Article

Conditional Order-m Efficiency of Wastewater Treatment Plants: The Role of Environmental Factors

Department of Applied Economic Analysis, University of Alicante, Ctra. San Vicente del Raspeig s/n, San Vicente del Raspeig, Alicante 03080, Spain
*
Author to whom correspondence should be addressed.
Water 2015, 7(10), 5503-5524; https://doi.org/10.3390/w7105503
Submission received: 3 August 2015 / Revised: 23 September 2015 / Accepted: 29 September 2015 / Published: 15 October 2015

Abstract

:
The growing economic and environmental importance of managing water resources at a global level also entails greater efforts and interest in improving the functioning and efficiency of the increasingly more numerous wastewater treatment plants (WWTPs). In this context, this study analyzes the efficiency of a uniform sample of plants of this type located in the region of Valencia (Spain). The type of efficiency measure used for this (conditional order-m efficiency) allows continuous and discrete contextual variables to be directly involved in the analysis and enables the assessment of their statistical significance and effect (positive or negative). The main findings of the study showed that the quality of the influent water and also the size and age of the plants had a significant influence on their efficiency levels. In particular, as regards the effect of such variables, the findings pointed to the existence of an inverse relationship between the quality of the influent water and the efficiency of the WWTPs. Also, a lower annual volume of treated water and more modern installations showed a positive influence. Additionally, the average efficiency levels observed turned out to be higher than those reported in previous studies.

1. Introduction

The increase in living standards of the population has a direct effect on the strain on available conventional water sources, which are becoming increasingly scarce especially in the areas of the Mediterranean Basin. This situation has been worsened by the increasingly frequent and lengthy periods of drought as a consequence of climate change [1,2,3,4].
Much of the strain can be relieved by re-utilizing water and so increasing the available supply for some agricultural and industrial uses [5,6]. Although wastewater treatment does not always involve water reuse, it is an important issue arising in many cases, gradually spreading and evolving. This is especially true of the direct or planned type, resources that can be used to complement conventional sources originating on the surface. In 2015, it was estimated that the total volume of reused water in the EU amounted to 1100 Mm³/year, accounting for 0.4% of the annual EU freshwater withdrawals [7]. From this perspective, it is clear that the potential environmental improvement in today’s context is one of the factors that justify the importance of analyzing the efficiency of wastewater treatment plants (WWTPs) [8,9,10].
In addition, from the economic point of view, the cost of water treatment services in Spain is high at around 1415 million euros per year, according to the last information provided by the Spanish Ministry of Environment (MARM) [11] and therefore studies on the efficiency of WWTPs may also help significantly in reducing costs, a saving which would be reflected in a reduction in prices or improvements in investment and the quality of service in the sector [12,13,14,15].
The reasons previously mentioned justify carrying out an analysis of WWTPs, in order to guarantee not only the adequate ecological status of bodies of water, as laid down in article 4 of the Framework Water Directive [16], but also the enormous economic potential offered by the re-utilization of these supplies.
In view of the problems mentioned, the aim of this study focuses on analyzing the degree of efficiency achieved by a homogeneous sub-group of WWTPs in the Region of Valencia (Spain) in order to be able to put forward ideas that will help to improve their management and thus the environmental quality status.
For such purposes a conditional order-m efficiency model was used, which allowed us to avoid the problems associated with the methods previously used to evaluate the efficiency of the WWTPs. Specifically, the presence of extreme values (outliers), the introduction of contextual variables in the model in two or more steps, and the impossibility of testing the statistical significance of the influence of the exogenous variables. Hence, the results obtained are likely to offer a more accurate measure of efficiency while providing information on how this is influenced by each exogenous variable.
Numerous studies about WWTPs, from a variety of standpoints, have been published but if we concentrate on the object of this report, studies which refer exclusively to their productivity and efficiency are fairly scarce. Although it is true that, for Spain, quite a few have been published in this regard over the last few years. See, for example, Molinos-Senante et al. [17,18,19], Lorenzo-Toja et al. [20], Hernández-Sancho et al. [5,21,22], Sala-Garrido et al. [23,24,25], Hernández-Sancho and Sala-Garrido [26,27]. On the international level, mention should be made of the research carried out by Mahmoudi et al. [28] for Iran, or De Jong et al. [8], Kemp [29] for the Dutch WWTPs and Gerrini et al. [15] for the Danish water services and WWTPs.
Most of those in the treatment field use a Data Envelopment Analysis (DEA) approach, although some include variations on the model: for example, Molinos-Senante et al. [18] DEA with non-desirable outputs, Hernández-Sancho et al. [22] and Molinos-Senante et al. [19] use a non-radial DEA model, and Sala-Garrido et al. [24] use a DEA approach with tolerances. Other studies use the influence of more specific aspects such as the effect of contextual factors on calculating the economic-environmental efficiency ratios [17,18,20], seasonal influences using Free Disposal Hull (FDH) or DEA and the Mann-Whitney test [5,25] or even the type of technology by using metafrontier approach with technological gap ratios [23].
The internal structure of these studies varies relatively little except for the samples used. They range from 338 WWTPs, in the case of Hernández-Sancho and Sala-Garrido [26,27], to 45 WWTPs analyzed in the study by Sala-Garrido et al. [24], depending on the homogenous subgroup using a specific technology, the treatment process or the specific area analyzed—most of them Valencia Region. And although almost all of the studies refer to a specific year, that of Hernández-Sancho et al. [21] uses a six year period.
If we compare the variables, the choice is similar in each one of the studies. The inputs used for the analyses range from purely economic data measured in euros per year, such as operation and maintenance costs, staffing, reagents, or energy costs, to technical data such as the water mass treated expressed as cubic meters. The studies by Hernández-Sancho et al. [5,21,22], Hernández-Sancho and Sala-Garrido [26,27], Molinos-Senante et al. [17,18,19], Sala-Garrido et al. [23,24,25], or Lorenzo-Toja et al. [20] include the elimination of contaminants from the treated water as output, calculating this on the basis of initial and final levels of solids in suspension (SS in mg/L), organic material expressed as a chemical demand for oxygen (COD, in mg/L) and nutrients. Apart from this, the last two studies mentioned also take into consideration non-desirable outputs such as sound, odor, and visual impact levels. In some of the studies (for example, [21,22,23,25]) the characteristics of the effluent, the age or the size of the plant, or the technology are employed as contextual variables.
All the former information about the existing previous references on efficiency and/or productivity of WWTPs is displayed graphically in detail in the Table 1 and Figure 1. The first of these includes the studies carried out on the treatment of water resources over recent years; the second underlines the variables and models used on the studies we consulted.
The structure of this study is the following. Firstly, the statistical model will be justified and described. Subsequently, the data used in the study will be presented and the results obtained will be expounded and discussed, and finally the conclusions will suggest the main ideas that could be implemented in order to improve both the efficiency of the analyzed WWTPs and the environmental quality status.
Table 1. Studies on productivity and efficiency in wastewater treatment sector.
ReferencesCharacteristics of the SampleNumber of DMUsInputsOutputs and Contextual VariablesMethodCountry/RegionMain Results
Kemp [29]Analysis of the efficiency of biological WWTPs in the Dutch food and beverage industry. Year 199193Variables of the Threshold Diffusion Model: Total costs of using technology, savings in pollution taxes, other benefits derived from using technology (improved image of the company due to environmental awareness).Variables relating to the use of biological WWTPs: taxes paid for dumping, total costs, annual unit cost of using a WWTP, efficiency of cleaning device control (different if the technology employed is aerobic or anaerobic), the uncertainty factorThreshold Model/Kolmogorov-Samirnov test/The logistic model/Gompertz modelThe NetherlandsInvestments made by the food and beverage industry in biological WWTPs were efficient given the nature of the effluent (homogenous and practically all organic). Relatively high efficiency of control at a low cost. Relative efficiency of levies or charges for pollution in the use of biological WWTPs
De Jong et al. [8]Inefficiency in Wastewater treatment plants using one public WWTP and polluting private companiesDecision Making model under a Zero Profit constraintThe NetherlandsSubsidies might, in part compensate for the lack of private sector investment, given the decreasing returns to scale in a context of Zero Profit and minimizing costs
Hernández-Sancho and Sala-Garrido [26]Technical efficiency in WWTPs338Costs of staffing, maintenance, waste, others. Contextual variables: size of plantEliminated contaminants.DEA/ANOVAValencia (Spain)Great efficiency in the larger WWTPs, the costs of maintenance and waste management being the most relevant in order to explain the differences in the efficiency of WWTPs
Hernández-Sancho and Sala-Garrido [27]Technical efficiency in WWTPs. Year 2004338Costs of energy, staffing, maintenance, waste, others (Reagents and capital amortization).Eliminated solids in Suspension (ESS) and eliminated chemical and bio chemical oxygen demand (ECOD and EBOD)DEA/Cost analysisValencia (Spain)Maintenance and waste management costs are the most relevant when explaining the differences between WWTPs from the efficiency point of view.
Hernández-Sancho et al. [21]Technical efficiency and productivity in WWTPs, Years 2003–2008 196Costs of energy, staffing reagents, maintenance, reagents, waste. Contextual variables: age of the plant, size, equivalent population. Technology. Eliminated solids in Suspension (ESS), eliminated chemical oxygen demand (ECOD).DEA/Malmquist Productivity IndexValencia (Spain)Not adapting the facilities towards technological improvement explains the drops in efficiency and productivity levels in the period under analysis. WWTPs with improved productivity are those with lower energy consumption.
Hernández-Sancho et al. [22]Energy efficiency in WWTPs, Year 2009 177Costs of energy, staffing, reagents, maintenance, waste management, others (laboratory and office expenses). Factors affecting energy consumed: size of plant, nature of influent water (grams of COD per m3), type of aeration in bio-reactor.Eliminated solids in suspension (ESS), eliminated chemical oxygen demand (ECOD)Non-radial DEAValencia (Spain)The size of the plant, the amount of organic material eliminated and the type of bio-reactor explain the differences in efficiency.
Hernández-Sancho et al. [5]Seasonal influences in WWTPs, 44 with EA technology and 32 with Activated Sludge (AS) technology76Costs of energy, staffing, reagents, maintenance, waste management, and other costsEliminated solids in suspension (ESS), eliminated chemical oxygen demand (ECOD), nitrogen (N) and phosphorus (P).DEA/Free disposal hull (FDH)Valencia (Spain)Plants with seasonal variations are less efficient in terms of costs than those which show seasonal behavior, this being most evident in those using AS technology.
Sala-Garrido et al. [23]Technology in use at WWTPs. Year 200999Running and maintenance costs. Technology usedEliminated solids in suspension (ESS), eliminated chemical oxygen demand (ECOD), nitrogen (N)DEA Metafrontier approach and technological gap ratios (TGRs)Valencia (Spain)As regards efficiency, no significant differences are noted, the four technology types analyzed being, on average, similar. According to the TGRs, operating using sludge technology is the optimum method
Sala-Garrido et al. [24]Efficiency under uncertainty in WWTPs, Year 200945Running and maintenance costsEliminated solids in suspension (ESS), eliminated chemical oxygen demand (ECOD), nitrogen (N)DEA with tolerancesValencia (Spain)The variability of inputs is lower than that of the outputs. Broad margin for reducing running costs if the number of efficient plants changes when using values with tolerances instead of the originals
Sala-Garrido et al. [25]Efficiency in WWTPs. Year 2008272Energy, staff costs, chemical agents, maintenance, waste management, and others (all in €/year)ESS and ECOD as (gr/year) and, as contextual variables: seasonality, activated sludge and extended aeration (EA)DEA with scaled variable performances and Mann-Whitney TestValencia (Spain)Seasonality has an adverse effect on the efficiency of the WWTPs, and this factor has a greater effect on WWTPs with AS technology than on those with EA technology
Molinos-Senante et al. [17]Analysis of smaller sized WWTPs7Investment, running and maintenance costs, energy consumption, elimination of solids, nitrogen, phosphorusContextual variables: surface area required for the facilities noise levels, odor levels, visual impact, and public acceptanceCompound socio-economic and environmental model to evaluate the plants’ sustainabilitySpainLower sustainability of intensive technologies from the environmental point of view, although the cost is lower
Molinos-Senante et al. [18]Analysis of efficiency in WWTPS. Year 200960Total costs including energy, staff, reagents, waste management, and maintenanceTotal quantity of pollutants removed: suspended solids (ESS), oxygen demand (ECOD), total nitrogen (N) and total phosphorus (P). Also, as non-desirable outputs: GHG emissions (Kg of CO2 equivalent)Environmental performance indicators and DEA with non-desirable outputs in two stages to construct an index of overall performanceValencia (Spain)The best results from the environmental point of view came from the WWTPs based on anaerobic digestion for sewage sludge. Given that only 7% of the treatment plants examined were identified as efficient, it is clear that there is a broad margin for improvement of global efficiency and also for energy consumption or reducing GHG emissions (greenhouse gases). Economies of scale did not affect environmental efficiency
Molinos-Senante et al. [19]Efficiency in WWTPs192Energy, staff costs, reagents, maintenance, waste management and othersSuspended solids (SS) and chemical oxygen demand (COD) removedNon-radial DEA, Total Improvement Index (TII), and Relative Improvement Index (RII), Kruskal-Wallis non-parametric testValencia (Spain)They isolated the specific inputs on which to act in order to save costs. The highest efficiency score was for energy costs, while the lowest was for staff costs. Taking into account that staff costs represent around half of the total cost, it is vital to increase the efficiency of this cost item in order to control costs and improve the competitiveness of the WWTPs
Lorenzo-Toja et al. [20]Analysis of efficiency in WWTPs in various regions of Spain. Year 2011113Consumption of electricity, chemical components and sludge productionQuality of the treated water: Kilograms of SS and kg of PO4−3 removed per cubic meter of treated waterLife Cycle Assessment and input oriented DEA BCC and Assurance Region ModelsSpainKey factors in detecting inefficiencies: contamination load of water entering, change of climate zone, complexity level of treatment. Smaller WWTPs could improve with constant supervision
Figure 1. Synthesis of the variables previously used in the analysis of the productivity and/or efficiency of WWTPs
Water 07 05503 g001

2. Method

As shown in the above review of the bibliography on this subject, the majority of the research conducted to date has analyzed the efficiency of WWTPs using non-parametric models, such as Data Envelopment Analysis (DEA) or Free Disposal Hull (FDH), in one of its multiple variants.
These methods offer major advantages over parametric models such as the fact that they do not need to establish the form of the production function; they allow the analysis of processes that involve various inputs generating multiple outputs at the same time, they compare each unit of activity (Decision Making Unit-DMU) with itself and the rest, and they can be adjusted to situations in which the prices of factors and products are unknown or are difficult to calculate.
So far, these models have been applied to evaluate the performance of WWTPs, endeavoring to incorporate advances capable of refining the estimations made whilst still leaving room to propose possible improvements.
Specifically, the different FDH/DEA variants used present one or several of the following characteristics that could be avoided: elevated sensitivity to extreme values (outliers), the introduction of context variables (non discretional or exogenous) under the assumption that they can be separated from the inputs and outputs, and the lack of statistical properties capable of verifying the influence of environmental variables on performance levels.
The presence of outliers in the sample, the first of the problems mentioned above, supposes the existence of one or more DMUs with variables offering extreme values, thereby introducing biases into the efficiency results owing to the high sensitivity presented by traditional non-parametric models to such values [33,34].
In addition, the second of the aspects mentioned previously that could be avoided is related with the way in which contextual variables have been considered in the different studies conducted. Although some of those studies have taken into account the contextual variables that might influence the final result of WWTPs, this influence has always been analyzed during a second stage once the analysis of efficiency has been carried out and, therefore, the sole purpose is to ascertain if said variables influenced the performance ratios calculated previously without taking them into consideration, in other words, not involving such variables in their calculation. It was assumed, therefore, that the set of contextual variables could be separated from the set of inputs and outputs, so that the level of the first would not affect the input and output values, but merely the efficiency results estimated, which in general is not necessarily so [35,36].
Finally, the last of the problems mentioned, pertaining to the lack of statistical properties capable of verifying the statistical significance of the influence of contextual variables on levels of efficiency, is closely related with the idea set out in the previous paragraph. The fact that previous studies use non-parametric models in which the effect of environmental variables was analyzed in a subsequent step did not allow for any non-parametric hypotheses to be tested out in order to reach a conclusion about the significance of said influence. There was only the option to conduct descriptive analysis for this purpose [36].
In any case, it is feasible to use a model that, whilst maintaining the advantages of non-parametric models, is capable of eliminating the drawbacks described above presented by the models used in the past.
In this respect, the non-parametric model used here is based on the conditional efficiency model created by Cazals et al. [37], which was subsequently developed further by Daraio and Simar [36]. This model, based on the fundamental idea of using environmental variables to identify the most similar observations and use them to estimate parameters of efficiency, avoids the aforementioned drawbacks of previous research studies and offers additional advantages, including: not requiring non-discretional variables to present a monotonous relationship with the production function; not requiring a decision to be made beforehand regarding whether the role played by these variables will be, as an input or output; and finally, enabling several continuous exogenous factors to be brought into play at the same time.
In any case, De Witte and Kortelainen [35] continued to develop the initial ideas of Cazals et al. [37] and Daraio and Simar [36] offering a modification capable of including contextual information from a large number of both continuous and discrete variables simultaneously and in a single step. Furthermore, De Witte and Kortelainen [35] also defined non-parametric significance tests in order to evaluate the influence of said contextual variables on levels of efficiency. A brief description of the model is provided below (for a complete version see [35,36,37]).
The orientation selected for the model in this study was input orientation, since the WWTPs analyzed are managed by a public entity (Entidad Pública de Saneamiento de Aguas Residuales (EPSAR)) whose purpose is to obtain certain levels of quality in treated water, in accordance with legal standards, at the lowest possible cost. Moreover, this is in line with the orientation used in previous studies with the same aim based on data from the same entity [19,21,22,24,27].
Thus, given the existence of a set of resources, X + p , to generate the outputs vector defined by Y + q , the estimation of input-oriented unconditional order-m efficiency [36] would be given by:
θ ^ m , n  ( x , y ) = E   ( θ ˜ m  ( x , y ) |  Y y )   =   0   [1 F X | Y , n ( u x | y ) ] m d u ,   u +
Then, the conditional order-m efficiency would be:
θ ^ m , n  ( x , y | z ) = E   ( θ ˜ m z  ( x , y ) |  y , z )   =   0   [1 F X | Y , Z , n ( u x | y , z ) ] m d u )
where:
θ ˜ m z  ( x , y ) =  inf { θ | ( θ   x , y ) Ψ m z ( y ) }
Ψ m z ( y ) = { ( x , y )   + p + q  |  x X i  ,  y   y ,   i = 1 , ... , m }
F X | Y , Z , n ( x | y , z ) = i = 1 n I ( x i x , y i     y K h ( z , z i ) i = 1 n I ( y i     y K h ( z , z i )
where I(·) is an indicator function, h the estimation of the appropriately sized bandwidth and K h ( ) a generalized multivariate kernel function.
For the definition of said kernel function, it must be taken into consideration that there are three types of contextual variables (Zs) involved in the model (continuous, ordered discrete, and unordered discrete). In this respect, the i-th unit would be as follows:
Z i =   ( Z i c , Z i o , Z i u ) ,   i = 1 , ... , n
where Z i c r would be the vector of continuous variables, Z i o v the vector of ordered discrete variables, and Z i u w the vector of unordered discrete variables and Z i s c , Z i s o , Z i s u the sth components of Z i c , Z i o   a n d   Z i u respectively. Furthermore, it is also assumed that Z i s o { 0 , 1 , ... , c s 1 }   s = 1 , ... , v and Z i s u { 0 , 1 , ... , d s 1 }   s = 1 , ... , w being c s 2 and d s 2 the different values for Z i s o and Z i s u respectively.
Hence, the standard multivariate product kernel function used would be:
K h ( z , z i ) = s = 1 r 1 h s c l c ( z s c z i s c h s c )   s = r + 1 r + v l o ( z s o , z i s o , h s o )   s = r + v + 1 r + v + w l u ( z s u , z i s u , h s u )
where l c ( ) ,    l o ( )   and   l u ( ) are univariate kernel functions, and h s c ,   h s o  and  h s u are the respective bandwidths for the continuous, ordered discrete, and unordered discrete variables. In particular:
l c ( z s c z i s c h s c ) = { 3 4 5 ( 1 1 5 ( z s c z i s c h s c ) 2 )       0              o t h e r w i s e    i f    ( z s c z i s c h s c ) 2 5
l o ( Z s o , Z i s o , h s o ) = ( h s o ) | Z i s o Z s o |
l u ( Z s u , Z i s u , h s u ) = { 1 h s u           i f   Z i s u = Z s u h s u ( c s 1 )           i f   Z i s u Z s u  
and the bandwidths are obtained by means of K-nearest neighbor method based on maximum likelihood cross-validation for the density of Z [38].
Then, having estimated the results of order-m conditional efficiency for each WWTP, the statistical significance of the contextual variables is analyzed. For this objective, De Witte and Kortelainen [35] use the regression method developed by Racine and Li [39]. Its main idea is based on the nonparmetric model given by:
Q ^ i z =   f ˜ ( z i ) + ε i , i = 1 , ... , n
where,
Q ^ i z =   θ ^ m , n ( x i , y i | z i ) θ ^ m , n ( x i , y i )
is the ratio of conditional and unconditional efficiency which includes continuous, ordered, and unordered context variables for each observation i, ε i an error term and with
E ( ε i | z i ) = 0
and f ˜ is the conditional mean function of the estimated ratio of efficiency scores.
Finally, it should be noted that, even though the significance analysis is conducted in a subsequent step, the framework described here does not suffer from the problems of inference that affect deterministic FDH and DEA based on two steps since the causes mentioned by Simar and Wilson [40] are avoided [35].

3. Data and Variables

The wastewater treatment process, from the moment the wastewater enters the plant, consists of different stages involving physical, chemical, and/or biological aspects. Those stages or levels of treatment are divided into preliminary, primary, secondary (with or without elimination of nutrients), and tertiary.
The first, the preliminary, is intended to prepare the contaminated water to facilitate the subsequent treatments, preventing obstructions, and erosion. This stage eliminates gross solids, small pieces of stone and sand and immiscible solids with a lower density than water. After the preliminary stage, during the primary treatment, the wastewater is subjected to a sedimentation treatment in order to remove both floating materials and settleable materials. Next, during the secondary treatment, the elimination of organic matter and nutrients (nitrogen and/or phosphorus) begins. However, not all treatment plants with secondary treatment include this kind of procedure involving nutrients. Finally, with the tertiary treatment, a high quality effluent is obtained after eliminating other pathogens and substances not removed in the earlier stages, mainly through chlorination or ultraviolet light.
The preliminary and primary treatments are normally similar in the various WWTPs in the region under study. However, the same does not apply when it comes to the secondary treatment. There are different types of secondary treatment depending on the technology being used for treating the wastewater (mainly, activated sludge, aerated lagoon, trickling filter, and rotating biological contractor or biodisk) [23].
In the specific case of this study, we are analyzing the most numerous homogenous subgroup (same treatment technology and identical removal of contaminants) of WWTPs in the Region of Valencia (Spain) with the two-fold objective of, on the one hand, respecting one of the basic requisites of the FDH/DEA models referring to the homogenous nature of the units to be compared, and on the other, to ensure that there is a high number of DMUs to guarantee the best degree of prioritization possible. In particular, we analyze the efficiency of 158 WWTPs which in 2012 (the most recent figures we could obtain) were using the type of secondary treatment based on activated sludge through extended aeration (EA), without removing nutrients and treating household wastewater.
The methods based on activated sludge utilize microorganisms which act on the organic matter suspended or dissolved in the water to be treated, interacting with it until it is transformed into a new cellular material that can be eliminated through decantation. Extended aeration is usually applied to wastewater from small or medium sized towns with less organic content. Although this involves lengthier periods of aeration (over 20 days), it has good results in eliminating organic matter.
The information used in this study was kindly supplied by the wastewater treatment authority for the Region of Valencia in Spain (Entidad Pública de Saneamiento de Aguas Residuales (EPSAR)), which is a public entity with independent status linked to the regional government for Valencia through the Regional Department for the Presidency, Agriculture, Fisheries, Food and Water.
The selection of variables considered for analysis, as recommended in previous papers that analyzed efficiency (for example, [5,41,42]), was carried out taken into account the previous bibliography about the topic (commented in Section 1, whose main conclusions were summarized in Table 1 and Figure 1, where it is possible to observe the different variables and the authors that used them in previous studies), the opinion from industry experts and the availability of the data. In this sense, the variables taken into consideration when analyzing efficiency were as follows:
Inputs (€/m3): cost of the energy used, fixed and variable (Energy) [5,17,18,20,21,22,24,25,26,27], total staffing costs (Staff), including salaries, taxes and social insurance and charges [5,17,18,21,22,24,25,26,27], and other expenses (Other), which would include the cost of reagents, the maintenance for treatment facilities and infrastructure (such as equipment and machinery, even their replacement), waste management (including sludge) and other concepts (such as offices, laboratories, gardens, etc.) [5,17,18,20,21,22,23,24,25,26,27].
All the costs were expressed as €/m3/year. There are several reasons for expressing them in monetary rather than material terms. Firstly, the information gathered from reviewing the previous studies on efficiency and/or productivity in the sector and the opinion of the EPSAR managers (the bibliographic references mentioned after each input in this section were already commented in Section 1 and a synthesis was also made directly in Table 1 and inversely in Figure 1). Secondly, the fact that not all inputs could be expressed in material units (for example, maintenance costs for offices, gardens, laboratories, machinery replacement, etc.). Thirdly, the different market situations existing for each plant which meant that not all the inputs could be obtained using the same price levels for each one. And lastly, the decision was also supported by the objective of continuing to be compatible with the ultimate purpose of the WWTPs studied, which is based on obtaining levels of quality in treated wastewater that are in accordance with current legal standards, using the minimum expenditure possible for doing so.
Outputs: elimination levels of suspended solids (ESS) and chemical oxygen demand (ECOD) measured in terms of mg/l, which are the measures used by WWTPS to evaluate the output quality of their waters and which are also habitually accepted as outputs in wastewater treatment processes [5,18,20,21,22,23,24,25,27]. Suspended solids (SS) represents the total amount of particles of solid pollutant that remains in suspension in water. The more of these that are eliminated, the greater the quality of water. In turn, the chemical oxygen demand (COD) is the amount of oxygen that is consumed by oxidizable matter (organic matter and a small quantity of inorganic). The fact is that the process for the decomposition of organic matter found in the water generates an oxygen consumption the level of which (COD) is measured as an indicator of the degree of contamination of the wastewater. The higher the level of elimination of COD, the greater the water quality.
Continuous contextual variables: Amount of suspended solids (SS) and chemical oxygen demand (COD) in the influent water (mg/L) [22,43]. They both offer a measure of the level of contamination of the influent water. In this respect, a WWTP is considered to be more efficient if it receives lower quality water and still achieves an equal or greater elimination of contaminants. In view of the results of similar previous studies, the efficiency of plants with lower influent water quality would be expected to be lower [20].
Another continuous contextual variable considered is the size of the plant, expressed as the volume of water treated (VTW) by each plant (m3/year) [20,21,22,26]. Usually, larger units tend to make better use of economies of scale and the inclusion of this variable endeavors to compile this information with a view to subsequently verifying the effect. Hence, there should be a direct relationship between the size of the plant and its level of efficiency as reflected in the bibliography consulted [22,26,44,45]. However, although in principle a result of such nature might be expected, this is not always the actual observed effect [30].
Discrete contextual variables: Type of aeration (TA) (turbine, blower, submersible aerator, rotors with vanes or other) [5,21,22,23,25] and, finally, time expressed as years since the construction or renovation of the plant (Age) [21,22]. No mention has been found in previous literature regarding the effect of a particular type of aeration on the efficiency of the WWTPS, hence there is no established expectation about influence of such variable. As regards plant age, it would be logical to expect that the more modern the plant the more efficient it would be since past experience should allow previous errors to be rectified and technical improvements to be incorporated [21].
All the information about the variables used is summarized in Table 2, which offers the main statistics in this regard.
Table 2. Descriptive statistics.
VariablesMeanStandard DeviationMin.Max.
Inputs
Energy (€/m3)0.120.080.030.60
Staff (€/m3)0.380.220.080.94
Other (€/m3)0.260.160.050.96
Outputs
ESS (mg/L)243.80143.6349763
ECOD (mg/L)569.60264.49911591
Continuous Contextual Variables
SS (mg/L)252.50145.9256777
COD (mg/L)601.30269.261011637
VTW (m3/year)124,367148,101.527716780,880
Discrete Contextual Variables
TAA = 26; R = 9; B = 89; T = 30; O = 4
Age (years)13.995.22333
(A = Aerators; R = Rotors; B = Blowers; T = Turbines; O = Other).

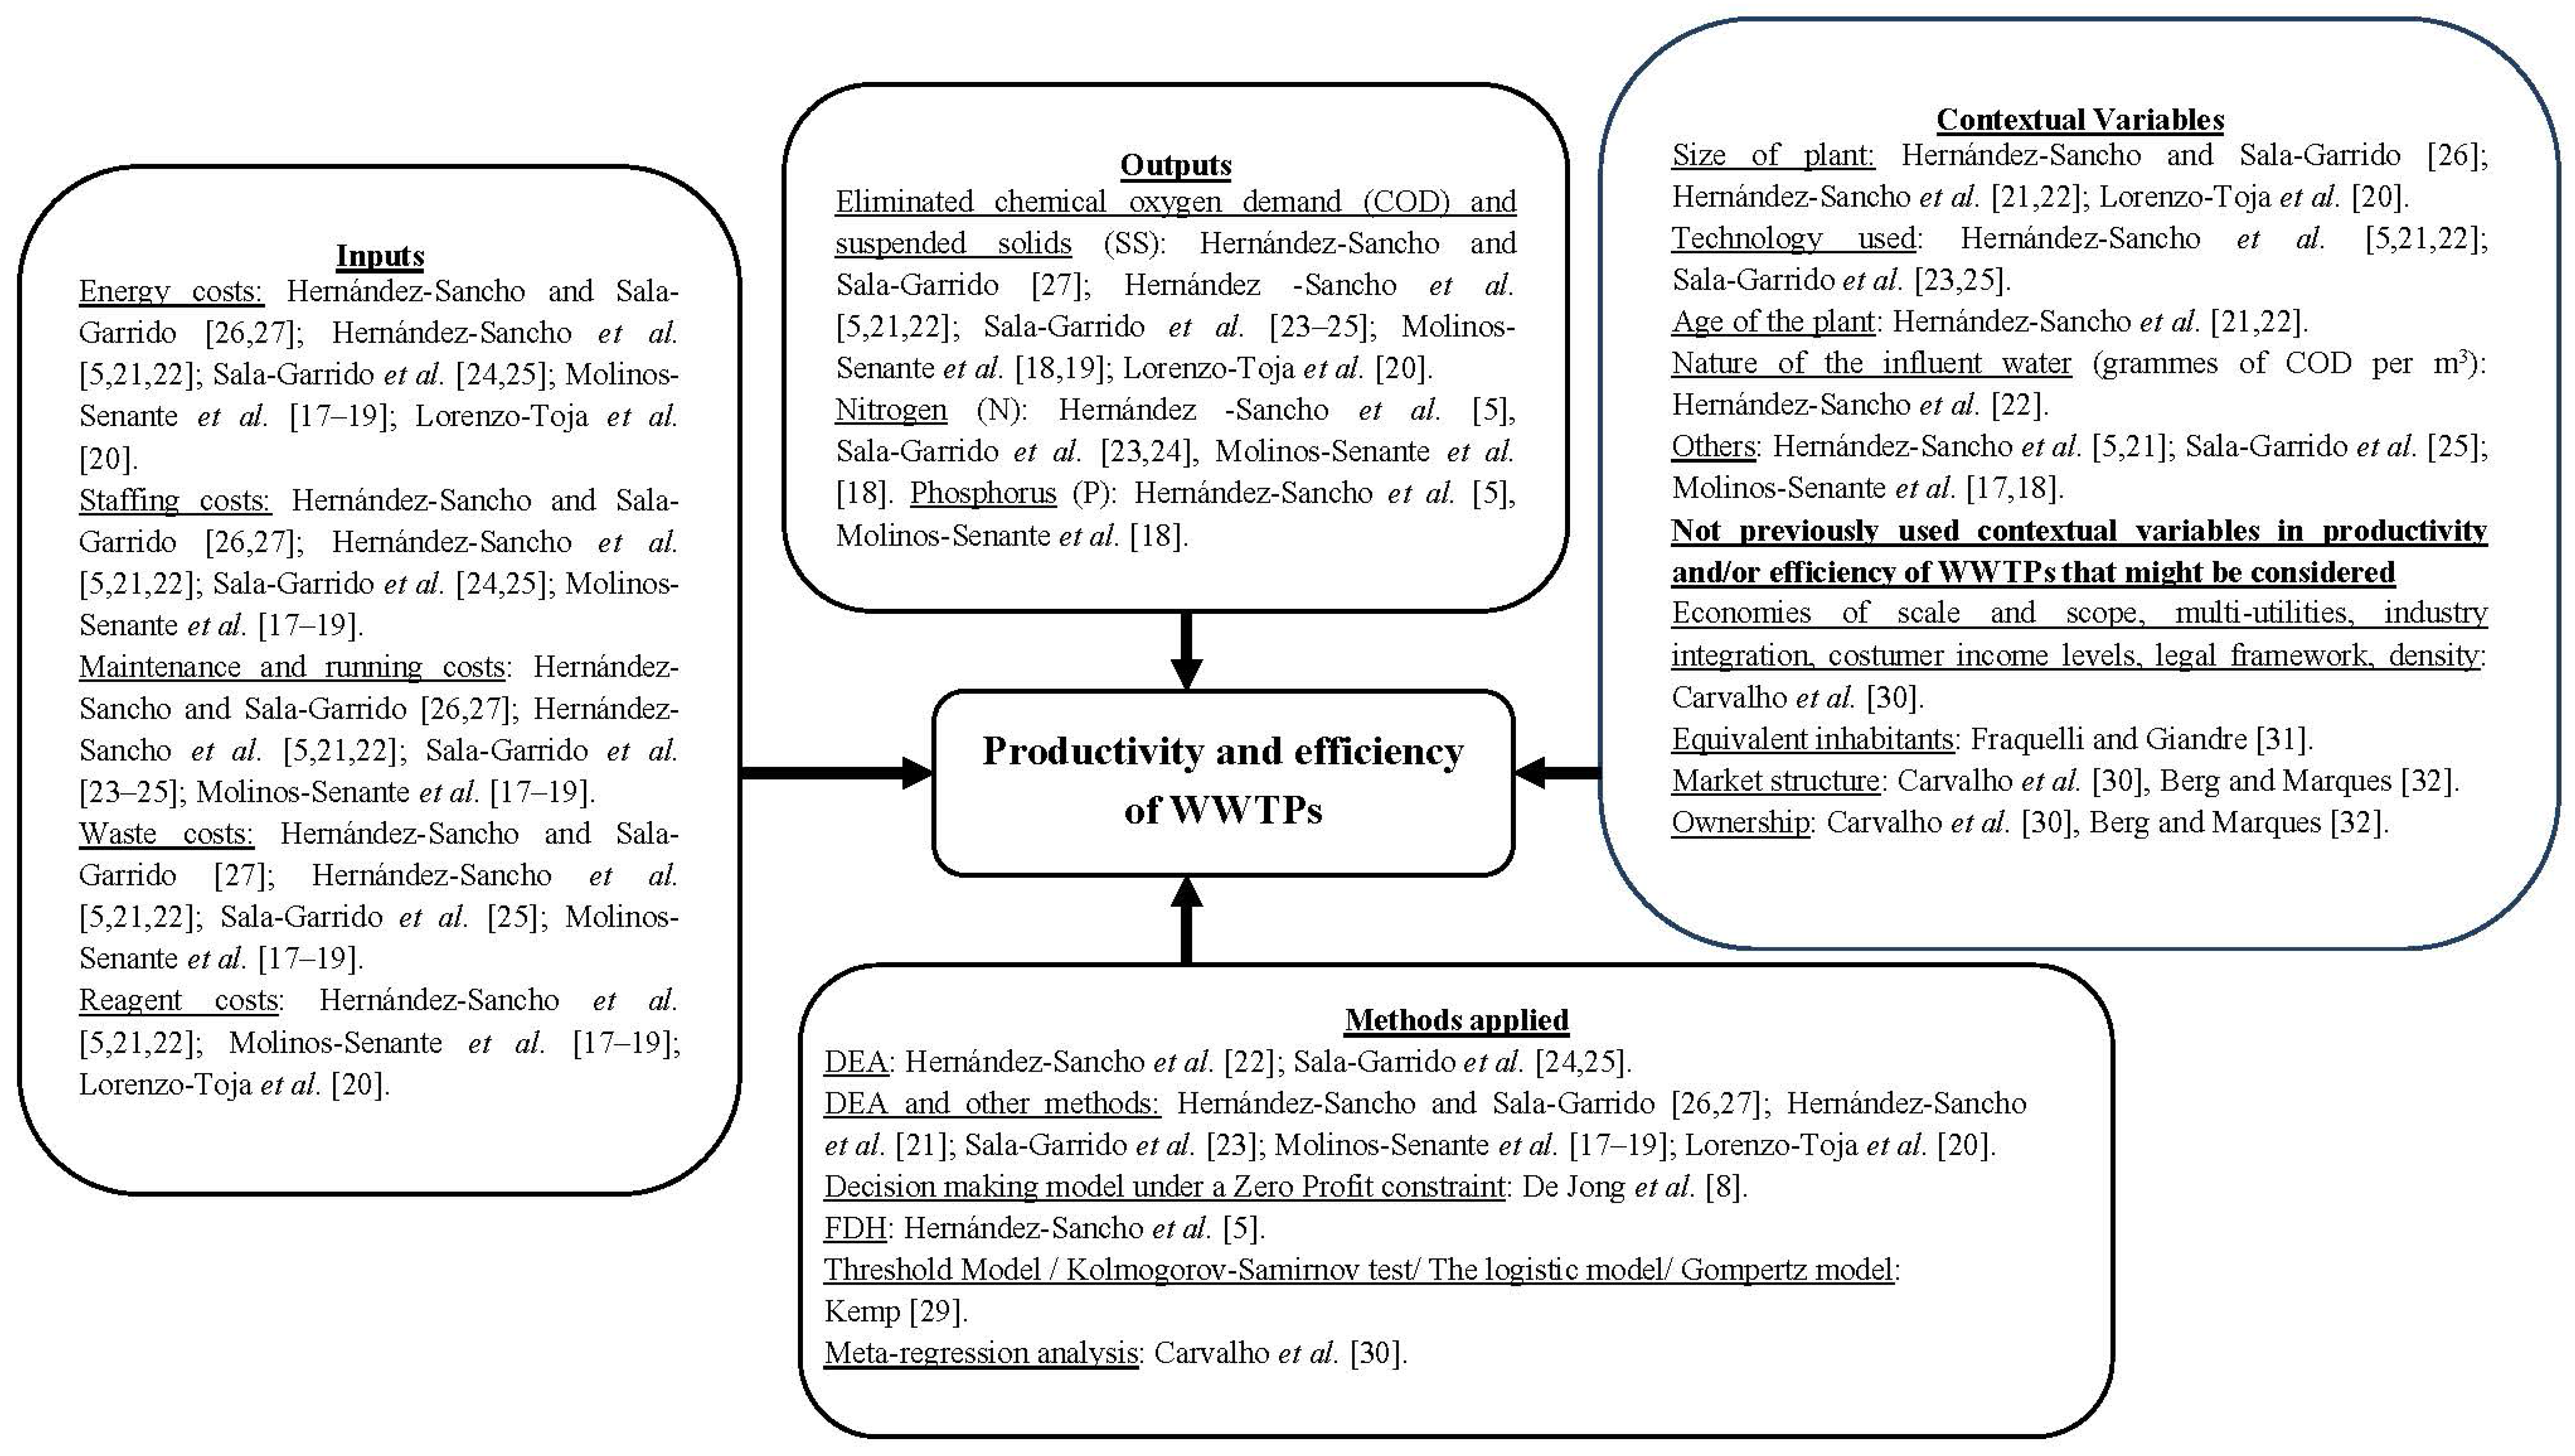
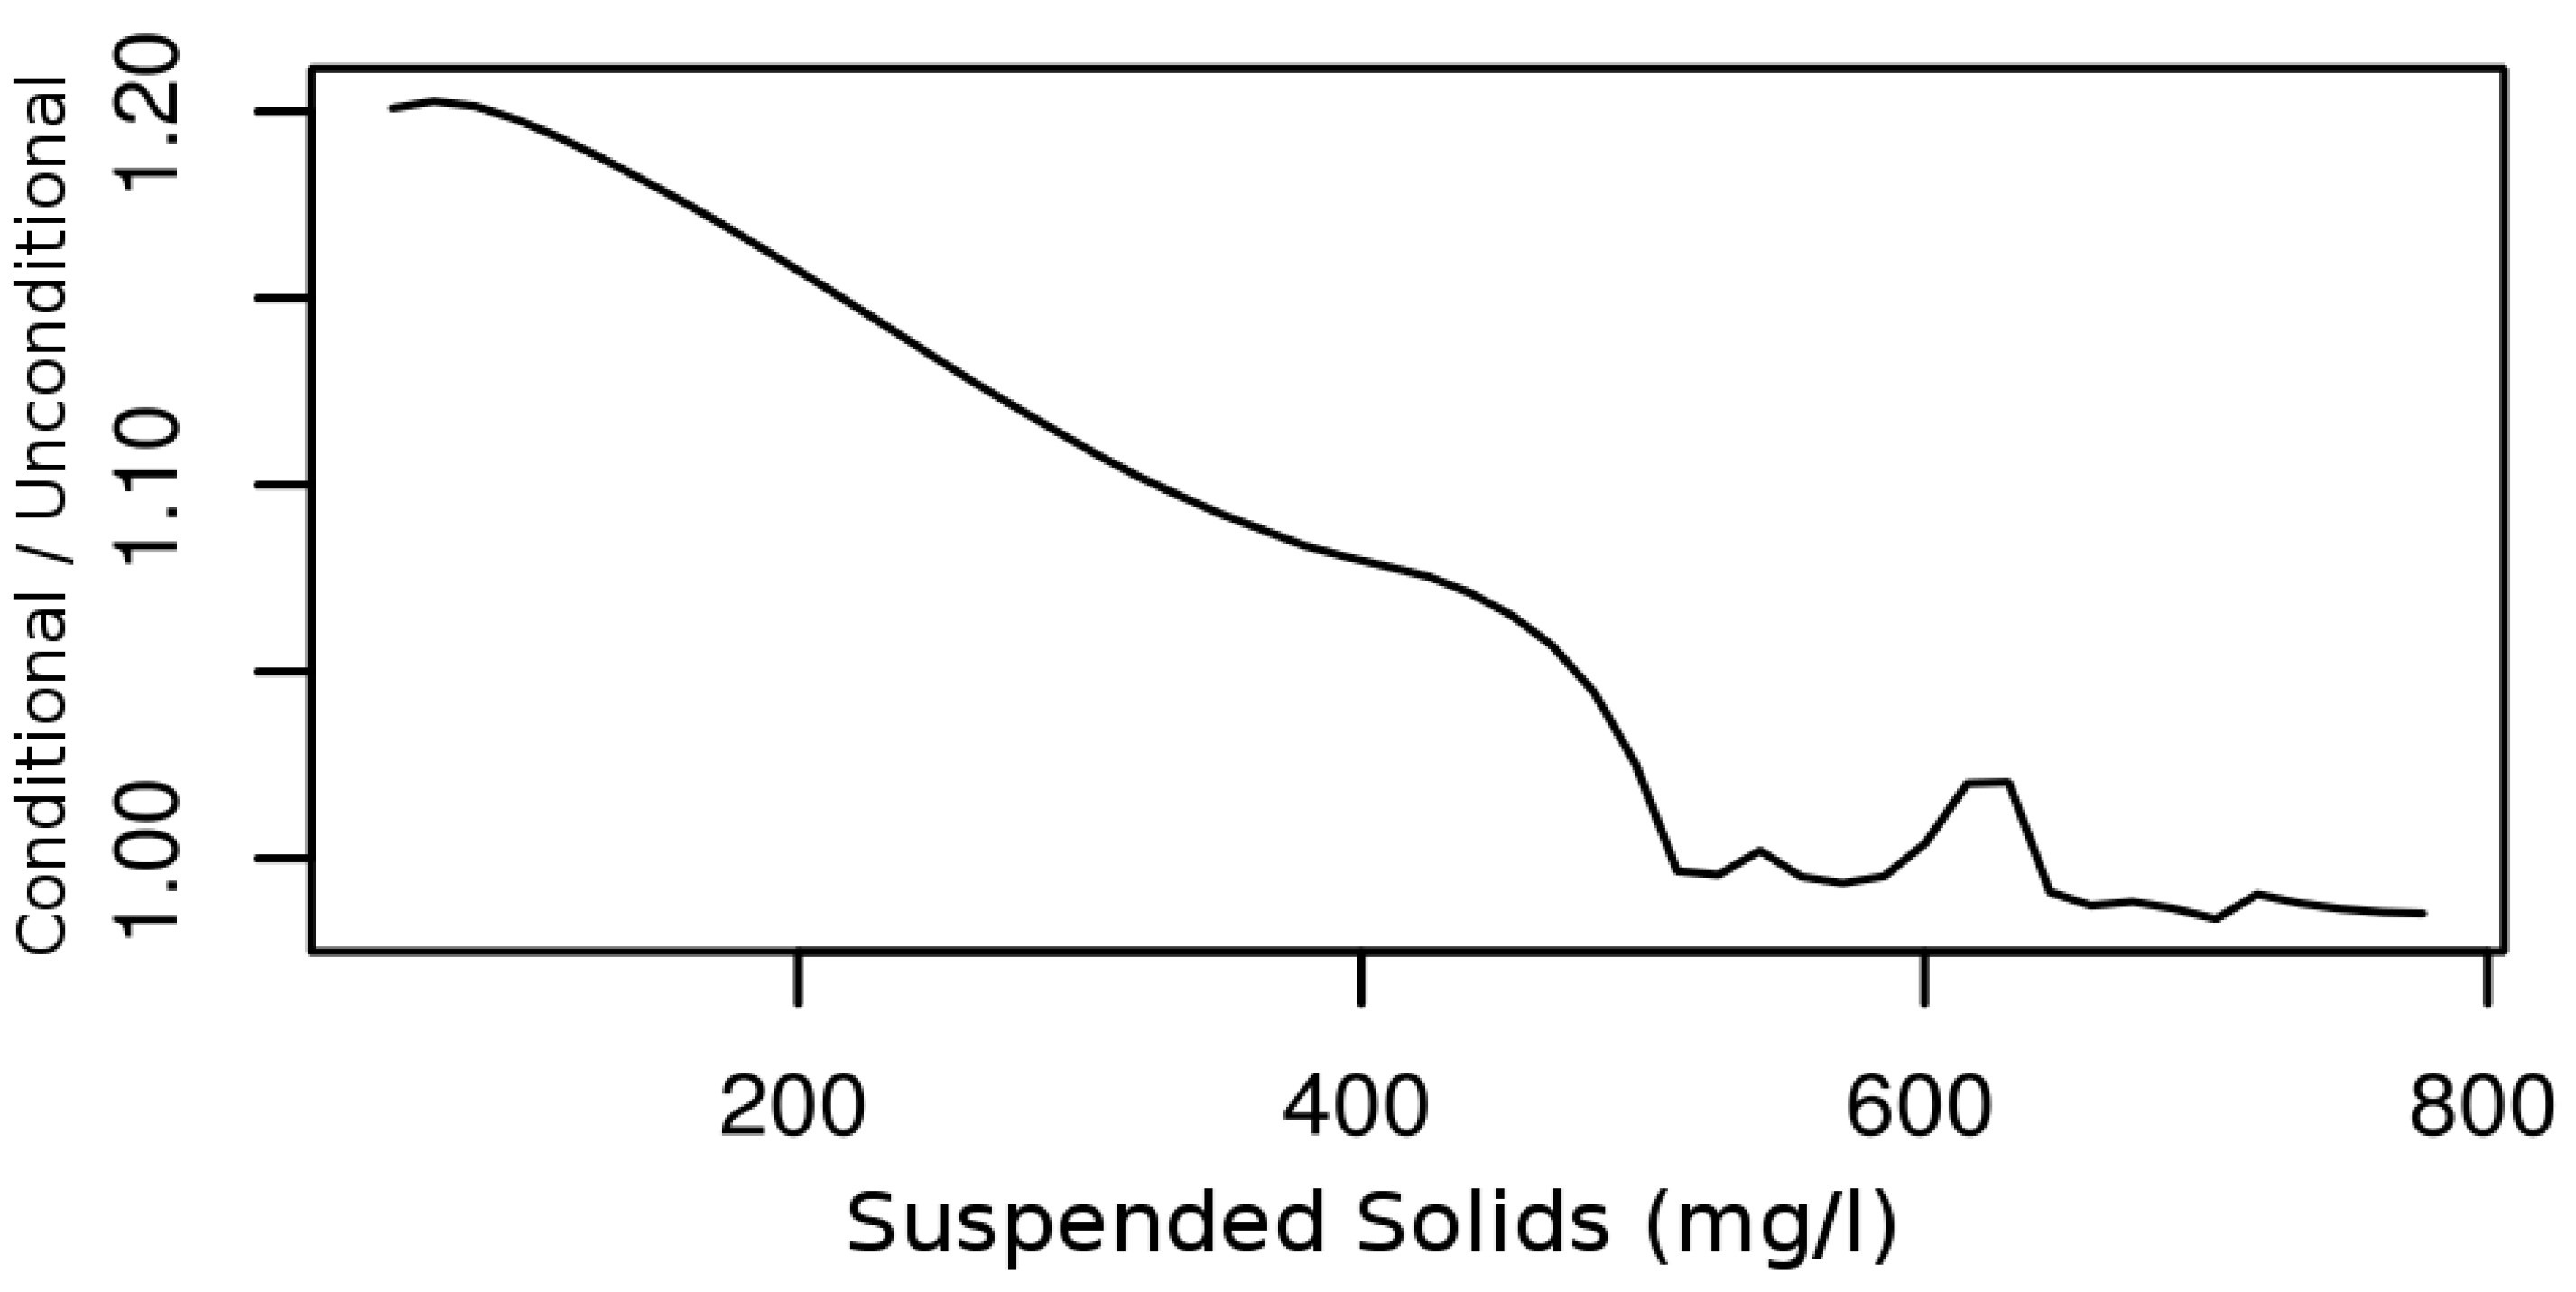
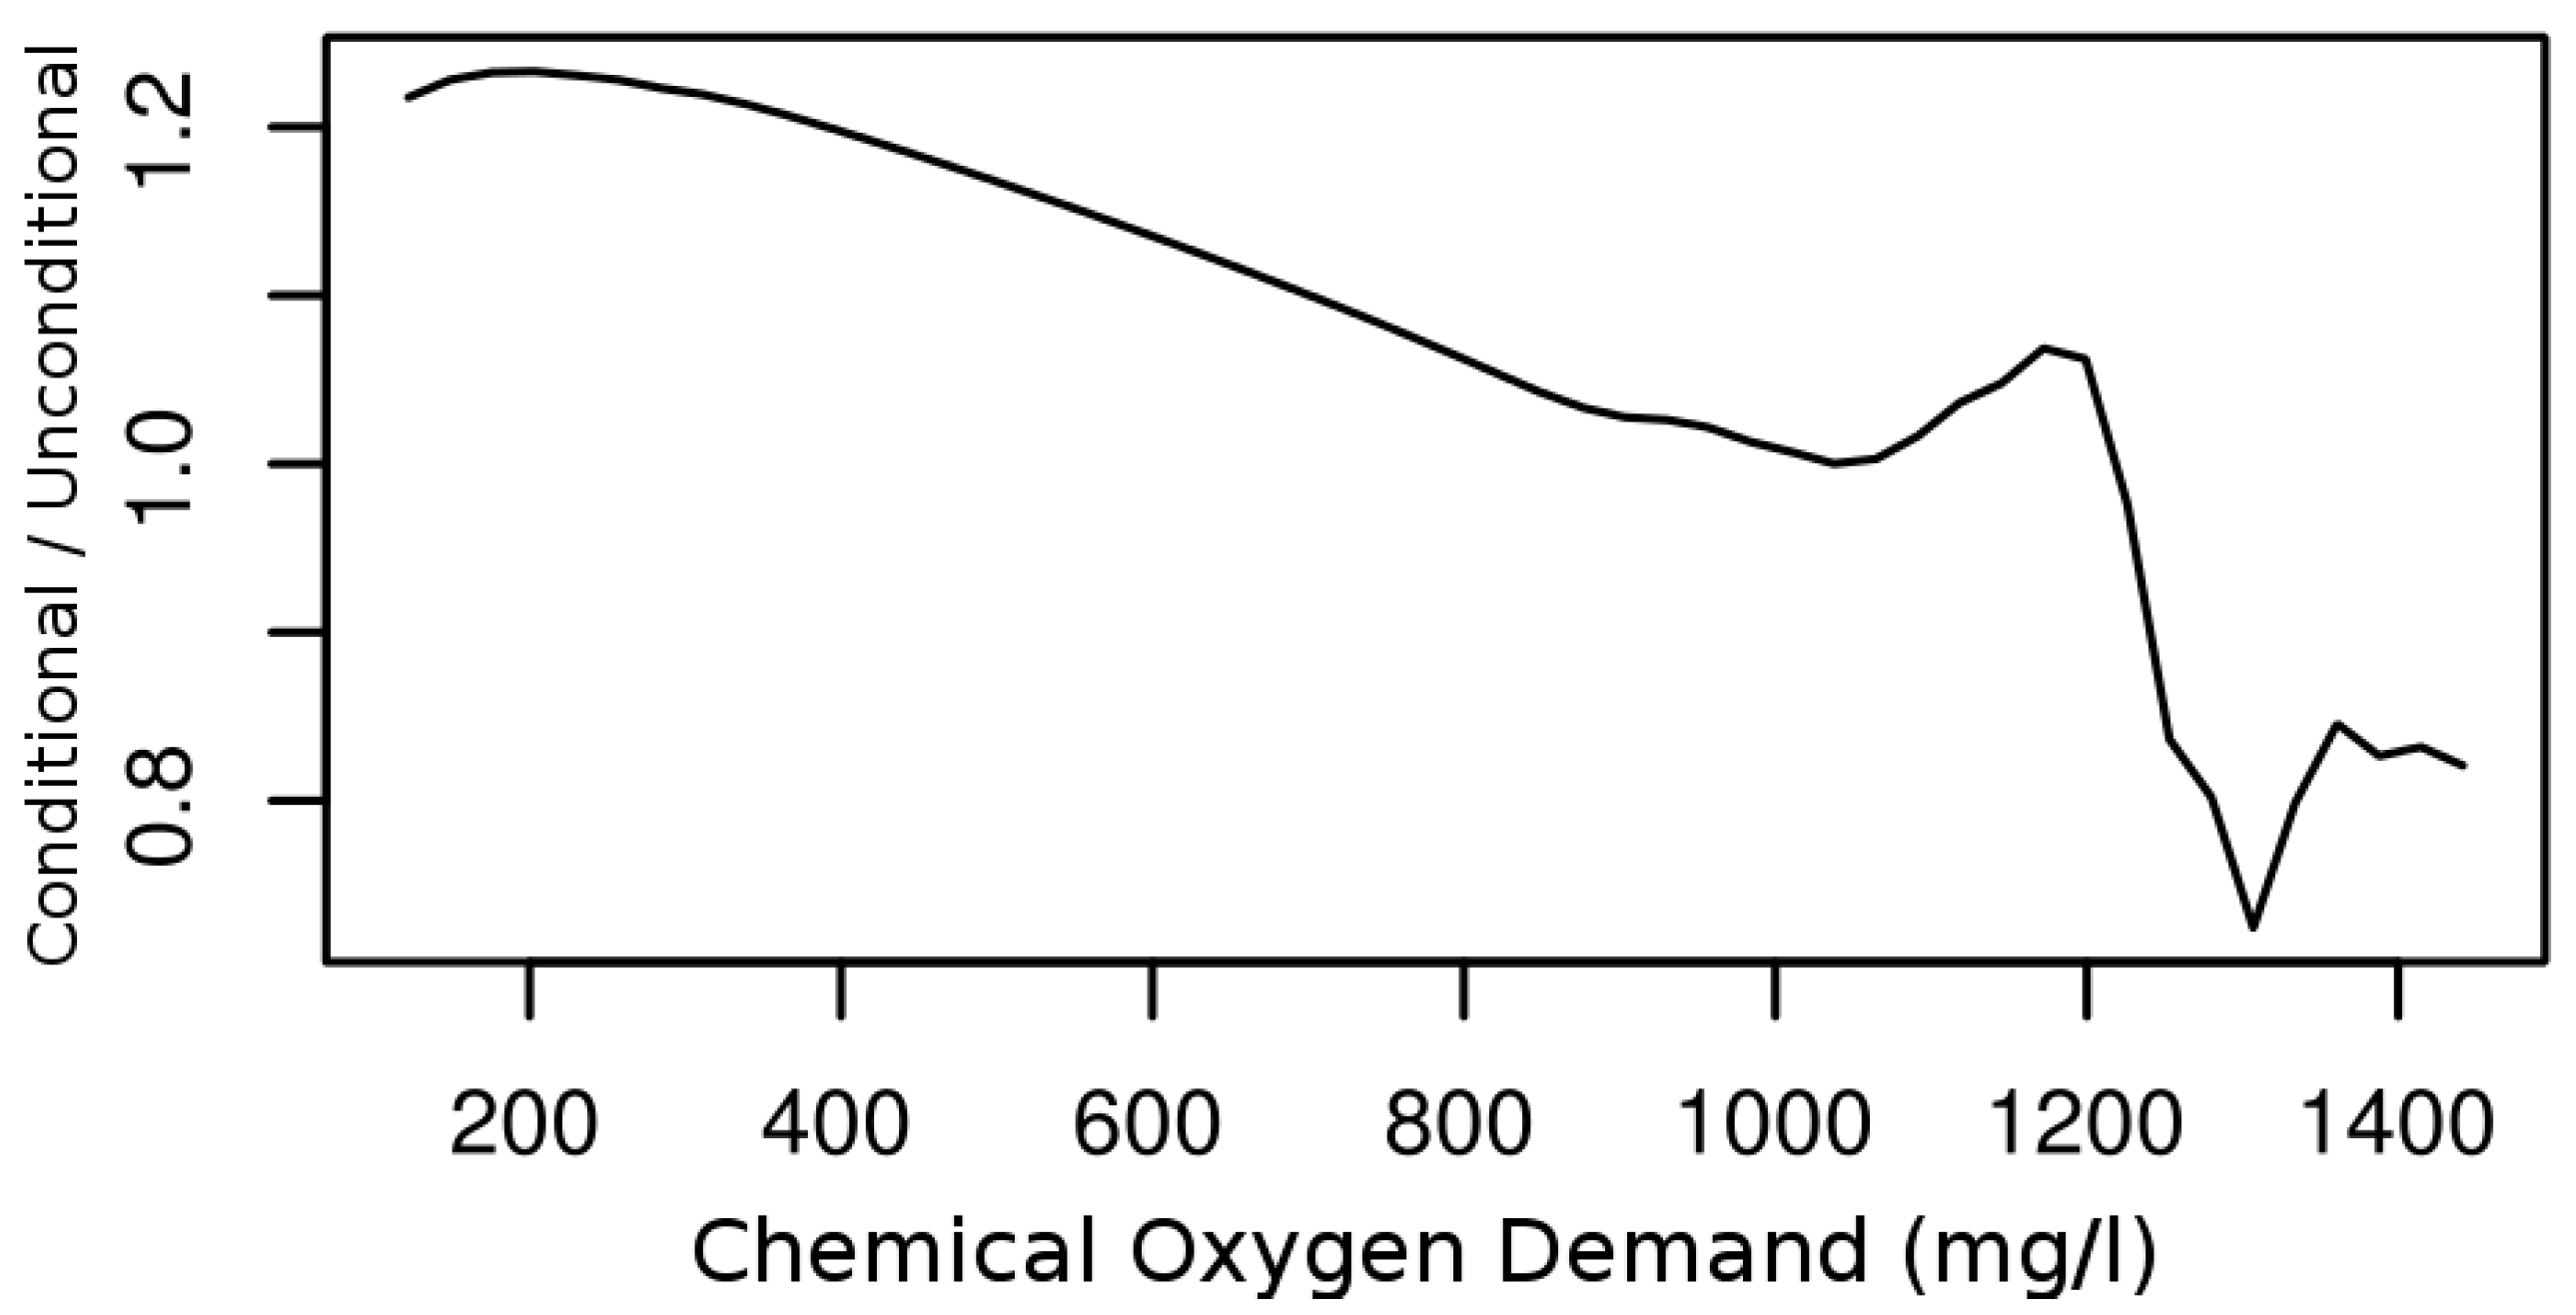
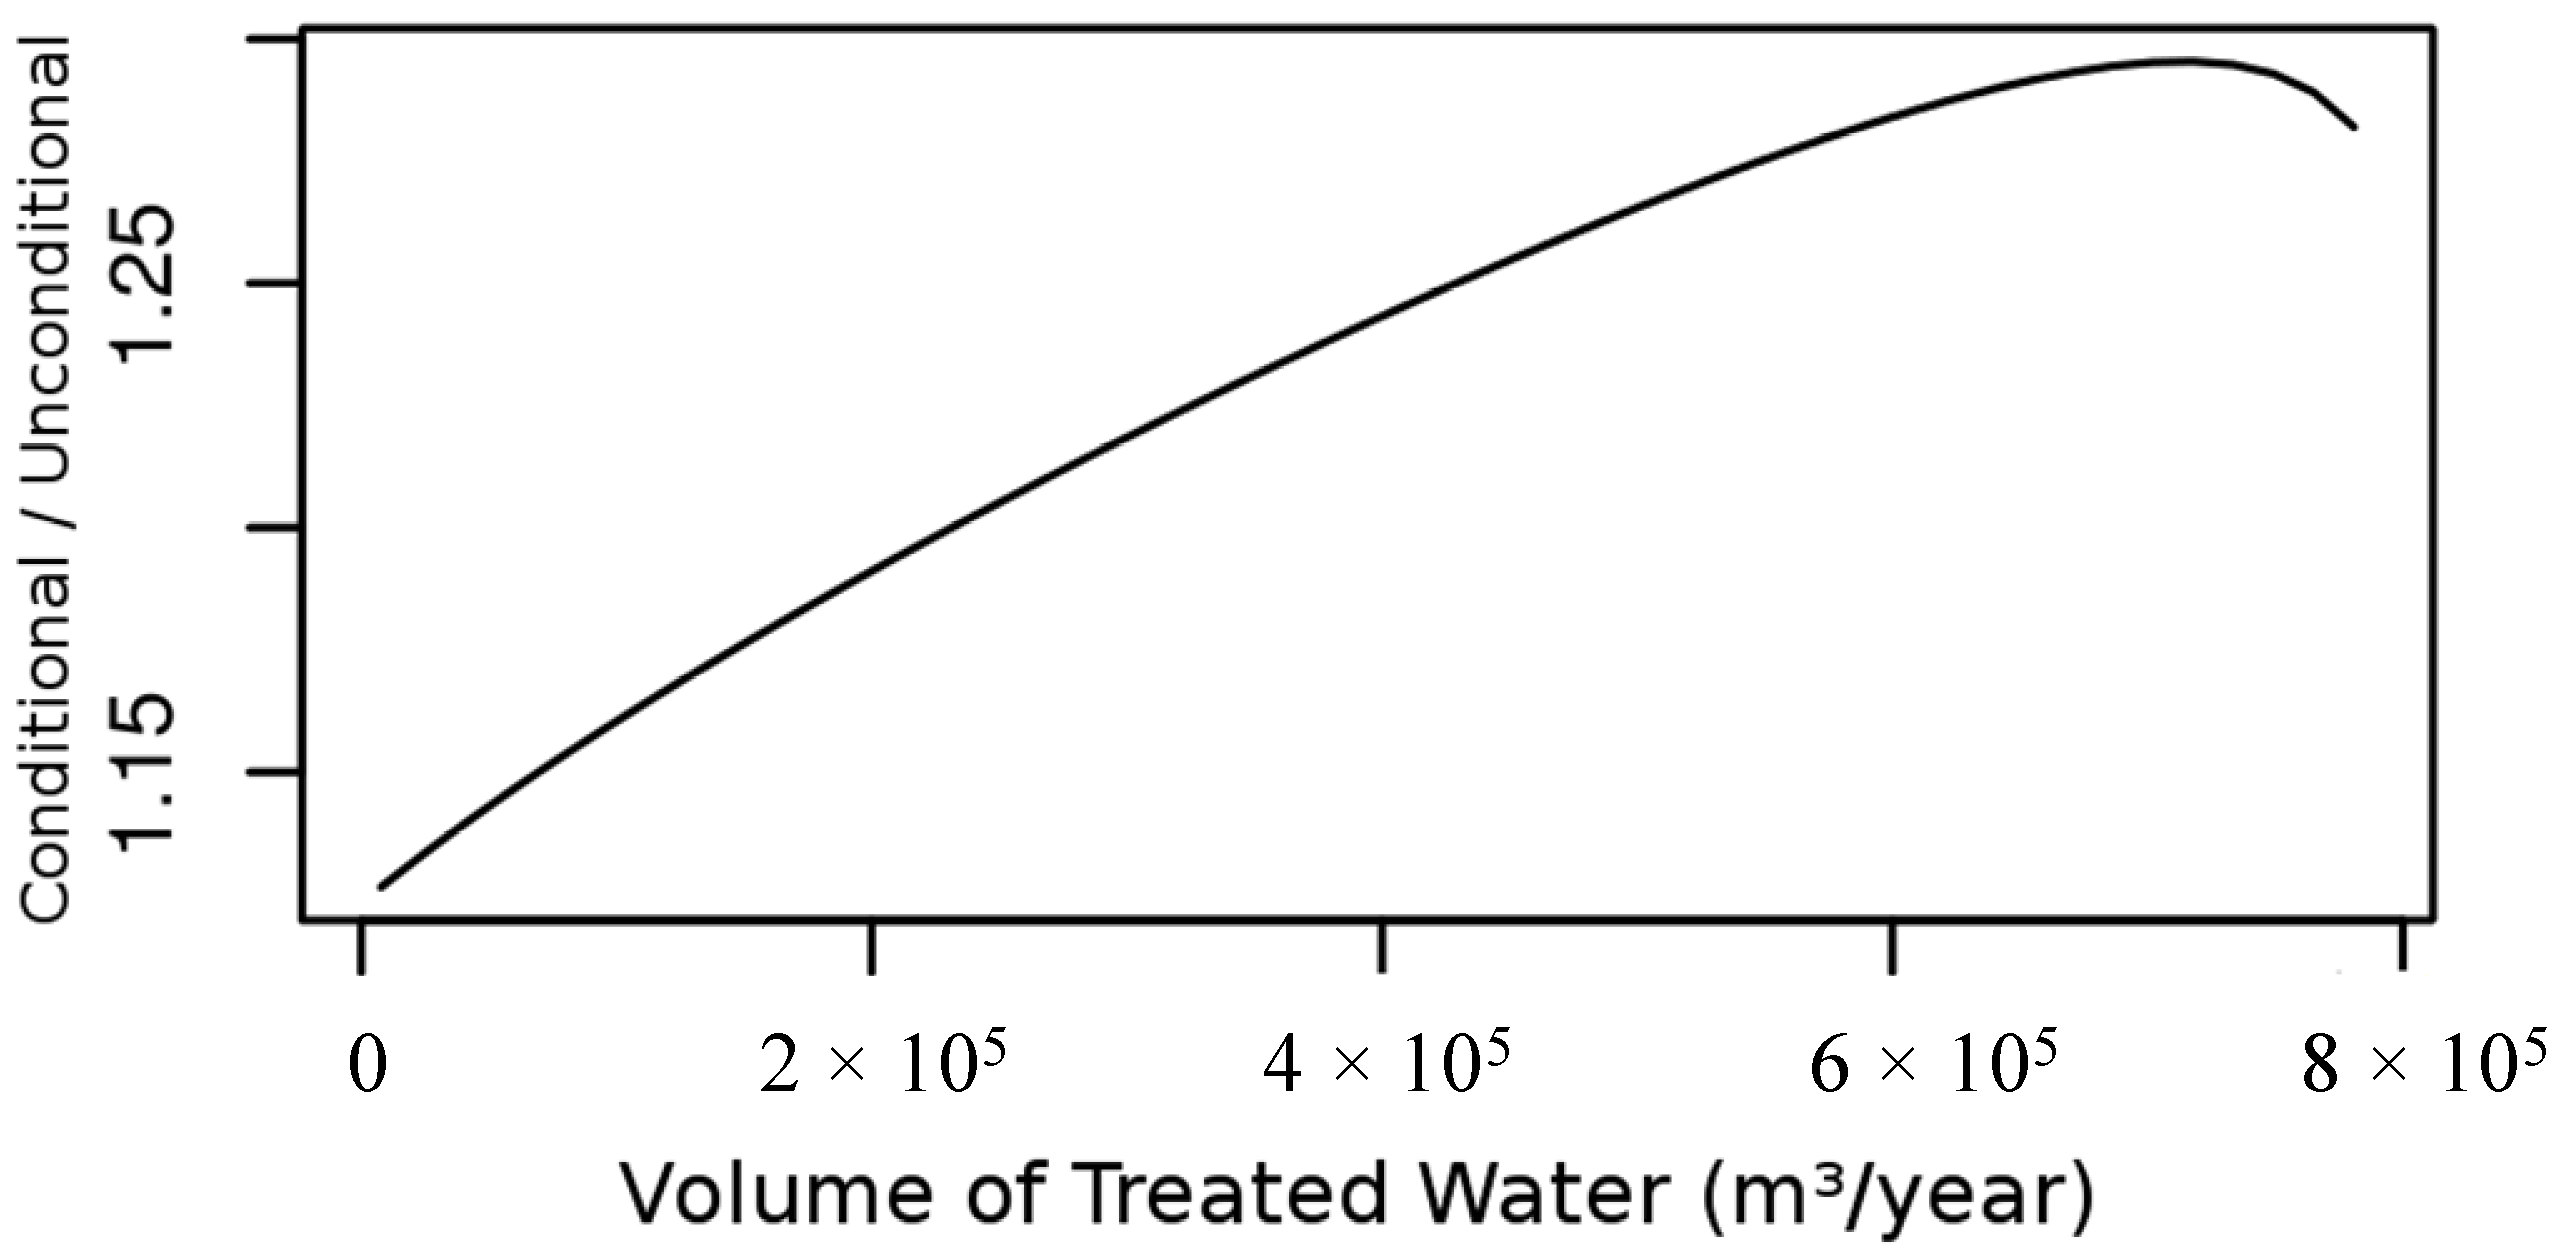
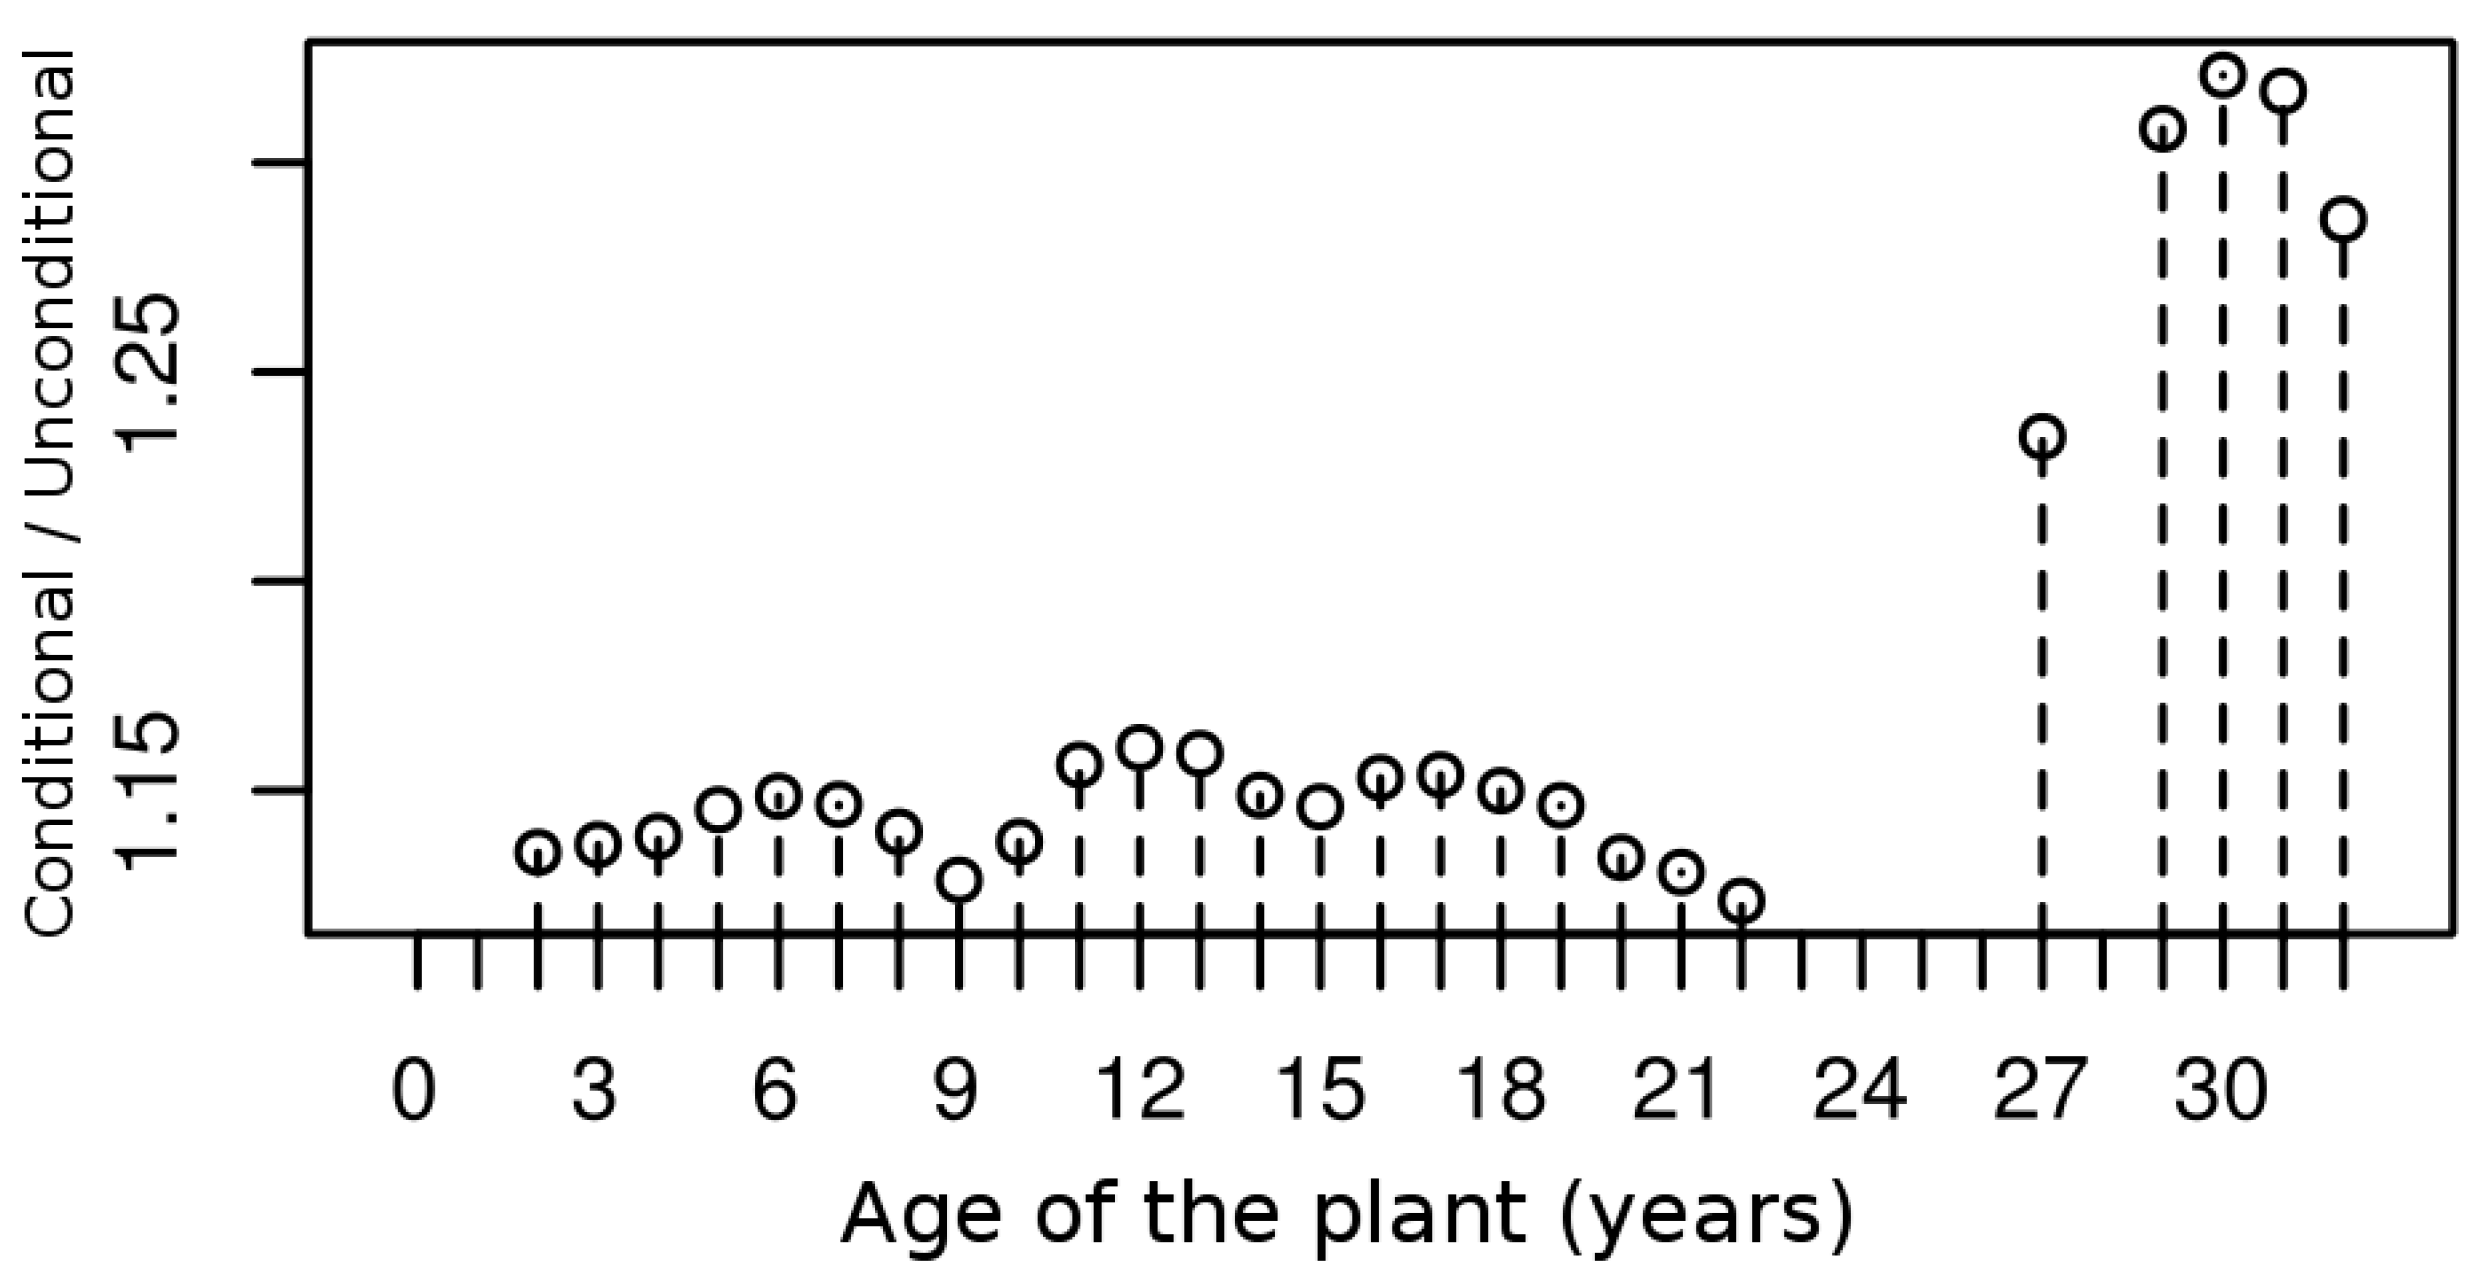
4. Results and Discussion

When analyzing the efficiency of the treatment plants encompassed in this study, firstly, their efficiency was calculated excluding contextual variables (M0) with a view to observing whether there was any kind of significant difference in the result. Hence, initially, an input-oriented order-m efficiency was estimated, as expressed in Equation (1), obtaining the mean value for efficiency of θ ^ m , n  ( x , y ) is 0.6964 (see Table 3).
Table 3. Levels of mean efficiency for WWTPs.
Measures of EfficiencyMeanStandard DeviationMin.Max.
M0 (order-m efficiency)0.69640.29020.21961.4010
M1 (order-m conditional efficiency)0.81410.37540.27842.2000
The above result indicates that the mean inefficiency of the whole set of 158 treatment plants was 0.3036 (1-0.6964), in other words, if all the plants were to perform as efficiently as the best ones, the mean efficiency could improve by 30.36%.
Below in the same table is the result for conditional order-m efficiency (M1), which controls heterogeneity between the different WWTPs by considering contextual variables. As expected, the efficiency ratio improves, where the mean value of θ ^ m , n  ( x , y | z ) is 0.8141, in other words, a mean inefficiency of just 0.1859 (potential improvement of 18.59%, which is quite smaller than the values of previous research too [21]). This result is logical given that now the dataset with which each unit is compared to estimate its level of efficiency is smaller since it only includes treatment plants with similar characteristics (values from the context variables) instead of comparing them with the total sample, as is the case M0. For the same reason, the number of efficient units with M0 (33 units) increased when the estimation was conducted with M1 (43 units).
In addition, both M0 and M1, indicate the existence of DMUs where the levels of input efficiency surpass unity (as evidenced by the maximum values in Table 3). These DMUs would be the ones that are functioning better than the average of the m treatment plants to which their efficiency is compared (as suggested by Cazals et al. [37], an m value was chosen for which the reduction of the number of superefficient observations was stable, m = 30 in both cases). In this respect, the maximum efficiency score obtained taking into account the effect of the contextual variables (M1) was 2.2000, meaning that the most efficient plant used 1.20 times less inputs than the expected value of the minimum level of m = 30 other WWTPs drawn from the plant population, generating a greater or equal output level and having contextual variables with similar characteristics. On the other hand, the least efficient WWTP only obtained an efficiency score of 0.2784, which means that it used 72.16% more resources than the expected value of the minimum input level of m = 30 other plants drawn from the population of WWTPs, generating a greater or equal output level and having contextual variables with similar characteristics.
In order to ascertain the existence and type of influence of the exogenous variables on levels of efficiency, the significance tests described in De Witte and Kortelainen [35], who use the regression method developed by Racine and Li [39], were implemented. The results are presented in Table 4.
Table 4. Non-parametric significance test. M1 (order-m conditional efficiency).
Variablesp-ValueMean EffectFactor that Favours Efficiency
SS0.0050 *FavorableGreater SS
COD0.0680 *FavorableGreater COD
VTW0.0020 *UnfavorableLower volume
TA0.3310Not significant
Age< 2 × 10⁻¹⁶ *UnfavorableLower age
Note: * implies a significant level of 95%.
The above table shows how the results of the significance comparisons for the contextual variables of M1 accept as valid the amount of suspended solids (SS), the chemical oxygen demand (COD), the volume of treated water (VTW) and the age of the plants (Age), rejecting the other variable considered, the type of aeration (TA).
The shape of the graphs of the non-parametric partial regressions for the conditional efficiency to unconditional efficiency ratios with the contextual variables shows the direction of the mean effect for each exogenous variable. It should be taken into account that, since an input orientation has been selected for the model, the relationship between the slope of the graphs and the sense of the influence of each contextual variable on the efficiency of the WWTPs is inverse. Thus, a positive slope indicates a negative influence of the contextual variable and vice versa [46,47,48]. This information is reflected in Figure 2, Figure 3, Figure 4 and Figure 5 for the variables whose significance was ascertained previously and summarized in the second and third column of Table 4.
Figure 2. Partial regression plot of SS (mg/L).
Water 07 05503 g002
As these figures show, both the level of suspended solids and the chemical oxygen demand positively affect the efficiency of the plants, whereas the volume of water treated and the age of the plants affect it negatively.
Figure 3. Partial regression plot of COD (mg/L).
Water 07 05503 g003
Figure 4. Partial regression plot of VTW (m3/year).
Water 07 05503 g004
Figure 5. Partial regression plot of Age (years).
Water 07 05503 g005
In terms of the amount of suspended solids and chemical oxygen demand, the expectation was that a higher content of solids and chemical demand in the water to be treated would reduce the efficiency of the treatment plants. However, the actual result does not agree with initial expectations. In this respect the data would seem to point to the fact that, in relation to the rest of the plants, those receiving lower quality influent water would implement specific measures aimed at better management of their resources and make a greater effort to ensure that the effluent water reached at least the minimum legally established quality standards.
On the other hand, the age of the plants and the volume of water treated show a different behaviour to the previous variables. In particular, those plants that were built or reformed a long time ago achieve a lower level of efficiency, as expected [21]. This result would agree with the fact that more recent WWTPs have incorporated technological innovations in their facilities, ensuring an improved performance with respect to older ones, while rectifying previous operation and/or management practices found not to be entirely appropriate.
Lastly, the volume of treated water would show an inverse relationship with the level of efficiency reached by the WWTPs, i.e., smaller treatment plants would be the most efficient, unlike the findings of previous studies [22,26,44,45]. However, the expected result was ambiguous, since certain previous studies pointed to the possibility of there not being statistically significant economies of scale [30].
In particular, there would appear to be a higher likelihood of finding diseconomies of scale in large water utilities, which increases when these are publicly owned, precisely the case on which the present study focuses. The possible reasons for this result essentially include greater network complexity, larger annualized capital costs, and higher transport costs as plant size increases. Furthermore, the public nature of the ownership and management of the facilities could affect the fact that, given the prevalence of public utilities in the water industry, there might be a certain tendency to privatize facilities with economies of scale [30].
All calculations were performed using the R np package 0.60-2 developed by Hayfield and Racine [49] for the calculations of the bandwidths, our own R package that we developed to estimate the order-m efficiencies and the conditional order-m efficiencies, and the code kindly provided by professors de Witte and Kortelainen to do the significance tests. The R version used was 3.1.3. [50].

5. Conclusions

This paper applies an extension of the model of conditional efficiency that allows a large quantity of continuous and discrete contextual variables to be incorporated simultaneously in the calculation of efficiency levels, as well as enabling the significance of said variables to be verified in the calculation of said levels.
The efficiency of 158 WWTPs that were using the type of secondary treatment based on activated sludge through extended aeration (EA) in the Region of Valencia (Spain) was analyzed and the main findings were that, unlike previous research into this subject [21], the levels of inefficiency were substantially lower, which would indicate that the treatment plants analyzed could improve their level of efficiency, but would not need to do so to such an extent.
At the same time, it has also been determined that certain exogenous factors presented statistical significance and different influence to previous results [20,21,22,25,44,45]. In particular, the quality of the influent water and the size were identified as a statistically negative significant exogenous factors (lower quality of the influent water and smaller plant size, greater efficiency) and yet the type of aerator used was not significant. Others, like the age, had the same type of influence as previous results (more modern, more efficient plants) [21].
Hence, the findings of the present study would point to the need for investing public funds in order to incorporate new technological improvements in the water treatment systems and facilities, thereby contributing to enhancing the efficiency of the process.
In this respect, it would also be advisable to step up the rate of renovation of the older plants to ensure that obsolete systems remain in operation for the shortest possible time. Moreover, improved performance would be achieved by the implementation of measures aimed at analyzing the management practices of treatment plants receiving lower quality influent water, with a view to replicating them in plants with higher quality influent water, thereby improving the efficiency of the latter.
Obviously, the implementation of measures to ensure that all treatment plants receive influent water with lower levels of SS and COD would also result in enhanced performance through a reduction of the effort and costs involved in the treatment process. In addition, as regards plant size, it would be advisable for new plants to be smaller, though obviously always in proportion to the size of the population they must serve. This would avoid the high annualized capital costs, greater installation complexity, and higher transport costs inherent to large infrastructures, which do not appear to have a positive impact on the efficiency of WWTPs. Lastly, given that the type of aeration was found not to have a significant impact on efficiency in the kind of plants analyzed, it would be logical to use the method with the lowest financial costs from an acquisition, installation, and maintenance standpoint.
Nevertheless, the static nature of this research limits the possibility of generalizing the conclusions obtained. The use of information referring to several years, and not just one, could alter and/or expand the conclusions obtained. In this respect, future research could focus on calculating levels of efficiency over time with a view to comparing their evolution and establishing conclusions within a dynamic framework, as well as expanding the group of WWTPs analyzed, including others that employ different processes with a view to comparing the results offered by each of said subtypes and expanding the findings. In this respect, the information available for this purpose is crucial.

Author Contributions

Ramón Fuentes contributed to literature review, method, data analysis, results, discussion and conclusions; Teresa Torregrosa to introduction and literature review; Enrique Ballenilla to data analysis.

Conflicts of Interest

The authors declare no conflict of interest.

References

  1. Medstat II: Water and Tourism Pilot Study. Available online: http://ec.europa.eu/eurostat/documents/3888793/5844489/KS-78-09-699-EN.PDF/04c900a4-6243-42e0-969f-fc04f184a8b6?version=1.0 (accessed on 20 September 2015).
  2. Beltrao, J.; Neves, A.; de Brito, J.C.; Seita, J. Salt removal potential of turfgrass in golf courses in the Mediterranean Basin. WSEAS Trans. Environ. Dev. 2009, 5, 394–403. [Google Scholar]
  3. Gössling, S.; Peeters, P.; Hall, C.M.; Dubois, G.; Ceron, J.P.; Lehmann, L. Tourism and water use: Supply, demand, and security, an international review. Tour. Manag. 2012, 33, 1–15. [Google Scholar] [CrossRef]
  4. Hof, A.; Schmitt, T. Urban and tourist land use patterns and water consumption: Evidence from Mallorca, Balearic Islands. Land Use Pol. 2011, 28, 792–804. [Google Scholar] [CrossRef]
  5. Hernández-Sancho, F.; Molinos-Senante, M.; Sala-Garrido, R. The influence of seasonality on the economic efficiency of wastewater treatment plants. In Advanced Water Supply and Wastewater Treatment: A Road to Safer Society and Environment; Hlavinek, W., Marsalek, M., Eds.; Springer: Berlin, Germany, 2011. [Google Scholar]
  6. Lazarova, V.; Sturny, V.; Tong, S.G. Relevance and benefits of urban water reuse in tourist areas. Water 2012, 4, 107–122. [Google Scholar] [CrossRef]
  7. Optimising Water Reuse in the EU. Final Report—Part I. Prepared for the European Commission—(DG ENV). Available online: http://ec.europa.eu/environment/water/blueprint/pdf/BIO_IA%20on%20water%20reuse_Final%20Part%20I.pdf (accessed on 7 September 2015).
  8. De Jong, R.; Nentjes, A.; Wiersma, D. Inefficiencies in public environmental services. Environ. Resour. Econ. 2000, 16, 69–79. [Google Scholar] [CrossRef]
  9. Laukkanen, M.; Huhtala, A. Optimal management of a eutrophied coastal ecosystem: Balancing agricultural and municipal abatement measures. Environ. Resour. Econ. 2008, 39, 139–159. [Google Scholar] [CrossRef]
  10. Van der Veeren, R.J.H.M.; Tol, R.S.J. Benefits of a reallocation of nitrate emission reductions in the Rhine River Basin. Environ. Resour. Econ. 2001, 18, 19–41. [Google Scholar] [CrossRef]
  11. Ministerio de Medio Ambiente, Medio Rural y Marino de España (MARM) (Spanish Ministry of Environment. Water Digital Book). Available online: http://servicios2.marm.es/sia/visualizacion/lda/economico/recuperacion_costes.jsp (accessed on 6 May 2015).
  12. Myšková, R.; Ilona, O.; Petr, C.; Karel, S. Assessment of environmental and economic effects of environmental investment as a decisions problem. WSEAS Trans. Environ. Dev. 2013, 9, 268–277. [Google Scholar]
  13. Guerrini, A.; Romano, G.; Campedelli, B. Economies of Scale, scope and density in the Italian water sector: A two-stage data envelopment analysis approach. Water Resour. Manag. 2013, 27, 4559–4578. [Google Scholar] [CrossRef]
  14. Long, S.; Cudney, R. Integration of energy and environmental systems in wastewater treatment plants. Int. J. Energy Environ. 2012, 3, 521–530. [Google Scholar]
  15. Guerrini, A.; Romano, G.; Leardini, C.; Martini, M. The effects of operational environmental variables on efficiency of Danish water and wastewater utilities. Water 2015, 7, 3263–3282. [Google Scholar] [CrossRef]
  16. Directive of the European Parliament and of the Council Establishing a Framework for Community Action in the Field of Water Policy, 2000/60/EC. Available online: http://www.ecolex.org/ecolex/ledge/view/RecordDetails?index=documents&id=LEX-FAOC023005 (accessed on 26 June 2015).
  17. Molinos-Senante, M.; Gómez, T.; Garrido-Baserba, M.; Caballero, R.; Sala-Garrido, R. Assessing the sustainability of small wastewater treatment systems: A composite indicator approach. Sci. Total Environ. 2014, 497, 607–617. [Google Scholar] [CrossRef] [PubMed]
  18. Molinos-Senante, M.; Hernández-Sancho, F.; Mocholí-Arce, M.; Sala-Garrido, R. Economic and environmental performance of wastewater treatment plants: Potencial reductions in greenhouse gases emissions. Resour. Energy Econ. 2014, 38, 125–140. [Google Scholar] [CrossRef]
  19. Molinos-Senante, M.; Hernández-Sancho, F.; Sala-Garrido, R. Benchmarking in wastewater treatment plants: A tool to save operational costs. Clean Technol. Environ. 2014, 16, 149–161. [Google Scholar] [CrossRef]
  20. Lorenzo-Toja, Y.; Vázquez-Rowe, I.; Chanel, S.; Marín-Navarro, D.; Moreira, M.; Feijoo, G. Eco-efficiency analysis of Spanish WWTPs using the LCA+DEA method. Water Res. 2015, 68, 651–666. [Google Scholar] [CrossRef] [PubMed]
  21. Hernández-Sancho, F.; Molinos-Senante, M.; Sala-Garrido, R. Techno-economical efficiency and productivity change of wastewater treatment plants: The role of internal and external factors. J. Environ. Monitor. 2011, 13, 3448–3459. [Google Scholar] [CrossRef] [PubMed]
  22. Hernández-Sancho, F.; Molinos-Senante, M.; Sala-Garrido, R. Energy efficiency in Spanish wastewater treatment plants: A non-radial DEA approach. Sci. Total Environ. 2011, 409, 2693–2699. [Google Scholar] [CrossRef] [PubMed]
  23. Sala-Garrido, R.; Hernández-Sancho, F.; Molinos-Senante, M. Comparing the efficiency of wastewater treatment technologies through a DEA metafrontier Model. Chem. Eng. J. 2011, 172, 766–772. [Google Scholar] [CrossRef]
  24. Sala-Garrido, R.; Hernández-Sancho, F.; Molinos-Senante, M. Assessing the efficiency of wastewater treatment plants in an uncertain context: A DEA with tolerances approach. Environ. Sci. Policy 2012, 18, 34–44. [Google Scholar] [CrossRef]
  25. Sala-Garrido, R.; Molinos-Senante, M.; Hernández-Sancho, F. How does seasonality affect water reuse possibilities? An efficiency and cost analysis. Resour. Conserv. Recycl. 2012, 58, 125–131. [Google Scholar] [CrossRef]
  26. Hernández-Sancho, F.; Sala-Garrido, R. Eficiencia Técnica en la Depuración de Aguas Residuales: El Caso de la Comunidad Valenciana. In Proceedings of the XIII Jornadas de ASEPUMA, La Coruña, Spain, 15–16 September 2005.
  27. Hernández-Sancho, F.; Sala-Garrido, R. Technical efficiency and cost analysis in wastewater treatment processes: A DEA approach. Desalination 2009, 249, 230–234. [Google Scholar] [CrossRef]
  28. Mahmoudi, M.J.; Fathi, B.; Sajadifar, H.; Shahsavari, A. Measuring efficiency of water and wastewater company: A DEA approach. Res. J. Appl. Sci. Eng. Technol. 2012, 4, 1642–1648. [Google Scholar]
  29. Kemp, R. The diffusion of biological wastewater treatment plants in the dutch food and beverage industry. Environ. Resour. Econ. 1998, 12, 113–136. [Google Scholar] [CrossRef]
  30. Carvalho, P.; Marques, R.C.; Berg, S. A meta-regression analysis of bench marking studies on water utilities market structure. Util. Policy 2012, 21, 40–49. [Google Scholar] [CrossRef] [Green Version]
  31. Fraquelli, G.; Giandre, R. Reforming the wastewater treatment sector in Italy: Implications of plant size, structure, and scale of economies. Water Resour. Res. 2003, 39. [Google Scholar] [CrossRef]
  32. Berg, R.; Marques, R. Quantitative studies of water and sanitation utilities: A benchmarking literature survey. Water Policy 2011, 13, 591–606. [Google Scholar] [CrossRef] [Green Version]
  33. Wheelock, D.C.; Wilson, P.W. Robust nonparametric quantile estimation of efficiency and productivity change in US commercial banking, 1985–2004. J. Bus. Econ. Stat. 2009, 27, 354–368. [Google Scholar] [CrossRef]
  34. Simar, L. Detecting outliers in frontier models: A simple approach? J. Prod. Anal. 2003, 20, 391–424. [Google Scholar] [CrossRef]
  35. De Witte, K.; Kortelainen, M. What explains the performance of students in a heterogeneous environment? Conditional efficiency estimation with continuous and discrete environmental variables. Appl. Econ. 2013, 45, 2401–2412. [Google Scholar] [CrossRef]
  36. Daraio, C.; Simar, L. Introducing environmental variables in nonparametric frontier models: A probabilistic approach. J. Prod. Anal. 2005, 24, 93–121. [Google Scholar] [CrossRef]
  37. Cazals, C.; Florens, J.P.; Simar, L. Nonparametric frontier estimation: A robust approach. J. Econom. 2002, 106, 1–25. [Google Scholar] [CrossRef]
  38. Daraio, C.; Simar, L. Conditional nonparametric frontier models for convex and nonconvex technologies: A unifying approach. J. Prod. Anal. 2007, 28, 13–32. [Google Scholar] [CrossRef]
  39. Racine, J.S.; Li, Q. Nonparametric estimation of regression functions with both categorical and continuous data. J. Econom. 2004, 119, 99–130. [Google Scholar] [CrossRef]
  40. Simar, L.; Wilson, P. Estimation and inference in two stage, semi-parametric models of production processes. J. Econom. 2007, 136, 31–64. [Google Scholar] [CrossRef]
  41. Fuentes, R.; Álvarez-Suárez, A. Productivity of travel agencies in Spain: The case of Alicante. Serv. Ind. J. 2011, 32, 2623–2640. [Google Scholar] [CrossRef]
  42. Barros, C.P.; Matias, A. Assessing the efficiency of travel agencies with a stochastic cost frontier: A Portuguese case study. Int. J. Tour. Res. 2006, 8, 367–379. [Google Scholar] [CrossRef]
  43. Qteishat, O.; Myszograj, S.; Suchowska-Kisielewicz, M. Changes of wastewater characteristic during transport in sewers. WSEAS Trans. Environ. Dev. 2011, 7, 349–358. [Google Scholar]
  44. Carvalho, P.; Marques, R. Estimating size and scope economies in the Portuguese water sector using the most appropriate functional form. Eng. Econ. 2015, 60, 109–137. [Google Scholar] [CrossRef]
  45. Marques, R.; de Witte, K. Is big better? On scale and scope economies in the Portuguese water sector. Econ. Model. 2011, 28, 1009–1016. [Google Scholar] [CrossRef]
  46. Blaming the Exogenous Environment? Conditional Efficiency Estimation with Continuous and Discrete Exogenous Variables. Available online: https://mpra.ub.uni-muenchen.de/14034/1/MPRA_paper_14034.pdf (accessed on 8 January 2011).
  47. Carvalho, P.; Marques, R. The influence of the operational environment on the efficiency of water utilities. J. Environ. Manag. 2011, 92, 2698–2707. [Google Scholar] [CrossRef] [PubMed]
  48. Halkos, E.G.; Tzeremes, N.G. Measuring the effect of Kyoto protocol agreement on countries’ environmental efficiency in CO2 emissions: An application of conditional full frontiers. J. Prod. Anal. 2014, 41, 367–382. [Google Scholar] [CrossRef] [Green Version]
  49. Nonparametric Econometrics: The np Package. Avaliabe online: http://www.jstatsoft.org/v27/i05/ (accessed on 25 May 2015).
  50. The R Foundation for Statistical Computing. Available online: http://www.R-project.org/ (accessed on 11 April 2015).

