Article

Effects of Seasonal Thermal Stratification on the Functional Diversity and Composition of the Microbial Community in a Drinking Water Reservoir

School of Environmental and Municipal Engineering, Xi’an University of Architecture and Technology, Xi’an 710055, Shan’xi, China
*
Author to whom correspondence should be addressed.
Water 2015, 7(10), 5525-5546; https://doi.org/10.3390/w7105525
Submission received: 15 June 2015 / Revised: 24 September 2015 / Accepted: 9 October 2015 / Published: 15 October 2015

Abstract

:
The microbial communities within reservoir ecosystems are shaped by water quality and hydrological characteristics. However, there are few studies focused on the effects of thermal stratification on the bacterial community diversity in drinking water reservoirs. In this study, we collected water samples from the Jinpen Reservoir around the re-stratification period. To explore the functional diversity and bacterial community composition, we used the Biolog method and 16S rRNA-based 454 pyrosequencing combined with flow cytometry. The results indicated that stratification of the reservoir had great effects on temperature and oxygen profiles, and both the functional diversity and the composition of the bacterial community strongly reflected the significant vertical stratification in the reservoir. The results of the Biolog method showed a significantly higher utilization of carbon sources in the hypolimnion than in the epilimnion. The result of pyrosequencing also showed a significantly higher species diversity and richness in the hypolimnion than in the epilimnion with different dominant phylum. Redundancy analysis also indicated that the majority of environmental variables, especially pH and dissolved oxygen, played key roles in shaping bacterial community composition. Our study provides a better understanding of the functional diversity of bacterial communities, and the response of microorganisms to seasonal thermal stratification.

1. Introduction

Reservoirs are the main source of urban drinking water in China, especially in arid and semiarid regions. Thermal regime is strongly associated with the hydrodynamics of these reservoirs, and the water column becomes seasonally thermally stratified and divided into the epilimnion, metalimnion, and hypolimnion [1,2,3]. The metalimnion would limit the transfer of oxygen from the surface to the deeper waters during the stratified period [4,5]. Additionally, an extended period of anoxic condition in the hypolimnion may intensify the deterioration of the water quality [6,7].
The freshwater ecosystem of drinking water reservoirs usually contains a number of microorganisms which are strongly affected by the physical and chemical variables [8]. Numerous studies have been performed to determine the microbial composition of aquatic habitats, using molecular methods such as denaturing gradient gel electrophoresis (DGGE) [9], catalyzed reporter deposition-fluorescence in situ hybridization (CARD-FISH) [10], clone library analysis [11], and 454-pyrosequencing [12,13]. The Biolog EcoPlate™ has also been developed to study heterotrophic microbial communities based on carbon-source utilization as a more simple and rapid method, and has been widely used in various environments, including soil, sediments and activated sludge [14,15,16]. However, to the best of our knowledge, few researchers have used the Biolog method to reveal the functional diversity of the bacterial community in drinking water reservoirs.
Stratified aquatic ecosystems offer a physically and chemically well-defined environment, providing diverse potential habitats for microorganisms. Hence, a clear shift in the microbial community structure is expected to be shown between the oxic and anoxic water bodies. Comeau et al. studied prokaryotes by using high-throughput 16S rRNA gene tag-pyrosequencing, and found that both the bacterial and archaeal communities were stratified by depth in an Arctic lake [17]. An examination of the phylogenetics of the Great Salt Lake, Utah, showed that samples in the epilimnion were phylogenetically clustered, while those from the hypolimnion were phylogenetically overdispersed [11]. Qian et al. indicated that there were significant differences in both the bacterial and archaeal diversity between the upper and lower layers in the Red sea [13]. Similar research by Pommier et al. found a parallel decrease in the richness and evenness of microbes form the bottom to the surface of the northwestern Mediterranean Sea [12]. However, the microbial communities in stratified freshwater ecosystems have not been studied to the same extent as those in marine or saline lakes, with different trophic status and morphology. Limited previous research has suggested that each thermal layer in the stratified lakes and reservoirs harbors different bacterial communities [5,18,19]. In addition, other studies based on functional genes, such as the adenosine 5'-phosphosulfate reductase (aprA) and the ammonia monooxygenase A (amoA) genes, showed the strong vertical differentiation of sulfate reducers, sulfur oxidizers, and archaeal ammonia oxidizers along environmental gradients [20,21]. Although marked vertical variations of the microbial communities have been found, it remains to be determined whether these variations are associated with functional or metabolic changes in levels of the utilization of carbon sources.
Stratification and mixing periods provide a unique opportunity to explore the response of water bacterial communities to both spatial and temporal changes in the aquatic ecosystem. In the present study, we investigated the composition and functional diversity of the bacterial community, before and after the water column become stratified, in the Jinpen Drinking Water Reservoir (Jinpen Reservoir), in Northwest China using both the Biolog method and 454-pyrosequencing of 16S rRNA. The environmental conditions, including the physical and chemical parameters of water quality and the total bacterial cell counts, were measured as well. Accordingly, the objectives were: (1) to investigate the shifts in bacterial communities before and after stratification, and compare the differences between the upper and deeper water layers during the stratification; (2) to determine whether the variations in bacterial community composition (BCC) are associated with changes in functional diversity; and (3) to reveal the possible relationships between bacterial communities and environmental driving factors in the Jinpen Reservoir. The results could provide more information about revealing the effects of seasonal thermal stratification of the reservoir water body, and present the first insight into the dynamics of microbial communities in the Jinpen Reservoir, China.

2. Materials and Methods

2.1. Study Sites and Sampling

The Jinpen Reservoir (34°42'–34°01' N; 107°43'–108°24' E) is a deep, canyon-shaped reservoir located in the City of Xi’an, in the Shaanxi Province of the Northwest China region. It is the most important raw water source for the city, with a daily water supply of 8.0 × 10⁵ m3. The reservoir has a surface area of 4.55 km2 and a volume of 2.0 × 10⁸ m3 at full water level. The maximum depth of the reservoir is 94 m, and the mean depth is 44 m. During the summer days, the water body becomes thermally stratified. The hydrography and water quality of the Jinpen Reservoir has been systematically determined in the past five years by our research team. Our previous studies indicated that the mixing period of the Jinpen Reservoir ends at the beginning of June, followed by a re-stratification period. Stratification became stable by mid-June, and lasted until December [1,22,23]. According to our previous results, we focused on the changes in microbial communities driven by thermal stratification, with regard to both the functional diversity and structure, in the Jinpen Reservoir.
In this study, three sampling sites (marked as A [34°02'45'' N, 108°12'25'' E], B [34°02'38'' N, 108°12'14'' E], C [34°02'47'' N, 108°12'15'' E]) were picked at the deepest area of the main reservoir, with an over 300 m distance from each other. Sampling was carried out on 29 May, 1 July and 1 August 2014, respectively. The water temperature, dissolved oxygen, total nitrogen and total phosphorus profiles of water quality of the sampling dates at site A were shown in Figure 1. Due to the fact that the re-stratification period was less than two weeks, and our sampling intervals were approximately every four weeks, no samples were taken during the re-established period of stratification. Water samples were obtained with a 2.0-L sterile Van-Dorn bottle, at intervals of 20 m, from the surface to the bottom (0.5 m above the sediment). A total of 34 water samples were collected maintained at the temperature of 4 °C, and were sent to the laboratory immediately. Samples were divided into two parts. One part was used for chemical analysis, total cell counts and the Biolog assay immediately. The other part (500 mL) was filtered onto 0.22-μm pore size polycarbonate membranes for DNA extraction. The filters were frozen at −80 °C until DNA extraction.
Figure 1. (AD) Water temperature, dissolved oxygen, total nitrogen and total phosphorus profiles of the sampling dates at site A, in the Jinpen Drinking Water Reservoir, China.
Water 07 05525 g001

2.2. Water Physical and Chemical Analysis

To examine the physiochemical characteristics of water quality, vertical profiles of water temperature, dissolved oxygen (DO), pH, specific conductivity (SpCond) and turbidity were measured in situ with increments of 0.5 m using a multiparameter water quality analyzer (Hydrolab DS5, Hach, Loveland, CO, USA). Thermal layer boundaries were determined based on temperature profile as shown in Figure 1. The metalimnion was determined to be where the temperature decreased by 0.5 °C over 1 m depth or less [24,25,26]. Water chemical parameters were analyzed as previously described [1,27]. Concentrations of total nitrogen (TN) and total phosphorus (TP) were measured using ultraviolet spectrophotometry and ammonium molybdate spectrophotometry after alkaline potassium persulfate digestion under high temperature (DR5000 spectrophotometer, Hach). Concentration of ammonia nitrogen (NH4-N) was determined using Nessler’s reagent colorimetric method at the circum-neutral pH condition. Permanganate index (CODMn) was determined by titrimetric method.

2.3. Total Cell Counts

The total bacterial cells of the water samples were counted using the flow cytometry (FCM) as previously described [28,29]. Each water sample (500 μL) was stained with 5 μL SYBR Green I (1:100 dilution in DMSO; Invitrogen, Basel, Switzerland), and incubated in the dark for 10 min at 35 °C. In addition, the bacteria concentration measured with the flow cytometer has to be less than 2.0 × 10⁵ cells mL−1. So the water samples were diluted just before measurement by ultrapure water if necessary. FCM was performed using a BD Accuri C6 flow cytometer (BD Accuri cytometers, Aalst, Belgium) equipped with a blue 25 mW solid state laser emitting at a fixed wavelength of 488 nm. 30 μL of each sample was performed at medium flow rate (35 μL·mL−1), and a threshold value of 500 was applied on the green fluorescence channel (FL1). Green fluorescence (FL1) was collected at 520 ± 10 nm, red fluorescence (FL3) above 630 nm, and side scatter (SSC) at 488 nm. Data were analyzed using CFlow software (BD Accuri).

2.4. Microbial Community Functional Diversity Determination

To explore the microbial community functional diversity profiles, Biolog Eco microplate (EcoPlate™, BIOLOG, Hayward, CA, USA) was employed as previously described with little modification [30,31]. The plate contains 31 different carbon sources, which can be grouped to six kinds of carbon sources, including carbohydrates, amino acids, esters, alcohols, amines and carboxylic acids, and each plate is reproduced in triplicate. 150 μL of each sample was added into every well of Eco plate using 8 way electronic pipettes (Bio-Rad, Hercules, CA, USA). Eco plates were incubated at 28 °C in darkness. The absorbance at 590 nm was recorded every 24 h interval over ten days, and the results obtained at 144 h were used for diversity index and further statistical analysis [30]. The diversity indices included average well color development (AWCD590nm), Shannon Diversity (H') and McIntosh Diversity (U). AWCD590nm was used as an indicator of general microbial activity, and assessed as the average optical density across all wells per plate [31,32]. McIntosh is an index measuring the homogeneity of species in the community, and Shannon index is greatly affected by the species richness of community. Both the two indices were calculated as previously described [15].

2.5. Roche 454 Pyrosequencing and Sequence Analysis

To determine the BCC of water samples, total DNA was extracted from the 0.22-μm filters using a Water DNA Kit (Omega Bio-Tek, Norcross, GA, USA) according to the manufacturer’s instructions. Extracted DNA was purified using a DNA Cleanup Kit (Omega Bio-Tek) according to the manufacturer’s instructions, and the purified DNA was frozen at −20 °C until further analysis.
To obtain the specific profile of BCC, the DNA samples from sampling site C were selected for amplification and 454 pyrosequencing of bacterial 16S rRNA genes. Briefly, the V1–V3 region of the 16S rRNA gene of the DNA samples with replicates was PCR amplified using the forward primer 8 F (5′-AGAGTTTGATCCTGGCTCAG-3′) and the reverse primer 553 R (5′-TTACCGCGGCTGCTGGCAC-3′) [19,33]. Polymerase chain reaction was conducted in 20 μL reaction mixtures containing 2.0 μL of deoxynucleoside triphosphate (2.5 mM), 0.8 μL of each forward and reverse primers (5 μM each), 0.4 μL of FastPfu polymerase, 5× FastPfu Buffer 4 μL, and 10 ng of DNA. PCR reaction was performed on a C1000 Thermal Cycler Gradient (Bio-Rad) using a program of 3 min at 95 °C, followed by 27 cycles of 30 s at 95 °C, 30 s at 55 °C, and 45 s at 72 °C with a final extension for 10 min at 72 °C. All PCR products were verified by 1% agarose gel electrophoresis stained by GelRed (Biotium, Hayward, CA, USA) with DL2000 DNA ladder (Comwin Biotech Co., Beijing, China) as a size standard. Triplicate reaction mixtures were pooled per sample, and purified using the DP209 DNA Purification Kit (Tiangen Biotech Co., Beijing, China) as the manufacturer’s instructions.
The mixtures were pyrosequenced using a Roche 454 Genome Sequencer FLX Titanium platform at Majorbio Bio-Pharm Technology Co. Ltd. (Shanghai, China). After sequencing process, data were processed using the Quantitative Insights into Microbial Ecology (QIIME) software [34,35]. The low-quality sequences shorter than 200 bp, having a read quality score below 25 and possessing homopolymers longer than 8 bp were removed [36]. Raw reads were also trimmed of the standard primers and barcodes. The sequences were then binned into operational taxonomic units (OTUs) based on a 97% sequence similarity using Mothur software package (Version 1.7.0). The OTUs which contained one read were removed to avoid possible sequencing error at this step [5,17]. Taxonomic classification of the reads was performed in the Ribosomal Database Project (RDP) database [37,38]. The respective diversity indices of pyrosequencing data including Shannon-Wiener index (H'), Chao 1 richness estimates, abundance coverage-based estimator (ACE) and coverage were calculated using Mothur software package [39]. The beta diversity analysis was carried out and Bray-Curtis similarity tree was constructed based on the beta diversity using QIIME [40,41]. Bar plots were done by Microsoft Excel 2010, and heatmap analysis was conducted using R package vegan (version 2.1.1) based on relative abundances of the top 100 abundant bacterial community at genus level [19,42].

2.6. Statistical Analysis

Differences in environmental parameters and the diversity indices of Biolog data and pyrosequencing data of the water samples were analyzed by one-way analysis of variance (ANOVA) with the Tukey-Kramer honest significant difference test (p < 0.05) using SPSS software (version 16.0). The presented data were considered to be significantly different as the probability (P) was less than 0.05. Principal component analysis (PCA) and redundancy analysis (RDA) were employed to analyze the Biolog and pyrosequencing data by Canoco software (version 4.5) and Canodraw [31,43].

3. Results

3.1. Physicochemical Properties of the Jinpen Reservoir

The environmental parameters of this study are summarized in Table 1. Vertical profiles show that the water column was mixed on 29 May 2014, and little variation was observed (Figure 1). Stratification was then reestablished and persisted during our sampling series in July and August. During the stratified period, temperature, DO, and pH were significantly higher in the epilimnion and rapidly dropping down in the hypolimnion (p < 0.01). Specifically, the temperature reached 25.11 °C in the surface layer, and varied distinctly with depth, and was almost constant at 8.41 °C at the bottom of the reservoir, at 1 August. DO concentrations reached a maximum (8.31 ± 0.20 mg·L−1) in the epilimnion, and were depleted (0 mg·L−1) below the metalimnion. The turbidity showed a significant increasing trend (p < 0.01), while the SpCond varied only slightly, with depth. There were also pronounced differences in nutrient concentrations; for example, the TN concentrations decreased form the mixing to the stratified period, while the TP showed an opposite trend. Furthermore, the TN, TP, and NH4-N concentrations were significantly lower in the epilimnion and higher in the hypolimnion (p < 0.05; Table 1). Vertical profiles show that the physical and chemical characteristics are similar at three sampling sites (data not shown). Variation in total cell counts was not significant.
Table 1. Environmental parameters and total cell counts of the samples in the Jinpen Drinking Water Reservoir, China.
Water LayerMixing Layer (n = 12)Epilimnion (n = 8)Metalimnion (n = 6)Hypolimnion (n = 8)
Temperature (°C)12.26 ± 3.82 BC21.88 ± 5.55 A14.27 ± 3.49 B8.50 ± 0.67 C
pH7.65 ± 0.42 A7.82 ± 0.74 A7.04 ± 0.40 AB6.78 ± 0.61 B
DO (mg·L−1)6.67 ± 2.58 AB8.31 ± 0.20 A6.0 ± 1.04 B0 ± 0 C
TN (mg·L−1)2.11 ± 0.13 A1.84 ± 0.03 B1.89 ± 0.11 BC1.99 ± 0.01 C
TP (mg·L−1)0.027 ± 0.006 A0.037 ± 0.001 A0.031 ± 0.010 A0.045 ± 0.013 B
CODMn (mg·L−1)3.40 ± 0.19 A4.03 ± 0.10 C3.77 ± 0.13 B3.96 ± 0.14 BC
NH4-N (mg·L−1)0.183 ± 0.001 AB0.126 ± 0.036 A0.116 ± 0.040 A0.218 ± 0.090 B
SpCond (ms·cm−1)172.0 ± 24.8 A144.7 ± 29.2 A150.5 ± 8.2 A172.7 ± 28.4 A
Turbidity (NTU)2.43 ± 0.84 A4.07 ± 1.75 A5.30 ± 0.33 A18.15 ± 9.69 B
Total cell count (1 × 10⁵ cells·mL−1)55.4 ± 11.5 A69.6 ± 28.3 A56.8 ± 31.7 A63.9 ± 19.7 A
Notes: Analysis of variance (ANOVA) was used. Different capital letters indicate significant differences among the layers (p < 0.05) Data represent mean ± S.E.

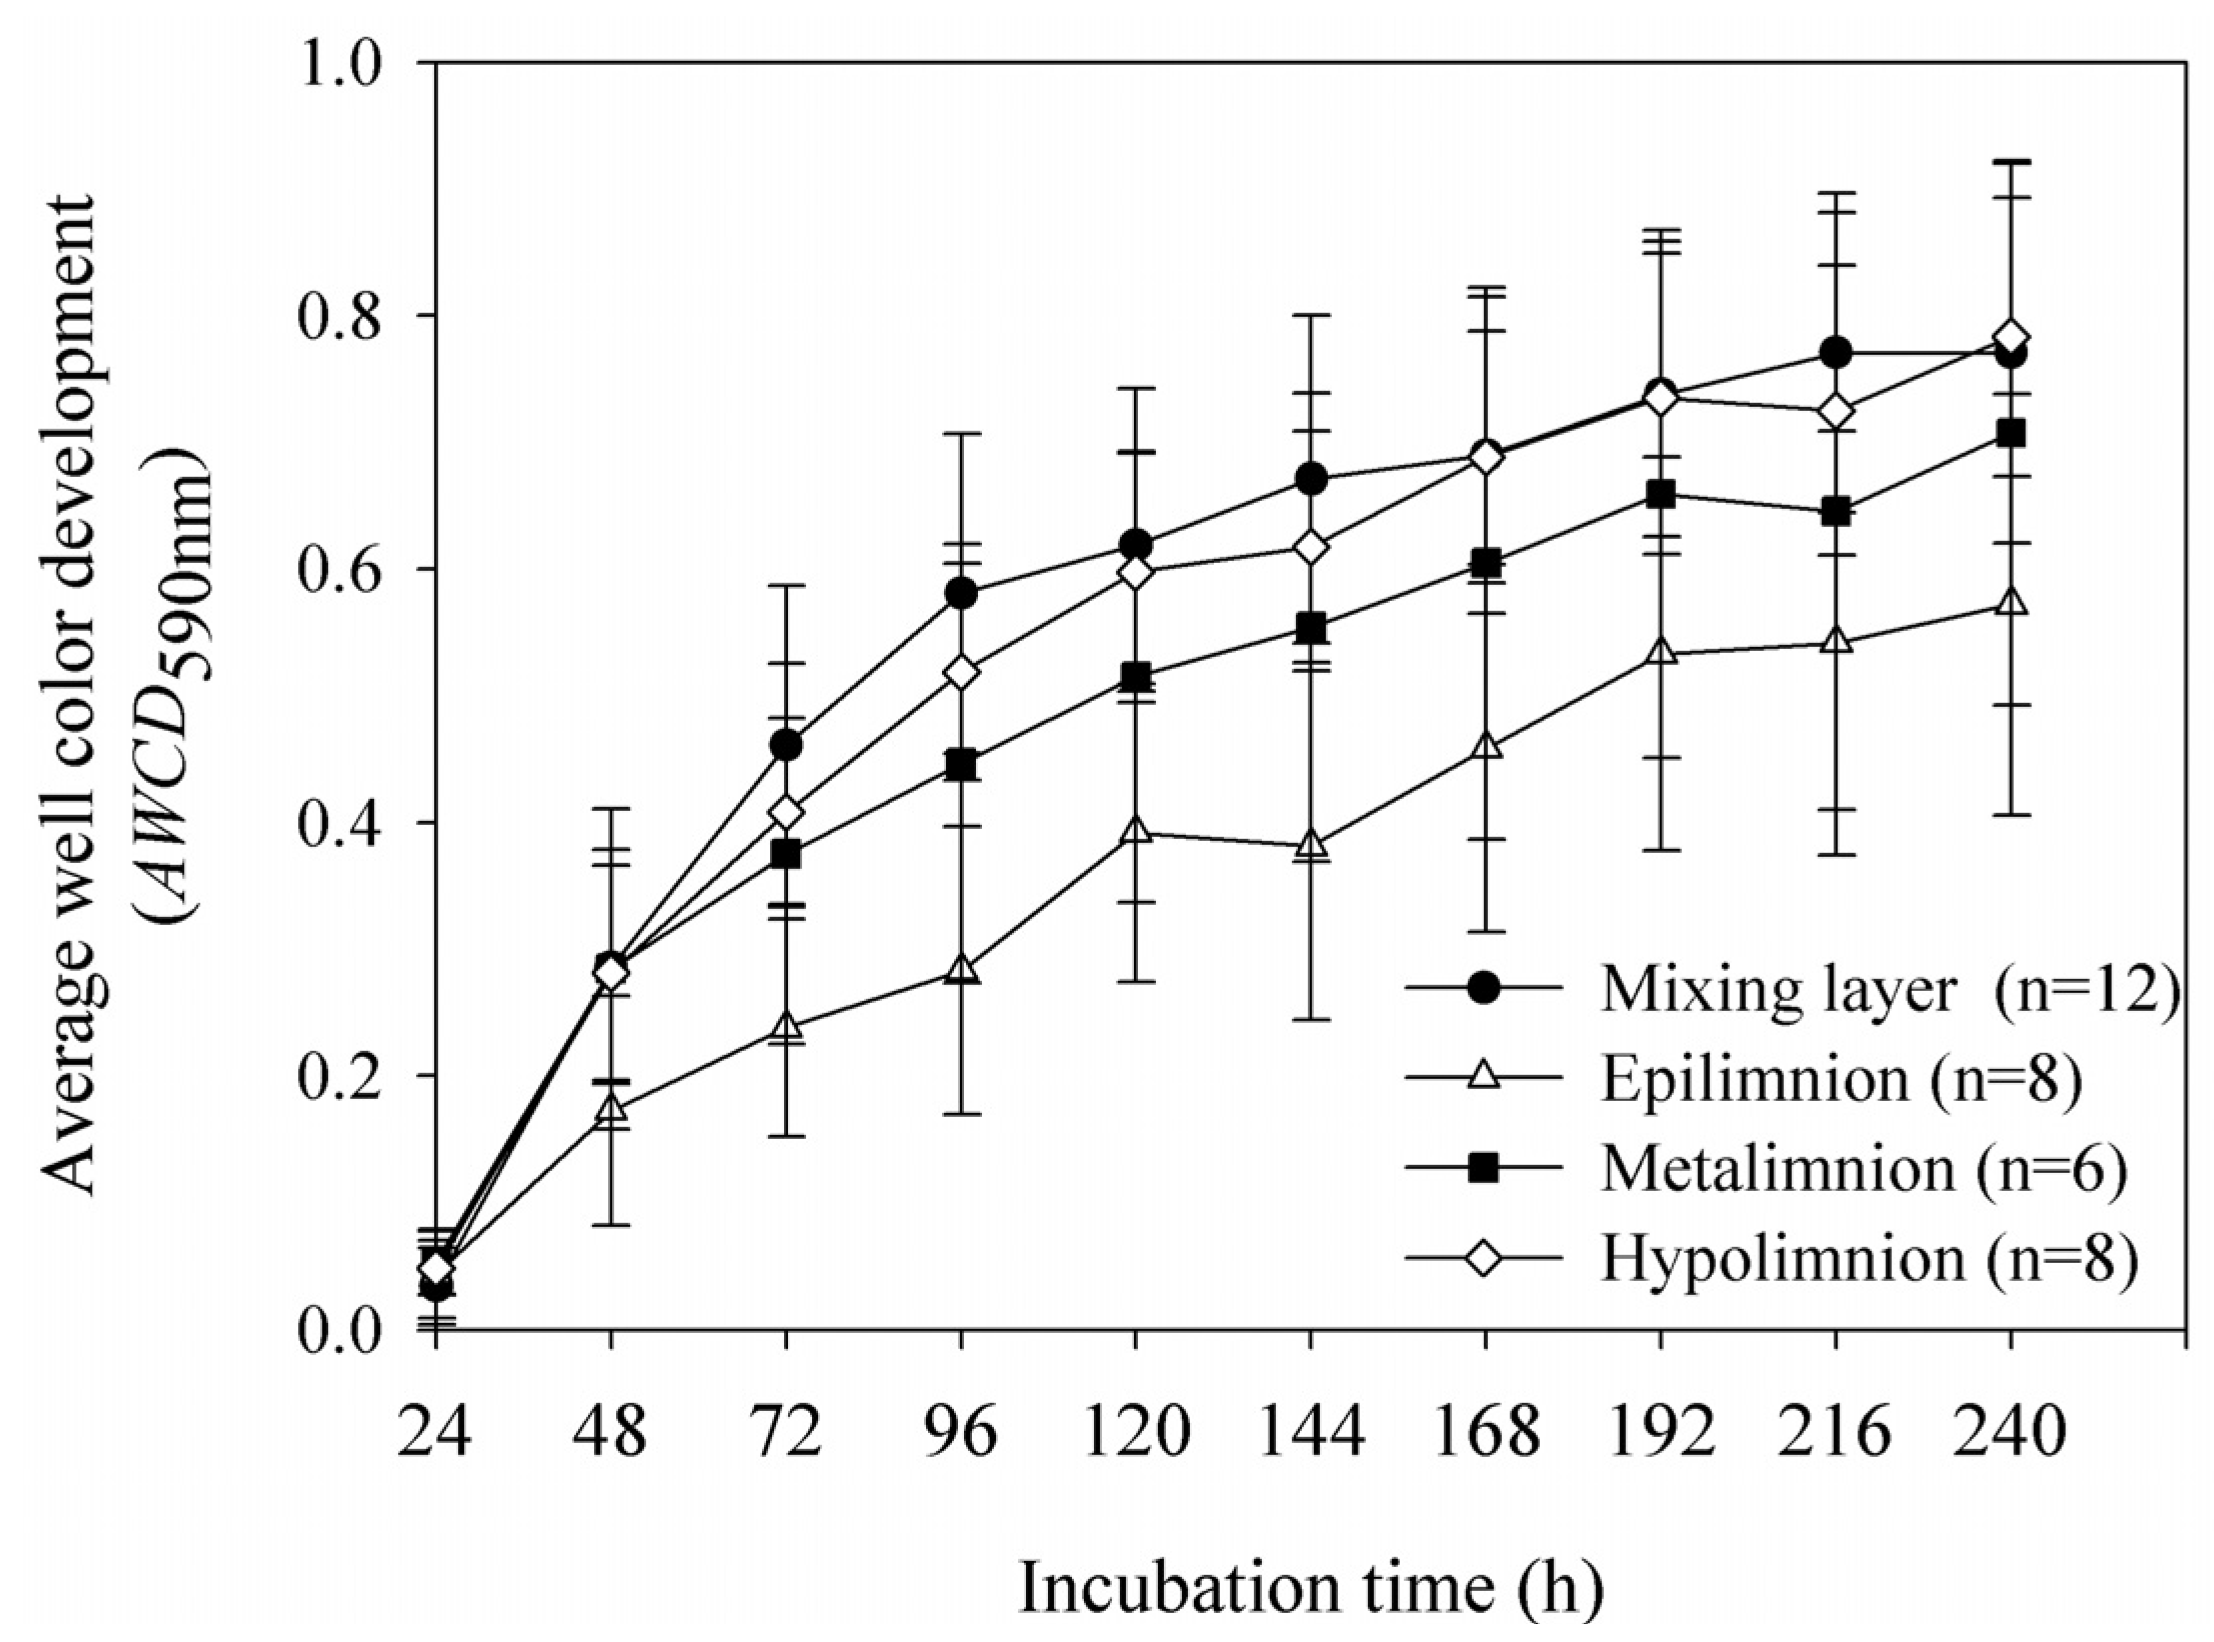
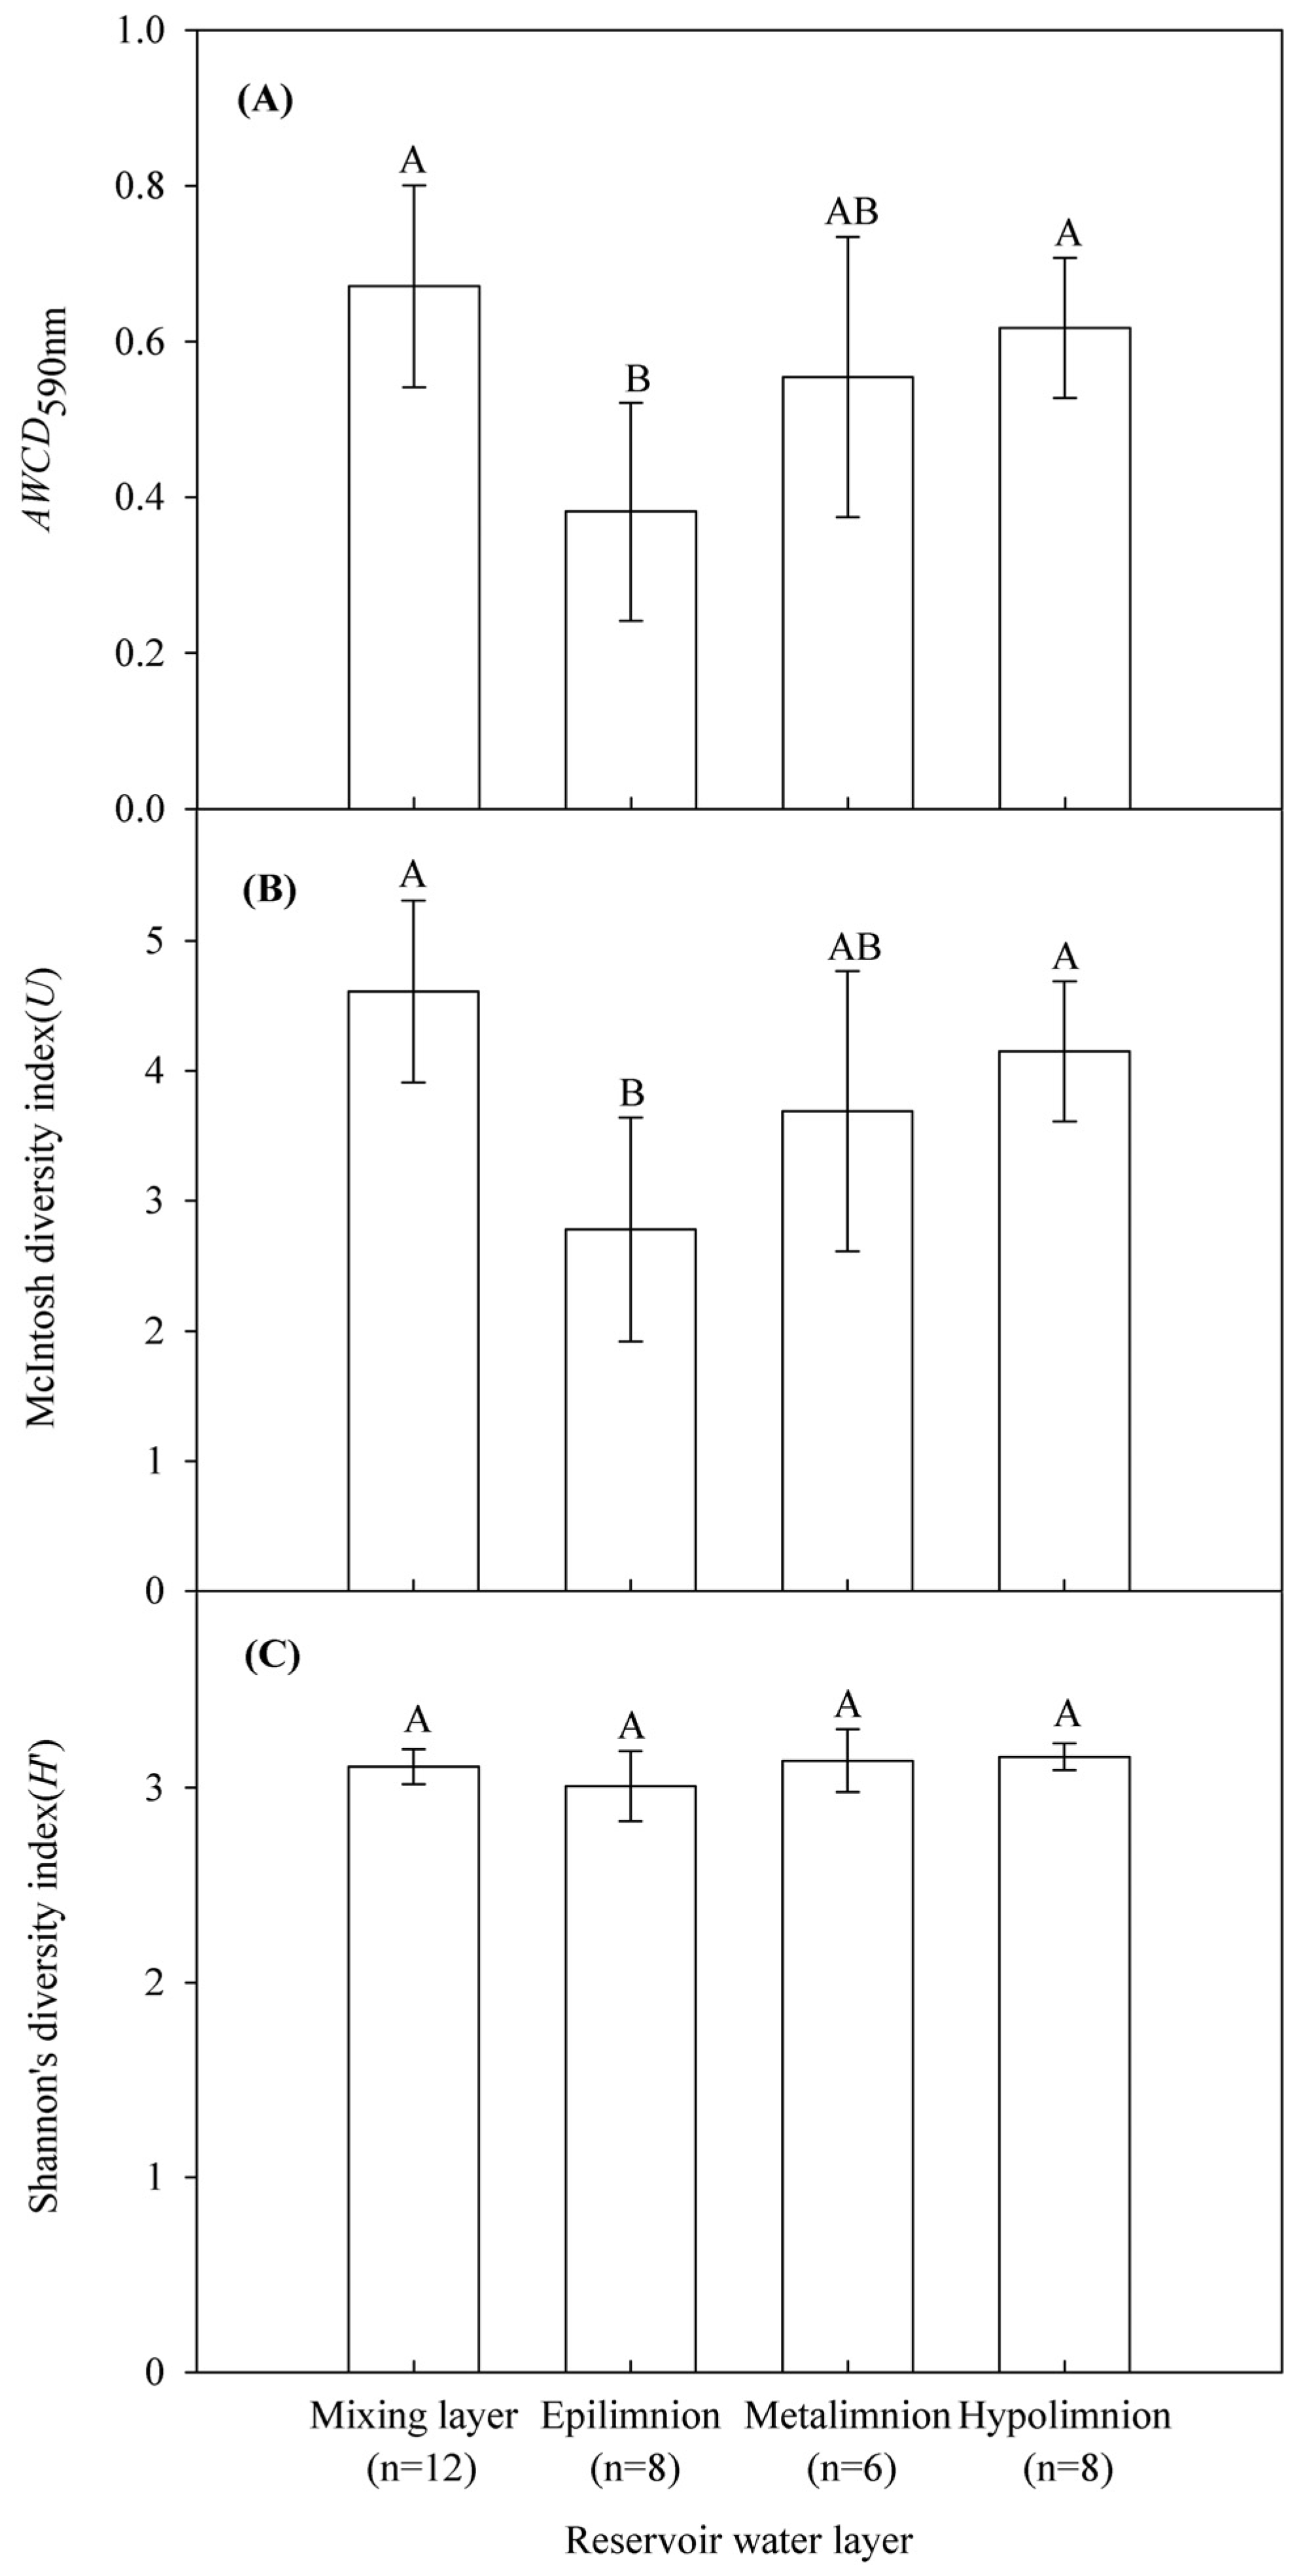
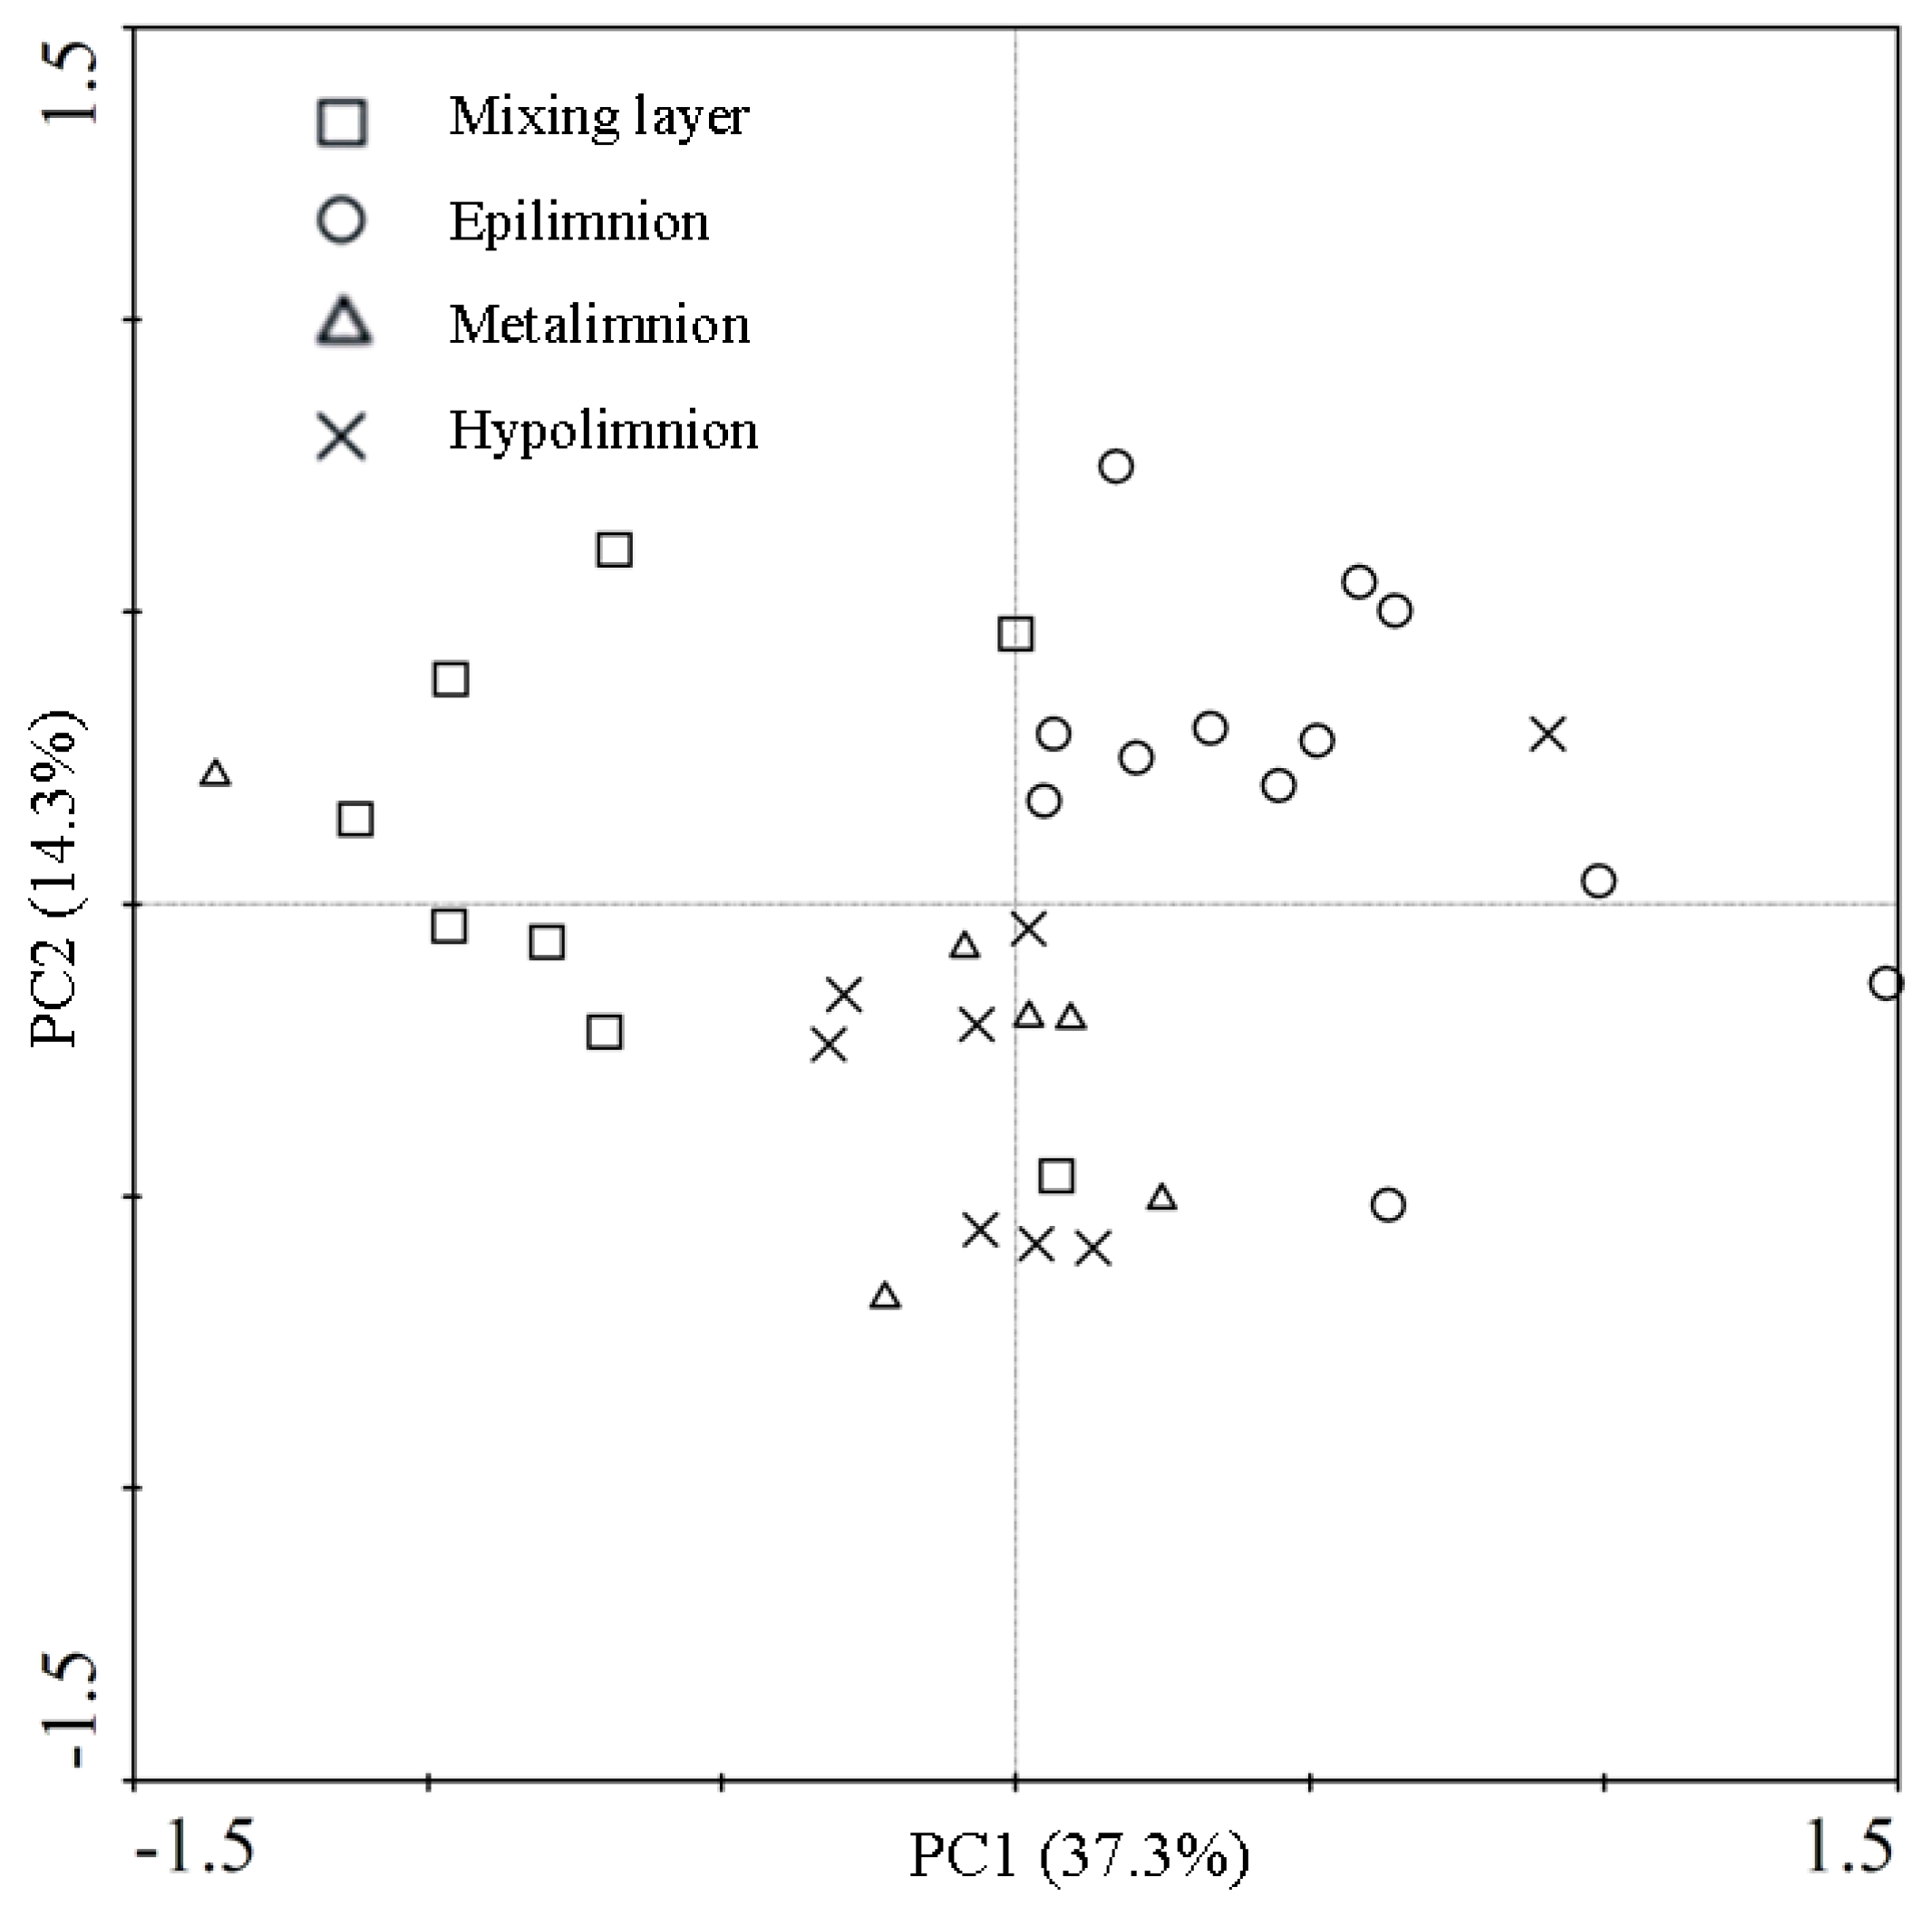
3.2. Microbial Community Functional Diversity

In this study, the Biolog approach was used to improve our understanding of the spatial and temporal shifts in the microbial community composition, based on metabolic diversity. As shown in Figure 2, the AWCD590nm was used as a measure of the total microbial activity, reflecting carbon source utilization ability, and tended to increase steadily with incubation time. The AWCD590nm value, McIntosh diversity index (U), and Shannon diversity index (H′) at 144 h are shown in Figure 3.
Figure 2. Kinetics of average well color development (AWCD590nm) curve of bacterial communities of each water layer in the Jinpen Dirking Water Reservoir, China. The data shown are the means and standard error (S.E.). “n” represents the number of samples in each layer.
Water 07 05525 g002
There were no significant differences with depth during the mixing period (data not shown). However, during the stratified period, the indices showed a clear increasing trend from the epilimnion to the hypolimnion. The lowest AWCD590nm value was observed in the epilimnion (0.38 ± 0.14), which is significantly lower than that of the hypolimnion (0.62 ± 0.09; p < 0.01), and significantly lower than that of the mixing layer (0.67 ± 0.13; p < 0.01) as well. The McIntosh diversity index almost coincided with the AWCD590nm value, and both the index of the hypolimnion (4.15 ± 0.54) and mixing layer (4.61 ± 0.70), were significantly higher than that of the epilimnion (2.78 ± 0.86; p < 0.01). For the Shannon diversity index, there was no significant change among the different water layers, and only a slightly increasing trend was observed with depth. This result suggests that the stratification had a strong effect on the functional diversity of the microbial communities in the Jinpen Reservoir.
Figure 3. Functional diverstity indices of bacterial communities. (A) Average well color development (AWCD590nm); (B) McIntosh diversity (U) and (C) Shannon diversity (H') at 144 h incubation time of bacterial communities of each water layer in the Jinpen Drinking Water Reservoir, China. Analysis of variance (ANOVA) was used. Bars followed by the different capital letter indicate significant difference among the layers (p < 0.05). The data shown are means and standard error (S.E.).
Water 07 05525 g003
Utilization of the six kinds of carbon sources at 144 h was shown, by One-Way ANOVA, to change significantly between different water layers (Table 2). Furthermore, the utilization of amino acids, esters, alcohols and amines showed extremely significant differences among different water layers (P < 0.01). All of the parameters in the epilimnion, which were different from those of the other water layers, reached the lowest level and were significantly lower than those of the hypolimnion (P < 0.05). This indicated that the microbial communities in the epilimnion had the lowest carbon source utilization ability. Interestingly, the utilizations was kept stable or appeared to show a decreasing trend from the mixing layer to the hypolimnion, except for that of carbohydrates. Specifically, a value of 0.81 ± 0.19 was observed in the hypolimnion, which was higher than the value of 0.69 ± 0.21observed in the mixing layer (Table 2).
Table 2. Variance analysis of utilization of the six groups of carbon sources in Biolog ECO plate by bacterial communities of each water layer in the Jinpen Drinking Water Reservoir, China.
Water LayerCarbohydratesAmino AcidsEstersAlcoholsAminesCarboxylic Acids
Mixing Layer (n = 12)0.69 ± 0.21 AB0.67 ± 0.11 A0.94 ± 0.16 A0.66 ± 0.10 A0.70 ± 0.21 A0.49 ± 0.15 A
Epilimnion (n = 8)0.46 ± 0.18 A0.31 ± 0.15 B0.56 ± 0.26 B0.29 ± 0.12 B0.43 ± 0.17 B0.28 ± 0.16 B
Metalimnion (n = 6)0.61 ± 0.27 AB0.54 ± 0.21 A0.84 ± 0.26 A0.50 ± 0.19 AC0.38 ± 0.19 B0.43 ± 0.17 AB
Hypolimnion (n = 8)0.81 ± 0.19 B0.55 ± 0.13 A0.95 ± 0.12 A0.47 ± 0.12 C0.59 ± 0.14 AB0.41 ± 0.11 AB
One Way ANOVA3.865 *9.899 **6.873 **13.097 **5.480 **3.017 *
Notes: Analysis of variance (ANOVA) was used. Different capital letters indicate significant differences among the sites (p < 0.05). * By analysis of variance: p < 0.05. ** By analysis of variance: p < 0.01. Data represent mean ± S.E.
PCA further revealed the temporal and spatial shifts in the functional diversity of the microbial community before and after water stratification. The first two PCs (PC1 and PC2) accounted for 51.6% of the total variance in the AWCD590nm data (Figure 4). The profiles of the samples from the mixing layer were similar and were clustered together; however, during the stratified period, the metabolic profiles were visibly distinguished from the mixing layer, and showed a higher degree of variability with more scattered data points. Moreover, PCA ordination showed that the samples from the epilimnion were significantly distinguished with that of the hypolimnion with different location area. Interestingly, although the metalimnion was shown to have lower functional diversity indices, the metabolic profiles showed a very similar separation between the metalimnion and the hypolimnion. In addition, the separation of the mixing layer horizons was mainly affected by N-acetyl-d-glucosamine, d-galactonic acid, and d-galacturonic acid, while the separation of the microbial communities of the hypolimnion correlated most with glycogen, α-cyclodextrin and α-ketobutyric Acid (data not shown).
Figure 4. Principle component analyses (PCA) of the functional diversity of bacterial communities of each sample in the Jinpen Drinking Water Reservoir, China. Data were calculated based on sole carbon substrate utilization pattern using Biolog method at 144 h incubation time. Numbers in brackets represent the percentage of variation explained by each factor, PC1 explains 37.3% of the variance of the data and PC2 explains 14.3% of the variance in the data, respectively.
Water 07 05525 g004

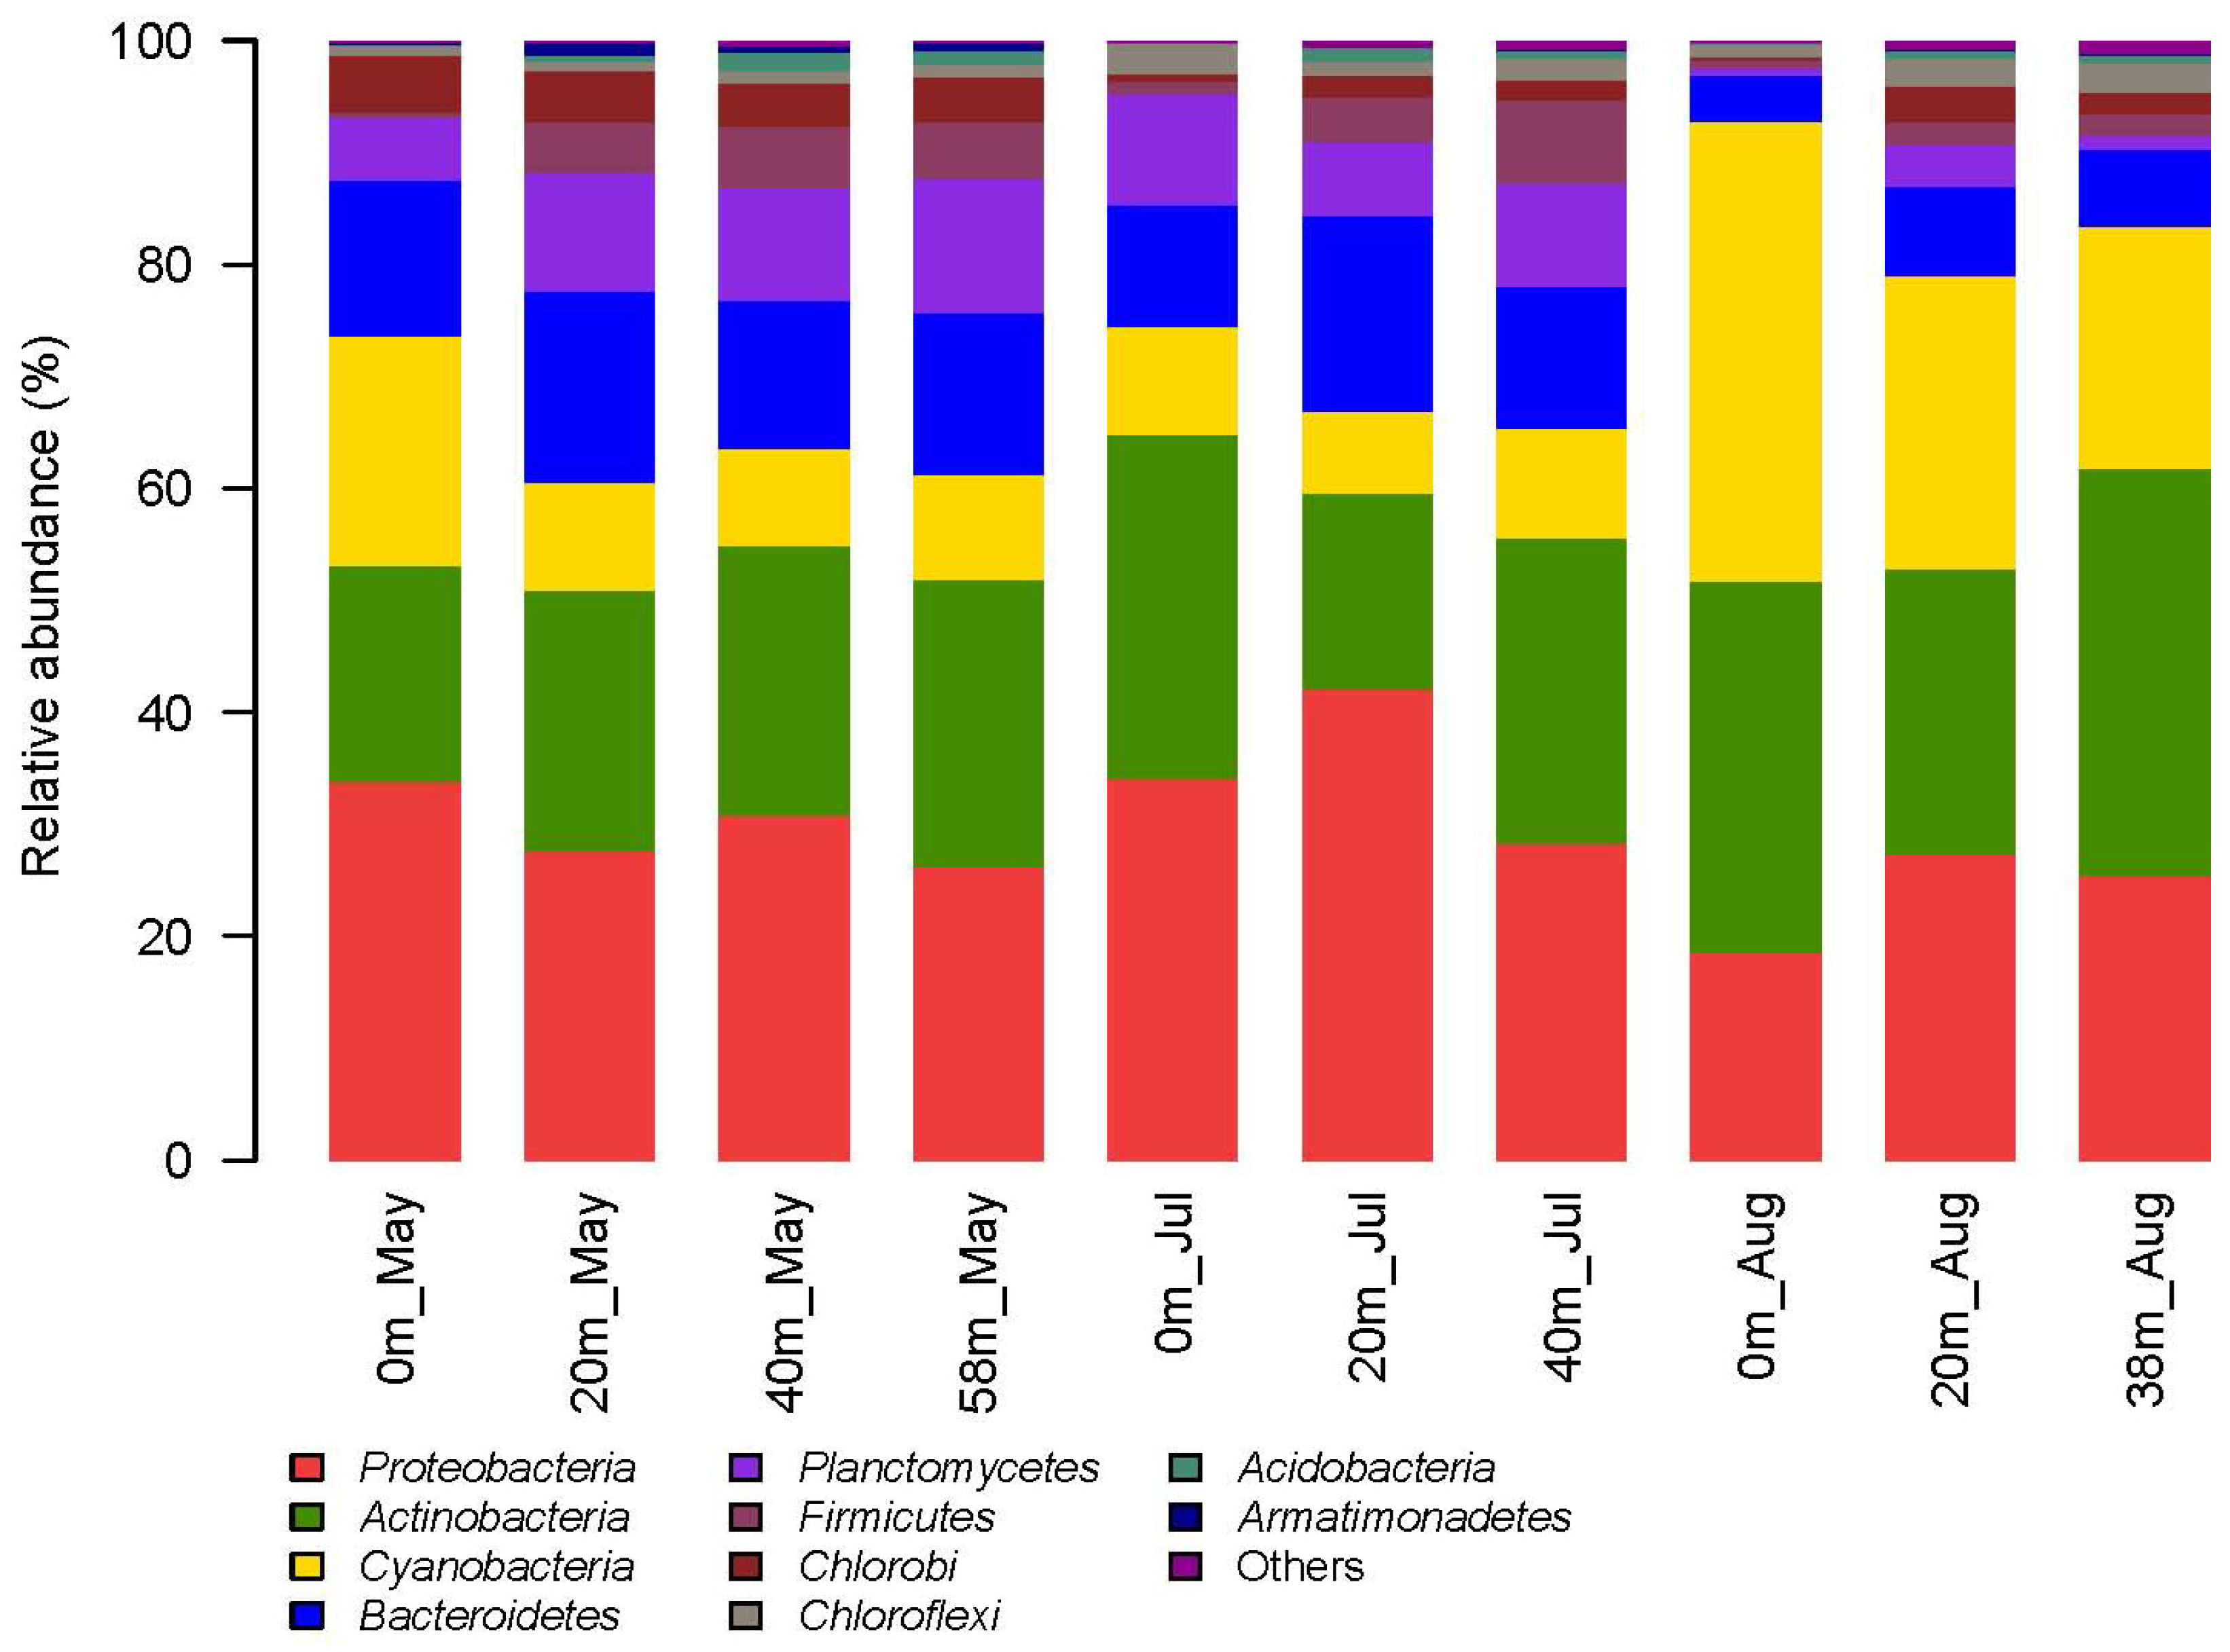
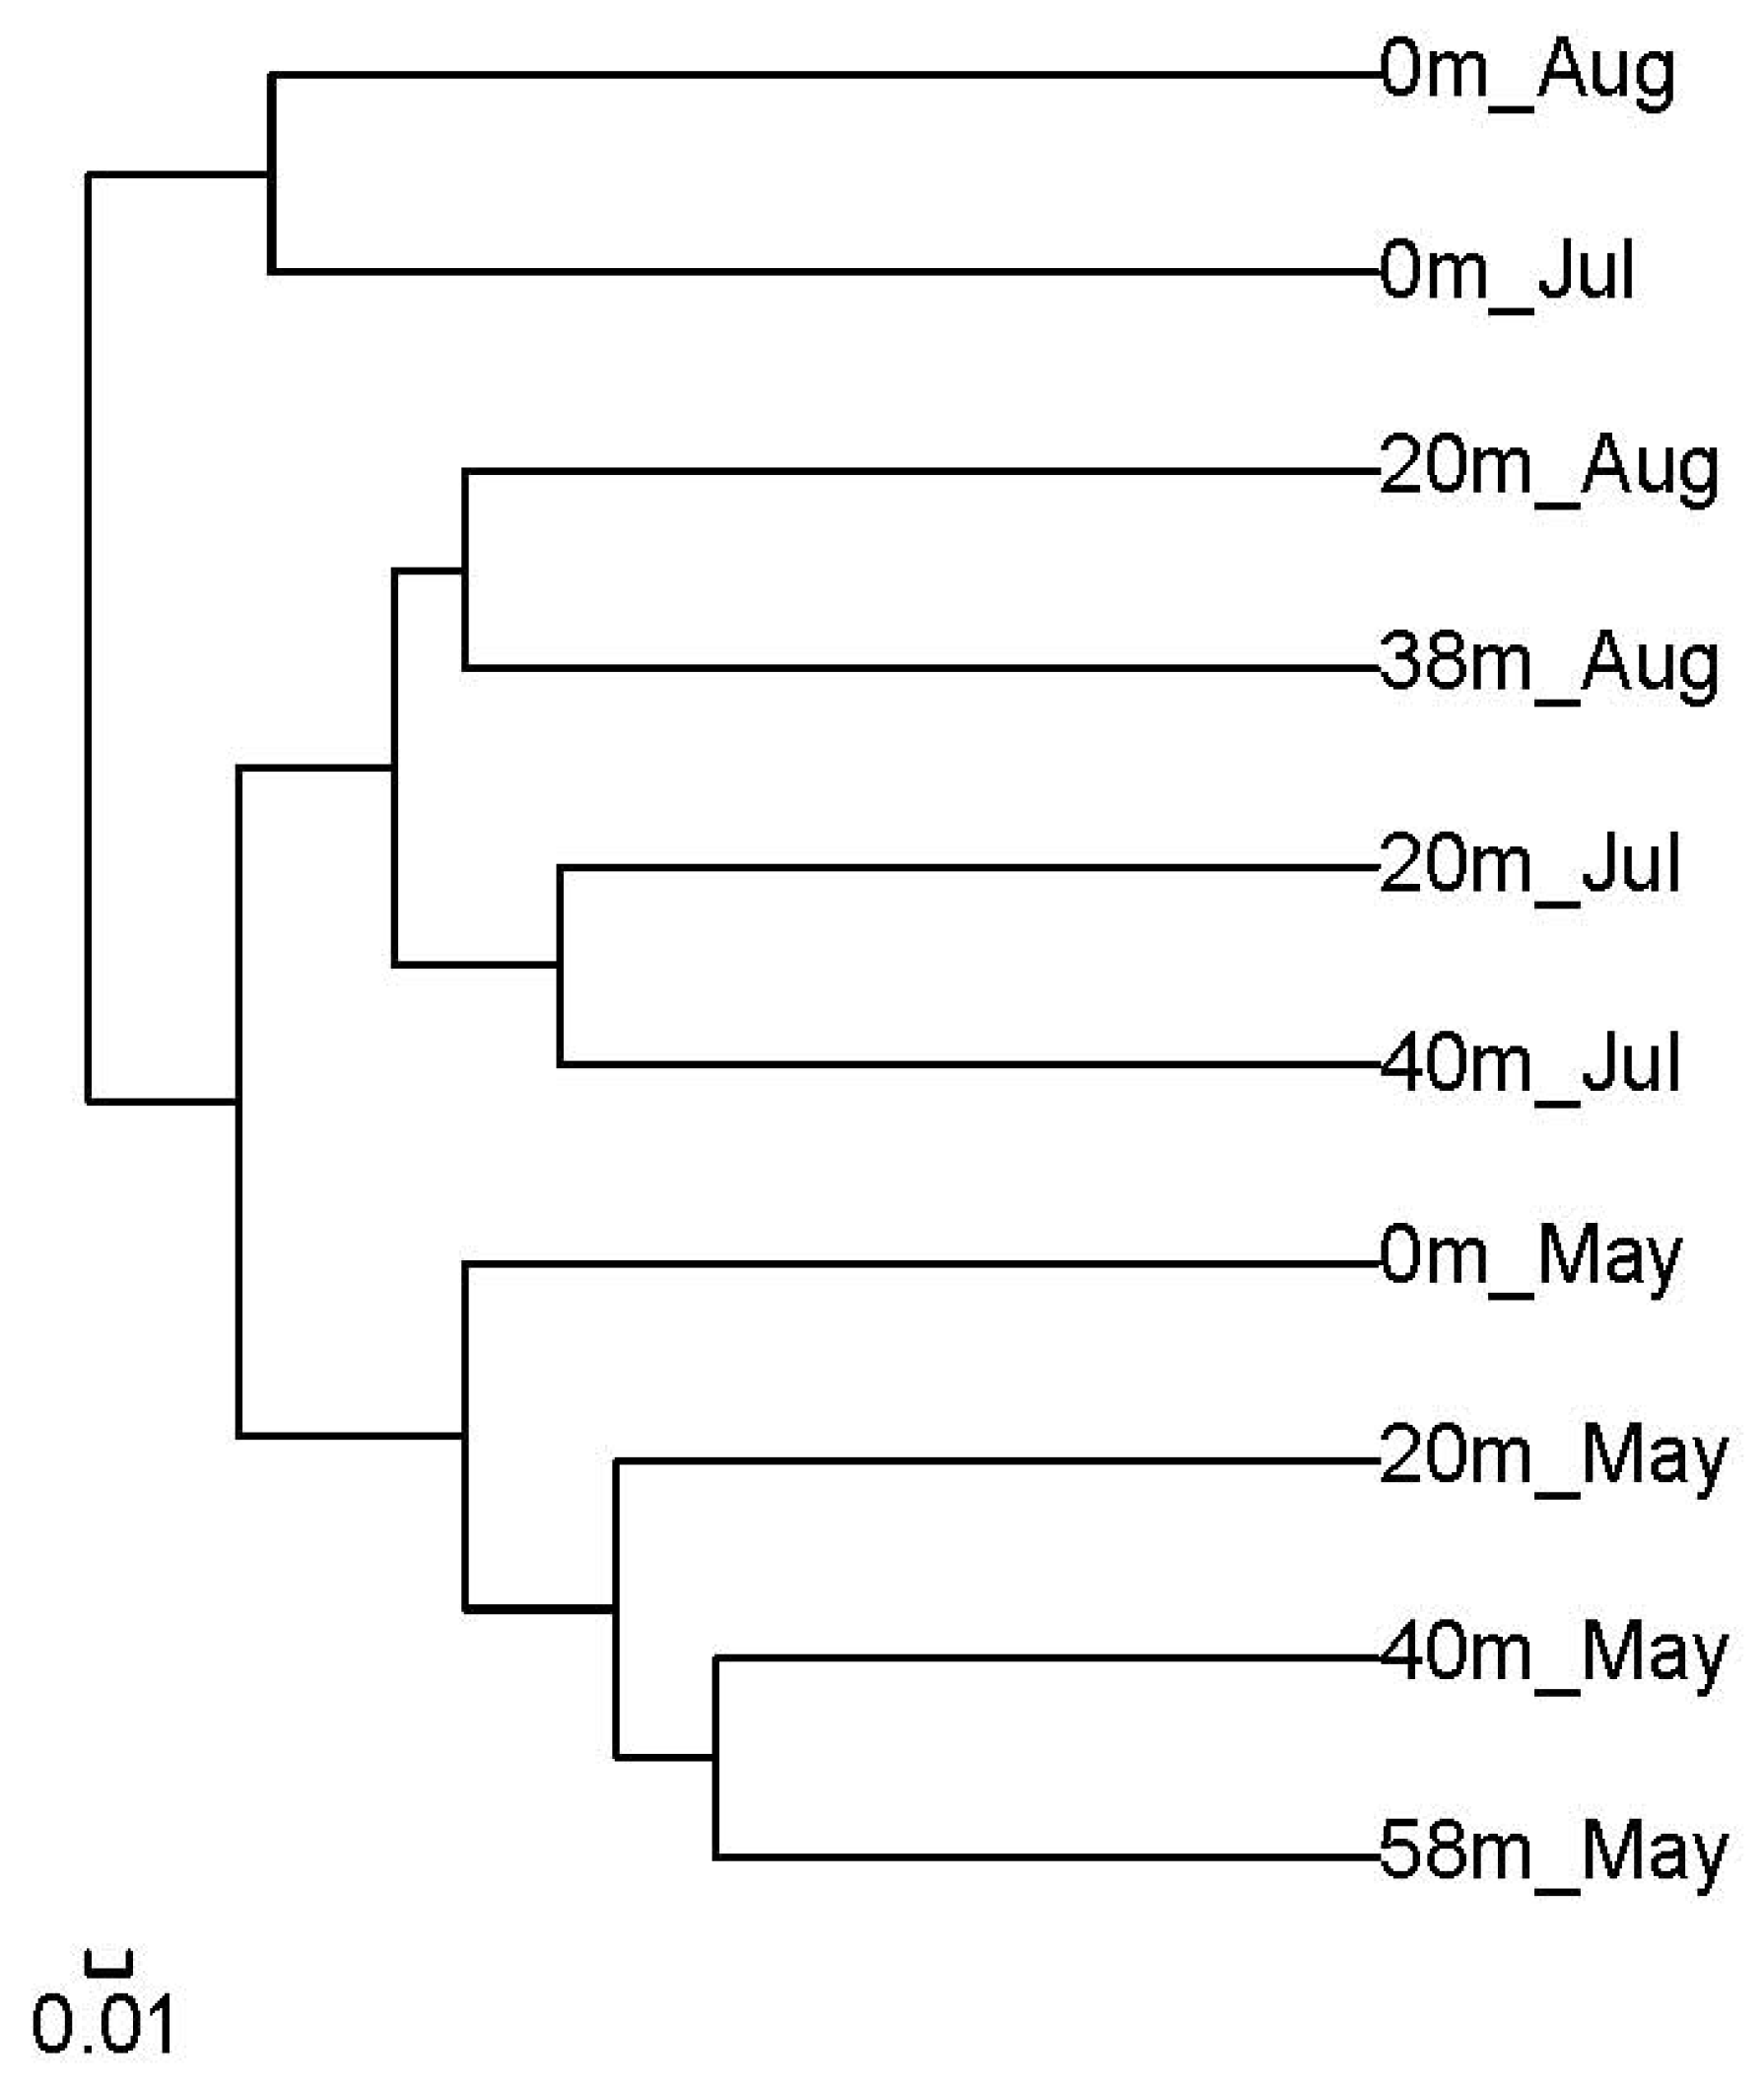
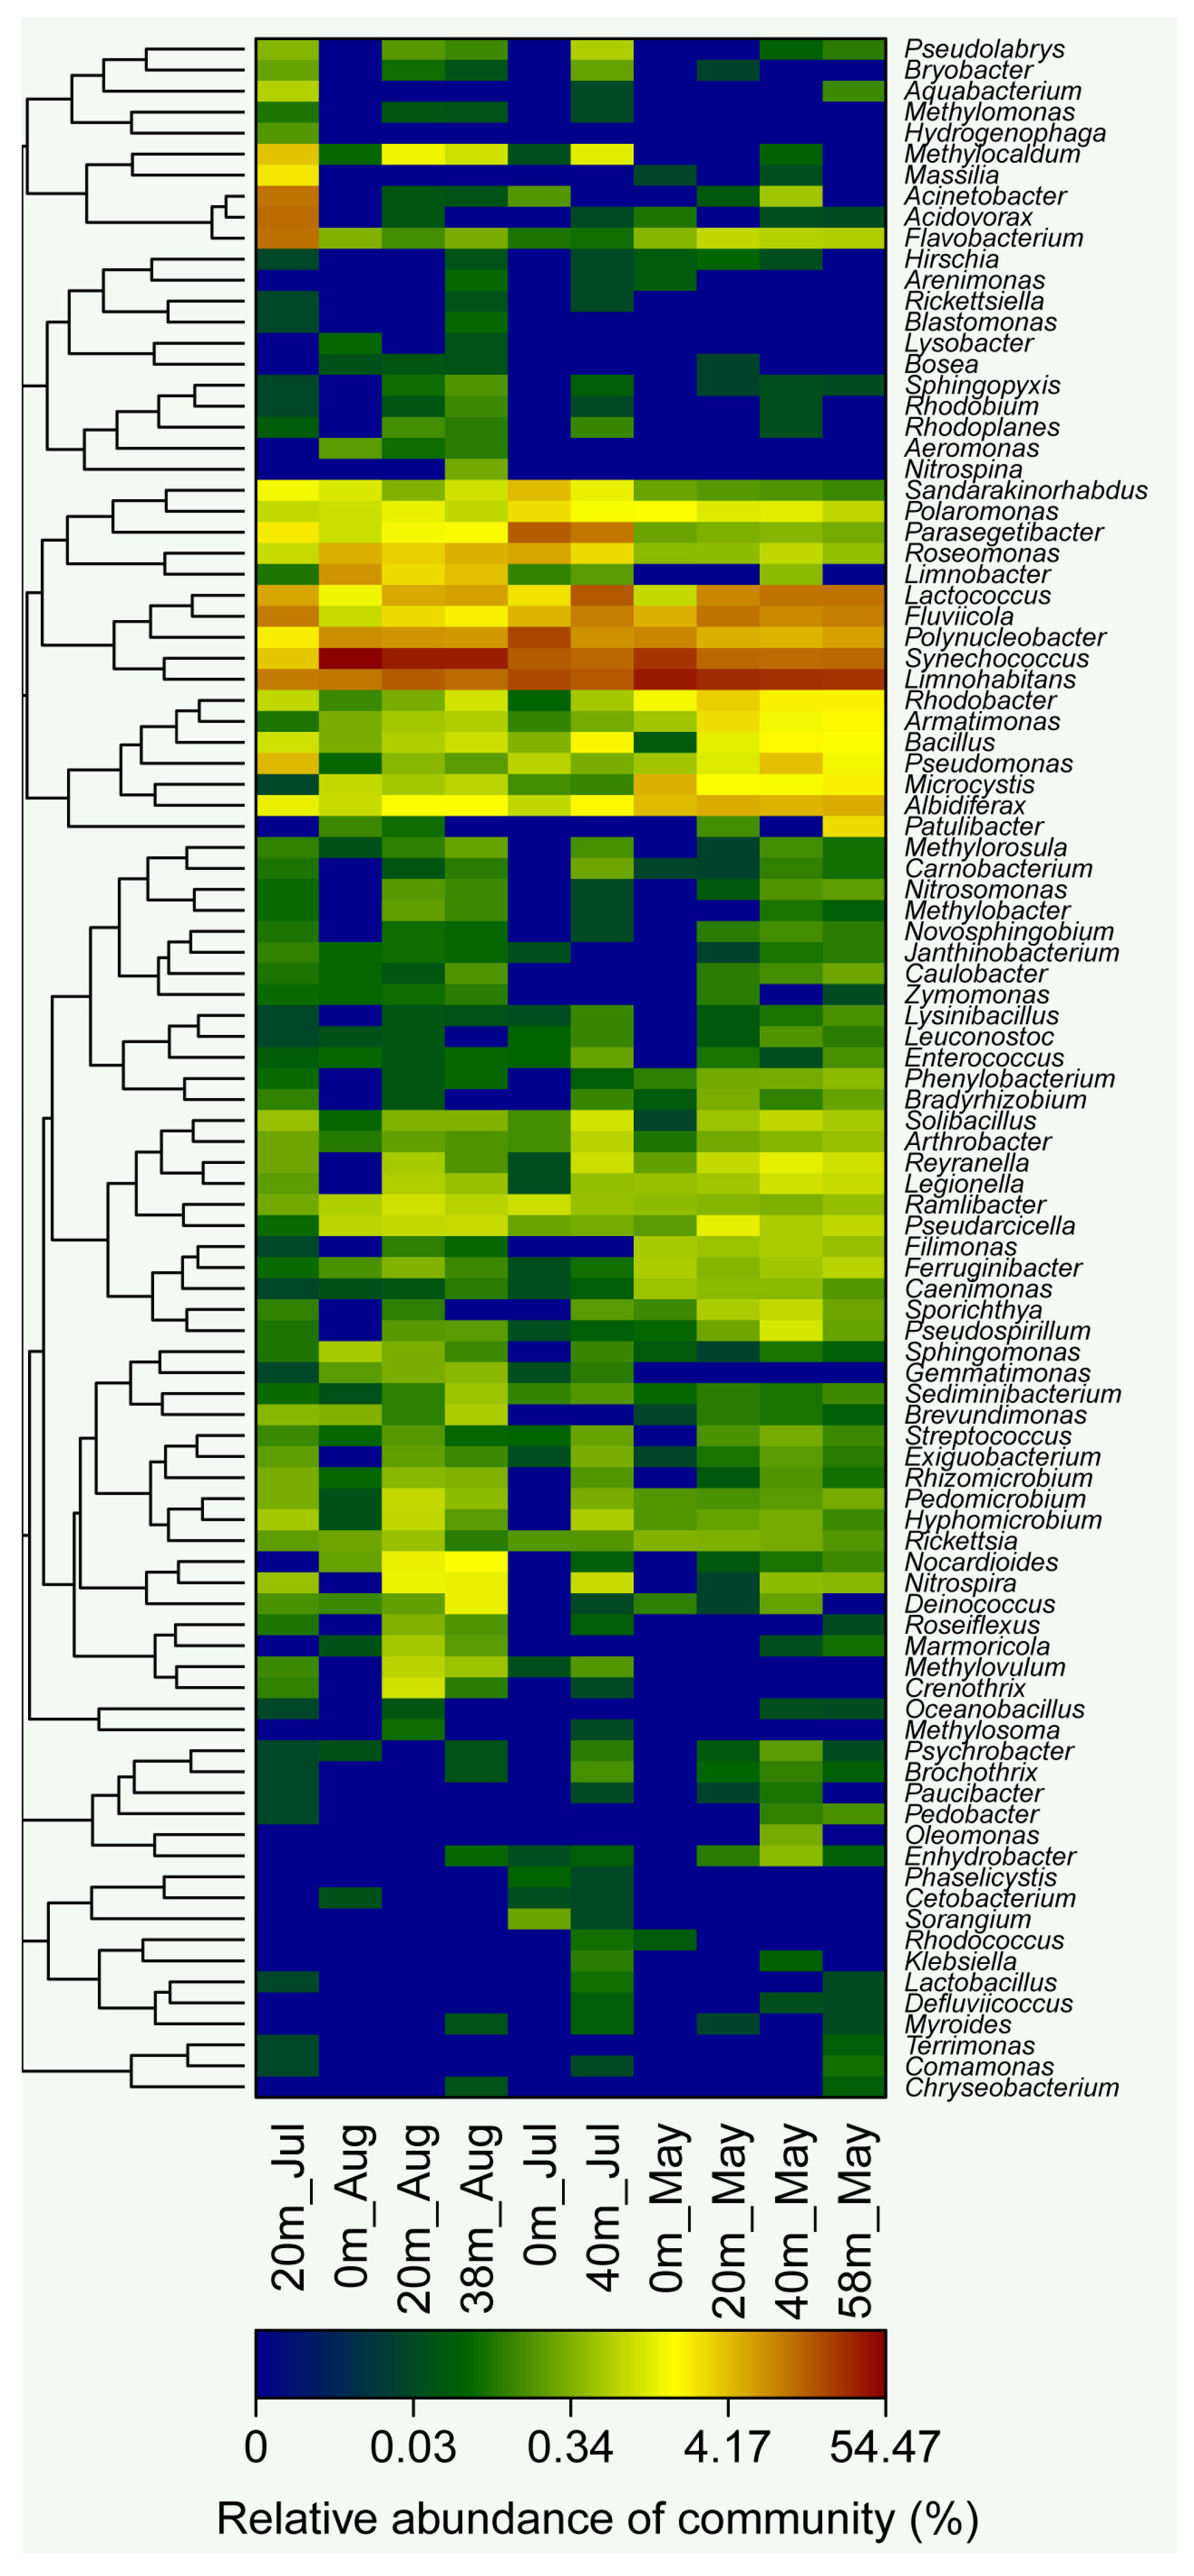
3.3. Pyrosequencing Results of Bacterial Community Composition

The analysis results of the Biolog method indicated that the difference in microbial functional diversity between different sampling sites was not significant. Thus, ten representative samples taken at site C were selected to represent the microbial community structure of the reservoir for pyrosequencing analysis. Generally, 97,637 high quality reads were detected after the removal of low quality reads. A total of 989 OTUs belonging to ten phyla were identified at a 97% similarity level (Figure 5), and the number of OTUs of each sample ranged from 209 to 370. Species estimators showed that the bacterial diversity and abundance differed significantly between different water layers (Table 3). Specifically, the numbers of OTUs showed a clear increasing trend with depth, after stratification, with the lowest OTUs being observed at the epilimnion, and the highest OTUs being detected at the hypolimnion, with significant difference (p < 0.01). However, the OTUs observed during the mixing period were slightly lower than those of the metalimnion and the hypolimnion, without significant differences. Both the ACE and Chao 1 richness estimates were higher than the OTU data, suggesting that additional species may exist [44], especially in the metalimnion and the hypolimnion. The Shannon-Wiener diversity index showed a significant increase from the epilimnion (3.32 ± 0.24) to the hypolimnion (4.13 ± 0.18; p < 0.05), while there was no significant difference between the mixing layer, the metalimnion, and the hypolimnion. All species estimators suggested that the epilimnion might harbor a smaller number and a lower diversity of bacterial communities during the stratification period. This is consistent with our results from the Biolog method, which indicated that the stratification had a great impact on microbial communities, and that the hypolimnion had a higher diversity of bacterial communities than that of the epilimnion.
Figure 5. Taxonomic classification of sequences of the bacterial communities in Site C from the Jinpen Drinking Water Reservoir, China. Sequences were classified at the phylum level using the Ribosomal Database Project (RDP).
Water 07 05525 g005
Table 3. Similarity-based operational taxonomic units (OTUs) and species estimates of pyrosequencing result of each water layer in the Jinpen Drinking Water Reservoir, China.
Water LayerOperational Taxonomic Units (OTUs)Chao 1 Richness EstimateAbundance-Based Coverage Estimators (ACE)Shannon-Wiener Index (H')Coverage
Mixing Layer (n = 4)302 ± 39 A375.5 ± 47.6 A369.8 ± 35.2 A4.11 ± 0.26 A0.99
Epilimnion (n = 2)218 ± 13 B339.5 ± 6.4 A384.0 ± 56.6 A3.32 ± 0.24 B0.99
Metalimnion (n = 2)356 ± 8 A497.5 ± 27.6 B477.5 ± 31.8 A4.25 ± 0.13 A0.99
Hypolimnion (n = 2)364 ± 8 A483.0 ± 14.1 B469.0 ± 2.8 A4.13 ± 0.18 A0.99
Notes: The parameters are presented for a similarity of 97%. Analysis of variance (ANOVA) was used. Different capital letters indicate significant differences among the sites (P < 0.05). Data represent mean ± SE.
A taxonomy-independent Bray-Curtis similarity tree was constructed to determine the relationship between different samples based on their OTU compositions (Figure 6). The dendrogram revealed that all samples were clustered into three major groups, which reflected the sharp vertical stratification of the reservoir. The first group was composed of the mixing layers, the second group was composed of samples from the epilimnion, and the third group consisted of samples from the metalimnion and the hypolimnion together. In addition, a distinct difference in the bacterial communities of samples taken from different water layers was evident at the phylum level (Figure 5). Proteobacteria represented the dominant phylum in all depths during the mixing period in May (more than 26.3%). However, Cyanobacteria became the dominant phylum at the oxygenated surface in August (40.9%), while Actinobacteria dominated the hypolimnion sample in August (36.3%). Moreover, Actinobacteria were more prevalent in the stratification layers than in the mixing layers. In contrast, the proportion of Bacteroidetes, Planctomycetes and Armatimonadetes showed a decreasing trend from the mixing period to the stratified period. All samples showed a stable increasing proportion of Firmicutes with depth, without any significant effect of stratification. Although Chlorobi were common at all depths of the mixing period, they became rare or absent from the surface layer after stratification. Interestingly, with regard to temporal changes, there were relatively gradual changes in BCC between May and July, while more dramatic and rapid changes were detected in August.
Figure 6. Clustering analysis of pyrosequencing profiles based on the Bray-Curtis similarity from the operational taxonomic units (OTUs) compositions (97% level).
Water 07 05525 g006
The heatmap was constructed based on the top 100 abundant bacterial communities at the genus level (Figure 7), and showed a more diverse and differing bacterial communities between different water layers. During the mixing period, Limnohabitans, Synechococcus, Fluviicola and Lactococcus were the dominant genera, whereas Synechococcus became the most abundant genus after stratification. In the epilimnion, the levels of Polynucleobacter, Parasegetibacter, Limnobacter, and Roseomonas were significantly higher than those in the hypolimnion. However, a higher number of diverse genera were detected in the deeper layers, including Bacillus, Fluviicola, Lactococcus, Nitrospina, Nitrospira, and so on. Interestingly, Acidovorax, Acinetobacter, and Flavobacterium bloomed in the metalimnion in July, but were rare or were not detected in other samples.
Figure 7. A color-scale heatmap showing 100 representative predominant 16S rRNA gene-based sequence classified at the genus level from the bacterial communities of the Jinpen Drinking Water Reservoir, China.
Water 07 05525 g007
RDA was performed to assess the relationship between the BCC of the reservoir and the environmental variations (Figure 8).The first two axes (RDA1 and RDA2) could explain 82.1% of the total variation. Samples from the mixing layer were clustered together, with a very similar separation in the left area of RDA1, and were dispersed from the samples of the other layers. All environment parameters, except for TP, were significantly correlated with the BCC, while the pH and DO were shown to play the most significant roles. Specifically, DO, TN, CODMn and turbidity were shown to be significant in describing the variation in BCC along RDA2, while pH, temperature, NH4-N, and SpCond accounted for a large amount of the variation in the distribution along RDA1.
Figure 8. Redundancy analysis (RDA) between the bacterial community composition (BCC) and environmental parameters in the Jinpen Drinking Water Reservoir, China. Samples are represented by open circles. Numbers in brackets represent the percentage of variation of the data explained by each factor, RDA1 explains 67.3% of the total variation and RDA2 explains 14.8% of the total variation, respectively. The primary factors for the variables of the environmental data are represented by arrows (DO = dissolved oxygen; SpCond = specific conductivity; TN = total nitrogen; TP = total phosphorus; NH4-N = ammonia nitrogen; CODMn = permanganate index).
Water 07 05525 g008

4. Discussion

The annual stratified period of the Jinpen Reservoir began from June 2014, and caused changes in the physical and chemical environment of the reservoir, which provided a chance to examine shifts in bacterial community. The samples from 29 May suggested that the Jinpen Reservoir was mixed during that time, which was supported by similar physical and chemical parameters of the water. Additionally, there were no significant differences in the functional diversity between the upper and lower waters. After the reservoir became thermally stratified, the results of the Biolog method showed that there was a strong vertical variation in the functional diversity of the microbial community. The vertical gradients of physicochemical conditions within the water column during stratification, particularly those of DO and temperature, represented typical habitat heterogeneity. Habitat heterogeneity was considered to play an important role in the determination of microbial community structure [20,25,45]. It is suggested that thermal conditions were the main factor affecting community metabolism and structure by altering hydrodynamic processes, water movement, and mixing events in the water bodies during the annual stratified period [46]. Thus, in this study, it appeared that the dramatic shifts in DO and water temperature among different layers were the main direction indices for the differences in the bacterial communities. Our RDA results of pyrosequencing provided further evidence of the habitat heterogeneity theory, as microorganisms would shift in response and adaptation to the variation in aquatic environment, thus the BCC of the Jinpen Reservoir was significantly correlated with the physicochemical variables of the environment, including pH, DO, temperature, turbidity, SpCond, NH4-N, TN and CODMn, especially the pH value and the oxygen concentration. However, few studies conducted on reservoirs have been reported to reveal the relationship between the BCC and environment parameters. Our RDA results suggest that the physical parameters and nutrients can help us to understand BCC trends, thus, further studies may be needed to isolate environmental variables and to reveal the importance of each of these variables.
The bacterial communities in the hypolimnion had significantly higher indices in functional diversity than those in the epilimnion. It is suggested that the microbial populations in the hypolimnion could be enhanced by various factors, such as extracellular enzymes of anaerobic metabolism [47,48], the biomass and organic matters exported from the upper waters, the complex interaction with the massive microorganisms in the sediment [10], and the release of nutrients from the sediment [9,49]. Although we did not measure changes in organic matter directly in the water bodies, we cannot exclude the possibility that the contaminants in the deeper layer can be metabolized in various ways due to the differences detected in the utilization of 31 different kinds of carbon sources by using the Biolog method. Specifically, we found that there is a greatly increased utilization of carbohydrates in the hypolimnion after stratification. This is likely evidence of a change in the composition of available carbon sources in the deeper waters, as microorganisms could select special suitable growth zones. On the other hand, the data of the pyrosequencing showed that samples of the epilimnion had the highest proportion of Cyanobacteria, whereas the FCM result showed that there is no significant difference of total bacteria cell counts among layers. However, the Biolog method based on the utilization of carbon sources, may not reflect the metabolic activity of autotrophic microorganisms, which result in a weaker carbon utilization detected in the epilimnion.
The result of pyrosequencing showed that the BCC of the reservoir were strongly affected by stratification as well as the functional diversity. As determined by the pyrosequencing data, the Bray-Curtis similarity tree indicated that the BCC of the epilimnion was distinguished from that of hypolimnion, which was consistent with the PCA results of Biolog. The diversity indices of the pyrosequencing also showed many similarities with the indices of functional diversity. Both the bacterial community diversity and richness were significantly higher in the hypolimnion than that of the epilimnion; meanwhile, the indices of the epilimnion were relatively variable. There seems to have been no previous study to associate the functional diversity patterns in the bacterial communities with BCC of drinking water reservoirs. The result of this study indicated that the variations in bacterial community functional diversity reflect the variations in BCC and showed useful ecological information. Specifically, the hypolimnion harbored a relatively higher diversity and richness of communities and a lower proportion of autotrophic microorganisms, which might lead to a higher and more diverse ability in utilizing carbon sources.
As expected, the BCC of the Jinpen Reservoir resembled the composition of some reported freshwater ecosystems, with Proteobacteria, Actinobacteria, Cyanobacteria, and Bacteroidetes as the major bacterial groups [5,18,50]. However, the percentage of each bacterial group was distinct at the level of phylum after stratification. Proteobacteria was the most abundant bacterial division during the mixing period, particularly Beta-proteobacteria and Alpha-proteobacteria. The predominance of these two divisions in lakes and reservoirs has already been demonstrated in many studies [51,52]. Actinobacteria showed an increasing trend after the water bodies became thermally stratified. Cyanobacteria bloomed at the surface water in August, and had an obvious vertical gradient in the water, as reported in other aquatic ecosystems [53]. Moreover, it is suggested that the blooms of Cyanobacteria are favored by the lack of mixing in the water body by Valdespino-Castillo et al. [46]. Additionally, both Chlorobi and Chloroflexi were detected, with a higher abundance in the hypolimnion than in the epilimnion, and were dynamically affected by stratification. In contrast, Firmicutes were less affected by stratification, with a stable and high proportion in the deeper layers. At a higher taxonomic resolution, the recognized bacterial species may provide more information on the dynamic of bacterial community. At the genus level, Limnohabitans was one the most abundant groups detected in the water. Limnohabitans belongs to Beta-Proteobacteria, and has been reported to play a prominent role in freshwater bacterioplankton communities [54]. Interestingly, the ability of Limnohabitans to grow on algal-derived substrates and their high rates of substrate uptake may provide them with a special competitive advantage in the water. Polynucleobacter is in the order of Beta-Proteobacteria as well, and was found abundantly in the epilimnion. This was consistent with the results of the study conducted by Hahn et al. [55], which revealed that Polynucleobacter are normally observed in the upper layer of freshwater with a usage of dissolved organic matter. In contrast, Fluviicola, Bacillus, and Nitrospira were found more abundantly in the deeper water; likewise, they were also detected abundantly in the sediment of the Jinpen Reservoir [43]. There was a dramatic increase in the populations of Acidovorax, Acinetobacter and Flavobacterium species in July; despite the fact that they were reported in other aquatic ecosystems, it is difficult to explain the reasons for their blooms.
The Biolog microplates contain a tetrazolium violet redox dye as an indicator of carbon source utilization, and the substrates present on the EcoPlates™ used in this study are known to be utilized by anaerobic bacteria, which allow for characterizing carbon substrate utilization by both aerobic and anaerobic bacterial communities [56]. Additionally, many previous studies within various microbial habitats including freshwater, soil, active sludge and sediment, indicated that the direct incubation of environmental samples in Biolog plates enables the identification of ecologically relevant functional differences in different microbial communities [43,57,58,59,60]. Moreover, the Biolog method has been applied as a more reliable reproducibility method [61,62,63]. In this study, the parallel samples in each Biolog plate exhibited reproducible carbon source utilization patterns with little variations. Furthermore, the Biolog method provides a rapid and convenient assay for detecting the shifts in bacterial communities, which could be used as an early warning indicator of environmental stress in drinking water reservoirs.
It should be noted that microbial communities are influenced by many factors such as the fast-changing environment, the inflow of the reservoir, the sediment of the ecosystem, and other aquatic organisms, which may interfere with our results. Hence, additional environmental parameters should be considered and measured combined with more sampling times over years. Furthermore, the diversity of the archaeal and eukaryotic community based on the high-throughput and sensitive sequencing technology should be combined with environmental characteristics to establish a more exact relationship between biogeochemistry cycling and microbial communities in drinking water reservoirs [64]. Despite the fact that there may have been some disturbances, the comparison of the communities detected in our study was feasible, since all samples were treated similarly. Overall, in this study, we have found that there were similar shifts both in the function and in the composition of the bacterial communities after the water body become stratified. Temperature differences between the superficial and the deeper waters affected the water density, which could have further contributed to the physical and chemical stratification and led to habitat heterogeneity. The heterogeneity of the habitat apparently shaped the microbial communities, and the dominant groups in turn may affect the water quality through their function and metabolism to adjust the dissolved nutrients in the water. It is possible that this interaction between the bacterial communities and stratified water body in fact produces a more ecologically robust and stable system under a dynamic equilibrium. Previous studies demonstrated that long periods of stratification had adverse effects on the water quality, especially in drinking water reservoirs. Therefore, the results of our study on the responses of aquatic bacterial communities to the shifts in environment would provide useful information for the protection of drinking water resources.

5. Conclusions

In summary, the present study examined the abundance and the diversity of bacterial communities within the Jinpen Drinking Water Reservoir around the re-stratification period. We observed evidence for the bacterial communities’ response to stratification event, and revealed dynamic variations in both the bacterial functional diversity and the BCC with similar trends. The functional diversity showed a vertical structure after the water body became stratified, which lead to a significantly higher ability of utilizing carbon sources in the hypolimnion than that of the epilimnion. The results of pyrosequencing also showed that the hypolimnion had significantly higher values in diversity and abundance, and the cluster analysis results clearly showed that the bacterial community composition was strongly correlated with water stratification. The sequencing results indicated that the reservoir contained some common freshwater bacterial taxa, such as Proteobacteria, Cyanobacteria, and Actinobacteria. Furthermore, each water layer showed different dominant bacteria groups. Specifically, Cyanobacteria were dominant in the epilimnion in August, whereas Actinobacteria were dominant in the hypolimnion. It is noteworthy that the BCC was shown to be significantly correlated with environmental parameters, such as pH, temperature, DO, total nitrogen, and so on. The work presented here provides new insight into the functional diversity of the microbial community of drinking water reservoirs, and provides a comprehensive understanding of microbial communities via the Biolog method combined with pyrosequencing.

Acknowledgments

This study was jointly sponsored by the grants from National Science and Technology Pillar Program of China (No. 2012BAC04B02), National Natural Science Foundation of China (No. 51478378), Youth Science and Technology Star Foundation of Shaanxi Provincial (No. 2015KJXX-32) and the Foundation of Key Laboratory of Environmental Engineering of Shanxi Province (No. 14JS041). We thank the administration of the Jinpen Drinking Water Reservoir for help with the sampling.

Author Contributions

Xiao Yang carried out the experiment and prepared the first edition of the manuscript. TingLin Huang and HaiHan Zhang were involved in the discussion of the results and the final proofreading of the manuscript. All authors have read and approved the final manuscript.

Conflicts of Interest

The authors declare no conflict of interest.

References

  1. Huang, T.; Li, X.; Rijnaarts, H.; Grotenhuis, T.; Ma, W.; Sun, X.; Xu, J. Effects of storm runoff on the thermal regime and water quality of a deep, stratified reservoir in a temperate monsoon zone, in Northwest China. Sci. Total Environ. 2014, 485, 820–827. [Google Scholar] [CrossRef] [PubMed]
  2. Wang, S.; Qian, X.; Han, B.-P.; Luo, L.-C.; Hamilton, D.P. Effects of local climate and hydrological conditions on the thermal regime of a reservoir at tropic of cancer, in Southern China. Water Res. 2012, 46, 2591–2604. [Google Scholar] [CrossRef] [PubMed]
  3. Elçi, Ş. Effects of thermal stratification and mixing on reservoir water quality. Limnology 2008, 9, 135–142. [Google Scholar]
  4. Becker, V.; Huszar, V.; Crossetti, L. Responses of phytoplankton functional groups to the mixing regime in a deep subtropical reservoir. Hydrobiologia 2009, 628, 137–151. [Google Scholar] [CrossRef]
  5. Yu, Z.; Yang, J.; Amalfitano, S.; Yu, X.; Liu, L. Effects of water stratification and mixing on microbial community structure in a subtropical deep reservoir. Sci. Rep. 2014, 4. [Google Scholar] [CrossRef] [PubMed]
  6. McGinnis, D.F.; Little, J.C. Predicting diffused-bubble oxygen transfer rate using the discrete-bubble model. Water Res. 2002, 36, 4627–4635. [Google Scholar] [CrossRef]
  7. Lawson, R.; Anderson, M.A. Stratification and mixing in lake elsinore, california: An assessment of axial flow pumps for improving water quality in a shallow eutrophic lake. Water Res. 2007, 41, 4457–4467. [Google Scholar] [CrossRef] [PubMed]
  8. Newton, R.J.; Jones, S.E.; Eiler, A.; McMahon, K.D.; Bertilsson, S. A guide to the natural history of freshwater lake bacteria. Microbiol. Mol. Biol. Rev. 2011, 75, 14–49. [Google Scholar] [CrossRef] [PubMed]
  9. Koizumi, Y.; Kojima, H.; Oguri, K.; Kitazato, H.; Fukui, M. Vertical and temporal shifts in microbial communities in the water column and sediment of saline meromictic lake kaiike (Japan), as determined by a 16s rDNA-based analysis, and related to physicochemical gradients. Environ. Microbiol. 2004, 6, 622–637. [Google Scholar] [CrossRef] [PubMed]
  10. Röske, K.; Röske, I.; Uhlmann, D. Characterization of the bacterial population and chemistry in the bottom sediment of a laterally subdivided drinking water reservoir system. Limnol. Ecol. Manag. Inland Waters 2008, 38, 367–377. [Google Scholar] [CrossRef]
  11. Meuser, J.E.; Baxter, B.K.; Spear, J.R.; Peters, J.W.; Posewitz, M.C.; Boyd, E.S. Contrasting patterns of community assembly in the stratified water column of great salt lake, Utah. Microb. Ecol. 2013, 66, 268–280. [Google Scholar] [CrossRef] [PubMed]
  12. Pommier, T.; Neal, P.R.; Gasol, J.M.; Coll, M.; Acinas, S.G.; Pedrós-Alió, C. Spatial patterns of bacterial richness and evenness in the nw mediterranean sea explored by pyrosequencing of the 16s rRNA. Aquat. Microb. Ecol. 2010, 61, 221–233. [Google Scholar] [CrossRef]
  13. Qian, P.-Y.; Wang, Y.; Lee, O.O.; Lau, S.C.K.; Yang, J.; Lafi, F.F.; Al-Suwailem, A.; Wong, T.Y.H. Vertical stratification of microbial communities in the red sea revealed by 16s rDNA pyrosequencing. ISME J. 2010, 5, 507–518. [Google Scholar] [CrossRef] [PubMed]
  14. Choi, K.-H.; Dobbs, F.C. Comparison of two kinds of biolog microplates (GN and ECO) in their ability to distinguish among aquatic microbial communities. J. Microbiol. Meth. 1999, 36, 203–213. [Google Scholar] [CrossRef]
  15. Zhao, Y.; Liu, B.; Zhang, W.; Hu, C.; An, S. Effects of plant and influent C:N:P ratio on microbial diversity in pilot-scale constructed wetlands. Ecol. Eng. 2010, 36, 441–449. [Google Scholar] [CrossRef]
  16. Rogers, B.; Tate, R. Temporal analysis of the soil microbial community along a toposequence in pineland soils. Soil Biol. Biochem. 2001, 33, 1389–1401. [Google Scholar] [CrossRef]
  17. Comeau, A.M.; Harding, T.; Galand, P.E.; Vincent, W.F.; Lovejoy, C. Vertical distribution of microbial communities in a perennially stratified arctic lake with saline, anoxic bottom waters. Sci. Rep. 2012, 2. [Google Scholar] [CrossRef] [PubMed]
  18. Boucher, D.; Jardillier, L.; Debroas, D. Succession of bacterial community composition over two consecutive years in two aquatic systems: A natural lake and a lake-reservoir. FEMS Microbiol. Ecol. 2006, 55, 79–97. [Google Scholar] [CrossRef] [PubMed]
  19. Sun, Z.; Li, G.; Wang, C.; Jing, Y.; Zhu, Y.; Zhang, S.; Liu, Y. Community dynamics of prokaryotic and eukaryotic microbes in an estuary reservoir. Sci. Rep. 2014, 4, 6966. [Google Scholar] [CrossRef] [PubMed]
  20. Pouliot, J.; Galand, P.E.; Lovejoy, C.; Vincent, W.F. Vertical structure of archaeal communities and the distribution of ammonia monooxygenase a gene variants in two meromictic high arctic lakes. Environ. Microbiol. 2009, 11, 687–699. [Google Scholar] [CrossRef] [PubMed]
  21. Kubo, K.; Kojima, H.; Fukui, M. Vertical distribution of major sulfate-reducing bacteria in a shallow eutrophic meromictic lake. Syst. Appl. Microbiol. 2014, 37, 510–519. [Google Scholar] [CrossRef] [PubMed]
  22. Sun, X.; Li, X.; Zhang, M.; Huang, T.; Liu, W. Comparison of water-lifting aerator type for algae inhibition in stratified source water reservoirs. Ecol. Eng. 2014, 73, 624–634. [Google Scholar] [CrossRef]
  23. Huang, T.; Ma, Y.; Cong, H.; Tan, P. Application of the technology of water lifting and aeration on improving water quality in a deep canyon reservoir—A case study from Northern China. Desalination Water Treat. 2013, 52, 1636–1646. [Google Scholar] [CrossRef]
  24. Wilhelm, S.; Adrian, R. Impact of summer warming on the thermal characteristics of a polymictic lake and consequences for oxygen, nutrients and phytoplankton. Freshw. Biol. 2008, 53, 226–237. [Google Scholar] [CrossRef]
  25. Shade, A.; Jones, S.E.; McMahon, K.D. The influence of habitat heterogeneity on freshwater bacterial community composition and dynamics. Environ. Microbiol. 2008, 10, 1057–1067. [Google Scholar] [CrossRef] [PubMed]
  26. Ma, Y.; Guo, Q.; Huang, T.; Tan, P. Response characteristics of water quality to seasonal thermal stratification in Jinpen reservoir along the heihe river, Xi’an city in China. J. Hydraul. Eng. 2013, 44, 406–415. (In Chinese) [Google Scholar]
  27. Li, X.; Huang, T.; Ma, W.; Sun, X.; Zhang, H. Effects of rainfall patterns on water quality in a stratified reservoir subject to eutrophication: Implications for management. Sci. Total Environ. 2015, 521, 27–36. [Google Scholar] [CrossRef] [PubMed]
  28. Wen, G.; Ma, J.; Huang, T.-L.; Egli, T. Using coagulation to restrict microbial re-growth in tap water by phosphate limitation in water treatment. J. Hazar. Mater. 2014, 280, 348–355. [Google Scholar] [CrossRef] [PubMed]
  29. Hammes, F.; Egli, T. Cytometric methods for measuring bacteria in water: Advantages, pitfalls and applications. Anal. Bioanal. Chem. 2010, 397, 1083–1095. [Google Scholar] [CrossRef] [PubMed]
  30. Zhang, H.; Huang, T.; Liu, T. Sediment enzyme activities and microbial community diversity in an oligotrophic drinking water reservoir, Eastern China. PloS ONE 2013, 8, e78571. [Google Scholar] [CrossRef] [PubMed]
  31. Zhang, H.; Huang, T.; Chen, S.; Guo, L.; Liu, T.; Yang, X. Microbial community functional diversity and enzymatic activity in the sediments of drinking water reservoirs, Northwest China. Desalination Water Treat. 2014, 52, 1608–1614. [Google Scholar] [CrossRef]
  32. Zak, J.C.; Willig, M.R.; Moorhead, D.L.; Wildman, H.G. Functional diversity of microbial communities: A quantitative approach. Soil Biol. Biochem. 1994, 26, 1101–1108. [Google Scholar] [CrossRef]
  33. Zhu, D.; Tanabe, S.-H.; Yang, C.; Zhang, W.; Sun, J. Bacterial community composition of South China sea sediments through pyrosequencing-based analysis of 16s rRNA genes. PloS ONE 2013, 8, e78501. [Google Scholar] [CrossRef] [PubMed]
  34. Caporaso, J.G.; Kuczynski, J.; Stombaugh, J.; Bittinger, K.; Bushman, F.D.; Costello, E.K.; Fierer, N.; Pena, A.G.; Goodrich, J.K.; Gordon, J.I. Qiime allows analysis of high-throughput community sequencing data. Nat. Methods 2010, 7, 335–336. [Google Scholar] [CrossRef] [PubMed]
  35. Schloss, P.D. A high-throughput DNA sequence aligner for microbial ecology studies. PLoS ONE 2009, 4, e8230. [Google Scholar] [CrossRef] [PubMed]
  36. Hamady, M.; Walker, J.J.; Harris, J.K.; Gold, N.J.; Knight, R. Error-correcting barcoded primers for pyrosequencing hundreds of samples in multiplex. Nat. Methods 2008, 5, 235–237. [Google Scholar] [CrossRef] [PubMed]
  37. Cole, J.R.; Chai, B.; Farris, R.J.; Wang, Q.; Kulam-Syed-Mohideen, A.; McGarrell, D.M.; Bandela, A.; Cardenas, E.; Garrity, G.M.; Tiedje, J.M. The ribosomal database project (RDP-II): Introducing myrdp space and quality controlled public data. Nucleic Acids Res. 2007, 35, D169–D172. [Google Scholar] [CrossRef] [PubMed]
  38. Crawford, P.A.; Crowley, J.R.; Sambandam, N.; Muegge, B.D.; Costello, E.K.; Hamady, M.; Knight, R.; Gordon, J.I. Regulation of myocardial ketone body metabolism by the gut microbiota during nutrient deprivation. Proceed. Natl. Acad. Sci. 2009, 106, 11276–11281. [Google Scholar] [CrossRef] [PubMed]
  39. Chao, A.; Bunge, J. Estimating the number of species in a stochastic abundance model. Biometrics 2002, 58, 531–539. [Google Scholar] [CrossRef] [PubMed]
  40. Jiang, X.-T.; Peng, X.; Deng, G.-H.; Sheng, H.-F.; Wang, Y.; Zhou, H.-W.; Tam, N.F.-Y. Illumina sequencing of 16s rRNA tag revealed spatial variations of bacterial communities in a mangrove wetland. Microb. Ecol. 2013, 66, 96–104. [Google Scholar] [CrossRef] [PubMed]
  41. Lozupone, C.; Lladser, M.E.; Knights, D.; Stombaugh, J.; Knight, R. Unifrac: An effective distance metric for microbial community comparison. ISME J. 2011, 5, 169–172. [Google Scholar] [CrossRef] [PubMed]
  42. Oksanen, J.; Kindt, R.; Legendre, P.; O’Hara, B.; Stevens, M.H.H.; Oksanen, M.J.; Suggests, M. The Vegan Package. Available online: http://www.researchgate.net/profile/Gavin_Simpson/publication/228339454_The_vegan_package/links/0912f50be86bc29a7f000000.pdf (accessed on 18 February 2015).
  43. Zhang, H.-H.; Huang, T.-L.; Chen, S.-N.; Yang, X.; Lv, K.; Sekar, R. Abundance and diversity of bacteria in oxygen minimum drinking water reservoir sediments studied by quantitative PCR and pyrosequencing. Microbol. Ecol. 2015, 69, 618–629. [Google Scholar] [CrossRef] [PubMed]
  44. Chao, A. Nonparametric estimation of the number of classes in a population. Scand. J. Stat. 1984, 11, 265–270. [Google Scholar]
  45. Schoener, T.W. Resource partitioning in ecological communities. Science 1974, 185, 27–39. [Google Scholar] [CrossRef] [PubMed]
  46. Valdespino-Castillo, P.M.; Merino-Ibarra, M.; Jiménez-Contreras, J.; Castillo-Sandoval, F.S.; Ramírez-Zierold, J.A. Community metabolism in a deep (stratified) tropical reservoir during a period of high water-level fluctuations. Environ. Monit. Assess. 2014, 186, 6505–6520. [Google Scholar] [CrossRef] [PubMed]
  47. Bauer, M.; Kube, M.; Teeling, H.; Richter, M.; Lombardot, T.; Allers, E.; Würdemann, C.A.; Quast, C.; Kuhl, H.; Knaust, F. Whole genome analysis of the marine bacteroidetes “gramella forsetii” reveals adaptations to degradation of polymeric organic matter. Environ. Microbiol. 2006, 8, 2201–2213. [Google Scholar] [CrossRef] [PubMed]
  48. Grossart, H.P.; Levold, F.; Allgaier, M.; Simon, M.; Brinkhoff, T. Marine diatom species harbour distinct bacterial communities. Environ. Microbiol. 2005, 7, 860–873. [Google Scholar] [CrossRef] [PubMed]
  49. Hupfer, M.; Lewandowski, J. Oxygen controls the phosphorus release from lake sediments—A long-lasting paradigm in limnology. Int. Rev. Hydrobiol. 2008, 93, 415–432. [Google Scholar] [CrossRef]
  50. Song, L.-Y.; Wang, Y.-Q. Investigation of microbial community structure of a shallow lake after one season copper sulfate algaecide treatment. Microbiol. Res. 2015, 170, 105–113. [Google Scholar] [CrossRef] [PubMed]
  51. Hiorns, W.D.; Methe, B.A.; Nierzwicki-Bauer, S.A.; Zehr, J.P. Bacterial diversity in adirondack mountain lakes as revealed by 16s rRNA gene sequences. Appl. Environ. Microbiol. 1997, 63, 2957–2960. [Google Scholar] [PubMed]
  52. Pernthaler, J.; Glöckner, F.-O.; Unterholzner, S.; Alfreider, A.; Psenner, R.; Amann, R. Seasonal community and population dynamics of pelagic bacteria and archaea in a high mountain lake. Appl. Environ. Microbiol. 1998, 64, 4299–4306. [Google Scholar] [PubMed]
  53. Eiler, A.; Bertilsson, S. Composition of freshwater bacterial communities associated with cyanobacterial blooms in four swedish lakes. Environ. Microbiol. 2004, 6, 1228–1243. [Google Scholar] [CrossRef] [PubMed]
  54. Kasalický, V.; Jezbera, J.; Hahn, M.W.; Šimek, K. The diversity of the limnohabitans genus, an important group of freshwater bacterioplankton, by characterization of 35 isolated strains. PLoS ONE 2013, 8, e58209. [Google Scholar] [CrossRef] [PubMed]
  55. Hahn, M.W.; Pöckl, M.; Wu, Q.L. Low intraspecific diversity in a polynucleobacter subcluster population numerically dominating bacterioplankton of a freshwater pond. Appl. Environ. Microbiol. 2005, 71, 4539–4547. [Google Scholar] [CrossRef] [PubMed]
  56. Bickel, S.L.; Tang, K.W. Carbon substrate usage by zooplankton-associated bacteria, phytoplankton-associated bacteria, and free-living bacteria under aerobic and anaerobic conditions. Mar. Biol. 2014, 161, 2233–2242. [Google Scholar] [CrossRef]
  57. Garland, J.L.; Mills, A.L. Classification and characterization of heterotrophic microbial communities on the basis of patterns of community-level sole-carbon-source utilization. Appl. Environ. Microbiol. 1991, 57, 2351–2359. [Google Scholar] [PubMed]
  58. Kersters, I.; Van Vooren, L.; Verschuere, L.; Vauterin, L.; Wouters, A.; Mergaert, J.; Swings, J.; Verstraete, W. Utility of the biolog system for the characterization of heterotrophic microbial communities. Syst. Appl. Microbiol. 1997, 20, 439–447. [Google Scholar] [CrossRef]
  59. Garland, J.L. Analytical approaches to the characterization of samples of microbial communities using patterns of potential C source utilization. Soil Biol. Biochem. 1996, 28, 213–221. [Google Scholar] [CrossRef]
  60. Fredrickson, J.K.; Balkwill, D.L.; Zachara, J.M.; Li, S.-M.W.; Brockman, F.J.; Simmons, M.A. Physiological diversity and distributions of heterotrophic bacteria in deep cretaceous sediments of the atlantic coastal plain. Appl. Environ. Microbiol. 1991, 57, 402–411. [Google Scholar] [PubMed]
  61. Fuller, M.E.; Scow, K.M.; Lau, S.; Ferris, H. Trichloroethylene (TCE) and toluene effects on the structure and function of the soil community. Soil Biol. Biochem. 1997, 29, 75–89. [Google Scholar] [CrossRef]
  62. Bossio, D.A.; Scow, K.M. Impact of carbon and flooding on the metabolic diversity of microbial communities in soils. Appl. Environ. Microbiol. 1995, 61, 4043–4050. [Google Scholar] [PubMed]
  63. Haack, S.K.; Garchow, H.; Klug, M.J.; Forney, L.J. Analysis of factors affecting the accuracy, reproducibility, and interpretation of microbial community carbon source utilization patterns. Appl. Environ. Microbiol. 1995, 61, 1458–1468. [Google Scholar] [PubMed]
  64. Sun, W.; Cupples, A.M. Diversity of five anaerobic toluene-degrading microbial communities investigated using stable isotope probing. Appl. Environ. Microbiol. 2012, 78, 972–980. [Google Scholar] [CrossRef] [PubMed]

