2. The Relationship between Soil Water Retention and Hydraulic Conductivity
The soil water retention curve defines the relationship between the measures of the pore water volume and suction in the soil matrix. The matric suction
p is defined as the difference between the air and water pressures in the pore. The variable for the pore water content is commonly the volumetric water content θ or effective saturation
, which is defined as
where
is the saturated water content and
is the residual water content. According to the van Genuchten (VG) model (1980), the SWRC is defined by the relation of
and
p as follows:
where α is the inverse of the air-entry pressure,
pb,
n is the parameter on the pore size distribution and
m = 1 − 1/
n.
According to Mualem [
2], the relative hydraulic conductivity function,
, can be derived as follows:
where
K is the unsaturated hydraulic conductivity function with respect to
, and
is the saturated hydraulic conductivity.
q is an empirical parameter on the pore connectivity, which is commonly assumed to be 0.5 [
2].
In the
integrand of Equation (4), the inverse of
p is a function of
, which is obtained from the equation on the SWRC. Substituting Equation (3) into (4), the van Genuchten-Mualem (VGM) model on the hydraulic conductivity can be derived as follows [
3]:
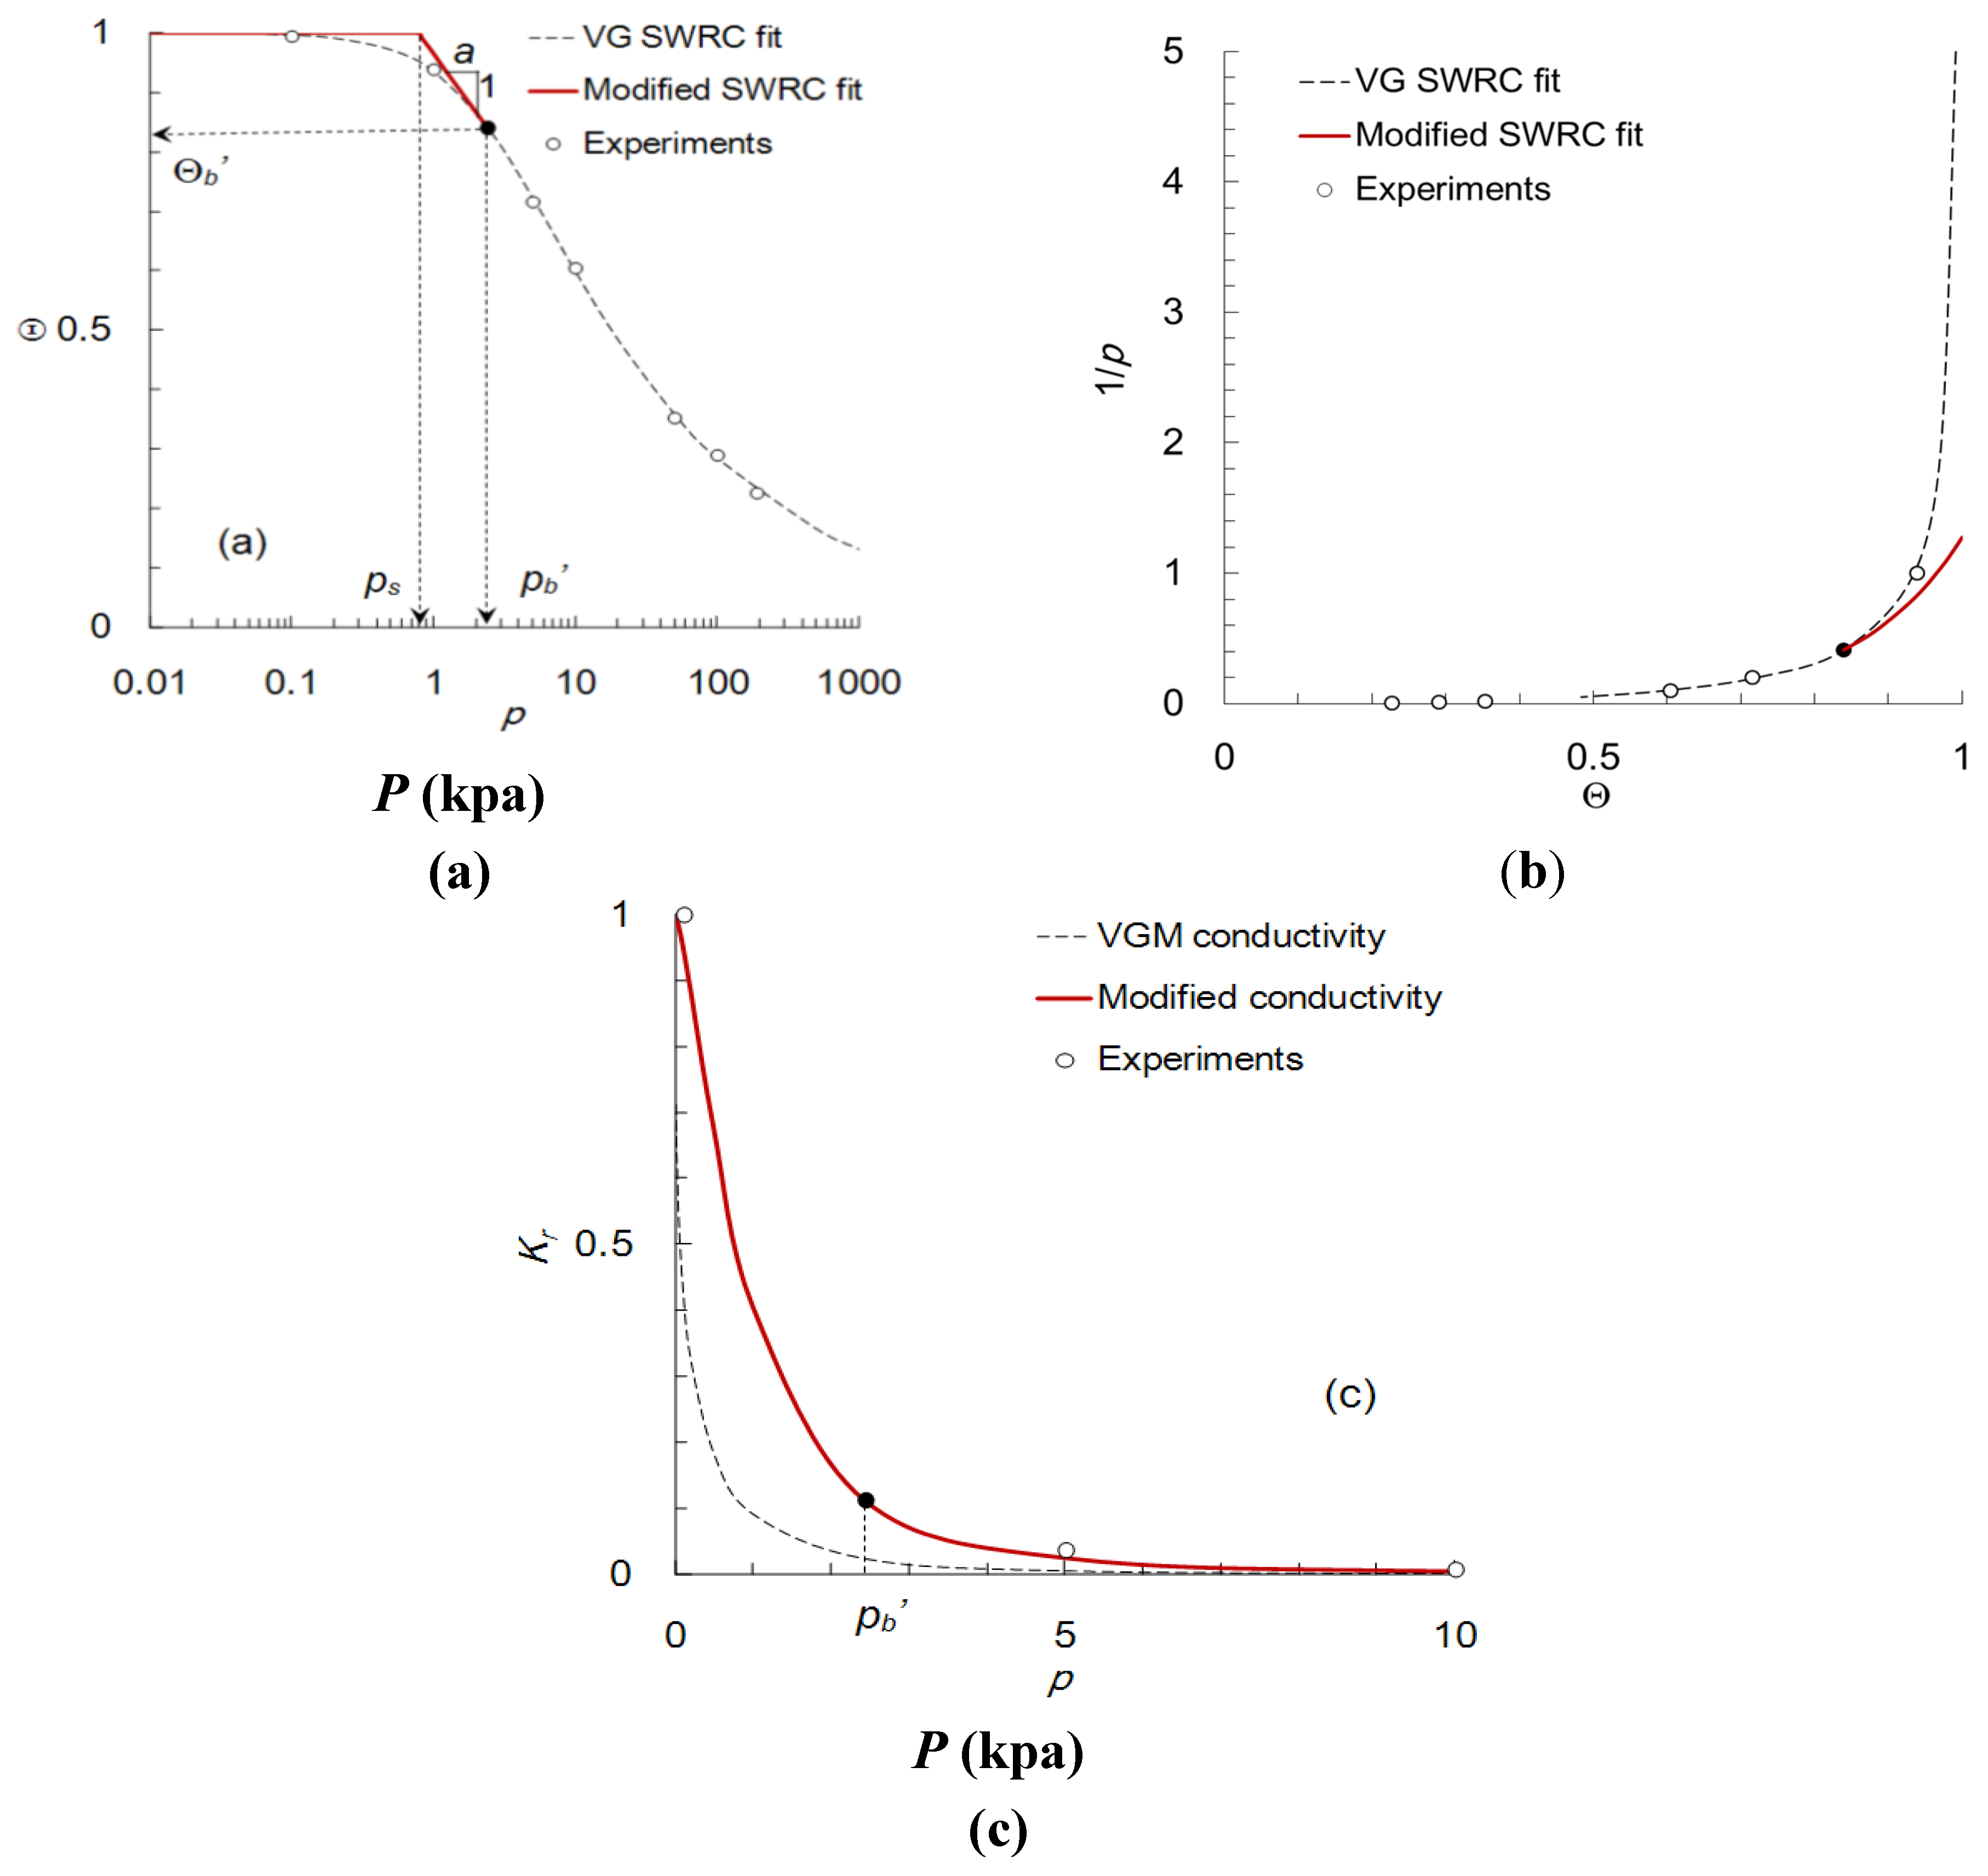
Figure 1 shows the hydraulic characteristics according to Mualem theory for a van Genuchten’s SWRC (
pb = 2.43 kPa,
n = 1.34,
q = 0.5). As shown in
Figure 1a, in the domain of a sufficiently small
p, the pores are almost saturated and the water content varies insignificantly in both the SWRC data and VG fit. In contrast, the slope of the SWRCs near full saturation has a significant effect on integrating the unsaturated HC in Equation (4). As shown in
Figure 1b, when Θ approaches 1, the value of 1/
p increases to infinity in the smooth SWRCs, such as the VG curves. According to Equation (4),
Kr (
Figure 1c) is reduced abruptly in the VGM model and is much less than 1.0 (saturated value) near saturation or at very low suction. In particular, the decrease in
Kr is drastic in the VGM model, when
n < 1.5 for silty soils [
7]. Numerical solutions using such HCs can frequently result in oscillations or divergence according to the steep gradient near saturation. Hence, the VGM model tends to estimate the HCs differently, even with extremely small variations in the shape of the SWRCs near saturation and it does not provide a unique HC for a set of SWRC data [
14].
Figure 1.
Comparison of the soil water retention curves and hydraulic conductivities in both van Genuchten-Mualem theory and its modification: (a) soil water retention curves; (b) 1/p-Θ relationships; and (c) hydraulic conductivities.
Figure 1.
Comparison of the soil water retention curves and hydraulic conductivities in both van Genuchten-Mualem theory and its modification: (a) soil water retention curves; (b) 1/p-Θ relationships; and (c) hydraulic conductivities.
To improve the VGM HC function, Vogel
et al. [
7] introduced a break near saturation, which serves the same purpose as
ps in the non-smooth curve (
Figure 1a). In the region where
p >
ps, the SWRC should be fitted again to the experimental results using a fictitious water content greater than the saturated one. Therefore, the parameters α and
n of the SWRCs are different from those of the original fit in the VG SWRC. Furthermore,
ps is determined to be a small value to retain the nonlinear form of the VG SWRC, but is difficult to assess uniquely.
pb is the inverse of α in the van Genuchten’s parametrization, which is evaluated from the curve fit of the SWRC data. In
Figure 1a,
pbʹ is an arbitrary estimate from which the curve is extrapolated tangentially on the log
p scale to full saturation, which is less than or equal to
pb. Θ
bʹ is the effective saturation corresponding to
pbʹ in the VG fit of Equation (2). The VG curve is linearized in the logarithmic
p axis by the tangential line from
pbʹ to
ps.
ps is the value of the matric suction on the tangential line when Θ = 1. The modified VG SWRC has a partially linear shape on the logarithmic scale, where
p is between
ps and
pbʹ and follows the VG curve smoothly in Equation (2), where
p >
pbʹ. The modified VG model on SWRC in
Figure 1a is derived as follows:
where
Equation (8) is the same as the VG function (2b) when , and Equation (9) is a linear function in the ln p-Θ axis when . At full saturation, Θ = 1 when p ≤ ps. Θb and Θbʹ are the effective saturations at pb and pbʹ, respectively, calculated from Equation (2) of the VG model. In Equations (8–11), the modified SWRC is established by two parameters, α and n, of the VG SWRC, but it also needs to define pbʹ.
Figure 1b shows the function of 1/
p with respect to Θ, in the modified SWRC according to Equations (8)–(11). For
, the function is the same as the VG curve, which leads smoothly to the modified curve in the region,
, according to Equation (9). When Θ = 1, the function of 1/
p is a vertical line according to Equation (10) with a break of 1/
ps. In the integration of Equation (4), the function of 1/
p is integrated for each interval of Θ. Substituting Equations (8)–(11) into Equation (4), the relative HC is derived as follows:
where
Detailed derivation of Equations (8)–(15) is given in the
Appendix. Equations (12)–(15) show the analytical solution of HC for the modified VGM model. The function of the modified SWRC is integrated to Equations (12) and (13). For full saturation (Θ = 1),
Kr = 1 (Equation (14)) according to the definition of Equation (5).
Figure 1c shows that the modified HC varies gradually without any abrupt decreases in the small matric suction near saturation. The difference between the SWRCs in
Figure 1a is very small but the value of
Kr from the modified SWRC is much greater than that of the VGM model.
According to Equations (12)–(15), the modified
Kr is deduced from the parameters, α and
n, of the VG SWRC. In addition,
pbʹ should be determined using a sufficiently small value so that the modified SWRC can fit the actual shape of the SWRC in the experiments equivalently to the original VG model.
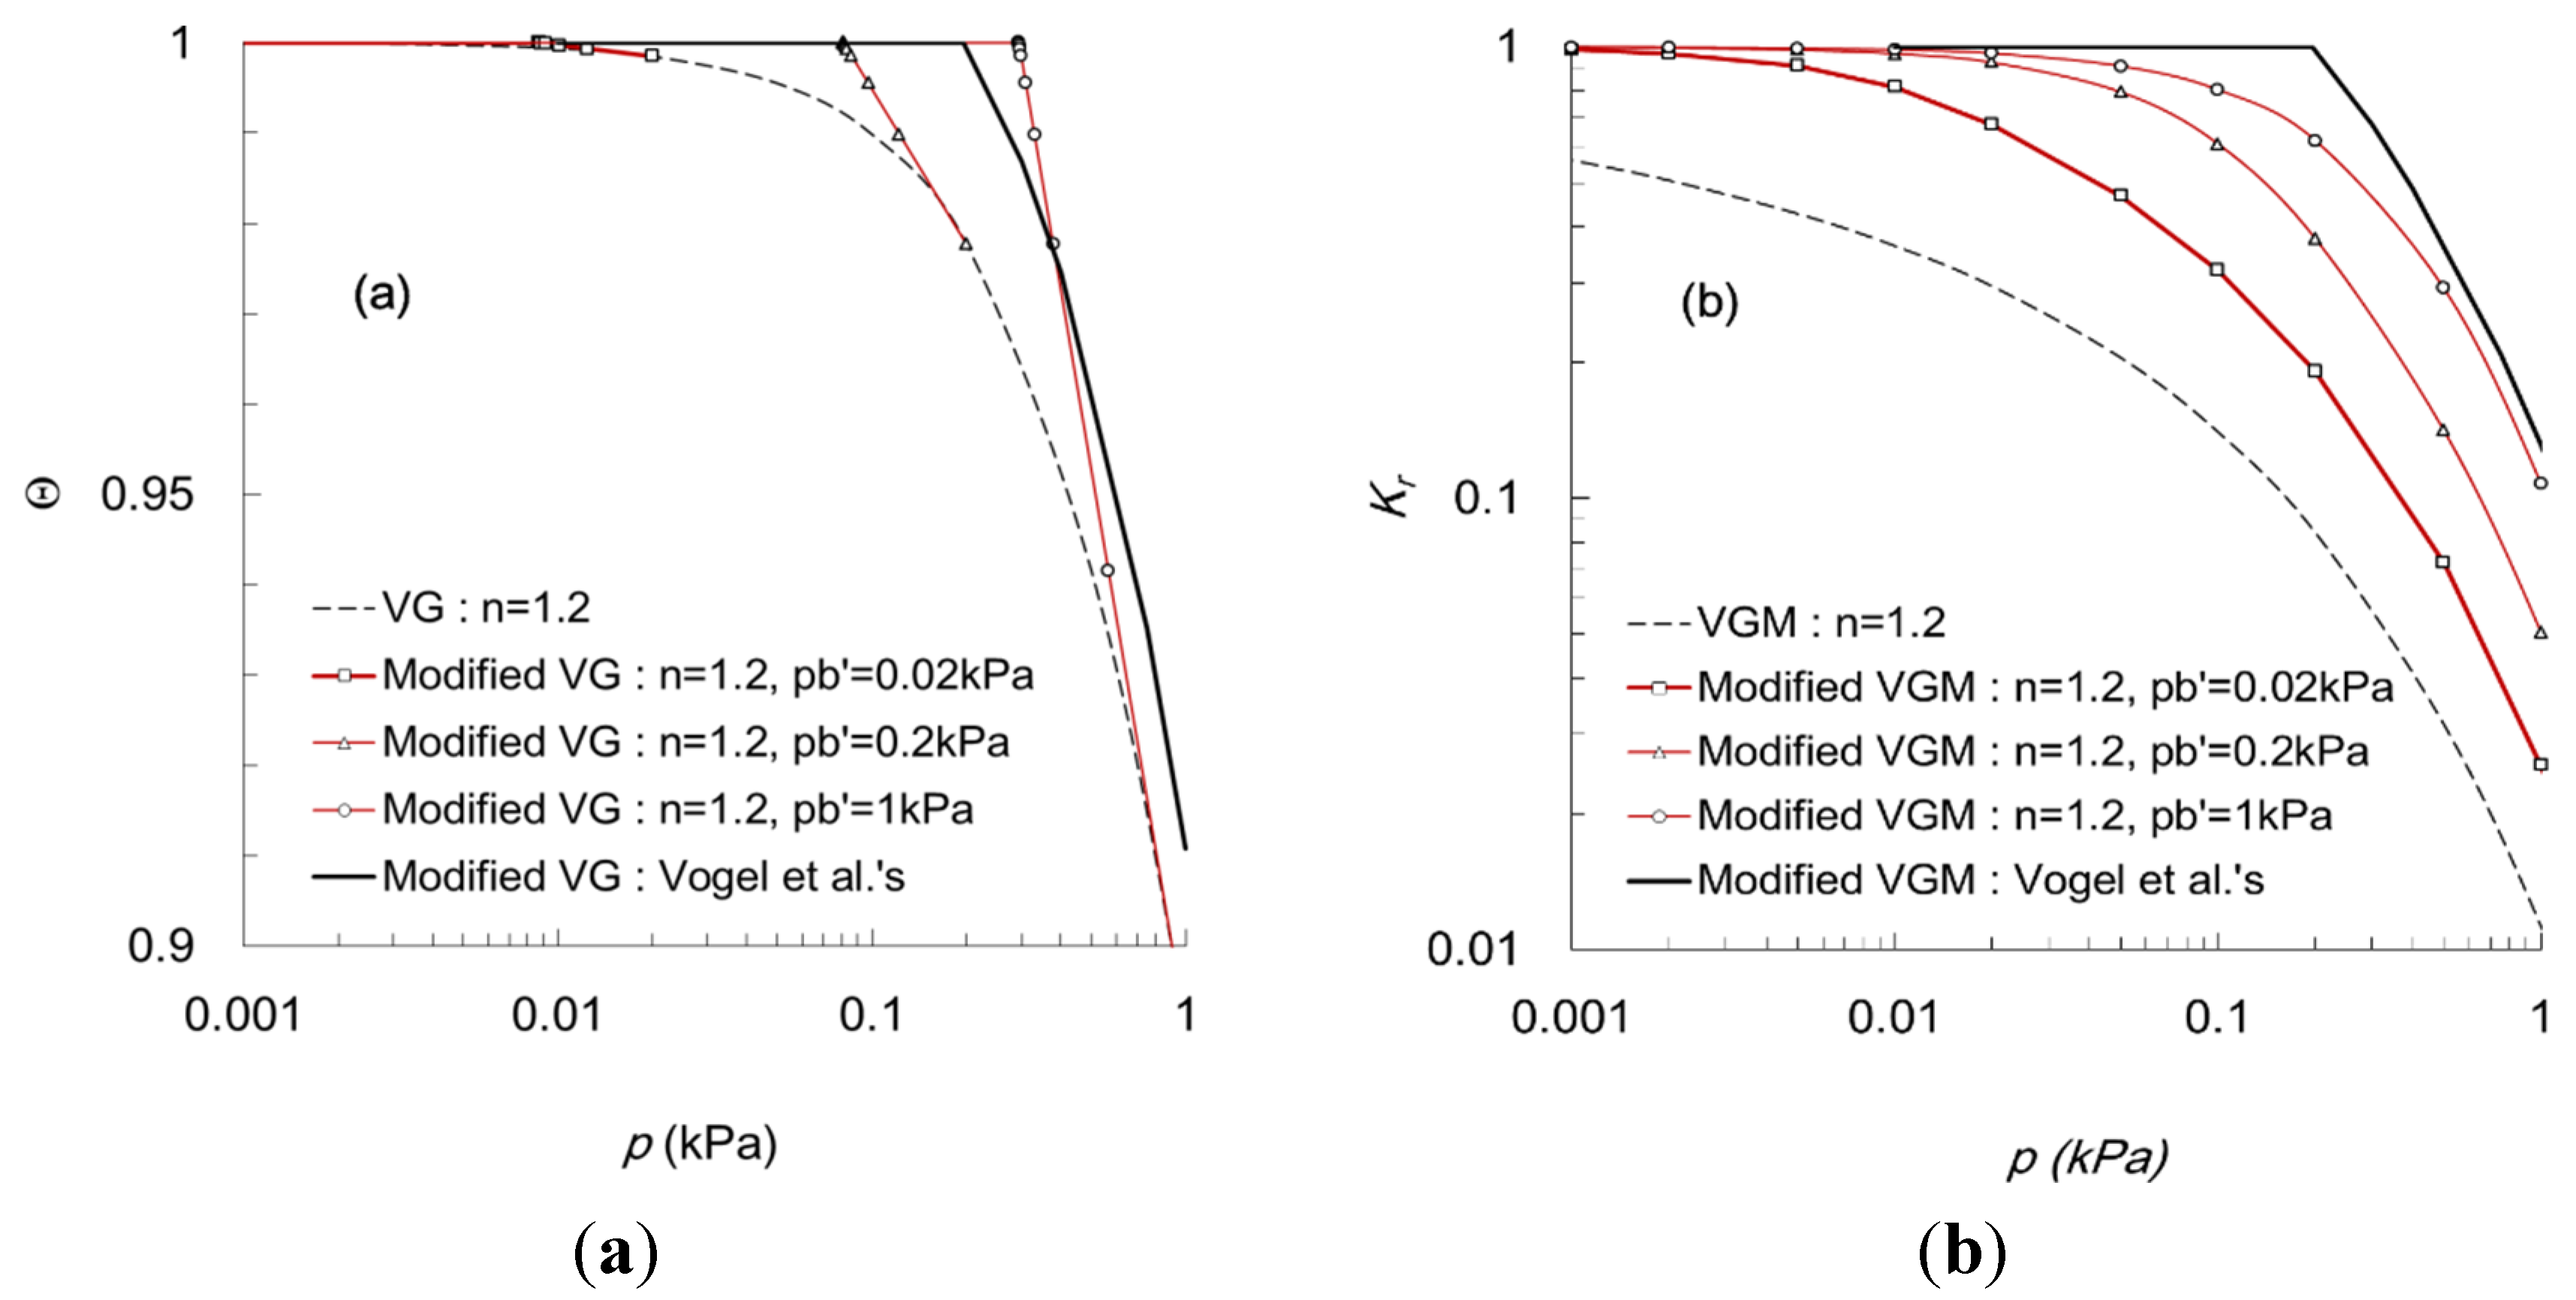
Figure 2 shows the effect of
pbʹ on the SWRCs and
Kr functions (
pb = 1 kPa,
n = 1.2,
q = 0.5), in which the maximum value of the
p axis is equal to
pb or 1kPa for comparison in a small
p value. In
Figure 2a, the modified SWRCs were compared with the VG model for three cases:
pbʹ =
pb (1 kPa),
pb/5 (0.2 kPa) and
pb/50 (0.02 kPa). Note that
ps is 0.29 kPa, 0.081 kPa and 0.0087 kPa, respectively. All modified SWRCs have the same VG curve in the greater matric suction than
pbʹ. As shown in
Figure 2b, the
Kr for the VGM model was reduced significantly, by 50%, at a matric suction of 0.001 kPa, and the overall values of
Kr are less than the modified HCs. In very small matric suction, the modified VGM model prevents abrupt changes in
Kr and retains the saturated
Kr of 1.0. For the higher
pbʹ, the value of
Kr is greater than that for
pbʹ = 0.02 kPa.
To compare with the
Kr function of Vogel
et al. [
7],
ps is estimated by 0.2 kPa, and α and
n of the SWRCs are assumed to be the same as the original fit in the van Genuchten’s model. The modification by Vogel
et al. [
7] revealed a non-smooth shape at the break pressure both in the SWRC (
Figure 2a) and the HCF (
Figure 2b). On the other hand, the proposed
Kr functions show a smooth shape, even though the modified SWRCs are not smooth.
Figure 2.
Effect of linearization by the modified SWRCs on Kr functions (pb = 1 kPa, n = 1.2, q = 0.5): (a) soil water retention curves; (b) hydraulic conductivities.
Figure 2.
Effect of linearization by the modified SWRCs on Kr functions (pb = 1 kPa, n = 1.2, q = 0.5): (a) soil water retention curves; (b) hydraulic conductivities.
As
pbʹ is defined at a tangential point to extrapolate the SWRC, it is far from the physical parameter or variable, and a parametric study is examined to find
pbʹ. To fit the water retention behavior equivalently to the VG model, it is better to establish a smaller
pbʹ. If
pbʹ is infinitesimal,
Kr has the same value as that of the Mualem model based on the VG SWRC, and the numerical stability is no longer preserved. In
Figure 2b,
Kr at the matric suction of
pb or
Kr(
pb) can be a measure to compare the hydraulic conductivities according to
pbʹ, which decreases from 0.1–0.03 (0.01 for VGM) with decreasing
pbʹ.
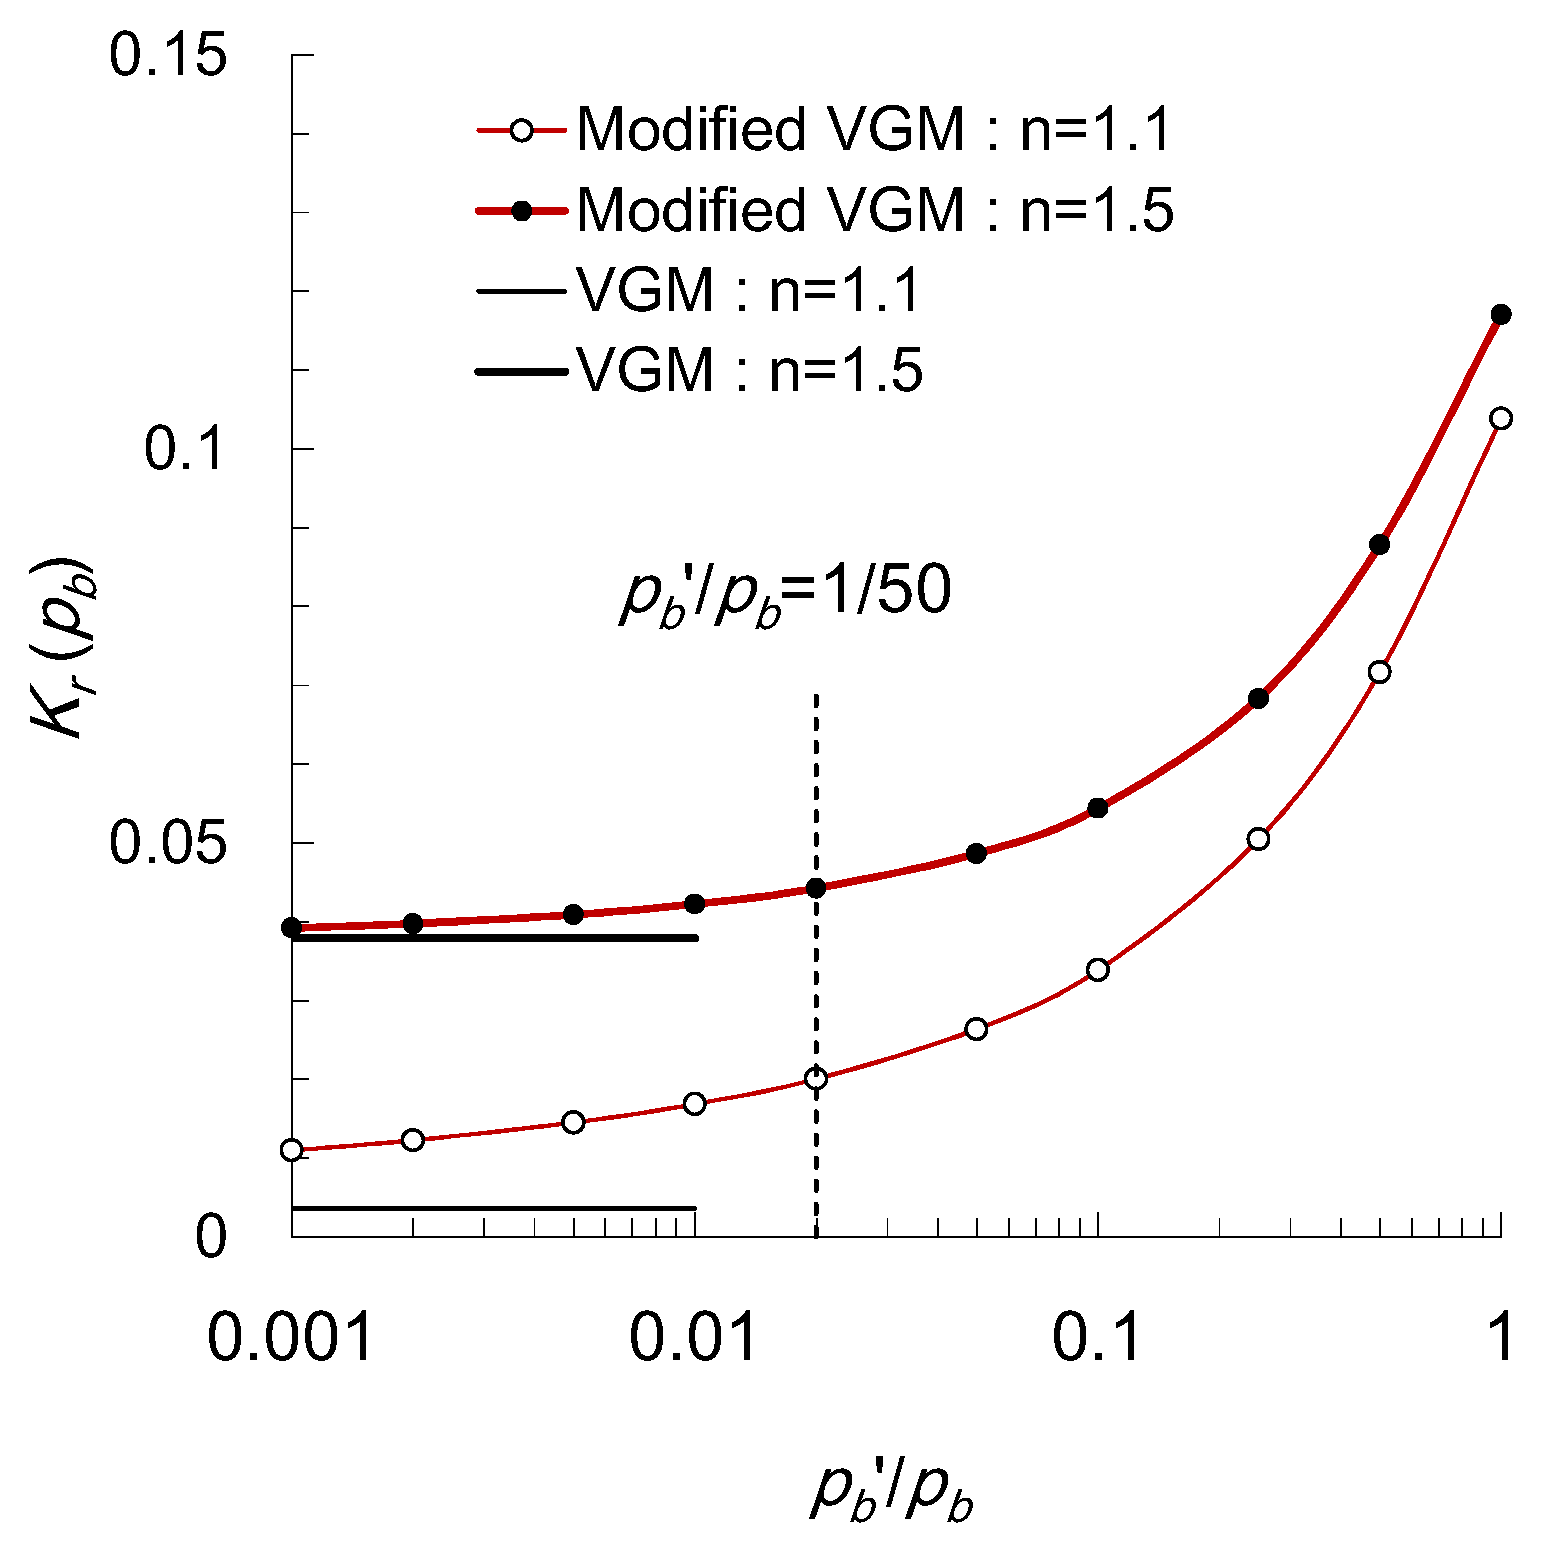
Figure 3 shows the change in
Kr(
pb) as a function of
pbʹ when
n = 1.1 and 1.5 (
pb = 1 kPa,
q = 0.5). When
pbʹ >
pb/50 (or 0.02 kPa),
Kr(
pb) increases remarkably with respect to the logarithmic
pbʹ. On the other hand, when
pbʹ <
pb/50,
Kr(
pb) varies steadily and converges slowly to the VGMs for very small
pbʹ(<0.001
pb). Therefore,
pbʹ can be assumed to be a threshold value of
pb/50 to consider both the accurate fit of the experimental SWRC and the numerical stability due to the
Kr function. In the case of
n = 1.5, the difference in
Kr(
pb) between the modified and original VGM models is less than in the case of
n = 1.1.
Figure 3.
Variation of Kr(pb) with respect to pbʹ for two cases of n = 1.1 and 1.5.
Figure 3.
Variation of Kr(pb) with respect to pbʹ for two cases of n = 1.1 and 1.5.
4. Comparison of the HCs of the VGM Model with a Modified Model
The parameters for SWRC (θ
s, θ
r,
pb,
n) were evaluated to fit the experimental data by RETC code [
19] and an additional parameter
q was evaluated to fit the HC data. As listed in
Table 2, the hydraulic behaviors of the soils are sorted into three groups. Soils with
n < 1.5 were classified as group A and the others were classified as group B. Group A was again sorted by two groups of group A-1 and group A-2, in which
pb ≥ 5 kPa. The samples belong to each group due to the presence of some fine-grained soil and residual formation environments. The low values of the tortuosity factor can be related to adsorptive water retention and film conductivity [
20,
21], which is beyond the scope of this study. For each group, the relative hydraulic conductivity,
Kr, for the modified VGM model was first compared with that of the VGM model and subsequently with the measured value.
Table 2.
Parameters of the van Genuchten-Mualem model for each SWRC and HC.
Table 2.
Parameters of the van Genuchten-Mualem model for each SWRC and HC.
| Group | Region | θs | θr | pb (kPa) | n | q | R2 for Modified HC Fit | R2 for VGM HC Fit |
|---|
| A-1 (n < 1.5, pb ≥ 5 kPa) | Kimpo | 0.40 | 0.00 | 10.90 | 1.23 | −1.5 | 0.638 | 0.702 |
| Seochang | 0.37 | 0.00 | 9.48 | 1.24 | −2.5 | 0.968 | 0.965 |
| Yesan 1 | 0.25 | 0.00 | 16.11 | 1.32 | −3.5 | 0.979 | 0.972 |
| A-2 (n < 1.5, pb < 5 kPa) | Asan | 0.28 | 0.13 | 2.43 | 1.34 | −3.5 | 0.990 | 0.977 |
| Okcheon 1 | 0.37 | 0.06 | 2.01 | 1.32 | −2.7 | 0.963 | 0.951 |
| Yesan 2 | 0.25 | 0.05 | 1.89 | 1.33 | −4.3 | 0.990 | 0.941 |
| B (n ≥ 1.5) | Okcheon 2 | 0.33 | 0.14 | 7.86 | 1.50 | −3.7 | 0.916 | 0.880 |
| Yesan SP | 0.46 | 0.18 | 1.14 | 1.69 | −3.6 | 0.970 | 0.967 |
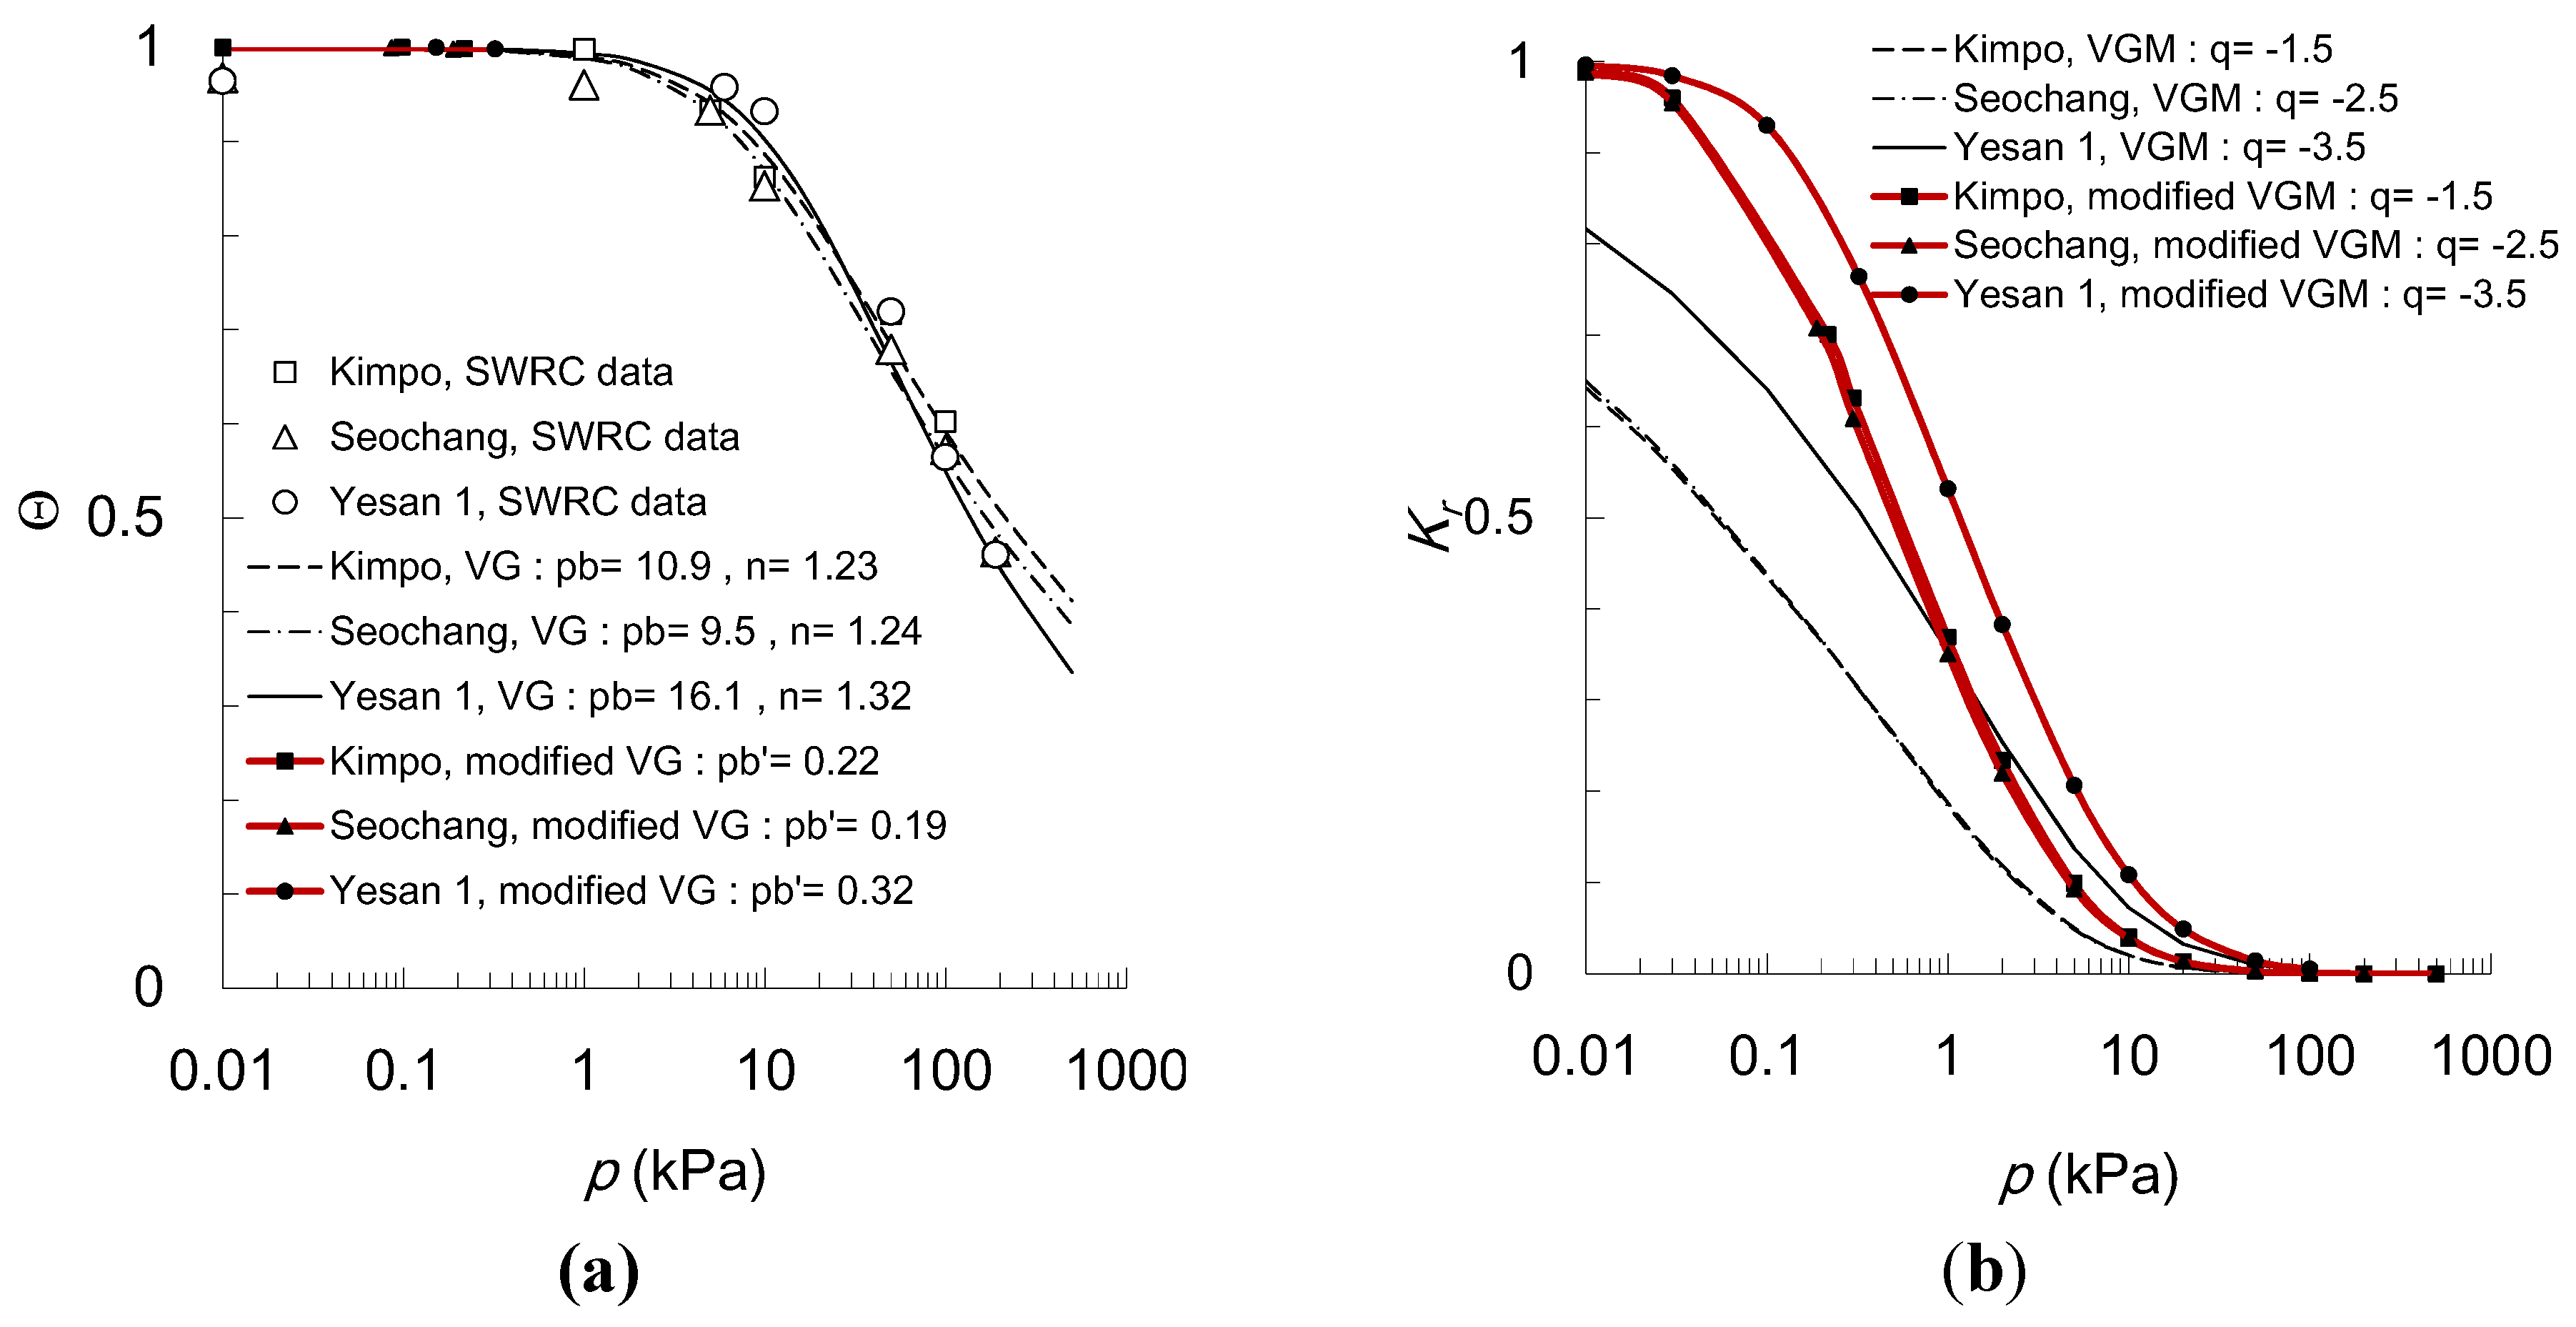
Figure 5 shows the SWRCs and HCs of group A-1 (
n < 1.5,
pb ≥ 5 kPa): Kimpo, Seochang and Yesan 1 samples. In the VG fits,
n = 1.23–1.32 and
pb = 9.5–16.1 kPa, while θ
s = 0.25–0.40 and θ
r = 0. The three measured SWRCs described by the effective saturation are similar because of the similar
n and
pb values. In the modified SWRCs,
pbʹ =
pb/50 or 0.19–0.32 kPa. The modified VG model fitted differently to the VG model just in the region where the matric suction is less than
pbʹ.
Figure 5a shows the modified VG fit when
p <
pbʹ. In the SWRCs of
Figure 5a, the VG model fits the measured data quite accurately on three samples of group A-1 and both models have an equivalent ability to fit the experimental SWRCs.
Figure 5.
Comparison of the VGM model with the modified model in Group A-1: (a) soil water retention curves (the measured data are shown by points, and the modified VG curve by lines with point when p < pbʹ); (b) hydraulic conductivities.
Figure 5.
Comparison of the VGM model with the modified model in Group A-1: (a) soil water retention curves (the measured data are shown by points, and the modified VG curve by lines with point when p < pbʹ); (b) hydraulic conductivities.
Kr was calculated using Equations (12)–(15), and the modified models were compared with the VGM HC models on Kimpo, Seochang and Yesan 1 samples (
Figure 5b). The
Kr function was calculated from the SWRC curve. The parameter
q was evaluated to fit HC data as −3.5–−1.5. The SWRCs in
Figure 5a incorporates the small difference in a suction less than
pbʹ but
Kr for the modified models is clearly greater than that for the VGM models. Near saturation,
Kr = 1 in the modified VGM model, whereas
Kr is reduced at a suction less than 0.01 kPa in the VGM model. The difference between the two models is 18%–37% at 0.01 kPa, which increases with decreasing
n.
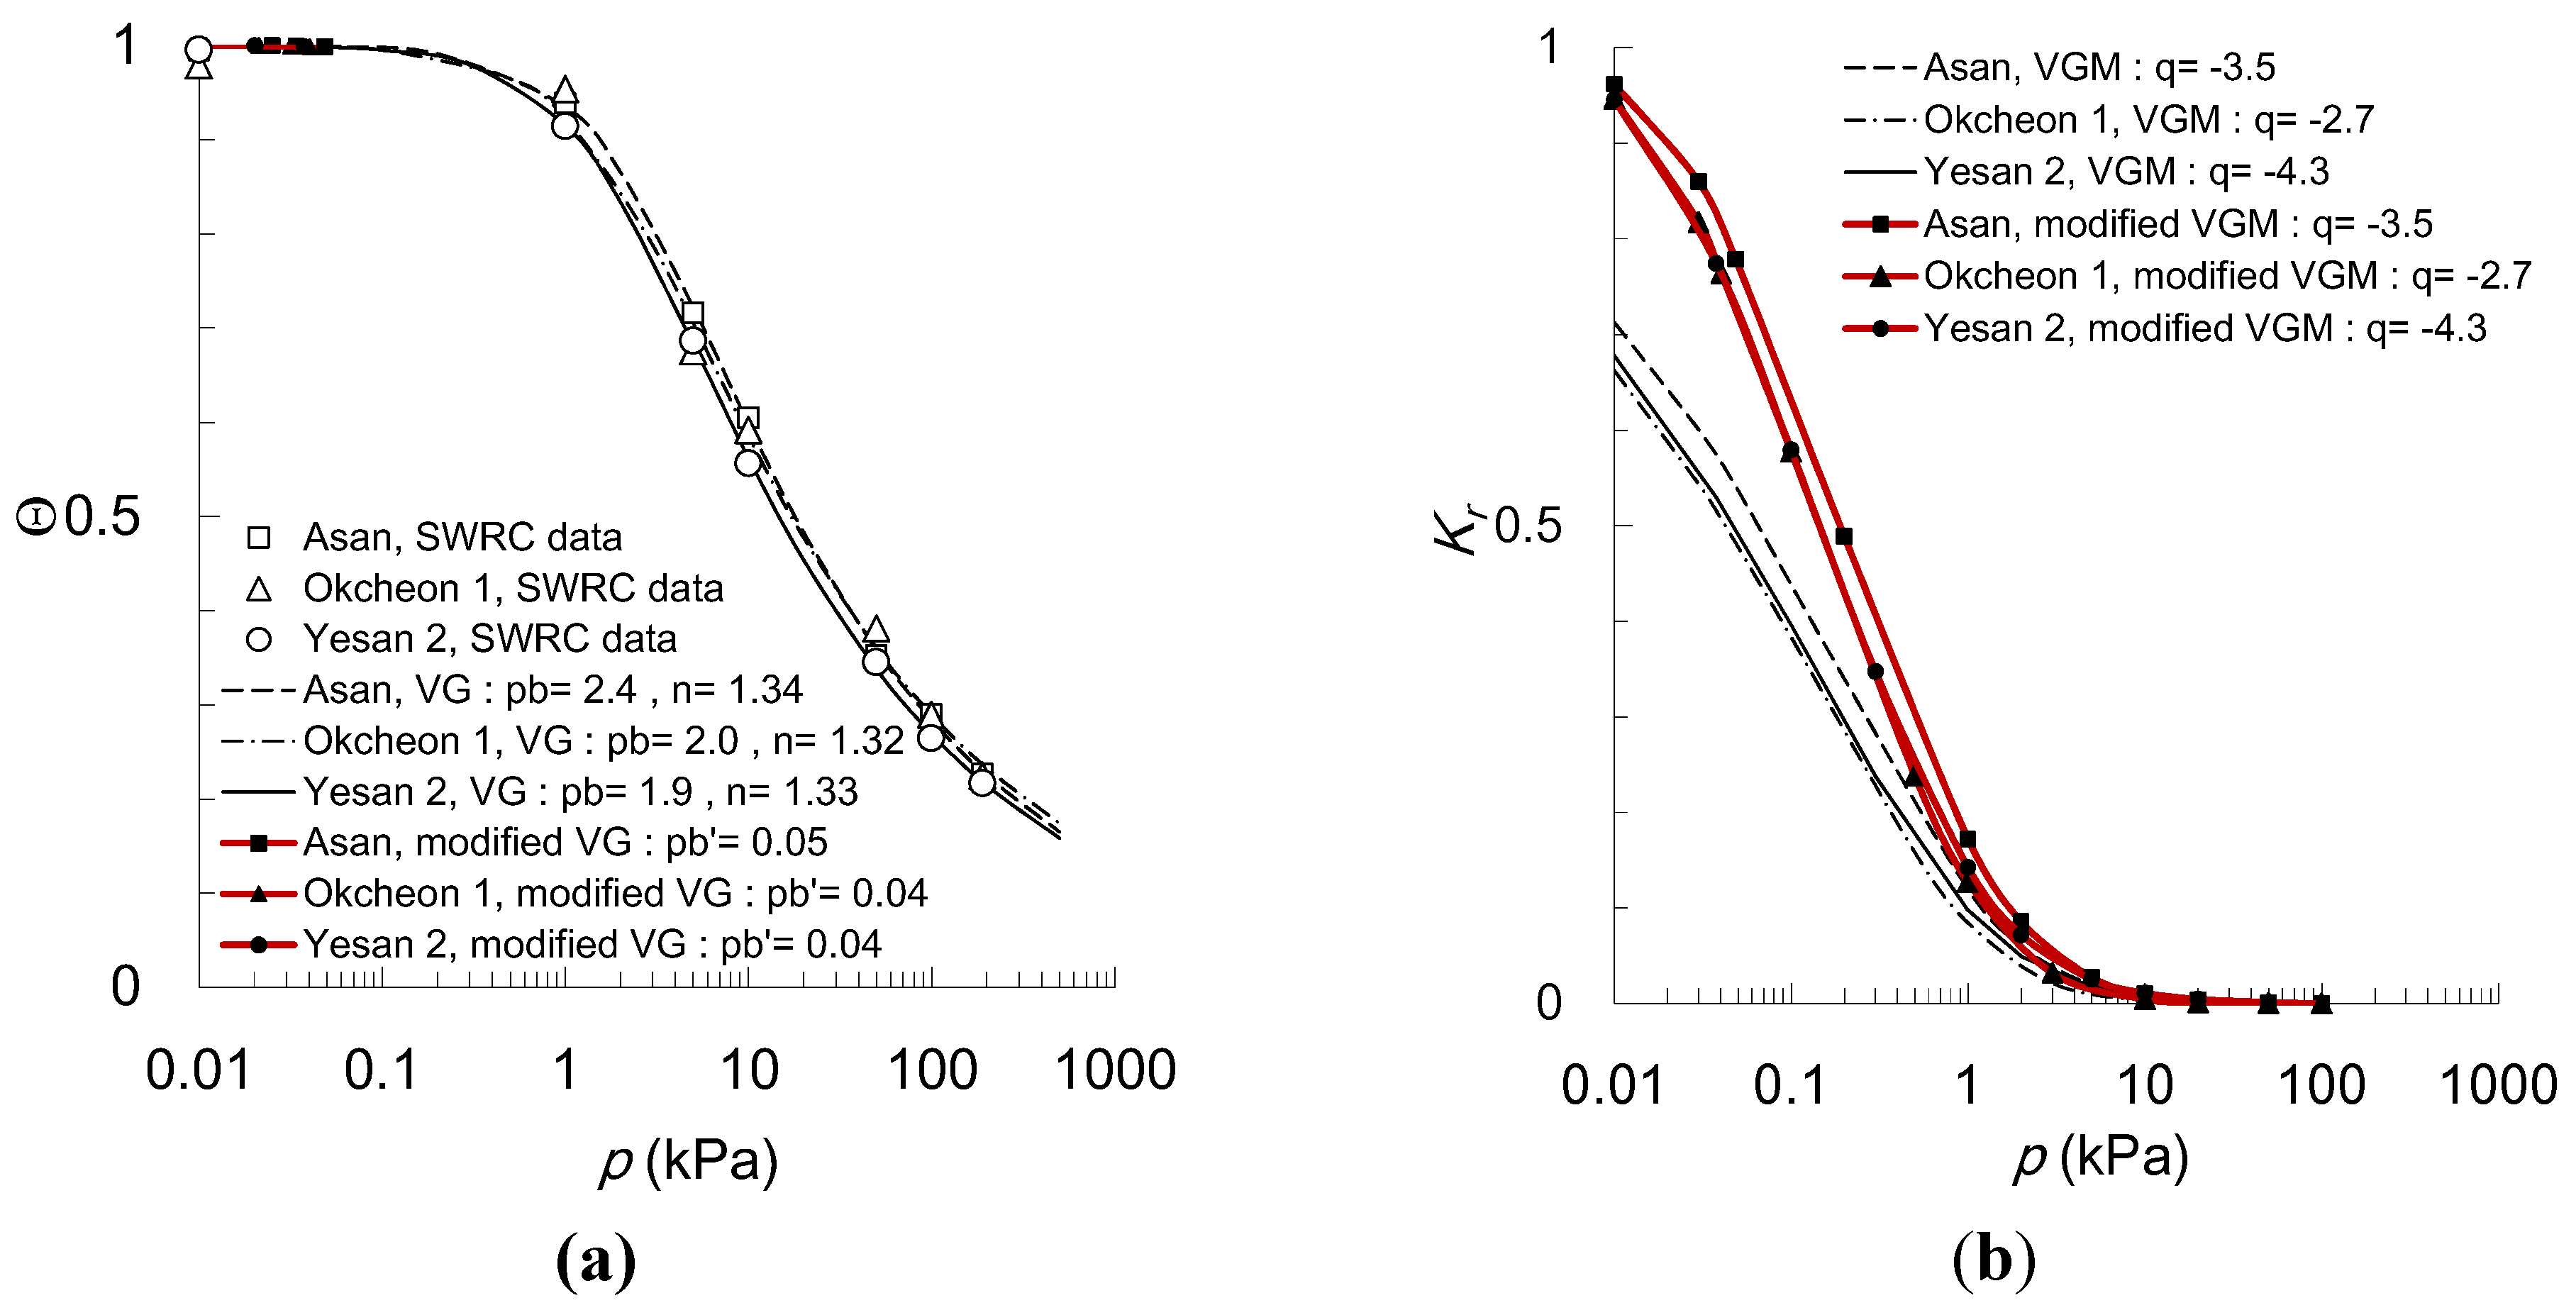
As shown in
Figure 6, the SWRCs for group A-2 (
n < 1.5,
pb < 5 kPa) are used to predict the relative HC in Asan, Okcheon 1 and Yesan 2 samples. Both the VG model and the modified VG model can fit the measured SWRCs accurately, in which the parameters of the three samples to fit SWRCs are quite similar;
n = 1.32–1.34,
pb = 1.9–2.4 kPa and
pbʹ = 0.04–0.05 kPa. θ
s, θ
r and
q were evaluated to be 0.25–0.37, 0.05–0.13 and −4.3–−2.7, respectively. In
Figure 6b, the VGM models for the three samples also showed an abrupt decrease in
Kr, which were less than the modified VGM model by ~25% at suction of 0.01 kPa. Because
pb in group A-2 is smaller than that in group A-1, the gradient of the
Kr function to the matric suction in
Figure 6b is greater than that in
Figure 5b.
Figure 6.
Comparison of the VGM model with the modified model in Group A-2: (a) soil water retention curves (The measured data are shown by points, and the modified VG curve by lines with point when p < pbʹ); (b) hydraulic conductivities.
Figure 6.
Comparison of the VGM model with the modified model in Group A-2: (a) soil water retention curves (The measured data are shown by points, and the modified VG curve by lines with point when p < pbʹ); (b) hydraulic conductivities.
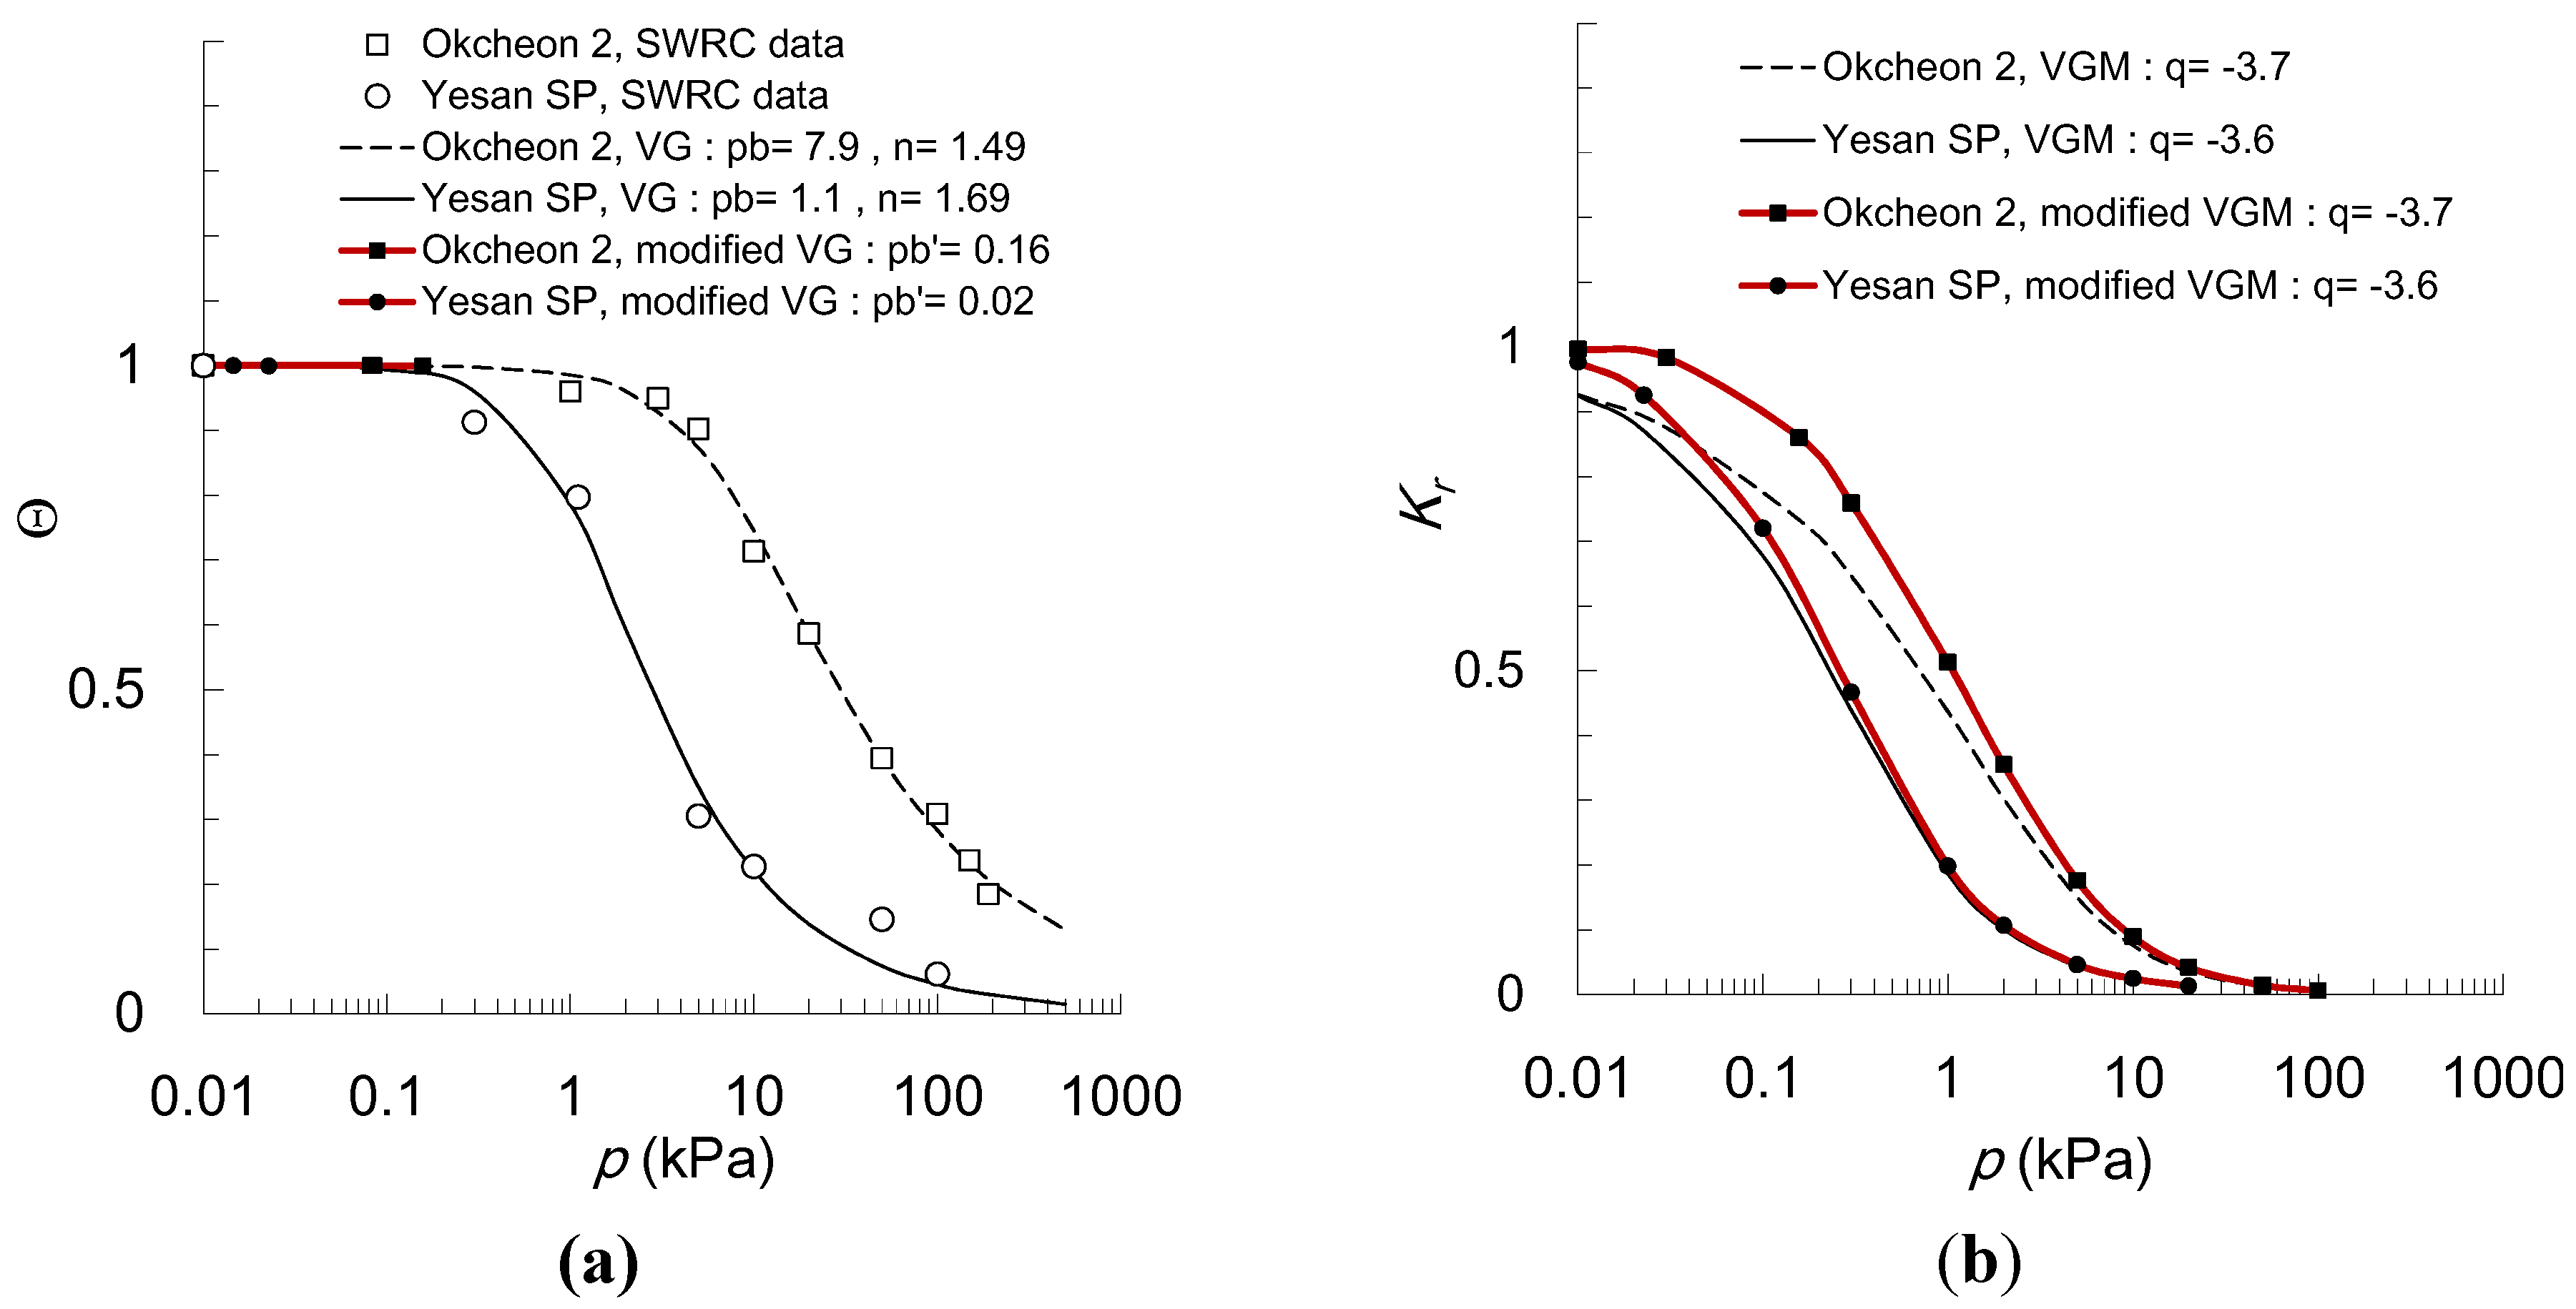
As shown in
Figure 7, the SWRCs (
Figure 7a) for group B (
n ≥ 1.5 are shown with the relative HC (
Figure 7b) in Okcheon 2 and Yesan SP samples. Both the VG model and the modified VG model can fit the measured SWRCs accurately;
n = 1.50 and 1.69,
pb = 1.1 and 7.9 kPa, θ
s = 0.33 and 0.46, θ
r = 0.14 and 0.18, and
q = −3.7–−3.6, respectively. The data on the SWRCs were measured within a matric suction less than 200 kPa, which is far from the actual suction at the residual water content. Therefore, θ
r (
Table 2) increased with increasing gradient of the SWRCs or
n to optimize the SWRC fit. Near saturation,
Kr ≈ 1 in both the modified VGM model and the VGM model, where
Kr is reduced by 10% at most in group B. Therefore, the VGM model estimates
Kr similar to the modified VGM model.
Figure 7.
Comparison of the VGM model with the modified model in Group B: (a) soil water retention curves (The measured data are shown by points, and the modified VG curve by lines with point when p < pbʹ); (b) hydraulic conductivities.
Figure 7.
Comparison of the VGM model with the modified model in Group B: (a) soil water retention curves (The measured data are shown by points, and the modified VG curve by lines with point when p < pbʹ); (b) hydraulic conductivities.
In groups A-1 and A-2, the prediction of Kr by the VGM model decreases abruptly near saturation. In such cases, the VGM model induces abnormal oscillation or divergence of the solutions in the numerical analysis near saturation. On the other hand, in group B, i.e., n > 1.5, there was a smaller decrease in Kr in the initial part of the VGM model.
5. Comparison of HCs of the Modified VGM Model with the Measured Data
Mualem’s model [
2] incorporates an empirical parameter,
q, accounting for the tortuosity and connectivity to predict the actual hydraulic conductivity, which is commonly assumed to be 0.5. On the other hand, many studies examined a range of values of the tortuosity parameter in the fit of the actual data [
4,
22,
23,
24], which is frequently negative [
25]. The parameter,
q, was estimated to be −1.5–−4.3 (−3.2 in average) in
Table 2, which was obtained directly from the experimental data for Korean residual soils.
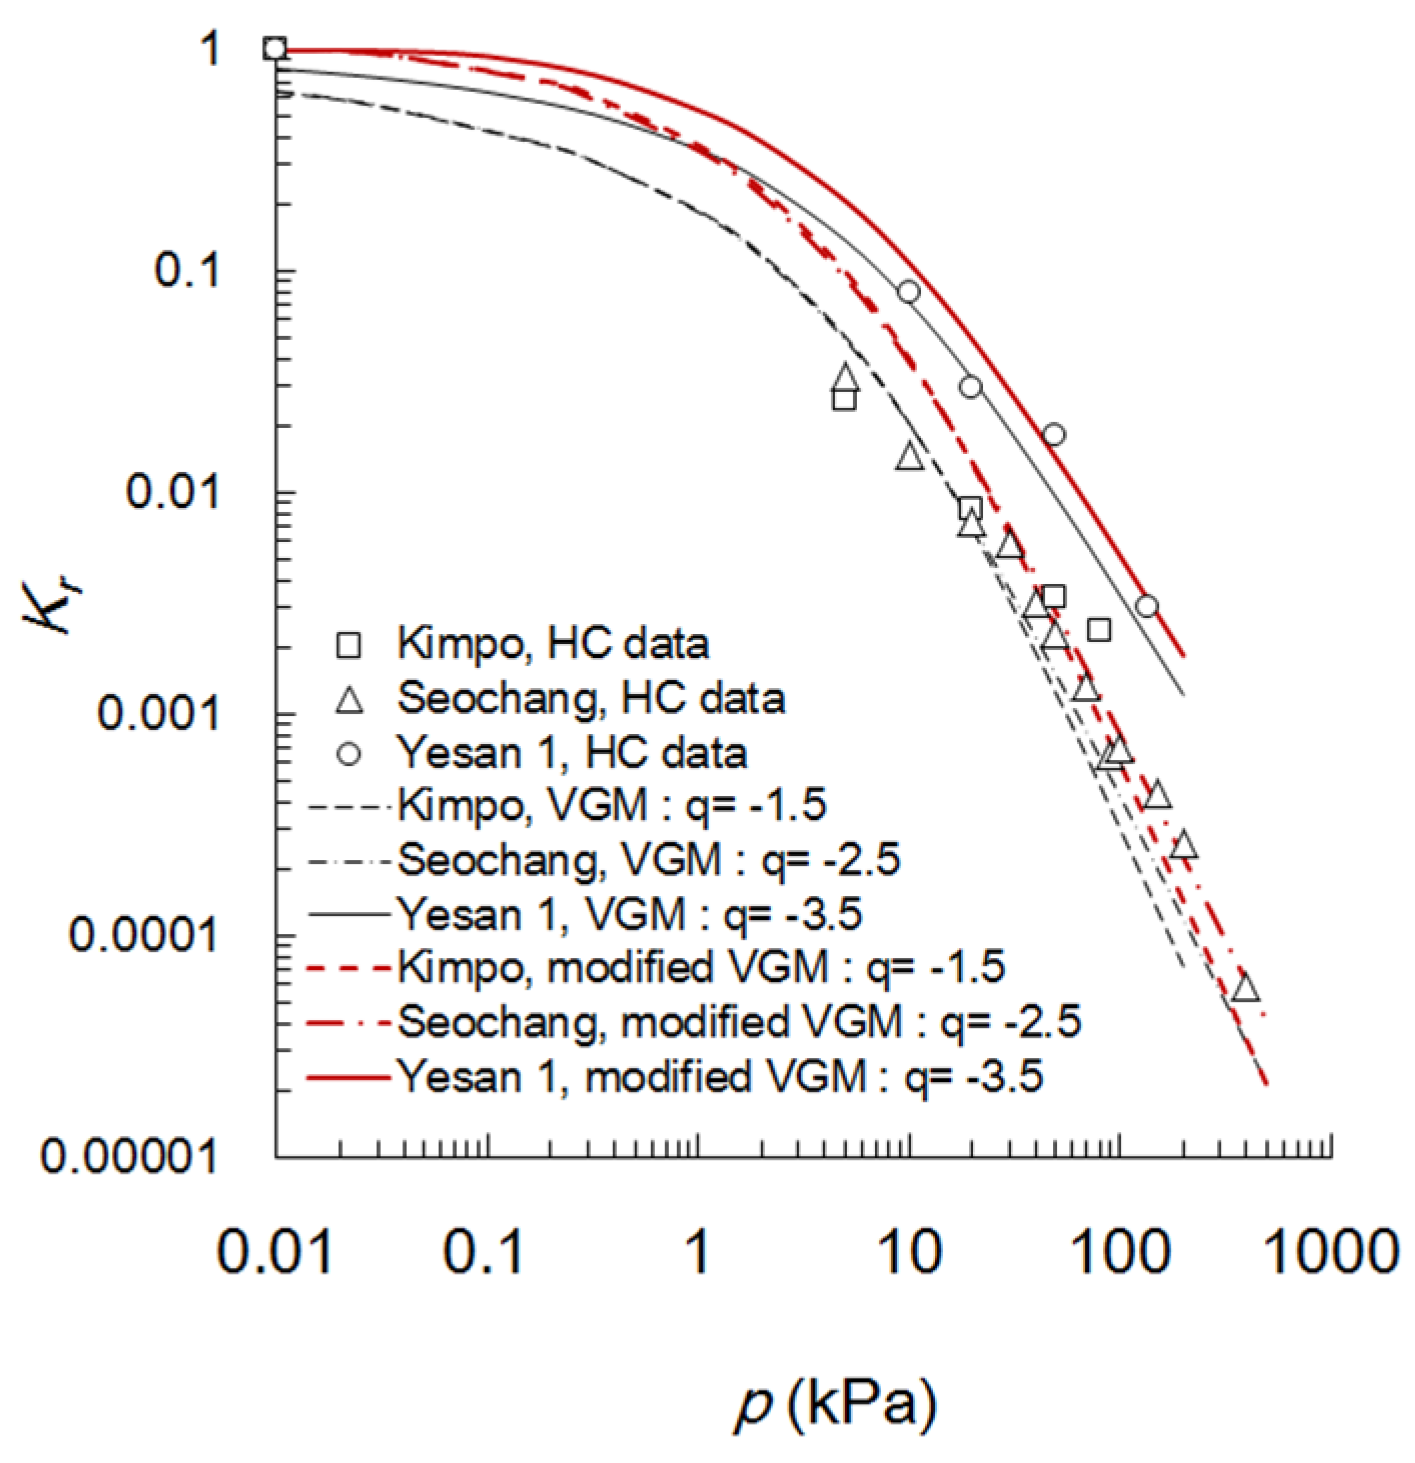
Figure 8 shows the
Kr predicted by both the original and the modified VGM models for group A-1 (
n < 1.5,
pb ≥ 5kPa), where
q was −2.5 on average. The goodness of fit of both models are compared in terms of the correlation coefficient
R2 for log
Kr (
Table 2). Using the modified model, the measured
Kr was predicted quite accurately for Yesan 1 sample (
n = 1.32,
R2 = 0.98 in
Table 2). Because the SWRCs of Kimpo (
n = 1.23) and Seochang (
n = 1.24) samples are similar, as shown in
Figure 5a, the measured data of the unsaturated HC were predicted well as similar curves using the modified VGM model (
R2 = 0.64 for Kimpo and
R2 = 0.97 for Seochang). The VGM model could predict the measured HC equivalently to the modified model (
R2 = 0.70–0.97 for group A-1), but underestimated the nearly saturated
Kr (~1.0) and subsequently the unsaturated part of the
Kr data compared to the modified model.
Figure 8.
Comparison of the measured hydraulic conductivities with the modified model in Group A-1.
Figure 8.
Comparison of the measured hydraulic conductivities with the modified model in Group A-1.
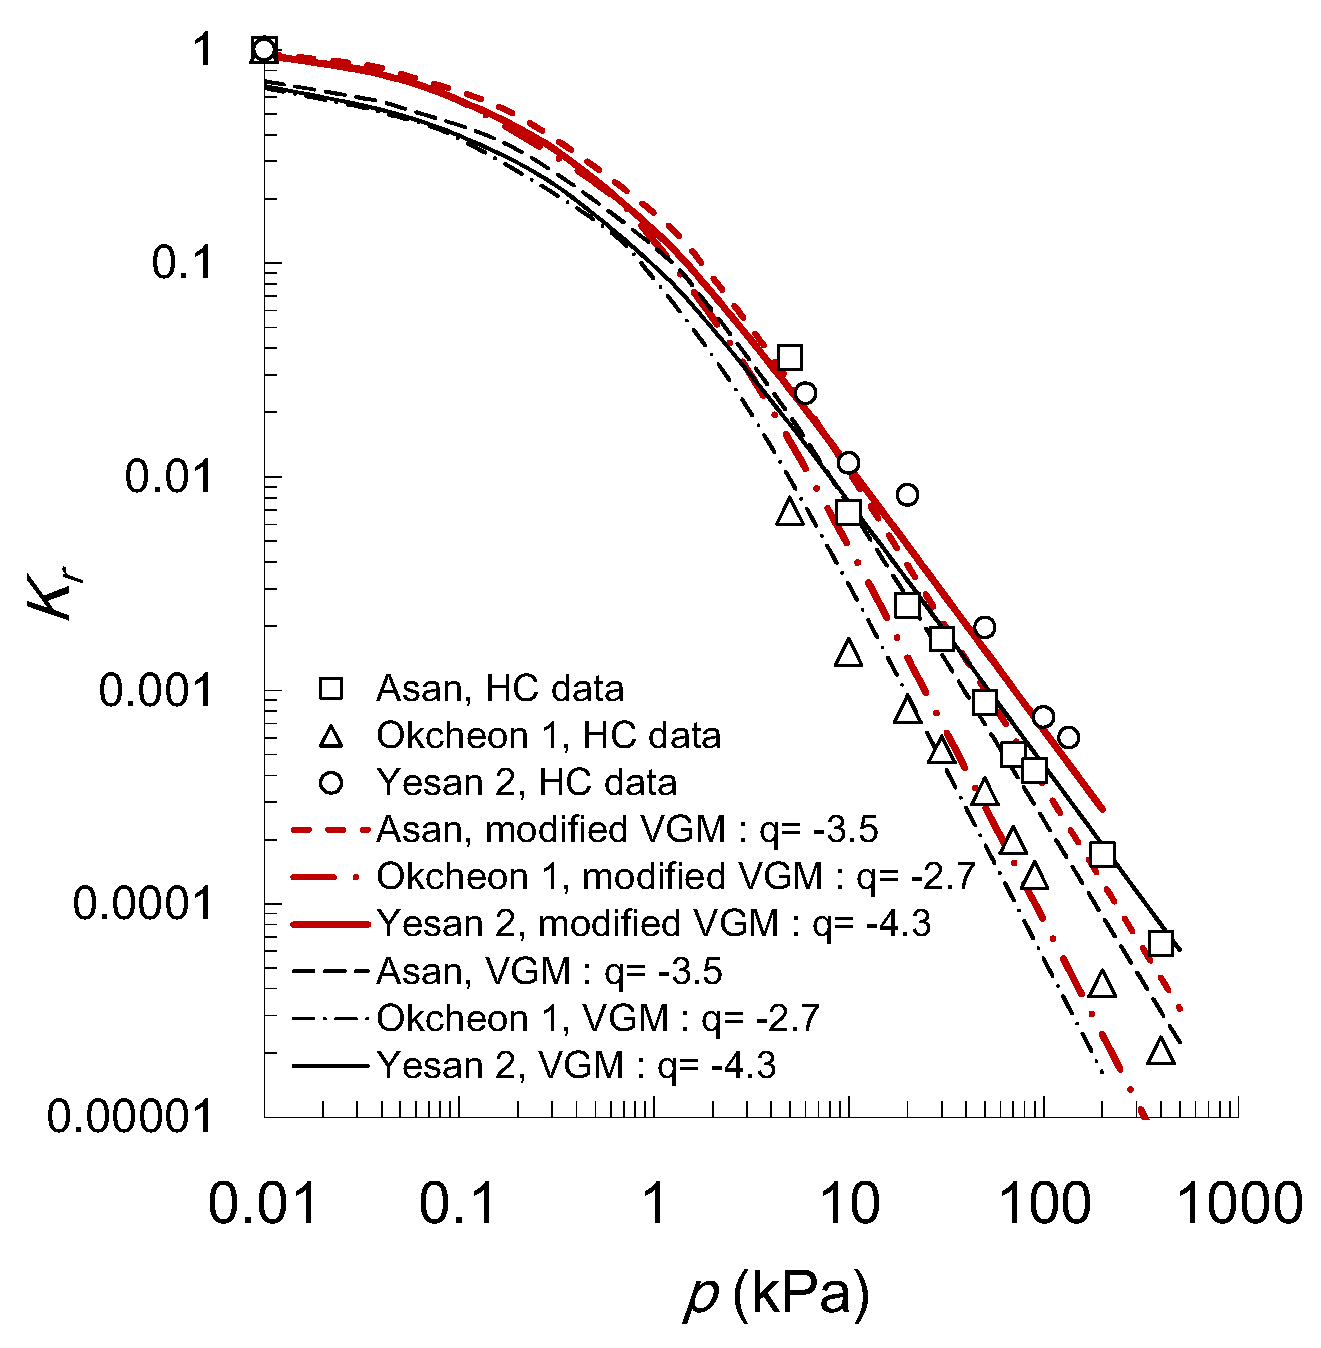
In group A-2 (
n < 1.5,
pb < 5 kPa) in
Figure 9, the measured
Kr was also predicted quite well by the modified model for Asan (
R2 = 0.99 in
Table 2), Okcheon 1 (
R2 = 0.96) and Yesan 2 (
R2 = 0.99) samples. The VGM model could predict the measured HC fairly (
R2 = 0.94–0.98 for group A-2), but underestimated the saturated and the unsaturated parts of the
Kr data compared to the modified model. Regarding the effects of
q on
Kr,
Kr increased with decreasing
q. Group A-2, which has a smaller
pb,
q (−3.5 on average), has a much stronger effect on HC than Group A-1. Therefore,
q contributes significantly to the prediction of
Kr. Yesan 2 sample in Group A-2 (
Figure 9) is compacted by the looser conditions and shows a higher
Kr for both the measurements and predictions than the Yesan 1 sample in Group A-1 (
Figure 8). Okcheon 2 sample is also looser than Okcheon 1 sample in Group A-2 (
Figure 9) and belongs to Group B (
Figure 10).
In group B (
n ≥ 1.5) in
Figure 10, the modified VGM model predicts the measured
Kr reasonably well for Okcheon 2 (
R2 = 0.92) and Yesan SP samples. The VGM model could predict similarly to the modified model (
R2 = 0.88–0.97 for group B) because
n > 1.5, and
Kr ~ 1.0 in the nearly saturated state. As shown in Equation (4),
Kr is multiplied by Θ
q, where Θ is deduced from the SWRC of each group. When
q is negative, Θ
q > 1.0 and increases with increasing
n. Group B showed the strongest effect of
q (−3.6 in average) on HC than Groups A-1 and A-2, because
n > 1.5.
Figure 9.
Comparison of the measured hydraulic conductivities with the modified model in Group A-2.
Figure 9.
Comparison of the measured hydraulic conductivities with the modified model in Group A-2.
Figure 10.
Comparison of the measured hydraulic conductivities with the modified model in Group B.
Figure 10.
Comparison of the measured hydraulic conductivities with the modified model in Group B.


