
Fault Tree Analysis of Trade-Offs between Environmental Flows and Agricultural Water Productivity in the Lake Urmia Sub-Basin Using Agent-Based Modeling


Abstract
:1. Introduction
2. Materials and Methods
2.1. LU
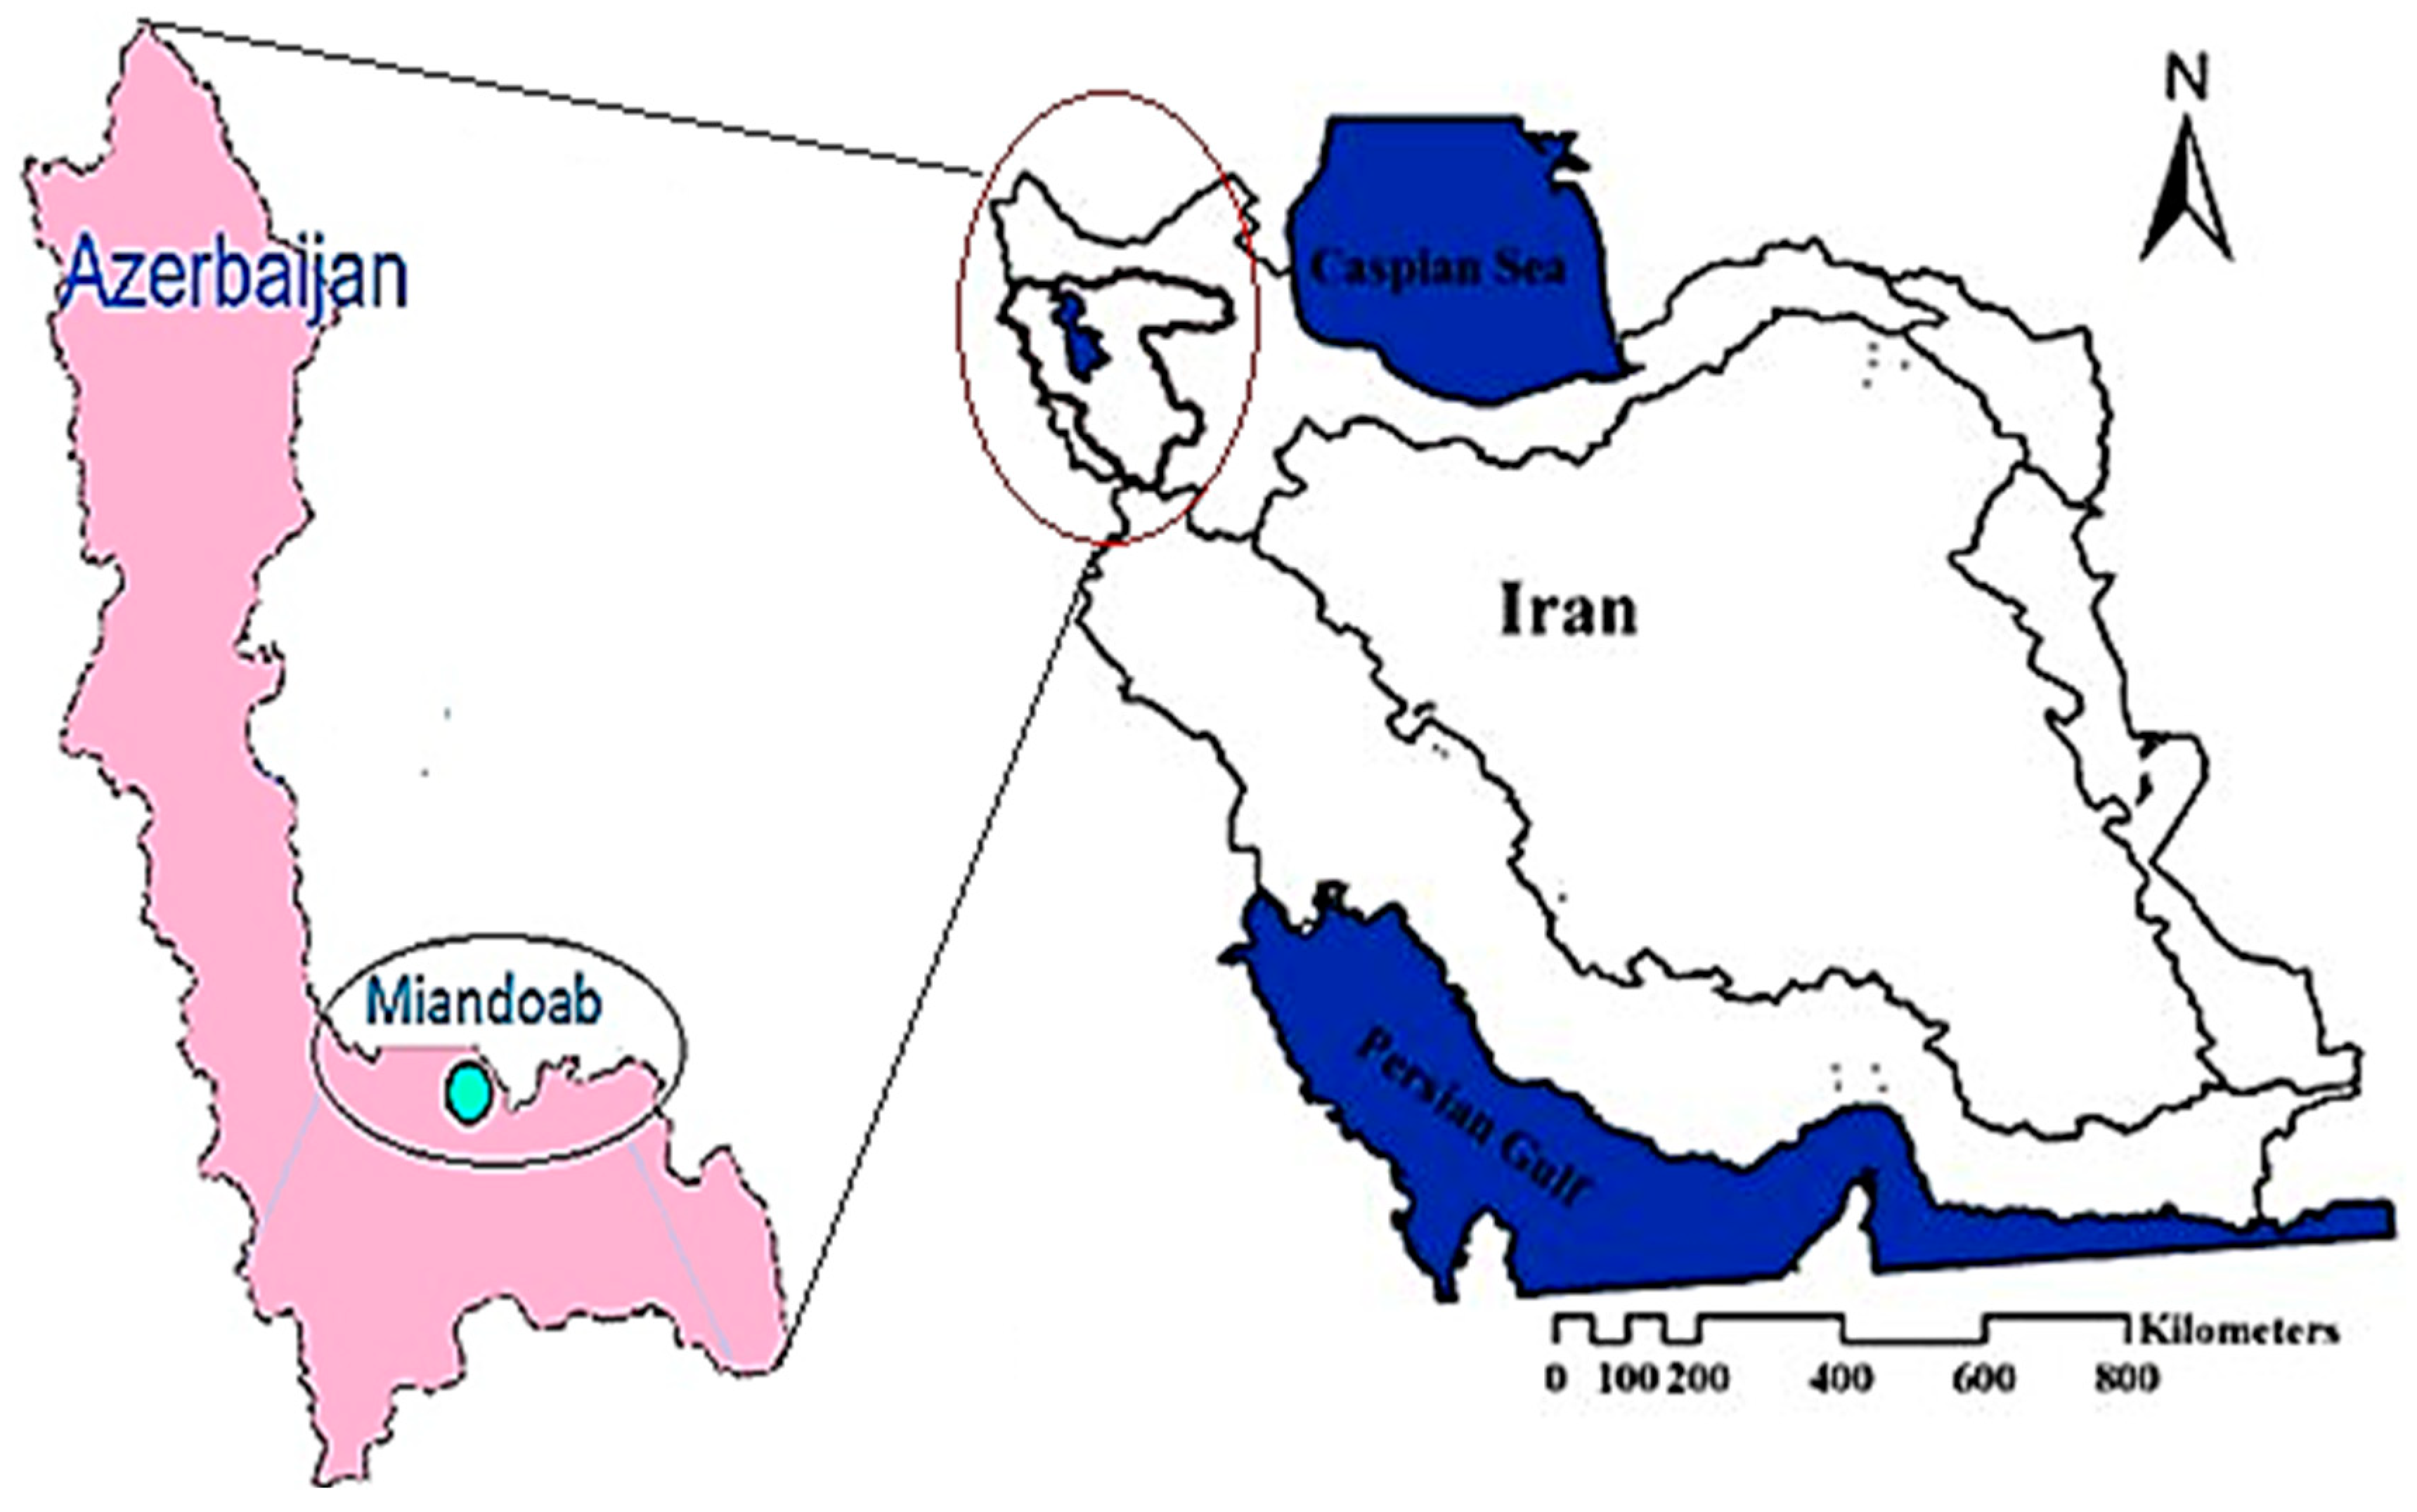
2.2. Miandoab Plain
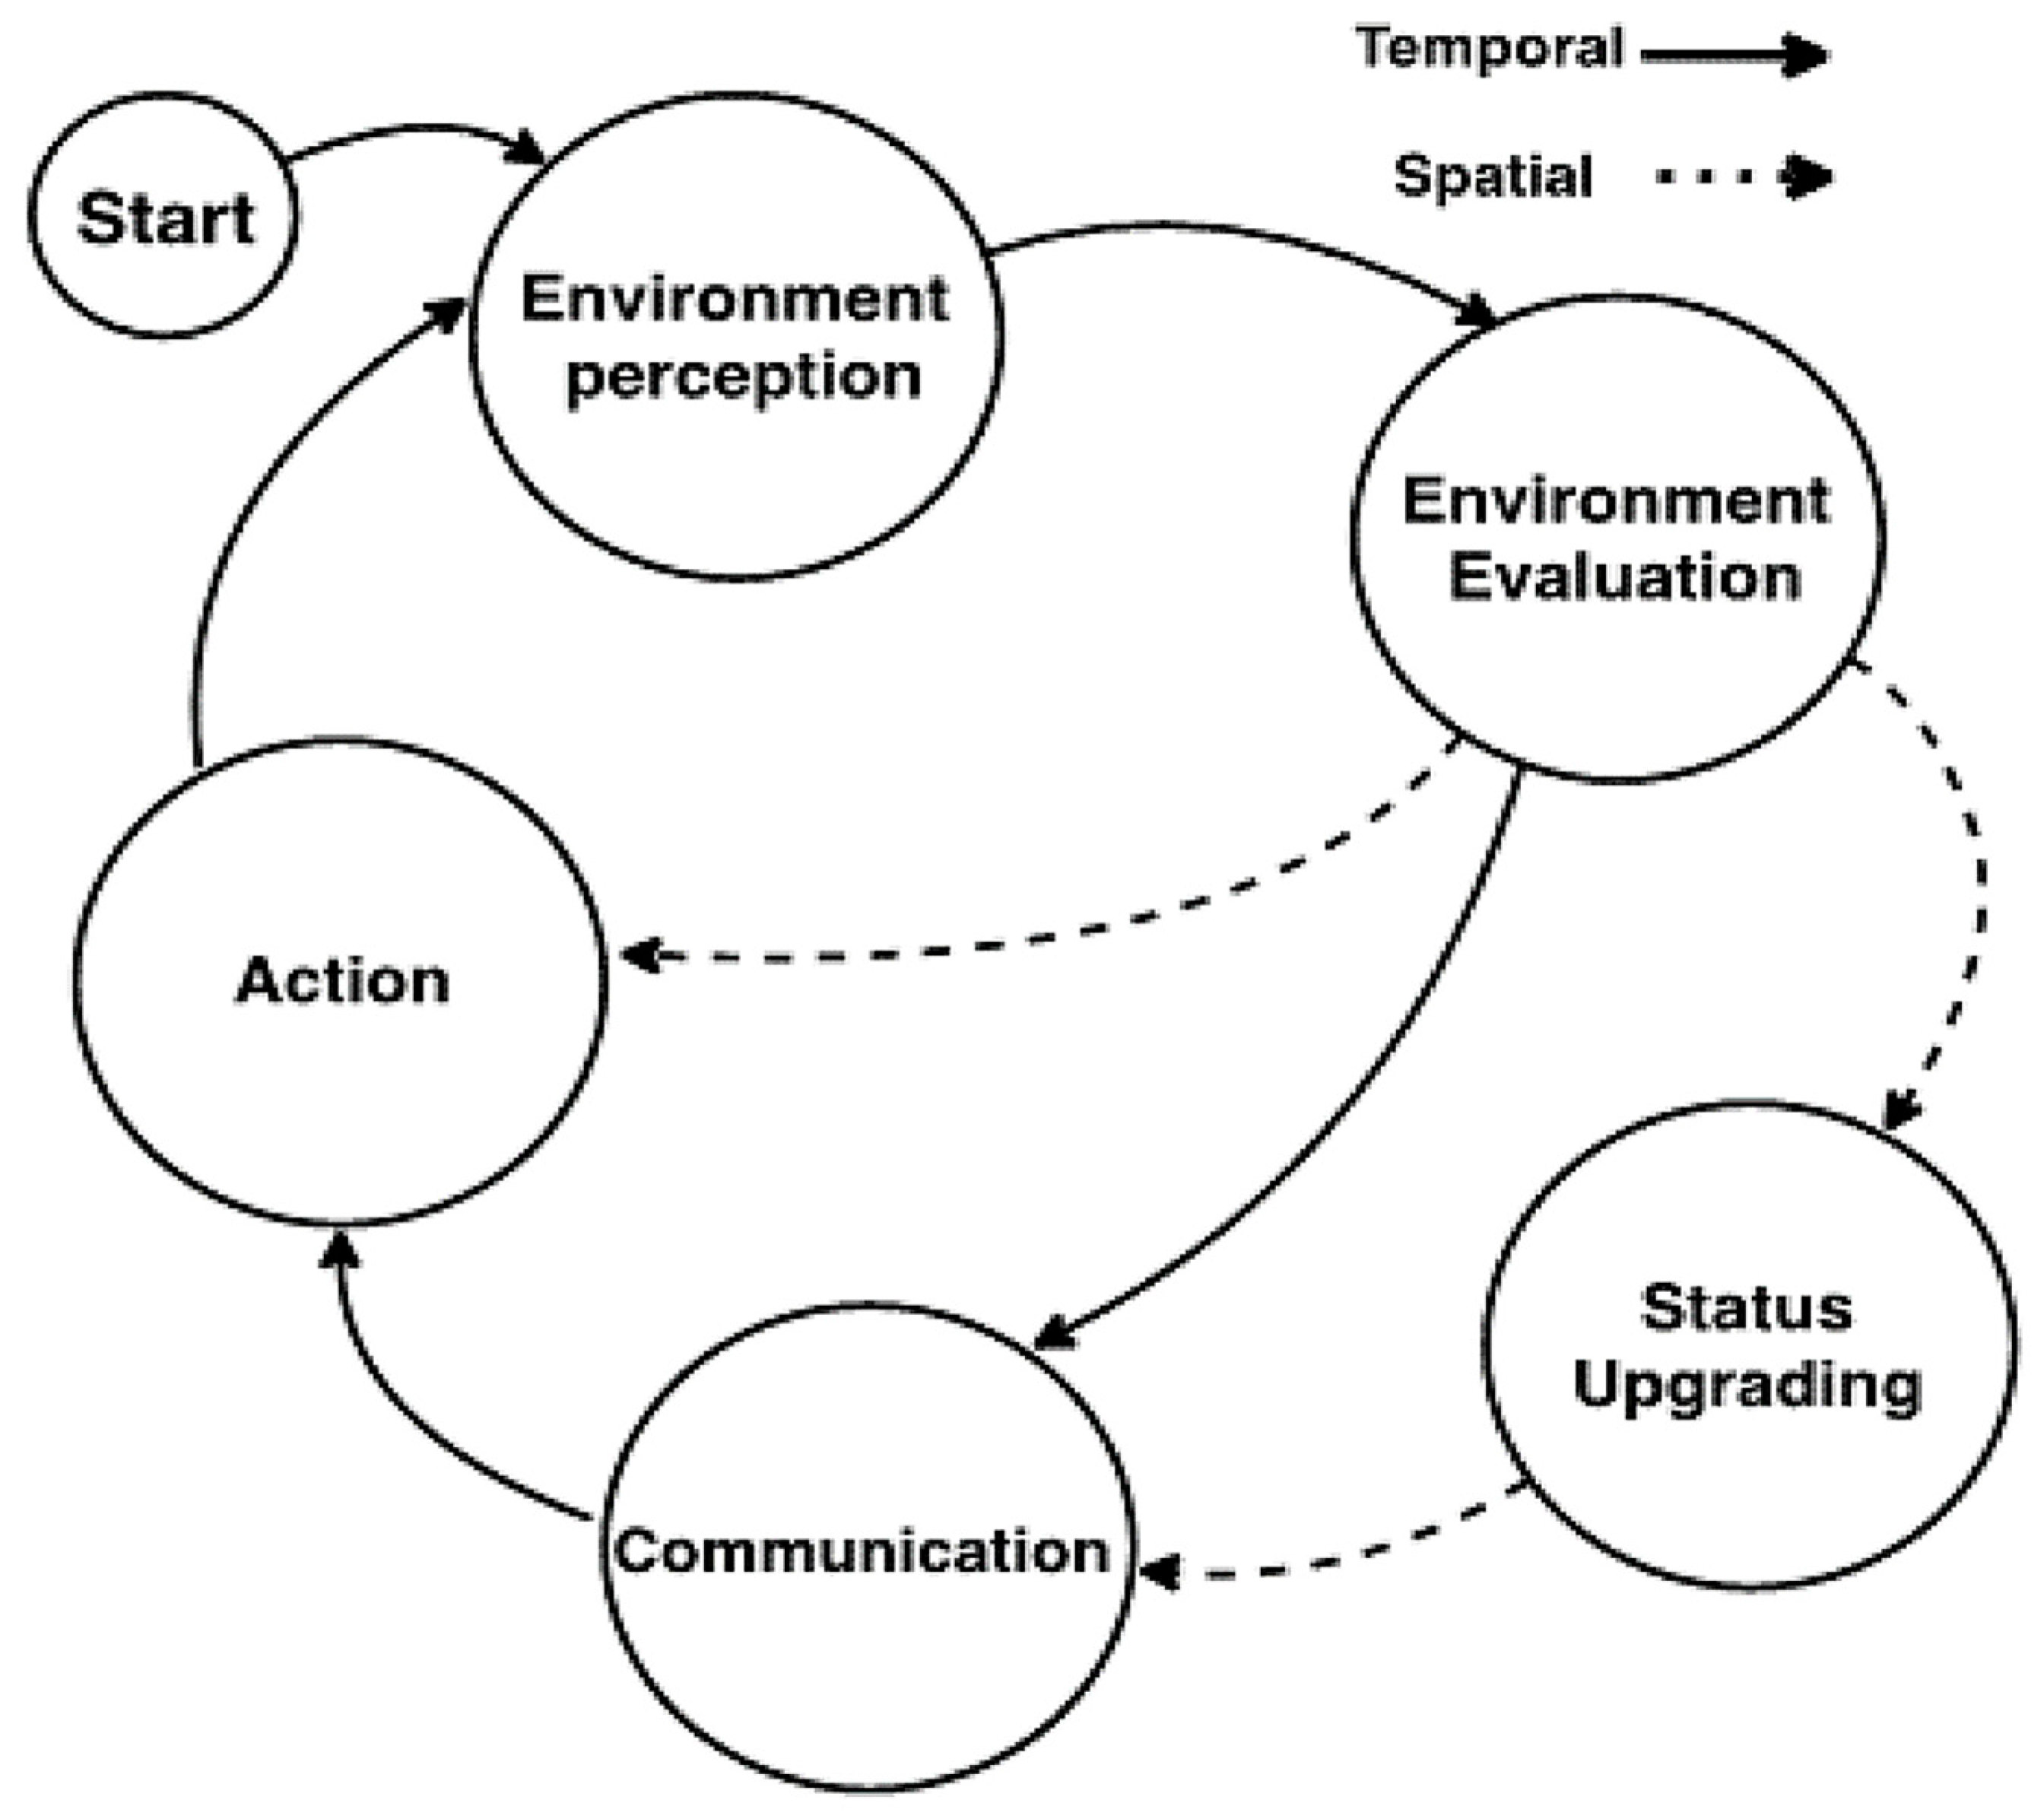
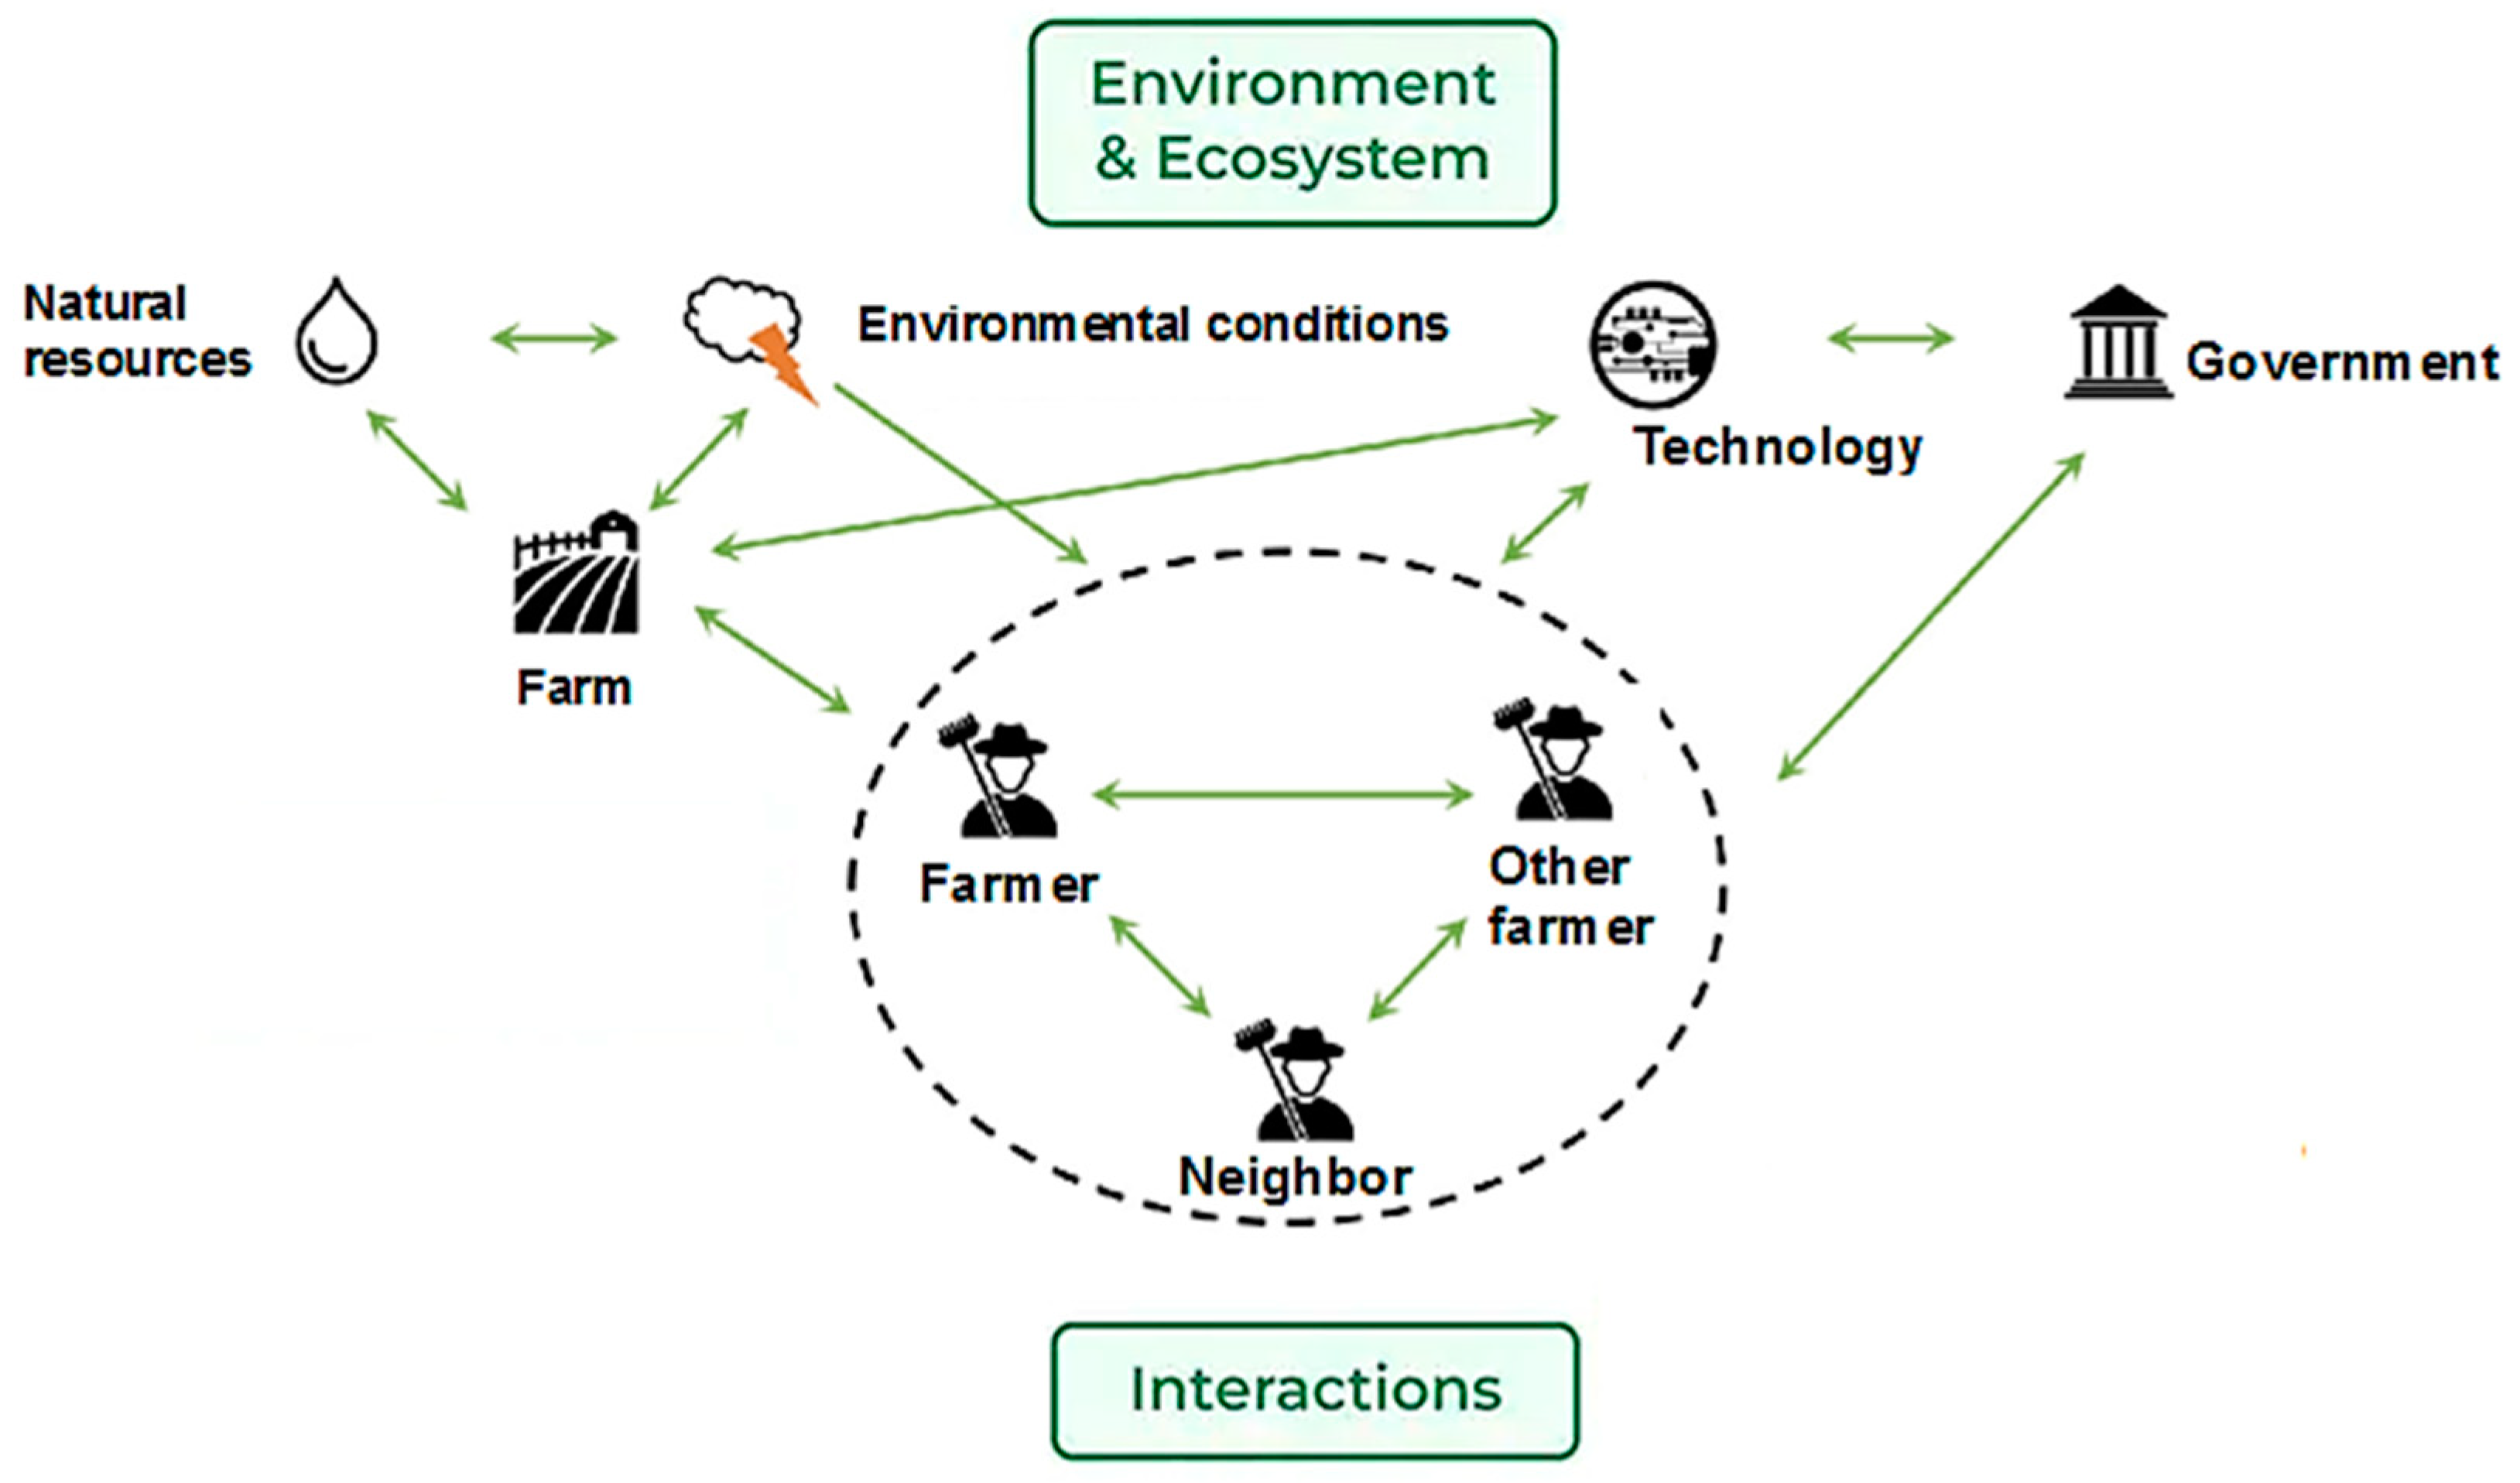
2.3. Agent-Based Modeling (ABM)
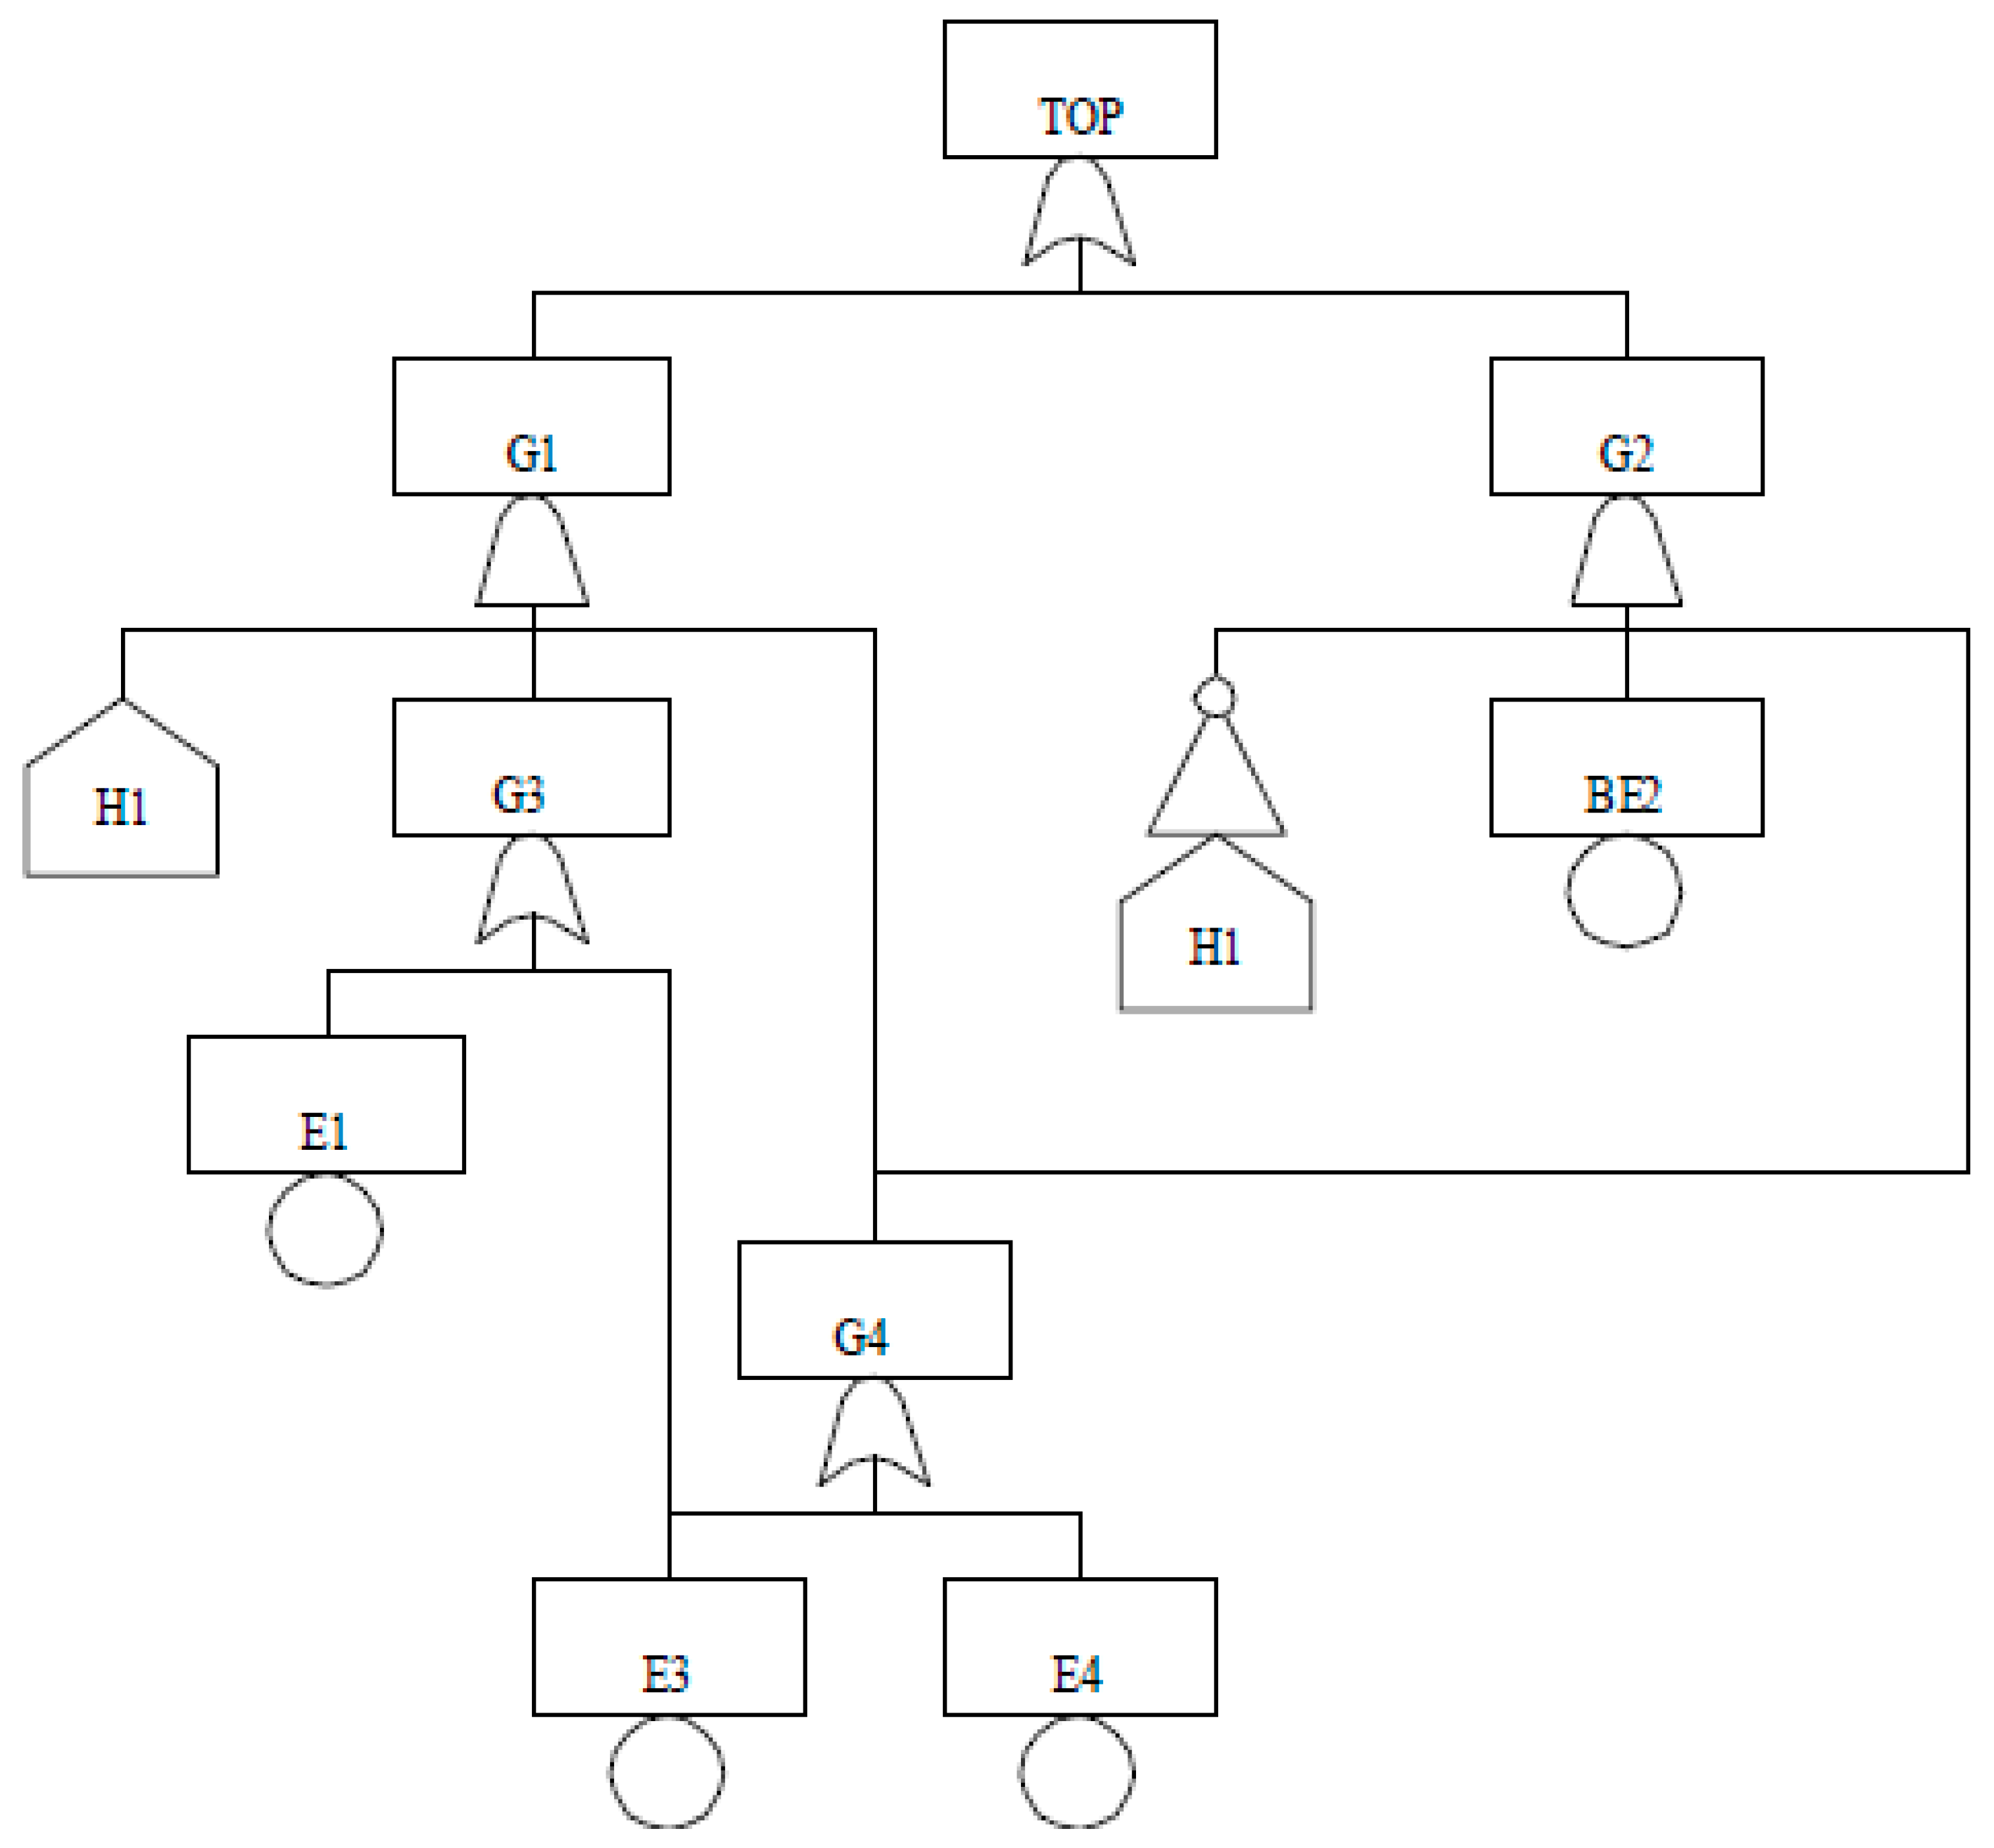
2.4. Fault Tree Analysis (FTA)
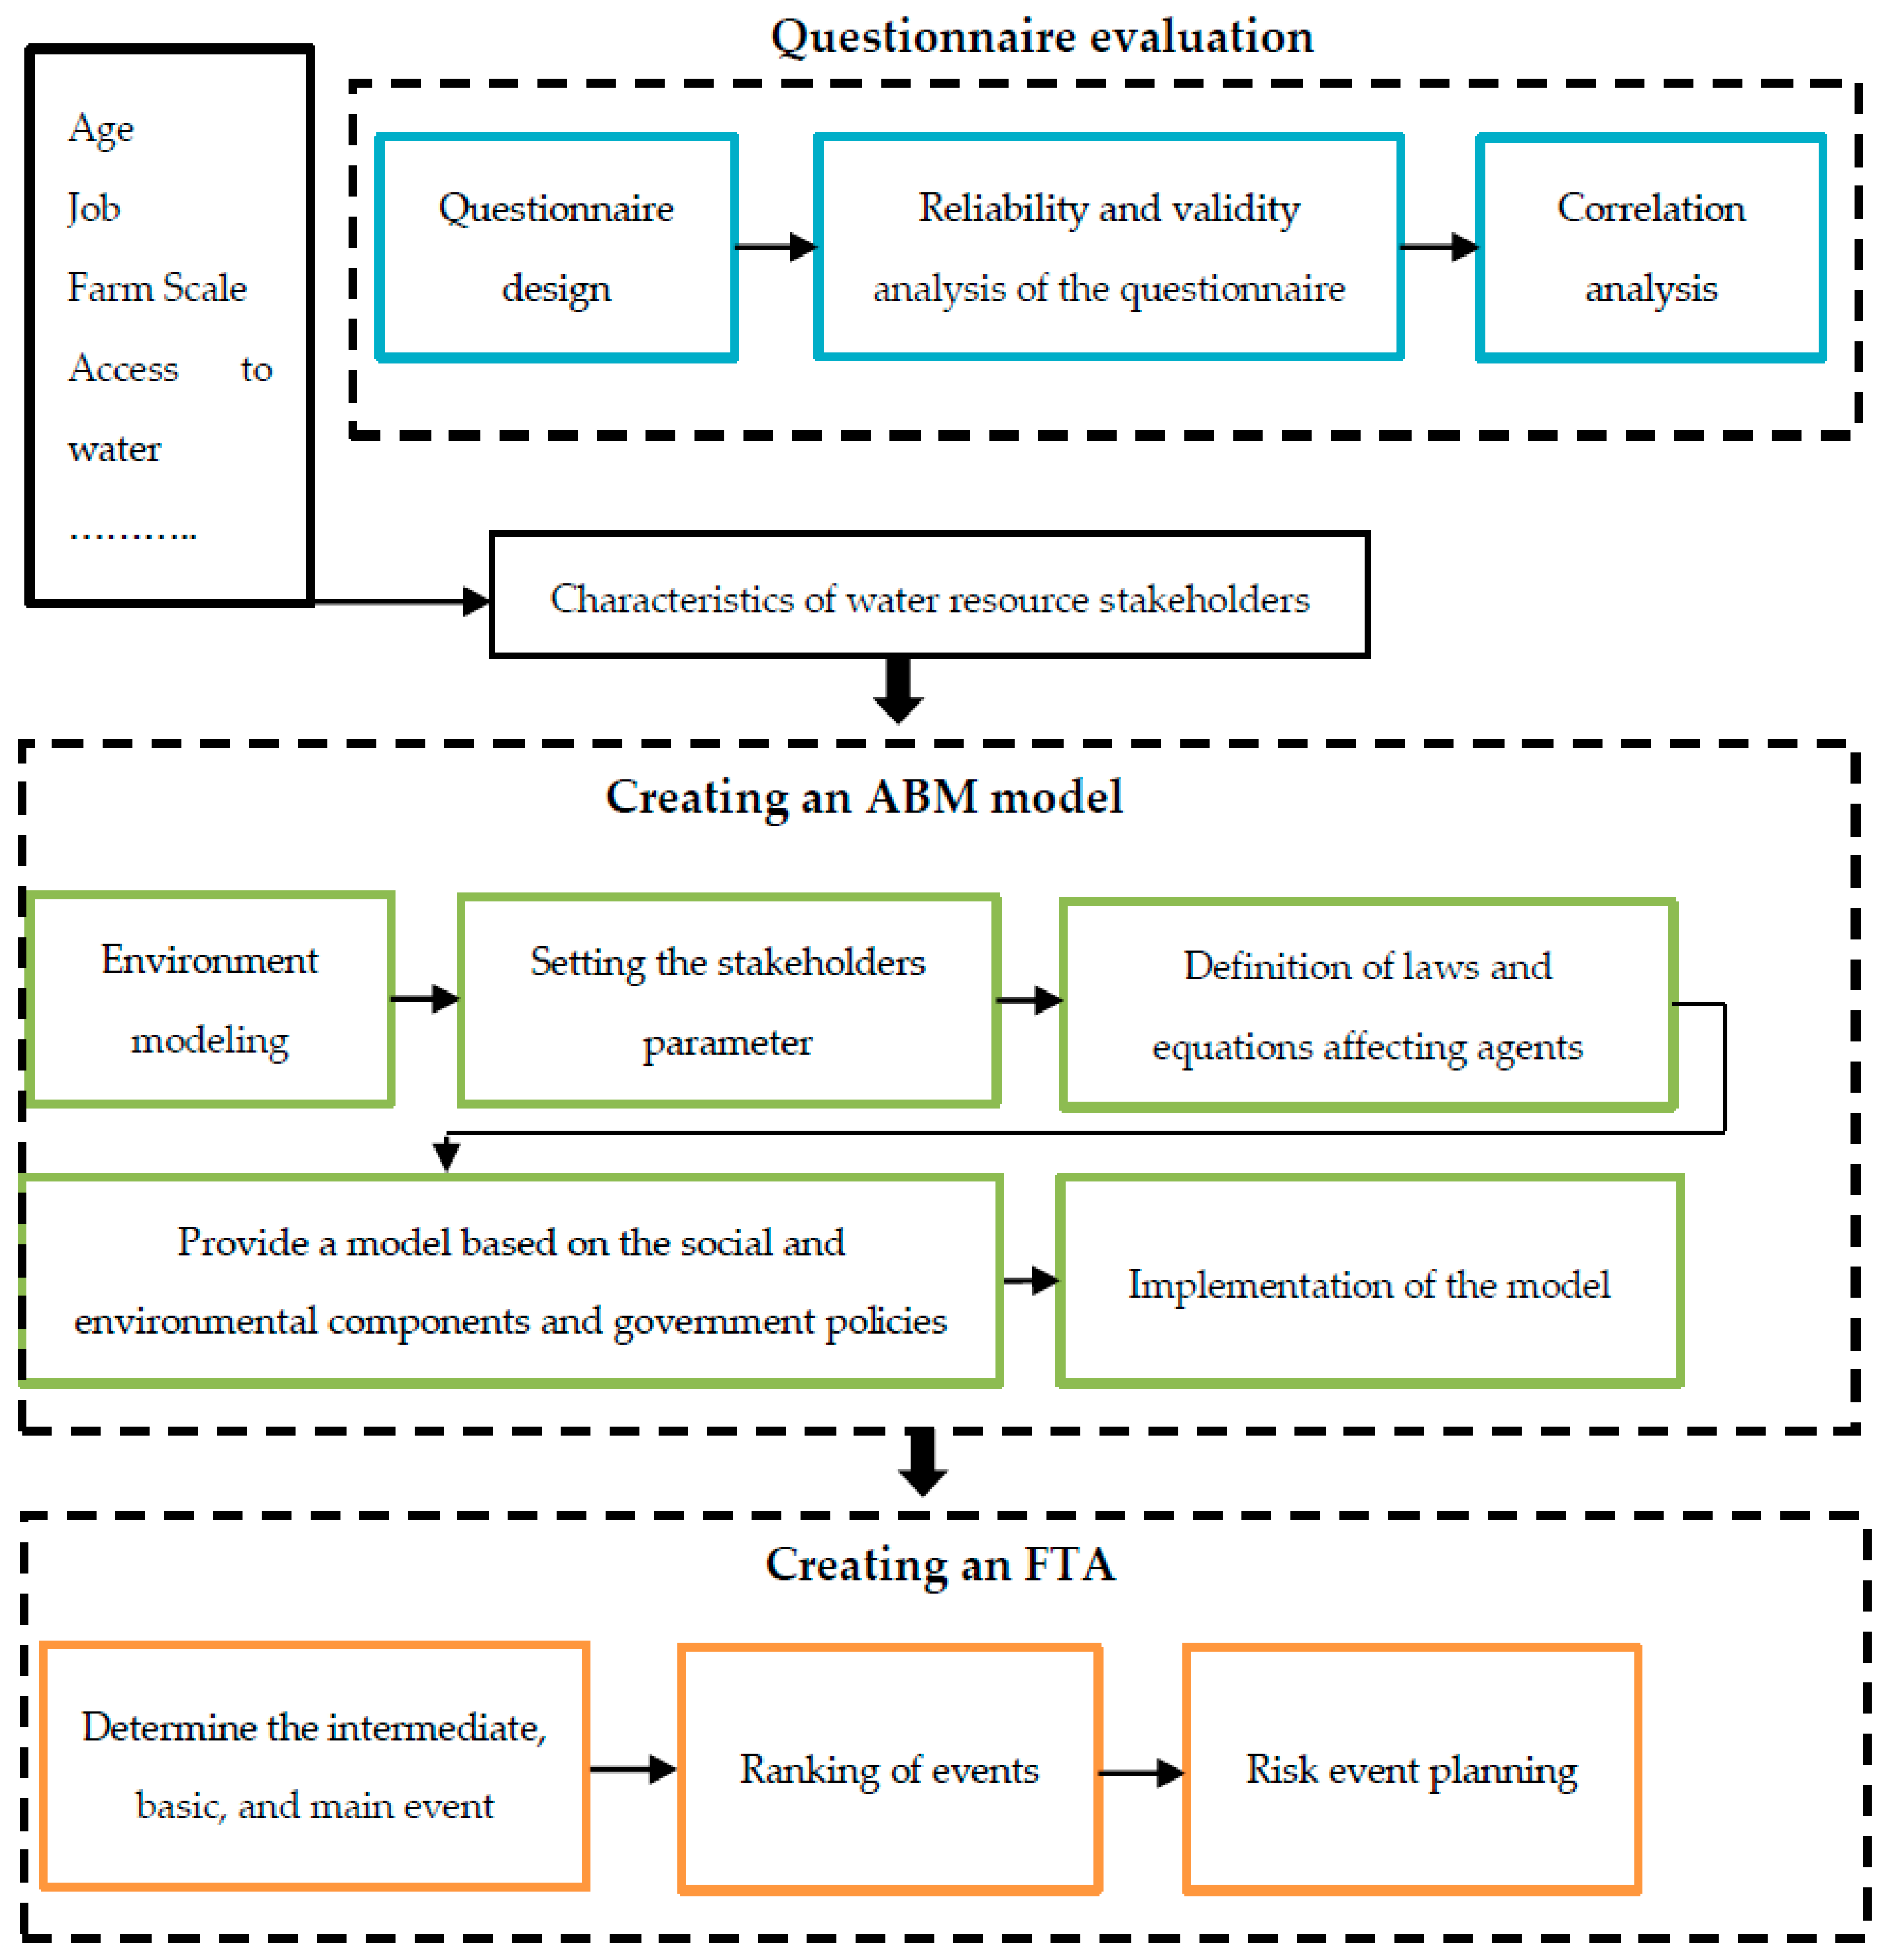
3. Methodology
3.1. Designed ABM Model
3.2. Model Description
3.2.1. Farmer Agent
3.2.2. Government Agent
3.2.3. Questionnaire Investigation
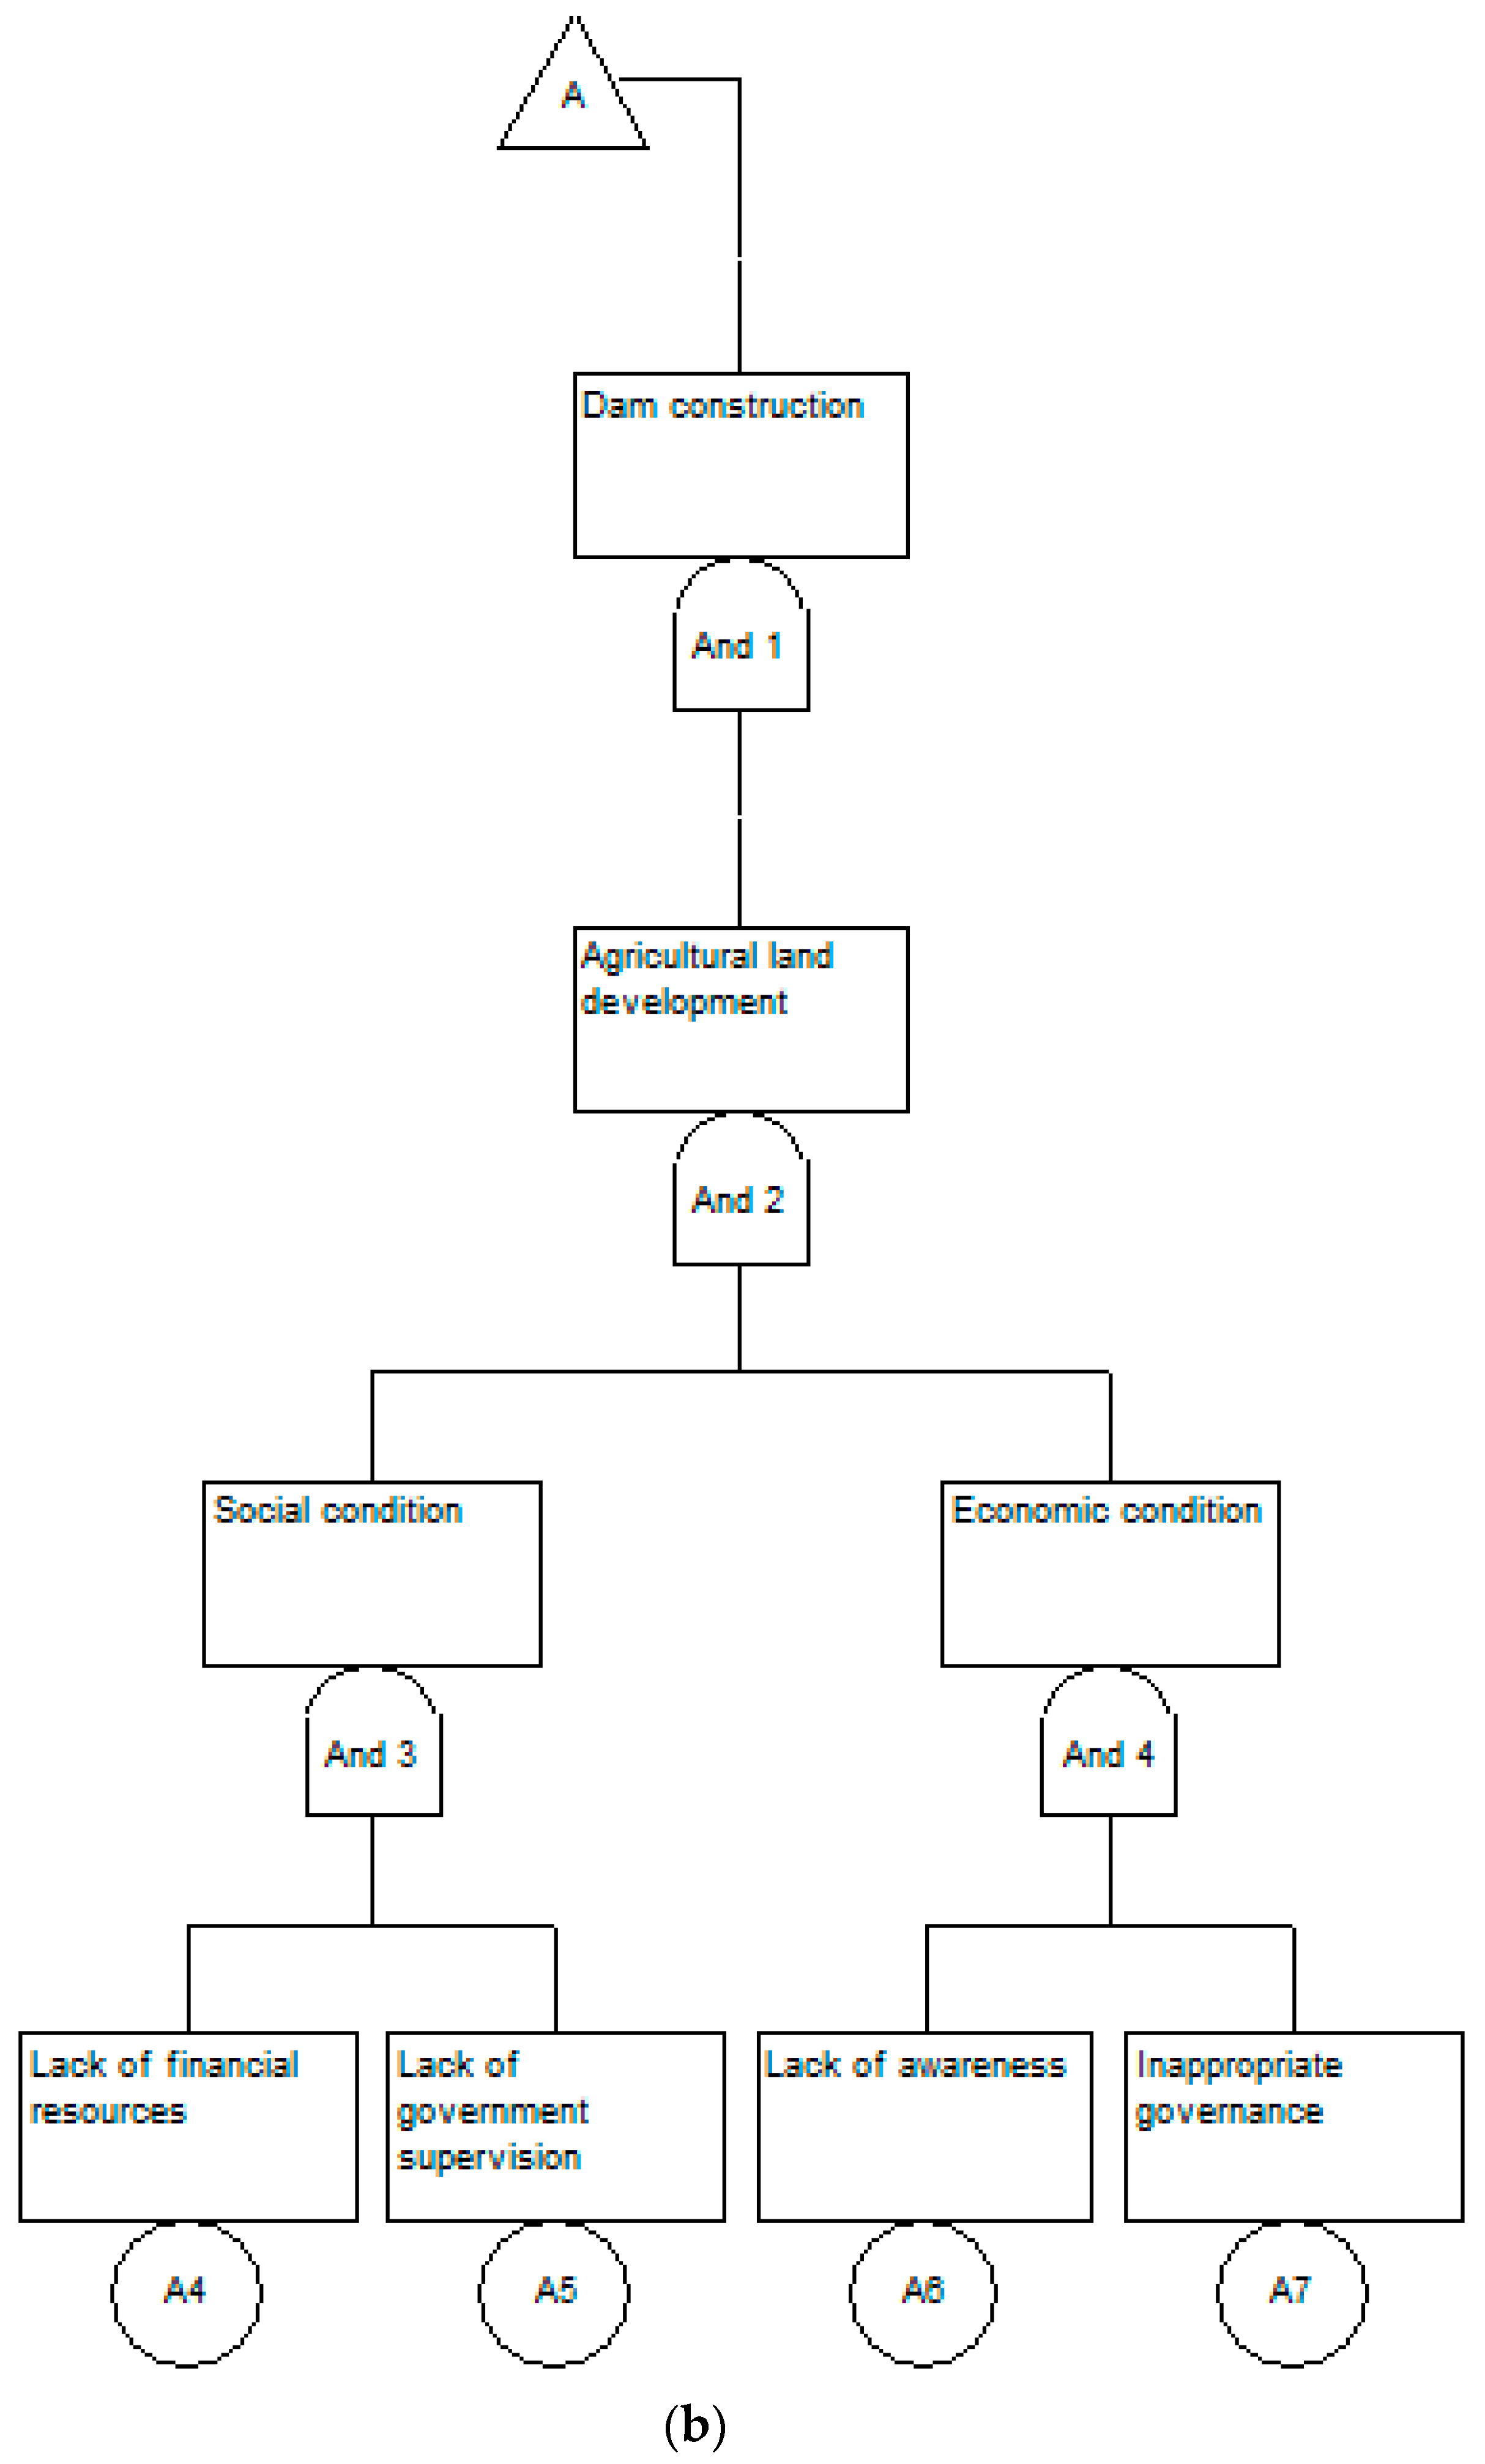
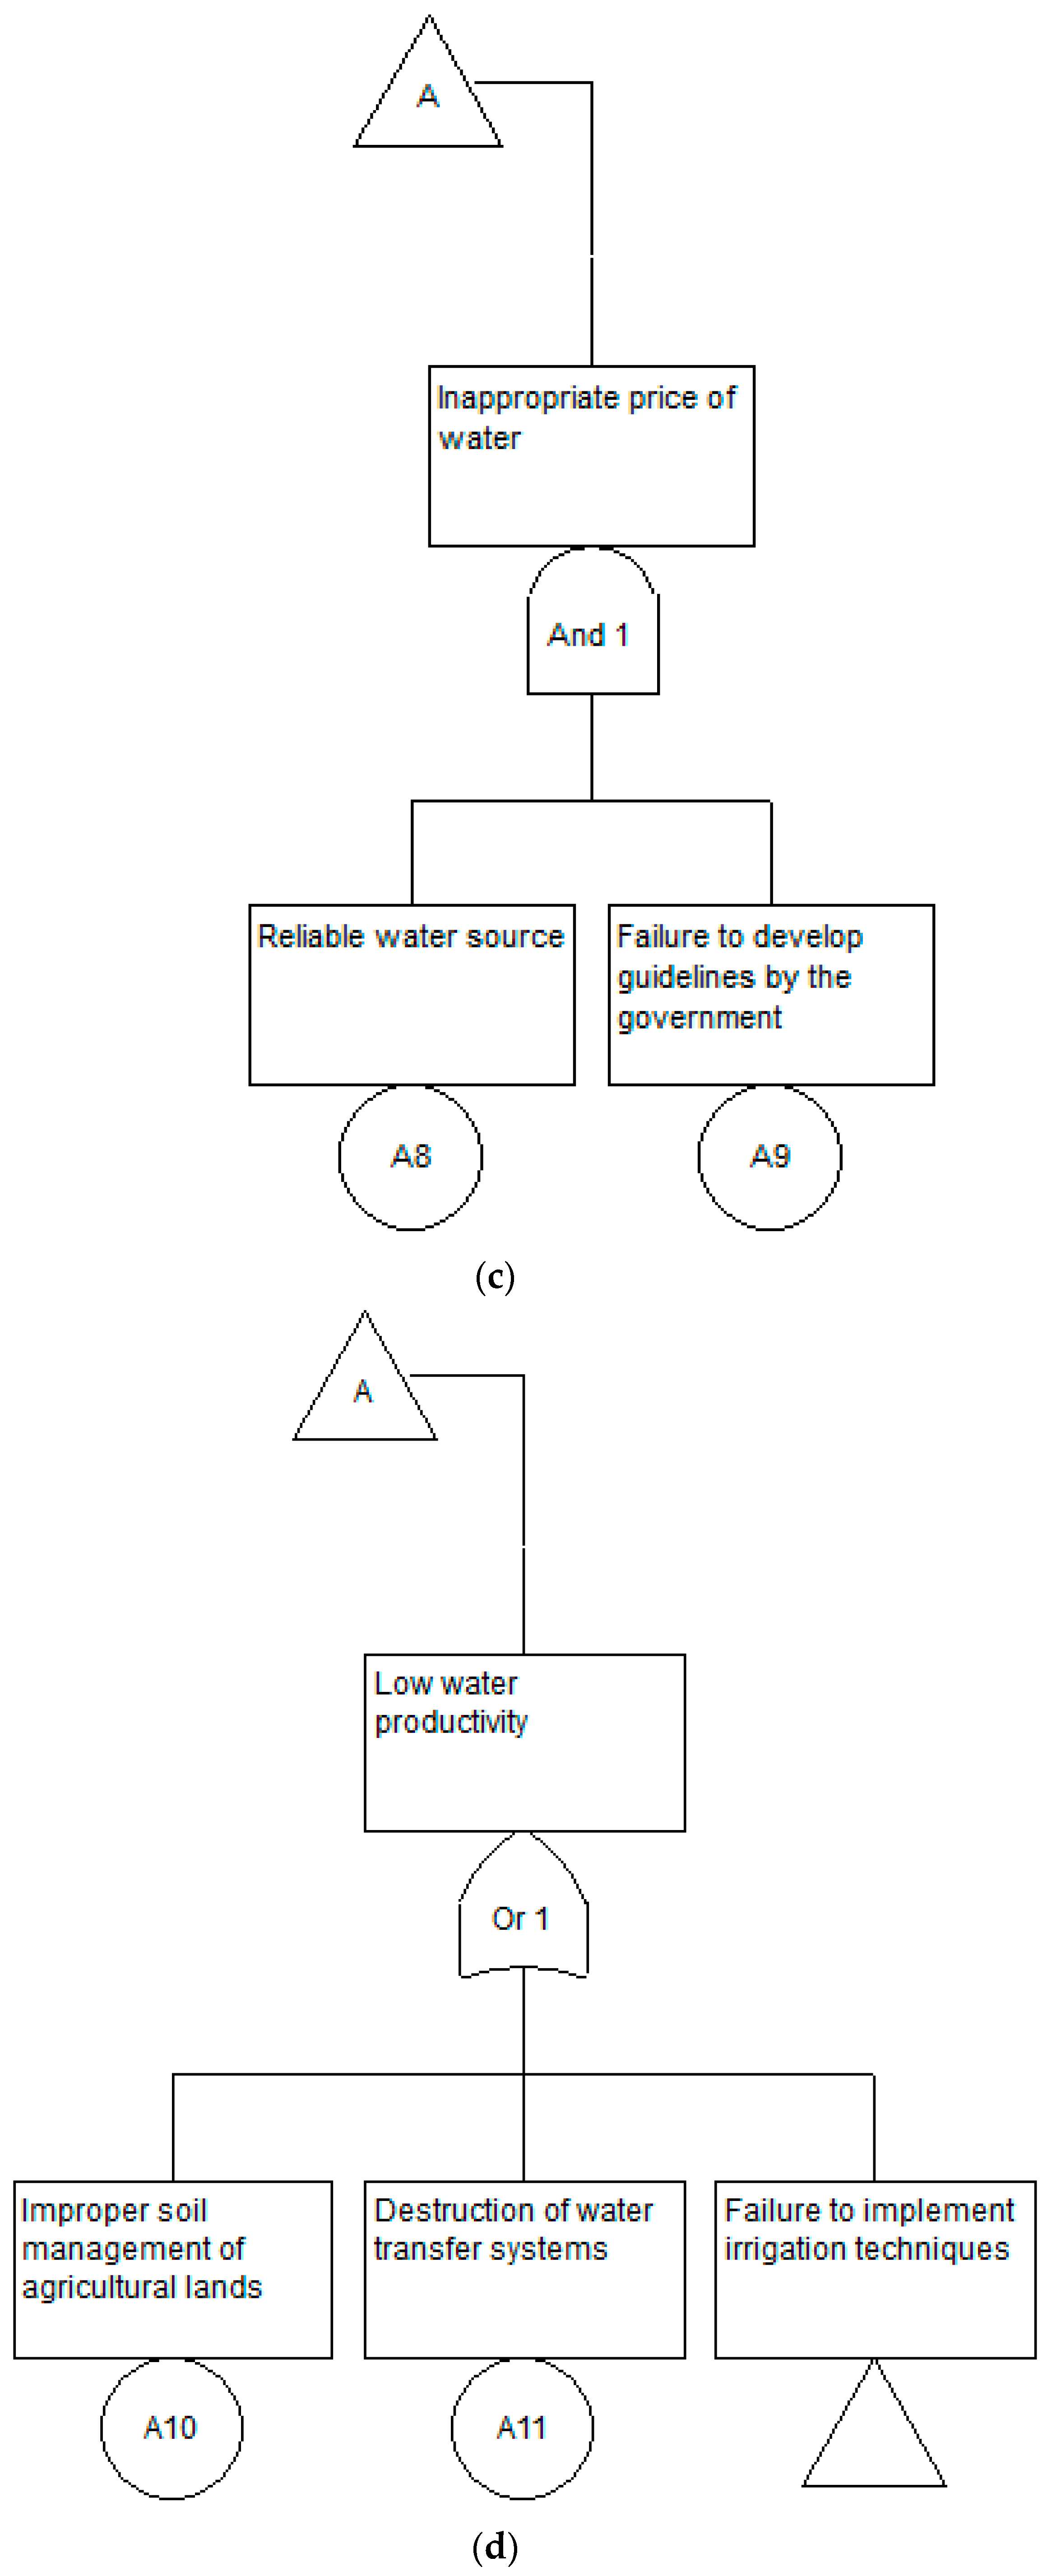
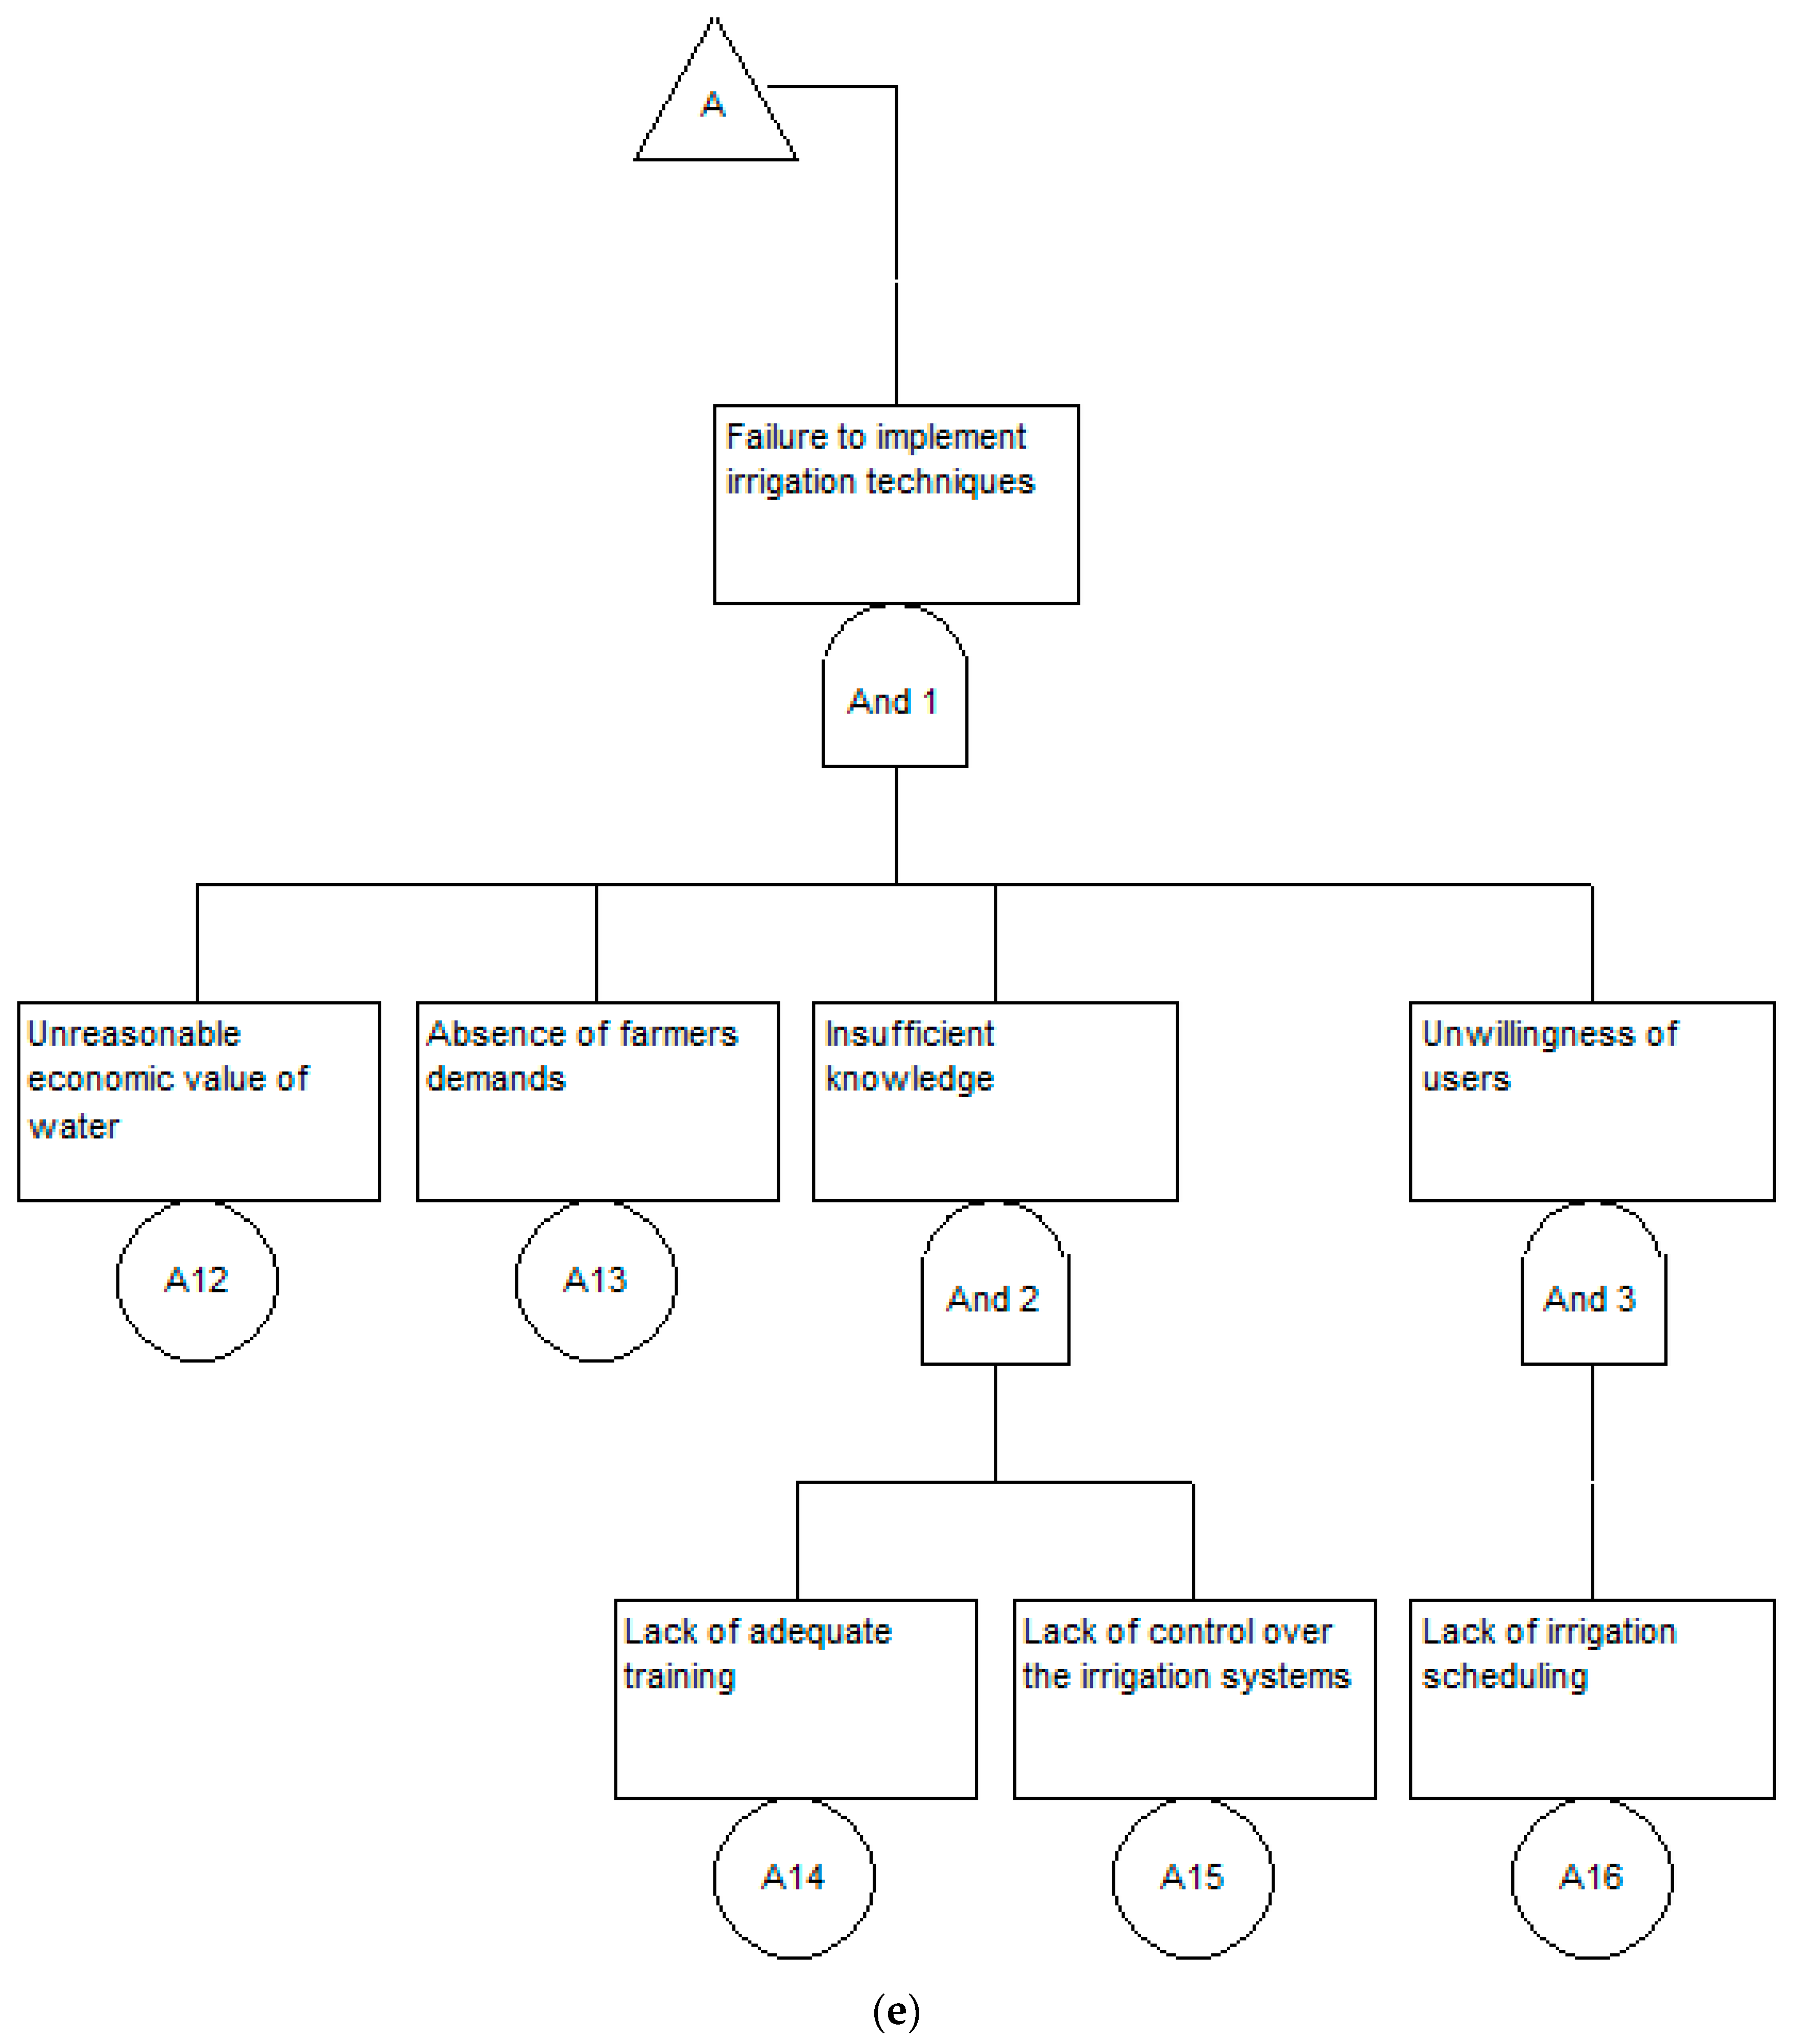
3.3. Compilation of the FTA of LU Sub-Basin
4. Results and Discussion
4.1. Risk of Failure of LU Sub-Basin
4.2. Measure the Importance of Basic Events
4.2.1. Lack of Accurate Planning in Water Supply and Demand
4.2.2. Unreasonable Economic Value of Water
4.2.3. Destructive Water Transfer Systems
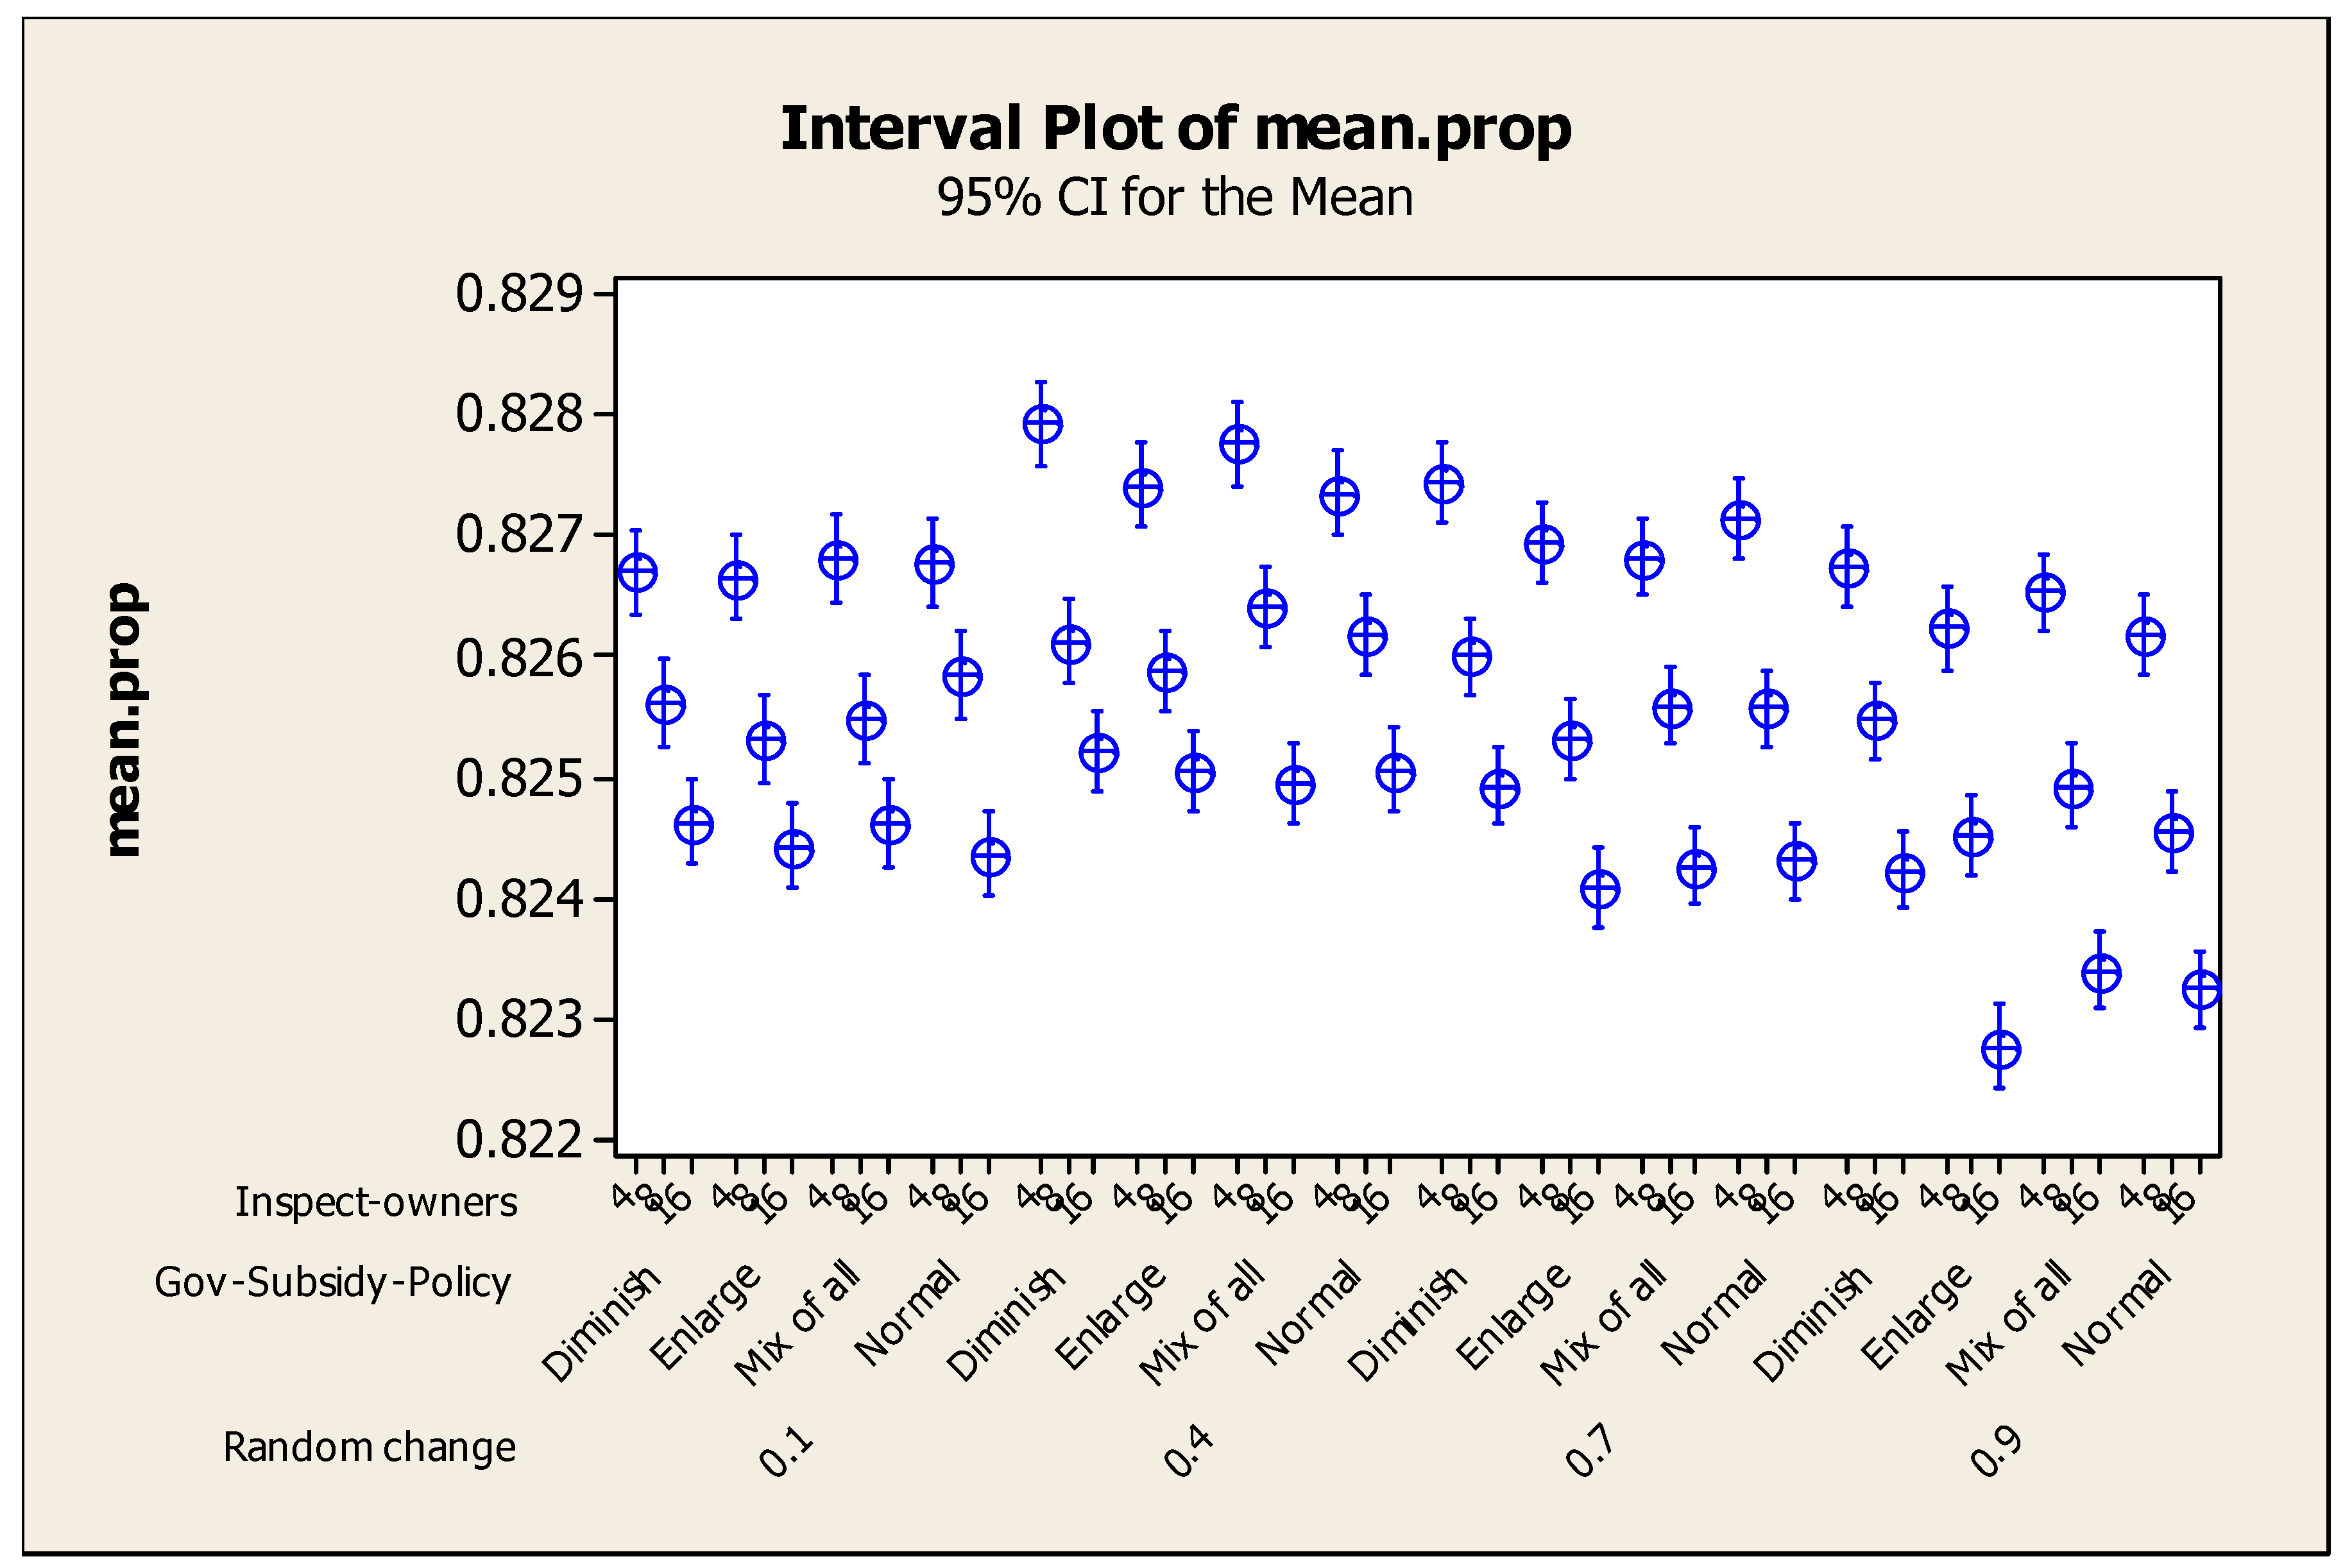
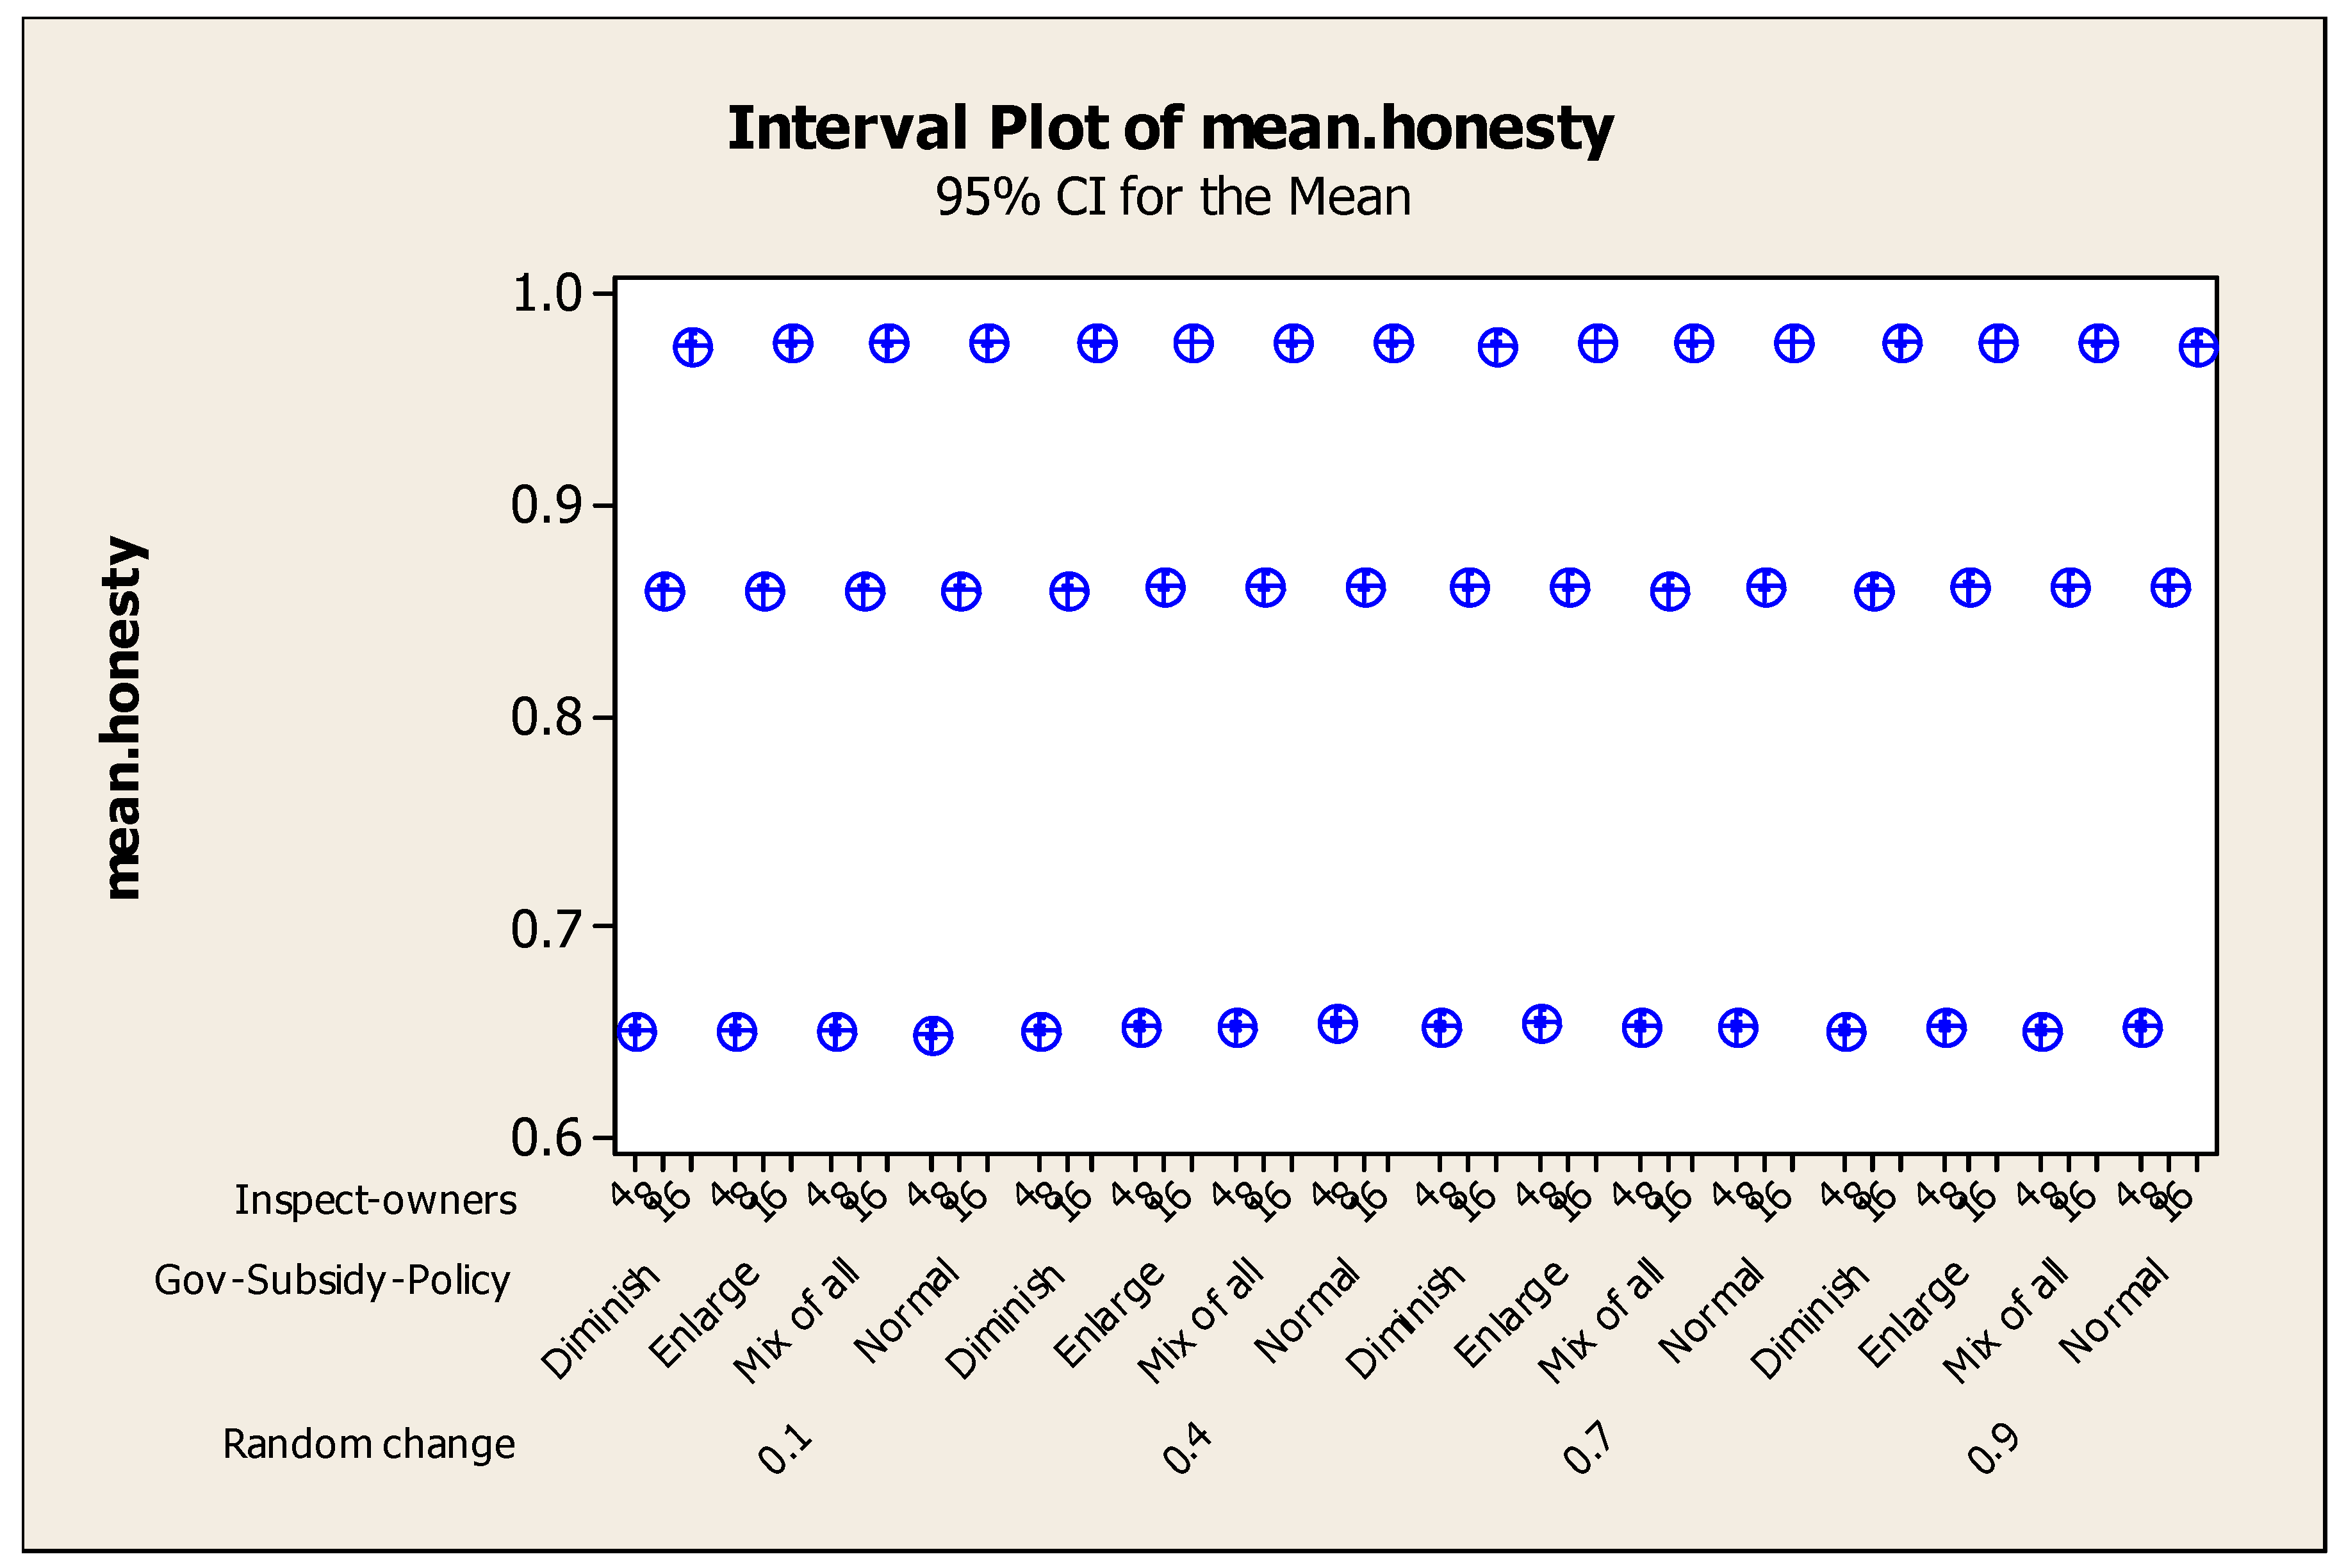
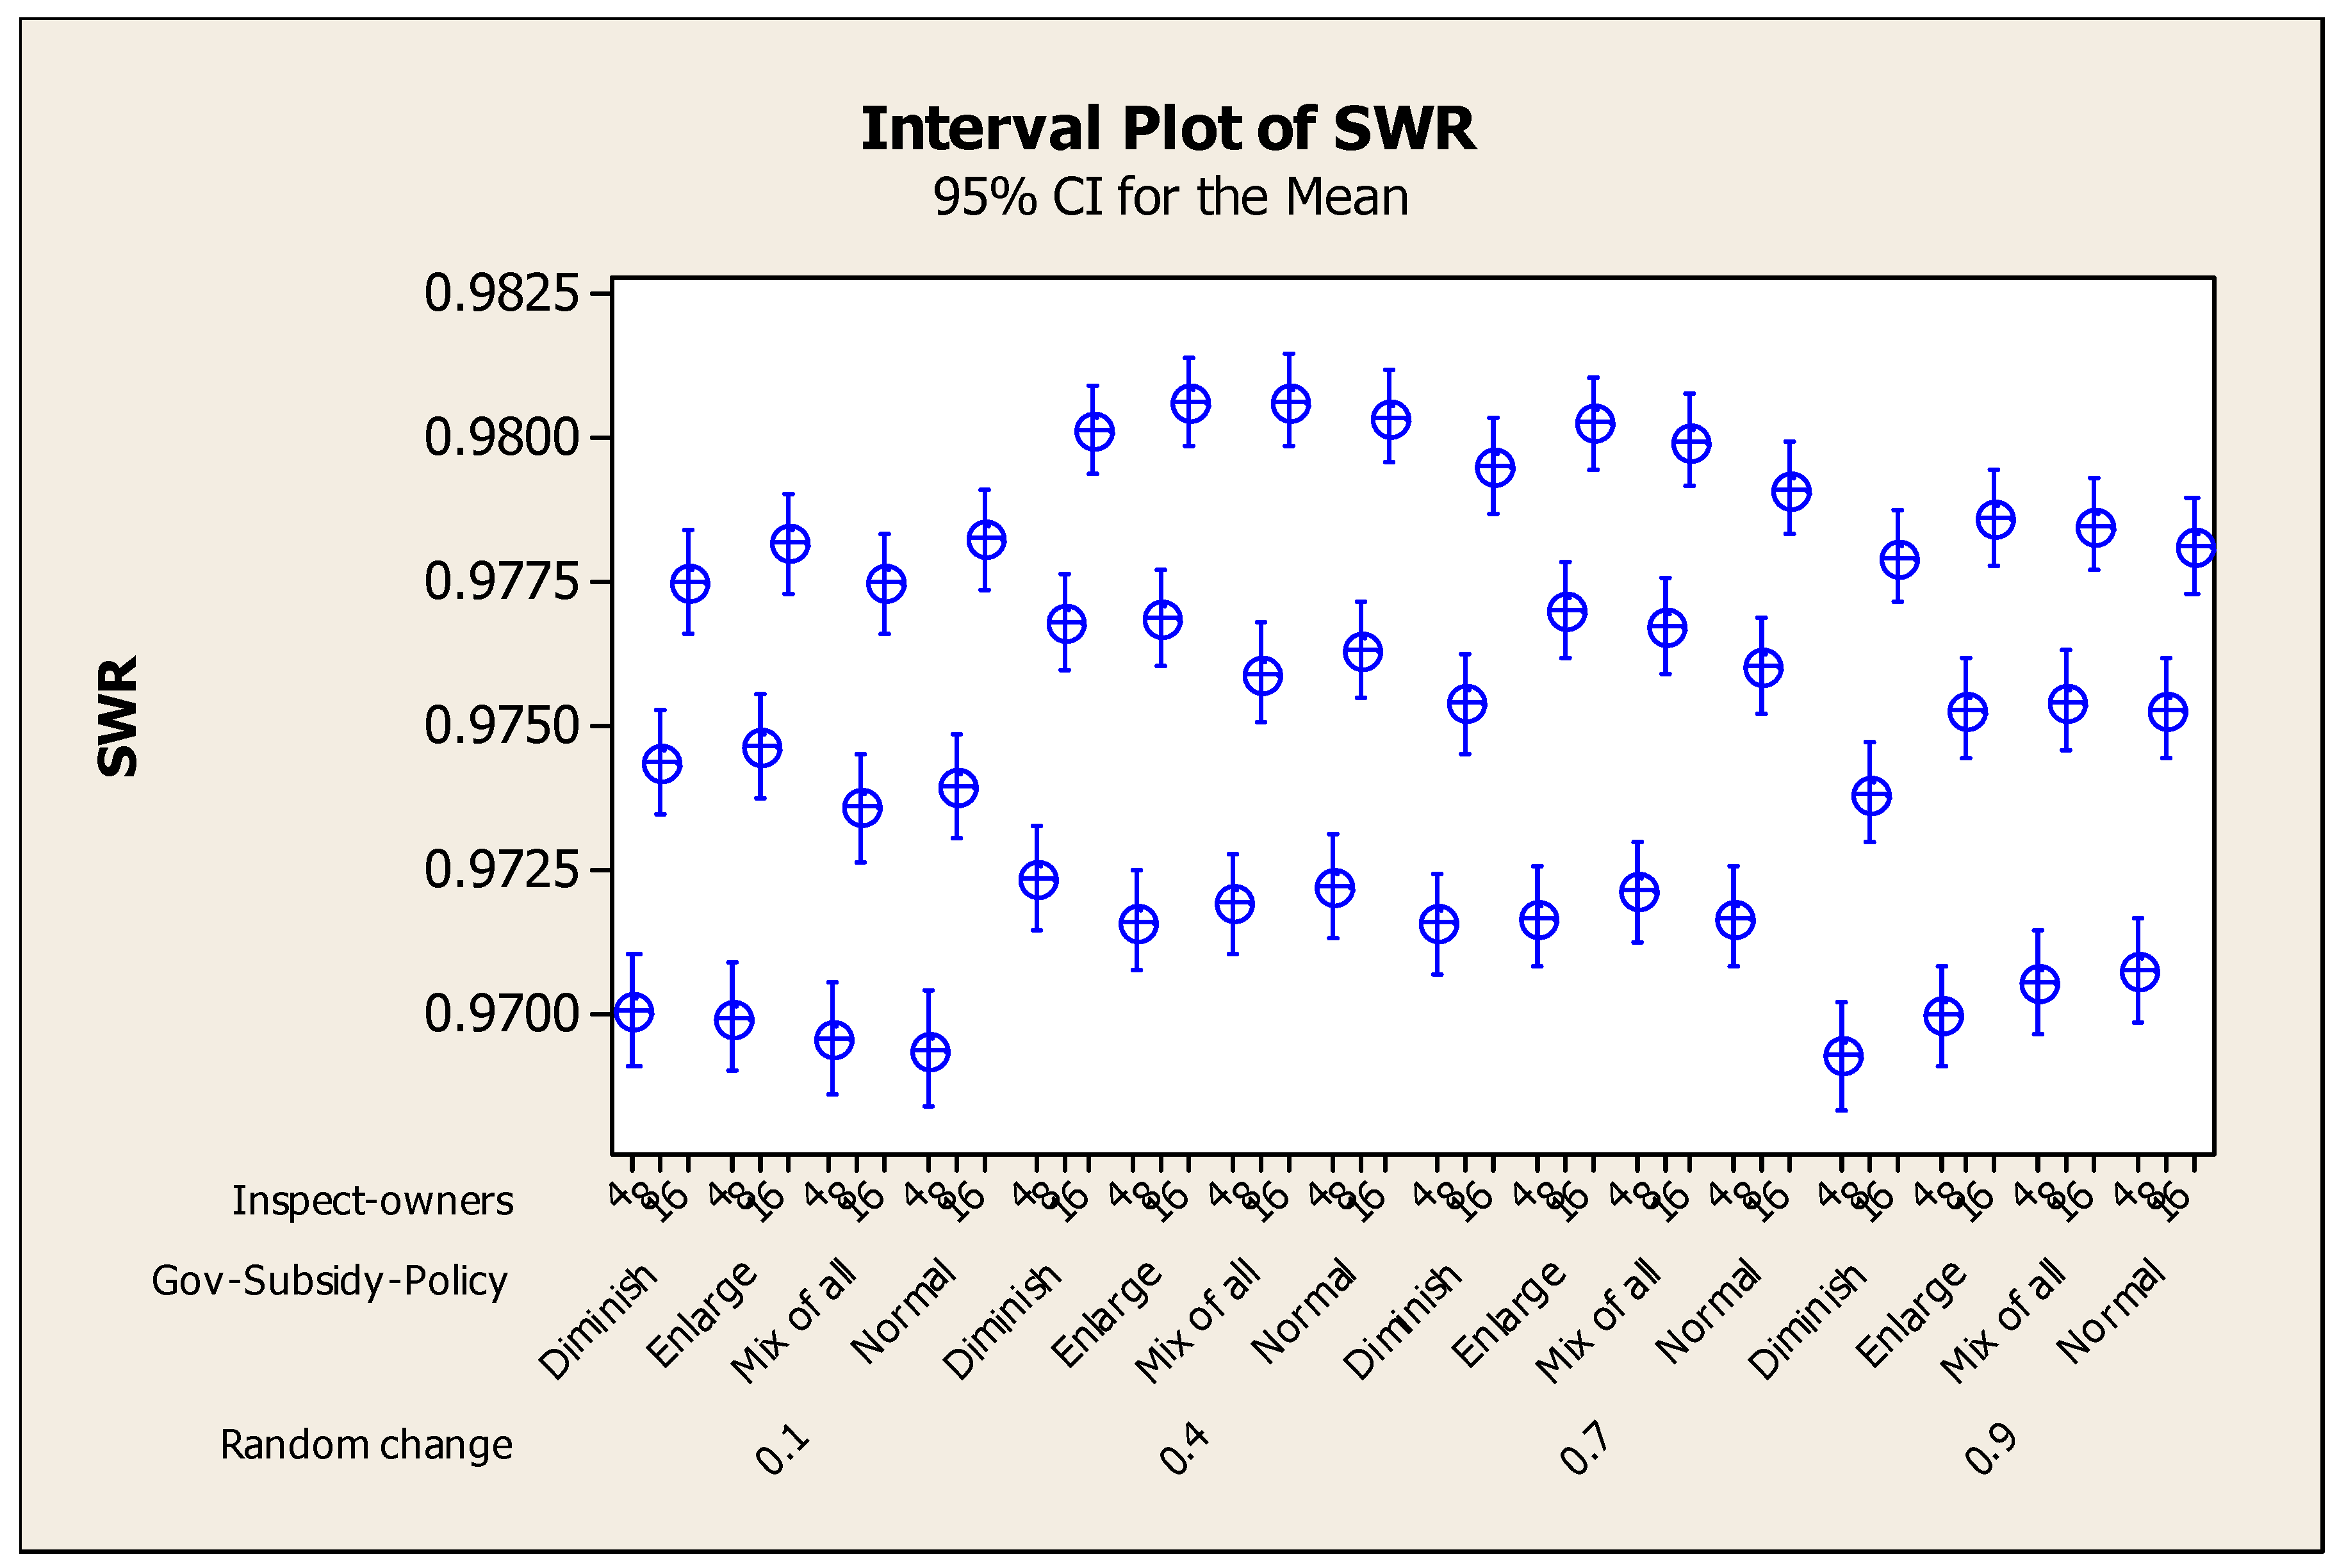
4.3. Analysis of the Proposed Methods
5. Conclusions
Author Contributions
Funding
Data Availability Statement
Conflicts of Interest
References
- Dehghanisanij, H.; Emami, S.; Khasheisiuki, A. Functional Properties of Irrigated Cotton under Urban Treated Wastewater Using an Intelligent Method. Appl. Water Sci. 2022, 12, 66. [Google Scholar] [CrossRef]
- Zhao, Z.; Zuo, J.; Zillante, G. Transformation of Water Resource Management: A Case Study of the South-to-North Water Diversion Project. J. Clean. Prod. 2015, 163, 136–145. [Google Scholar] [CrossRef]
- Pramova, E.; Locatelli, B.; Djoudi, H.; Olufunso, A. Forests and Trees for Social Adaptation to Climate Variability and Change. WIREs Clim. Change 2012, 3, 581–596. [Google Scholar] [CrossRef]
- Misra, A.K. Climate Change and Challenges of Water and Food Security. Int. J. Sustain. Environ. 2014, 3, 153–165. [Google Scholar] [CrossRef]
- Anghileri, D.; Pianosi, F. Sciences A Framework for the Quantitative Assessment of Climate Change Impacts on Water-Related Activities at the Basin Scale. Hydrol. Earth Syst. Sci. 2011, 15, 2025–2038. [Google Scholar] [CrossRef]
- Zarrineh, N.; Abad, M.A.N. Integrated Water Resources Management in Iran: Environmental, Socio-Economic and Political Review of Drought in Lake Urmia. Int. J. Water Resour. Environ. Eng. 2014, 6, 40–48. [Google Scholar] [CrossRef]
- Schmidt, M.; Gonda, R.; Transiskus, S. Environmental Degradation at Lake Urmia (Iran): Exploring the Causes and Their Impacts on Rural Livelihoods. GeoJournal 2021, 86, 2149–2163. [Google Scholar] [CrossRef]
- Ženko, M.; Menga, F. Linking Water Scarcity to Mental Health: Hydro–Social Interruptions in the Lake Urmia Basin, Iran. Water 2019, 11, 1092. [Google Scholar] [CrossRef]
- Gachlou, M.; Roozbahani, A. Comprehensive Risk Assessment of River Basins Using Fault Tree Analysis. J. Hydrol. 2019, 577, 123974. [Google Scholar] [CrossRef]
- Ojiemhende, F.; Oluseye, O.; Sidiq, A. Fault Tree Analysis and Its Modifications as Tools for Reliability and Risk Analysis of Engineering Systems—An Overview. Int. J. Res. Publ. Rev. 2022, 2582, 7421. [Google Scholar]
- Singh, A. Simulation—Optimization Modeling for Conjunctive Water Use Management. Agric. Water Manag. 2014, 141, 23–29. [Google Scholar] [CrossRef]
- Sun, Y.; Liu, N.; Shang, J.; Zhang, J. Sustainable Utilization of Water Resources in China: A System Dynamics Model. J. Clean. Prod. 2016, 142, 613–625. [Google Scholar] [CrossRef]
- Ma, L.; Chen, B.; Wang, X.; Zhu, Z.; Wang, R. The Analysis on the Desired Speed in Social Force Model Using a Data Driven Approach. Physica A 2019, 525, 894–911. [Google Scholar] [CrossRef]
- Kocabas, V.; Dragicevic, S. Assessing Cellular Automata Model Behaviour Using a Sensitivity Analysis Approach. Comput. Environ. Urban Syst. 2006, 30, 921–953. [Google Scholar] [CrossRef]
- Santé, I.; García, A.M.; Miranda, D.; Crecente, R. Landscape and Urban Planning Cellular Automata Models for the Simulation of Real-World Urban Processes: A Review and Analysis. Landsc. Urban Plan. 2010, 96, 108–122. [Google Scholar] [CrossRef]
- Macal, C.M.; North, M.J. Agent-Based Modeling and Simulation. In Proceedings of the 2009 Winter Simulation Conference (WSC), Austin, TX, USA, 13–16 December 2009; pp. 86–98. [Google Scholar]
- Grimm, V.; Berger, U.; Bastiansen, F.; Eliassen, S.; Ginot, V.; Giske, J.; Goss-custard, J.; Grand, T.; Heinz, S.K.; Huse, G.; et al. A Standard Protocol for Describing Individual-Based and Agent-Based Models. Ecol. Model. 2006, 8, 115–126. [Google Scholar] [CrossRef]
- Hommes, C.H. Heterogeneous agent models in economics and finance. In Handbook of Computational Economics; Elsevier: Amsterdam, The Netherlands, 2006; Volume 2. [Google Scholar] [CrossRef]
- Berglund, E.Z.; Asce, M. Using Agent-Based Modeling for Water Resources Planning and Management. J. Water Resour. Plan. Manag. 2015, 141, 04015025. [Google Scholar] [CrossRef]
- Lin, Z.; Lim, S.H.; Lin, T.; Borders, M. Using Agent-Based Modeling for Water Resources Management in the Bakken Region. J. Water Resour. Plan. Manag. 2020, 146, 05019020. [Google Scholar] [CrossRef]
- Castilla-rho, J.C.; Mariethoz, G.; Rojas, R.; Andersen, M.S.; Kelly, B.F.J. Environmental Modelling & Software An Agent-Based Platform for Simulating Complex Human E Aquifer Interactions in Managed Groundwater Systems. Environ. Model. Softw. 2015, 73, 305–323. [Google Scholar] [CrossRef]
- Nhim, T.; Richter, A.; Zhu, X. The Resilience of Social Norms of Cooperation under Resource Scarcity and Inequality—An Agent-Based Model on Sharing Water over Two Harvesting Seasons. Ecol. Complex. 2018, 40, 100709. [Google Scholar] [CrossRef]
- Pouladi, P.; Afshar, A.; Hadi, M.; Molajou, A.; Farahmand, H. Agent-Based Socio-Hydrological Modeling for Restoration of Urmia Lake: Application of Theory of Planned Behavior. J. Hydrol. 2019, 576, 736–748. [Google Scholar] [CrossRef]
- Ohab-yazdi, S.A.; Ahmadi, A. Using the Agent-Based Model to Simulate and Evaluate the Interaction Effects of Agent Behaviors on Groundwater Resources, A Case Study of a Sub-Basin in the Zayandehroud River Basin. Simul. Model. Pract. Theory 2018, 87, 274–292. [Google Scholar] [CrossRef]
- Javad, M.; Zarghami, M.; Nadiri, A. An Uncertain Agent-Based Model for Socio-Ecological Simulation of Groundwater Use in Irrigation: A Case Study of Lake Urmia Basin, Iran. Agric. Water Manag. 2021, 249, 106796. [Google Scholar] [CrossRef]
- Lang, D.; Ertsen, M.W. Conceptualising and Implementing an Agent-Based Model of an Irrigation System. Water 2022, 14, 2565. [Google Scholar] [CrossRef]
- Okura, F.; Budiasa, I.W.; Kato, T. Exploring a Balinese Irrigation Water Management System Using Agent-Based Modeling and Game Theory. Agric. Water Manag. 2022, 274, 107951. [Google Scholar] [CrossRef]
- Shoushtarian, F.; Negahban-azar, M.; Crooks, A. Investigating the Micro-Level Dynamics of Water Reuse Adoption by Farmers and the Impacts on Local Water Resources Using an Agent-Based Model. Socio-Environ. Syst. Model. 2022, 4, 18148. [Google Scholar] [CrossRef]
- Streefkerk, I.N.; De Bruijn, J.; Haer, T.; Van Loon, A.F.; Quichimbo, E.A.; Wens, M.; Hassaballah, K.; Aerts, J.C.J.H. A Coupled Agent-Based Model to Analyse Human-Drought Feedbacks for Agropastoralists in Dryland Regions. Front. Water 2023, 4, 1037971. [Google Scholar] [CrossRef]
- Mirzaei, A.; Ashktorab, N.; Noshad, M. Evaluation of the Policy Options to Adopt a Water-Energy-Food Nexus Pattern by Farmers: Application of Optimization and Agent-Based Models. Front. Environ. Sci. 2023, 11, 1139565. [Google Scholar] [CrossRef]
- Kabir, S. An Overview of Fault Tree Analysis and Its Application in Model Based Dependability Analysis. Expert Syst. Appl. 2017, 77, 114–135. [Google Scholar] [CrossRef]
- Danesh-yazdi, M. Lake Urmia Crisis and Restoration Plan: Planning without Appropriate Data and Model Is Gambling. J. Hydrol. 2019, 576, 639–651. [Google Scholar] [CrossRef]
- Cover, S. Changing Causes of Drought in the Urmia Lake Basin—Increasing Influence of Evaporation and Disappearing. Water 2021, 13, 3273. [Google Scholar]
- Dehghanisanij, H.; Emami, S.; Emami, H.; Elbeltagi, A. Evaluating Performance Indicators of Irrigation Systems Using Swarm Intelligence Methods in Lake Urmia Basin, Iran. Environ. Dev. Sustain. 2023, 26, 4175–4195. [Google Scholar] [CrossRef]
- Rahimi, A.; Breuste, J. Why Is Lake Urmia Drying up? Prognostic Modeling With Land-Use Data and Arti Fi Cial Neural Network. Front. Environ. Sci. 2021, 9, 603916. [Google Scholar] [CrossRef]
- Heppenstall, A.; Malleson, N.; Crooks, A. “Space, the Final Frontier”: How Good Are Agent-Based Models at Simulating Individuals and Space in Cities? Systems 2016, 4, 9. [Google Scholar] [CrossRef]
- Deangelis, D.L.; Diaz, S.G. Decision-Making in Agent-Based Modeling: A Current Review and Future Prospectus. Front. Ecol. Evol. 2019, 6, 237. [Google Scholar] [CrossRef]
- Ferdous, R.; Khan, F.; Sadiq, R.; Amyotte, P.; Veitch, B. Fault and Event Tree Analyses for Process Systems Risk Analysis: Uncertainty Handling Formulations. Risk Anal. 2011, 31, 86–107. [Google Scholar] [CrossRef] [PubMed]
- Austin, P.C. Fine-Gray Subdistribution Hazard Models to Simultaneously Estimate the Absolute Risk of Different Event Types: Cumulative Total Failure Probability May Exceed 1. Stat. Med. 2021, 40, 4200–4212. [Google Scholar] [CrossRef] [PubMed]
- Wilensky, U.; Tisue, S. Center for connected learning and computer-based modeling northwestern university, evanston, illinois. In Proceedings of the Agent 2004 Conference on Social Dynamics: Interaction, Reflexivity and Emergence, Argonne, IL, USA, 7–9 October 2004. [Google Scholar]
- Chiacchio, F.; Pennisi, M.; Russo, G.; Motta, S.; Pappalardo, F. Agent-Based Modeling of the Immune System: NetLogo, a Promising Framework. BioMed Res. Int. 2014, 2014, 907171. [Google Scholar] [CrossRef]
- Amosson, S.H.; New, L.; Almas, L.; Bretz, F.; Marek, T. Economics of Irrigation Systems; Texas FARMER Collection; Texas A&M University: College Station, TX, USA, 2002; 20p. [Google Scholar]
- Taher, M.; Connor, J.D.; Albiac, J. Ef Fi Cient Water Management Policies for Irrigation Adaptation to Climate Change in Southern Europe. Ecol. Econ. 2015, 120, 226–233. [Google Scholar] [CrossRef]
- Liu, T. Factors Influencing Farmers’ Adoption of Best Management Practices: A Review and Synthesis. Sustainability 2018, 10, 432. [Google Scholar] [CrossRef]
- Horbach, J.; Rammer, C.; Rennings, K. Determinants of Eco-Innovations by Type of Environmental Impact—The Role of Regulatory Push/Pull, Technology Push and Market Pull. Ecol. Econ. 2012, 78, 112–122. [Google Scholar] [CrossRef]
- Diaz, C.J.; Donoso, G.; Speelman, S. The Irrigation Subsidy Policy in Chile: Lessons from the Allocation, Uneven Distribution, and Water Resources Implications. Int. J. Water Resour. Dev. 2021, 39, 133–154. [Google Scholar] [CrossRef]
- Chuchird, R.; Sasaki, N. Influencing Factors of the Adoption of Agricultural Irrigation Technologies and the Economic Returns: A Case Study in Chaiyaphum Province, Thailand. Sustainability 2017, 9, 1524. [Google Scholar] [CrossRef]
- Zhang, W.; Member, S.; Valencia, A.; Chang, N.; Agent-based, A. Learning and Agent-Based Modeling: A Multidisciplinary Review. IEEE Trans. Neural Networks Learn. Syst. 2023, 34, 2170–2190. [Google Scholar] [CrossRef] [PubMed]
- Palanisami, K.; Mohan, K.; Giordano, M.; Charles, C. Measuring Irrigation Subsidies in Andhra Pradesh and Southern India: An Application of the GSI Method for Quantifying Subsidies; Global Subsidies Initiative; International Institute for Sustainable Development (IISD): Winnipeg, MB, Canada, 2011; 56p. [Google Scholar]
- Adeyemi, O.; Grove, I.; Peets, S.; Norton, T. Advanced Monitoring and Management Systems for Improving Sustainability in Precision Irrigation. Sustainability 2017, 9, 353. [Google Scholar] [CrossRef]
- Aliabadi, B.T.; Hassandokht, M.R.; Etesami, H.; Alikhani, H.A. Effect of Mulching on Some Characteristics of Tomato (Lycopersicon Esculentum Mill.) under Deficit Irrigation. J. Agric. Sci. Technol. 2019, 21, 927–941. [Google Scholar]
- Zhou, Q.; Deng, X.; Wu, F.; Li, Z.; Song, W. Participatory Irrigation Management and Irrigation Water Use Efficiency in Maize Production: Evidence from Zhangye City, Northwestern China. Water 2017, 9, 822. [Google Scholar] [CrossRef]
- Abiodun, E.; Shukri, M.; Abidin, Z.; Saiful, M.; Mahmud, A.; Buyamin, S.; Hafis, M.; Ishak, I.; Khairie, M.; Abd, I.; et al. A Review on Monitoring and Advanced Control Strategies for Precision Irrigation. Comput. Electron. Agric. 2020, 173, 105441. [Google Scholar] [CrossRef]
- Nabiafjadi, S.; Sharifzadeh, M.; Ahmadvand, M. Social Network Analysis for Identifying Actors Engaged in Water Governance: An Endorheic Basin Case in the Middle East. J. Environ. Manag. 2021, 288, 112376. [Google Scholar] [CrossRef]
- Galvez, V.; Rojas, R.; Bennison, G.; Prats, C. Collaborate or Perish: Water Resources Management under Contentious Water Use in a Semiarid Basin. Intl. J. River Basin Manag. 2019, 18, 421–437. [Google Scholar] [CrossRef]
- Pahl-wostl, A.C.; Craps, M.; Dewulf, A.; Mostert, E.; Tabara, D. Social Learning and Water Resources Management. Ecol. Soc. 2007, 12, 5. [Google Scholar] [CrossRef]
- Alborzi, A.; Mirchi, A.; Moftakhari, H.; Mallakpour, I.; Alian, S.; Nazemi, A. Climate-Informed Environmental Inflows to Revive a Drying Lake Facing Meteorological and Anthropogenic Droughts. Environ. Res. Lett. 2018, 13, 084010. [Google Scholar] [CrossRef]
- Enqvist, J.P.; Ziervogel, G. Water Governance and Justice in Cape Town: An Overview. WIREs Water 2019, 6, e1354. [Google Scholar] [CrossRef]
- Cosgrove, W.J.; Loucks, D.P. Water management: Current and future challenges and research directions. Water Resour. Res. 2015, 51, 4823–4839. [Google Scholar] [CrossRef]
- Hunecke, C.; Engler, A.; Jara-rojas, R.; Poortvliet, P.M. Understanding the Role of Social Capital in Adoption Decisions: An Application to Irrigation Technology. Agric. Syst. 2021, 153, 221–231. [Google Scholar] [CrossRef]
- Sani, L.I. Influence of Socio-Economic Characteristics of Irrigation Farmers to Access and Utilization of Agricultural Knowledge and Information. Libr. Philos. Pract. 2017, 1571, 1–17. [Google Scholar]
- Bozorgzadeh, E.; Mousavi, S.J. A Quantitative Approach to Resource Effectiveness Assessment: Application in the Urmia Lake Basin. J. Environ. Manag. 2021, 289, 112559. [Google Scholar] [CrossRef] [PubMed]
- Abadi, B. How Agriculture Contributes to Reviving the Endangered Ecosystem of Lake Urmia? The Case of Agricultural Systems in Northwestern Iran. J. Environ. Manag. 2019, 236, 54–67. [Google Scholar] [CrossRef]


| Age (Year) | Education | Occupation | Entrepre Index |
|---|---|---|---|
| age < 40 40 < age < 60 age > 60 | University education or without education | Without side occupation or unrelated occupation | Normalized innovation index |
| [1–3] | [1–5] | [1–3] | [0–1] |
| Irrigation System | Irrstatus Amount | |
|---|---|---|
| Border | 30% | 1 |
| Furrow | 50% | 2 |
| Sprinkler | 65% | 3 |
| Surface drip (tape) | 80% | 4 |
| Surface drip (tape) (with irrigation management) | 90% | 5 |
| Subsurface drip irrigation | 95% | 6 |
| Parameter | Description | Value |
|---|---|---|
| Network-density | Influence of the farmer’s neighbors | [0.05, 0.1, 0.2] |
| α | Farm scale | [0.4, 0.7, 0.9] |
| β | Farmer’s entrepreneurship on the initial propensity to DTIM | [0.4, 0.7, 0.9] |
| r | Effect of random changes | [0.1, 0.4, 0.7, 0.9] |
| SWS | Sustainable water supply | [1000, 10,000, 50,000] |
| Seed-ratio | Portion of seed participants of the cooperation | [0.05, 0.1, 0.2] |
| Seed-owner | Types of earliest participants | [Close owners, Hight entrepre and scale, Hight degree, Hight entrepre, No other job] |
| Gov-policy | Subsidy, training, and supervision policy of the government | [Normal, Enlarge, Diminish, Mix of all] |
| Inspect-owners | Government supervision teams | [4, 8, 16] |
| No. | Basic Events | Type | No. | Basic Events | Type |
|---|---|---|---|---|---|
| 1 | Drought | Natural | 9 | Failure to develop guidelines by the government | Operational |
| 2 | Flood | Natural | 10 | Absence of farmer’s demands | Operational |
| 3 | Small ownership of agricultural land | Operational | 11 | Lack of adequate training | Operational |
| 4 | Lack of financial resources | Operational | 12 | Lack of control over the irrigation systems management | Operational |
| 5 | Lack of government supervision | Operational | 13 | Lack of irrigation scheduling | Operational |
| 6 | Lack of awareness | Operational | 14 | Conflict of interest | Operational |
| 7 | Inappropriate governance | Operational | 15 | Insufficient knowledge | Operational |
| 8 | Reliable water resources | Operational | 16 | Improper soil management of agricultural lands | Operational |
| Source | DF | SS | MS | F | P |
|---|---|---|---|---|---|
| Network-density | 2 | 0.000083 | 0.000041 | 1.18 | 0.308 |
| Random change | 3 | 0.015535 | 0.005178 | 147.65 | 0.000 |
| SWS | 2 | 0.306912 | 0.153456 | 4375.59 | 0.000 |
| Seed-ratio | 2 | 0.000096 | 0.000048 | 1.36 | 0.256 |
| Seed-owner | 4 | 0.000123 | 0.000031 | 0.88 | 0.475 |
| Gov-Subsidy-Policy | 3 | 0.002418 | 0.000806 | 22.98 | 0.000 |
| Inspect-owners | 2 | 0.074007 | 0.037003 | 1055.10 | 0.000 |
| Error | 64,781 | 2.271928 | 0.000035 | ||
| Total | 64,799 | 2.671102 |
| Source | DF | SS | MS | F | P |
|---|---|---|---|---|---|
| Network-density | 2 | 9.014 | 4.507 | 10,834.69 | 0.000 |
| Random change | 3 | 0.017 | 0.006 | 13.49 | 0.000 |
| SWS | 2 | 0.032 | 0.016 | 38.34 | 0.000 |
| Seed-ratio | 2 | 0.031 | 0.015 | 37.17 | 0.000 |
| Seed-owner | 4 | 0.001 | 0.000 | 0.58 | 0.677 |
| Gov-Subsidy-Policy | 3 | 0.004 | 0.001 | 3.14 | 0.024 |
| Inspect-owners | 2 | 1164.803 | 582.401 | 1,400,027.11 | 0.000 |
| Error | 64,781 | 26.948 | 0.000 | ||
| Total | 64,799 | 1200.850 |
| Source | DF | SS | MS | F | P |
|---|---|---|---|---|---|
| Network-density | 2 | 0.001113 | 0.000556 | 2.23 | 0.107 |
| Random change | 3 | 0.064029 | 0.021343 | 85.61 | 0.000 |
| SWS | 2 | 0.862558 | 0.431279 | 1729.93 | 0.000 |
| Seed-ratio | 2 | 0.000161 | 0.00008 | 0.32 | 0.725 |
| Seed-owner | 4 | 0.000871 | 0.000218 | 0.87 | 0.479 |
| Gov-Subsidy-Policy | 3 | 0.002044 | 0.000681 | 2.73 | 0.042 |
| Inspect-owners | 2 | 0.718565 | 0.359282 | 1441.14 | 0.000 |
| Error | 64,781 | 16.150154 | 0.000249 | ||
| Total | 64,799 | 17.799494 |
| Source | DF | SS | MS | F | P |
|---|---|---|---|---|---|
| Network-density | 2 | 0.015 | 0.007 | 0.32 | 0.724 |
| Random change | 3 | 744.568 | 248.189 | 11046.72 | 0.000 |
| SWS | 2 | 0.543 | 0.272 | 12.09 | 0.000 |
| Seed-ratio | 2 | 0.177 | 0.088 | 3.94 | 0.020 |
| Seed-owner | 4 | 0.132 | 0.033 | 1.47 | 0.209 |
| Gov-Subsidy-Policy | 3 | 0.035 | 0.012 | 0.51 | 0.673 |
| Inspect-owners | 2 | 1.972 | 0.986 | 43.88 | 0.000 |
| Error | 64,781 | 1455.451 | 0.022 | ||
| Total | 64,799 | 2202.893 |
| Basic Events | Ix = ∑Ux/Us | Quantitative Rating |
|---|---|---|
| CS1 = (A1, A2) | (1/42) × (1/42) = 0.005/0.8 = 0.006 | 1 |
| CS2 = (A8) | 35/42 = 0.83/0.8 = 1.04 | 7 |
| CS3 = (A3, A4, A5) | (25/42) × (25/42) × (38/42) = 0.32/0.8 = 0.4 | 2 |
| CS4 = (A6, A7) | (35/42) × (40/42) = 0.79/0.8 = 0.99 | 6 |
| CS5 = (A8, A9) | (35/42) × (36/42) = 0.71/0.8 = 0.89 | 5 |
| CS6 = A10 | 35/42 = 0.83/0.8 = 1.04 | 8 |
| CS7 = A11 | 25/42 = 0.60/0.8 = 0.75 | 4 |
| CS8 = (A3, A12, A13) | (25/42) × (35/42) × (42/42) = 0.50/0.8 = 0.625 | 3 |
| CS9 = (A14, A15) | (38/42) × (40/42) = 0.86/0.8 = 1.075 | 9 |
| CS10 = A16 | 38/42 = 0.9/0.8 = 1.125 | 10 |
Disclaimer/Publisher’s Note: The statements, opinions and data contained in all publications are solely those of the individual author(s) and contributor(s) and not of MDPI and/or the editor(s). MDPI and/or the editor(s) disclaim responsibility for any injury to people or property resulting from any ideas, methods, instructions or products referred to in the content. |
© 2024 by the authors. Licensee MDPI, Basel, Switzerland. This article is an open access article distributed under the terms and conditions of the Creative Commons Attribution (CC BY) license (https://creativecommons.org/licenses/by/4.0/).
Share and Cite
Emami, S.; Dehghanisanij, H. Fault Tree Analysis of Trade-Offs between Environmental Flows and Agricultural Water Productivity in the Lake Urmia Sub-Basin Using Agent-Based Modeling. Water 2024, 16, 844. https://doi.org/10.3390/w16060844
Emami S, Dehghanisanij H. Fault Tree Analysis of Trade-Offs between Environmental Flows and Agricultural Water Productivity in the Lake Urmia Sub-Basin Using Agent-Based Modeling. Water. 2024; 16(6):844. https://doi.org/10.3390/w16060844
Chicago/Turabian StyleEmami, Somayeh, and Hossein Dehghanisanij. 2024. "Fault Tree Analysis of Trade-Offs between Environmental Flows and Agricultural Water Productivity in the Lake Urmia Sub-Basin Using Agent-Based Modeling" Water 16, no. 6: 844. https://doi.org/10.3390/w16060844