Article

Climate Change Impacts on Nitrate Leaching and Groundwater Nitrate Dynamics Using a Holistic Approach and Med-CORDEX Climatic Models

by
Aikaterini Lyra
1,
Athanasios Loukas
2,*,
Pantelis Sidiropoulos
2 and
Lampros Vasiliades
1
1
Laboratory of Hydrology and Aquatic Systems Analysis, Department of Civil Engineering, School of Engineering, University of Thessaly, 38334 Volos, Greece
2
Laboratory of Hydraulic Works and Environmental Management, School of Rural and Surveying Engineering, Aristotle University of Thessaloniki, 54124 Thessaloniki, Greece
*
Author to whom correspondence should be addressed.
Water 2024, 16(3), 465; https://doi.org/10.3390/w16030465
Submission received: 17 December 2023 / Revised: 26 January 2024 / Accepted: 29 January 2024 / Published: 31 January 2024

Abstract

:
This study presents the projected future evolution of water resource balance and nitrate pollution under various climate change scenarios and climatic models using a holistic approach. The study area is Almyros Basin and its aquifer system, located in Central Greece, Thessaly, Greece. Almyros Basin is a coastal agricultural basin and faces the exacerbation of water deficit and groundwater nitrate pollution. Using an Integrated Modeling System (IMS), which consists of the surface hydrology model (UTHBAL), the nitrate leachate model (REPIC, an R-ArcGIS-based EPIC model), the groundwater hydrology model (MODFLOW), and the nitrates’ advection, dispersion, and transport model (MT3MDS), the projected values of the variables of water quantity and quality are simulated. Nineteen climatic models from the Med-CORDEX database were bias-corrected with the Quantile Empirical Mapping method and employed to capture the variability in the simulated surface and groundwater water balance and nitrate dynamics. The findings indicate that future precipitation, runoff, and groundwater recharge will decrease while temperature and potential evapotranspiration will increase. Climate change will lead to reduced nitrogen leaching, lower groundwater levels, and persistent nitrate pollution; however, it will be accompanied by high variability and uncertainty, as simulations of IMS under multiple climatic models indicate.

1. Introduction

Rising nitrate levels in aquifers are a long-term concern worldwide, particularly in aquifers underneath predominantly agricultural areas [1]. The prolonged and intensive fertilizing treatments employed to attain crop-yield amplification tend to serve as the primary cause of groundwater nitrate pollution [2,3]. The main factor in the development of nitrate pollution in groundwater, especially heterogeneous confined aquifers with exceptionally low recharge rates, is a gradual accumulation of nitrates, which may rise to concentrations that are hazardous to the reliability of urban water supplies [4,5]. According to an important investigation to avoid neonatal methemoglobinemia, the World Health Organization, or WHO, announced a short-term restriction of 50 mg/L for the consumption of water, which the European Union likewise advocated [6]. Regulations in Greece and abroad have set an upper threshold of 50 mg/L, although prolonged water consumption with smaller nitrate concentrations (over 25 mg/L) is a cause for worry [7]. After evaluating the present level of nitrate water pollution in the European Union (EU), the European Commission concluded that further work is required to accomplish the zero-pollution target [8]. Across the Member States from 2016 to 2019, 14.1% of groundwater systems rose above the nitrates concentration upper threshold imposed for drinking water (50 mg/L), and 81% of sea waters, 31% of coastal waters, 36% of rivers, and 32% of wetlands in the EU are eutrophic. The Commission aims to enhance adherence to the Nitrates Directive as a crucial step toward achieving the European Green Deal’s objective of reducing nutrient losses by a minimum of 50% by 2030 and accomplishing the goal of having all water bodies in good quantity and quality by 2027 [8,9,10,11,12].
However, surface runoff and groundwater recharge rates are expected to reduce under climate change, causing a decrease in the dilution of substances and nutrients, particularly in the Mediterranean regions [13,14]. The impacts of climate change on nitrogen leaching and groundwater nitrate pollution depend on the future patterns of precipitation and temperature. The amount of nitrogen losses to groundwater is not easily defined, but the IPCC uses a 30% nitrogen leaching emission factor for future estimates [15]. Olesen et al. (2019) [16] found that climate change will have significant effects on nitrogen leaching, while Reichenau et al. (2016) [17] argued that there will be no significant changes. Villa et al. (2022) [18] emphasize the importance of high–resolution climate input data for estimating nitrogen leaching under climate change scenarios, while Davamani et al. (2024) suggest that improved simulation models can capture local changes [19]. The impact of climate change on water resources, including nitrogen leaching and nitrate concentrations in groundwater, is still uncertain and requires further research [1,16,20,21].
The uncertain future can be represented via scenarios, the Representative Concentrations Pathways (RCPs) of greenhouse gas emissions, and the radiative forcing in Watt/m2 on Earth’s surface [22]. For example, the climate change scenario RCP8.5 is considered the “reference scenario” without any mitigation or adaptation actions. It represents adverse impacts with radiation absorption of 8.5 W/m2 and global temperature increases of 2.6–4.8 °C by 2100. RCP4.5 represents medium impacts with radiation absorption of 4.5 W/m2 and a rise in global temperatures of 2–3 °C by 2100 [22]. The projected precipitation and temperature are simulated using coarse-scaled climatic models (Global Circulation Models) and nested Regional Circulation Models (RCMs) under different forcing emissions [23]. Climatic variables from different climate scenarios and climatic models with different initial conditions of simulated climate and different spatial resolutions produce great variability and uncertainty, which is reflected in the simulated projections of the water and nitrogen cycle variables [24,25]. The variability of the simulated variables among climatic models is smaller than the variability among climatic scenarios [26]. A holistic approach can enhance predictive models for water and nitrogen cycles and inform stakeholders about water system status to facilitate appropriate actions and rational expectations of the results. To tackle freshwater pollution and maintain the quality and quantity of these natural resources, a holistic approach is necessary, considering the relationships between surface water, groundwater, and agricultural water demands [19,27,28,29].
Groundwater is the main source of water in Greece, accounting for nearly 70% of the country’s water resources. The rural sector uses 74% of the groundwater. The Water District of Thessaly, including the Almyros Basin, is confronting challenges with water scarcity and nitrate pollution [30]. This study investigates the water resources, mainly the groundwater resources, and the nitrate leaching and aquifer pollution under two climatic scenarios, RCP8.5 and RCP4.5, with the projected climate from nineteen (19) climatic models of the Med-CORDEX database. The study aims to define the ranges and patterns of hydrological cycle and groundwater nitrogen pollution in the coastal Almyros Basin and Almyros aquifer system in Greece under adverse and medium climatic impacts. It highlights the complexity and uncertainties associated with climate projections and emphasizes the need for multiple models in assessments. The assessment utilized an Integrated Modeling System designed for rural coastal watersheds that has been calibrated and validated in an earlier study by Lyra et al. (2021) [31]. This system includes interconnected models for surface water hydrology, nitrate leaching/agronomic modeling, and ground-water modeling. These models effectively simulate groundwater flow and the behavior of contaminants such as nitrates and chlorides.

2. Materials and Methods

2.1. Study Area

Almyros Basin is the most important system of water resources with intensive irrigation activity in coastal Thessaly, and, according to the Thessaly Basin Management Plan, it is in poor condition due to quantitative and qualitative degradation. This degradation is a result of various factors, such as the lack of proper water resource management, the absence of an organized irrigation network, increased groundwater pumping, cultivation of water-demanding crops, and excessive use of fertilizers. Since there are no significant surface water resources, the area relies heavily on groundwater pumping, which has caused significant problems for the Almyros aquifer system in terms of quantity and quality [31]. The Almyros Basin is the only coastal plateau of Thessaly and includes six watersheds—Kazani, Lahanorema, Holorema, Xirias, Platanorema, and Xirorema [31]. The total area of the Almyros Basin is about 856 km2, which is located 32 km2 in the Kazani, 141 km2 in the Lahanorema, 192 km2 in the Holorema, 216 km2 in the Xirias, 96 km2 in the Platanorema, and 173 km2 in Xirorema. Typical semi-arid Mediterranean climatic conditions prevail, where air temperature and relative humidity significantly fluctuate throughout the year. In the summer, usually, elevated temperatures and low relative humidity prevail, while, in winter, the temperature is low and relative humidity is high. In autumn and winter, precipitation occurs more frequently, with higher levels in mountainous areas. The climate varies based on elevation, with warm and semi-arid conditions up to 500 m, warm and wet between 700 m and 900 m, and cold and wet at higher elevations. The average annual temperature is about 15 °C, and on average, there is about 570 mm of precipitation. The low-lying areas have a thriving agricultural sector, which drives the region’s economy. Covering an area of 293 km2, the Almyros groundwater system lies in the coastal and lowest region of the watershed, as displayed in Figure 1.

2.1.1. Geology and Hydrogeology

A characteristic of the Almyros basin is the relative sinking of the eastern part of the basin concerning the west due to geotectonic actions [31]. Quaternary river deposits cover a large part of the Almyros basin placed upon geological layers with primary porous flow. The neogenic formations cover smaller areas while located in the central and north of the Lahanorema and Holorema and even smaller areas in the Xiria and Xirorema watersheds. The aquifer is in direct contact with the sea along its coastal boundary. The hydrogeological formations of the Almyros aquifer are illustrated in Figure 2a.

2.1.2. Hydraulic Heads and Nitrate Concentrations

Climate change is expected to reduce the availability and quality of surface water as well as groundwater. Nitrate leaching concentrations depend on the amounts of applied water for irrigation. Hydraulic conductivity and aquifer layer directions and inclinations have an impact on the length of time that nitrates persist in groundwater. Water table fluctuations are contingent upon factors such as the area covered by irrigation, the volume of groundwater taken out for irrigation, and the groundwater horizons’ hydraulic conductivity [23]. The groundwater hydraulic heads of the aquifer system have a downward trend, especially in the lowlands and the northern coastal areas, where the water levels drop below the Mean Sea Level. The southern area also exhibits a lowering of more than 10 m during the observed period from 1991 to 2018. The aquifer system is recharged by approximately 19 hm3/y, and the groundwater abstractions are estimated at approximately 29 hm3/y, resulting in a deficient water budget of approximately 12 hm3/y [31]. The groundwater abstractions are used mostly for agricultural irrigation water use, although there are a few wells used for drinking water supply, many of them located in the nitrate polluted areas. Excesses of nitrate concentrations (NO3) are found in areas located in the central and southern aquifer, but also in the coastal area (Figure 2b). High nitrate concentrations are usually observed in areas with clayish geological materials.

2.2. Integrated Modeling System (IMS) and Source Information

An Integrated Modeling System has been used to simulate both groundwater and surface water resources of the Almyros Basin. The Integrated Modeling System is composed of interlinked mathematical models of surface hydrology (UTHBAL) [32], aquifer system’s hydrology (MODFLOW) [33], nitrogen leaching processes (REPIC) [23,31], and groundwater nitrates mobility with advection and dispersion (MT3DMS) [34]. To compute watershed flows and groundwater recharge, the UTHBAL model integrates areal temperature, precipitation, and potential evapotranspiration using monthly sequences. The Thornthwaite method has been utilized to assess potential evapotranspiration [35] based on the geographical latitude of the studied area, as shown in Equation (1).
E p = 16   ·   10 · t i J α   ·   μ · N 360
where E p is the potential evapotranspiration in mm/month, t i is the mean monthly temperature in °C, μ is the number of days, N is the average astronomical duration of a day, J is an annual index related to temperature, and α is an empirical parameter that depends on the index J ( α = 0.016 · J + 0.5 ) .
The model can be used in diverse ways (lumped, semi-distributed, or fully distributed) depending on the available data. It has six calibrated/estimated parameters. In particular, from October 1961 to September 2018, the study employs the UTHBAL model as a semi-distributed model to simulate surface hydrological procedures within the six Almyros sub-basins. The parameters include the monthly melt rate factor (Cm = 6 mm/°C), the coefficient of actual evapotranspiration (α = 0.48), the coefficient of interflow (β = 0.033), the coefficient of baseflow (γ = 0.033), the coefficient of groundwater recharge (K = 0.68). The values of these parameters were taken from the regionalized application of UTHBAL in Thessaly since there are no runoff/streamflow measurements in the Almyros Basin that could be used for the model calibration. The weighted average Curve Number of the US Soil Conservation Service is estimated using Land Cover/Land Use and soil data for each sub-basin (e.g., CNKazani = 67.93, CNLahanorema = 68.11, CNHolorema = 68.47, CNXirias = 60.69, CNPlatanorema = 51.07, and CNXirorema = 53.84) [31]. Groundwater recharge is enriched with the weighted average irrigation return flow of the different crops for watersheds. The MODFLOW model’s influxes are defined as irrigation return flow, recharge of groundwater, a net monthly rise of sea level -advanced at the start of the hydrological season in Greece (October), and shoreline conductance, while water outfluxes are established on a monthly timestep structure according to rural, urban, and other water needs. The model utilizes a one-layer rectangular grid of 200 rows and 200 columns, each cell measuring approximately 150 m × 150 m. Unconfined aquifer simulation is implemented using the Layer Property Flow package. In the western part, a No-Flow Boundary condition was applied due to the impervious nature of adjacent geological formations, and in the eastern part, a Transient Head Boundary was used for the rising sea level. Hydraulic conductivity was simulated in zones based on hydrogeological characteristics, with values ranging from 0.1–18.7 m/day. By adjusting the amount of nutrients and irrigated water per basin and crop category, the REPIC model simulates agronomic procedures. The REPIC model is a spatially distributed framework for assessing nitrate leaching and crop growth. It is an advancement of the Environmental Policy Integrated Climate (EPIC) model and developed using the R programming language via the R-ArcGIS Bridge in ArcGIS 10+/Pro [23,31]. Land use, climate, agricultural schemes, and other parameters are among the input data. Each grid cell in REPIC represents a specific crop type, and the model incorporates the groundwater recharge from the UTHBAL surface hydrology model to estimate nitrate leaching in mg/L. The model is divided into rectangular cells, approximately 300 m × 300 m in size. Notably, each REPIC cell corresponds to four MT3DMS cells. Crop yield and nitrate leakage are examples of REPIC results. The MT3DMS simulation uses the former as input data and simulates the movement of nitrates in the aquifer system. It typically relies on a pre-solved groundwater flow problem provided using MODFLOW. MT3DMS is compatible with any finite difference model, like MODFLOW. This compatibility is established on the condition that concentration variations over space and time minimally affect the regional water flow pattern and that both codes share a consistent structure of the aquifer model. The longitudinal dispersivity values for the studied aquifer range from 0.07 to 30 m [31].
Most of the Integrated Modeling System modules were calibrated and validated in the study of Lyra et al. in 2021 [31], except for the UTHBAL model due to a lack of surface runoff/streamflow data. The MODFLOW model showed high performance in calibration (1991–2009) and validation (2013–2015), with Nash-Sutcliffe Efficiency (NSE), R2, and Index of Agreement (IA) values of 0.975, 0.981, and 0.993, respectively. MODFLOW maintained its high performance in the validation phase, with increased NSE, R2, and IA scores of 0.997, 0.997, and 0.999, respectively. Similarly, the REPIC model demonstrated high accuracy in calibration (2007–2012), with NSE, R2, and IA scores of 0.98, 0.99, and 0.99, respectively. REPIC also upheld its effectiveness in the subsequent validation period (2013–2018), with scores of 0.92, 0.96, and 0.99 for NSE, R2, and IA, respectively. The MT3DMS model showed robust performance in calibration (1992–2004), with NSE, R2, and IA values of 0.80, 0.87, and 0.95, respectively. Its validation (2013–2015) for NO3 concentrations maintained substantial accuracy, with scores of 0.82, 0.96, and 0.95 for NSE, R2, and IA, respectively. These results emphasize the reliability and consistency of the IMS models across distinct temporal phases and observed variables. The study completed by Lyra et al. in 2021 [31] involved extensive pre-processing, verification, and usage of observational data collected over many years of surveillance for the Almyros Basin and its aquifer system. The main goal was to validate and calibrate the Integrated Modeling System’s modules. The climate data (precipitation and temperature) for the region was collected from six meteorological stations within and outside the basin, including data from various sources such as the Hellenic Meteorological Service and private meteorological stations. The locations of the stations are depicted in Figure 1. These data were processed to serve as input for the simulations using the REPIC and UTHBAL models, respectively. The monthly precipitation was estimated using the Thiessen polygon method with the gradient method at watershed centroids. The monthly temperature was estimated using the gradient method at watershed centroids. The Greek Payment Authority provided spatial datasets of arable land and crop yields. Soil hydraulic properties databases from the European Soil Data Centre were also included [36]. The Hellenic Survey of Geology and Mineral Exploration, Magnesia Prefecture, and Regional Government of Thessaly provided field measurements of water levels, nitrates, and chlorides in groundwater. Former studies also added new measurements of nitrate and chloride contents in the Almyros aquifer [31]. Borehole point data was used to identify water pumping installations [37]. In order to model the Almyros water system accurately in the context of climate change, datasets for future temperature, precipitation, and sea level changes were needed for this work. Based on satellite data [38], the mean sea level rise is estimated to be 0.05 m from 1991 to 2018. The Almyros coastline sees a linear trend of 3.6 mm/y during this time. The projected sea level rise for the period from 2081–2100 concerning RCP8.5 and RCP4.5 scenarios, respectively, is projected to be a net rise of 0.3 m and 0.6 m, respectively. This translates to a rate of 6.3 mm/y along the coastline of Almyros Basin. The source data and information needed for the Integrated Modeling System are summarized in Table 1.

2.3. Quantile Empirical Mapping

Climate change scenarios are studied with the help of global and regional circulation models, which simulate the future climate to 2100. The results of climate models’ simulations used for the precipitation and temperature came from the Mediterranean Coordinated Regional Downscaling Experiment (Med-CORDEX). The results of the Med-CORDEX program are the free outputs/results of simulations of historical and future climate simulations. GCM/RCM’s precipitation and temperature feature empirical distributions (ECDFs), just as the observed precipitation and temperature [23].
The empirical CDF probability quantiles are estimated with the general estimation rule [39], where xi is the ith increasing-ordered value, and N is the count of data. Quantile Empirical Mapping modifies the distribution of GCM/RCM output to the distribution of observed data by adapting the quantiles of the GCM/RCM distribution (see Supplementary Materials). All statistical characteristics of the GCM/RCM’s distribution, such as the mean, variation, median, wet days, etc., are bias-corrected along with the time-series values. The Quantile Empirical Mapping method is performed by using Equation (2) for temperature and precipitation, respectively, where F t , o b s e r v e d 1 is the inverse transfer function of the observed CDF, FGCM/RCM is the climate model output.
y t , f u t = F t , o b s e r v e d 1 F GCM / RCM x t
The method of Quantile Empirical Mapping has been applied to 19 climatic model outputs of Med-CORDEX (Mediterranean Coordinated Regional Downscaling Experiment) to correct the differences between their values and the variables that have been observed in the study area. The method was applied for the adverse climate change impacts scenario, RCP8.5, and the medium one, RCP4.5, on the centroids of the watersheds of the Almyros basin [23]. The available climatic models for the study area are displayed in Table 2.

2.4. Performance Evaluation and Classification

The performance of the Bias Correction method of Quantile Empirical Mapping (QEM) of the climatic models has been evaluated against the observed climate of the historical period, with statistical measures of efficiency. These measures are the coefficient of determination (R2), Nash-Sutcliffe Efficiency (NSE), Index of Agreement (IA), Kling-Gupta Efficiency (KGE) [40], and Volumetric Efficiency (VE) [41]. Their mathematical formulas are shown in Equations (3)–(7). In Equation (3), SSres is the sum of the squares of the residuals (that is, the deviations of the predicted value from the actual value), and SStot is the total sum of the squares of the predicted values, reduced by the average value. In Equations (4), (5), and (7), yi is the simulated value, and xi is the observed value. In Equation (6), the term of the square root represents the Euclidean distance between the observed and the simulated values, r is the Pearson correlation, α the variability of the residuals as the ratio of the variance of the bias-corrected values to the variance of the observed values (α = σyx), and β the mean bias fraction as the ratio of the average of bias-corrected values to the average of the observed values (β = y ¯ / x ¯ ).
R 2 = 1 S S r e s S S t o t                           [ 0 , 1 ]
N S E = 1 i = 1 n y i x i 2 i = 1 n x i x ¯ 2                     ( , 1 ]
I A = 1 i = 1 n y i x i 2 i = 1 n ( y i x ¯ + x i x ¯ ) 2                             [ 0 , 1 ]
K l i n g G u p t a   E f f i c i e n c y   K G E = 1 r 1 2 + α 1 2 + β 1 2                               ( , 1 ]
V E = 1 i = 1 n y i x i i = 1 n x i                             [ 0 , 1 ]  
According to the scores of each statistical metric, the bias-corrected climatic models are sorted in descending order of performance. Their relative order performance scores are then aggregated, and according to the final cumulative value, the best-fitted models are identified and evaluated for further study and application with the Integrated Modeling System (IMS).

3. Results

The Integrated Modeling System created in the previous studies of Lyra et al. (2021) [31] and Lyra and Loukas (2022) [23] has been used to simulate and project future climate change scenarios for the Almyros basin in Thessaly, Greece, for both the adverse and medium impacts (RCP8.5 and RCP4.5). The final results are displayed for individual climatic models under two Representative Concentrations Pathways (8.5 and 4.5) for selected periods where critical (significant) temporal variations of the study hydrologic variables (e.g., precipitation, temperature, runoff, nitrate leaching, and other water balance components) are identified. Furthermore, special focus is given to crucial geographical areas pinpointed for nitrate pollution, where nitrate concentrations exceed permissible (acceptable) limits.

3.1. Statistical Downscaling and Bias Correction with Quantile Empirical Mapping

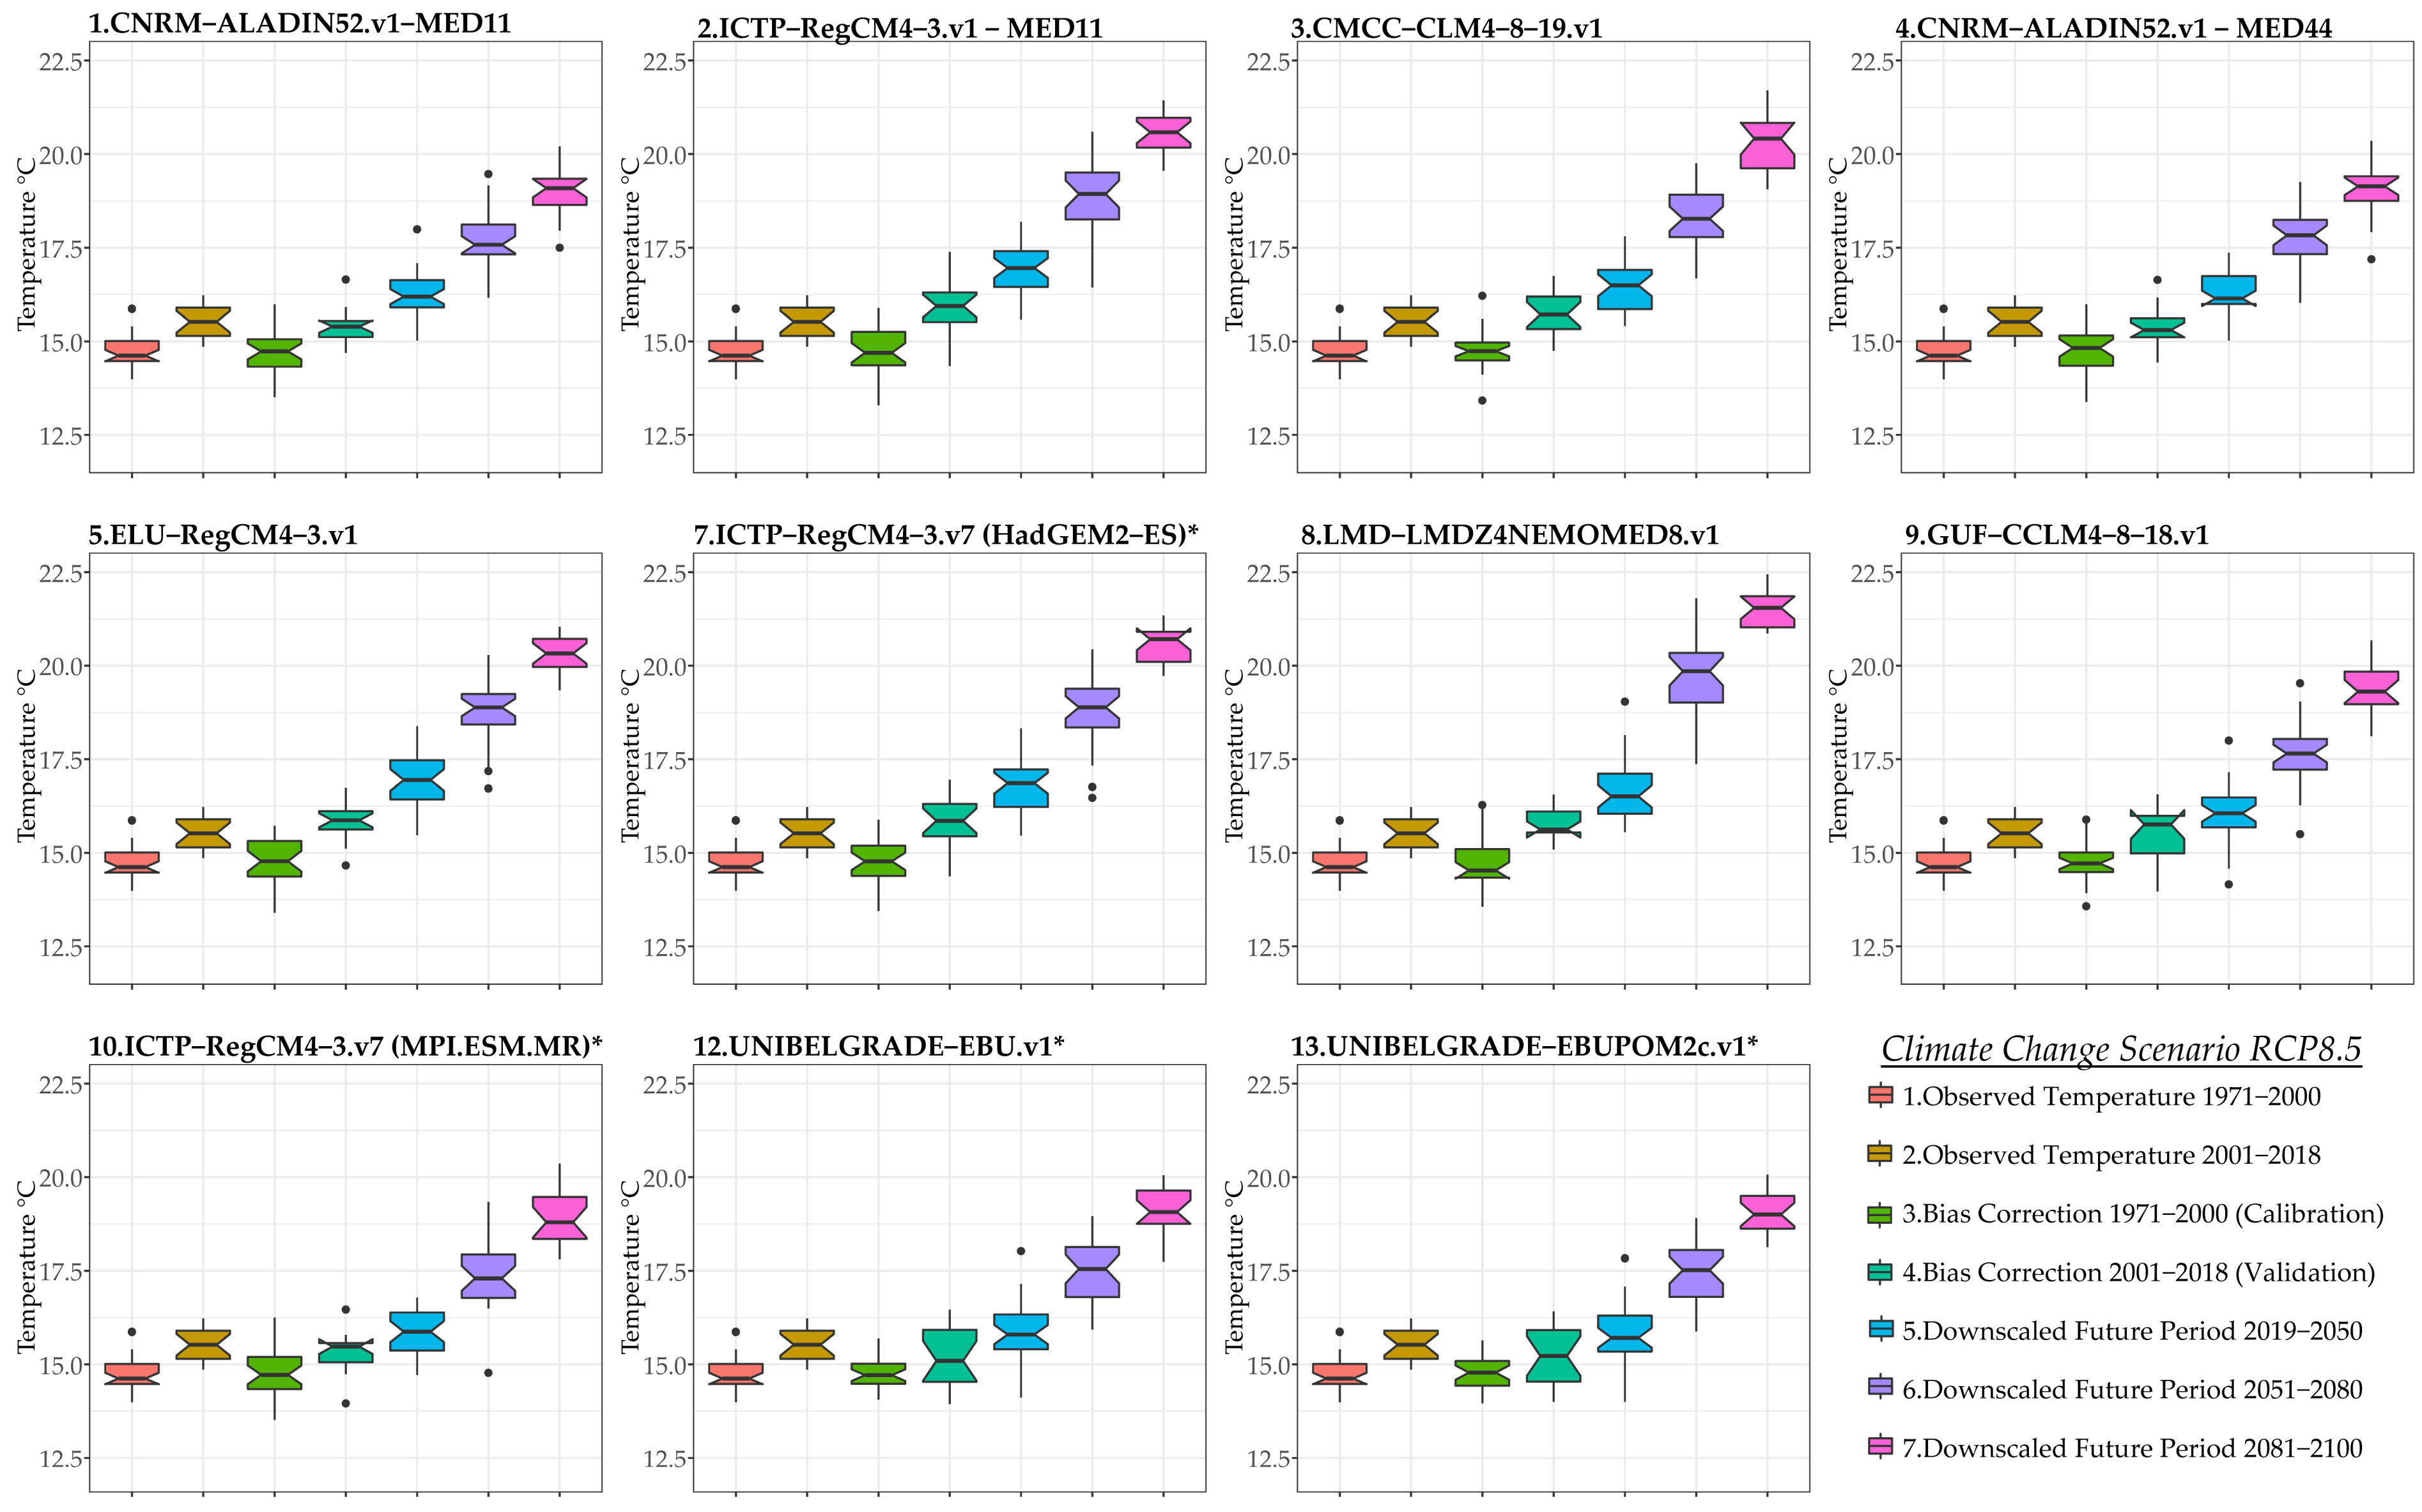
The application of the Quantile Empirical Mapping (QEM) downscaling method showed that the downscaled precipitation values are in agreement with the historical observed precipitation values. Box-Whisker plots have been designed for the variables of precipitation and temperature for each climatic Med-CORDEX scenario, namely RCP8.5 and RCP4.5. The box plots are depicted with distinct colors for each time period studied: 1991–2000, 2001–2018, 2019–2050, 2051–2080, and 2081–2100. Figure 3 illustrates Box-Whisker plots for mean annual precipitation under the RCP8.5 scenario for each bias-corrected climatic model with Quantile Empirical Mapping. The boxplots are designed with notches to distinguish the statistical significance of the median values of the studied time periods. When the ranges of the notches overlay, the median values are not statistically different at the 5% significance level. Regarding the historical observed periods 1971–2000 (calibration period) and 1991–2018 (validation period), there is a minor increase in the mean value of annual precipitation and, respectively, the notches change. The notches’ ranges overlay, hence, they are not statistically different. The inverted notch of the period 2001–2018 indicates the interquartile range of the timeseries (50% of the data) and a relative asymmetry of the spread of the timeseries of the period towards the lower values, which means that there were more years of low annual precipitation of this time period. Under RCP8.5, the results indicate that the bias-corrected models 1.CNRM-ALADIN52v1 (MED-11), 2.ICTP-RegCM4-3v1*, 4.CNRM-ALADIN52.v1 (MED-44), and 5.ELU-RegCM4-3_v1 underestimate the historical annual precipitation, while the models 3.CMCC-CLM4-8-19.v1, 8.LMD-LMDZ4NEMOMED8.v1, 9.GUF-CCLM4-8-18.v1, 12.UNIBELGRADE-EBU.v1* overestimate more or less the annual precipitation. The models that present good agreement with the historical mean values are the 7.ICTP-RegCM4-3.v7* (HadGEM2), 10.ICTP-RegCM4-3.v7* (MPI-ESM-MR) and 13.UNIBELGRADE-EBUPOM2c.v1*. 
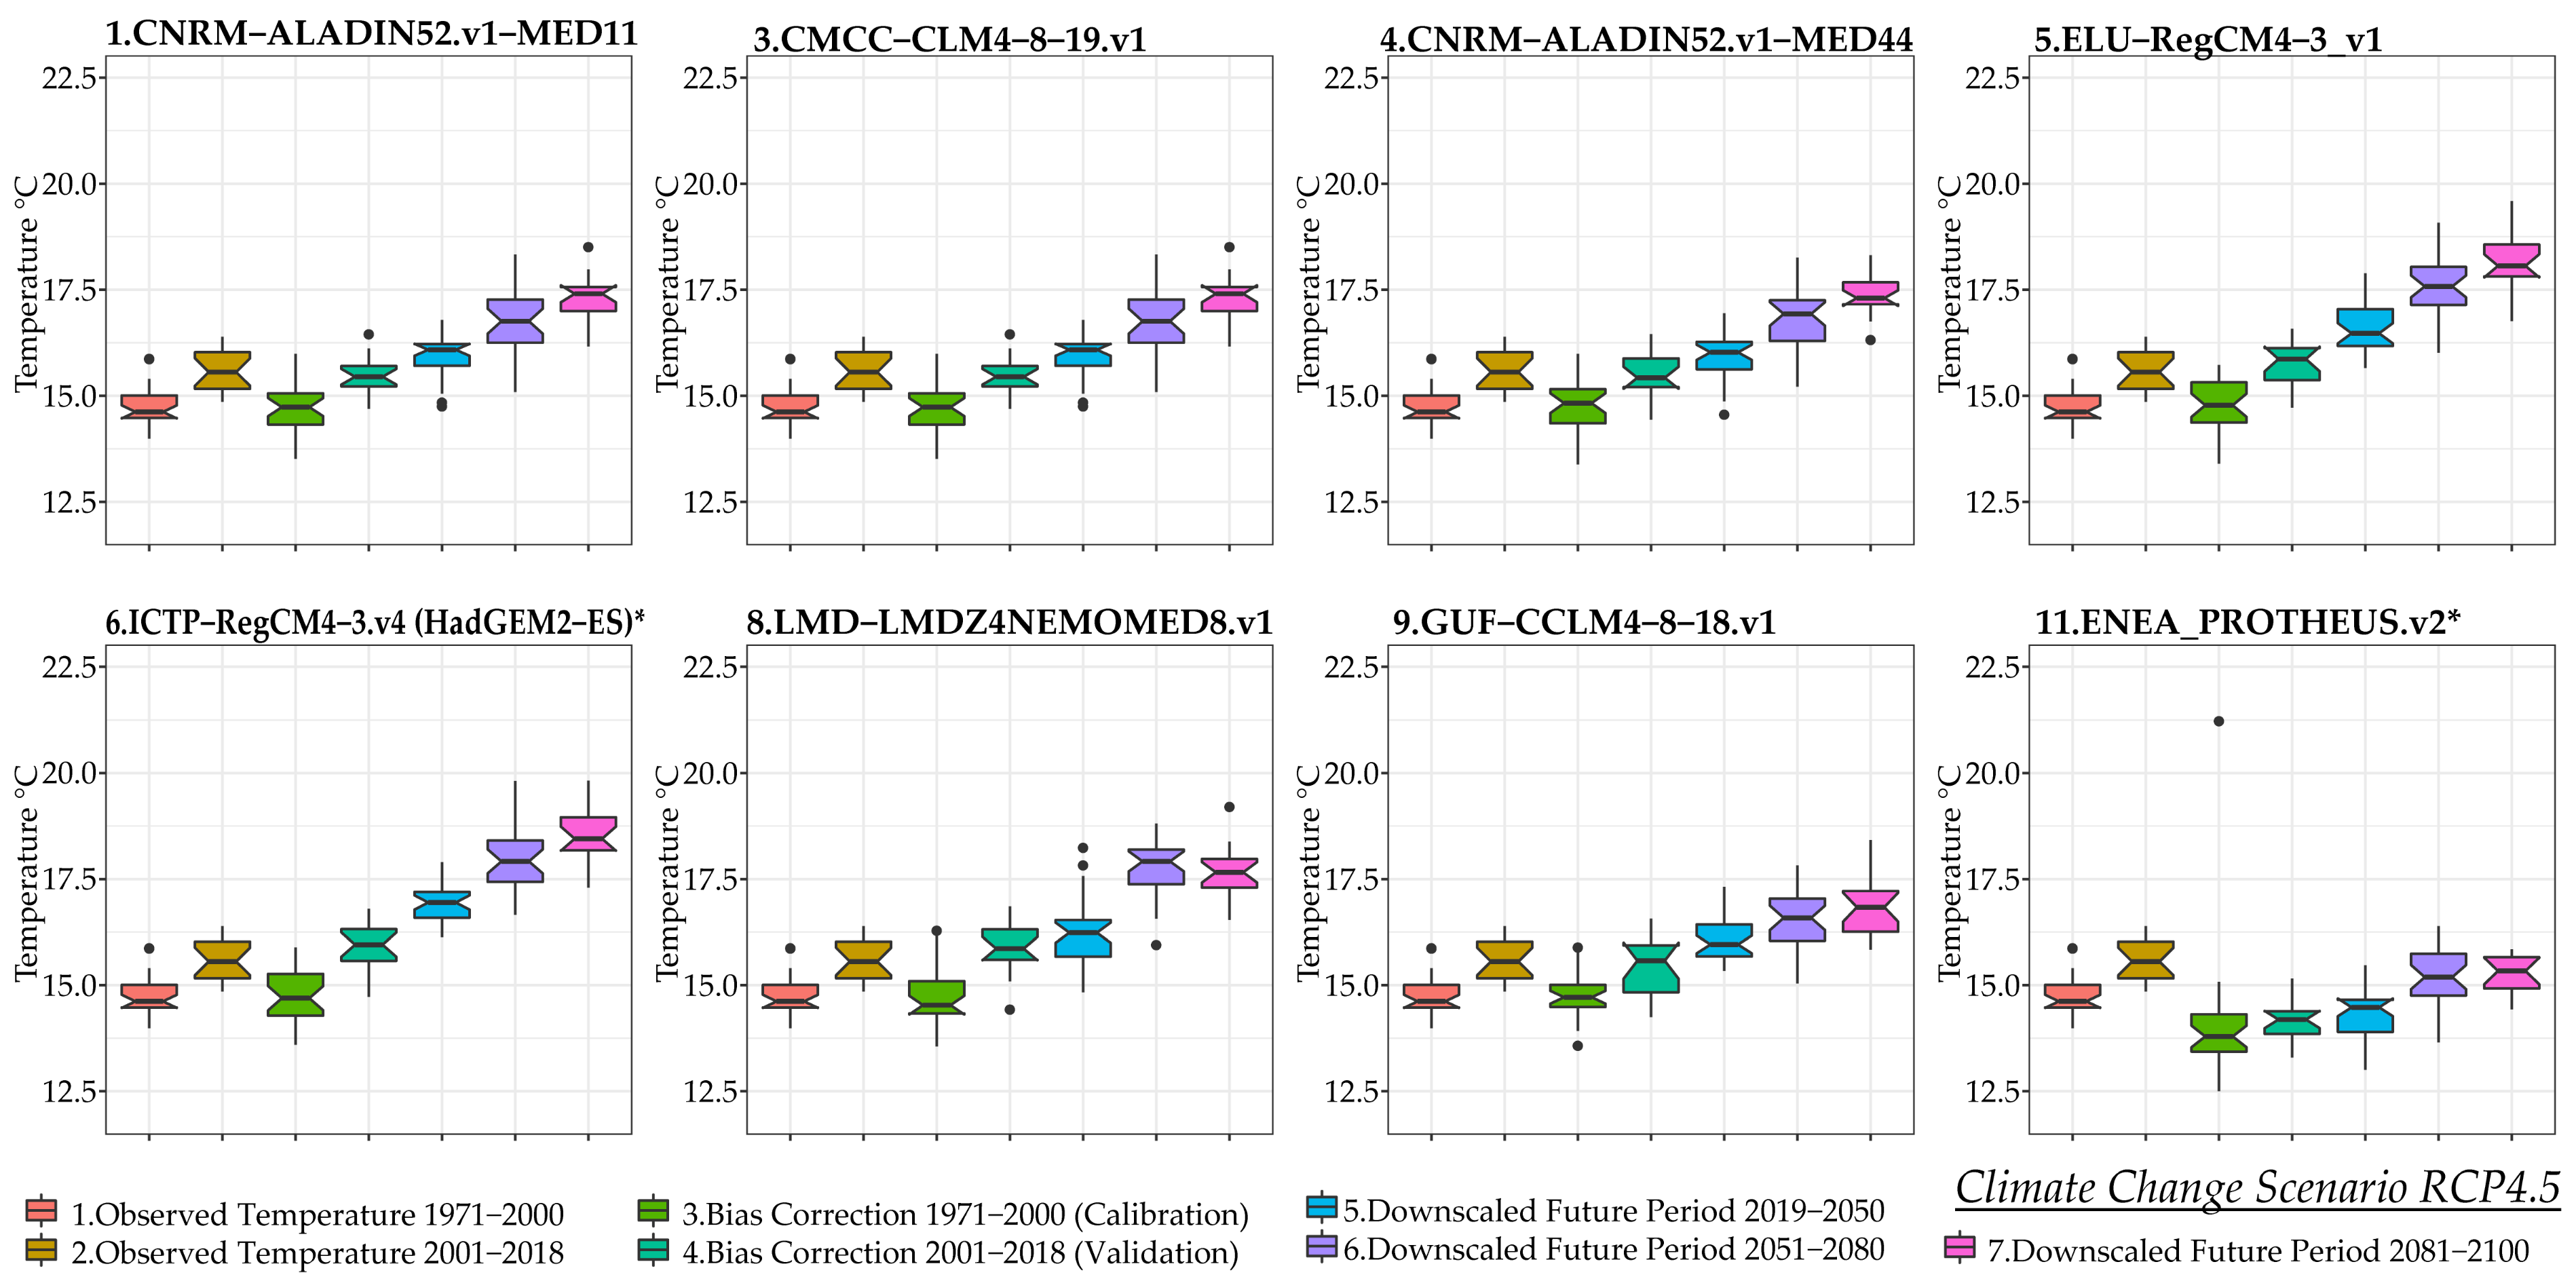
Figure 4 illustrates Box-Whisker plots for mean annual precipitation under the RCP4.5 scenario, for each bias-corrected climatic model with Quantile Empirical Mapping. The results indicate that the bias-corrected models 1.CNRM-ALADIN52.v1 (MED-11), 4.CNRM-ALADIN52v1 (MED-44), 5.ELU-RegCM4-3v1, 6.ICTP-RegCM4-3v4*, 11.ENEA-PROTHEUSv2* underestimate the historical annual precipitation. The models 3.CMCC-CCLM4-8-19v1, and 8.LMD-LMDZ4NEMOMED8v1 overestimate the historical annual precipitation. The only model that accurately estimates the historical annual precipitation is the 9.GUF-CCLM4-8-18v1. However, all bias-corrected models present similar decreases in annual precipitation of the future periods 2019–2050, 2051–2080, and 2081–2100.
Figure 5 presents Box–Whisker plots for bias-corrected and downscaled mean annual temperature under the RCP8.5 scenario. Regarding the historical observed periods 1971–2000 (calibration period) and 1991–2018 (validation period), there is a minor increase in the mean value of annual temperature and, respectively, the notches change. The notches’ ranges do not overlay hence, the medians are statistically different. The notch of the period 1971–2000 indicates the interquartile range of the timeseries (50% of the data) and a relative asymmetry of the spread of the timeseries of the period towards the lower values, which means that there were more years of low annual temperature of this time period. On the contrary, the symmetrical shape of the time period 2001–2018 indicates the increase in the number of years with increased annual mean temperature. The results show for the calibration period that the bias-corrected climatic models 3.CMCC-CCLM4-8-19v1 and 9.GUF-CCLM4-8-18v1 are in excellent agreement with the mean and variance of the historical annual temperature timeseries. The bias-corrected climatic models 4.CNRM-ALADIN52v1, 10.ICTP-RegCM4-3.v7*(MPI-ESM-MR), and 13.UNIBELGRADE-EBUPOM2cv1* also show a robust fit for mean annual temperature.
For RCP4.5, Figure 6 displays Box-Whisker plots for mean annual temperature, indicating that the bias-corrected models 1.CNRM-ALADIN52v1, 3.CMCC-CCLM4-8-19v1, 4.CNRM-ALADIN52v1 and 9.GUF-CCLM4-8-18v1, again show good agreement with the historical temperature time series. In general, there is a steady pattern of precipitation trend in all bias-corrected climate models.
The performance of QEM model results is evaluated and compared below using the employed statistical metrics. In Table 3, the performance of Quantile Empirical Mapping on precipitation is displayed for each climatic model, based on which a relative additive classification of the models has been made. The performance of bias-corrected precipitation, as indicated by the evaluation metrics under the RCP4.5 and RCP8.5 scenarios, presents an interesting perspective across different climatic models. Under the RCP8.5 scenario, the 7.ICTP-RegCM4-3.v7* (HadGEM2), 13.UNIBELGRADE-EBUPOM2cv1*, and 2.ICTP-RegCM4-3v1* models stand out with high R2 values, signifying a strong correlation with observed precipitation data. According to this classification, the bias-corrected models 7.ICTP-RegCM4-3.v7 and 13.UNIBELGRADE-EBUPOM2c.v1 are tied.
In this case, the statistical scores of Nash-Sutcliffe Efficiency (NSE) and Volumetric Efficiency (VE) are conclusive. The bias-corrected model 13.UNIBELGRADE-EBUPOM2cv1* presents better performance, even though not quite different from the bias-corrected model 7. However, the bias-corrected model 7.ICTP-RegCM4-3.v7* (HadGEM2) performs a better adaptation according to R2 and, hence, a better seasonality of the precipitation values. The 7.ICTP-RegCM4-3.v7* (HadGEM2) model particularly excels in NSE, IA, and KGE metrics, highlighting its robust performance in capturing precipitation patterns. However, the 8.LMD-LMDZ4NEMOMED8v1 model exhibits notable low VE and KGE, while high R2 and IA and mediocre NSE values indicate a potential overestimation of precipitation. Under the RCP4.5 scenario, it is observed that the values of precipitation present an excellent fit to the primary values of the variable for the historical period. The 9.GUF-CCLM4-8-18v1 model stood out with the highest R2 and VE values, indicating a strong correlation and explained variance. According to the additive classification procedure, the climatic model 9.GUF-CCLM4-8-18.v1 presents the best statistical fit. However, it overestimates the mean annual precipitation. In this case, the statistical scores of Nash-Sutcliffe Efficiency (NSE) και Volumetric Efficiency (VE) are conclusive, according to which the model 9.GUF-CCLM4-8-18v1 presents better performance than model 1.CNRM-ALADIN52.v1, and especially for the Volumetric Efficiency (VE), which is very important for ensuring the monthly and seasonal fitting of the bias-corrected values. The 11.ENEA-PROTHEUSv2* model, while showing lower R2, maintains competitive performance across other metrics.
In Table 4, the performance of Quantile Empirical Mapping on temperature is displayed for each climatic model based on which a relative classification of the models has been made. Under the RCP8.5 scenario, several models, such as 1.CNRM-ALADIN52.v1, 2.ICTP-RegCM4-3v1*, and 5.ELU-RegCM4-3v1 consistently exhibits high R2 and NSE values, indicating strong agreement with observed temperature data.
The 13.UNIBELGRADE-EBUPOM2cv1* model stands out with the highest R2 and NSE values, highlighting its accuracy in reproducing temperature patterns. However, the 9.GUF-CCLM4-8-18v1 model shows lower performance across these metrics. Under the RCP4.5 scenario, 1.CNRM-ALADIN52.v1 and 5.ELU-RegCM4-3v1 emerges as a top performer with high R2, NSE, and KGE values, suggesting robustness in simulating temperature patterns. The 11.ENEA-PROTHEUSv2* model, while demonstrating competitive performance, exhibits slightly lower scores in some metrics. The climate model that exists in both climate scenarios and shows remarkably high values of statistical measures, especially for the precipitation that is critical to the hydrological water system modeling is 9.GUF-CCLM4-8-18.V1. The other models were not available for both climate scenarios, so they could only be applied for one climate scenario.

3.2. Projected Surface Hydrology with the UTHBAL Model under Climate Change

The Thornthwaite method has been utilized to assess potential evapotranspiration [35] based on the geographical latitude of the studied area and the bias-corrected/downscaled monthly temperature of the Med-CORDEX climatic models for RCP8.5 and RCP4.5.
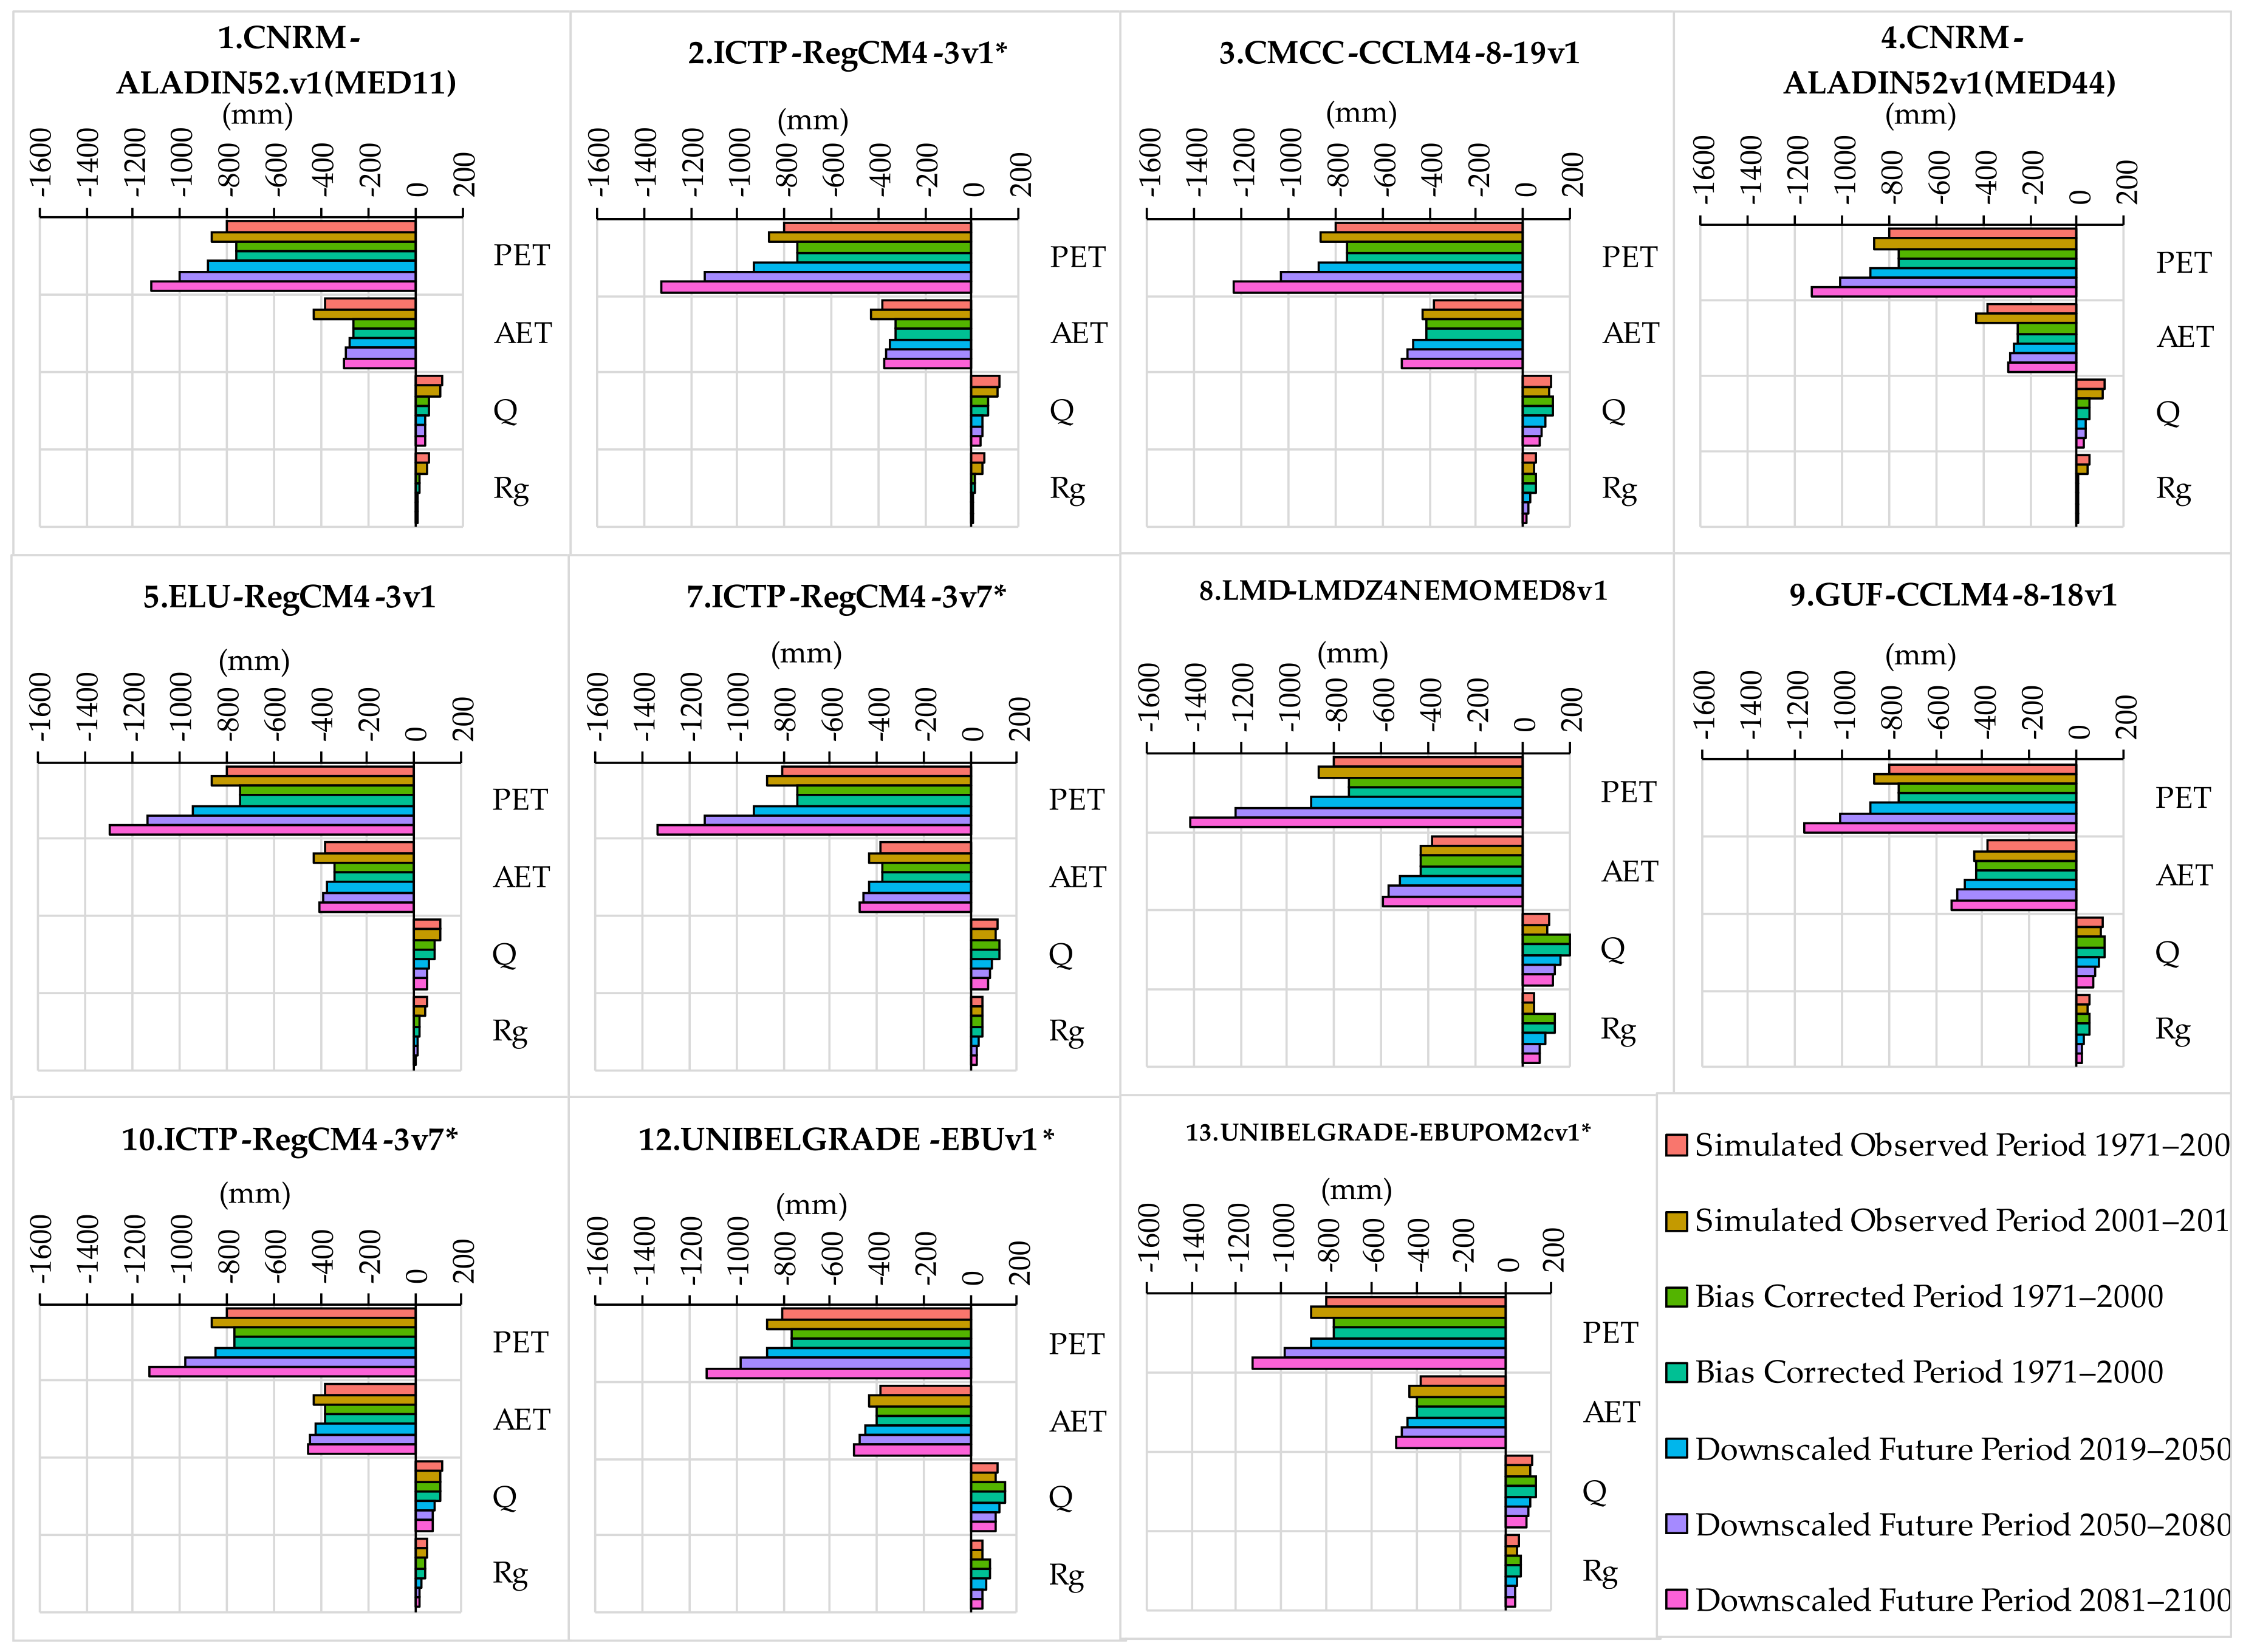
 Figure 7 and 
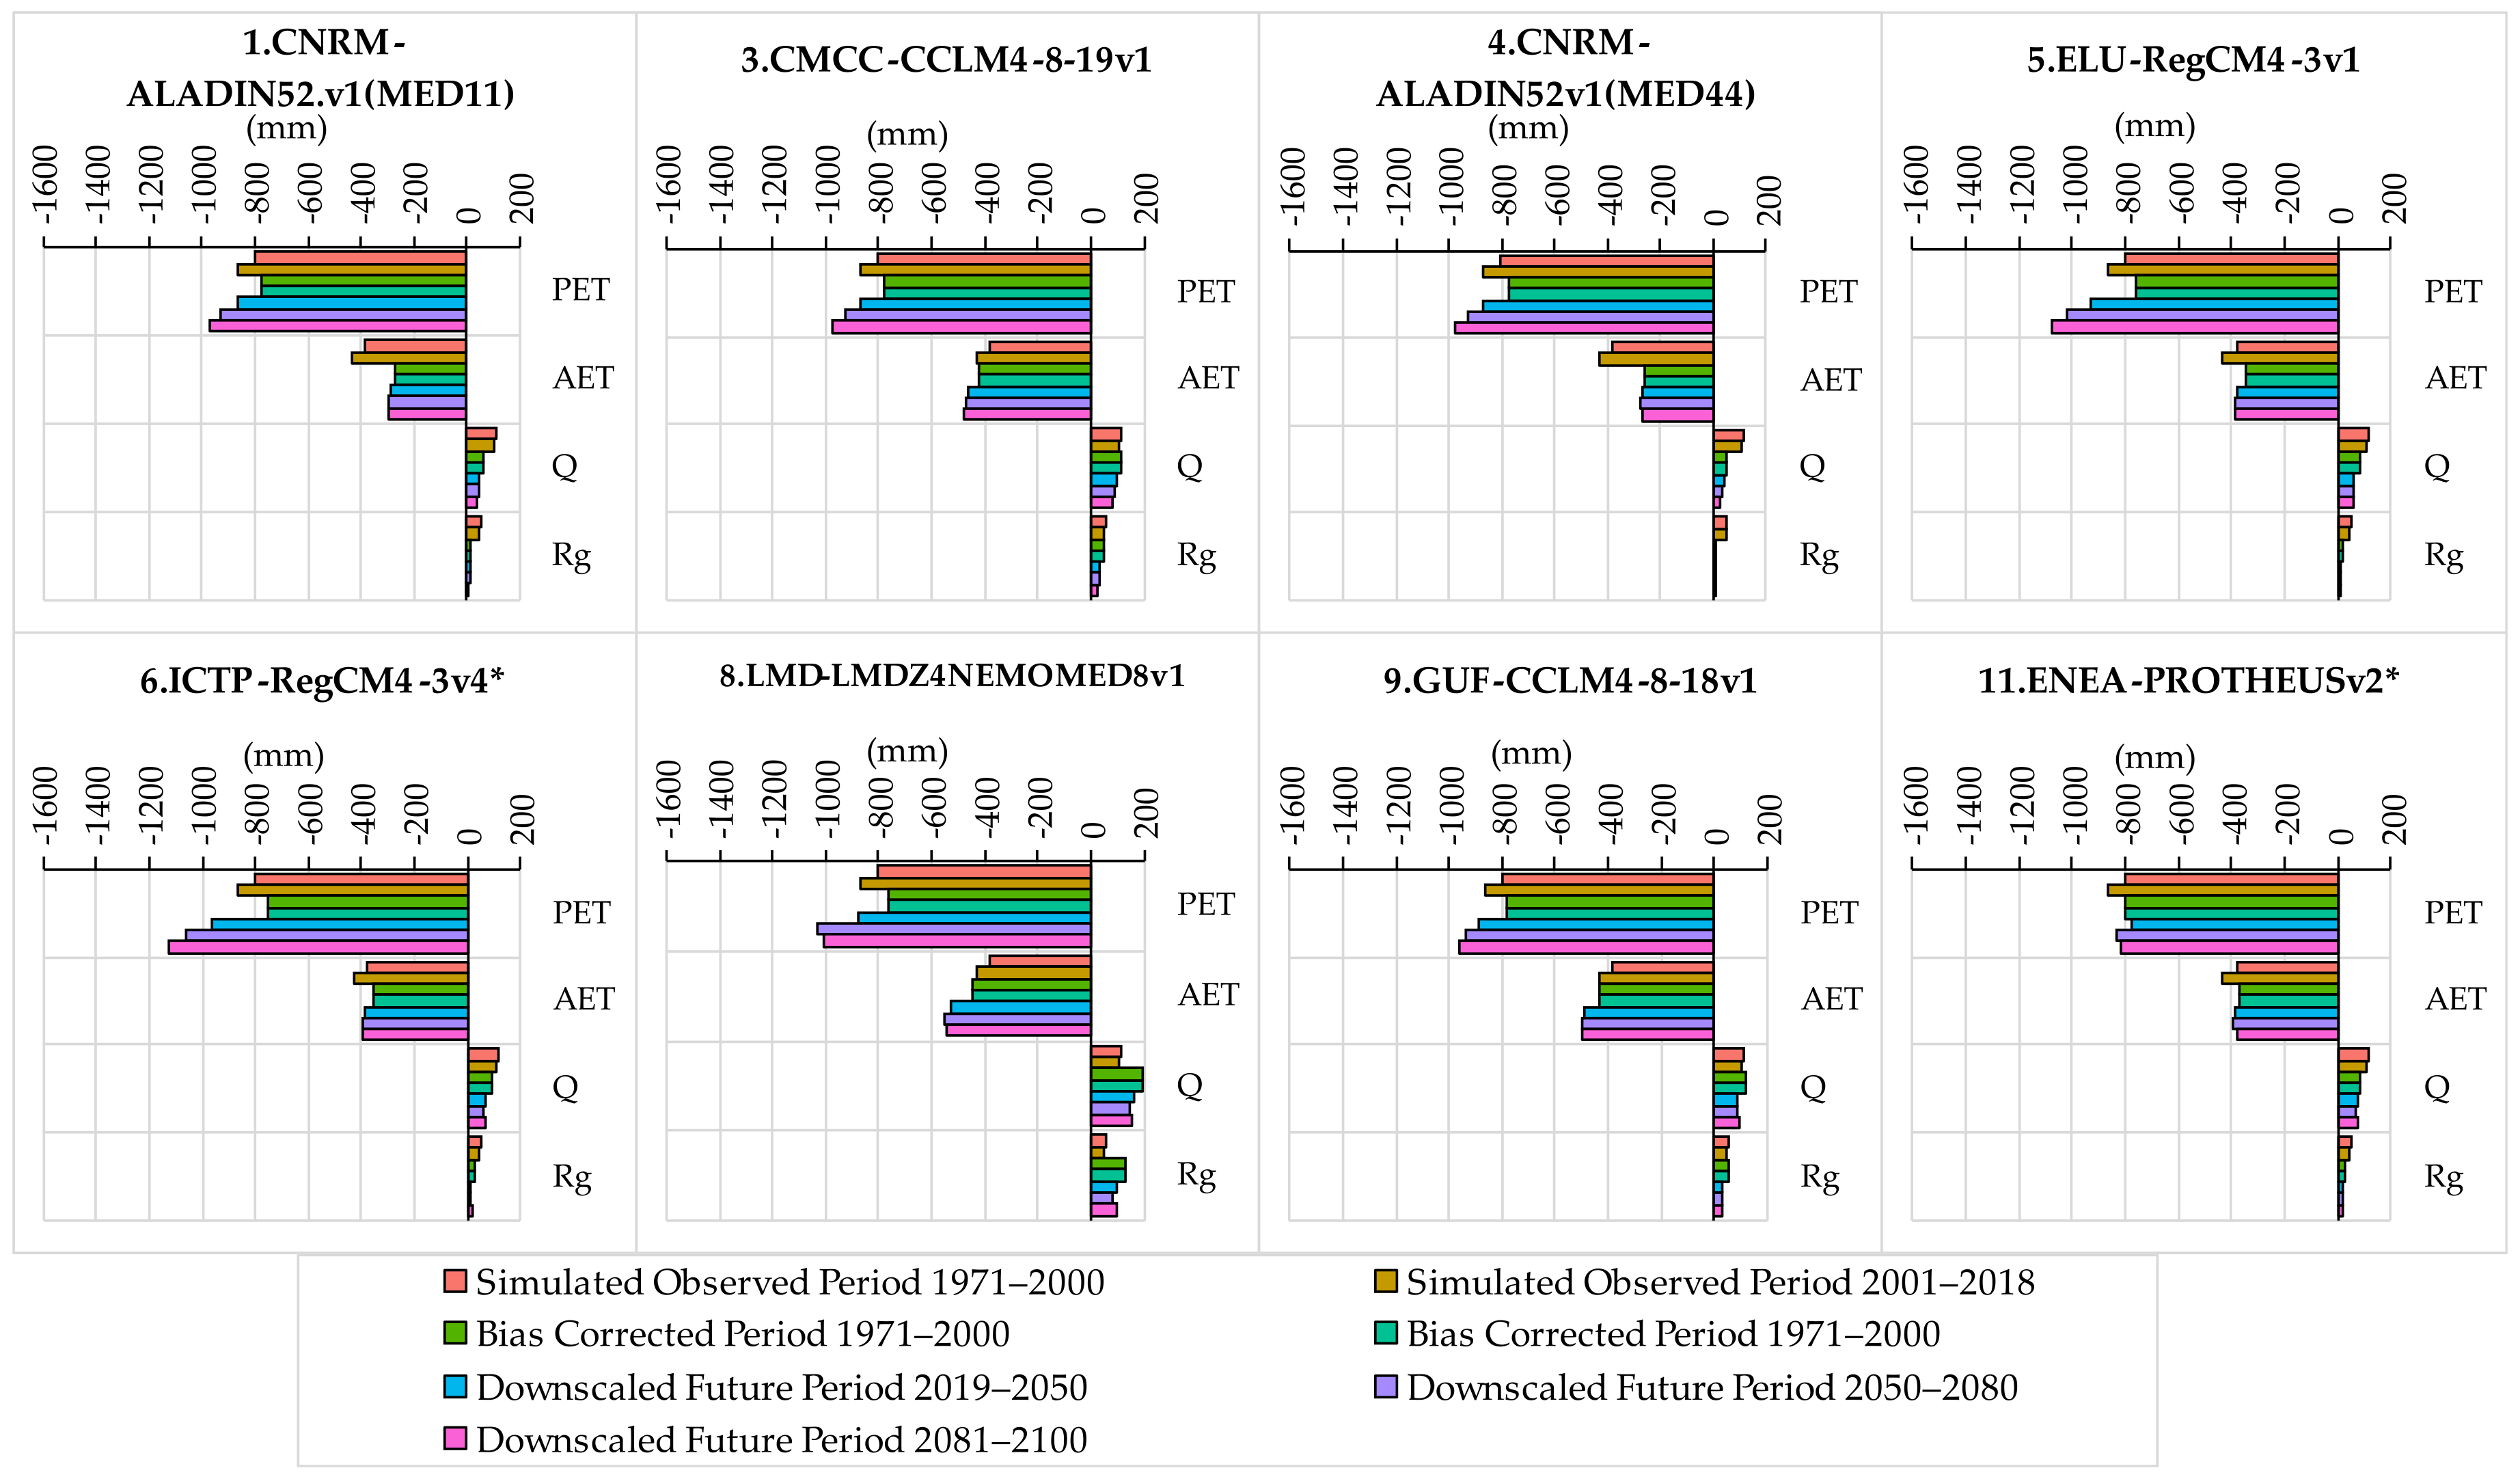
Figure 8 display the potential evapotranspiration for each climatic model under both RCPs, spanning historical periods (1991–2000, 2001–2018) and future intervals (2019–2050, 2051–2080, and 2081–2100). Observations from the charts reveal an increasing trend in potential evapotranspiration, with a more pronounced increase anticipated in the RCP8.5 scenario after 2051, while RCP4.5 shows a gentler upward trend. Under the RCP8.5 scenario, 1.CNRM-ALADIN52.v1 (MED-11) consistently projects high PET values across all observed periods, with a substantial increase from 1991–2000 to 2081–2100. Similarly, 2.ICTP-RegCM4-3v1* and 5.ELU-RegCM4-3v1 demonstrates upward trends in PET, indicating an intensification of potential evapotranspiration over the simulated years. The 9.GUF-CCLM4-8-18v1 and 12.UNIBELGRADE-EBUv1* models also project increasing PET values, though with some fluctuations. Under the RCP4.5 scenario, the PET projections show a similar increasing trend for most models, with 1.CNRM-ALADIN52.v1 (MED-11) and 3.CMCC-CCLM4-8-19v1 consistently demonstrates higher values. The 11.ENEA-PROTHEUSv2* model, however, diverges with a decrease in PET during the period 2019–2050.
Surface hydrology simulations are employed using the UTHBAL model from 1991 to 2100 using monthly timestep for the 19 climatic models of Med-CORDEX for both RCPs. The UTHBAL model estimates monthly mean areal values of Actual Evapotranspiration (AET), surface runoff (Q), and groundwater recharge (Rg). Figure 7 shows the mean annual simulated values for these variables during historical periods (1991–2000, 2001–2018) and future periods (2019–2050, 2051–2080, and 2081–2100). The simulated actual evapotranspiration (AET) with the UTHBAL model across different climatic models under the RCP4.5 and RCP8.5 scenarios shows variations over various periods. From the charts, it is observed that the actual evapotranspiration, similarly to the potential evapotranspiration, presents an increasing trend, and a larger increase is estimated in the climatic scenario RCP8.5, while in RCP4.5, it presents a milder increasing trend. Under the RCP8.5 scenario, the 8.LMD-LMDZ4NEMOMED8v1, and 9.GUF-CCLM4-8-18v1 models project an increase in AET from 1991–2000 to 2081–2100, with the 8.LMD-LMDZ4NEMOMED8v1 model consistently projects the highest values. The 3.CMCC-CCLM4-8-19v1, 12.UNIBELGRADE-EBUv1* and 13.UNIBELGRADE-EBUPOM2cv1* models also display increasing AET, suggesting enhanced evapotranspiration rates. The other models also exhibit an upward trend but with lower evapotranspiration rates. In the RCP4.5 scenario, similar trends are observed, with 8.LMD-LMDZ4NEMOMED8v1 consistently projects the highest AET values. The 3.CMCC-CCLM4-8-19v1 and 9.GUF-CCLM4-8-18v1 models show an increasing trend in AET, while the 11.ENEA-PROTHEUSv2* model exhibits fluctuations. The 1.CNRM-ALADIN52.v1 (MED-11), and 4.CNRM-ALADIN52v1 (MED-44) models present the lowest AET values, while all the other models show an increasing but milder trend in AET. Surface runoff and groundwater recharge present similar trends with the potential and actual evapotranspiration.
According to the RCP8.5 scenario, all models show a decreasing trend in surface runoff from 1991–2000 to 2081–2100, reflecting reduced runoff values. The 1.CNRM-ALADIN52.v1 (MED-11), 2.ICTP-RegCM4-3v1* and 4.CNRM-ALADIN52v1 (MED-44) models exhibit the lowest runoff values. The 3.CMCC-CCLM4-8-19v1, 7.ICTP-RegCM4-3.v7*(HadGEM2), 9.GUF-CCLM4-8-18v1, 12.UNIBELGRADE-EBUv1* and 13.UNIBELGRADE-EBUPOM2cv1* shows a milder decreasing trend in surface runoff than the other models, while the 8.LMD-LMDZ4NEMOMED8v1 model presents the highest runoff values. According to the RCP4.5 scenario, all models show a decreasing trend in surface runoff for all time frames. The 1.CNRM-ALADIN52.v1 (MED-11), and 4.CNRM-ALADIN52v1 (MED-44) models exhibit the lowest runoff values, similarly to RCP8.5. The 3.CMCC-CCLM4-8-19v1 and 9.GUF-CCLM4-8-18v1 models present a milder decreasing trend in surface runoff than the other models, while the 8.LMD-LMDZ4NEMOMED8v1 model presents the highest runoff values. Notably, the 11.ENEA-PROTHEUSv2* model displays fluctuations, emphasizing the complexity of surface runoff responses.
Groundwater recharge shows a decreasing trend for all climatic models under RCP8.5. The most reduced groundwater recharge is projected by the 1.CNRM-ALADIN52.v1 (MED-11), 2.ICTP-RegCM4-3v1*, 4.CNRM-ALADIN52v1 (MED-44) and 5.ELU-RegCM4-3v1 models. The 12.UNIBELGRADE-EBUv1* and 13.UNIBELGRADE-EBUPOM2cv1* exhibits a milder decreasing trend than the rest of the models, along with the 8.LMD-LMDZ4NEMOMED8v1 model presents the highest values of groundwater recharge. All models present a decreasing trend in groundwater recharge under RCP4.5 and also exhibit similar decreasing rates apart from the 8.LMD-LMDZ4NEMOMED8v1 model. The latter exhibits the highest values of groundwater recharge, as in RCP8.5. Fluctuations are noticed in the models that project high groundwater recharge values. However, in all models, the groundwater recharge is slightly larger in RCP4.5 than under RCP8.5.

3.3. Projected Nitrogen Leaching with the REPIC Model under Climate Change

The REPIC model was used for the simulation of the monthly nitrate leaching towards the Almyros aquifer for the climatic scenarios RCP8.5 and RCP4.5 from January 1991 until December 2100. The mean monthly values of nitrogen leaching are displayed in Figure 9 for each climatic model for the historical and future periods under RCP8.5 and in Figure 10 under RCP4.5. In examining the box plots depicting nitrogen leaching over different climate change periods, it is observed that nitrogen leached towards the aquifer follows the temperature change, although no simple statistical correlation between temperature and nitrogen leaching is established. Regarding the historical observed periods 1991–2000 (calibration period) and 1991–2018 (validation period), the mean value of annual nitrogen leaching remains stable, but the variability expands during the simulated observed period 2001–2018 and, respectively, the notches change. However, the notches’ ranges overlay, hence, the medians are not statistically different. Particularly, for the observed simulated base period 1991–2018, 40% of total annual nitrogen fertilization is leached towards the Almyros aquifer system, which approximates the average annual value of 42.7 kg/ha of nitrogen.
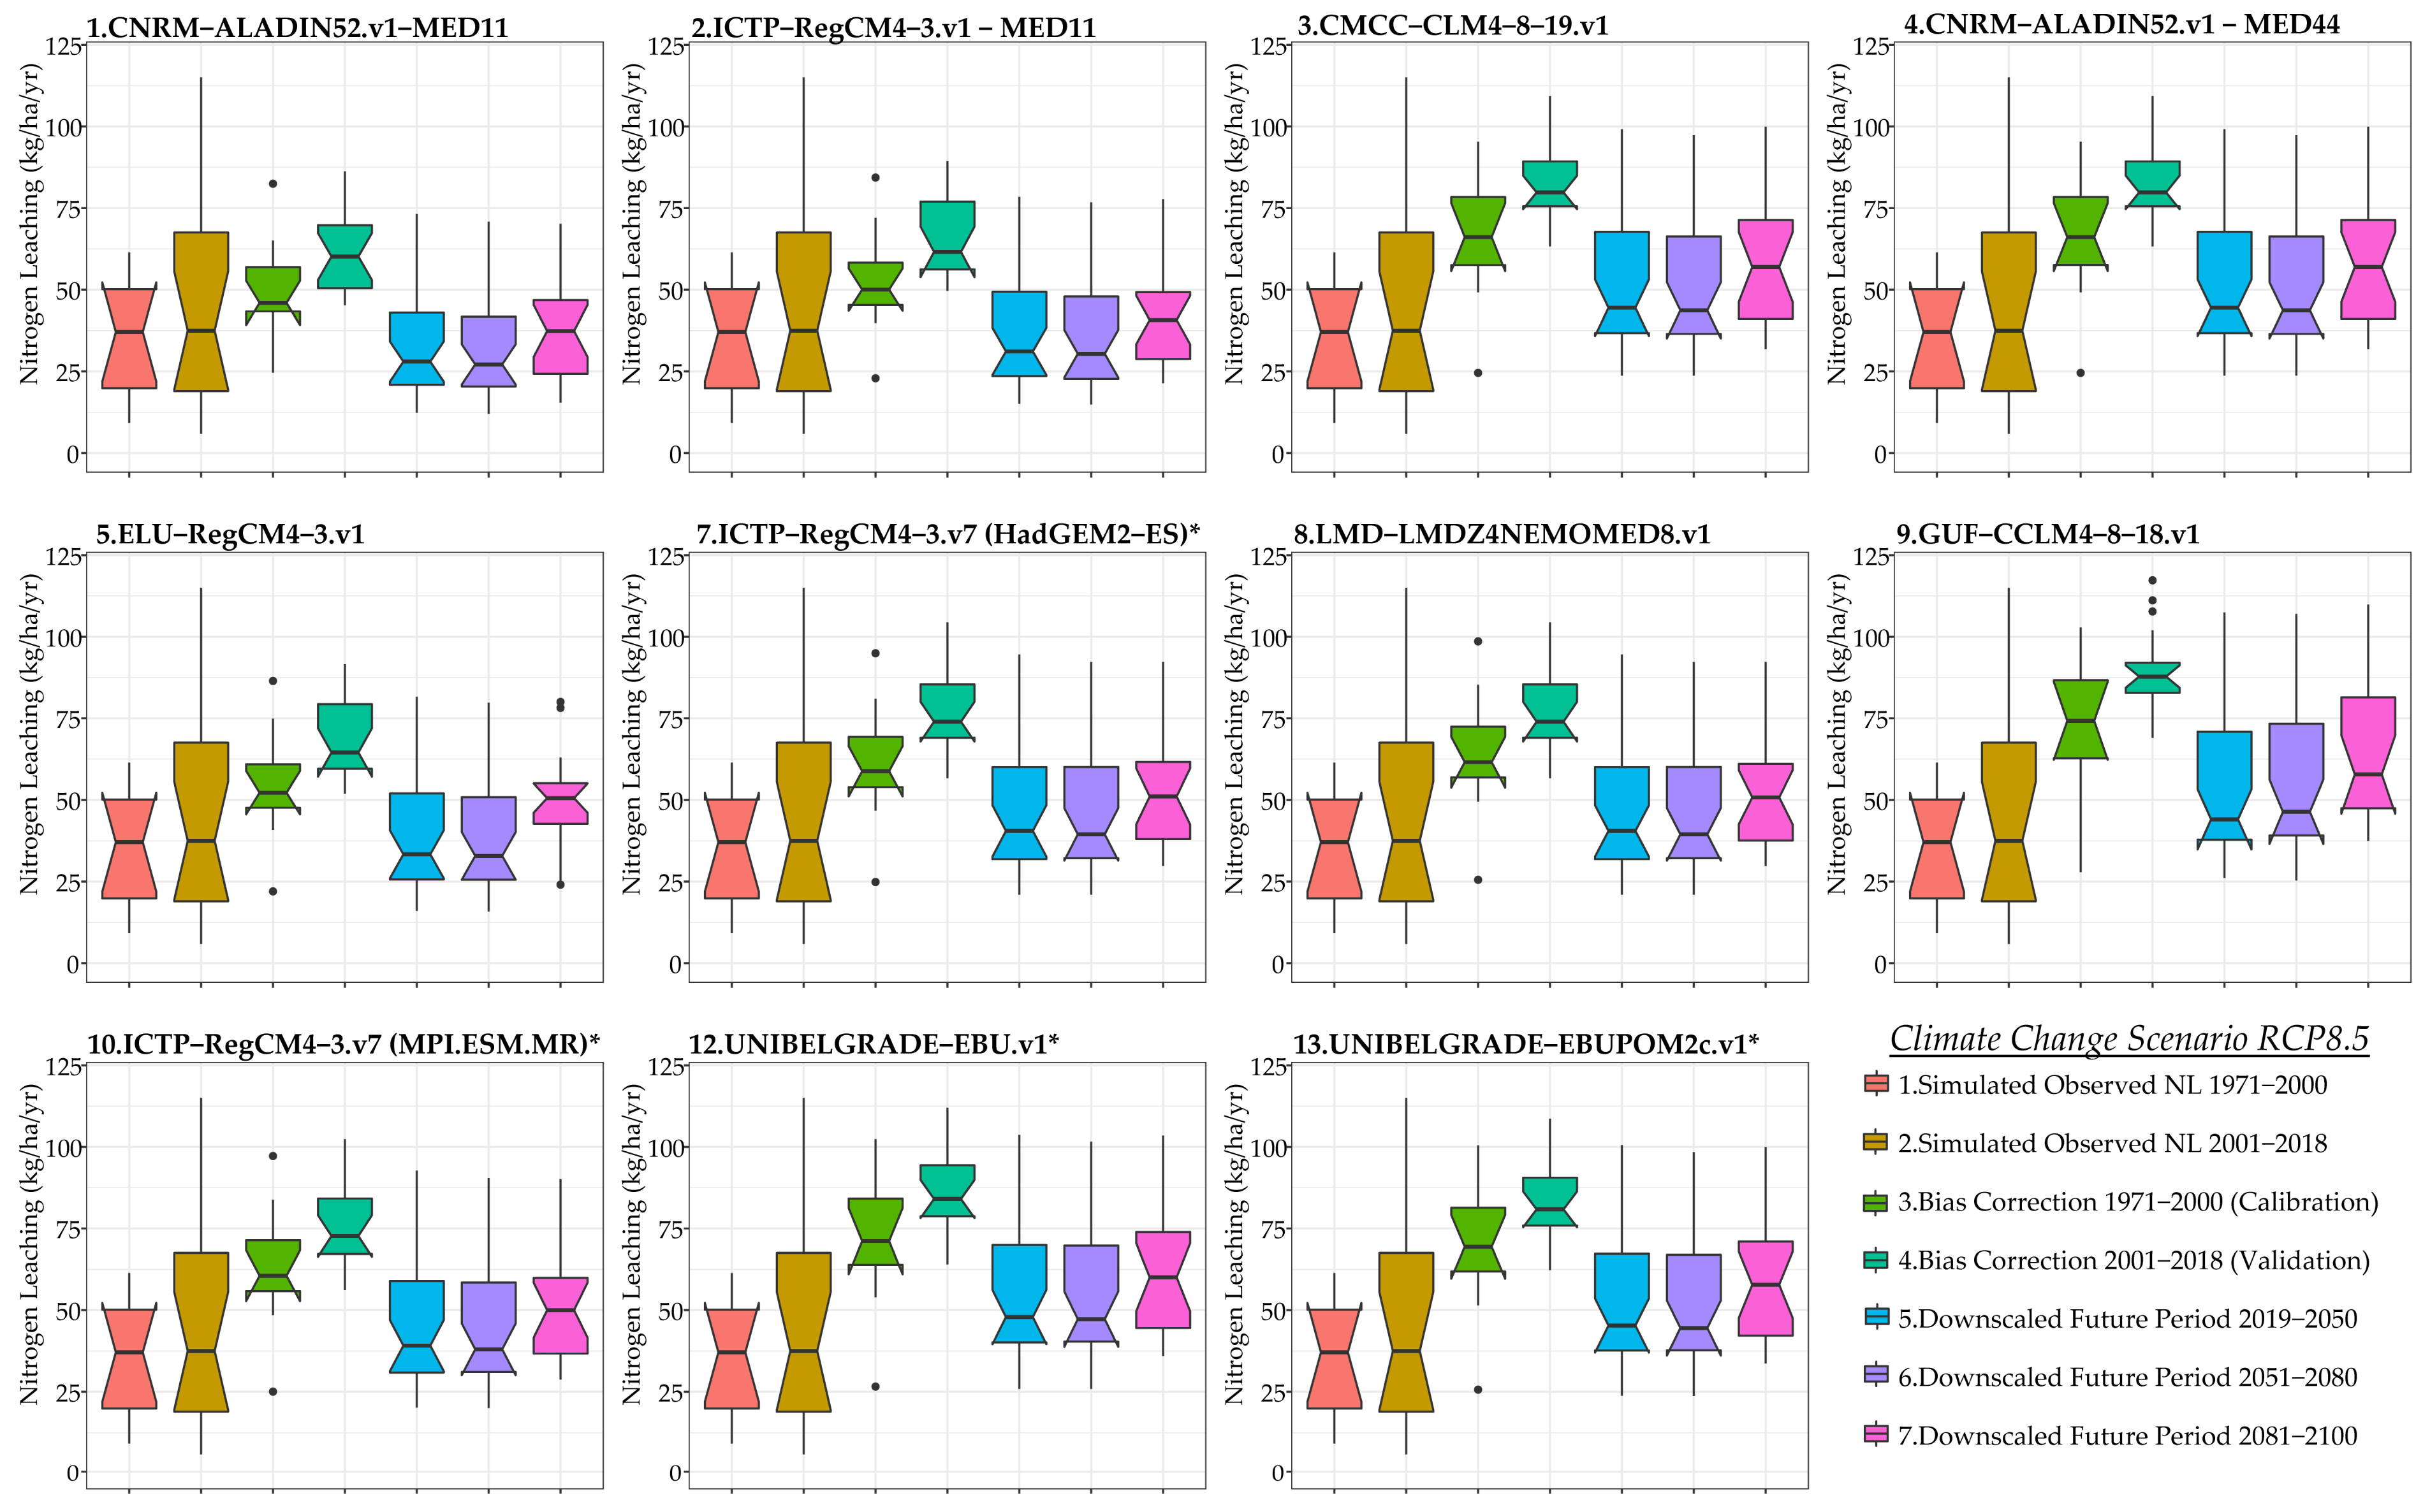
During the historical bias-corrected time period of 1991–2018, under the climate scenario RCP8.5, 65% of the total annual nitrogen fertilization is leached towards the groundwater under the climatic model 1.CNRM-ALADIN52.v1 (MED-11), 66% under the climatic model 2.ICTP-RegCM4-3v1*, 56% under the climatic model 3.CMCC-CCLM4-8-19v1., 86% under the climatic model 4.CNRM-ALADIN52v1 (MED-44), 67% under the climatic model 5.ELU-RegCM4-3v1, 57% under the climatic model 7.ICTP-RegCM4-3.v7* (HadGEM2), 37% under the climatic model 8.LMD-LMDZ4NEMOMED8v1, 52% under the climatic model 9.GUF-CCLM4-8-18v1, 59% under the climatic model 10.ICTP-RegCM4-3.v7* (MPI-ESM-MR), 61% under the climatic model 12.UNIBELGRADE-EBUv1*, and 64% under the climatic model 13.UNIBELGRADE-EBUPOM2cv1*.
In the time period 2019–2050, under the climate scenario RCP8.5, 46% of the total annual nitrogen fertilization is leached towards the groundwater under the climatic model 1.CNRM-ALADIN52.v1 (MED-11), 51% under the climatic model 2.ICTP-RegCM4-3v1*, 50% under the climatic model 3.CMCC-CCLM4-8-19v1, 68% under the climatic model 4.CNRM-ALADIN52v1 (MED-44), 45% under the climatic model 5.ELU-RegCM4-3v1, 45% under the climatic model 7.ICTP-RegCM4-3.v7* (HadGEM2), 19% under the climatic model 8.LMD-LMDZ4NEMOMED8v1, 34% under the climatic model 9.GUF-CCLM4-8-18v1, 48% under the climatic model 10.ICTP-RegCM4-3.v7* (MPI-ESM-MR), 45% under the climatic model 12.UNIBELGRADE-EBUv1*, and 44% under the climatic model 13.UNIBELGRADE-EBUPOM2cv1*. In the time period 2051–2100, under the climate scenario RCP8.5, 45% of the total annual nitrogen fertilization is leached towards the groundwater under the climatic model 1.CNRM-ALADIN52.v1 (MED-11), 55% under the climatic model 2.ICTP-RegCM4-3v1*, 57% under the climatic model 3.CMCC-CCLM4-8-19v1., 74% under the climatic model 4.CNRM-ALADIN52v1 (MED-44), 56% under the climatic model 5.ELU-RegCM4-3v1, 51% under the climatic model 7.ICTP-RegCM4-3.v7* (HadGEM2), 29% under the climatic model 8.LMD-LMDZ4NEMOMED8v1, 41% under the climatic model 9.GUF-CCLM4-8-18v1, 47% under the climatic model 10.ICTP-RegCM4-3.v7* (MPI-ESM-MR), 48% under the climatic model 12.UNIBELGRADE-EBUv1*, and 49% under the climatic model 13.UNIBELGRADE-EBUPOM2cv1*. Under RCP8.5, the climatic model that produces the largest quantities of nitrogen leached is the 9.GUF-CCLM4-8-18v1. In decreasing order of nitrogen leached, the bias-corrected climatic models are models 9, 12, 13, 3, 4, 8, 7, 10, 5, 2, and 1. Comparatively, more quantities of nitrogen are leached towards groundwater under RCP8.5 than under RCP4.5.
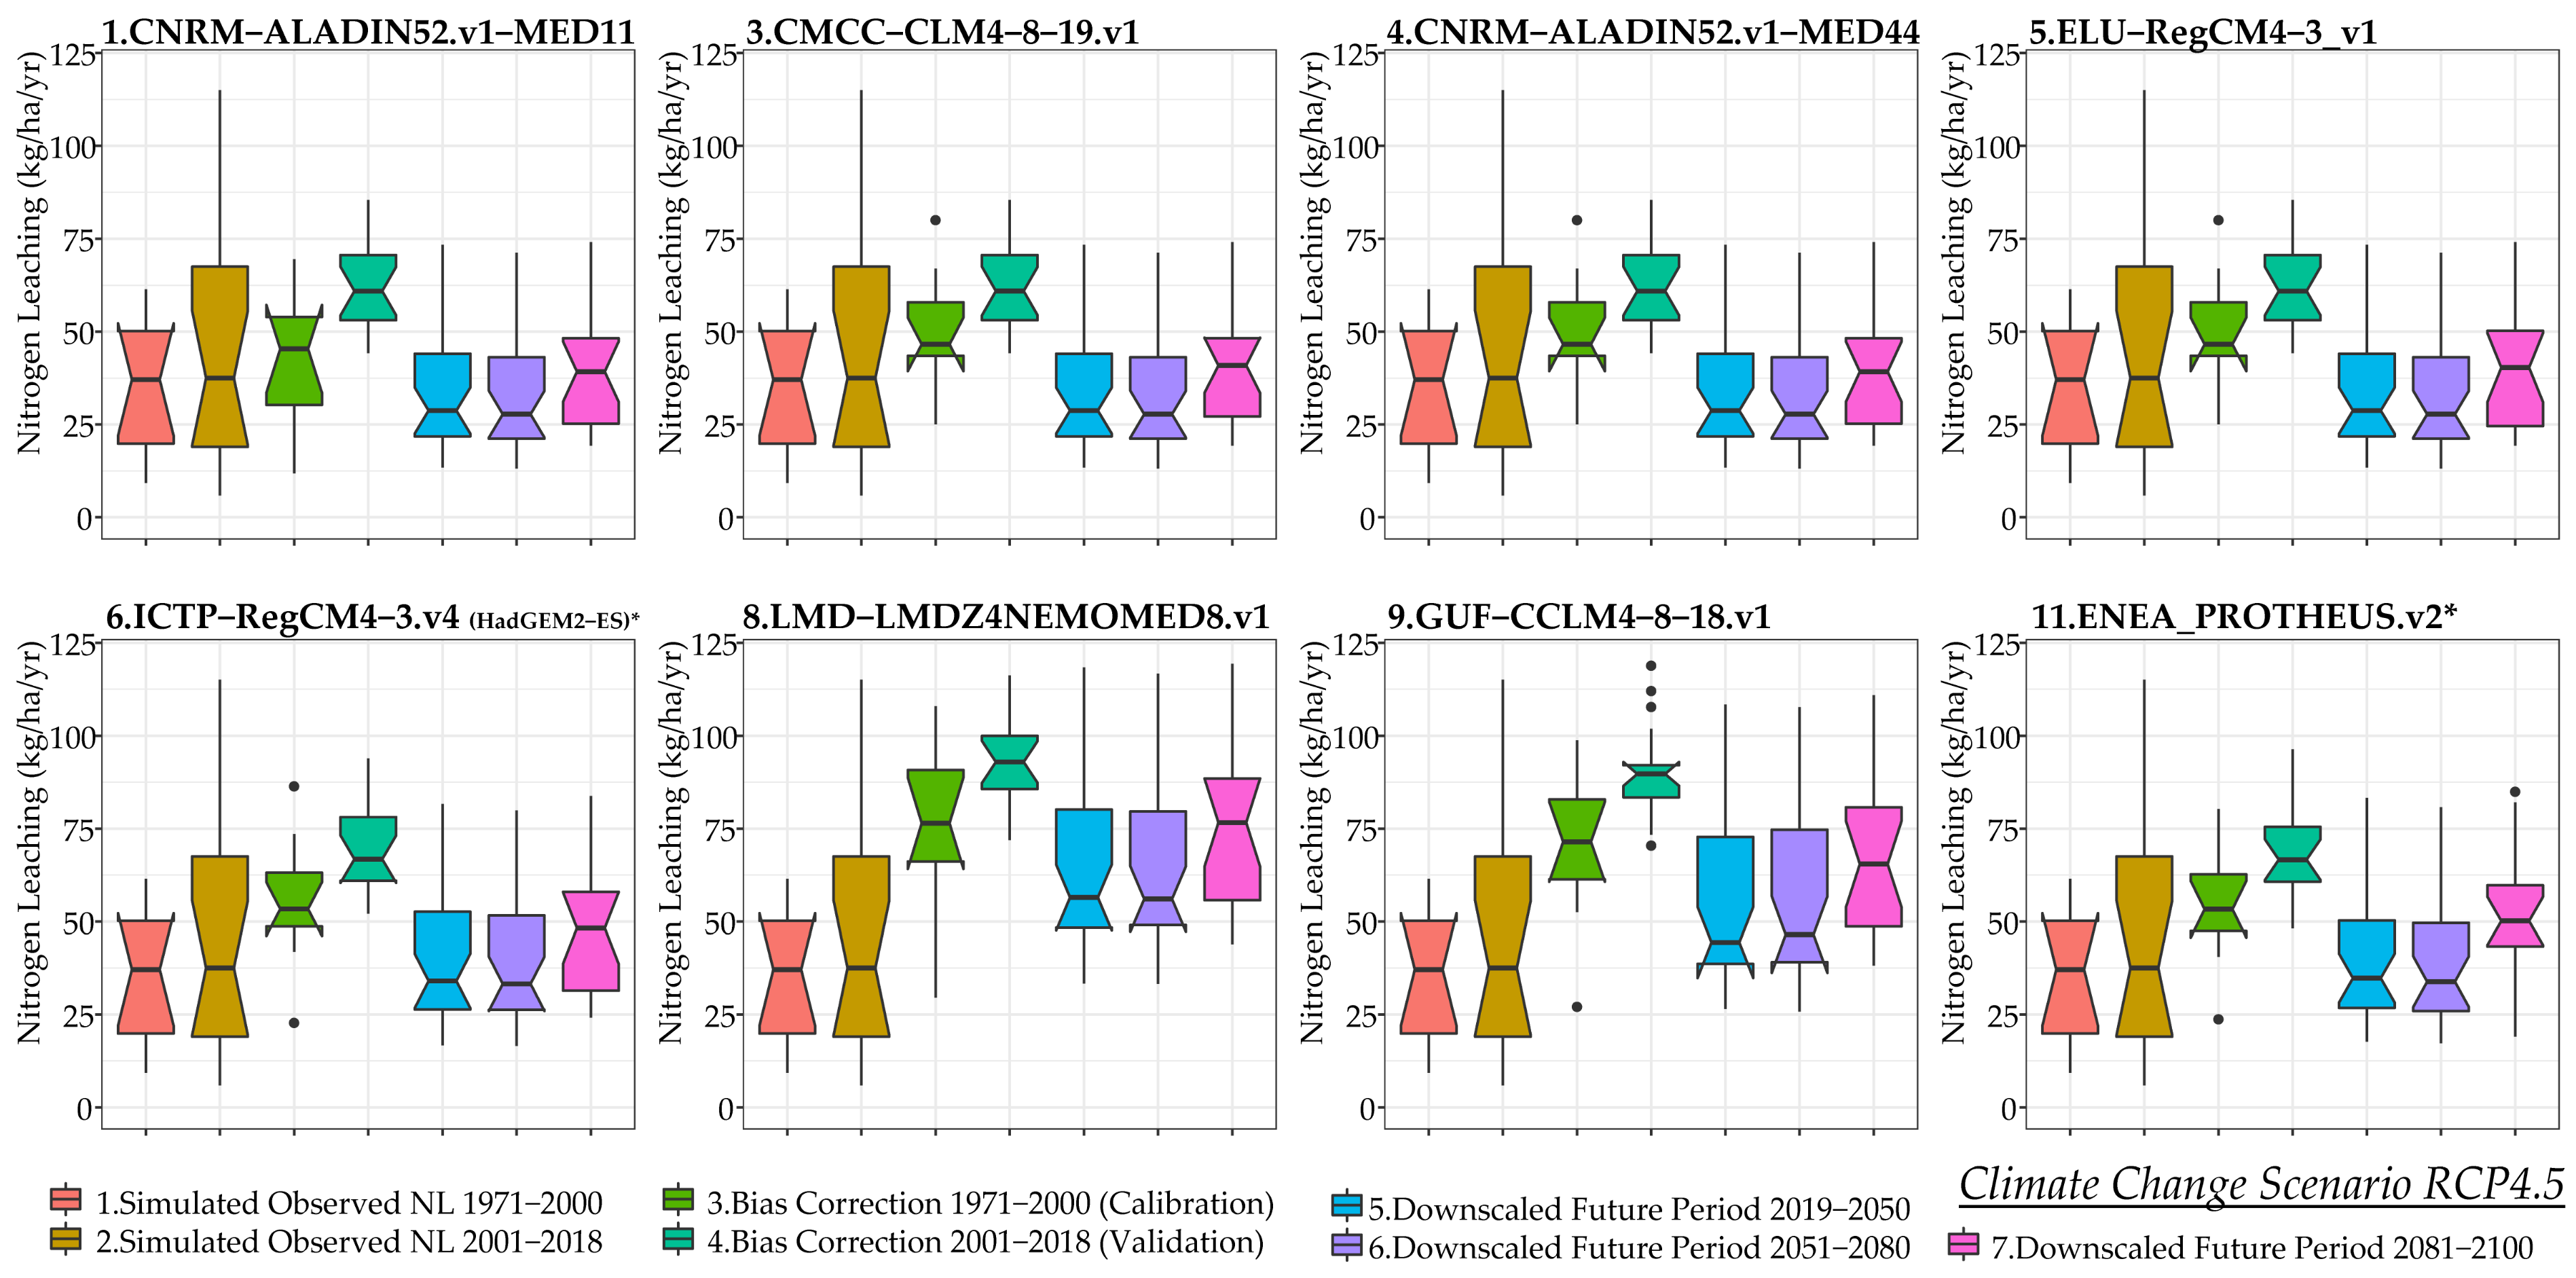
During the historical bias-corrected time period of 1991–2018, under the climate scenario RCP4.5, 52% of the total annual nitrogen fertilization is leached towards the groundwater under the climatic model 1.CNRM-ALADIN52.v1 (MED-11), 55% of the nitrogen fertilization is leached towards the groundwater under the climatic models 3.CMCC-CCLM4-8-19v1, 4.CNRM-ALADIN52v1 (MED-44), 5.ELU-RegCM4-3v1, 61% under the climatic model 6.ICTP-RegCM4-3v4*, 83% under the climatic model 8.LMD-LMDZ4NEMOMED8v1, 78% under the climatic model 9.GUF-CCLM4-8-18v1, and 59% under the climatic model 11.ENEA-PROTHEUSv2*. In the time period 2019–2050, under the climate scenario RCP4.5, 37% of the total annual nitrogen fertilization is leached towards the groundwater under the climatic models 1.CNRM-ALADIN52.v1 (MED-11), 3.CMCC-CCLM4-8-19v1, 4.CNRM-ALADIN52v1 (MED-44), and 5.ELU-RegCM4-3v1, 43% under the climatic model 6.ICTP-RegCM4-3v4*, 69% under the climatic model 8.LMD-LMDZ4NEMOMED8v1, 43% under the climatic model 9.GUF-CCLM4-8-18v1, and 59% under the climatic model 11.ENEA-PROTHEUSv2*. In the time period 2051–2100, under the climate scenario RCP4.5, 40% of the total annual nitrogen fertilization is leached towards the groundwater under the climatic model 1.CNRM-ALADIN52.v1 (MED-11), 4.CNRM-ALADIN52v1 (MED-44), and 5.ELU-RegCM4-3v1, 41% 55% of the nitrogen fertilization is leached towards the groundwater under the climatic models 3.CMCC-CCLM4-8-19v1, 47% under the climatic model 6.ICTP-RegCM4-3v4*, 76% under the climatic model 8.LMD-LMDZ4NEMOMED8v1, 68% under the climatic model 9.GUF-CCLM4-8-18v1, and 49% under the climatic model 11.ENEA-PROTHEUSv2*. Under RCP4.5, the climatic model that produces the largest quantities of nitrogen leached is the 7.ICTP-RegCM4-3.v7* (HadGEM2). In decreasing order of nitrogen leached, the bias-corrected/downscaled climatic models are models 7, 8, 9, 5, 2, 3, 4, and 1.
The relative changes of nitrogen leaching in the future periods 2019–2030 and 2019–2050, 2051–2080, and 2081–2100 concerning the historical period 1991–2018 under RCP8.5 are displayed in Table 5. According to the results, the nitrogen leached towards the groundwater of the Almyros aquifer system will be reduced in the future, while the specification of the reduction depends on the bias-corrected model that is employed and the climatic scenario that represents the future warming emissions. Nevertheless, with the current agronomic policies of nitrogen application, there is a reduction of more than 41% according to the 9.GUF-CCLM4-8-18v1 climatic model, which cannot be expected for the period 2019-2030. Moreover, there is great uncertainty among the simulated results for the climate models.

3.4. Projected Groundwater Hydrology with the MODFLOW Model under Climate Change

Groundwater hydrology, aquifer water flows, groundwater abstractions, and sea level rise have been simulated with the MODFLOW model from 1991 to 2100 on a monthly timestep for the 19 climatic models of Med-CORDEX for the two RCPs. The model was run for four time periods separately: 1991–2018, 2019–2050, 2051–2080, and 2081–2100. For each forward simulation, the starting heads were set as the simulated heads of the last time step of the previous time period/simulation. In Table 6, the average monthly hydraulic heads for the Almyros aquifer for every climatic model and scenario are displayed. The water table will be lowered as time progresses in all climatic models and scenarios. In RCP8.5, the average water table reduction ranges between 1.5 m and 9 m, while in RCP4.5, it ranges between 1.9 m and 9 m. Certainly, these values correspond to the spatial average of the hydraulic heads, and there is great variability according to hydrogeological characteristics, but the adverse impact of the warming climate on groundwater heads has been established. Under the RCP8.5 scenario, the models indicate a decreasing trend in mean water table levels. The models 4.CNRM-ALADIN52v1 (MED-44), 7.ICTP-RegCM4-3.v7* (HadGEM2), 9.GUF-CCLM4-8-18v1 and 10.ICTP-RegCM4-3.v7* (MPI-ESM-MR) exhibits higher rates of lowering water table as compared to the other models. All the other models present lowering the water table with a more stable pace, except for the 8.LMD-LMDZ4NEMOMED8v1 model stands out with consistently higher values, suggesting an upward trend in groundwater levels, which contrasts with the overall decreasing trend observed in all models. Under the RCP4.5 scenario, the 4.CNRM-ALADIN52v1 (MED-44) model presents the steeper lowering rate, while the 8.LMD-LMDZ4NEMOMED8v1 model shows high water levels. The models 3.CMCC-CCLM4-8-19v1, 5.ELU-RegCM4-3v1, 6.ICTP-RegCM4-3v4*, 9.GUF-CCLM4-8-18v1 and 11.ENEA-PROTHEUSv2* shows a decreasing trend but with a slightly slower pace. Table 7 shows the water balance for the historical periods of 1991–2000 and 2001–2018 and the future periods 2019–2050, 2051–2080, and 2081–2100 for the 19 Med-CORDEX models and the two RCPs. According to the groundwater analysis, both warming scenarios have a substantially deficient groundwater equilibrium at present, and the aquifer imbalance will continue to be negative.
The water balance will be deficient, but the lowering of the hydraulic heads has to be considered in the interpretation of the results. The reason for the water deficit is the general reduction in groundwater recharge, the increased evapotranspiration, and hence the increased groundwater abstractions, which lead to less water flow volumes to interact and form the water balance. This is supported and proved by the lowering of hydraulic heads. The water balance for the time periods 1991–2000, 2001–2018, 2019–2050, 2051–2080, and 2081–2100 under the RCP8.5 scenario shows significant fluctuations. The 1.CNRM-ALADIN52.v1 (MED-11) model shows a steady decline in water balance across the specified periods. The decline is gradual but substantial, emphasizing a potential long-term water deficit. Similarly, the 2.ICTP-RegCM4-3v1* model exhibits consistently negative values and predicts a significant decrease in water balance, especially towards the end of the century. The 3.CMCC-CCLM4-8-19v1 model shows a negative water balance but with less intensity compared to the previous models and implies a decline in water availability, albeit at a slightly slower rate. In contrast, the 8.LMD-LMDZ4NEMOMED8v1 model exhibits a positive water balance, suggesting variability in water balance, potentially influenced by unique model dynamics. However, all the other models display negative values, reflecting a consistent trend of decreasing water balance, while the severity varies among models.
The water balance projections under the RCP4.5 scenario show a reduction in water availability across the specified time frames. The 1.CNRM-ALADIN52.v1 (MED-11) model continues to show negative values, indicating decreasing water availability over time, yet the decline is less pronounced compared to the RCP8.5 scenario. The 3.CMCC-CCLM4-8-19v1 model, similar to its performance in the RCP8.5 scenario, displays negative values of water balance and implies a potential reduction in water resources, though at a slightly slower pace. The 8.LMD-LMDZ4NEMOMED8v1 model presents positive values during certain periods, suggesting intermittent water surplus. The 11. ENEA-PROTHEUSv2 model exhibits consistently negative values, indicating a decreasing water balance and a potential long-term reduction in water availability.

3.5. Projected Groundwater Nitrate Pollution with the MT3DMS Model under Climate Change

The MT3DMS model was utilized to assess nitrate concentrations in response to climate change scenarios, particularly the Representative Concentration Pathways (RCP) 8.5 and 4.5. from 1991 to 2100 on a monthly timestep for the 19 climatic models of Med-CORDEX for the two RCPs. The time periods considered are 1991–2000, 2001–2018, 2019–2050, 2051–2080, and 2081–2100. The average groundwater ΝO3 (mg/L) for historical and future periods with values specified for each climatic model are displayed in Table 8. Analyzing the RCP8.5 and RCP4.5 scenarios during the initial period of 1991–2000, the concentrations range from 31.1 to 32.5, showing some variability. As the timeline progresses from 2001–2018, a general decline in nitrate concentrations is noticeable for most models, indicating potential temporal trends. The subsequent intervals (2019–2050, 2051–2080, and 2081–2100) exhibit a consistent decrease in nitrate concentrations for most climatic models. However, variations exist among the models, with some showing steeper declines than others. Under the RCP8.5 scenario, the climatic model with the largest nitrate concentration is 4.CNRM-ALADIN52.v1 (MED-44) from 1991 until 2080, and the 5.ELU-RegCM4-3_v1 in 2081–2100. The climatic model with the smallest nitrate concentration is 8.LMD-LMDZ4NEMOMED8.v1 for all periods, reaching its minimum value of 13.7 during the 2081–2100 time period. Under the RCP4.5 scenario, the climatic model with the largest nitrate concentration is 4.CNRM-ALADIN52.v1 (MED-44) from 1991 to 2018, the 5.ELU-RegCM4-3v1 from 2019 to 2080, and the 6.ICTP-RegCM4-3v4* from 2080 to 2100. The climatic model with the smallest nitrate concentration is 8.LMD-LMDZ4NEMOMED8.v1, reaching its minimum value of 14.3 during the time period of 2081-2100, except for the period 2051–2080 when the 1.CNRM-ALADIN52.v1 (MED-11) presents the lowest average nitrate concentrations. The 6.ICTP-RegCM4-3v4* exhibits an anomalous spike in nitrate concentration, reaching 52.9 during the time period 2081–2100, which stands out in contrast to the generally declining trend observed in other models.
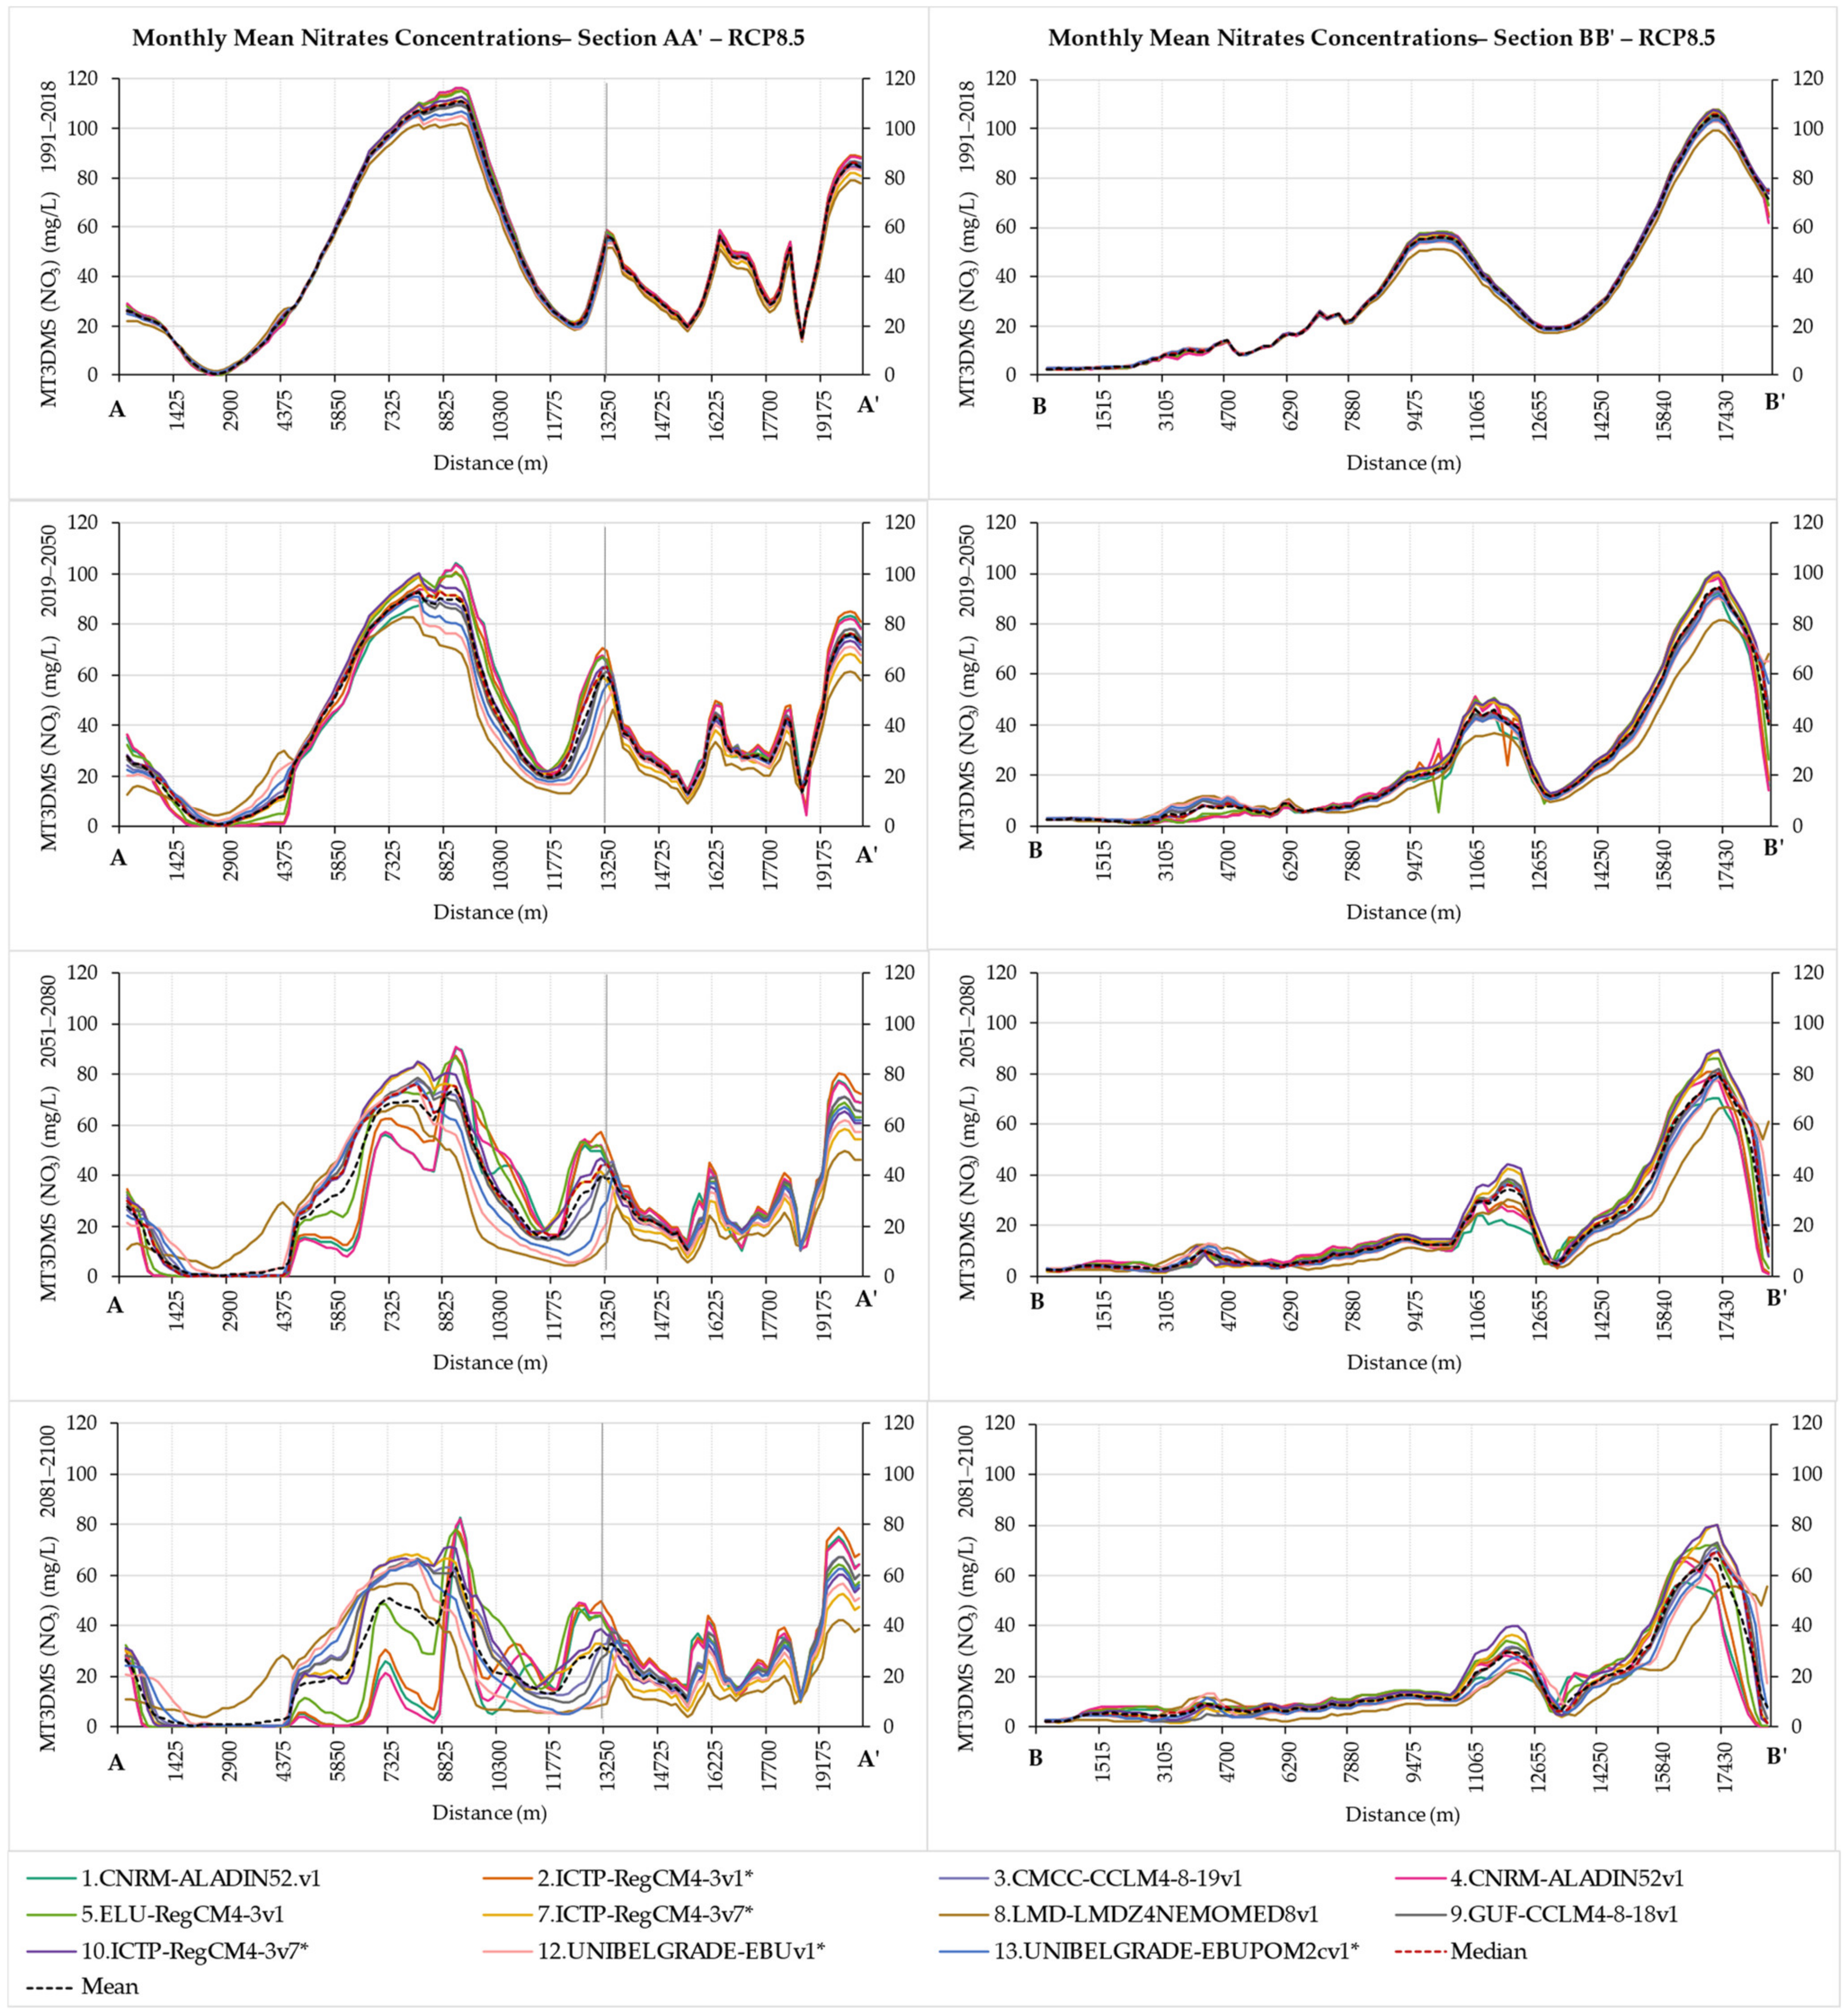
In 
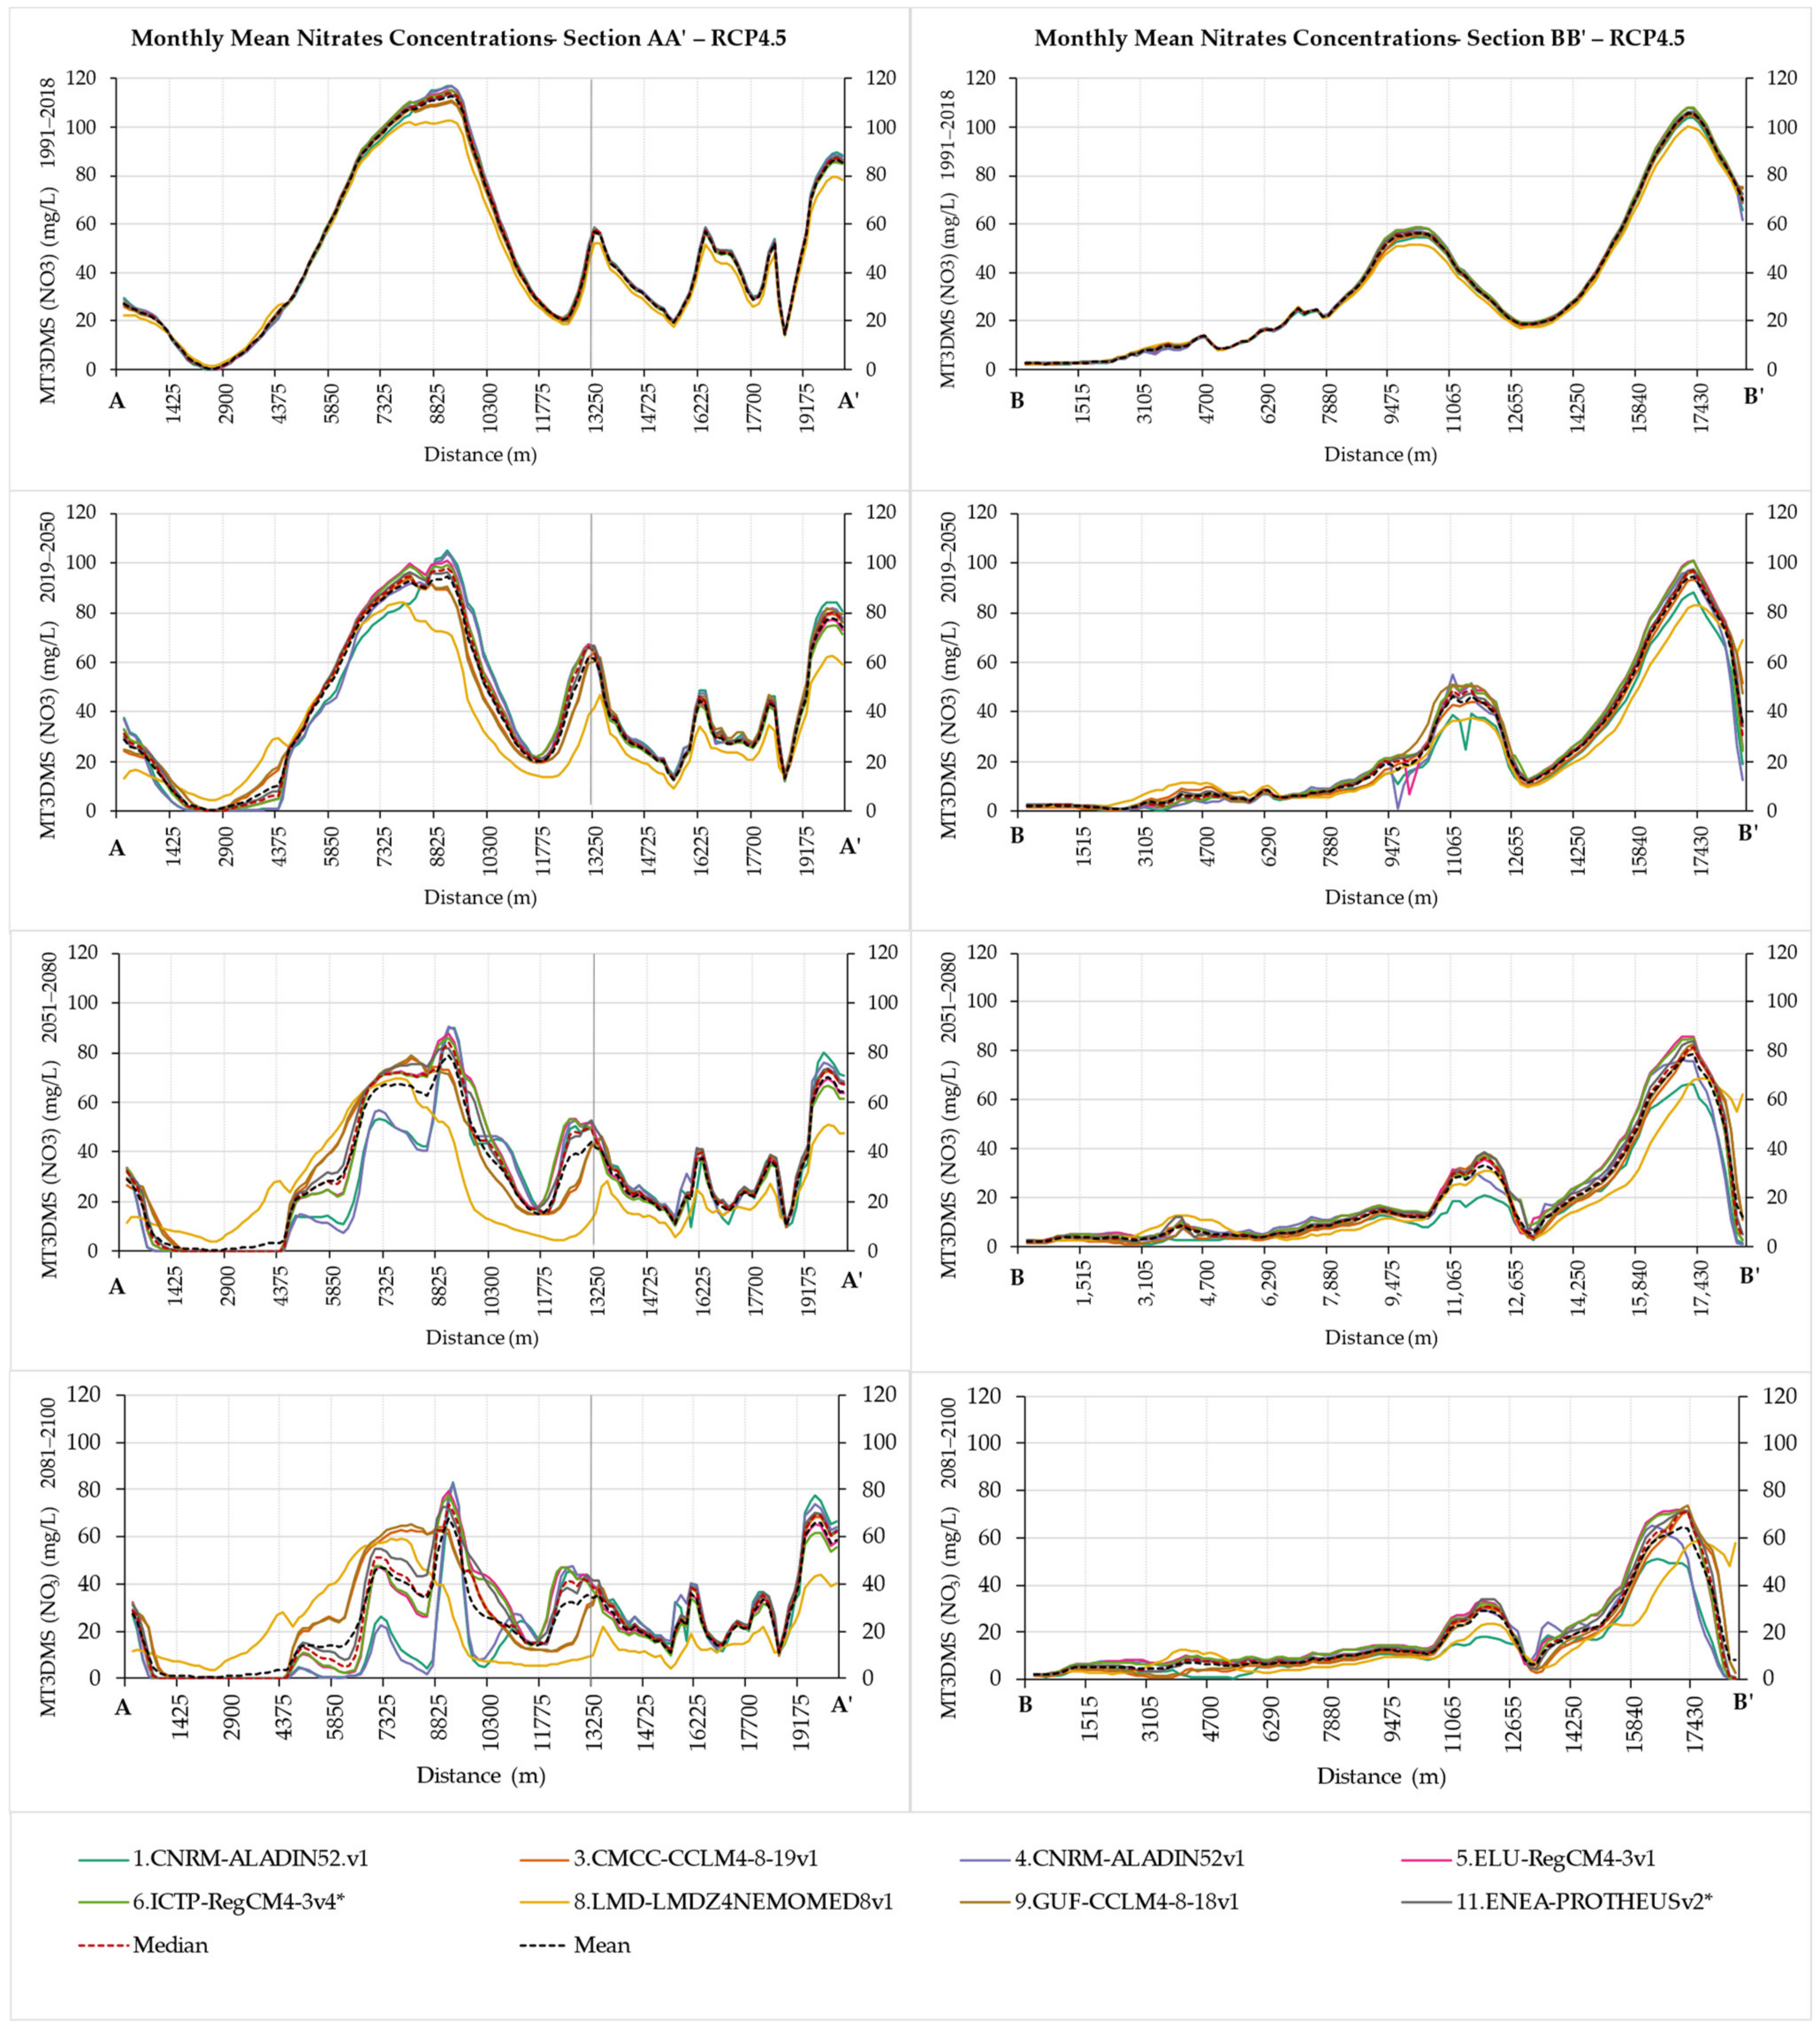
Figure 11, the sections AA’ and BB’ of the Almyros aquifer system and the evolution of nitrate pollution for the 11 bias-corrected climatic models are displayed for the adverse impacts scenario RCP8.5, and in Figure 12, the sections AA’ and BB’ for the eight bias-corrected climatic models are displayed for the medium impacts scenario RCP4.5. Observing the sections of the results derived from the MT3DMS simulations for the nitrate concentrations, it is noticed that there is a general consensus among the climatic scenarios and climatic models for the historical period of 1991–2018. The results initiate present differences and variability, especially in the areas of increased nitrate concentrations as time progresses into the future until 2100.
As regards the implementation of the climatic scenario RCP8.5, in Section AA’, the highest nitrate concentrations are produced at the central part of the coastal area using the bias-corrected climatic models 10.ICTP-RegCM4-3.v7* (MPI-ESM-MR), 5.ELU-RegCM4-3v1, and 7.ICTP-RegCM4-3.v7* (HadGEM2), and at the southern part by model 2.ICTP-RegCM4-3v1*. The lowest concentrations present the largest differentiations. They are produced at the central part by the bias-corrected climatic models 4.CNRM-ALADIN52v1 (MED-44), 1.CNRM-ALADIN52.v1 (MED-11), and 2.ICTP-RegCM4-3v1*, while at the southern part by the bias-corrected climatic models 8.LMD-LMDZ4NEMOMED8v1, 12.UNIBELGRADE-EBUv1*, 13.UNIBELGRADE-EBUPOM2cv1* and 7.ICTP-RegCM4-3.v7* (HadGEM2). Under the climatic scenario of medium impacts RCP4.5, in Section AA’, the highest nitrates concentrations are produced at the central part of the coastal area by the bias-corrected climatic models 4.CNRM-ALADIN52v1 (MED-44), 11.ENEA-PROTHEUSv2* and 8.LMD-LMDZ4NEMOMED8v1, and at the southern part by models 1.CNRM-ALADIN52.v1 (MED-11) and 4.CNRM-ALADIN52v1 (MED-44).
The lowest concentrations present the largest differentiations. They are produced at the central part by the bias-corrected climatic model 11.ENEA-PROTHEUSv2*, 1.CNRM-ALADIN52.v1 (MED-11) and 3.CMCC-CCLM4-8-19v1, while at the southern part by the bias-corrected climatic model 8.LMD-LMDZ4NEMOMED8v1.
Notably, in RCP4.5, the simulated nitrate concentrations present both the highest and lowest nitrate concentrations at the central coastal part. This is attributed to the heterogeneous hydrological conditions and hydraulic conductivity of the coastal area. In the northern coastal part, the geological formations consist of highly permeable materials of sand and gravel, while from the central part to the south, clayish formations that form slower groundwater flows than in the northern part start to appear. The increasing uncertainty of nitrate pollution according to each climatic model is also verified in the results in Sections BB’ for both climatic scenarios RCP8.5 and RCP4.5.
Across the sections that pass through contaminated groundwater with nitrates, the results present differentiations, and their variability is similar to the sections AA.’
In the RCP8.5 scenario, the 1.CNRM-ALADIN52.v1 (MED-11), 2.ICTP-RegCM4-3v1*, 3.CMCC-CCLM4-8-19v1, and the other models consistently demonstrate a decline in nitrate pollution levels from 1991–2000 to 2081–2100. This decreasing trend suggests a potential improvement in water quality over time. However, the 5.ELU-RegCM4-3v1 and 7.ICTP-RegCM4-3.v7* (HadGEM2) models exhibit a slight increase in nitrate pollution levels in the later years, indicating regional variability in pollution dynamics. In the RCP4.5 scenario, the 1.CNRM-ALADIN52.v1 (MED-11) and 3.CMCC-CCLM4-8-19v1 models display a stable nitrate pollution trend, while the 5.ELU-RegCM4-3v1 and 6.ICTP-RegCM4-3v4* models show an increase in pollution levels over time. The 8.LMD-LMDZ4NEMOMED8v1, 9.GUF-CCLM4-8-18v1, and 11.ENEA-PROTHEUSv2* models exhibit a slower declining trend in nitrate pollution levels, suggesting potential challenges in maintaining water quality.
Statistics of groundwater percent (%) differences in ΝO3 (% mg/L) of future periods from the historical base period 1991–2000 are displayed in Table 9.
The average percent reduction of nitrate concentrations in the groundwater system of Almyros ranges from 30 to 41% in RCP8.5 and from 29 to 50% in RCP4.5 for both cross-section AA’ and BB’.
In RCP8.5, the climatic models that produce the smallest mean reduction are 8.LMD-LMDZ4NEMOMED8.v1 (−32%) in the direction of AA’, and 5.ELU-RegCM4-3_v1 (−30%) in the direction of BB’. The climatic models that produce the largest mean reduction are 1.CNRM-ALADIN52v1 (MED-11) (−41%) in the direction of AA’, and 8.LMD-LMDZ4NEMOMED8.v1 (–41%) in direction of BB’. The minimum local decreases occur under the model 2.ICTP-RegCM4-3v1* (−100%) and 4.CNRM-ALADIN52.v1 (MED-44) (−100%), while the smallest local decreases occur under 8.LMD-LMDZ4NEMOMED8.v1 (−91%) and 12.UNIBELGRADE-EBU.v1* (−81%), for sections AA’ and BB’, respectively.
The maximum local increases occur under the model 8.LMD-LMDZ4NEMOMED8.v1 (246%) and 4.CNRM-ALADIN52.v1 (MED-44) (199%), while the smallest local increases occur under 13.UNIBELGRADE-EBUPOM2c.v1* (64%) and 8.LMD-LMDZ4NEMOMED8.v1 (30%), for sections AA’ and BB’, respectively.
In RCP4.5, the climatic models that produce the smallest mean reduction are 8.LMD-LMDZ4NEMOMED8.v1 (−30%) in the direction of AA’, and 5.ELU-RegCM4-3_v1 (−29%) in the direction of BB’. The climatic model that produces the largest mean reduction is 1.CNRM-ALADIN52v1 (MED-11) (−43%) in the direction of AA’, and (−50%) in the direction of BB’. The minimum local decreases occur, similarly to RCP8.5, under model 2.ICTP-RegCM4-3v1* (−100%) and 4.CNRM-ALADIN52.v1 (MED-44) (−100%), while the smallest local decreases occur under 8.LMD-LMDZ4NEMOMED8.v1 (−90% and −88%), for sections AA’ and BB’, respectively. The maximum local increases occur again under the model 8.LMD-LMDZ4NEMOMED8.v1 (190%) and 4.CNRM-ALADIN52.v1 (MED-44) (166%), while the smallest local increases occur under 3.CMCC-CCLM4-8-19v1 (70%) and 8.LMD-LMDZ4NEMOMED8.v1 (32%), for sections AA’ and BB’, respectively.
Model 4.CNRM-ALADIN52.v1 (MED-44) presents the largest deviations from the mean of the differences of nitrate concentrations from the base period under RCP8.5 and RCP4.5, while also under the latter climatic scenario model 8.LMD-LMDZ4NEMOMED8v1 also presents higher standard deviations.

4. Discussion

This study investigated the water resources, mainly the groundwater resources, and the nitrate leaching and aquifer pollution under two climatic scenarios, RCP8.5 and RCP4.5, with the projected climate from nineteen (19) climatic models of the Med-CORDEX database. The scope of the study was to define the water balance, mainly the groundwater balance, and the nitrates concentrations and pollution under adverse and medium climatic impacts on the coastal agricultural Almyros Basin and its aquifer system. The evaluation procedure uses the Integrated Modeling System [31] designed for agricultural coastal watersheds and consists of interconnected models of surface water hydrology [32], agronomic/nitrate leaching processes [23,31], and groundwater models of aquifer hydrology [33] and nitrates transport [34].
Potential evapotranspiration is projected to increase significantly in the RCP8.5 climatic scenario post-2051, while RCP4.5 indicates a milder upward trend. In RCP8.5, 1.CNRM-ALADIN52.v1 (MED-11) consistently projects high PET, notably increasing from 1991–2000 to 2081–2100. Models 2.ICTP-RegCM4-3v1* and 5.ELU-RegCM4-3v1 shows upward PET trends. While 9.GUF-CCLM4-8-18v1 and 12.UNIBELGRADE-EBUv1* also projects rising PET; there are fluctuations. In RCP4.5, PET generally increases across models, with 1.CNRM-ALADIN52.v1 (MED-11) and 3.CMCC-CCLM4-8-19v1 consistently shows higher values, but 11.ENEA-PROTHEUSv2* deviates with a decrease in PET during 2019–2050. Similar to potential evapotranspiration, AET demonstrates an increasing trend, notably higher in RCP8.5. Under RCP8.5, 8.LMD-LMDZ4NEMOMED8v1 and 9.GUF-CCLM4-8-18v1 consistently project increased AET from 1991–2000 to 2081–2100, with 8.LMD-LMDZ4NEMOMED8v1 displays the highest values. Models like 3.CMCC-CCLM4-8-19v1, 12.UNIBELGRADE-EBUv1*, and 13.UNIBELGRADE-EBUPOM2cv1* also shows rising AET, indicating high evapotranspiration. In RCP4.5, similar trends persist, with 8.LMD-LMDZ4NEMOMED8v1 projecting the highest AET values, while 3.CMCC-CCLM4-8-19v1 and 9.GUF-CCLM4-8-18v1 exhibit increasing AET. However, the 11.ENEA-PROTHEUSv2* model shows fluctuations and 1.CNRM-ALADIN52.v1 (MED-11) and 4.CNRM-ALADIN52v1 (MED-44) models present the lowest AET values, with other models displaying a milder increasing trend in AET.
Surface runoff and groundwater recharge exhibit trends similar to potential and actual evapotranspiration. In the RCP8.5 scenario, all models demonstrate a decreasing trend in surface runoff from 1991–2000 to 2081–2100, with 1.CNRM-ALADIN52.v1 (MED-11), 2.ICTP-RegCM4-3v1*, and 4.CNRM-ALADIN52v1 (MED-44), showing the lowest runoff values. Models like 3.CMCC-CCLM4-8-19v1, 7.ICTP-RegCM4-3.v7* (HadGEM2), 9.GUF-CCLM4-8-18v1, 12.UNIBELGRADE-EBUv1*, and 13.UNIBELGRADE-EBUPOM2cv1* exhibits a milder decreasing trend, while 8.LMD-LMDZ4NEMOMED8v1 presents the highest runoff values. In RCP4.5, all models display decreasing surface runoff trends, with 1.CNRM-ALADIN52.v1 (MED-11) and 4.CNRM-ALADIN52v1 (MED-44) have the lowest values. The 3.CMCC-CCLM4-8-19v1 and 9.GUF-CCLM4-8-18v1 models show a milder decreasing trend, and 8.LMD-LMDZ4NEMOMED8v1 presents the highest values. Notably, the 11.ENEA-PROTHEUSv2* model exhibits fluctuations, emphasizing the complexity of surface runoff responses.
Groundwater recharge under RCP8.5 displays a decreasing trend across all models, with 1.CNRM-ALADIN52.v1 (MED-11), 2.ICTP-RegCM4-3v1*, 4.CNRM-ALADIN52v1 (MED-44), and 5.ELU-RegCM4-3v1 projecting the most reduced values. Models like 12.UNIBELGRADE-EBUv1* and 13.UNIBELGRADE-EBUPOM2cv1* shows a milder decreasing trend alongside 8.LMD-LMDZ4NEMOMED8v1 presents the highest groundwater recharge values. In the RCP4.5 scenario, all models exhibit decreasing groundwater recharge trends, with fluctuations in models projecting high values. Notably, the 8.LMD-LMDZ4NEMOMED8v1 model maintains the highest groundwater recharge values, consistent with RCP8.5, indicating slightly larger recharge rates in RCP4.5 than under RCP8.5 across all models.
Nitrogen leaching towards aquifers is influenced by temperature changes, but no simple statistical correlation exists between temperature and nitrogen leaching. Comparatively, RCP8.5 shows more nitrogen leaching than RCP4.5. During 1991–2018 under RCP8.5, the climatic model 9.GUF-CCLM4-8-18v1 exhibits the highest nitrogen leaching at 65%, followed by 12.UNIBELGRADE-EBUv1*, 13.UNIBELGRADE-EBUPOM2cv1*, and others, with 1.CNRM-ALADIN52.v1 (MED-11) at 86%. In 2019–2050 and 2051–2100, 9.GUF-CCLM4-8-18v1 still leads in nitrogen leaching, but with the current agronomic policies of nitrogen application, a reduction of 50% of nitrogen leaching cannot be expected for the period 2019–2030 [8,9,10,11] since the highest reduction resulted in 41% according to the 9.GUF-CCLM4-8-18v1 climatic model. Under RCP4.5 (1991–2018), 8.LMD-LMDZ4NEMOMED8v1 tops at 83%, followed by 11.ENEA-PROTHEUSv2*. In 2019–2050, 8.LMD-LMDZ4NEMOMED8v1 remains highest, while 11.ENEA-PROTHEUSv2* exhibits fluctuations. In 2051–2100, 7.ICTP-RegCM4-3.v7* (HadGEM2) leads, with 8.LMD-LMDZ4NEMOMED8v1 close behind. Notably, RCP4.5 models generally leach less nitrogen than RCP8.5 models.
The water table is expected to decrease in all climatic models and scenarios, and the water balance projections under the RCP8.5 and RCP4.5 scenarios provide a complex view of hydrological changes over different time periods. This is due to the adverse impact of a warming climate on groundwater heads. The water balances for historical periods and future periods show a deficient groundwater equilibrium and a negative aquifer budget. In RCP8.5, the water table will be lower than RCP4.5, as RCP4.5 produces milder impacts. Under the RCP8.5 scenario, the majority of models indicate a consistent negative water balance, reflecting a decline in water availability across the specified time frames. The severity of the decline varies among models, with 1.CNRM-ALADIN52.v1 (MED-11), 2.ICTP-RegCM4-3v1*, and 4.CNRM-ALADIN52v1 (MED-44) showing particularly substantial decreases. In contrast, the 8.LMD-LMDZ4NEMOMED8v1 model stands out with intermittent positive values, suggesting periods of water surplus. However, this model’s behavior is an exception rather than the norm among the RCP8.5 projections. Transitioning to the RCP4.5 scenario, the water balance trends are generally similar, with negative values indicating potential decreases in water availability. Again, the 8.LMD-LMDZ4NEMOMED8v1 model presents intermittently positive values, indicating periods of water surplus. The reduction in water deficit can be attributed to multiple factors, including diminished groundwater recharge, heightened evapotranspiration, and increased groundwater abstractions. These elements collectively result in lower water flow volumes and contribute to an unbalanced water equilibrium.
The MT3DMS simulations for nitrate concentrations show a consensus among climatic scenarios and models for the historical period of 1991–2018. However, there are differences and variability, particularly in areas of increased nitrate concentrations as time progresses until 2100. The highest nitrate concentrations are produced at the central part of the coastal area in the bias-corrected climatic models 10.ICTP-RegCM4-3.v7* (MPI-ESM-MR), 5.ELU-RegCM4-3v1, and 7.ICTP-RegCM4-3.v7* (HadGEM2), and at the southern part by model 2.ICTP-RegCM4-3v1*. The lowest concentrations present the largest differentiations in the central part by the bias-corrected climatic models 4.CNRM-ALADIN52v1 (MED-44), 1.CNRM-ALADIN52.v1 (MED-11), and 2.ICTP-RegCM4-3v1*, while at the southern part by the bias-corrected climatic models 8.LMD-LMDZ4NEMOMED8v1, 12.UNIBELGRADE-EBUv1*, 13.UNIBELGRADE-EBUPOM2cv1* and 7.ICTP-RegCM4-3.v7* (HadGEM2). In RCP4.5, both the highest and lowest nitrate concentrations are presented at the central coastal part due to the heterogeneous hydrological conditions and hydraulic conductivity of the coastal area. The increasing uncertainty of nitrate pollution according to each climatic model is also verified in the results in Sections BB’ for both climatic scenarios RCP8.5 and RCP4.5. Statistically, the average reduction of nitrate concentrations in Almyros’ groundwater system ranges from 30 to 41% in RCP8.5 and 29 to 50% in RCP4.5 for both cross-sections AA’ and BB’. The smallest mean reduction occurs in RCP8.5, with the largest reduction in RCP4.5. The smallest local decreases occur in RCP8.5 and RCP4.5, with the largest mean reduction in RCP4.5. The smallest local decreases occur in RCP8.5 and RCP4.5, with the largest local increases in RCP4.5. Model 4.CNRM-ALADIN52.v1 (MED-44) presents the largest deviations from the mean of nitrate concentration differences from the base period.
In summary, a careful evaluation underscores a consensus among the majority of models, projecting a decrease in water availability under both scenarios. The divergences observed among models emphasize the inherent uncertainty in climate projections, emphasizing the imperative for prudent interpretation.

5. Conclusions

The Integrated Modeling System for Almyros Basin and its aquifer system has been employed to simulate and project the impacts of future climate change on the water resources and groundwater pollution of the basin. The study has specifically been focused on the adverse RCP8.5 and medium impact RCP4.5 climatic scenarios. These simulations extend until the year 2100, offering insights into various critical hydrological components, including surface runoff, groundwater recharge, nitrogen leaching, groundwater balance, and aquifer nitrate pollution.
The results indicate that precipitation, surface runoff, and groundwater recharge will be reduced in the future. With the anticipated rise in temperature, there is a corresponding increase in both potential and actual evapotranspiration. These climate change impacts contribute to a reduction in nitrogen leaching, a lowering of the groundwater table, and the overall minimization of the water budget. Based on simulation results, it is evident that the water resources in the Almyros Basin are projected to fall short of achieving a good quantity status by 2027, even under the assumption of the moderate impact RCP4.5 climatic scenario. The leaching of nitrogen in the Almyros aquifer is expected to decline, primarily attributed to the decrease in groundwater recharge and the elevated temperatures. Implementing agricultural Best Management Practices (BMPs) can contribute to additional reductions in nitrogen leaching. However, it’s important to note that these practices may not significantly impact the persistence of nitrates in the groundwater system of the Almyros Basin. The duration rate of nitrates in the aquifer’s pollution is challenging to determine conclusively due to notable variability among the bias-corrected Med CORDEX climatic models and results. This uncertainty is evident across both climatic scenarios, namely RCP8.5 and RCP4.5. In the context of climate change, nitrate pollution is anticipated to decrease in all scenarios. However, this reduction may not be sufficient to classify the groundwater system of the Almyros Basin as achieving a good chemical status by 2027, even if the medium impacts of the RCP4.5 climatic scenario are realized. As a result, remedial measures should be implemented to address the contamination at specific sites and areas within the aquifer system, and initiative-taking protective measures against further contamination should also be put into effect. Such measures and actions could be: (a) the construction of small- and medium-sized surface water reservoirs for irrigation and urban water supply with the consecutive reduction in groundwater abstractions, (b) the application of Agricultural Best Management Practices (BMPs) for irrigation (e.g., deficit irrigation) and reduced fertilizer application, (c) application of artificial groundwater recharge, (d) re-use of domestic treated wastewater for irrigation of specific crops and/or groundwater recharge, (e) pump and treat remediation techniques at contaminated sites and (f) change crop pattern. Some of the above measures/actions have been simulated and presented in the Ph.D. Thesis of Lyra [42]. Furthermore, to implement adaptive water resources management, other actions should be applied, such as (i) the establishment of dense monitoring networks to track groundwater quality and quantity for ensuring real–time data provision and diagnosis for the design of future management policies. All the above actions are anticipated to mitigate and even over-turn the negative impacts of future climate change in the study basin.

Supplementary Materials

Additional information for the application of Bias Correction methods and the Nitrogen Leaching model can be found at: https://github.com/waterhy.

Author Contributions

Conceptualization, supervision, methodology, writing—original draft, review, and editing, A.L. (Athanasios Loukas); Conceptualization, software, methodology, writing—original draft-review, formal analysis, investigation, and data curation, A.L. (Aikaterini Lyra); writing—original draft preparation, editing, and review, P.S.; writing—original draft preparation, editing, and review, L.V. All authors have read and agreed to the published version of the manuscript.

Funding

This research is co-financed by Greece and the European Union (European Social Fund—ESF) through the Operational Programme «Human Resources Development, Education and Lifelong Learning» in the context of the project “Strengthening Human Resources Research Potential via Doctorate Research” (MIS-5000432), implemented by the State Scholarships Foundation (ΙΚΥ).

Data Availability Statement

The original contributions presented in the study are included in the article/supplementary material, further inquiries can be directed to the corresponding authors.

Acknowledgments

The simulations used in this work were downloaded from the Med-CORDEX database (www.medcordex.eu).

Conflicts of Interest

The authors declare no conflicts of interest. The funders had no role in the design of the study; in the collection, analyses, or interpretation of data; in the writing of the manuscript; or in the decision to publish the results.

References

  1. Sarkar, S.; Mukherjee, A.; Senapati, B.; Duttagupta, S. Predicting Potential Climate Change Impacts on Groundwater Nitrate Pollution and Risk in an Intensely Cultivated Area of South Asia. ACS Environ. Au 2022, 2, 556–576. [Google Scholar] [CrossRef]
  2. Kazakis, N.; Voudouris, K.S. Groundwater vulnerability and pollution risk assessment of porous aquifers to nitrate: Modifying the DRASTIC method using quantitative parameters. J. Hydrol. 2015, 525, 13–25. [Google Scholar] [CrossRef]
  3. Abascal, E.; Gómez-Coma, L.; Ortiz, I.; Ortiz, A. Global diagnosis of nitrate pollution in groundwater and review of removal technologies. Sci. Total Environ. 2022, 810, 152233. [Google Scholar] [CrossRef]
  4. MEE-GSNEW. Nitrates Directive Report (91/676/EEC).Nitrate Pollution Situation in Greece (Reporting Period 2016–2019). Athens. (In Greek). Available online: http://cdr.eionet.europa.eu/gr/eu/nid/index_html (accessed on 20 January 2022).
  5. Ward, M.H.; Jones, R.R.; Brender, J.D.; De Kok, T.M.; Weyer, P.J.; Nolan, B.T.; Villanueva, C.M.; Van Breda, S.G. Drinking water nitrate and human health: An updated review. Int. J. Environ. Res. Public Health 2018, 15, 1557. [Google Scholar] [CrossRef]
  6. WHO. Guidelines for Drinking-Water Quality: First Addendum to the Fourth Edition; World Health Organization: Geneva, Switzerland, 2017. [Google Scholar]
  7. NCESD. Greece, State of the Environment Report, Summary; National Center of Environment and Sustainable Development: Athens, Greece, 2018; pp. 70–71. [Google Scholar]
  8. EU. Report From The Commission to the Council and the European Parliament on the Implementation of Council Directive 91/676/EEC Concerning the Protection of Waters against Pollution Caused by Nitrates from Agricultural Sources Based on Member State Reports for the Period 2016–2019; European Commission: Brussels, Belgium, 2021. [Google Scholar]
  9. EEC. Council Directive of 12 December 1991 concerning the protection of waters against pollution caused by nitrates from agricultural sources (91/676/EEC). In Directive 91/676/EEC; European Parliament Council of the European Union, Ed.; Official Journal of the European Union: Luxembourg, 1991; Volume 375, pp. 1–8. [Google Scholar]
  10. EU. Directive 2000/60/EC of the European Parliament and of the Council establishing a framework for Community action in the field of water policy—European Environment Agency. In WFD; European Parliament Council of the European Union, Ed.; Official Journal of the European Union: Luxembourg, 2000; Volume 327, pp. 1–73. [Google Scholar]
  11. EU. Directive (EU) 2020/2184 of the European Parliament and of the Council of 16 December 2020 on the quality of water intended for human consumption (recast) (Text with EEA relevance). In Revised EU Drinking Water Directive (EU) 2020/2184; Official Journal of the European Union: Luxembourg, 2020; Available online: https://eur-lex.europa.eu/eli/dir/2020/2184/oj (accessed on 24 August 2022).
  12. Costa, L.R.D.; Hugman, R.T.; Stigter, T.Y.; Monteiro, J.P. Predicting the impact of management and climate scenarios on groundwater nitrate concentration trends in southern Portugal. Hydrogeol. J. 2021, 29, 2501–2516. [Google Scholar] [CrossRef]
  13. Mas-Pla, J.; Menció, A. Groundwater nitrate pollution and climate change: Learnings from a water balance-based analysis of several aquifers in a western Mediterranean region (Catalonia). Environ. Sci. Pollut. Res. 2019, 26, 2184–2202. [Google Scholar] [CrossRef]
  14. Atawneh, D.A.; Cartwright, N.; Bertone, E. Climate change and its impact on the projected values of groundwater recharge: A review. J. Hydrol. 2021, 601, 126602. [Google Scholar] [CrossRef]
  15. Bijay, S.; Craswell, E. Fertilizers and nitrate pollution of surface and ground water: An increasingly pervasive global problem. SN Appl. Sci. 2021, 3, 518. [Google Scholar] [CrossRef]
  16. Olesen, J.E.; Børgesen, C.D.; Hashemi, F.; Jabloun, M.; Bar-Michalczyk, D.; Wachniew, P.; Zurek, A.J.; Bartosova, A.; Bosshard, T.; Hansen, A.L.; et al. Nitrate leaching losses from two Baltic Sea catchments under scenarios of changes in land use, land management and climate. Ambio 2019, 48, 1252–1263. [Google Scholar] [CrossRef] [PubMed]
  17. Reichenau, T.G.; Klar, C.W.; Schneider, K. Effects of Climate Change on Nitrate Leaching. In Regional Assessment of Global Change Impacts: The Project GLOWA-Danube; Mauser, W., Prasch, M., Eds.; Springer International Publishing: Cham, Switzerland, 2016; pp. 623–629. [Google Scholar] [CrossRef]
  18. Villa, A.; Eckersten, H.; Gaiser, T.; Ahrends, H.E.; Lewan, E. Aggregation of soil and climate input data can underestimate simulated biomass loss and nitrate leaching under climate change. Eur. J. Agron. 2022, 141, 126630. [Google Scholar] [CrossRef]
  19. Davamani, V.; John, J.E.; Poornachandhra, C.; Gopalakrishnan, B.; Arulmani, S.; Parameswari, E.; Santhosh, A.; Srinivasulu, A.; Lal, A.; Naidu, R. A Critical Review of Climate Change Impacts on Groundwater Resources: A Focus on the Current Status, Future Possibilities, and Role of Simulation Models. Atmosphere 2024, 15, 122. [Google Scholar] [CrossRef]
  20. Oduor, B.O.; Campo-Bescós, M.Á.; Lana-Renault, N.; Casalí, J. Effects of climate change on streamflow and nitrate pollution in an agricultural Mediterranean watershed in Northern Spain. Agric. Water Manag. 2023, 285, 108378. [Google Scholar] [CrossRef]
  21. Tsakiris, G.P.; Loucks, D.P. Adaptive Water Resources Management Under Climate Change: An Introduction. Water Resour. Manag. 2023, 37, 2221–2233. [Google Scholar] [CrossRef]
  22. IPCC. Climate Change 2014: Synthesis Report. Contribution of Working Groups I, II and III to the Fifth Assessment Report of the Intergovernmental Panel on Climate Change; Core Writing Team, Pachauri, R.K., Meyer, L.A., Eds.; 9291691437; IPCC: Geneva, Switzerland, 2014; p. 151. [Google Scholar]
  23. Lyra, A.; Loukas, A. Simulation and Evaluation of Water Resources Management Scenarios Under Climate Change for Adaptive Management of Coastal Agricultural Watersheds. Water Resour. Manag. 2022, 37, 2625–2642. [Google Scholar] [CrossRef]
  24. Focaccia, S.; Panini, G.; Pedrazzoli, P.; Ciriello, V. A meta-modeling approach for hydrological forecasting under uncertainty: Application to groundwater nitrate response to climate change. J. Hydrol. 2021, 603, 127173. [Google Scholar] [CrossRef]
  25. Aizebeokhai, A.P.; Oyeyemi, K.D.; Adeniran, A. An Overview of the Potential Impacts of Climate Change on Groundwater Resources. J. Inform. Math. Sci. 2017, 9, 437–453. [Google Scholar] [CrossRef]
  26. Olesen, J.E.; Carter, T.R.; Díaz-Ambrona, C.H.; Fronzek, S.; Heidmann, T.; Hickler, T.; Holt, T.; Minguez, M.I.; Morales, P.; Palutikof, J.P.; et al. Uncertainties in projected impacts of climate change on European agriculture and terrestrial ecosystems based on scenarios from regional climate models. Clim. Chang. 2007, 81, 123–143. [Google Scholar] [CrossRef]
  27. Rotiroti, M.; Sacchi, E.; Caschetto, M.; Zanotti, C.; Fumagalli, L.; Biasibetti, M.; Bonomi, T.; Leoni, B. Groundwater and surface water nitrate pollution in an intensively irrigated system: Sources, dynamics and adaptation to climate change. J. Hydrol. 2023, 623, 129868. [Google Scholar] [CrossRef]
  28. Amanambu, A.C.; Obarein, O.A.; Mossa, J.; Li, L.; Ayeni, S.S.; Balogun, O.; Oyebamiji, A.; Ochege, F.U. Groundwater system and climate change: Present status and future considerations. J. Hydrol. 2020, 589, 125163. [Google Scholar] [CrossRef]
  29. Sheikha-BagemGhaleh, S.; Babazadeh, H.; Rezaie, H.; Sarai-Tabrizi, M. The effect of climate change on surface and groundwater resources using WEAP-MODFLOW models. Appl. Water Sci. 2023, 13, 121. [Google Scholar] [CrossRef]
  30. Kourgialas, N.N. A critical review of water resources in Greece: The key role of agricultural adaptation to climate-water effects. Sci. Total Environ. 2021, 775, 145857. [Google Scholar] [CrossRef]
  31. Lyra, A.; Loukas, A.; Sidiropoulos, P.; Tziatzios, G.; Mylopoulos, N. An Integrated Modeling System for the Evaluation of Water Resources in Coastal Agricultural Watersheds: Application in Almyros Basin, Thessaly, Greece. Water 2021, 13, 268. [Google Scholar] [CrossRef]
  32. Loukas, A.; Mylopoulos, N.; Vasiliades, L. A Modeling System for the Evaluation of Water Resources Management Strategies in Thessaly, Greece. Water Resour. Manag. 2007, 21, 1673–1702. [Google Scholar] [CrossRef]
  33. Harbaugh, A.W.; McDonald, M.G. User’s Documentation for MODFLOW-2000, an Update to the U.S. Geological Survey Modular Finite-Difference Ground-Water Flow Model; United States Government Printing Office: Washington, DC, USA, 2000. [Google Scholar]
  34. Zheng, C.; Wang, P.P. MT3DMS: A Modular Three-Dimensional Multi-Species Transport Model for Simulation of Advection, Dispersion and Chemical Reactions of Contaminants in Groundwater Systems, Documentation and User’s Guide; Contract Report SERDP-99-1; U.S. Army Engineer Research and Development Center: Vicksburg, MS, USA, 1999. [Google Scholar]
  35. Thornthwaite, C.W. An Approach toward a Rational Classification of Climate. Geogr. Rev. 1948, 38, 55–94. [Google Scholar] [CrossRef]
  36. ESDAC. European Soil Data Centre, Joint Research Centre, European Commission. Available online: http://esdac.jrc.ec.europa.eu (accessed on 21 January 2021).
  37. MEE-GSNEW. Ministry of Environment and Energy, Secretariat of Natural Environment and Water. Available online: http://lmt.ypeka.gr/public_view.html (accessed on 28 January 2024).
  38. E.U. Copernicus Marine Service Information. Sea level daily gridded data from satellite observations for the Mediterranean Sea from 1993 to 2020. In European Seas Gridded L 4 Sea Surface Heights And Derived Variables Reprocessed 1993 Ongoing; Copernicus Climate Change Service (C3S); Copernicus Marine Service: Ramonville-Saint-Agne, France, 2023. [Google Scholar] [CrossRef]
  39. Lee, T.; Singh, V.P. Statistical Downscaling for Hydrological and Environmental Applications; CRC Press: Boca Raton, FL, USA, 2018. [Google Scholar] [CrossRef]
  40. Moriasi, D.N.; Arnold, J.G.; Van Liew, M.W.; Bingner, R.L.; Harmel, R.D.; Veith, T.L. Model Evaluation Guidelines for Systematic Quantification of Accuracy in Watershed Simulations. Trans. ASABE 2007, 50, 885–900. [Google Scholar] [CrossRef]
  41. Criss, R.E.; Winston, W.E. Do Nash values have value? Discussion and alternate proposals. Hydrol. Process 2008, 22, 2723–2725. [Google Scholar] [CrossRef]
  42. Lyra, A. Simulation and Management of Degraded Water Resources of Coastal Watersheds. Ph.D. Thesis, Department of Civil Engineering, School of Engineering, University of Thessaly, Vólos, Greece, 2023. [Google Scholar] [CrossRef]
Figure 1. Map of the Almyros Basin, its watersheds, and the Almyros aquifer system.
Water 16 00465 g001
Figure 2. (a) Map of the Almyros aquifer hydrogeological formations at different elevated horizontal sections. (b) Map of the averaged hydraulic heads as simulated using the Integrated Modeling System and the averaged observed nitrate concentrations at well locations for the observed period 1991–2018.
Water 16 00465 g002
Figure 3. Box–Whisker plots of Mean Annual Precipitation (mm) for the observed periods 1971–2000 and 2001–2018, and the Bias–corrected Med–CORDEX Models under RCP8.5 for the periods 1971–2000 and 2001–2018, 2019–2050, 2051–2080 and 2081–2100.
Water 16 00465 g003
Figure 4. Box–Whisker plots of Mean Annual Precipitation (mm) for the observed periods 1971–2000 and 2001–2018, and the Bias–corrected Med–CORDEX Models under RCP4.5 for the periods 1971–2000 and 2001–2018, 2019–2050, 2051–2080 and 2081–2100.
Water 16 00465 g004
Figure 5. Box–Whisker plots of Mean Annual Temperature in °C for the observed periods 1971–2000 and 2001–2018, and the Bias–corrected Med–CORDEX Models under RCP8.5 for the periods 1971–2000 and 2001–2018, 2019–2050, 2051–2080 and 2081–2100.
Water 16 00465 g005
Figure 6. Box–Whisker plots of Mean Annual Temperature in °C for the observed periods 1971–2000 and 2001–2018, and the Bias–corrected Med–CORDEX Models under RCP4.5 for the periods 1971–2000 and 2001–2018, 2019–2050, 2051–2080 and 2081–2100.
Water 16 00465 g006
Figure 7. Bar charts for the Simulated variables of Potential Evapotranspiration (PET), Actual Evapotranspiration (AET), Surface runoff (Q), and Groundwater Recharge (Rg) in mm for the Bias–corrected Med–CORDEX Models under RCP8.5 for the historical time periods of 1971–2000 and 2001–2018, and the future periods 2019–2050, 2051–2080 and 2081–2100.
Water 16 00465 g007
Figure 8. Bar charts for the simulated variables of Potential Evapotranspiration (PET), Actual Evapotranspiration (AET), Surface runoff (Q), and Groundwater Recharge (Rg) in mm for the Bias–corrected Med–CORDEX Models under RCP4.5, for the historical time periods 1971–2000 and 2001–2018, and the future periods 2019–2050, 2051–2080 and 2081–2100.
Water 16 00465 g008
Figure 9. Box–Whisker of Nitrogen Leaching (kg/ha/yr) as simulated with the REPIC model for the Bias–corrected Med–CORDEX Models under RCP8.5, for historical periods 1971–2000 and 2001–2018, and future periods, 2019–2050, 2051–2080 and 2081–2100.
Water 16 00465 g009
Figure 10. Box–Whisker of Nitrogen Leaching (kg/ha/yr) as simulated with the REPIC model for the Bias–corrected Med–CORDEX Models under RCP4.5, for historical periods 1971–2000 and 2001–2018, and future periods, 2019–2050, 2051–2080 and 2081–2100.
Water 16 00465 g010
Figure 11. Section AA’ (left) and Section BB’ (right) for Nitrate Concentrations in mg/L for the Bias–corrected Med–CORDEX Models under RCP8.5 for the time periods of 1991–2018, 2019–2050, 2051–2080, and 2081–2100.
Water 16 00465 g011
Figure 12. Section AA’ (left) and Section BB’ (right) for Nitrate Concentrations in mg/L for the Bias–corrected Med–CORDEX Models under RCP4.5 for the time periods of 1991–2018, 2019–2050, 2051–2080, and 2081–2100.
Water 16 00465 g012
Table 1. Source Information used in the study.
VariableData PrecisionTime StepTime SpanSourceAcquiring Method
Climate
(Precipitation, Temperature)
Point StationMonthly,
daily
1961–2018Hellenic Meteorological Service (EMY)Request
Ministry of Environment and Energy
Private meteorological stations
Land UseFieldAnnual Greek Payment Authority of Common Agricultural Policy (C.A.P.) Aid Schemes (OPEKEPE)Request
Crop YieldsCrop TypeAnnual Public
Corine Land CoverMin. Mapping Unit/Width 25 ha/100 m6 years1990–2018Copernicus Land Monitoring Service European Environment AgencyPublic
Soil Hydraulic PropertiesRaster 1 km × 1 km2013European Soil Data Centre (ESDAC)Request Form
Raster 500 m × 500 m2015
Clay, Sand, Silt, and Coarse MaterialPoint2015OPEKEPE and the National Agricultural Research Foundation (NAGREF)Request
Groundwater Heads and NO3 ConcentrationsPointDaily1991–2015Hellenic Survey of Geology and Mineral Exploration (HSGME)Request
Regional Government of ThessalyRequest
Magnesia PrefectureRequest
Former StudiesLiterature
BoreholePoint1991–2015Abstraction Points from Surface and Underground Water BodiesDigitization
Former StudiesLiterature
Sea LevelGridded1991–2018Copernicus Climate Change ServiceRegister
Climate Models (Precipitation, Temperature)11 and 44 degreesMonthly1970–2100Mediterranean Coordinated Regional Downscaling Experiment (Med-CORDEX)Request Form/for research only
Table 2. Med-CORDEX GCM/RCM simulations used in the study.
DomainGCM Model/CMIP5 EnsembleRCM Model Climate Scenario
MED-11CNRM-CM5_r8i1p11.CNRM-ALADIN52v1RCP8.5-4.5
ICTP-RegCM4_r1i1p12.ICTP-RegCM4-3v1*RCP8.5
MED-44CMCC-CM.r1i1p13.CMCC-CLM4-8-19.v1RCP8.5-4.5
CNRM-CM5_r8i1p14.CNRM-ALADIN52.v1RCP8.5-4.5
HadGEM2-ES.r1i1p15.ELU-RegCM4-3_v1RCP8.5-4.5
HadGEM2-ES.r1i1p16.ICTP-RegCM4-3.v4*RCP4.5
HadGEM2-ES.r1i1p17.ICTP-RegCM4-3.v7*RCP8.5
IPSL-CM5A-MR.r1i1p18.LMD-LMDZ4NEMOMED8.v1RCP8.5-4.5
MPI-ESM-LR.r1i1p19.GUF-CCLM4-8-18.v1RCP8.5-4.5
MPI-ESM-MR.r1i1p110.ICTP-RegCM4-3.v7*RCP8.5
MED-44iCNRM-CM5.r1i1p111.ENEA_PROTHEUS.v2*RCP4.5
MPI-ESM-LR.r1i1p112.UNIBELGRADE-EBU.v1*RCP8.5
MPI-ESM-LR.r1i1p113.UNIBELGRADE-EBUPOM2c.v1*RCP8.5
Note: * Available only for one RCP.
Table 3. QEM performance scores using the employed statistical metrics and efficacy ranking order (in parentheses) for monthly precipitation. (* Available only for one RCP).
ScenarioClimatic ModelR2NSEIAKGEVE
RCP8.5
(8.5 W/m2, CO2 1370 ppm)
1.CNRM-ALADIN52v1 (MED-11)0.97 (11)0.72 (10)0.92 (9)0.57 (8)0.61 (9)
2.ICTP-RegCM4-3v1*0.99 (2)0.73 (8)0.90 (10)0.51 (10)0.71 (8)
3.CMCC-CLM4-8-19.v10.99 (4)0.91 (6)0.97 (6)0.71 (6)0.79 (6)
4.CNRM-ALADIN52.v1 (MED-44)0.97 (10)0.64 (11)0.90 (11)0.50 (11)0.57 (11)
5.ELU-RegCM4-3_v10.98 (8)0.88 (7)0.96 (7)0.69 (7)0.78 (7)
7.ICTP-RegCM4-3.v7* (HadGEM2)0.99 (2)0.96 (2)0.99 (2)0.81 (3)0.87 (2)
8.LMD-LMDZ4NEMOMED8.v10.99 (5)0.73 (9)0.94 (8)0.57 (9)0.58 (10)
9.GUF-CCLM4-8-18.v10.99 (7)0.95 (3)0.98 (4)0.82 (2)0.83 (5)
10.ICTP-RegCM4-3.v7* (MPI-ESM-MR)0.99 (1)0.95 (4)0.98 (5)0.77 (5)0.87 (3)
12.UNIBELGRADE-EBU.v1*0.99 (6)0.94 (5)0.99 (3)0.81 (4)0.85 (4)
13.UNIBELGRADE-EBUPOM2c.v1*0.98 (9)0.97 (1)0.99 (1)0.91 (1)0.90 (1)
RCP4.5
(4.5 W/m2, CO2 650 ppm)
1.CNRM-ALADIN52v1 (MED-11)0.98 (6)0.75 (6)0.93 (7)0.58 (6)0.64 (6)
3.CMCC-CLM4-8-19.v10.99 (2)0.91 (3)0.97 (3)0.71 (3)0.79 (4)
4.CNRM-ALADIN52.v1 (MED-44)0.97 (7)0.64 (8)0.90 (8)0.50 (8)0.57 (8)
5.ELU-RegCM4-3_v10.98 (5)0.88 (5)0.96 (5)0.69 (5)0.78 (5)
6.ICTP-RegCM4-3.v4*0.99 (1)0.9 (4)0.97 (4)0.70 (4)0.81 (3)
8.LMD-LMDZ4NEMOMED8.v10.99 (3)0.73 (7)0.94 (6)0.57 (7)0.58 (7)
9.GUF-CCLM4-8-18.v10.99 (4)0.95 (1)0.99 (1)0.82 (1)0.83 (1)
11.ENEA_PROTHEUS.v2*0.96 (8)0.92 (2)0.98 (2)0.80 (2)0.82 (2)
Table 4. QEM performance scores using the employed statistical metrics and efficacy ranking order (in parentheses) for monthly temperature. (* Available only for one RCP).
ScenarioClimatic ModelR2NSEIAKGE
RCP8.5
(8.5 W/m2, CO2 1370 ppm)
1.CNRM-ALADIN52v1 (MED-11)0.90 (3)0.94 (2)0.99 (1)0.97 (1)
2.ICTP-RegCM4-3v1*0.90 (6)0.94 (5)0.98 (5)0.97 (5)
3.CMCC-CLM4-8-19.v10.90 (8)0.93 (8)0.98 (8)0.97 (8)
4.CNRM-ALADIN52.v1 (MED-44)0.90 (9)0.93 (9)0.98 (8)0.97 (8)
5.ELU-RegCM4-3_v10.90 (2)0.94 (2)0.99 (1)0.97 (1)
7.ICTP-RegCM4-3.v7* (HadGEM2)0.90 (5)0.94 (5)0.98 (5)0.97 (5)
8.LMD-LMDZ4NEMOMED8.v10.90 (10)0.93 (10)0.98 (8)0.97 (10)
9.GUF-CCLM4-8-18.v10.80 (11)0.04 (11)0.72 (11)0.52 (11)
10.ICTP-RegCM4-3.v7* (MPI-ESM-MR)0.90 (7)0.94 (7)0.98 (5)0.97 (5)
12.UNIBELGRADE-EBU.v1*0.90 (4)0.94 (4)0.99 (1)0.97 (1)
13.UNIBELGRADE-EBUPOM2c.v1*0.90 (1)0.94 (1)0.99 (1)0.97 (1)
RCP4.5
(4.5 W/m2, CO2 650 ppm)
1.CNRM-ALADIN52v1 (MED-11)0.90 (1)0.94 (1)0.98 (1)0.97 (1)
3.CMCC-CLM4-8-19.v10.90 (5)0.94 (1)0.98 (1)0.97 (1)
4.CNRM-ALADIN52.v1 (MED-44)0.90 (4)0.93 (5)0.98 (5)0.96 (5)
5.ELU-RegCM4-3_v10.90 (2)0.94 (1)0.98 (1)0.97 (1)
6.ICTP-RegCM4-3.v4*0.90 (3)0.94 (4)0.98 (4)0.96 (4)
8.LMD-LMDZ4NEMOMED8.v10.90 (6)0.93 (6)0.98 (5)0.96 (6)
9.GUF-CCLM4-8-18.v10.80 (8)0.74 (8)0.72 (8)0.52 (8)
11.ENEA_PROTHEUS.v2*0.80 (7)0.78 (7)0.94 (7)0.89 (7)
Table 5. Average relative (%) changes of nitrogen leaching in the future periods from the historical period 1991–2018. (* only for one RCP).
ScenarioClimatic Model2019–20302031–20502051–20802081–2100Sparkline
RCP8.5 (8.5 W/m2, CO2 1370 ppm)1.CNRM-ALADIN52v1 (MED-11)−25%−46%−30%−32%Water 16 00465 i001
2.ICTP-RegCM4-3v1*−13%−45%−21%−11%Water 16 00465 i002
3.CMCC-CLM4-8-19.v1−16%−26%−3%4%Water 16 00465 i003
4.CNRM-ALADIN52.v1 (MED-44)−20%−40%−18%−11%Water 16 00465 i004
5.ELU-RegCM4-3_v1−27%−50%−28%−5%Water 16 00465 i005
7.ICTP-RegCM4-3.v7* (HadGEM2)−24%−37%−21%1%Water 16 00465 i006
8.LMD-LMDZ4NEMOMED8.v1−40%−63%−19%−25%Water 16 00465 i007
9.GUF-CCLM4-8-18.v1−41%−45%−20%−21%Water 16 00465 i008
10.ICTP-RegCM4-3.v7* (MPI-ESM-MR)−13%−38%−26%−12%Water 16 00465 i009
12.UNIBELGRADE-EBU.v1*−24%−44%−20%−24%Water 16 00465 i010
13.UNIBELGRADE-EBUPOM2c.v1*−28%−46%−23%−22%Water 16 00465 i011
RCP4.5 (4.5 W/m2, CO2 650 ppm)1.CNRM-ALADIN52v1 (MED-11)−10%−55%−39%−27%Water 16 00465 i012
3.CMCC-CLM4-8-19.v1−14%−57%−42%−29%Water 16 00465 i013
4.CNRM-ALADIN52.v1 (MED-44)−14%−57%−42%−30%Water 16 00465 i014
5.ELU-RegCM4-3_v1−14%−57%−42%−30%Water 16 00465 i015
6.ICTP-RegCM4-3.v4*−12%−54%−39%−26%Water 16 00465 i016
8.LMD-LMDZ4NEMOMED8.v1−4%−43%−28%−13%Water 16 00465 i017
9.GUF-CCLM4-8-18.v1−5%−51%−33%−16%Water 16 00465 i018
11.ENEA_PROTHEUS.v2*−11%−53%−38%−18%Water 16 00465 i019
Table 6. Average groundwater heads (m) for historical and future periods. (* only for one RCP).
ScenarioClimatic Model1991–20002001–20182019–20502051–20802081–2100Sparkline
RCP8.5 (8.5 W/m2, CO2 1370 ppm)1.CNRM-ALADIN52v1 (MED-11)73.5564.9258.8851.2649.84Water 16 00465 i020
2.ICTP-RegCM4-3v1*73.8765.5859.4051.2449.76Water 16 00465 i021
3.CMCC-CLM4-8-19.v175.1072.0759.2458.7957.15Water 16 00465 i022
4.CNRM-ALADIN52.v1 (MED-44)73.4564.1058.5450.5649.19Water 16 00465 i023
5.ELU-RegCM4-3_v174.2468.2261.5853.5351.76Water 16 00465 i024
7.ICTP-RegCM4-3.v7* (HadGEM2)75.0171.9456.3058.5256.86Water 16 00465 i025
8.LMD-LMDZ4NEMOMED8.v176.7678.4077.8474.9874.68Water 16 00465 i026
9.GUF-CCLM4-8-18.v174.9171.5958.1058.6657.00Water 16 00465 i027
10.ICTP-RegCM4-3.v7* (MPI-ESM-MR)74.7470.7856.0256.8655.17Water 16 00465 i028
12.UNIBELGRADE-EBU.v1*75.4574.3767.2164.1962.84Water 16 00465 i029
13.UNIBELGRADE-EBUPOM2c.v1*75.1973.2563.1261.2859.70Water 16 00465 i030
RCP4.5 (4.5 W/m2, CO2 650 ppm)1.CNRM-ALADIN52.v1 (MED-11)74.0168.5562.7358.9350.15Water 16 00465 i031
3.CMCC-CCLM4-8-19v174.9171.8560.9758.4456.80Water 16 00465 i032
4.CNRM-ALADIN52v1 (MED-44)73.4964.4958.0750.6549.23Water 16 00465 i033
5.ELU-RegCM4-3v174.2068.0061.3553.2451.48Water 16 00465 i034
6.ICTP-RegCM4-3v4*74.3268.5161.0353.6051.74Water 16 00465 i035
8.LMD-LMDZ4NEMOMED8v176.5877.8576.8473.6973.05Water 16 00465 i036
9.GUF-CCLM4-8-18v174.8571.1868.2358.0556.40Water 16 00465 i037
11.ENEA-PROTHEUSv2*74.4569.5962.8554.8153.08Water 16 00465 i038
Table 7. Average water balance (hm3) for historical and future periods. (* only for one RCP).
ScenarioClimatic Model1991–20002001–20182019–20502051–20802081–2100Sparkline+/−
RCP8.5 (8.5 W/m2, CO2 1370 ppm)1.CNRM-ALADIN52v1 (MED-11)−31.4−26.2−20.6−9.7−4.4Water 16 00465 i039
2.ICTP-RegCM4-3v1*−29.6−26−21.6−9.4−3.2Water 16 00465 i040
3.CMCC-CLM4-8-19.v1−15.2−16.1−17.5−11.3−7.1Water 16 00465 i041
4.CNRM-ALADIN52.v1 (MED-44)−33−26.5−21.8−8.7−3.1Water 16 00465 i042
5.ELU-RegCM4-3_v1−25.7−21.3−21−10.5−4.5Water 16 00465 i043
7.ICTP-RegCM4-3.v7* (HadGEM2)−16−15.1−17.6−11.4−8.5Water 16 00465 i044
8.LMD-LMDZ4NEMOMED8.v14.91.8−5.9−2.40.5Water 16 00465 i045
9.GUF-CCLM4-8-18.v1−17−16.1−17.3−11.1−7.1Water 16 00465 i046
10.ICTP-RegCM4-3.v7* (MPI-ESM-MR)−19.7−17.4−19−10.8−5.2Water 16 00465 i047
12.UNIBELGRADE-EBU.v1*−10.1−9.1−13.9−9.6−5.1Water 16 00465 i048
13.UNIBELGRADE-EBUPOM2c.v1*−13.3−12.7−15.9−10.6−5.8Water 16 00465 i049
RCP4.5 (4.5 W/m2, CO2 650 ppm)1.CNRM-ALADIN52.v1 (MED-11)−30.4−25.2−27.2−16.7−18.1Water 16 00465 i050
3.CMCC-CCLM4-8-19v1−16.9−15.1−18.7−10.3−8.1Water 16 00465 i051
4.CNRM-ALADIN52v1 (MED-44)−32.5−25.9−21−9.7−4.9Water 16 00465 i052
5.ELU-RegCM4-3v1−26.2−21.6−21.2−10.5−4.5Water 16 00465 i053
6.ICTP-RegCM4-3v4*−24.9−20.7−20.5−11.7−7Water 16 00465 i054
8.LMD-LMDZ4NEMOMED8v12.80.2−6.4−5.8−1.8Water 16 00465 i055
9.GUF-CCLM4-8-18v1−17.8−16.9−21.7−11.2−7.3Water 16 00465 i056
11.ENEA-PROTHEUSv2*−23.3−19.7−20.6−10.6−4.4Water 16 00465 i057
Table 8. Average groundwater ΝO3 (mg/L) for historical and future periods. (* only for one RCP).
ScenarioClimatic Model1991–20002001–20182019–20502051–20802081–2100
RCP8.5 (8.5 W/m2, CO2 1370 ppm)1.CNRM-ALADIN52v1 (MED-11)32.430.225.021.017.5
2.ICTP-RegCM4-3v1*32.430.626.223.218.8
3.CMCC-CLM4-8-19.v132.029.124.321.218.0
4.CNRM-ALADIN52.v1 (MED-44)32.530.626.223.318.7
5.ELU-RegCM4-3_v132.430.326.123.219.4
7.ICTP-RegCM4-3.v7* (HadGEM2)32.029.224.521.218.0
8.LMD-LMDZ4NEMOMED8.v131.126.420.518.213.7
9.GUF-CCLM4-8-18.v132.029.124.121.017.8
10.ICTP-RegCM4-3.v7* (MPI-ESM-MR)32.229.825.522.219.2
12.UNIBELGRADE-EBU.v1*31.828.122.920.316.7
13.UNIBELGRADE-EBUPOM2c.v1*31.928.523.520.617.2
RCP4.5 (4.5 W/m2, CO2 650 ppm)1.CNRM-ALADIN52.v1 (MED-11)32.329.824.217.616.3
3.CMCC-CCLM4-8-19v132.129.124.120.717.2
4.CNRM-ALADIN52v1 (MED-44)32.530.626.022.718.6
5.ELU-RegCM4-3v132.430.326.123.119.2
6.ICTP-RegCM4-3v4*32.330.225.822.652.9
8.LMD-LMDZ4NEMOMED8v131.226.720.918.614.3
9.GUF-CCLM4-8-18v132.029.225.921.017.9
11.ENEA-PROTHEUSv2*32.329.925.421.618.7
Table 9. Statistics of groundwater percent (%) differences in ΝO3 (% mg/L) of future periods from the historical base period 1991–2000. (* only for one RCP).
ScenarioClimatic ModelMean (AA’/BB’)Min (AA’/BB’)Max (AA’/BB’)Stdev (AA’/BB’)
RCP8.5 (8.5 W/m2, CO2 1370 ppm)1.CNRM-ALADIN52v1 (MED-11)−41−37−100−1001251074036
2.ICTP-RegCM4-3v1*−38−30−100−1001341574142
3.CMCC-CLM4-8-19.v1−34−38−99−9673772532
4.CNRM-ALADIN52.v1 (MED-44)−40−30−100−1001341994245
5.ELU-RegCM4-3_v1−35−30−100−1001391283940
7.ICTP-RegCM4-3.v7* (HadGEM2)−38−36−100−98104832934
8.LMD-LMDZ4NEMOMED8.v1−32−41−91−89246304129
9.GUF-CCLM4-8-18.v1−35−38−100−9666832533
10.ICTP-RegCM4-3.v7* (MPI-ESM-MR)−33−31−100−98105943036
12.UNIBELGRADE-EBU.v1*−36−35−98−81108512430
13.UNIBELGRADE-EBUPOM2c.v1*−36−37−99−9064582330
RCP4.5 (4.5 W/m2, CO2 650 ppm)1.CNRM-ALADIN52.v1 (MED-11)−43−50−100−100121784031
3.CMCC-CCLM4-8-19v1−36−44−100−9670592631
4.CNRM-ALADIN52v1 (MED-44)−41−31−100−1001291614142
5.ELU-RegCM4-3v1−36−29−100−1001401363941
6.ICTP-RegCM4-3v4*−37−29−100−1001381303939
8.LMD-LMDZ4NEMOMED8v1−30−39−90−88190324130
9.GUF-CCLM4-8-18v1−33−39−100−9671832634
11.ENEA-PROTHEUSv2*−34−34−100−99110943435
Disclaimer/Publisher’s Note: The statements, opinions and data contained in all publications are solely those of the individual author(s) and contributor(s) and not of MDPI and/or the editor(s). MDPI and/or the editor(s) disclaim responsibility for any injury to people or property resulting from any ideas, methods, instructions or products referred to in the content.

