Article

Comprehension of Seismic-Induced Groundwater Level Rise in Unsaturated Sandy Layer Based on Soil–Water–Air Coupled Finite Deformation Analysis

Department of Civil and Environmental Engineering, Nagoya University, Furo-cho, Chikusa-ku, Nagoya 4648603, Japan
*
Author to whom correspondence should be addressed.
Water 2024, 16(3), 452; https://doi.org/10.3390/w16030452
Submission received: 6 December 2023 / Revised: 20 January 2024 / Accepted: 26 January 2024 / Published: 30 January 2024
(This article belongs to the Special Issue How Earthquakes Affect Groundwater)

Abstract

:
Immense liquefaction damage was observed in the 2011 off the Pacific coast of Tohoku Earthquake. It was reported that, in Chiba Prefecture, Japan, the main shock oozed muddy water from the sandy ground and the aftershock which occurred 29 min after the main shock intensified the water spouting; thus, the aftershock expanded the liquefaction damage in the sandy ground. For comprehending such a phenomenon, using a soil–water–air coupled elastoplastic finite deformation analysis code, a rise in groundwater level induced by main shock is demonstrated, which may increase the potential of liquefaction damage during the aftershock. The authors wish to emphasize that these results cannot be obtained without soil–water–air coupled elastoplastic finite deformation analysis. This is because the rise in groundwater level is caused by the negative dilatancy behavior (plastic volume compression) of the saturated soil layer which supplies water to the upper unsaturated soil layer, and it is necessary to precisely calculate the settlement of ground and the amount of water drainage/absorption to investigate the groundwater level rise. This study provides insight into the mechanism of ground liquefaction during a series of earthquakes.

1. Introduction

The 2011 off the Pacific coast of Tohoku Earthquake caused extensive liquefaction damage to the reclaimed ground of Tokyo Bay area, located more than 400 km away from the epicenter. In Urayasu City, Chiba Prefecture, Japan, the liquefaction damage was particularly severe although the observed peak ground acceleration was approximately 150 gal [1]. One of the reasons for this severe damage is considered to be the aftershock that struck 29 min after the occurrence of the main shock, in addition to the long duration of the earthquake. Studies on liquefaction damage expansion due to this aftershock have been conducted primarily using a soil–water two-phase coupled analysis. For example, Ueda et al. [2] showed that the aftershock occurred before the sufficient dissipation of excess pore water pressure which increased during the main shock. Also, Morikawa et al. [3] suggested that stress-induced anisotropy developed due to the main shock, which led to reliquefaction during the aftershock.
Moreover, according to Yasuda et al. [4], evidence from the residents suggests that the main shock oozed muddy water, and the aftershock intensified the spouting of water. Figure 1 shows the water spout phenomenon before and after the main shock and aftershock recorded by a fixed-point camera at Urayasu City Irifune Junior High School [5]. The water spout phenomenon was observed 10 min after the main shock, and it became intense during the aftershock. Thus, it can be considered that the liquefaction damage expanded because the groundwater level rose due to the main shock and thereby the aftershock occurred when the shallow unsaturated soil layer was saturated. This study aims to elucidate the mechanism of groundwater level rise due to a main shock, which has the potential to increase liquefaction damage during aftershocks using a soil–water–air three-phase coupled analysis.
Groundwater-level fluctuation phenomena due to earthquakes have been frequently observed (e.g., Refs. [6,7,8]), and the causes of such phenomena are considered to be an increase in pore water pressure, a change in permeability, and a change in void ratio. Particularly, in the field of geophysics, many studies on the mechanism of groundwater level change caused by earthquakes have been performed, and numerical analyses have been conducted by modeling the ground as a linear elastic body based on Biot’s equation [9]. See Mang and Wang [10] for a detailed summary. In contrast, in this study, a three-phase coupled dynamic analysis is performed by modeling the ground as an elastoplastic body. In a previous study, using a three-phase coupled finite deformation analysis code considering inertial force [11] incorporating the elastoplastic constitutive equation SYS Cam-clay model [12], the authors showed that the groundwater level rose due to an earthquake. This was because the saturated soil layer below the groundwater level exhibited negative dilatancy behavior (plastic volume compression), which supplied water to the unsaturated soil layer above the groundwater level [13]. To consider the liquefaction damage caused by this phenomenon, this study discusses the seismic-induced groundwater level rise in more detail.
This paper is structured as follows. In Section 2, the analysis conditions are described, and, in Section 3, numerical simulations during/after the main shock and aftershock are performed. In contrast to previous studies on three-phase coupled dynamic elastoplastic analyses primarily during an earthquake (e.g., Refs. [14,15,16,17]), in this study, a deformation analysis during/after the main shock and aftershock was performed using the above-mentioned three-phase coupled elastoplastic finite deformation analysis code [11] with reference to the Urayasu City ground condition and earthquakes. Section 4 presents several case studies to better understand the mechanism of groundwater level rise due to an earthquake, and the conclusion of this paper is presented in Section 5.

2. Analysis Conditions

A three-phase coupled finite deformation analysis code considering inertial force [11] incorporating the elastoplastic constitutive equation SYS Cam-clay model [12] was used in this study. An outline of the analysis method is described in Appendix A and Appendix B. Please refer to them as needed.
Figure 2 shows the analysis cross-section. In this study, a one-dimensional analysis, which can easily comprehend water and air flow balances, was performed. Referring to geological columnar sections published by Chiba Prefecture [18,19] and Nakai et al. [20], the ground was set up with a layer composition consisting of sand, clay, and bedrock.
Nakai et al. [20] performed a two-dimensional analysis on liquefaction damage in Urayasu City during the 2011 Tohoku earthquake using the soil–water coupled finite deformation analysis code [21] incorporating the SYS Cam-clay model [12] and constructed and validated a ground model for Urayasu City. A mesh of 1 horizontal and 1000 vertical finite elements was used under a plane strain condition. The periodic boundary condition [21] was set at the lateral sides and the viscous boundary condition [22] was set for the horizontal direction at the bottom (shear wave velocity Vs = 400 m/s [20]). The displacement-fixed condition was set for the vertical direction at the bottom. Regarding water and air boundary conditions, the total head constant condition corresponding to the initial groundwater level was set for water and the exhausted condition satisfying always atmospheric pressure was set for air at the ground surface, whereas the undrained and unexhausted conditions were set at the other boundaries. The initial groundwater level was set at 1 m below the ground surface because the groundwater level at which partial building damage comprising 50–70% of the surface area occurred ranged from GL-0.8 m to GL-1.3 m [23].
Table 1 shows the material constants and initial values for the elastoplastic constitutive equation SYS Cam-clay model [12]. The values were determined from the numerical simulations of mechanical tests of soils sampled from Urayasu City ground after the earthquake [20], and the initial values for specific volume, degree of structure, stress ratio, and degree of anisotropy were given to each layer uniformly while the initial overconsolidation ratio was distributed in the vertical direction according to the overburden pressure. The skeleton stress equation [24] was used in the elastoplastic constitutive model. Table 2 shows the material constants for the soil–water characteristics of the van Genuchten [25] and Mualem [26] model, and other physical properties. Both saturated and unsaturated states were considered for the sand layer, while saturated states were assumed for the clay and bedrock layer. Figure 3 shows the soil–water characteristic curve and the relations between water/air permeability and the degree of saturation for the sand layer. The saturated coefficient of water permeability for the sand layer was determined from a permeability test using sand sampled in Urayasu City [19]. The dry coefficient of air permeability for the sand layer is calculated from the saturated coefficient of water permeability by using the ratio of the viscosity coefficients of air and water [27]. The other material constants related to the soil–water characteristic of the sand layer were determined by referring to a past study on experimental results of clayey sand [28] because the buried soil layer and alluvial sand layer in Urayasu City ground contained a large amount of fine grains [5] and we were unable to obtain the result of a soil water retention test using Urayasu sand. The other values were taken from Nakai et al. [20]. The initial pore water pressure p w was set equal to the pore air pressure p a at the groundwater level, assuming the hydrostatic pressure distribution in the vertical direction. The initial p a was assumed to be zero at the initial ground surface height and was distributed vertically by considering the self-weight of air above the groundwater level [13]. The initial p a below the groundwater level was equal to p w because the suction p s ( = p a p w ) was zero. The initial degree of saturation s w was calculated from the soil water characteristic curve according to the suction value. Figure 4 shows the initial vertical distributions of p w , p a , and s w in the sand layer.
Figure 5 shows input seismic waves for the main shock and the aftershock and their Fourier amplitude spectrums. We used the east–west components of the seismic waveforms recorded at KiK-NET Shimousa (CHBH04, measurement depth 2300 m, Vs = 2540 m/s [29]), where both the main shock and aftershock waveforms of the 2011 Tohoku earthquake were available. Because the seismic velocity structure of the ground at KiK-NET Shimousa was not available, the following Midorikawa’s Equation [30], which empirically gives the maximum velocity amplitude ratio Av between the ground surface and the seismic bedrock (Vs = 3000 m/s), was used:
A v = 170 · V s 0.6           ( V s < 1100   m / s ) 2.5                                         ( V s 1100   m / s )
To convert the seismic waves at Vs = 2540 m/s to those at Vs = 400 m/s, 170 · 400 0.6 / 2.5 = 1.87 was multiplied by the recorded waveforms, and they are shown in Figure 5. Assuming that the recorded waves were observed at a free surface level of the base stratum, acceleration with half the amplitude of the waves, shown in Figure 5, was imposed at the bottom boundary of the analysis cross-section in the horizontal direction as upward seismic waves. The aftershock was input 29 min after the occurrence of the main shock. All the computations were performed under the same conditions during and after the main shock and the aftershock, except for the presence or absence of seismic wave input. The computations were performed until the excess pore pressure in the sand layer completely dissipated after the aftershock. Here, the excess pore water pressure was defined as pore water pressure generated excessively from hydrostatic pressure corresponding to the initial groundwater level (i.e., the total head constant condition at the ground surface).

3. Results and Discussion

Figure 6 shows the distributions of the degree of saturation s w , mean skeleton stress (abbreviated as MSS), and excess pore water pressure (abbreviated as EPWP) immediately before the main shock to immediately before the aftershock. Figure 7 shows the distributions of these quantities from immediately before the aftershock to the end of the consolidation of the sand layer after the aftershock. Here, we use “consolidation” to describe the phenomenon of sand compression as excess pore pressure that is generated by earthquake dissipates over time. The figures show an enlarged view of the sand layer part of approximately 2.5 m from the ground surface, including the part in which the initial groundwater level was located.
First, we discuss the results during and after the main shock, as shown in Figure 6. The distribution of s w demonstrates that the groundwater level was rising after the main shock. During the main shock, MSS decreased in the saturated soil elements, whereas MSS hardly decreased in the soil elements with a low degree of saturation near the ground surface. During the main shock, the increase in EPWP is attributed to negative dilatancy (i.e., plastic volume compression) due to seismic cyclic shear. In this analysis, EPWP in the sand layer started dissipating around the end of the main shock. In association with the dissipation of EPWP, the groundwater level rose due to the consolidation drainage of the sand layer below the groundwater level after the main shock and s w near the ground surface increased. This saturation led to a decrease in MSS near the ground surface. Although the EPWP started to dissipate in the deeper saturated area of the sand layer, the EPWP did not dissipate immediately before the aftershock, and the MSS was lower immediately before the aftershock than before the main shock.
Next, we discuss the results during and after the aftershock, as shown in Figure 7. As described above, s w increased in the shallow part of the ground, which had been unsaturated before the main shock, and the EPWP did not dissipate when the aftershock occurred. Consequently, the MSS decreased more during the aftershock than during the main shock. Thus, the numerical simulation demonstrated that the factors causing the liquefaction damage expansion during the aftershock include the saturation of the unsaturated soil layer due to the groundwater level rise after the main shock, as well as the occurrence of the aftershock before the sufficient dissipation of the EPWP. The EPWP in the sand layer completely dissipated approximately a day after the aftershock, and the elevated water level returned to the pre-earthquake position (i.e., the initial groundwater level position) because of the total head constant condition set at the ground surface. In addition, the MSS at the end of consolidation after the aftershock was lower than that before the main shock because the lateral component of the skeleton stress became smaller under the complicated stress history during the earthquakes.
Figure 8 shows the temporal change in mean skeleton stress reduction ratio (abbreviated as MSSRR), EPWP, and s w of the soil element in the unsaturated state before the main shock, as shown in Figure 6 and Figure 7. MSSRR is defined as Δp′/p0, where p0 represents MSS before the main shock and Δp′ represents the difference between p0 and current MSS. The temporal change in MSSRR shows that MSSRR was larger during the aftershock compared to that during the main shock, and the temporal change in EPWP and s w shows that the EPWP increased by the main shock did not completely dissipate and the soil element became saturated at the start of the aftershock. Note that the EPWP, which was defined in Section 2 as pore water pressure generated excessively from hydrostatic pressure corresponding to the initial groundwater level, decreased a little during the main shock because the soil element subsided and the pore water pressure hardly increased in the unsaturated soil.
In addition, to emphasize the effect of saturation of the unsaturated soil layer, we also conducted a numerical simulation during and after the aftershock, which occurred a day after the main shock, that is, after the EPWP due to the main shock in the sand layer fully dissipated. Figure 9 shows its contour diagrams. If the groundwater level returned to the initial position before the aftershock, the MSS in the shallow layer did not significantly decrease during the aftershock and was larger than when the aftershock occurred 29 min after the main shock. Figure 10 shows the temporal change in MSSRR, EPWP, and s w of the soil element in the unsaturated state before the main shock, as shown in Figure 6 and Figure 9. In comparison with Figure 8, the temporal change in MSSRR did not increase more significantly than when the aftershock occurred 29 min after the main shock, and the temporal change in EPWP and s w shows that the EPWP that increased due to the main shock was completely dissipated, and the soil element became unsaturated again at the start of the aftershock.
Here, the mechanism of groundwater level rise caused by the earthquake is described in more detail. Figure 11 shows the distribution of the amount of water absorption immediately before the aftershock. As described above, it is evident that consolidation drainage of the sand layer below the groundwater level caused the water absorption of the sand layer above the groundwater level. Figure 12 is a conceptual diagram illustrating the mechanism of groundwater level rise caused by the earthquake. First, considering a one-dimensional consolidation under the upper-end-drained and lower-end-undrained conditions for the saturated ground, shown in Figure 12a, the amount of ground settlement is equal to the amount of drainage from the ground. Therefore, the supernatant water level produced by consolidation drainage is equal to the height of ground surface before consolidation without the consideration of evaporation, rainfall, etc. In the present analysis, the seismic cyclic shear causes a negative dilatancy in the initially saturated ground below the groundwater level, resulting in positive EPWP and consolidation settlement accompanied by the dissipation of EPWP. However, in the presence of an unsaturated soil layer above the groundwater level, as shown in Figure 12b, water drained by consolidation is supplied to the unsaturated soil layer. Here, since the unsaturated soil is composed of soil particles, pore water, and pore air, the groundwater level rises by the volume of the soil (i.e., soil particles + pore water + trapped pore air) sunk in the portion corresponding to the supernatant water. For example, if the amount of consolidation drainage from the saturated ground is the same, the smaller the volume of pore air in the unsaturated soil layer, i.e., the smaller the void ratio of the unsaturated soil layer under the same degree of saturation, the higher the groundwater level rises. This is the mechanism of seismic-induced groundwater level rise described in this analysis. Therefore, in order to investigate the rise in groundwater levels, it is necessary to precisely calculate the settlement of ground and the amount of water drainage/absorption within the framework of three-phase finite deformation analysis. To better understand the mechanism of groundwater level rise, case studies were conducted in the next section, Section 4.

4. Case Studies on Mechanism of Groundwater Level Rise

In Section 3, we described that the smaller the void ratio of the unsaturated soil layer, the higher the groundwater level rises, provided that the amount of consolidation drainage from the saturated soil layer below the groundwater level is the same. In this section, we conduct case studies focusing on this point, and we summarize the mechanism of groundwater level rise. To clarify the mechanism described in Section 3, the undrained condition was set at the upper end and the condition was set up for no pore water exchange between the sand and clay layers in the finite element mesh, shown in Figure 2, in order not to exchange water with the outside of the sand layer. In addition, the initial groundwater level was set at 2 m below the ground surface, indicating that the initial unsaturated area was set larger than in Section 3 to observe a greater groundwater level rise for various cases. In addition, the computations were performed until the excess pore pressure in the sand layer completely dissipated after the main shock and the aftershock was not input.

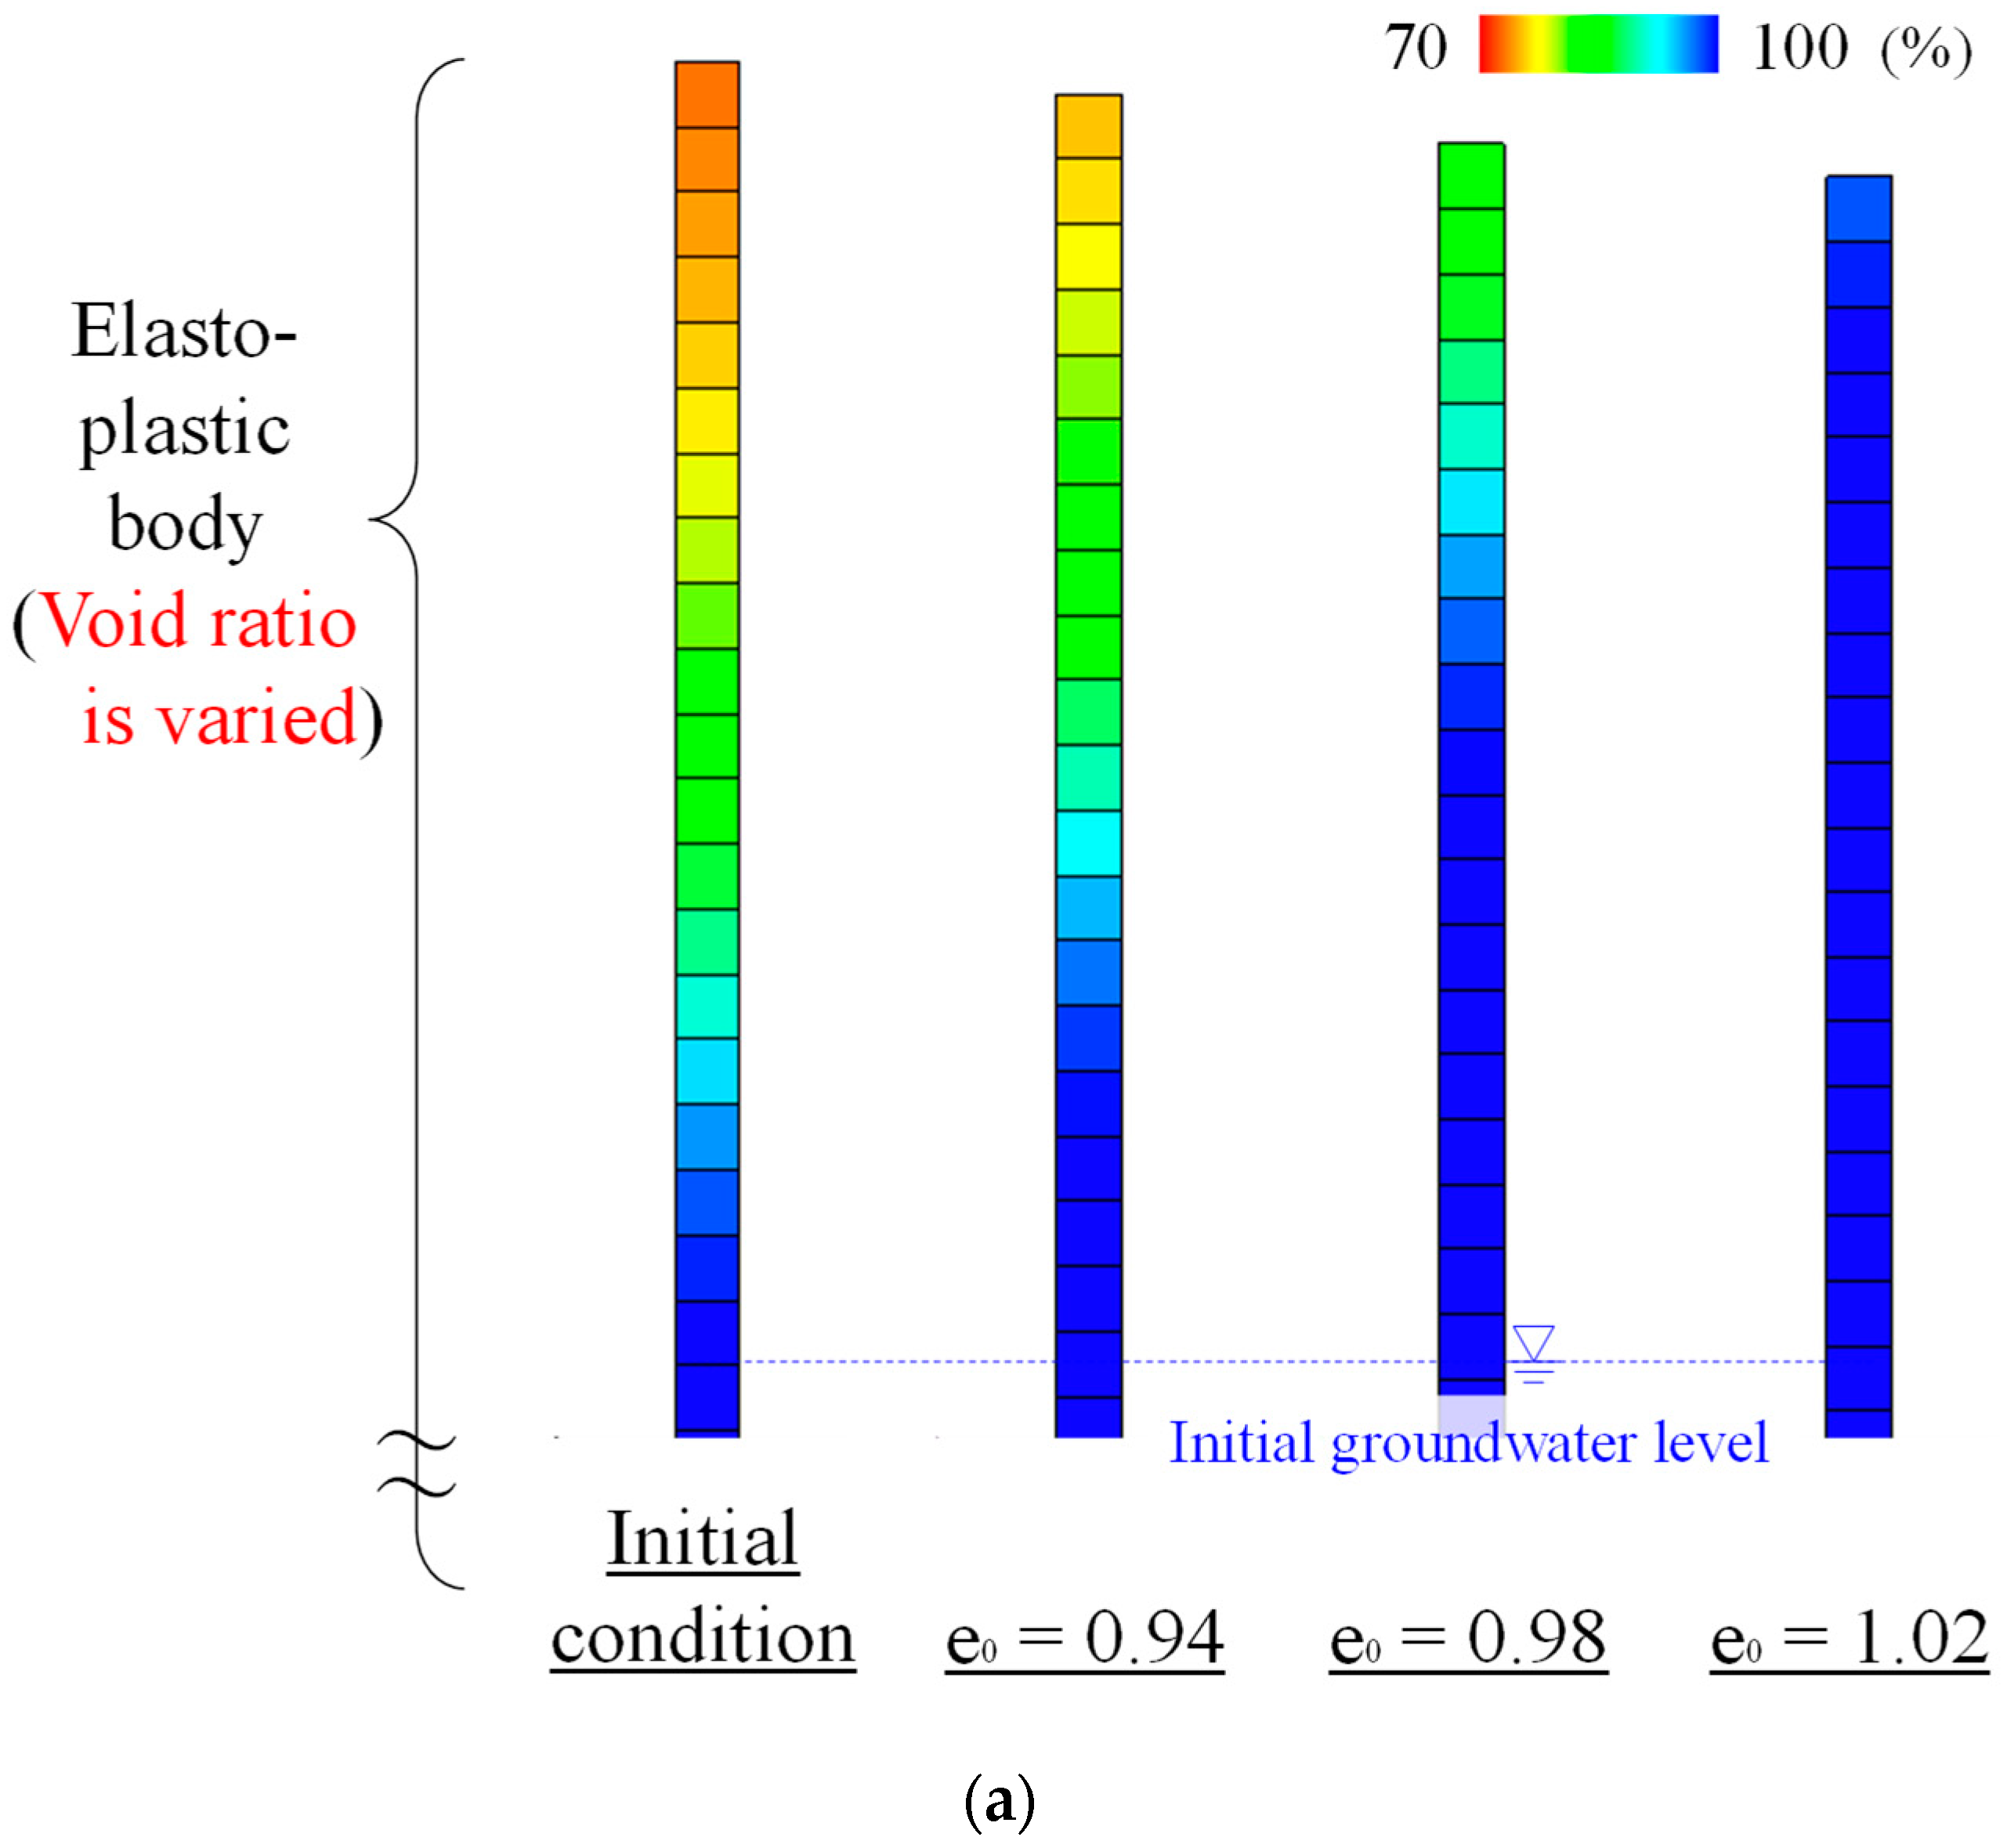
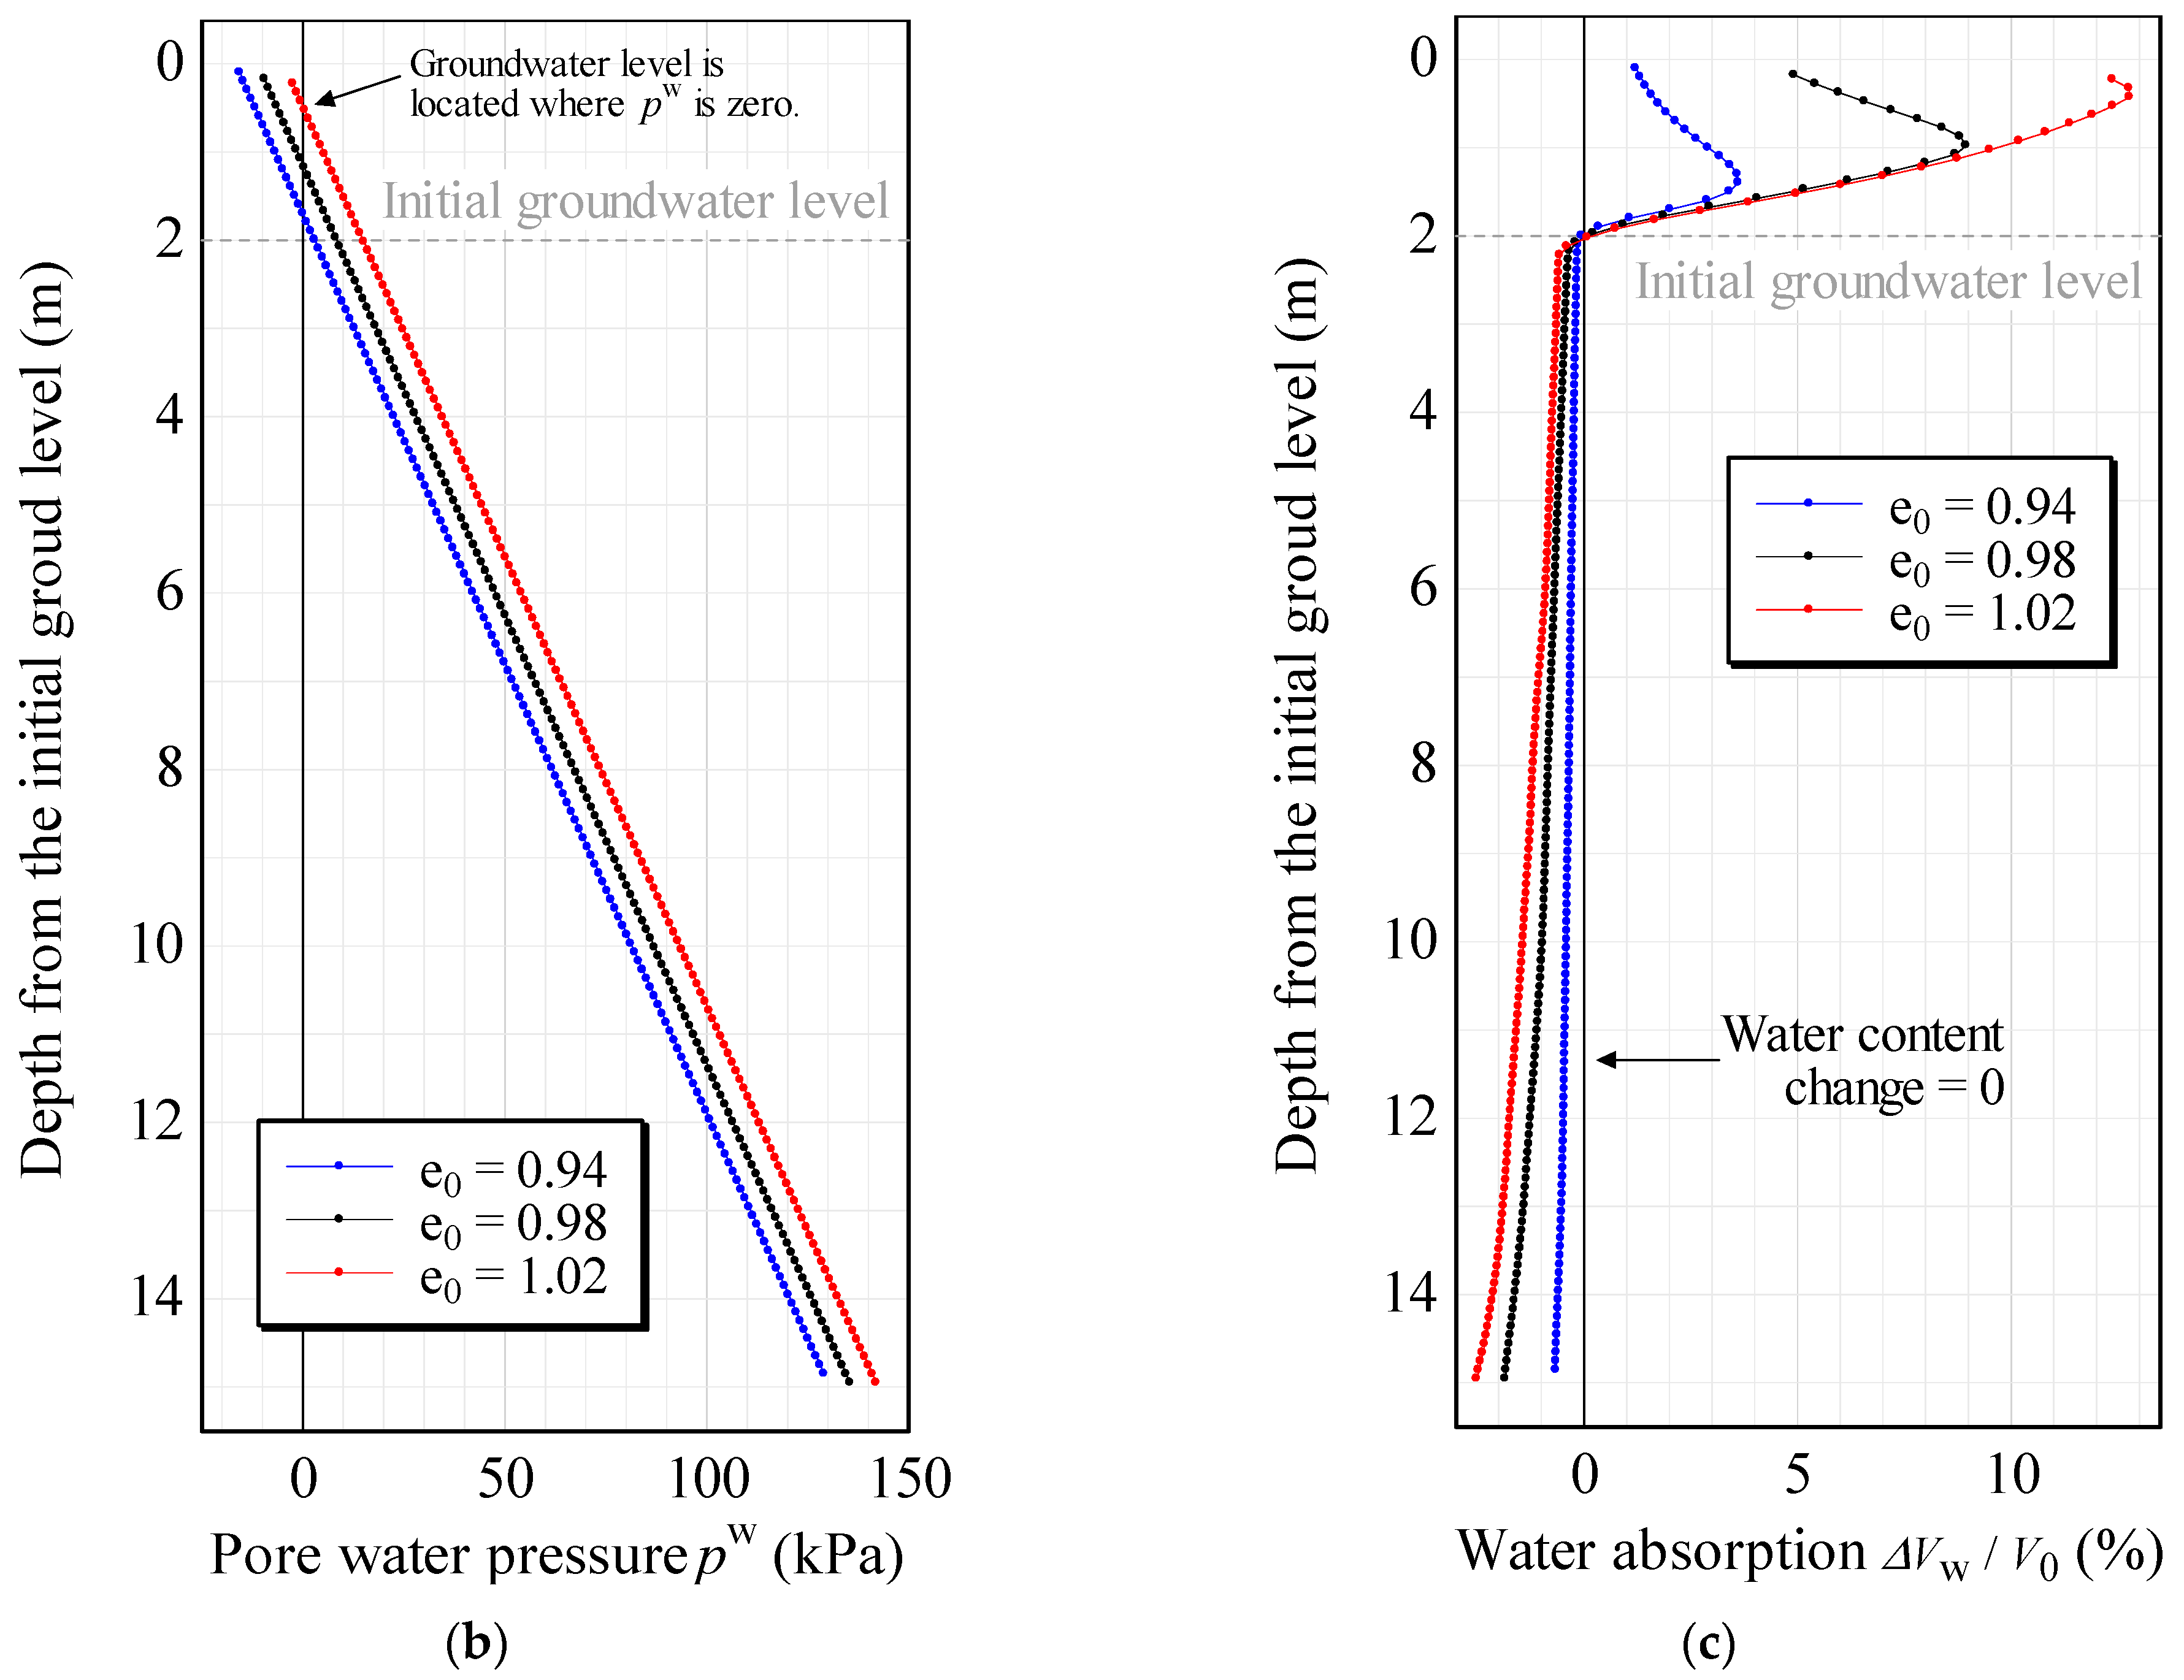
4.1. Case Where Void Ratio of the Entire Sand Layer Varies

Case analyses were conducted by varying the initial void ratio of the entire sand layer. Specifically, based on the case where the initial void ratio e0 was 0.98, the same as in Section 3, computations were performed for the cases where the void ratio was reduced to e0 = 0.94 (denser sand layer) and increased to e0 = 1.02 (looser sand layer). Figure 13 shows the distributions of the degree of saturation, pore water pressure, and the amount of water absorption ΔVw/V0 (V0: volume of the soil before the earthquake; ΔVw: volume of water absorption) when the excess pore pressure in the sand layer completely dissipated. Note that the groundwater level is located where the pore water pressure is zero in the distributions of pore water pressure. First, the results, when pore water did not exchange with the outside of the sand layer, show that the groundwater level rose due to the exchange of pore water in the sand layer. Next, comparing the results when the initial void ratio was changed, i.e., e0 = 0.94 and 1.02, the distributions of the degree of saturation and pore water pressure show that the groundwater level rose higher as the void ratio increased, in contrast to the above explanation. The distributions of the amount of water absorption show that the larger the void ratio, the larger the amount of drainage from the saturated sand layer, i.e., the groundwater level rose higher as the void ratio increased because the loose ground with a larger void ratio exhibited larger plastic volume compression, which led to a larger amount of consolidation drainage from the saturated sand layer. In addition, the analysis result in this section reached a steady state without a return of the groundwater level because the undrained condition was set at the ground surface as well as the other boundaries, while the groundwater level rose temporally and returned to the initial groundwater level due to the total head constant condition set at the ground surface in the analysis of Section 3.

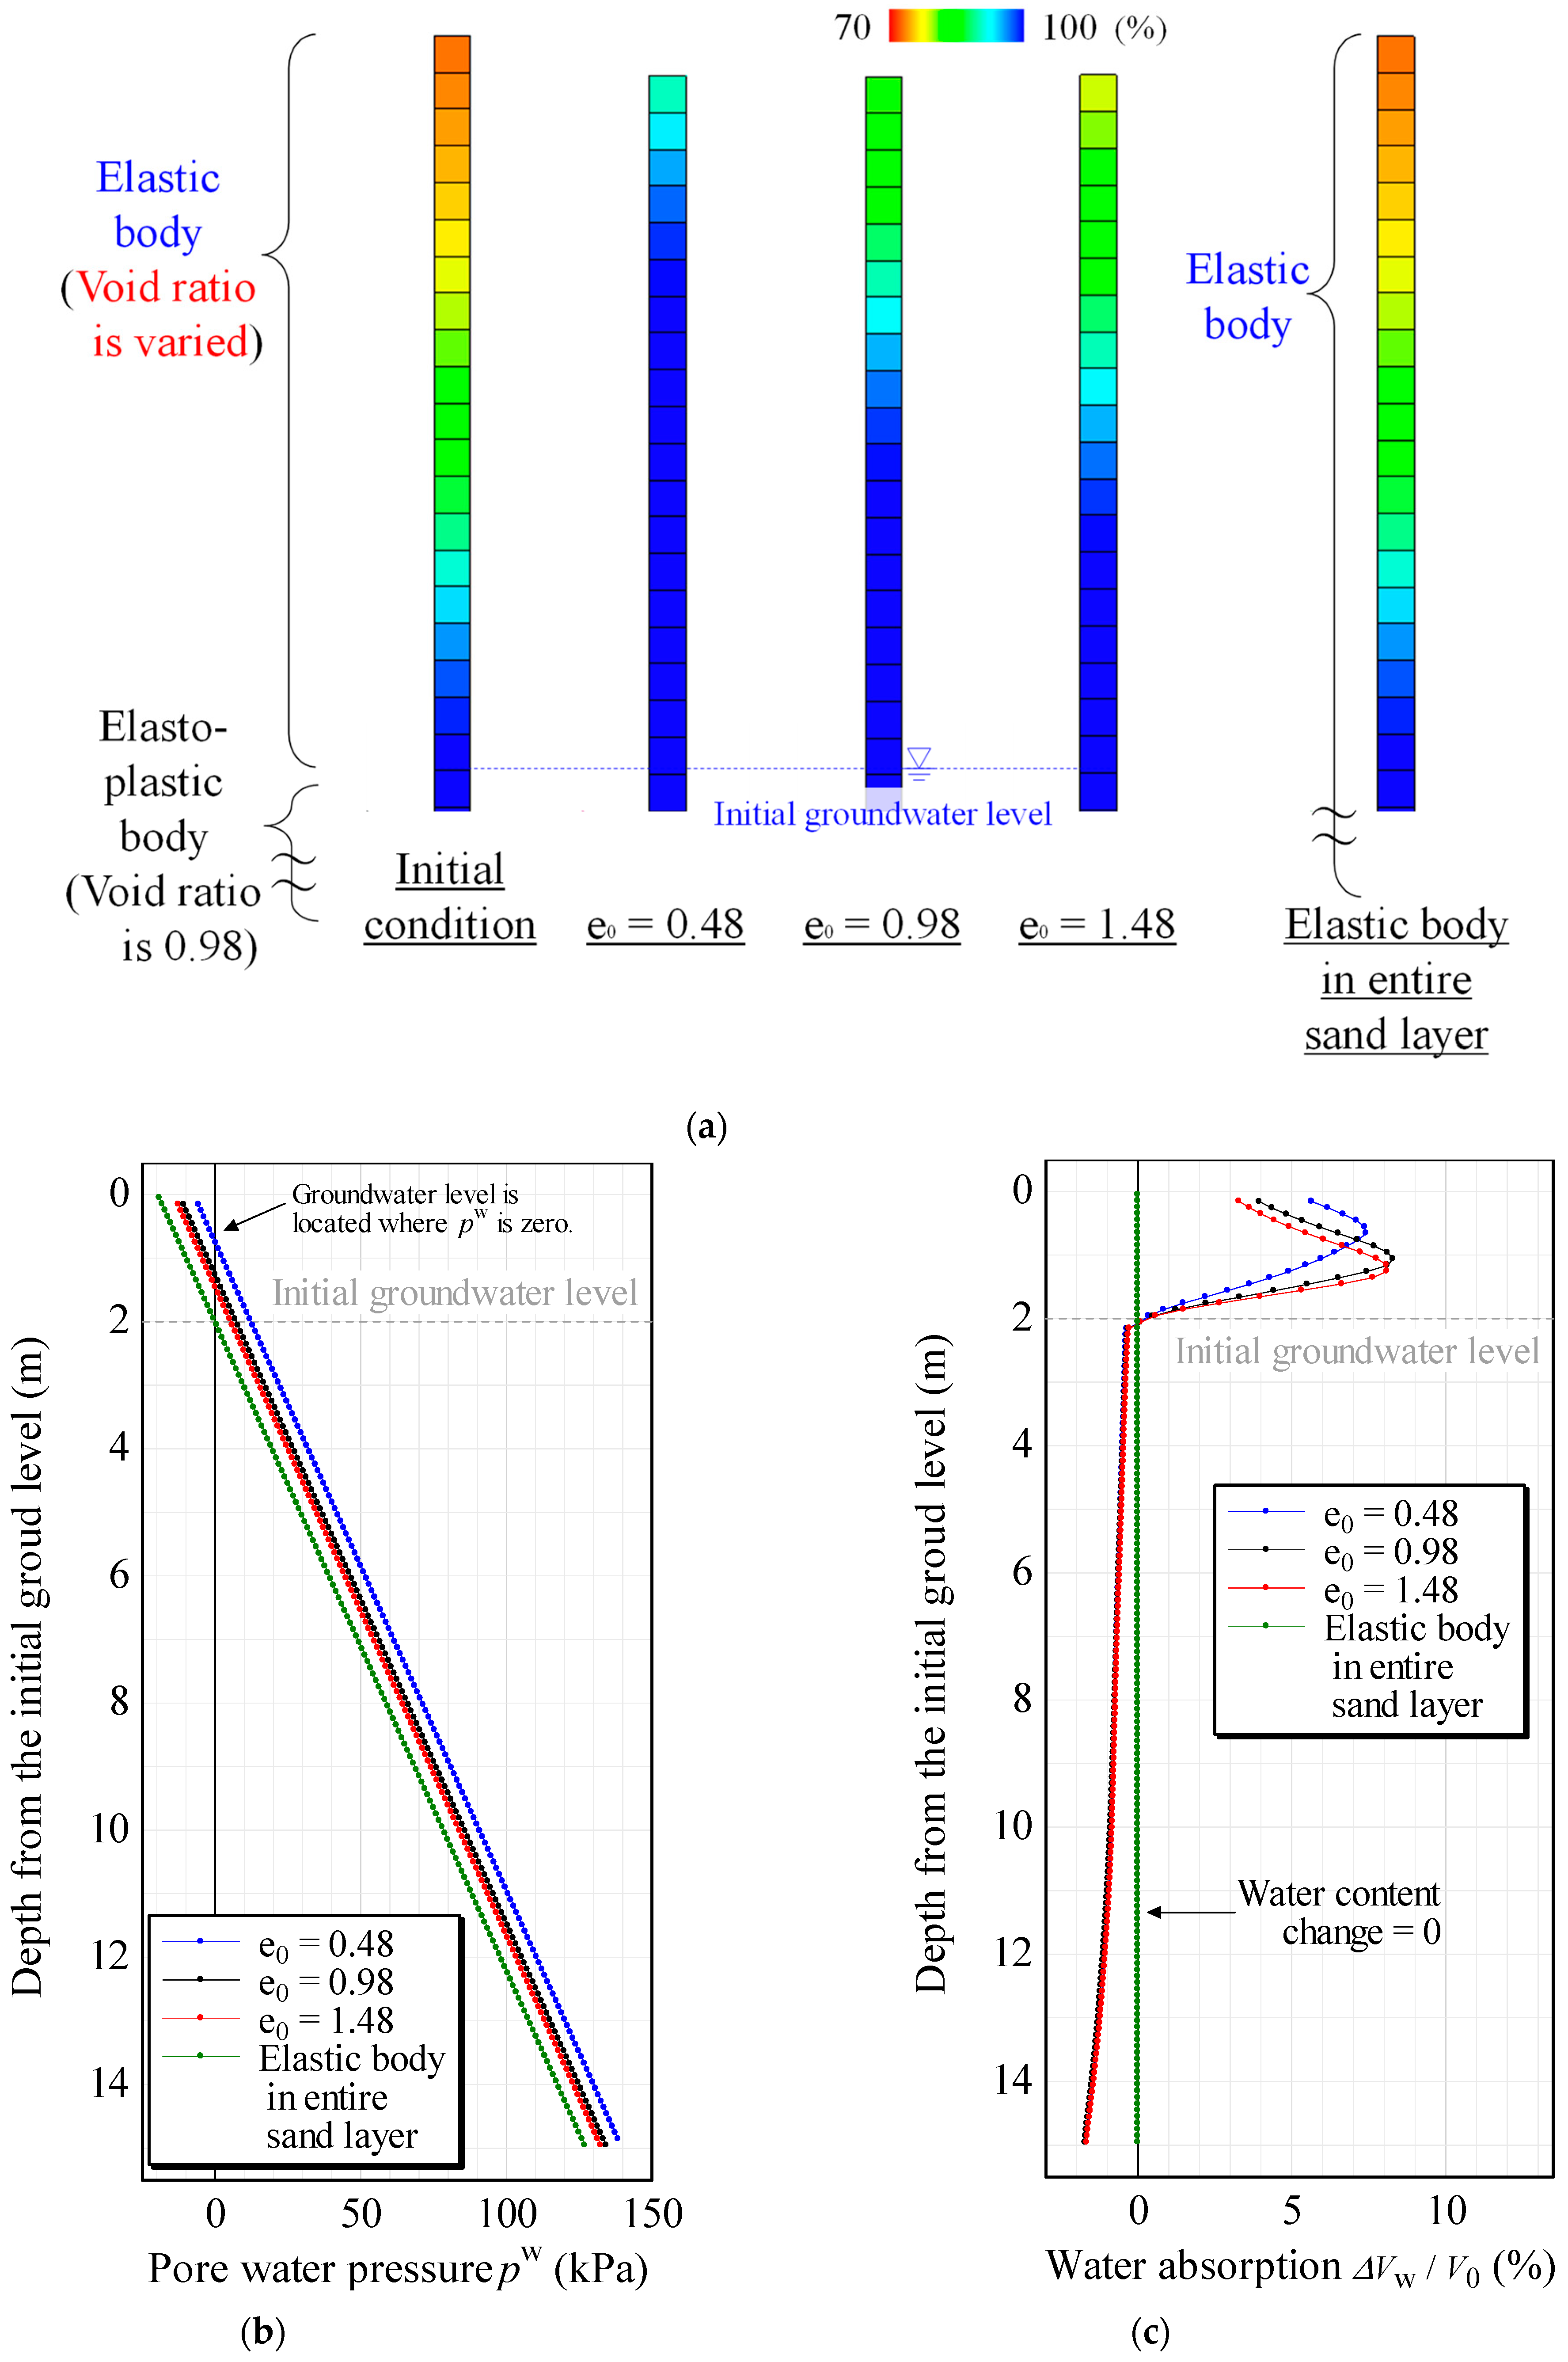
4.2. Case Where Void Ratio of the Unsaturated Sand Layer Modeled as Elastic Body Varies

In the previous section, the initial void ratio of the entire sand layer was changed, but, in this section, the computations were performed when the initial void ratio was varied only in the unsaturated sand layer above the groundwater level, and only the unsaturated sand layer was modeled as a linear elastic body (Young’s modulus: 2.58 × 10⁴ kPa; Poisson’s ratio: 0.2). Specifically, based on the case where the initial void ratio e0 was 0.98, the same as in Section 3, the computations were performed for the cases where the void ratio only in the unsaturated sand layer was reduced to e0 = 0.48 and increased to e0 = 1.48. Figure 14 shows the distributions of degree of saturation, pore water pressure, and the amount of water absorption in soil element, when the excess pore pressure in the sand layer completely dissipated. The distributions of degree of saturation and pore water pressure show that the smaller the void ratio of the unsaturated sand layer, the higher the groundwater level rose. Further, the distributions of the amount of water absorption show that the amount of consolidation drainage from the saturated sand layer was almost the same in any case. Thus, because the elastic unsaturated sand layer does not cause negative dilatancy (plastic volume compression) due to excitation, if the amount of consolidation drainage from the saturated sand layer (plastic volume compression) is almost the same, the smaller the void ratio of the unsaturated sand layer, the higher the groundwater level rise, based on the mechanism explained in Figure 12. Furthermore, we also analyzed the case where the entire ground, including the saturated sand layer, was modeled as the elastic body, which is also shown in Figure 14. Because the groundwater level changes due to dilatancy (plastic volume change) induced by excitation, the elastic analysis cannot represent the groundwater level fluctuation demonstrated in this paper, indicating the importance of elastoplastic analysis in the seismic response analysis of the ground.

5. Conclusions

We investigated the mechanism of main shock-induced groundwater level rise, which has the potential to increase liquefaction damage during aftershocks by simulating processes during/after the main shock and aftershock using a three-phase coupled elastoplastic finite deformation analysis code. As a result, in addition to the conventional interpretation that the aftershock occurred when positive excess pore water pressure generated during the main shock did not sufficiently dissipate, the following mechanism of liquefaction damage expansion was demonstrated:
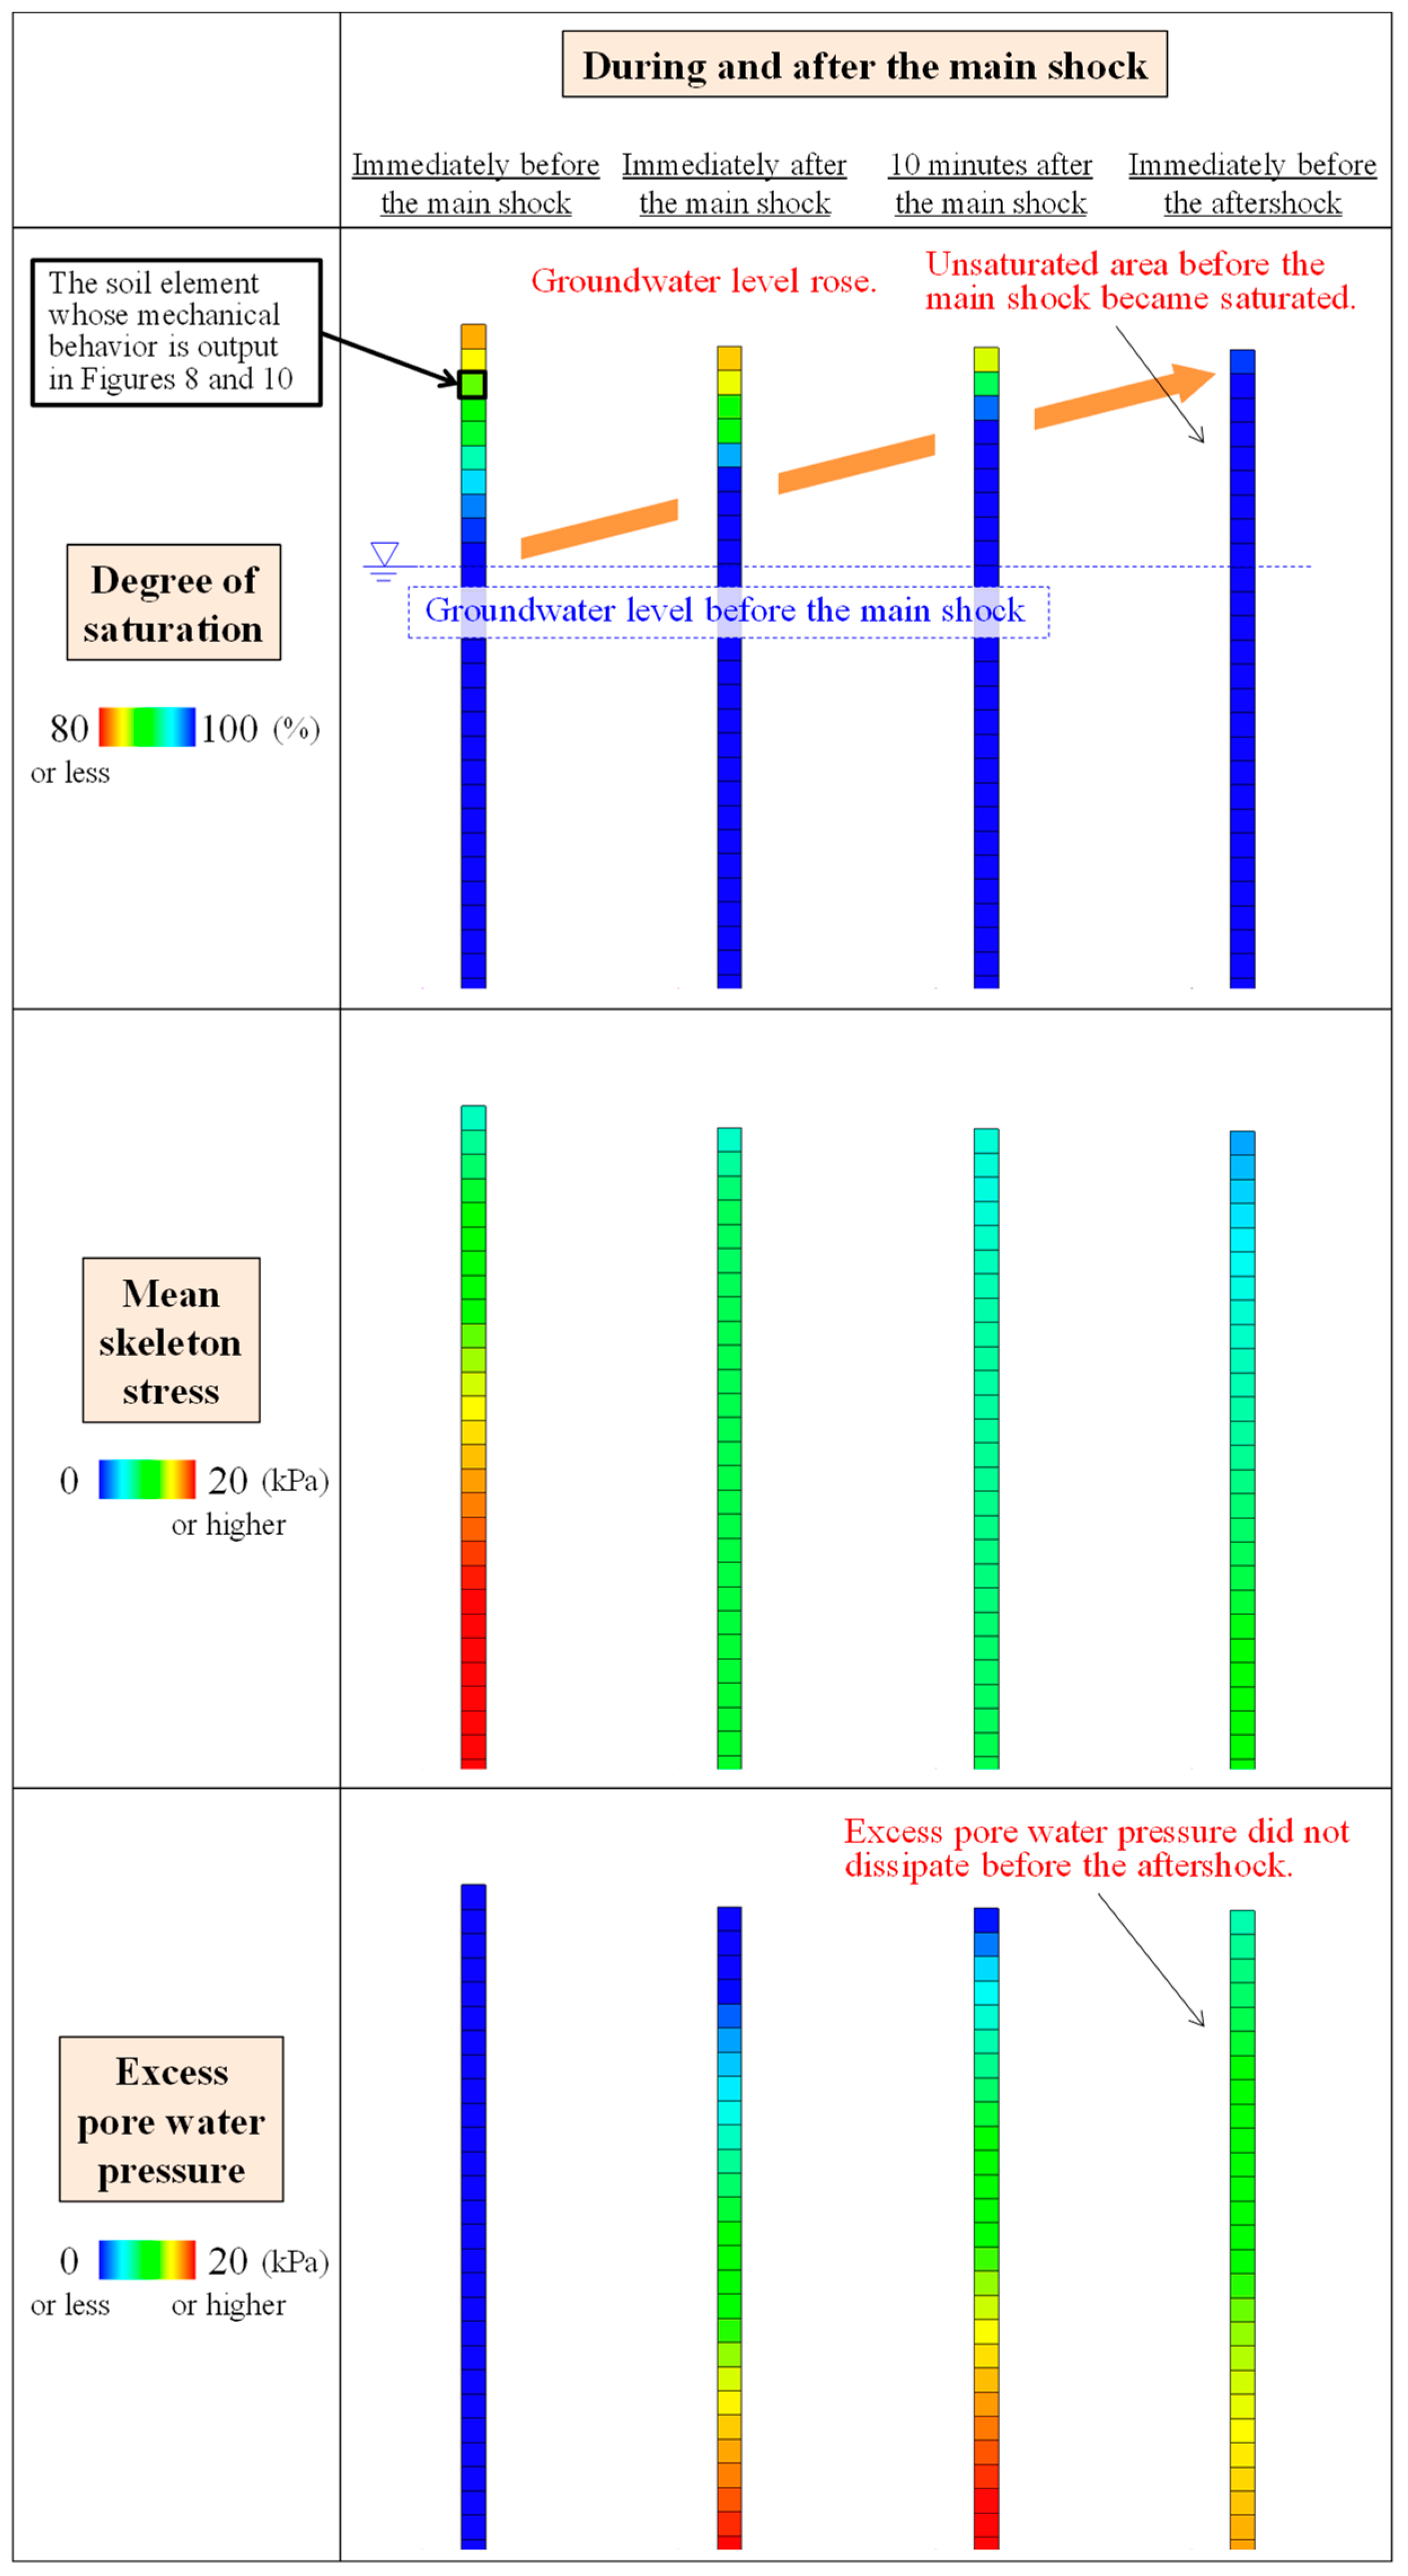
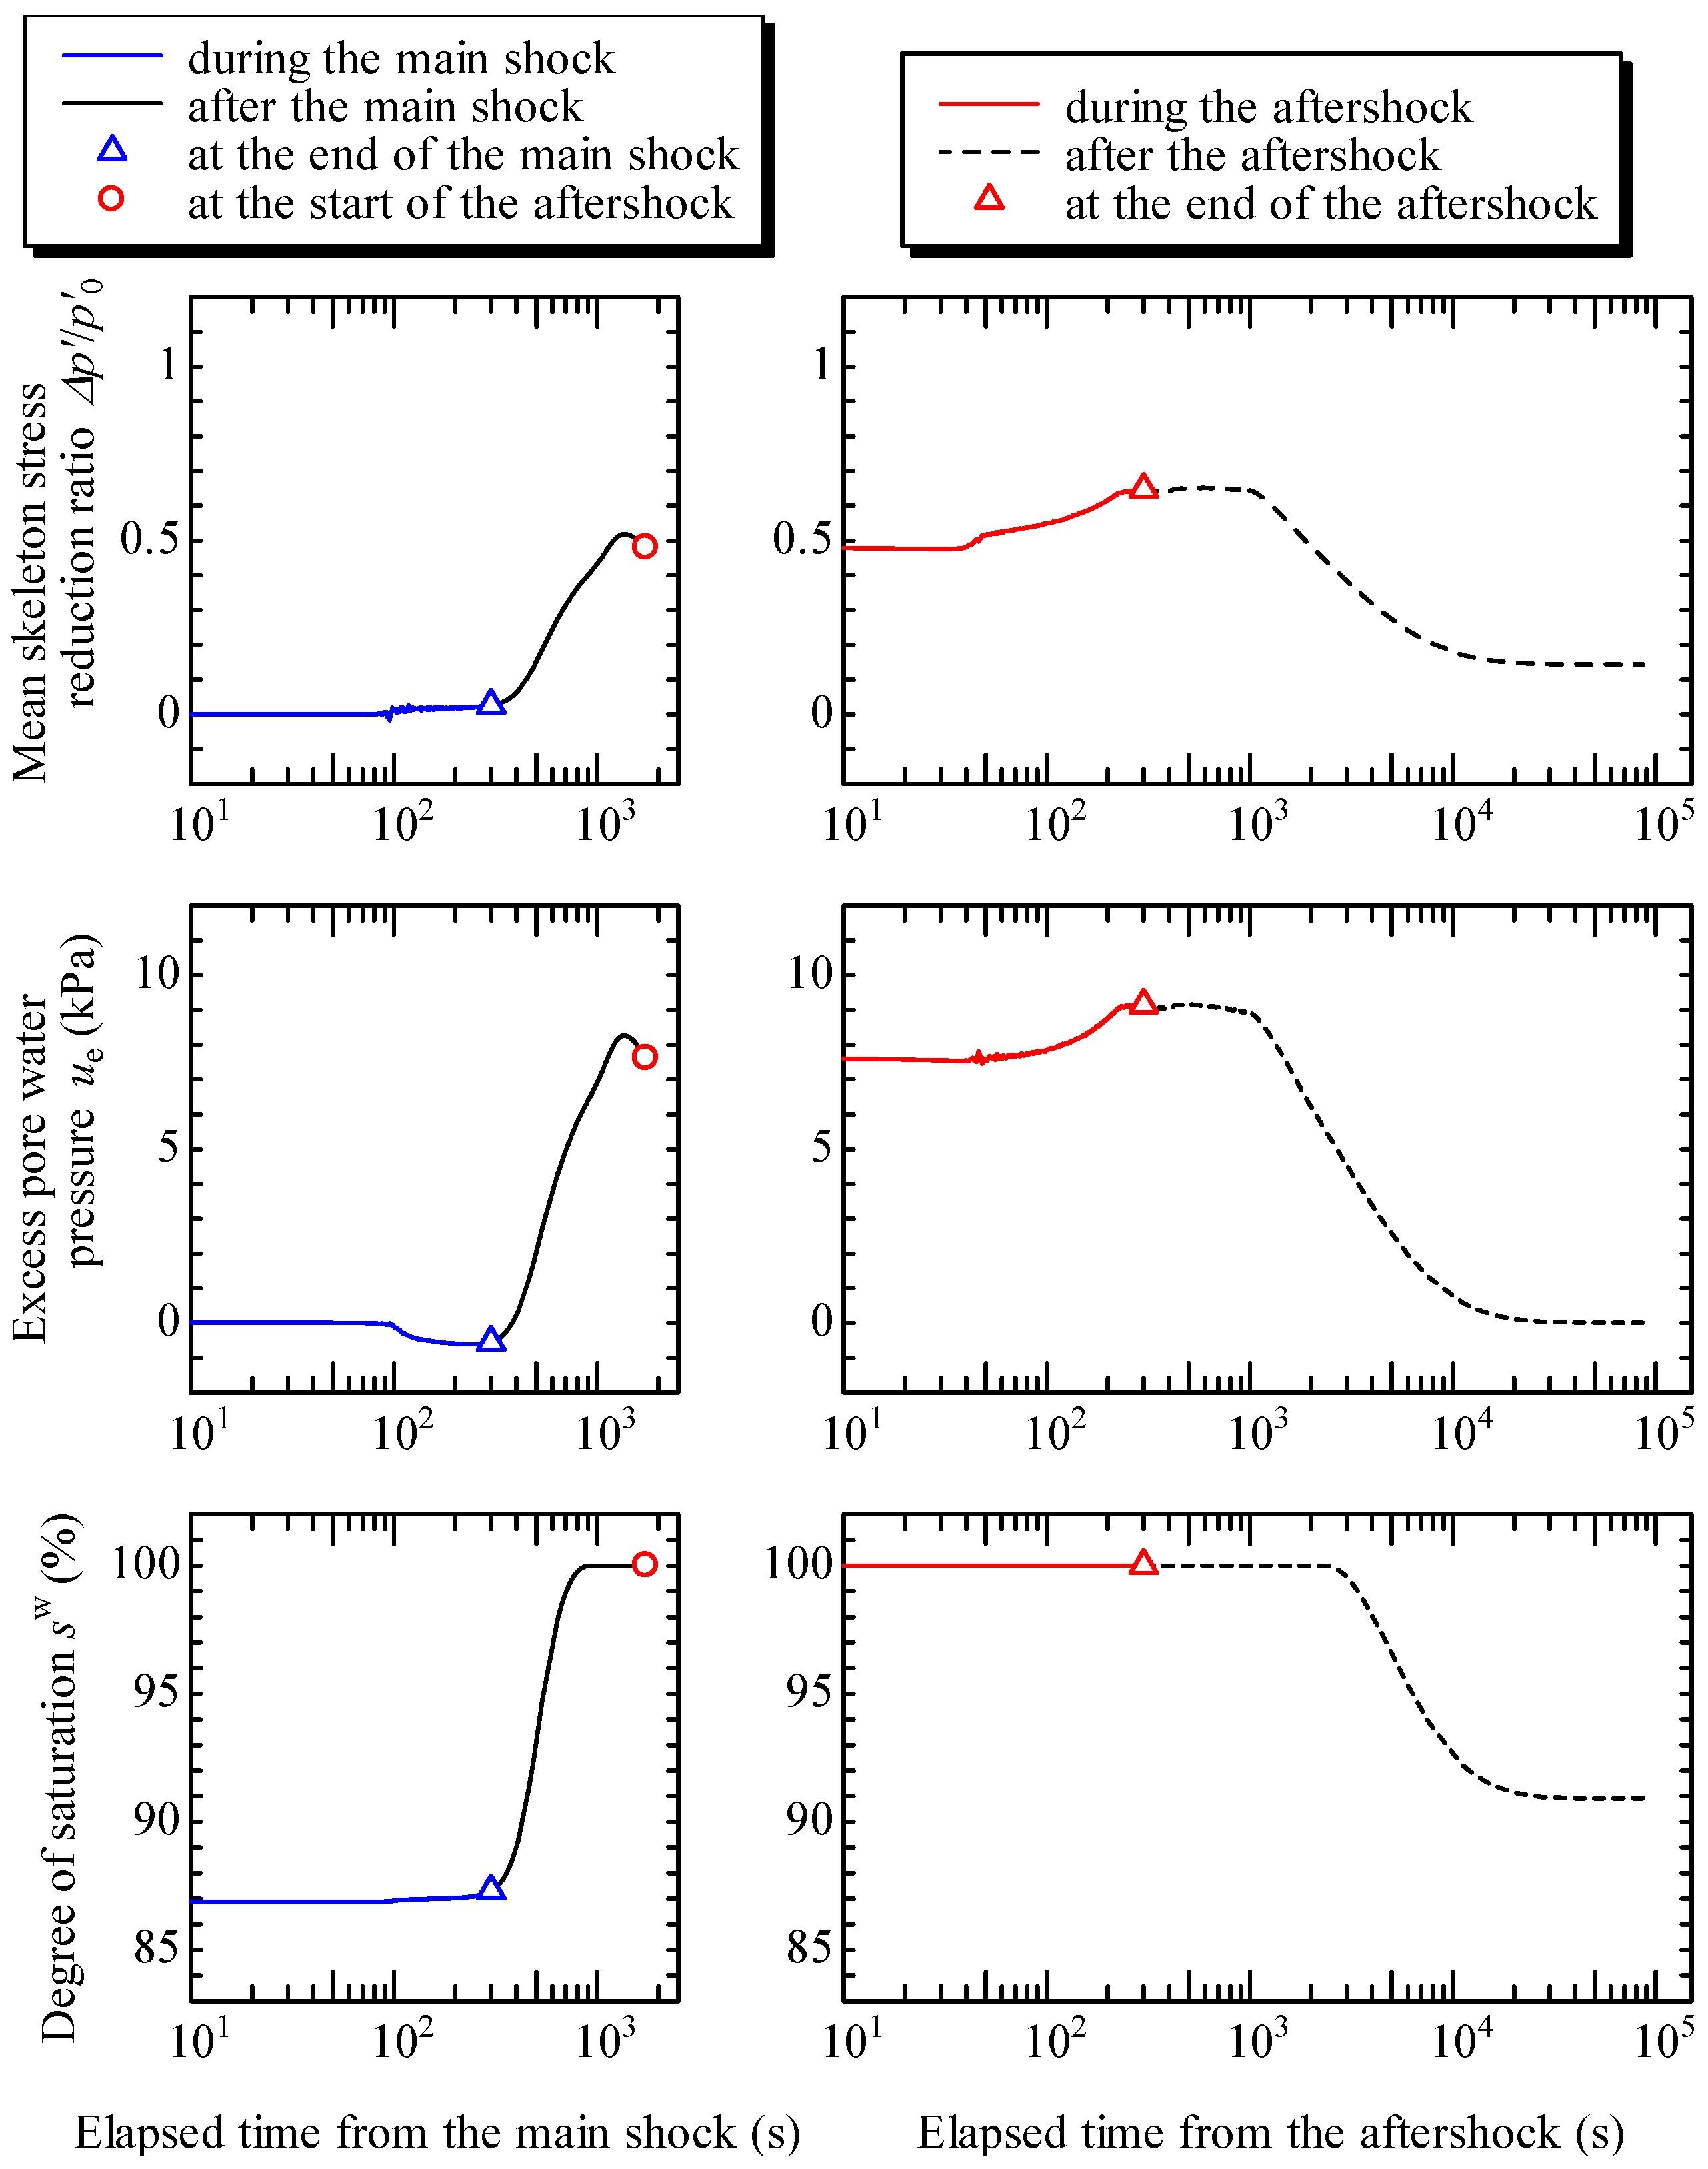
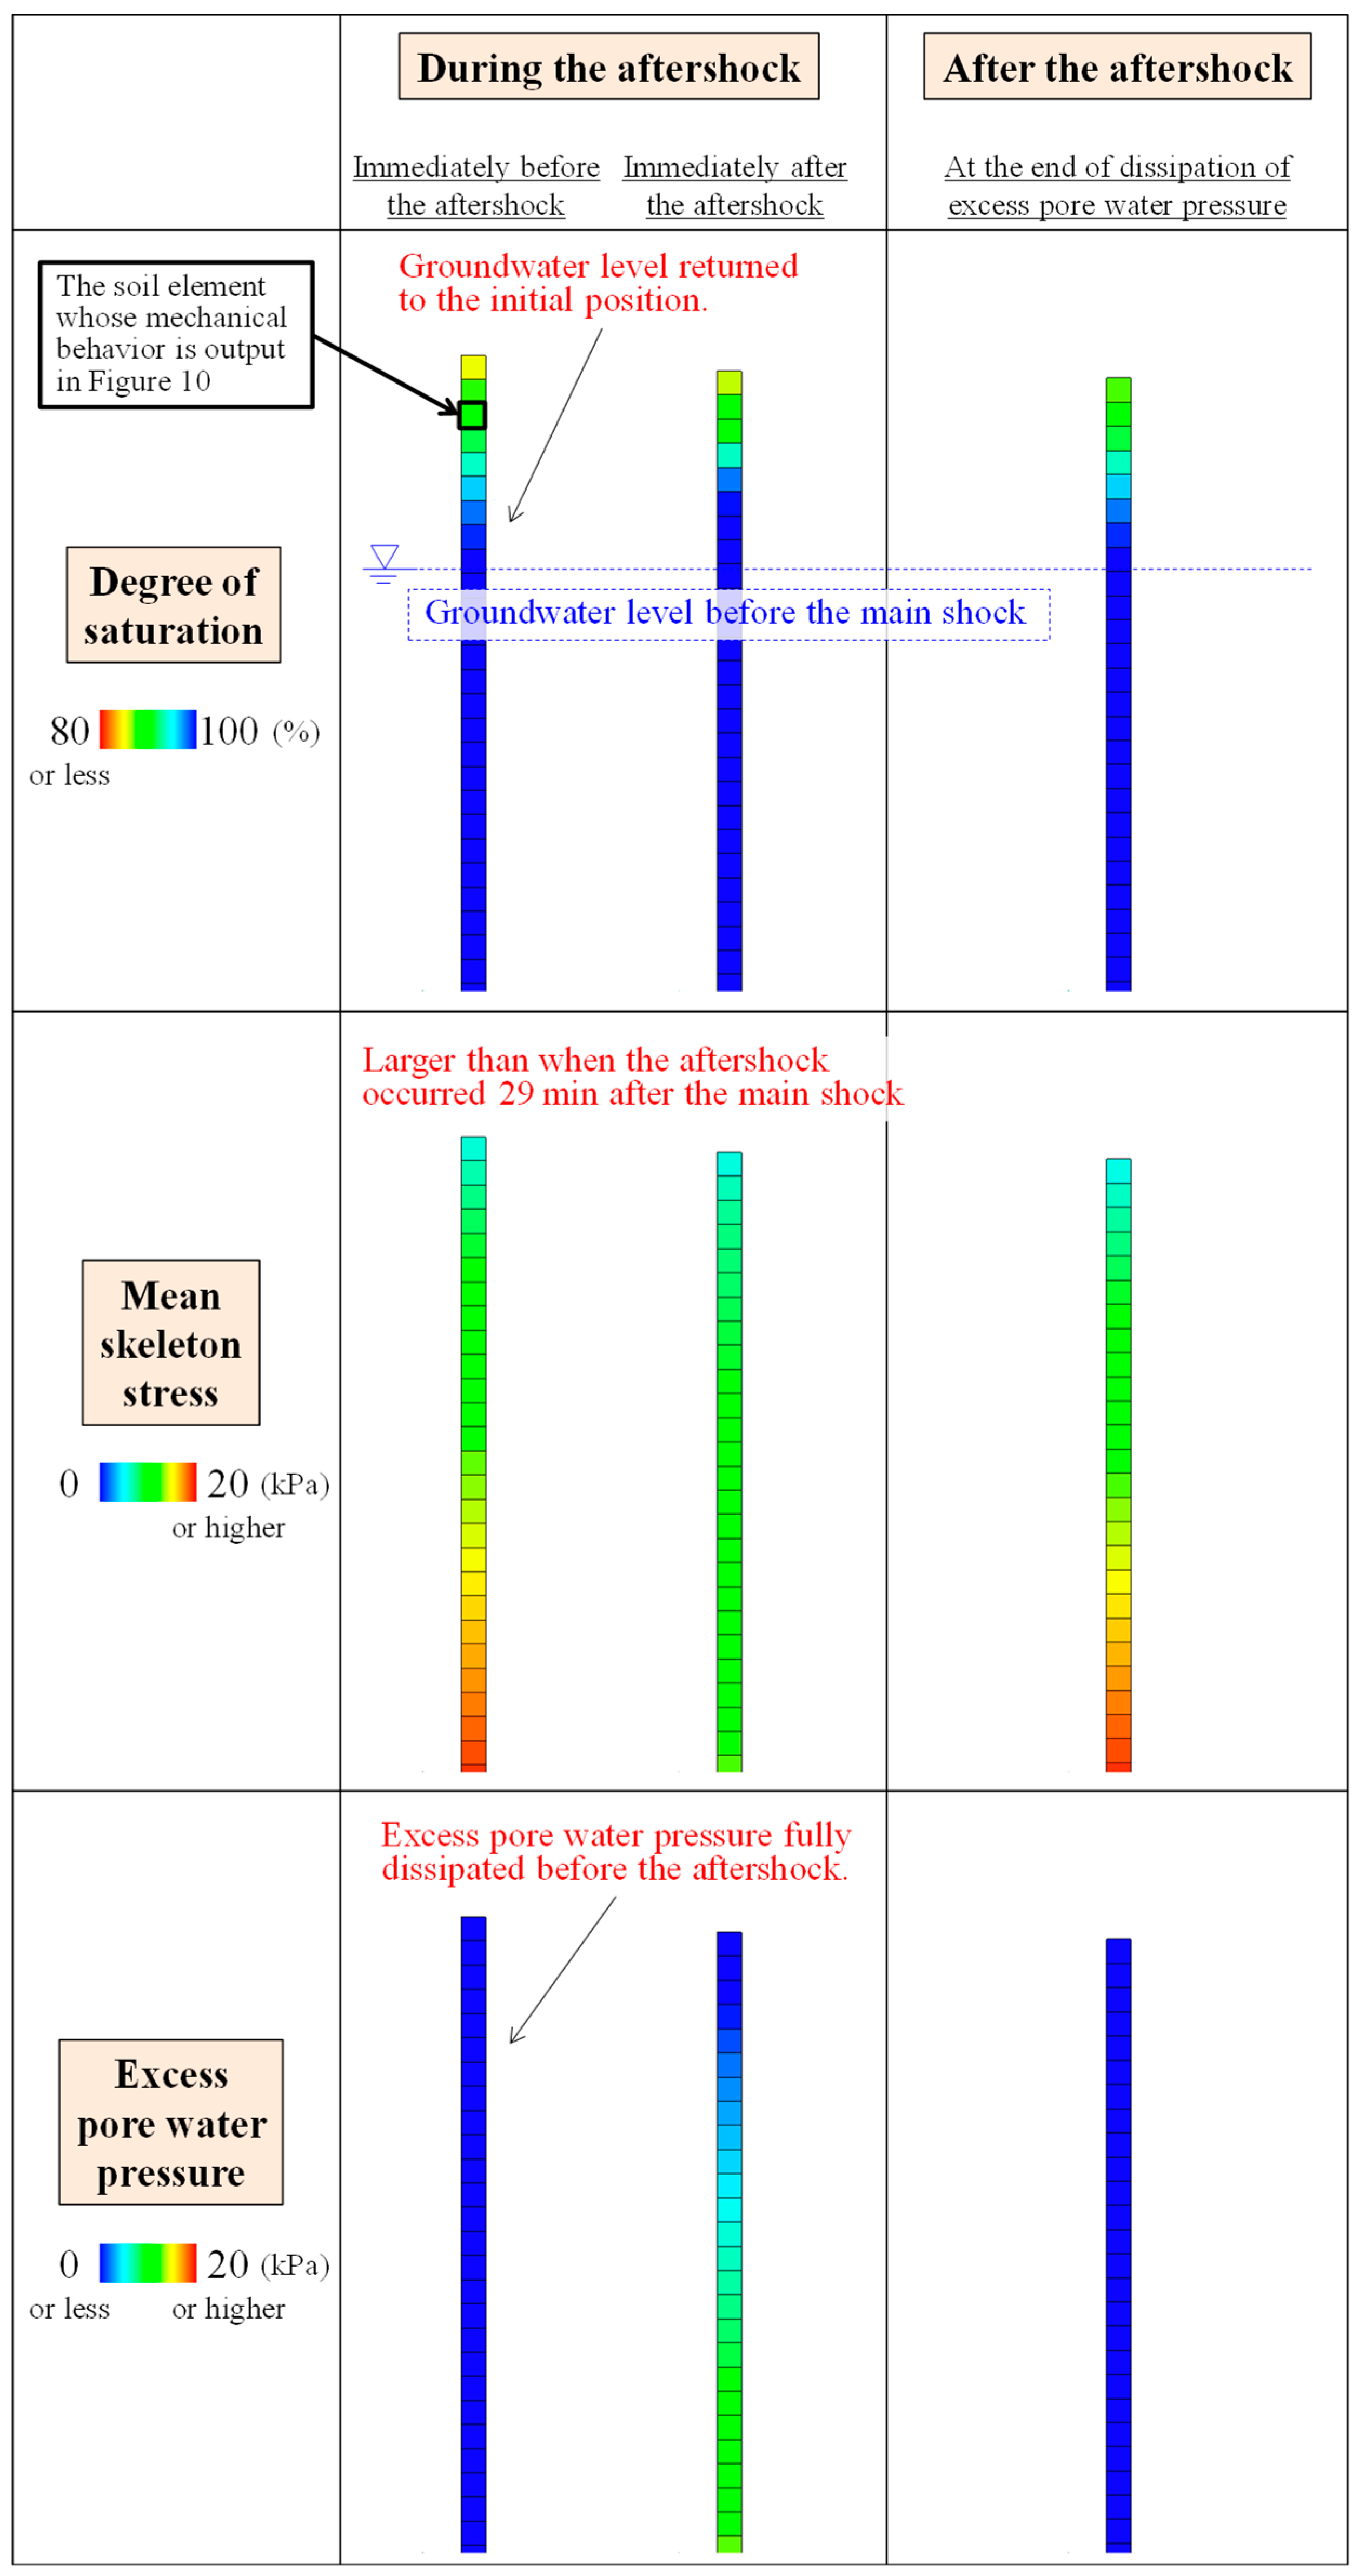
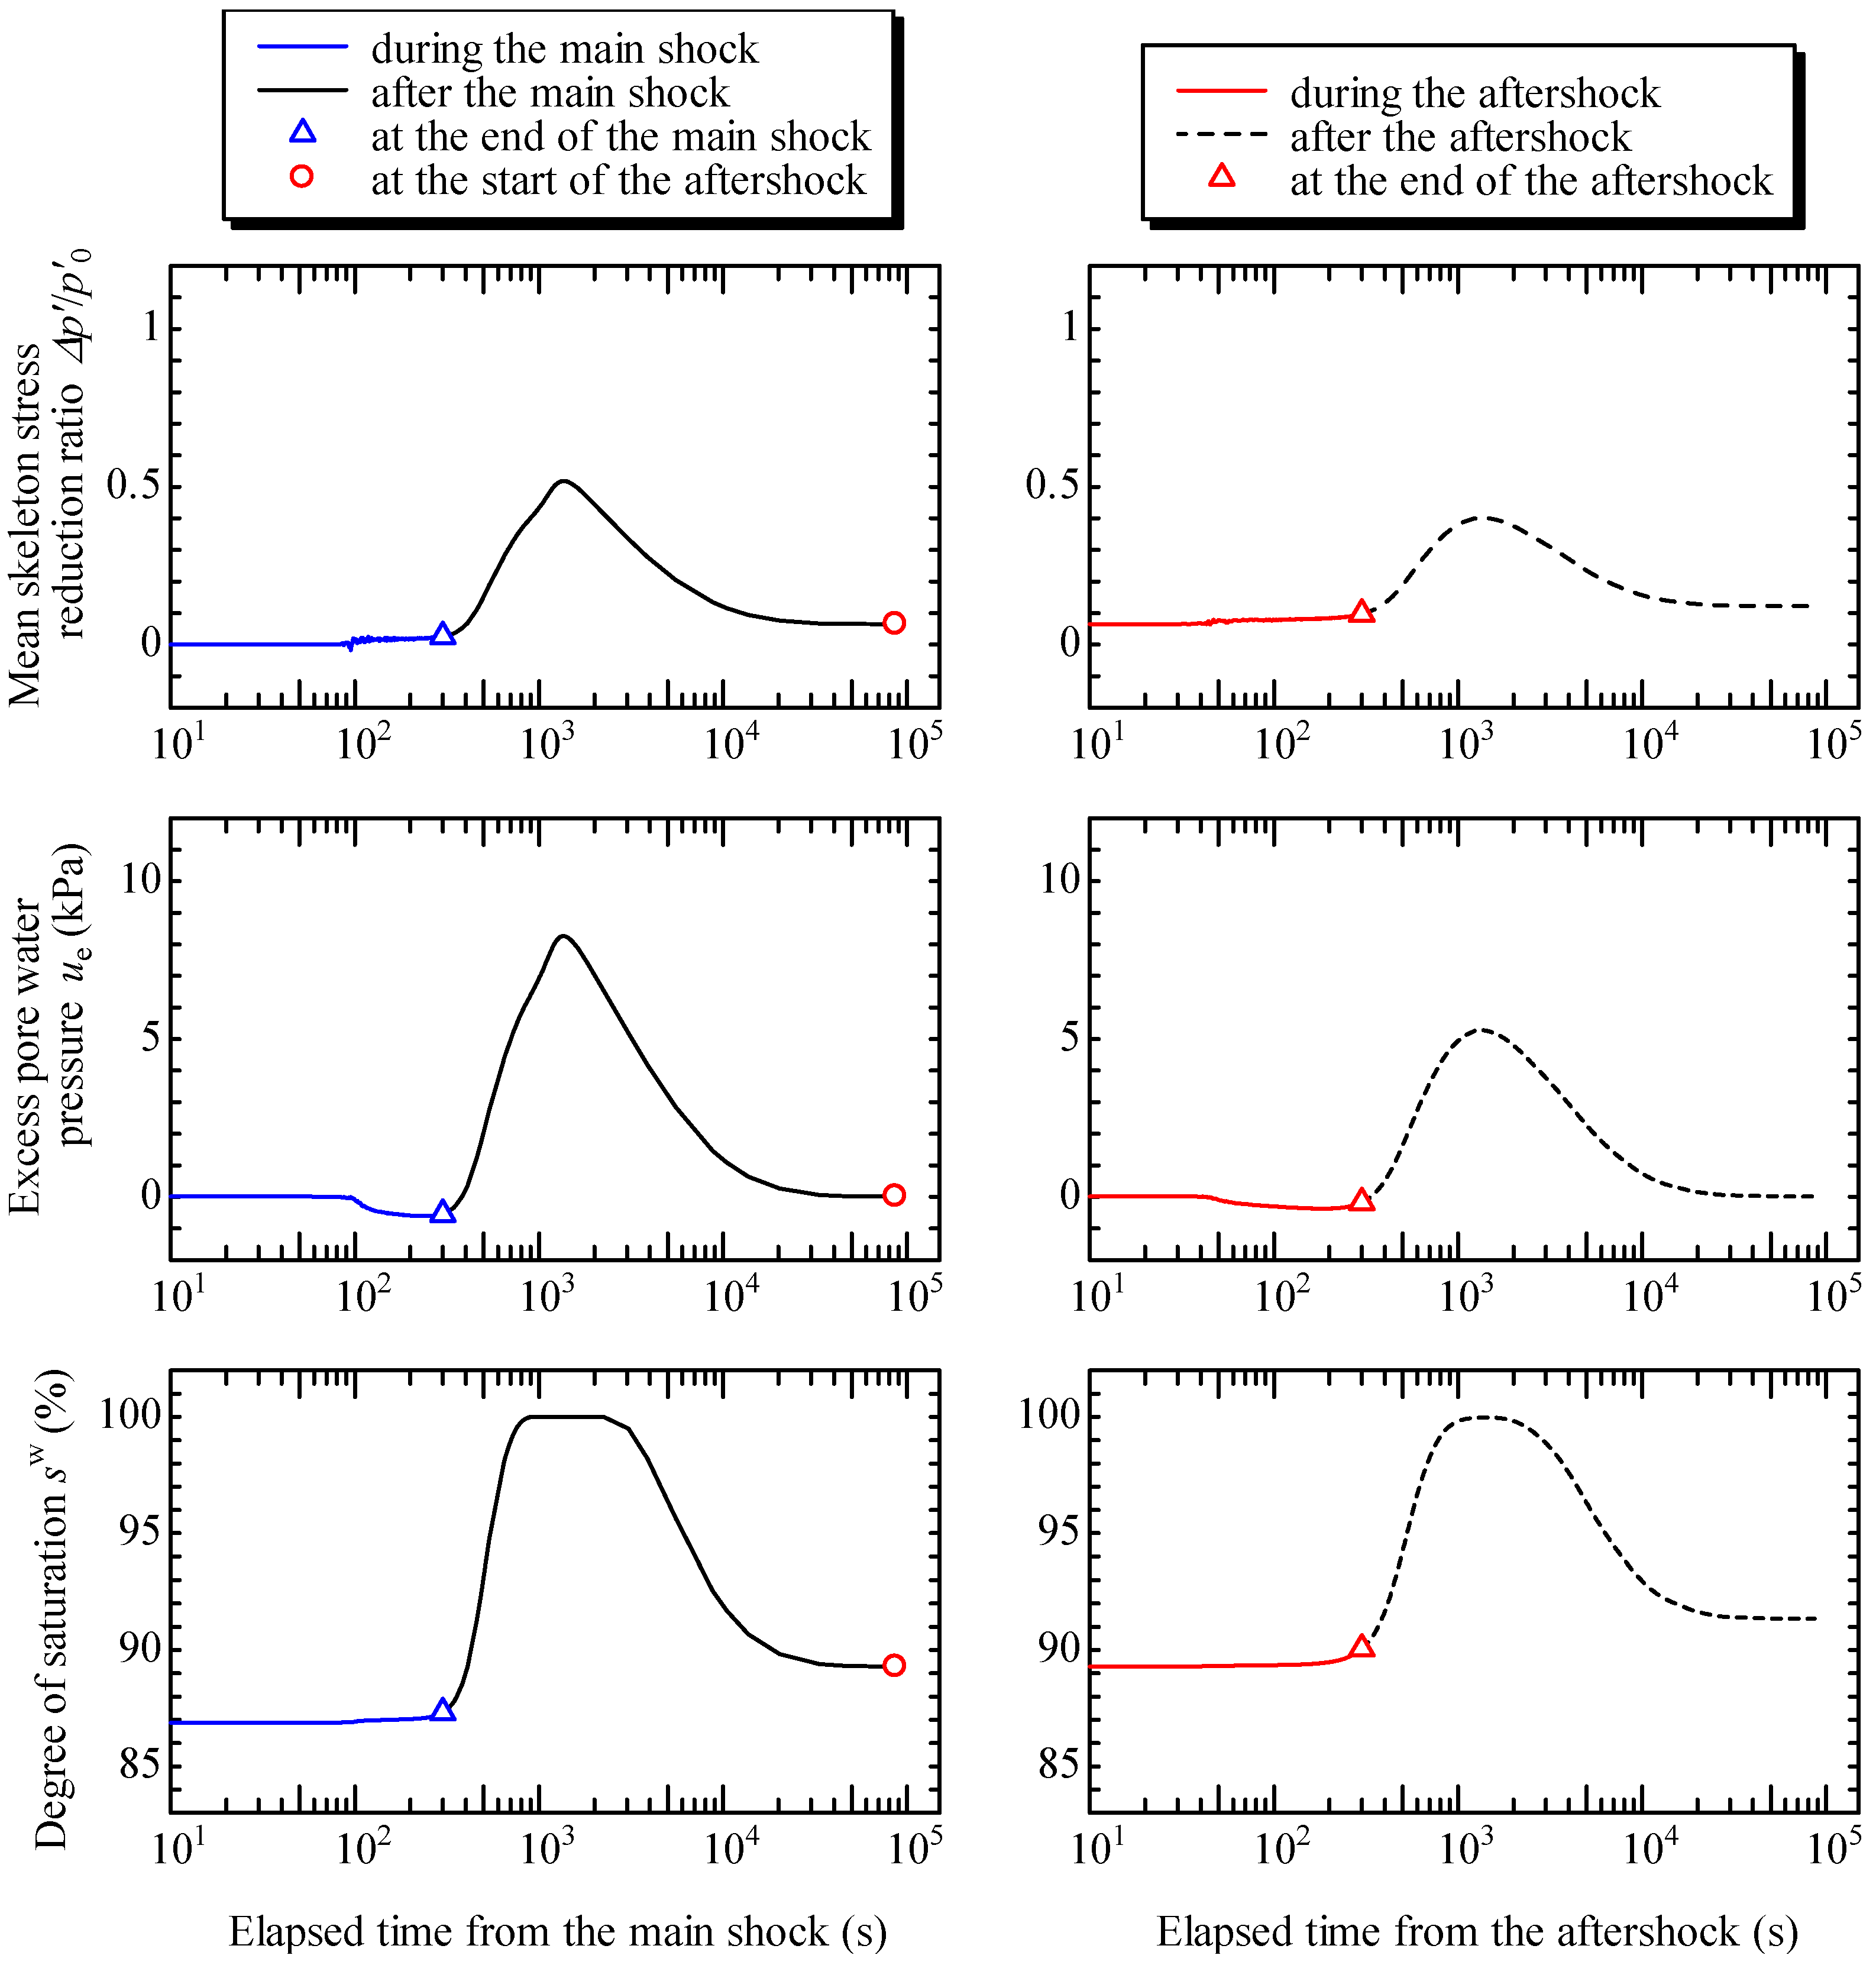
  • In the saturated sand layer below the groundwater level, seismic external forces caused positive excess pore water pressure accompanied by negative dilatancy (plastic volume compression) due to seismic cyclic shear without immediate drainage.
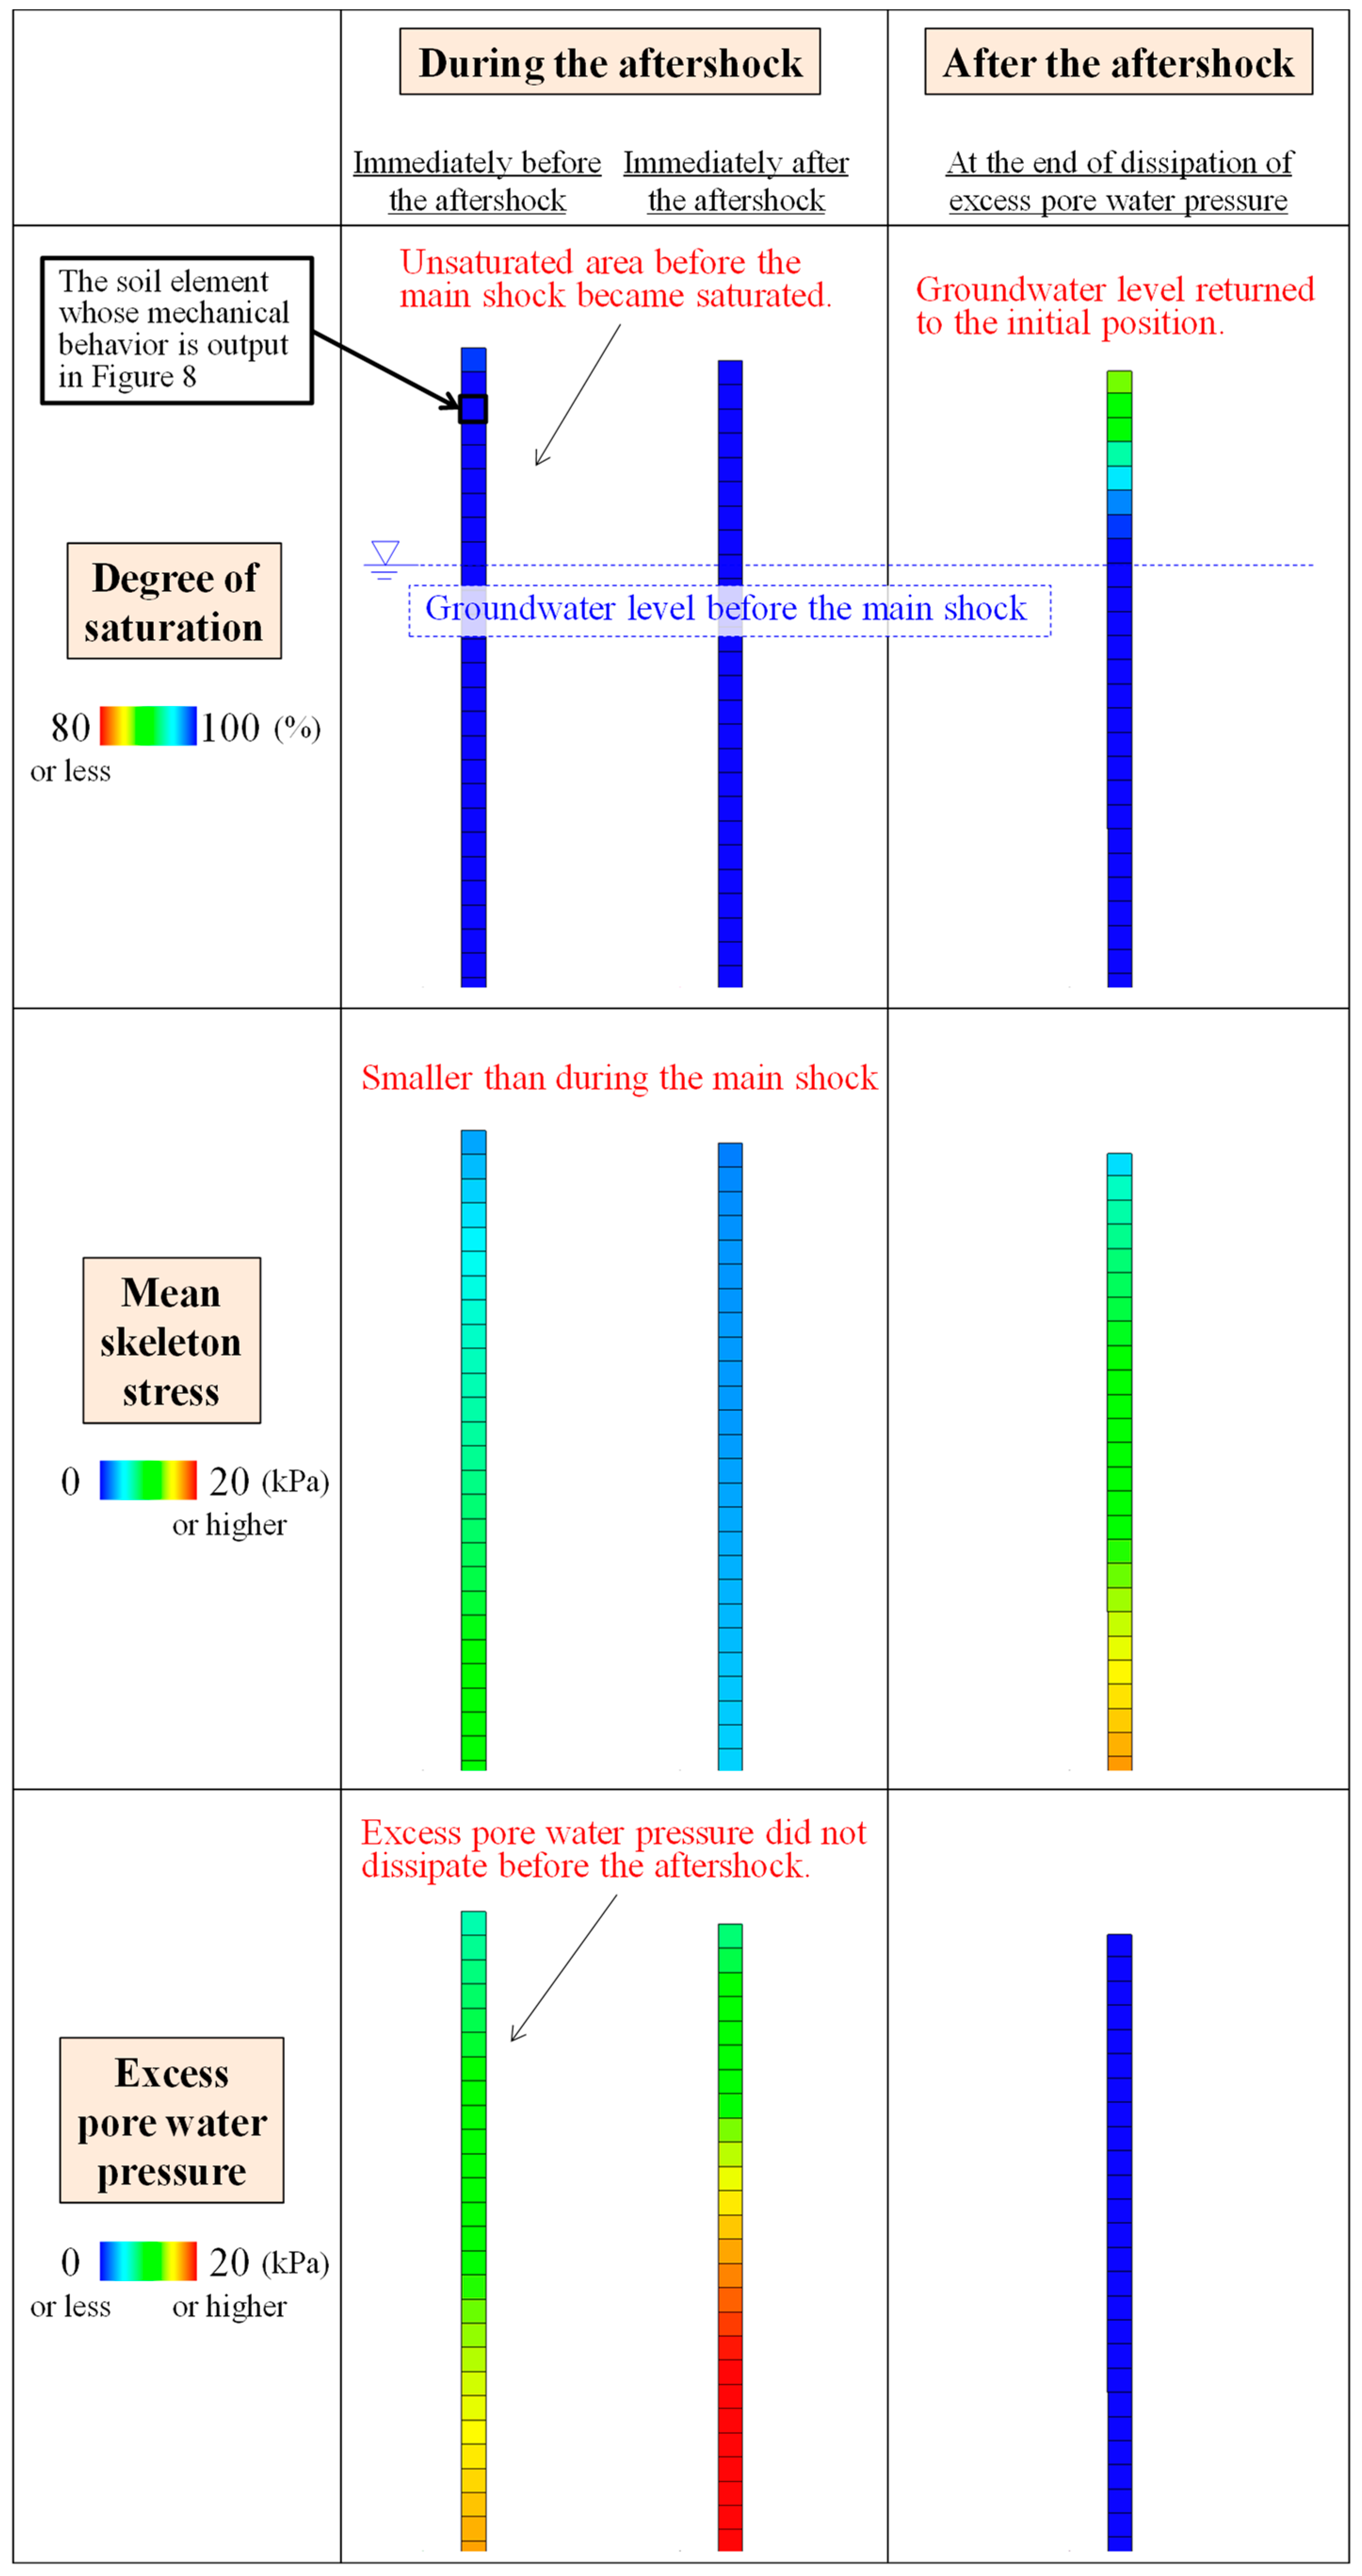
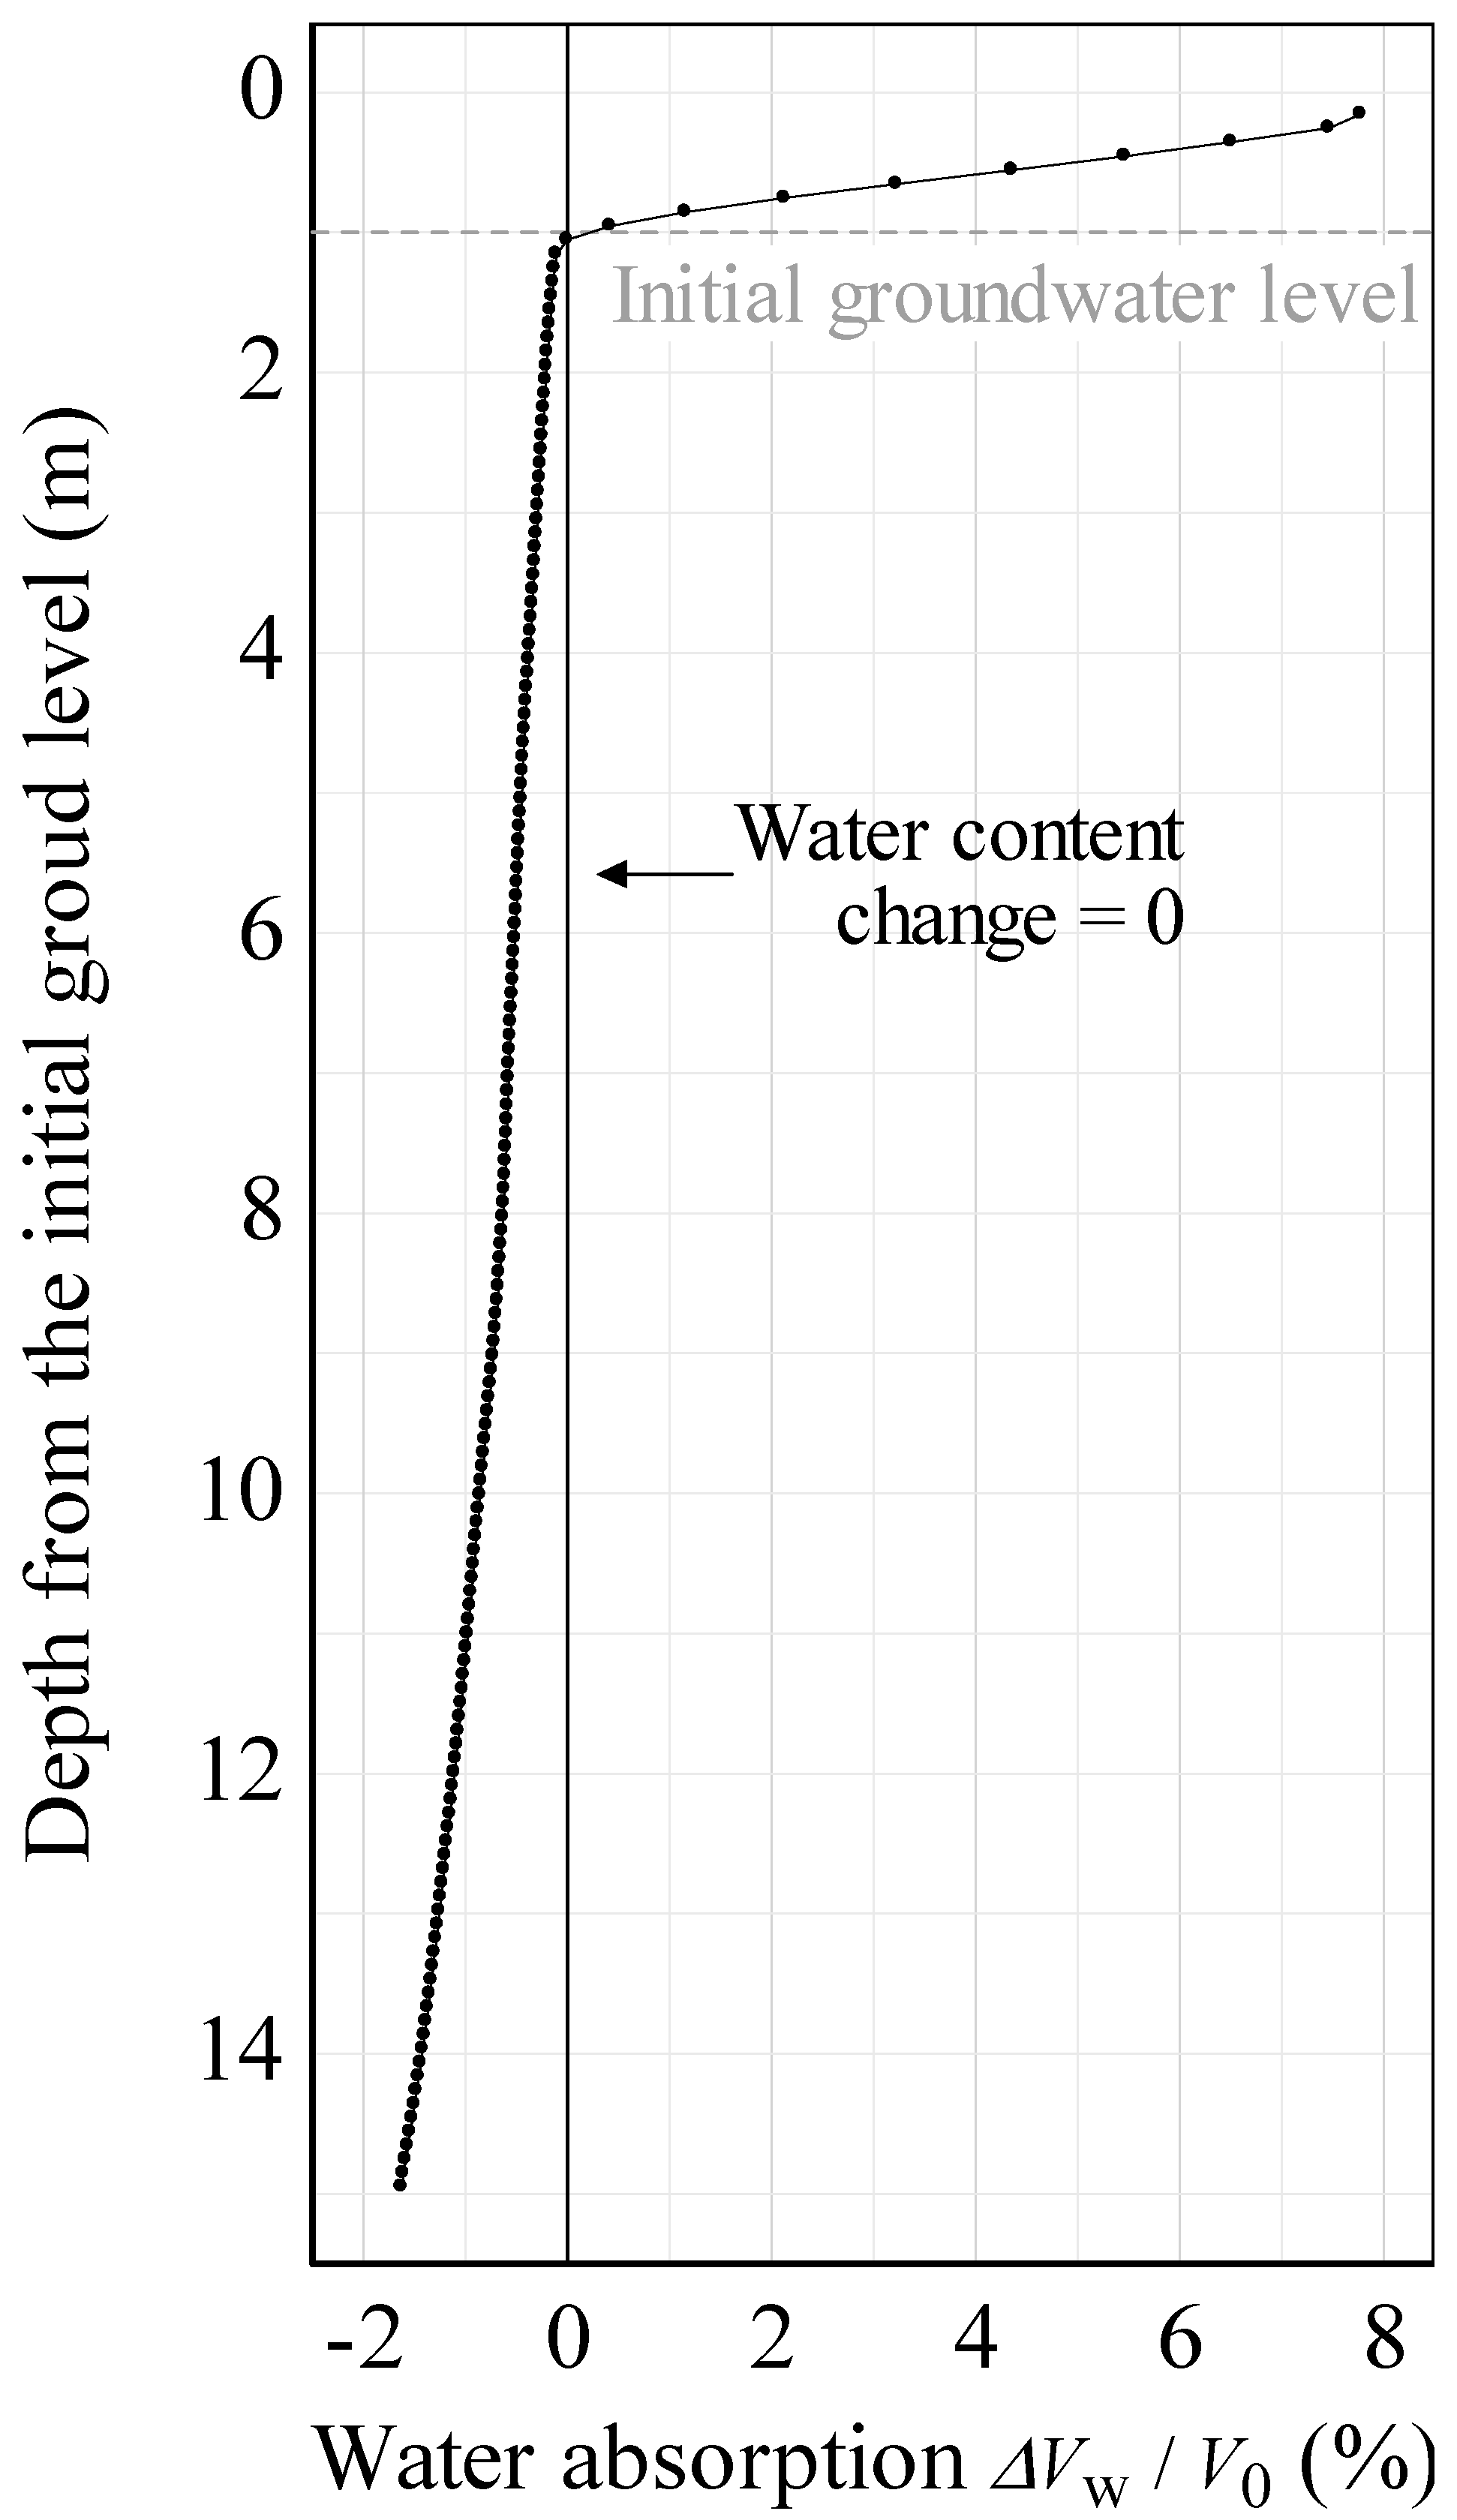
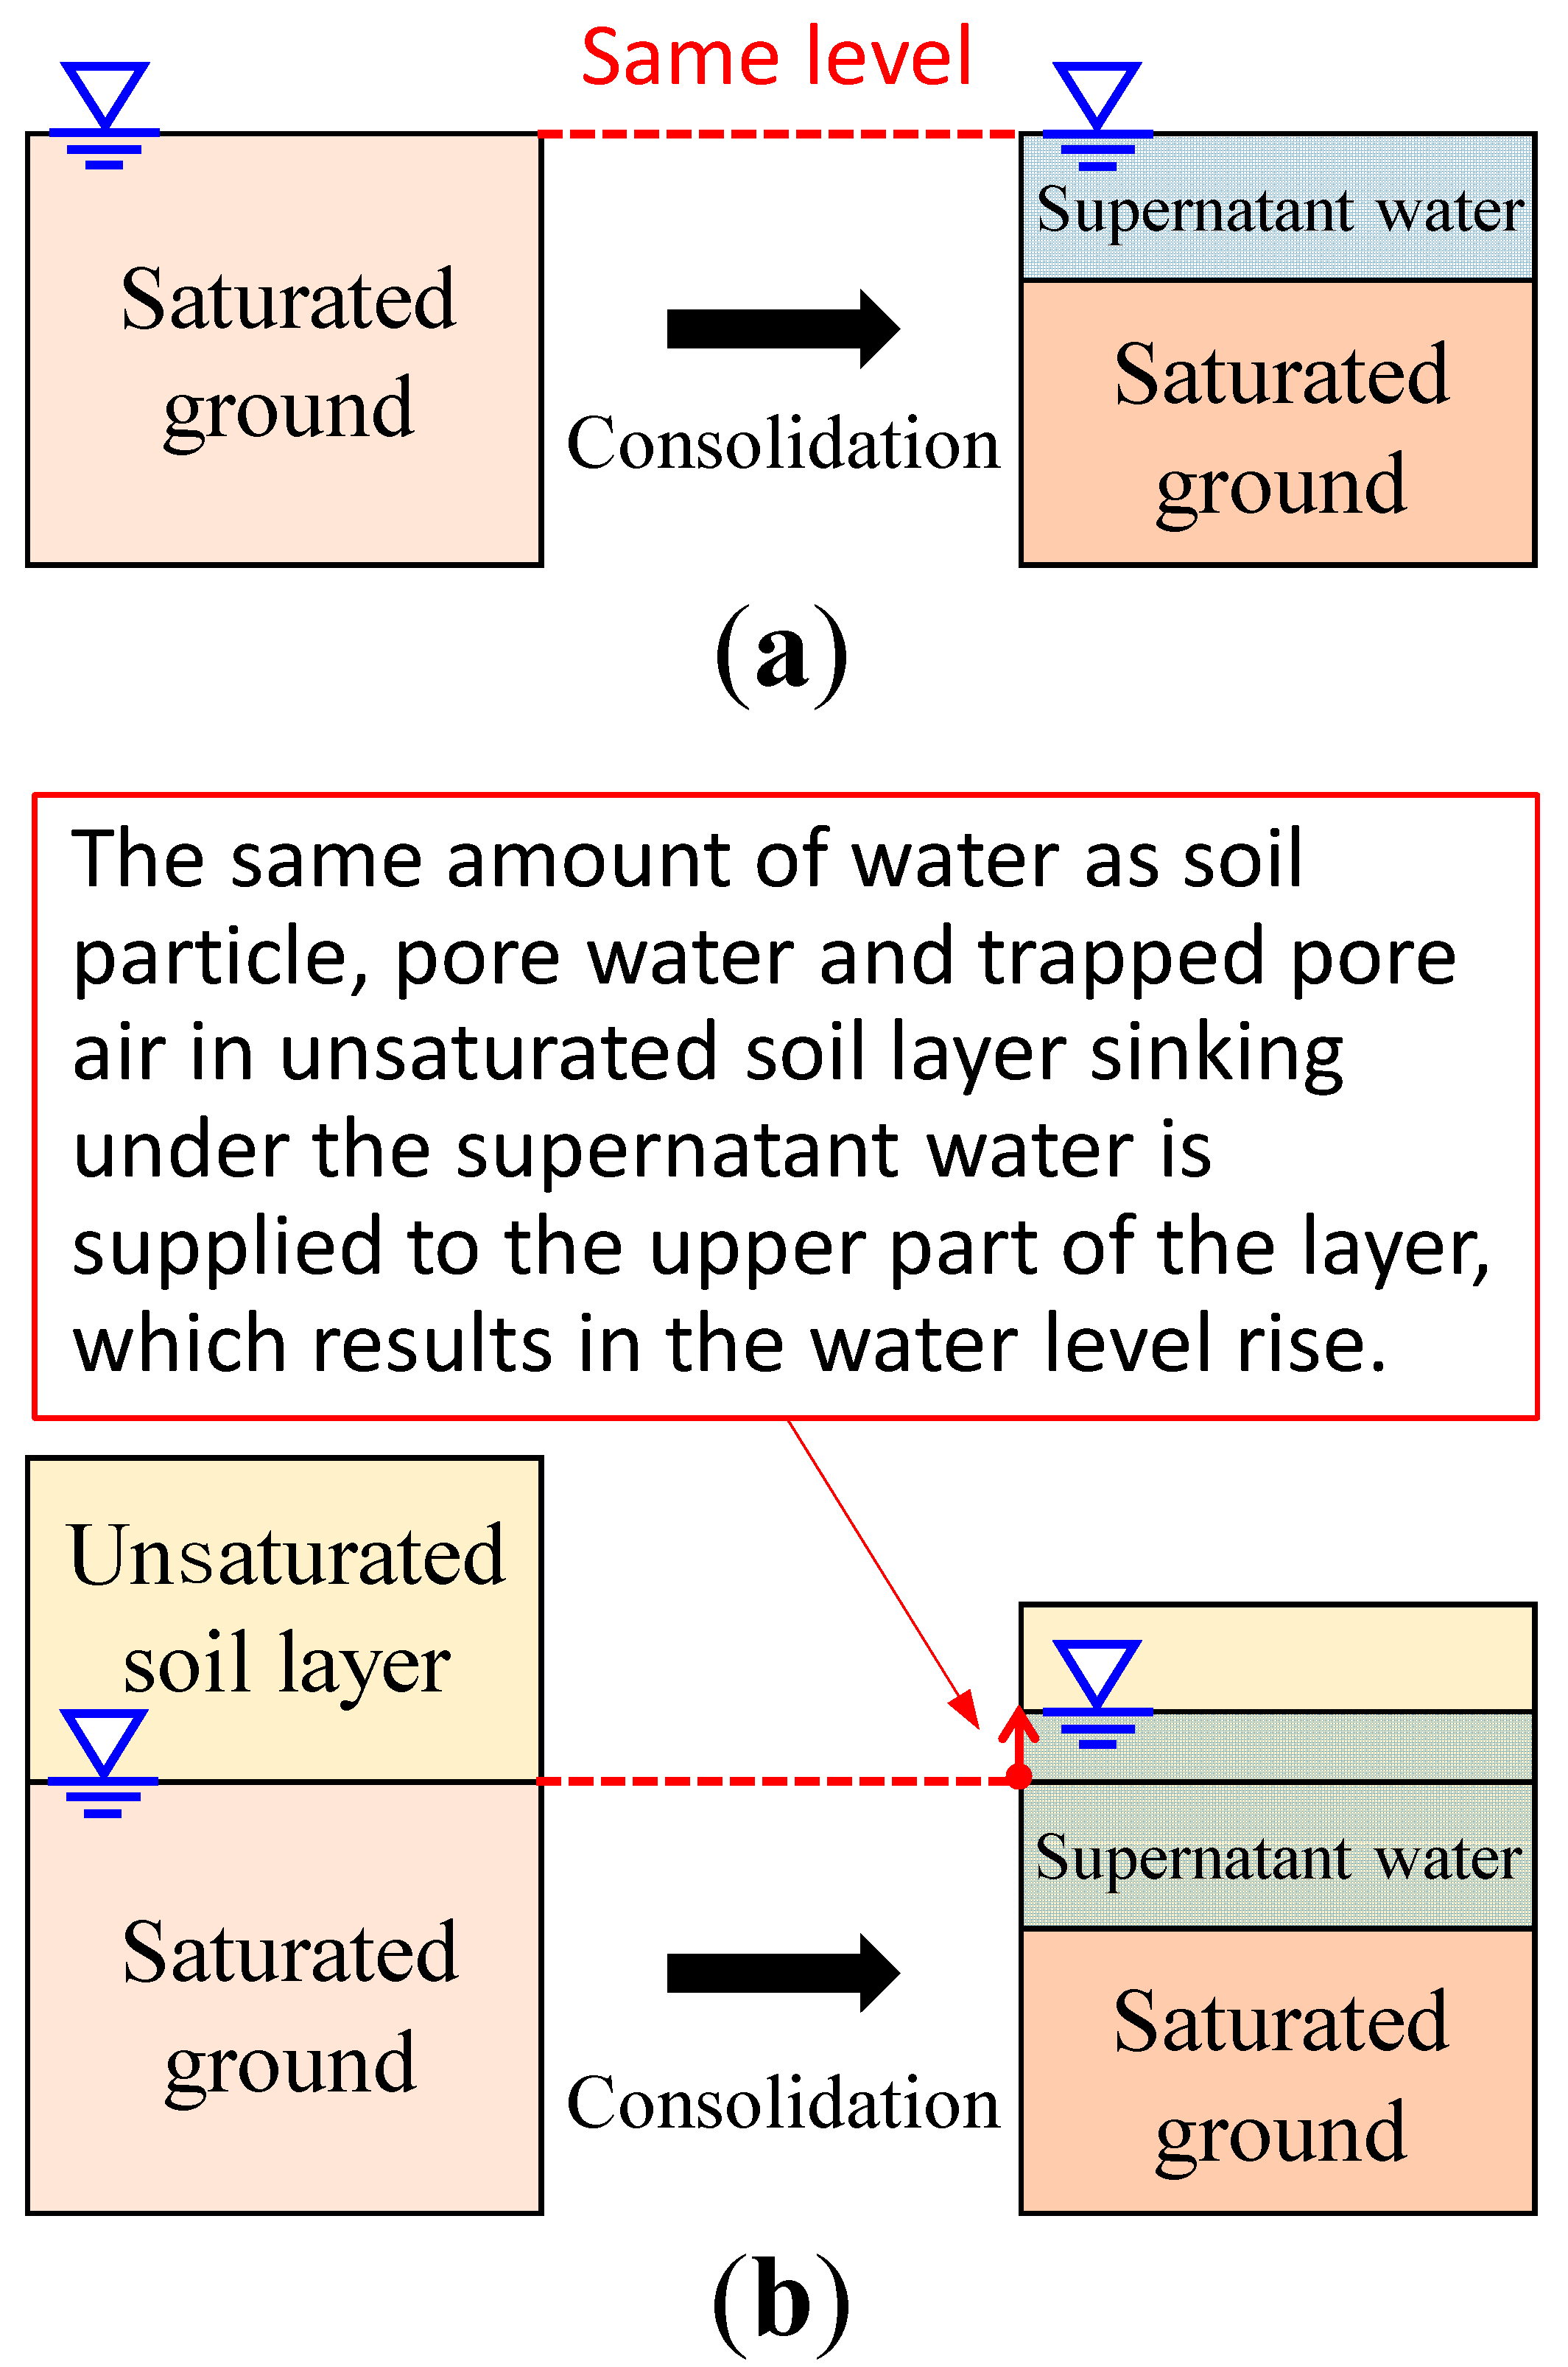
  • The main shock leads to consolidation drainage between the main shock and aftershock, supplying water from the saturated sand layer to the unsaturated sand layer above the groundwater level. In other words, the groundwater level rises between the main shock and aftershock, expanding the saturated area.
  • Aftershock increases the possibility of liquefaction in the expanded saturated area.
In addition, we conducted case studies on the mechanism of groundwater level rise and demonstrated that the smaller the void ratio of the unsaturated soil layer, the higher the groundwater level rises, when the amount of consolidation drainage (plastic volume compression) of the saturated soil layer is the same.
The case presented in this paper is the simplest one-dimensional analysis wherein deformation and water absorption/drainage occur only in the vertical direction. However, as discussed above, this groundwater level rise phenomenon during/after an earthquake results from plastic volume compression, which cannot be expressed by an elastic analysis. Furthermore, it is necessary to precisely calculate ground settlement and water absorption/drainage to accurately estimate the groundwater-level change. Therefore, it should be noted that the analytical results shown in this paper can only be obtained using “three-phase coupled elastoplastic finite deformation” analysis.
This study provides insight into the mechanism of ground liquefaction during a series of earthquakes. In the future, we will consider the effect of initial groundwater level, stress-induced anisotropy, and multidimensionality on the liquefaction damage such as settlement, horizontal displacement, tilt of house, and so on.

Author Contributions

Conceptualization, T.Y. and T.N.; methodology, T.Y. and T.N.; software, T.Y. and T.N.; validation, T.N.; formal analysis, T.Y.; investigation, T.Y. and T.N.; resources, T.Y. and T.N.; data curation, T.Y.; writing—original draft preparation, T.Y.; writing—review and editing, T.N.; visualization, T.Y.; supervision, T.N.; project administration, T.N.; funding acquisition, T.N. All authors have read and agreed to the published version of the manuscript.

Funding

This work was supported by JSPS KAKENHI, grant numbers JP25249064 and JP17H01289.

Data Availability Statement

The datasets generated during and/or analyzed during the current study are available from the corresponding author on reasonable request.

Conflicts of Interest

The authors declare no conflicts of interest.

Appendix A. Outline of the Analysis Method

The analysis code is based on u-pw-pa formulation. For the spatial discretization of the soil skeleton, the finite element method is employed, while for the pore water and air, extensions of the physical model of Christian [31] and Tamura [32] are used [21]. For temporal discretization, a method compliant with Wilson’s θ method [33] has been adopted [21]. Details of the method are described in Noda and Yoshikawa [11] and are omitted in this paper, which is centered on the governing equations.
Equations (A1)–(A3) constitute the equation of motion, the soil skeleton–water coupled equation, and the soil skeleton–air coupled equation, respectively:
ρ D s v s = div   T + ρ b
s w div   v s + 1 ρ w div ρ w k w γ w grad p w + ρ w b ρ w D s v s + n D s s w + n s w K w D s p w = 0
s a div   v s + 1 ρ a div ρ a k a γ w grad p a + ρ a b ρ a D s v s + n D s s a + n s a ρ a R ̄ Θ D s p a = 0
where D s is an operator expressing the material time derivative viewed from the soil skeleton, v s and D s v s are the soil skeleton’s velocity vector and acceleration vector, respectively, T is the Cauchy total stress tensor (tension: positive), b is the body force vector per unit mass, p w is the pore water pressure (compression: positive), p a is the pore air pressure (compression: positive), s w is the degree of saturation ( s a = 1 s w ), n is the porosity, ρ indicates the density of the soil as a whole, ρ w and ρ a indicate the densities of the water and the air, respectively, γ w is the unit weight of water, k w is the coefficient of water permeability, k a is the coefficient of air permeability, K w denotes the bulk modulus of water, R ̄ is the gas constant of air, and Θ is the absolute temperature. It is assumed that air obeys the equation of state of ideal gas. It is further assumed that (i) the soil particles are incompressible, (ii) there is no variation in the temperature, and (iii) there is no mass exchange between the phases.
In the analysis method followed here, the term denoting the temporal variation in the degree of saturation s w is replaced by terms denoting the temporal variation in suction and specific moisture capacity using the van Genuchten equation [25], as shown in Equations (A4)–(A6).
S e = 1 + ( α p s ) n m
S e = s w s m i n w s m a x w s m i n w
D s s w = s m a x w s m i n w n 1 α ( α p s ) n 1 1 + ( α p s ) n m 1 D s p s
In these equations, S e is the effective degree of saturation, p s is the suction ( p s = p a p w ) , s m a x w is the maximum degree of saturation, s m i n w is the minimum degree of saturation, and α , m , and n are parameters of the van Genuchten equation having the relationship m = 1 1 / n .
The equations of water permeability k w and air permeability k a , derived by applying the van Genuchten equation to the Mualem model [26], are shown next:
k w = k s w S e 1 2 1 1 S e 1 m m 2
k a = k d a 1 S e 1 2 1 S e 1 m 2 m
where k s w is the saturated coefficient of water permeability and k d a is the dry coefficient of air permeability.
The skeleton stress equation [24] is used in the constitutive model for the soil skeleton, as expressed in Equation (A9).
T = T ( s w p w + s a p a ) I
Here, T is the skeleton stress tensor (tension: positive) and I is the identity tensor. The SYS Cam-clay model [12] is used as the constitutive equation of the soil skeleton, which is briefly explained in Appendix B.
The solution for the initial and boundary value problem is obtained by solving a total of five equations, i.e., the three equations in Equation (A1) along with Equations (A2) and (A3), including Equation (A6) for five unknowns, i.e., the three displacement components of the soil skeleton, the pore water pressure p w , and the pore air pressure p a .

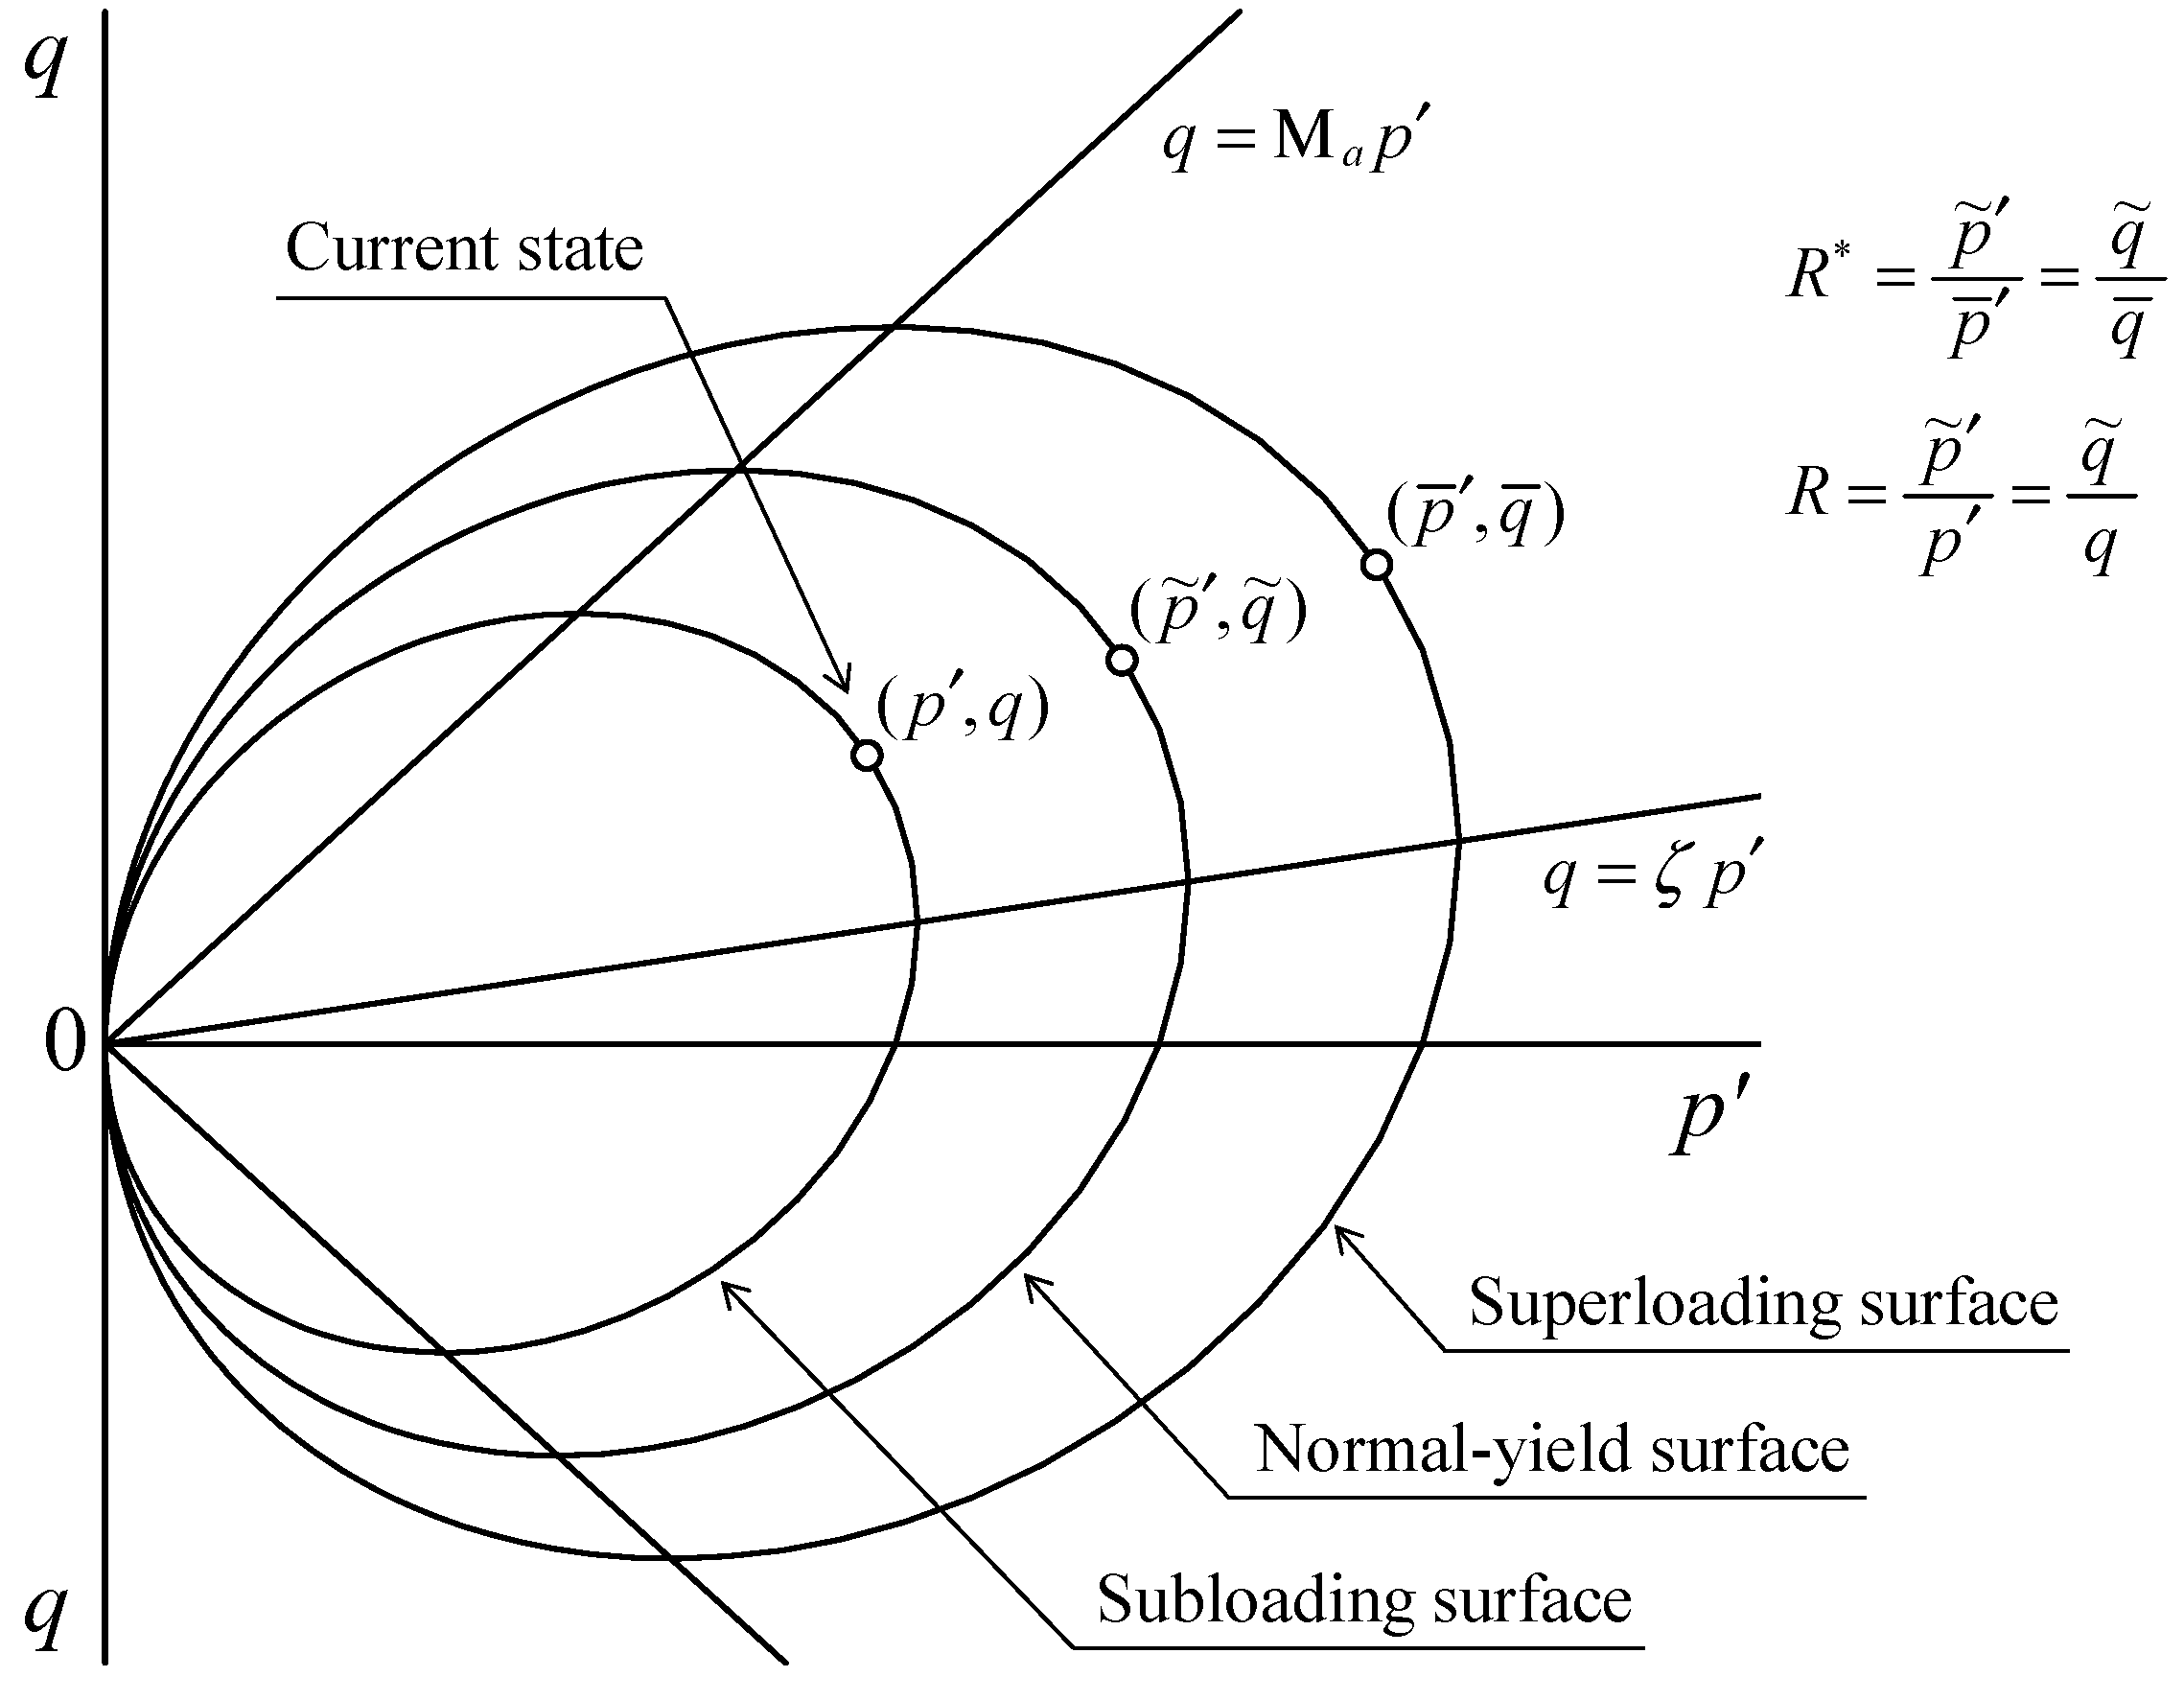
Appendix B. The Super/Subloading Yield Surface (SYS) Cam-Clay Model

Appendix B.1. Quantified Expression of Structure, Overconsolidation, Anisotropy, and Their Respective Evolution Rules

Naturally deposited soils, whether clayey or sandy, generally exist in a ‘structured’ and overconsolidated state. To describe the deformation behavior of a soil in this state, we have to start from the base of an elasto-plastic model of a de-structured soil in a state of normal consolidation. Given that a soil in this unstructured and normally consolidated state still possesses anisotropy, we take for our ‘base’ in this paper the Modified Cam-clay model [34] introducing the rotational hardening concept of Sekiguchi and Ohta [35], which treats stress parameter η * and its evolution rule as an expression of anisotropy. The degrees of structure and overconsolidation are then introduced and quantified by means of the two concepts of the superloading surface for structure [12,36], and the subloading surface for overconsolidation [37,38]. That is to say, the degree of structure is expressed by means of the superloading surface situated on the outside of the Cam-clay normal-yield surface and similar to it (the center of similarity being the origin p = q = 0 and the similarity rate is given by R * ( 0 < R * 1 )), while the overconsolidated state is expressed by means of a subloading surface situated on the inside of the superloading surface and again is similar to it (center of similarity p = q = 0 , similarity rate R ( 0 < R 1 ); reciprocal 1 / R is the overconsolidation ratio). p here is the mean skeleton stress and q is the deviator stress. Using skeleton stress tensor T (tension: positive), we can say that p = t r T / 3 , q = 3 / 2 S · S , S = T + p I ( I : identity tensor). The closer R * is to 0, the higher the degree of structure, but with the loss of structure that accompanies plastic deformation, R * will approach 1 (evolution rule for R * ). Similarly, the closer R is to 0, the more overconsolidated the state of the soil, but as R increases toward 1 with plastic deformation, the state of the soil will also approach normal consolidation (evolution rule for R ). It can thus be assumed that the decay of structure with plastic deformation brings a simultaneous loss from overconsolidation (a transition to the normally consolidated state), resulting, finally, in conditions that match those in the Cam-clay model. The relative positions of the three loading surfaces, assuming conditions of axial symmetry, are as shown in Figure A1.
If we start from the Modified Cam-clay Equation (A10) below as our base, given that the current skeleton stress exists on the subloading surface, we first need to derive the subloading surface as shown in Equation (A11), to which various elasto-plastic principles such as the associated flow rule and Prager’s consistency condition are applied.
The Cam-clay yield function:
MD ln p ~ p ~ 0 + MD ln M 2 + η * 2 M 2 + 0 t J tr D p d τ = f ( p ~ , η * ) + 0 t J tr D p d τ = 0
The subloading surface function:
f ( p , η * ) + MD ln R * MD ln R + 0 t J tr D p d τ = 0
Here, D = ( λ ~ κ ~ ) / M / ( 1 + e 0 ) is the dilatancy coefficient, and M , λ ~ , κ ~ , and e 0 are the critical state constant, compression index, swelling index, and initial void ratio ( e is the void ratio at time t = t ). p ~ 0 is the mean skeleton stress at the intersection of the normal yield surface and anisotropic axis at the start time of computation. 0 t J tr D p d τ corresponds to the plastic volumetric strain. η * , the expression of anisotropy, is obtained using the rotational hardening variable β , from the calculation η * = 3 / 2 η ^ η ^ , η ^ = η β , η = S / p . β = 0 expresses a state of no anisotropy. Here, the evolution rules for R * , R , and β are given by the following equations.
Evolution rule for R * :
R * ˙ = J U * 1 c s D v p + c s 2 3 D s p       U * = a D R * b 1 R * c ,     D v p = tr D p ,   D s p = D p 1 3 tr D p I
Evolution rule for R :
R ˙ = J U D p       U = m D ln R
Evolution rule for β [39]:
β = J b r D 2 3 D s p η ^ η b       η b = m b η ^ η ^ β
Here, J is determinant of deformation gradient tensor and D p is the plastic stretching tensor. a, b, and c are the degradation parameters of the structure, cs is the parameter that determines the ratio of D v p and D s p which influences the decay of a structure ( 0 c s 1 ), m is the degradation parameter of overconsolidation, br is the evolution parameter of rotational hardening, and mb is the limit of rotational hardening. These are all material constants. ‖ ‖ indicates Euclidean norm, the superscript “・” indicates a time derivative, and the superscript “ ” indicates the Green-Naghdi [40] objective rate.

Appendix B.2. The Associated Flow Rule and the Constitutive Equation

Associated flow rule:
D p = λ f T       λ = f T T J MD p ( M 2 + η * 2 ) ( M s 2 η 2 ) > 0
Constitutive equation:
T = E D Λ E f T
Here, E is the elastic modulus tensor, and Λ is the expression of plastic multiplier λ in terms of stretching D . Further, we can establish the following relations.
M s 2 = M a 2 + b r 4 M η * 2 M 2 + η * 2 ( m b η * 3 2 η ^ β ) MD U * R * 1 c s α ~ + c s 2 η * U R 6 η * 2 + 1 3 α ~ 2
and
M a 2 = M 2 + ζ 2 ,       ζ = 3 / 2 β ,       α ~ = M a 2 η 2
The slope M s of the threshold between hardening and softening q = M s p , obtained under loading conditions λ > 0 , varies according to structural degradation, the loss of overconsolidation, and the development or loss of anisotropy, as well as with the current stress ratio. Similarly, the slope M a of the threshold between plastic compression and expansion q = M a p varies in response to the development or loss of anisotropy. For details, the reader is referred to Asaoka et al. [12].
Figure A1. Three loading surfaces.
Water 16 00452 g0a1

References

  1. National Research Institute for Earth Science and Disaster Resilience. NIED K-NET, KiK-Net; National Research Institute for Earth Science and Disaster Resilience: Ibaraki, Japan, 2019. [CrossRef]
  2. Ueda, K.; Izawa, J.; Murono, Y.; Iai, S. Analytical study on the influence of aftershocks on the liquefaction behavior of ground. J. JSCE (A1) 2014, 70, I_578–I_585. (In Japanese) [Google Scholar] [CrossRef]
  3. Morikawa, Y.; Bao, X.; Zhang, F.; Taira, A.; Sakaguchi, H. Why an aftershock with a maximum acceleration of 25 gal could make ground liquefied in the 2011 Great East Japan Earthquake. In Proceedings of the 6th International Workshop on New Frontiers in Computational Geotechnics, Takayama, Japan, 21–23 May 2012; pp. 117–122. [Google Scholar]
  4. Yasuda, S.; Harada, K.; Ishikawa, K.; Kanemaru, Y. Characteristics of liquefaction in Tokyo Bay area by the 2011 Great East Japan Earthquake. Soils Found. 2012, 52, 793–810. [Google Scholar] [CrossRef]
  5. Urayasu City Liquefaction Countermeasure Technology Consideration Investigating Committee. The Second Committee. Available online: https://www.city.urayasu.lg.jp/shisei/johokoukai/shingikai/shichoukoushotsu/1002796/1002934.html (accessed on 15 November 2023). (In Japanese).
  6. Koizumi, N.; Kano, Y.; Kitagawa, Y.; Sato, T.; Takahashi, M.; Nishimura, S.; Nishida, R. Groundwater anomalies associated with the 1995 Hyogo-ken Nanbu Earthquake. J. Phys. Earth 1996, 44, 373–380. [Google Scholar] [CrossRef]
  7. Chia, Y.; Wang, Y.S.; Chiu, J.J.; Liu, C.W. Changes of groundwater level due to the 1999 Chi-Chi earthquake in the Choshui River alluvial fanin Taiwan. BSSA 2001, 91, 1062–1068. [Google Scholar] [CrossRef]
  8. Hosono, T.; Yamada, C.; Manga, M.; Wang, C.-Y.; Tanimizu, M. Stable isotopes show that earthquakes enhance permeability and release water from mountains. Nat. Commun. 2020, 11, 2776. [Google Scholar] [CrossRef] [PubMed]
  9. Biot, M.A. General theory of three-dimensional consolidation. J. Appl. Phys. 1941, 12, 155–164. [Google Scholar] [CrossRef]
  10. Manga, M.; Wang, C.-Y. Earthquake Hydrology. Treatise Geophys. 2015, 4, 305–328. [Google Scholar] [CrossRef]
  11. Noda, T.; Yoshikawa, T. Soil-water-air coupled finite deformation analysis based on a rate-type equation of motion incorporating the SYS Cam-clay model. Soils Found. 2015, 55, 45–62. [Google Scholar] [CrossRef]
  12. Asaoka, A.; Noda, T.; Yamada, E.; Kaneda, K.; Nakano, M. An elastoplastic description of two distinct volume change mechanisms of soils. Soils Found. 2002, 42, 47–57. [Google Scholar] [CrossRef]
  13. Yoshikawa, T.; Noda, T.; Kodaka, T.; Takaine, T. Analysis of the effect of groundwater level on the seismic behavior of an unsaturated embankment on clayey ground. Soil Dyn. Earthq. Eng. 2016, 85, 217–230. [Google Scholar] [CrossRef]
  14. Ravichandran, N. Fully coupled finite element model for dynamics of partially saturated soils. Soil Dyn. Earthq. Eng. 2009, 29, 1294–1304. [Google Scholar] [CrossRef]
  15. Khoei, A.; Mohammadnejad, T. Numerical modeling of multiphase fluid flow in deforming porous media: A comparison between two- and three-phase models for seismic analysis of earth and rockfill dams. Comput. Geotech. 2011, 38, 142–166. [Google Scholar] [CrossRef]
  16. Matsumaru, T.; Uzuoka, R. Three-phase seepage-deformation coupled analysis about unsaturated embankment damaged by earthquake. Int. J. Geomech. 2016, 16, C4016006. [Google Scholar] [CrossRef]
  17. Zhang, B.; Muraleetharan, K.K. Liquefaction of level ground unsaturated sand deposits using a validated fully coupled analysis procedure. Int. J. Geomech. 2018, 18, 04018118. [Google Scholar] [CrossRef]
  18. Chiba Prefecture. CHIBA INFORMATION MAP. Available online: https://map.pref.chiba.lg.jp/pref-chiba/Portal (accessed on 15 November 2023). (In Japanese).
  19. Ishikawa, K.; Yasuda, S. Study of sand boiling characteristics along Tokyo Bay during the 2011 Tohoku-Pacific Ocean Earthquake. J. JSCE (A1) 2012, 68, I_274–I_281. (In Japanese) [Google Scholar] [CrossRef]
  20. Nakai, K.; Noda, T.; Asaoka, A. Severe and nonuniform liquefaction damage of reclaimed ground contributed by interference between body waves and stratigraphic irregularity-induced surface waves. Earthq. Spectra, 2024; in press. [Google Scholar] [CrossRef]
  21. Noda, T.; Asaoka, A.; Nakano, M. Soil-water coupled finite deformation analysis based on a rate-type equation of motion incorporating the SYS Cam-clay model. Soils Found. 2008, 48, 771–790. [Google Scholar] [CrossRef]
  22. Lysmer, J.; Kuhlemeyer, R.L. Finite dynamic model for infinite media. ASCE 1969, 95, 859–878. [Google Scholar] [CrossRef]
  23. Ishikawa, K.; Yasuda, S. Effect of lowering the ground water table as the countermeasure against liquefaction-induced damage to houses. J. JAEE 2017, 15, 7_205–7_219. (In Japanese) [Google Scholar] [CrossRef]
  24. Jommi, C. Remarks on the constitutive modelling of unsaturated soils. In Experimental Evidence and Theoretical Approaches in Unsaturated Soils; CRC Press/Balkema: Boca Raton, FL, USA, 2000; pp. 139–153. [Google Scholar]
  25. van Genuchten, M.T. A closed-form equation for predicting the hydraulic conductivity of unsaturated soils. Soil Sci. Soc. Am. J. 1980, 44, 892–898. [Google Scholar] [CrossRef]
  26. Mualem, Y. A new model for predicting the hydraulic conductivity of unsaturated porous media. Water Resour. Res. 1976, 12, 513–522. [Google Scholar] [CrossRef]
  27. Muskat, M. The Flow of Homogeneous Fluid through Porous Media; Mcgraw-Hill: New York, NY, USA, 1937; pp. 69–74. [Google Scholar]
  28. Yamamoto, T.; Nakai, T.; Maruki, Y.; Kodaka, T.; Kishida, K.; Ohnishi, Y. Health assessment of the slopes along the roads introducing the long-term degradation concept. Jpn. Geotech. J. 2009, 4, 21–33. (In Japanese) [Google Scholar] [CrossRef]
  29. Yamamizu, F.; Kasahara, K.; Suzuki, H.; Ikawa, T.; Adachi, I. Seismic reflection profiling around the Shimohsa deep-well. Programme Abstr. Seismol. Soc. Jpn. 1993, 2, 261. (In Japanese) [Google Scholar]
  30. Midorikawa, S. Prediction of isoseismal map in the Kanto plain due to hypothetical earthquake. J. Struct. Eng. 1987, 33B, 43–48. (In Japanese) [Google Scholar]
  31. Christian, J.T. Undrained stress distribution by numerical method. J. Soil Mech. Found. Div. 1968, 94, 1333–1345. [Google Scholar] [CrossRef]
  32. Akai, K.; Tamura, T. Numerical analysis of multi-dimensional consolidation accompanied with elasto-plastic constitutive equation. Proc. JSCE 1978, 269, 95–104. (In Japanese) [Google Scholar] [CrossRef]
  33. Wilson, E.L.; Farhoomand, I.; Bathe, K.J. Nonlinear dynamic analysis of complex structures. Int. J. Earthq. Eng. Struct. Dyn. 1973, 1, 241–252. [Google Scholar] [CrossRef]
  34. Roscoe, K.H.; Burland, J.B. On the generalized stress-strain behaviour of ‘wet’ clay. In Engineering Plasticity; Cambridge University Press: Cambridge, UK, 1968; pp. 535–609. [Google Scholar]
  35. Sekiguchi, H.; Ohta, H. Induced anisotropy and time dependency in clays. In Proceedings of the 9th International Conference on Soil Mechanics and Foundation Engineering, Specialty Session 9, Tokyo, Japan, 10–15 July 1977; pp. 229–238. [Google Scholar]
  36. Asaoka, A.; Nakano, M.; Noda, T. Superloading yield surface concept for highly structured soil behavior. Soils Found. 2000, 40, 99–110. [Google Scholar] [CrossRef]
  37. Hashiguchi, K. Plastic constitutive equations of granular materials. In Proceedings of the US-Japan Seminar on Continuum Mechanics and Statistical Approaches in the Mechanics of Granular Materials, Sendai, Japan, 5–9 June 1978; pp. 321–329. [Google Scholar]
  38. Hashiguchi, K. Subloading surface model in unconventional plasticity. Int. J. Solids Struct. 1989, 25, 917–945. [Google Scholar] [CrossRef]
  39. Hashiguchi, K.; Chen, Z.P. Elastoplastic constitutive equations of soils with the subloading surface and the rotational hardening. Int. J. Numer. Anal. Meth. Geomech. 1998, 22, 197–227. [Google Scholar] [CrossRef]
  40. Green, A.E.; Naghdi, P.M. A general theory of an elastic-plastic continuum. Arch. Ration. Mech. Anal. 1965, 18, 251–281. [Google Scholar] [CrossRef]
Figure 1. Intensified water spout during aftershock. The pictures were captured using a fixed-point camera provided by Irifune Junior High School: (a) before the main shock; (b) immediately after the main shock; (c) 10 min after the main shock; and (d) 10 min after the aftershock [5]. Note that main shock and aftershock occurred at 14:46 and 15:15, respectively.
Water 16 00452 g001
Figure 2. Analysis cross-section: (a) finite element mesh; (b) layer composition; (c) soil cross-section in the northwest–southeast direction in the central part of Urayasu City [19], presumed from CHIBA INFORMATION MAP [18].
Water 16 00452 g002
Figure 3. Soil–water characteristic curve and relations between the coefficients of water/air permeability and degree of saturation for sand layer.
Water 16 00452 g003
Figure 4. Initial values for pore water/air pressure and degree of saturation in the sand layer.
Water 16 00452 g004
Figure 5. Input seismic waves and Fourier amplitude spectrums: (a) main shock; (b) aftershock.
Water 16 00452 g005
Figure 6. Distributions of degree of saturation, mean skeleton stress, and excess pore water pressure during and after the main shock.
Water 16 00452 g006
Figure 7. Distributions of degree of saturation, mean skeleton stress, and excess pore water pressure during and after the aftershock, which occurred 29 min after the main shock.
Water 16 00452 g007
Figure 8. Temporal change in mean skeleton stress reduction ratio, excess pore water pressure, and the degree of saturation of the soil element in the unsaturated state before the main shock, as shown in Figure 6 and Figure 7.
Water 16 00452 g008
Figure 9. Distributions of degree of saturation, mean skeleton stress, and excess pore water pressure during and after the aftershock, which occurred after the excess pore water pressure due to the main shock being fully dissipated.
Water 16 00452 g009
Figure 10. Temporal change in mean skeleton stress reduction ratio, excess pore water pressure, and the degree of saturation of the soil element in the unsaturated state before the main shock, as shown in Figure 6 and Figure 9, when the aftershock occurred after the excess pore water pressure due to the main shock being fully dissipated.
Water 16 00452 g010
Figure 11. Distribution of the amount of water absorption immediately before the aftershock.
Water 16 00452 g011
Figure 12. Mechanism of groundwater level rise: (a) case where ground is saturated; and (b) case where ground located in a shallow area is unsaturated.
Water 16 00452 g012
Figure 13. Distributions of degree of saturation, pore water pressure, and the amount of water absorption when the void ratio of the entire sand layer varies: (a) degree of saturation; (b) pore water pressure; and (c) amount of water absorption.
Water 16 00452 g013aWater 16 00452 g013b
Figure 14. Distributions of degree of saturation, pore water pressure, and the amount of water absorption when the void ratio of the unsaturated sand layer modeled as an elastic body varies: (a) degree of saturation; (b) pore water pressure; and (c) amount of water absorption.
Water 16 00452 g014
Table 1. Material constants and initial values for the SYS Cam-clay model.
SandClayBedrock
Elastoplastic parameters
Specific volume at q = 0 and p′ = 98.1 kPa on NCL N 2.03.022.0
Critical state constant Μ 1.41.41.5
Compression index λ ~ 0.10.2420.005
Swelling index κ ~ 0.00250.020.0005
Poisson’s ratio ν 0.20.10.1
Evolution parameters
Degradation parameter of overconsolidated state m 8.020.00.3
Degradation parameter of structure a 8.00.650.05
Degradation parameter of structure b 1.01.01.0
Degradation parameter of structure c 1.01.01.0
Degradation parameter of structure c s 1.00.40.5
Evolution parameter of rotational hardening b r 10.00.20.2
Limit of rotational hardening m b 0.441.00.7
Initial values
Void ratio e 0 0.982.350.21
Degree of structure 1 / R 0 * 3.0421.75100.0
Overconsolidation ratio 1 / R 0 DistributedDistributedDistributed
Stress ratio η 0 0.5450.5450.545
Degree of anisotropy ζ 0 0.00.31.0
Table 2. Material constants for the soil–water characteristic model and other physical properties.
SandClayBedrock
Soil–water characteristic
Maximum degree of saturation % s m a x w 100.0--
Minimum degree of saturation % s m i n w 60.0--
van Genuchten parameter kPa−1 α 0.15--
van Genuchten parameter ( m = 1 1 / n ) n 2.0--
Saturated coefficient of water permeability m/s k s w 6.17 × 10−51.0 × 10−91.0 × 10⁻⁸
Dry coefficient of air permeability m/s k d a 3.40 × 10⁻³--
Physical property
Soil particle density g/cm3 ρ s 2.7872.6902.650
Bulk modulus of water kPa K w 2.19 × 1062.19 × 1062.19 × 106
Specific gas constant of air m2/s2/K R ¯ 287.04287.04287.04
Absolute temperature K Θ 293.15293.15293.15
Disclaimer/Publisher’s Note: The statements, opinions and data contained in all publications are solely those of the individual author(s) and contributor(s) and not of MDPI and/or the editor(s). MDPI and/or the editor(s) disclaim responsibility for any injury to people or property resulting from any ideas, methods, instructions or products referred to in the content.

