1. Introduction
Water is an essential natural resource that plays a crucial role in the ecosystem [
1,
2,
3]. A stable water environment is necessary for ensuring national food security, energy supply, and the water demand [
4]. However, due to urban modernization and industrialization, large amounts of domestic sewage and industrial wastewater are discharged beyond the acceptable standard and quantity, leading to water pollution and damage to water resources, as well as a decline in the water quality [
5,
6]. According to data from the Ecological Environment Monitoring Center of Hainan Province in 2021, from 92 sections of 86 monitored water bodies, there are 22 mildly polluted sections, accounting for 23.9%; 19 moderately polluted sections, accounting for 20.7%; and 13 heavily polluted sections, accounting for 14.1% (The data come from the report “Water Environment Quality of City-County Boundary Cross Sections (including Basin Ecological Protection Compensation Cross Sections) in the First Quarter of 2021” released by the Ecological Environment Monitoring Centre of Hainan Province.
http://hnsthb.hainan.gov.cn/xxgk/0200/0202/hjzl/shjzl/202105/t20210510_2976294.html (accessed on 21 March 2023)). This shows that large bodies of heavily polluted surface water and seawater remain, and the problem of water pollution in Hainan Province is serious [
7,
8]. To address this, the Chinese government has proposed a series of plans and programs. For example, in 2015, the State Council put forward the overall requirements for water environment management and the repair of water ecosystem services. In 2018, the Hainan provincial government proposed that the province’s water environment quality should be significantly improved and enhanced, and the governance goals of various water bodies were clearly defined. However, this government-led model of water quality improvements overlooks the importance of resident participation, resulting in high costs and low efficiency [
9,
10,
11]. As the direct beneficiaries of water quality improvements, residents should be the key players in the governance process [
12]. Therefore, it is essential to analyze the willingness of residents to pay for water quality improvements and the factors influencing them to provide a scientific basis on which the government can formulate reasonable policies.
In recent years, there has been a wealth of studies conducted to understand the Willingness to pay (WTP) for the enhancement of water quality. The most commonly used measurement methods for these studies are the contingent valuation method (CVM), Choice Experiments (CE), the Life Satisfaction Approach (LSA), and the point and interval data model [
13,
14,
15,
16,
17,
18,
19]. CVM is particularly popular due to its versatility and ability to give immediate feedback [
20]. It is a survey method that assesses people’s WTP for environmental treatment by directly asking them how much they are willing to pay to improve the current environmental quality. Empirical research has shown that there are a variety of factors that affect WTP, such as age, education, gender, marital status, occupation, household income, and the number of household members [
21,
22]. Other factors such as awareness of environmental protection, the relative importance of the environment to the economy, the ages of children in the household, the level of transparency of information and participation in the decision-making process, and the need for water quality improvements can also influence WTP [
15,
23,
24]. For instance, Guilfoos et al. [
25] discovered that there were discrepancies between people’s perceptions of water quality and the actual number of bacteria present in the water samples collected from households. Zheng et al. [
26] found that respondents’ perceptions of the importance of the environment is also an important factor in determining WTP. It is difficult to draw the same conclusions from different studies due to varying circumstances. Additionally, some scholars have studied the psychological factors and water quality perceptions that influence people’s WTP for water quality improvements. For example, Tanellari et al. [
27] looked at the relationships among information, risk perception, and WTP based on a mailed survey of consumers in northern Virginia and the Maryland suburbs of Washington, D.C. Jianjun et al. [
15] revealed that people’s concerns regarding the drinking water quality and their perceptions of the health risk associated with the drinking water quality can have a significant positive effect on their WTP.
Although previous studies on WTP for water quality improvements have made significant progress, there are still some inadequacies. First, most of the current studies on WTP for water quality improvements have focused on the measurement of specific aspects of WTP in each study area, the determinants of WTP, and the choice of methods for estimating WTP. However, the interactions among the influencing factors are rarely considered, and each indicator is treated as an independent factor in the discussion and recommendation, which is not consistent with reality [
28,
29]. Second, due to the majority of higher research institutes and a large amount of research funding being mainly concentrated in economically developed regions, current research on the WTP for water quality improvements rarely focuses on developing countries and their economically backward regions. Third, the existing research on the WTP for water quality improvements has mainly been conducted in areas with severe overall pollution. Hainan Island is a tropical island with a large area of natural tropical rainforest and an excellent environment, but it still has severe water quality problems. Environmental problems still exist in environmentally excellent areas, and the participation of residents in environmental management in environmentally excellent areas still deserves extensive attention.
This paper makes two contributions to the literature to address the existing gap. Firstly, we adopt the estimation method proposed by Lopez-Feldman [
30] to evaluate the value of water quality enhancements in Haikou City. This extends the scope of research on water environmental management and presents a valuable research model for several developing countries located near to the equator. Secondly, we examine the factors that influence residents’ willingness to participate in water quality improvements using logistic models and ISM models to investigate the mechanisms behind these factors. This investigation provides a foundation for resolving water environmental management issues. The rest of this paper is organized as follows:
Section 2 provides a brief overview of the study area and the methods used.
Section 3 presents the results and discussion, which includes descriptive statistics and results from the mixed logit model. Finally,
Section 4 and
Section 5 outline the conclusions and policy implications, respectively.
2. Materials and Methods
2.1. Double-Bounded Dichotomous CVM
Since its first application by Davis to assess the recreational value of hunting and camping in Maine’s woodlands, the CVM has been recognized by the U.S. Department of Water Resources and the Department of the Interior and has been included in regulations as one of the basic methods for assessing resources [
31,
32]. The CVM simulates market scenarios to determine respondents’ maximum willingness to accept (WTA) improvements to the resource environment or the minimum WTA for its degradation. In this way, the economic value of the improved resource environment can be assessed by maximizing consumer utility, which is obtained through surveying consumers. There are four basic WTP export techniques for CVM research: open-ended, payment card, closed-ended, and sequential bids. Of these, the closed-ended bootstrapping technique, also known as the dichotomous bootstrapping technique, can be further subdivided into single-boundary dichotomous, double-bounded dichotomous, and multi-boundary dichotomous techniques. The double-bounded dichotomous guidance technique is more effective and accurate for obtaining respondents’ actual WTP than other methods [
20,
33,
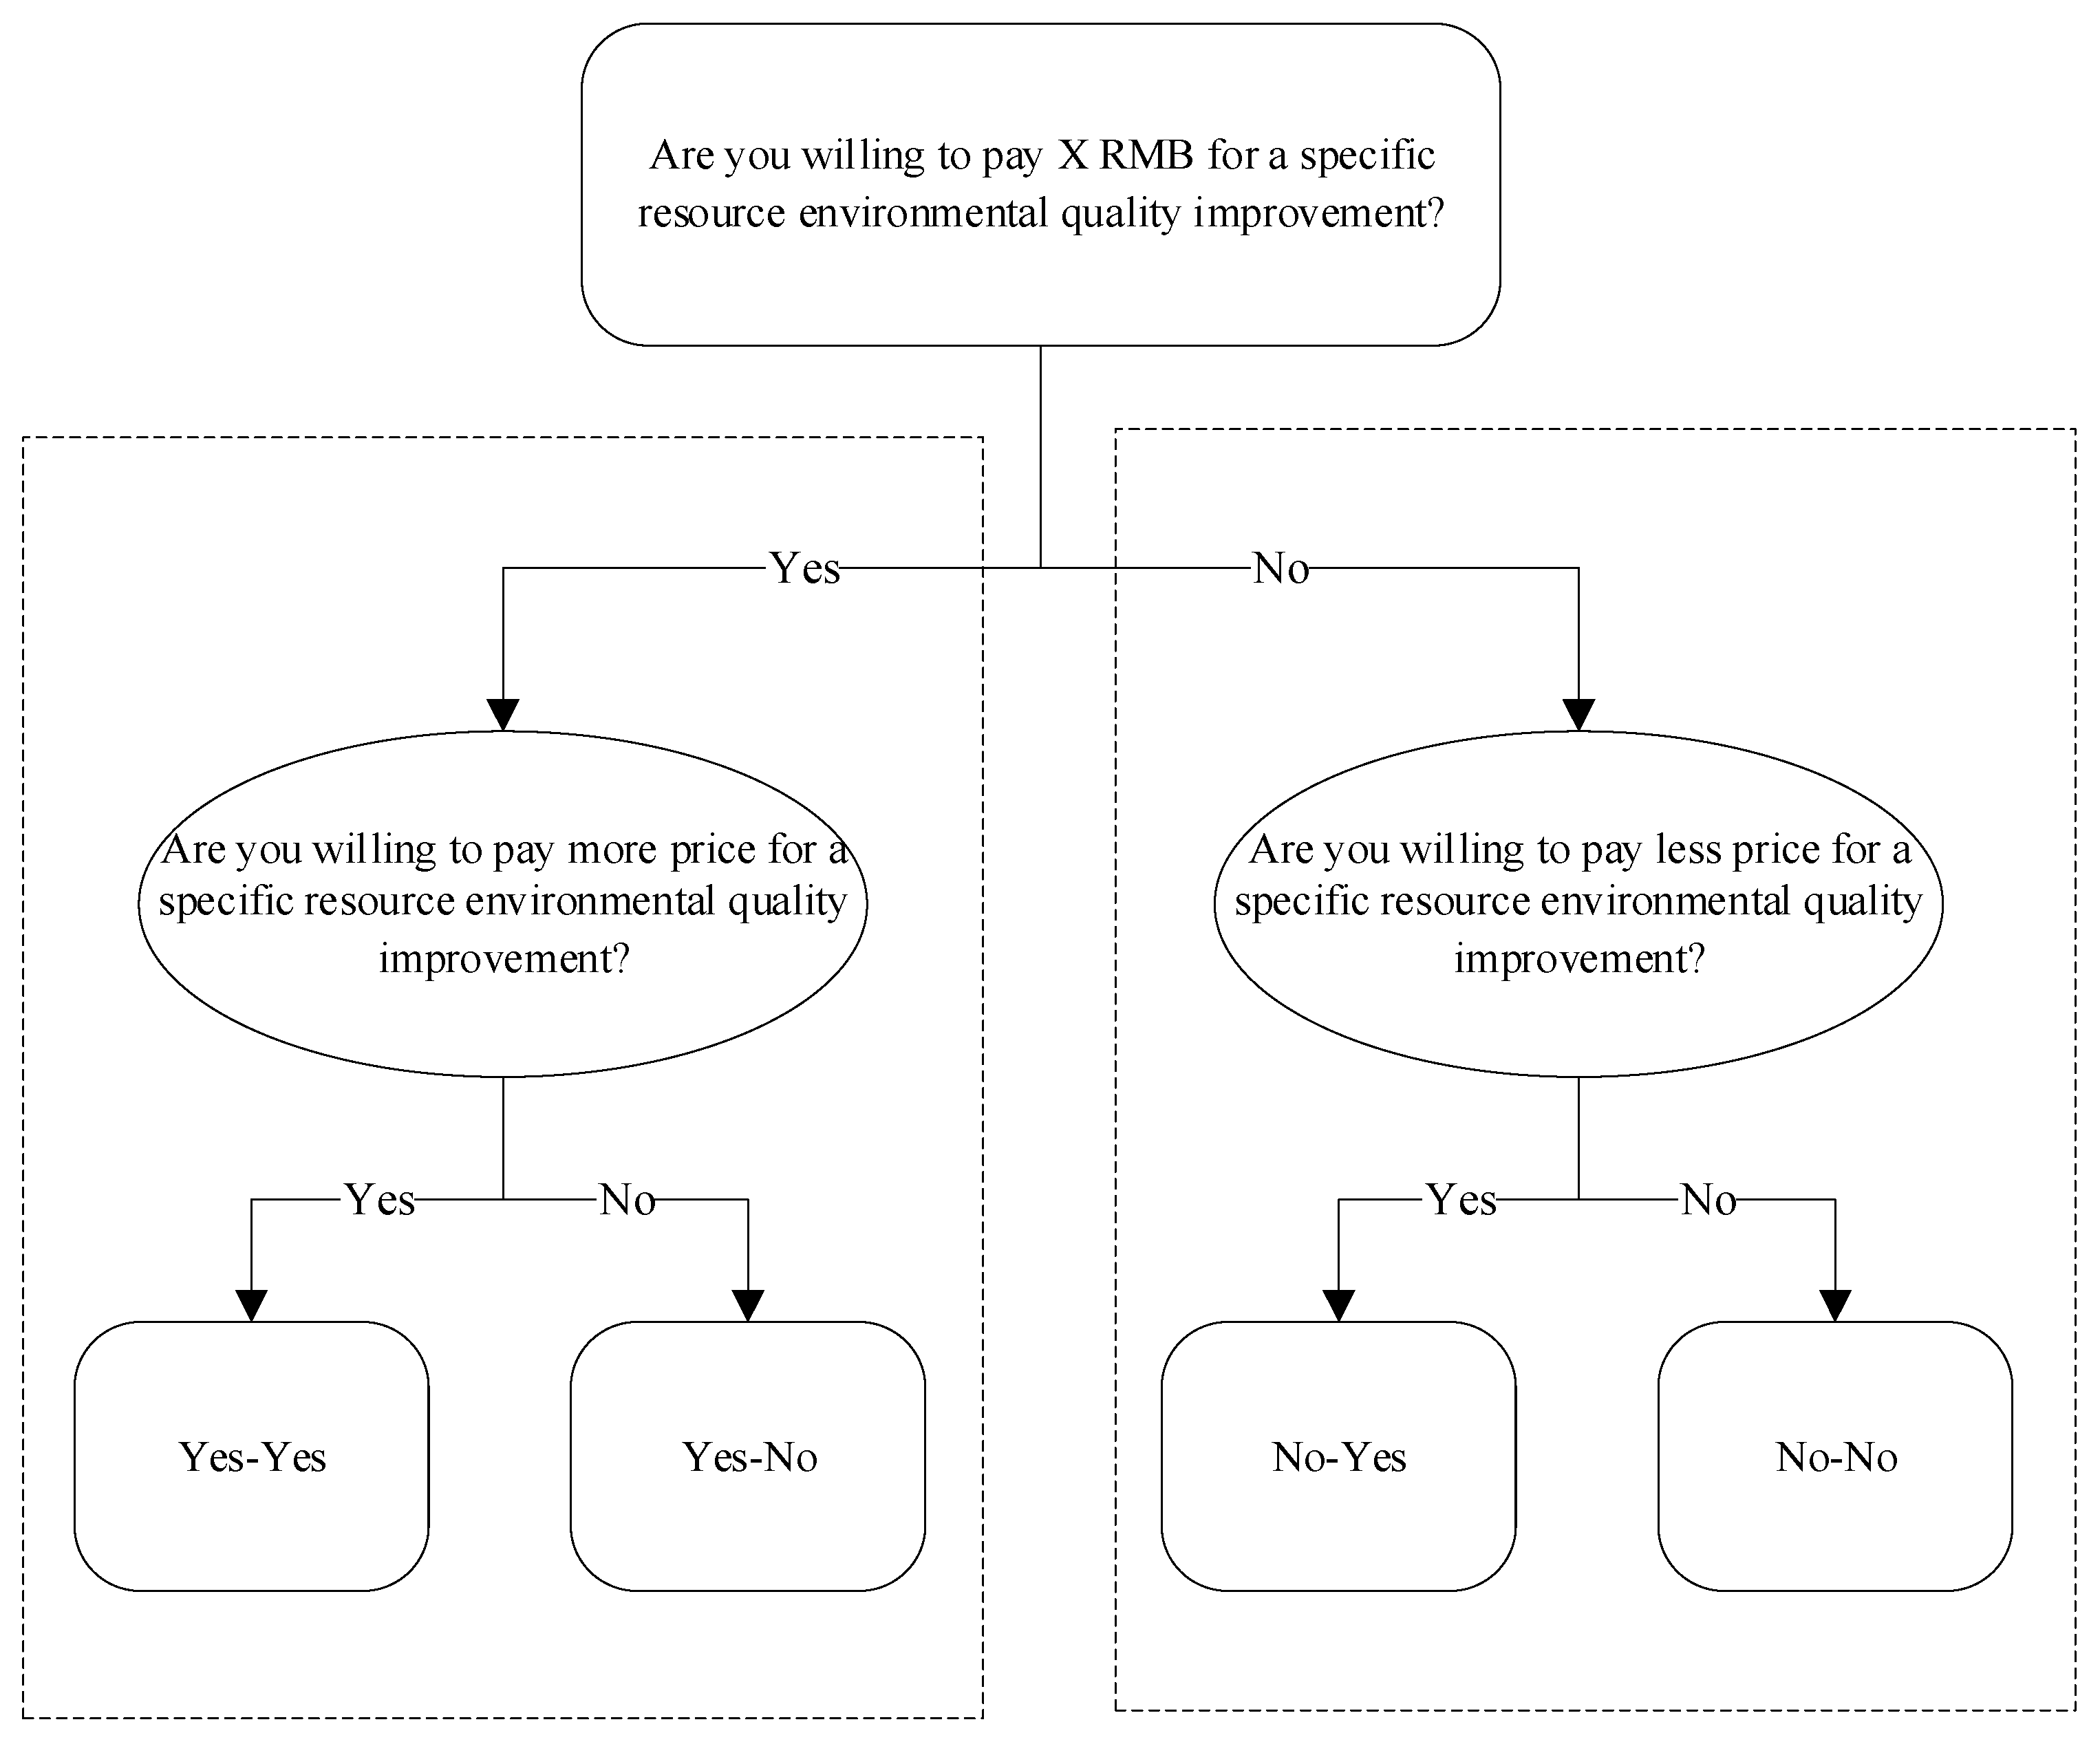
34]. Therefore, in this study, the double-bounded dichotomous CVM questionnaire was used to evaluate the social benefits of water quality improvements in Haikou City. In the study, respondents were asked to choose between “yes” and “no” twice for the given bid value. In the first instance, the respondent was given a random bid value of “X RMB” and asked whether he or she would be willing to pay. Then, based on the results of the first response, in the second question, the bid value was increased or decreased further to reduce the range of respondents’ actual WTP. This process generated four different responses: “yes-yes”, “yes-no”, “no-yes”, and “no-no”. A functional relationship between the probability and the bid value was established from the results of these responses, and the expected value of the respondents’ actual WTP was estimated.
Figure 1 shows the flow diagram of the double-bounded dichotomous CVM research.
The factors influencing respondents’ WTP consist of two components, i.e., the visible component and the unobservable component. The specific formula is
where
denotes the i-th respondent’s WTP.
is the visible component.
denotes the respondent’s personal socioeconomic attributes.
denotes the random disturbance term, which is the unobservable component, and this random disturbance term obeys a distribution function with a mean of 0 and variance of
, i.e.,
.
In the dichotomous double-bounded CVM, is assumed to be a dichotomous variable representing the outcome of the i-th respondent’s choice between the two bid values. indicates that the respondent answered “yes” to the bid value, and indicates that the respondent answered “no” to the bid value. denotes the initial bid value, and denotes the second bid value.
Then, the probability of a respondent answering “yes” to the first bid value and “no” to the second bid value (i.e.,
) can be expressed as
Similarly, the probability of answering “yes” to both bids (i.e.,
) can be expressed as
The probability of answering “no” to the first bid and “yes” to the second bid (i.e.,
) can be expressed as
The probability of answering “no” to both bids (i.e.,
) can be expressed as
The estimation of the model parameter values can be done by constructing log-likelihood functions, as follows:
where
is an indicative variable that takes a value of 1 or 0 depending on the respondent’s response to the two bid values, i.e.,
in the first case. Thus, a respondent can contribute to only one of the four components of the likelihood function. Further, with the help of the maximum likelihood estimation, the estimates of
and
can be obtained. Finally, the expected WTP value can be estimated by the above coefficient estimates and the mean value of each influencing factor.
2.2. ISM
In order to further examine the factors that influence residents’ WTP for water quality improvements and the hierarchical relationships between them, this study utilized the Interpretive Structural Modeling (ISM) approach. This model was first proposed by the American scholar Warfield [
35] and is primarily used to recognize the connections between multiple variables. It is now being utilized to uncover the hierarchical structure of the influencing factors [
36]. The specific steps are as follows:
(1) Determine the adjacency matrix between factors:
Assuming that there are
significant influencing factors,
is the factor influencing residents’ WTP for the water quality improvements, and
denotes the
significant influencing factor. The components of the adjacency matrix R are defined by Equation (7):
(2) Determine the reachable matrix M among the factors, which is calculated from Equation (8)
where
I is the unit matrix, 2 ≤
λ ≤
k, and the Boolean operator is used in the power operation of the matrix.
(3) Determine the Hierarchy of Each Factor:
According to Equation (9), the reachable matrix is divided into the reachable set and the antecedent set and both represent the set of all factors in the reachable matrix that can be reached from the factor , where both and represent the factors in the reachable matrix. Formula (10) determines the highest level () and the factors that influence it and then determines other levels of factors. The concrete operation involves the removal of rows and columns where the highest-level factors are located in the reachable matrix M to form the reachable matrix . The second level factors are obtained by repeating the steps shown in Formulas (9) and (10), and the factors are derived at all levels by analogy.
The hierarchical structure of the factors that influence the dependent variable is then determined. Arrows are used to link the factors at each level, and the hierarchical structure of the factors that cause the “deviation” is obtained.
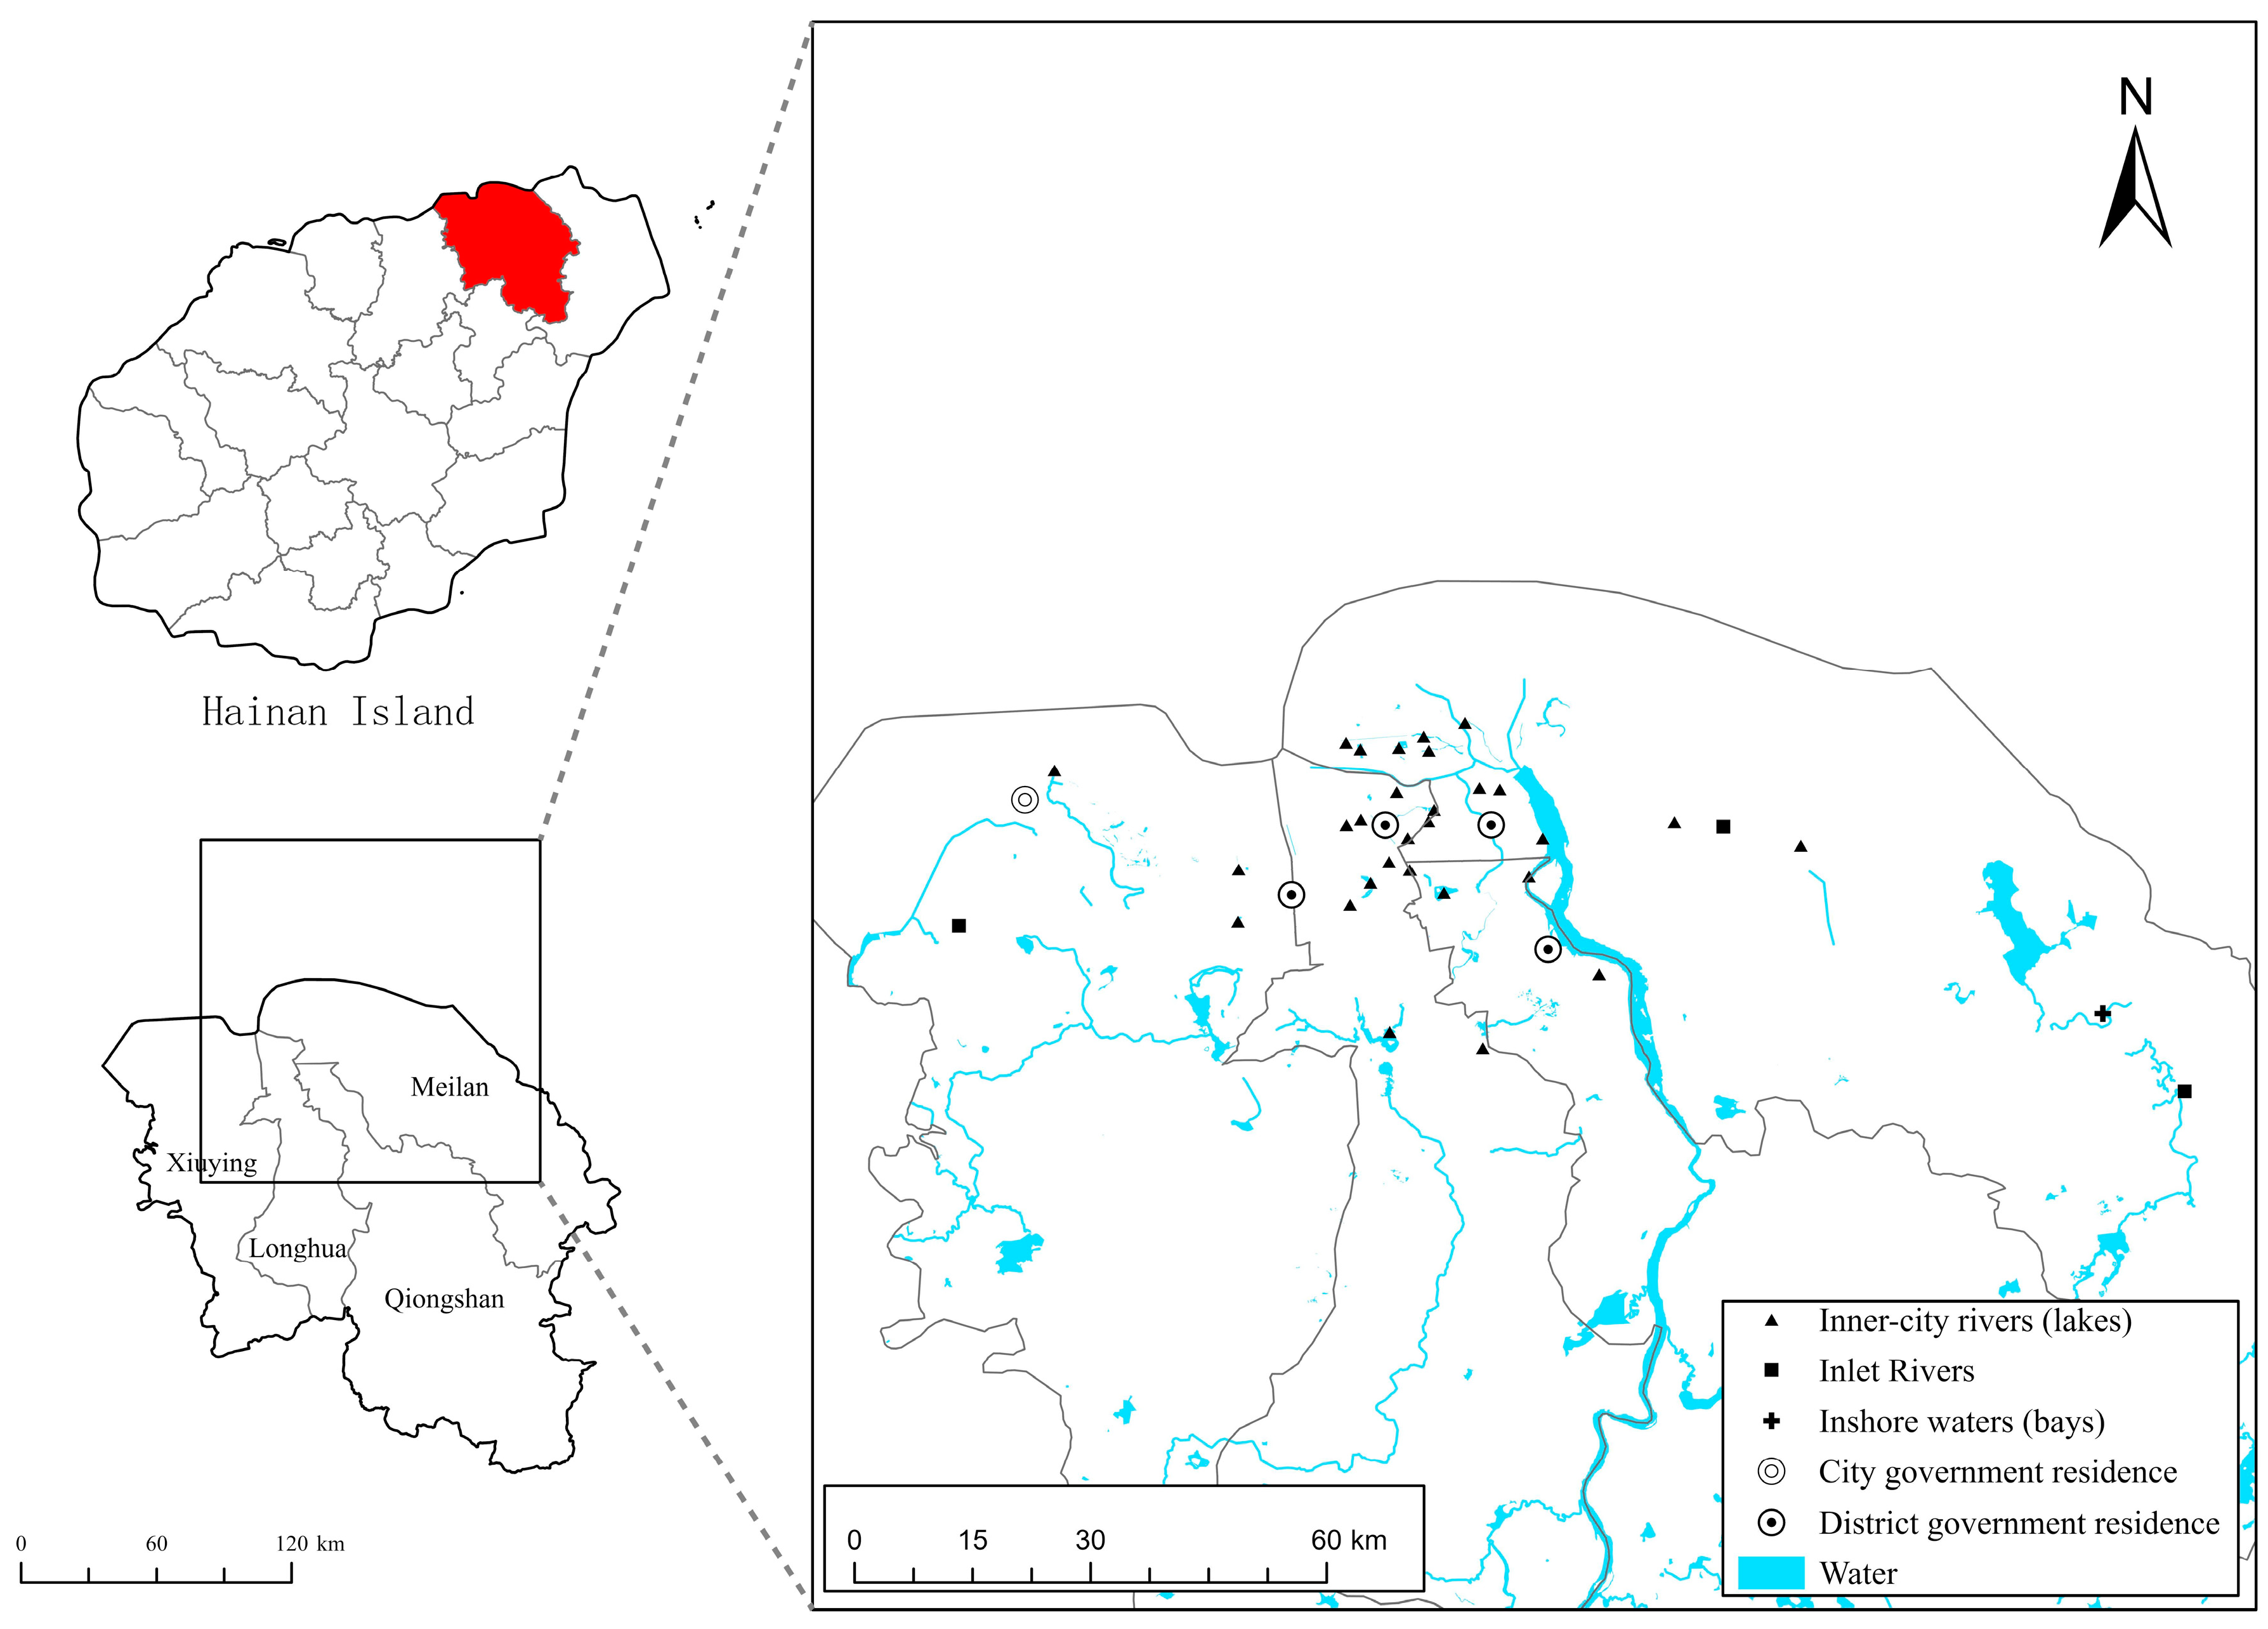
2.3. Study Area
Haikou City, the capital of the southernmost province of China, was used as the study area in this paper. It has a favorable natural ecological environment and a tropical marine climate with an average annual temperature of 24.3 °C and an average annual rainfall of 2067 mm. The forest coverage rate is 38.47%, the greening coverage rate of the built-up area is 37.2%, and the public green space per capita is 12.5 m
2 [
36]. Moreover, Haikou is ranked first among 74 cities monitored by the Ministry of Environmental Protection year-round for its quality of air. It is surrounded by rivers (17 major rivers) and the sea, and its water system space is divided into 5 major water systems, Nandu River, Changliu Group, Central City, Jiangdong Group, and Dongzhai Port, which cover an area of up to 21 km
2 (total annual average water resources of about 1941 million m
3) [
37]. All of these features mean that Haikou is renowned for its beautiful environment.
As urban construction continues to expand, large amounts of domestic sewage and industrial wastewater are being discharged, while the urban sewage network is inadequate and sewage treatment facilities are insufficient, resulting in sewage being widely distributed in the inner rivers (lakes) of Haikou city’s towns, major rivers, lakes and reservoirs, and rivers entering the sea (
Figure 2). According to the Ecological Environment Bureau of Haikou City, out of the 30 urban river (lake) assessment sections in Haikou City in 8 November 2019 were classified as category 4 (26.7%), 5 as category 5 (16.7%), and 11 as category 5 inferior (36.7%), making the overall proportion of polluted water bodies in all assessment sections as high as 80%. Additionally, the polluted waters from urban rivers (lakes) flowing into the near sea and the sewage discharge from various outfalls affect the water quality of near-shore waters (bays) (These data come from the report “Water Quality Status of Internal Rivers (Lakes) in Key Regulated Towns in Hainan Province in November 2019” released by the Ecological Environment Monitoring Centre of Hainan Province.
http://hnsthb.hainan.gov.cn/xxgk/0200/0202/hjzl/shjzl/201911/t20191129_2712933.html) (accessed on 21 March 2023). For example, in May 2018, 28.6% of the monitoring stations had a water quality worse than the fourth category of seawater quality standards in the sea near the outfall of the Longkun Ditch in Haikou City, while in August the proportion was 57.1% (These data come from the report “Public announcement of water quality monitoring information of the major sea-entry river crossings in Hainan Province in May 2018” released by the Ecological Environment Monitoring Centre of Hainan Province.
http://hnsthb.hainan.gov.cn/xxgk/0200/0202/hjzl/hyhjzl/201901/t20190108_2135363.html) (accessed on 21 March 2023). Therefore, Haikou City is a representative and exemplary area for understanding the value of water resources and residents’ willingness to improve water quality in tropical areas and ecologically advantageous regions in China.
2.4. Questionnaire Design
The research questionnaire was divided into four sections. The first part investigated the ecological awareness of the participants through a set of questions. In the second part, the interviewees were introduced to the water quality improvements being conducted in Haikou City, such as the status, distribution, and goals of various polluted water bodies outlined in the Three-Year Action Plan, so that they could gain enough relevant information. The third part was a survey of the respondents’ WTP using the double-bounded dichotomous guidance technique. The fourth part focused on understanding the socioeconomic characteristics of the participants, such as their gender, age, education level, and income level. For the third part of the CVM research process, the questionnaire included the following questions: If the quality of the polluted water in Haikou can be kept at an ideal level (i.e., the goal in the “Three-Year Action Plan”) with control measures, would your family be willing to pay X RMB per year? If not, the bid value was lowered for the second inquiry; if yes, the bid value was increased for the second inquiry.
3. Results and Discussion
3.1. Presurvey
A presurvey was conducted in the form of a web-based questionnaire among urban residents in Haikou City to reduce the “starting point bias” and determine the respondents’ WTP for water quality improvements. The results showed that the WTP was roughly distributed within 300 RMB, and the bid value range of the double-bounded dichotomous CVM was set between 0 and 300 RMB. Taking existing research experience and respondents’ cognitive acceptability into account, the lowest initial bid value was set at 75 RMB, the highest was set at 250 RMB, and the gradient of bid value change for the second inquiry was 50 RMB. This means that respondents may encounter 12 possible bid values, with the lowest being 25 RMB and the highest being 300 RMB. In total, there were 8 initial bid values, or 8 payment options, as shown in
Table 1.
3.2. Data Collection
The field survey was conducted in July 2019 in Haikou City. To ensure that all regions were included in the study, residents from Xiuying District, Qiongshan District, Longhua District, and Meilan District were included. Stratified random sampling was used to draw samples from each district, and one-on-one interviews were conducted with the participants. A total of 320 questionnaires were distributed, and after removing invalid questionnaires, 309 valid questionnaires were obtained, giving an efficiency rate of 96.56%.
Table 2 indicates that of the 309 valid samples, 56.31% of the respondents were male and 43.69% were female, showing a balanced distribution. The ages of the respondents ranged from 19 to 70 years old, with an average age of 32 years, indicating that most of the survey sample consisted of young adults, likely because they could better comprehend the research questions and answer on behalf of their families. The average number of years of education among respondents was 13, with 78.32% having received a high school education or higher. A total of 47.90% of the respondents were indigenous residents, roughly the same as the number of nonindigenous residents. Around 10% of the respondents intended to move away from the area in the next five years, implying that most respondents were not planning to leave Haikou in the near future. The average annual income of all surveyed households was approximately 90,000 RMB, and the per capita disposable income of urban residents in Haikou City in 2017 was 33,320 RMB, which is roughly equivalent after converting this value into the household income (Data were taken from the Household Sample Survey of the Haikou Survey Team of the National Bureau of Statistics of China.
http://szb.hkwb.net/szb/html/2018-03/01/content_284764.htm (accessed on 21 March 2023)). This suggests that the sample selection was reasonable and representative. Furthermore, the sample statistics also revealed that about 76.7% of the respondents indicated that they had no knowledge of the Three-Year Action Plan for the Treatment of Polluted Water Bodies in Hainan Province. The mean value of respondents’ concern for the local ecological environment was 3.06, suggesting that most of them did not discuss ecological environment issues with others very often. The mean value of trust in the government was 4.16, indicating that most respondents had a high level of trust in the government’s ability to manage the environment.
3.3. WTP Statistics Results
Table 3 shows the statistics of 309 respondents’ responses to eight payment scheme scenarios, which are “Yes-Yes”, “Yes-No”, “No-Yes”, and “No-No”. A total of 27.18% of the respondents answered “No-No”, and this number increased as the initial bid value increased, with a roughly increasing trend in the percentage for each scenario. When the initial bid values were 75 RMB, 100 RMB, and 125 RMB, the percentages of respondents who answered “Yes” first were significantly higher than the probability of answering “No”, but as the initial bid value increased, the probability of respondents answering “No” first gradually increased. After the first “No” response, the proportion of respondents who answered “No” for the second time was higher than the proportion of respondents who answered “Yes” for the second time. At an initial bid value of 225 RMB, 16 out of 37 respondents agreed that they would pay 225 RMB for water quality improvements, and 14 stated that they would not pay 225 RMB or 175 RMB. This preliminary result shows that residents’ WTP for water quality improvements in Haikou City decreases as the amount increases, and a small number of residents are not willing to pay for these improvements regardless of the cost. This result is consistent with our expectations.
We used Stata 15.0 econometric software to calculate the median WTP of Haikou residents, which was found to be around 194.22 RMB per year. The 95% confidence interval was [177.93, 210.50], and it was statistically significant at the 1% level (as seen in
Table 4). According to the 2020 Seventh National Census of Hainan Province Statistical Yearbook, the population of Haikou City was 2,873,358 at the end of 2020. Therefore, we estimate that the total annual value of Haikou water quality improvements would be at least 5.58 × 10⁸ RMB (calculated by multiplying the median WTP by the population size).
3.4. Analysis of Factors Influencing WTP
This research utilized the “doubled” command in Stata 15.0 econometric software to estimate the two bids and responses of the respondents
30. The results of this maximum likelihood function are displayed in
Table 5. The Loglikelihood was -379.6218 and the chi-square statistic was 33.25, and this was significant at the 1% level, indicating that the model was a good fit for the sample data.
The results of the analysis of the factors that influence WTP show that the coefficients of age, education level, being an indigenous resident, income level, having a minor family member in the household, and having trust in the government were all significant, meaning that these factors have major impacts on people’s WTP. More specifically, (1) age was found to have a significant negative effect on WTP at the 10% level, suggesting that older people are less likely to agree to the proposed bid value. The research process revealed that older residents are generally less willing to pay due to their weaker cognitive and receptive abilities to new things, as well as their lower income level, greater number of children, and heavier financial burden. (2) Education level and WTP were found to have a positive correlation, which was significant at the 5% level, possibly because the more educated residents were able to understand the serious consequences of water pollution and therefore had a greater willingness to pay. (3) The coefficient of income level was positive and significant at the 1% level, indicating that the higher the income level is, the greater the capacity to pay is, and the greater number of people willing to pay to compensate for the losses caused by water pollution. (4) Residents with minors were more likely to accept the bid value, possibly because families with minors are more concerned about their children’s health and are thus more willing to pay for the treatment of polluted water bodies. (5) Government trust was shown to have a positive and significant effect on WTP at the 10% level, implying that the greater the trust in the government, the greater the WTP. This could be because the government plays an essential role in environmental governance, and its ability to govern is directly linked to the efficiency of the implementation of governance measures and the effectiveness of public payments.
The coefficients for gender, indigenous status, plans to move away, family members engaged in environmental protection, policy awareness, and environmental concern were all found to be insignificant. Specifically, it is likely that gender was insignificant due to both men and women having the same social responsibilities and being equally aware of environmental issues; indigenous status was insignificant, suggesting that there is no difference in the respondents’ WTP to improve the local water environment based on their past living or working time in Haikou; plans to move away was insignificant, likely because the residents are more concerned with their current living environment and are more willing to pay to improve its state; having family members engaged in environmental protection had no significant effect on the WTP, indicating that there is no difference between the two groups, which may be related to the increased public environmental awareness; environmental concern was not significant, indicating that it is not the main factor affecting the public’s WTP; and policy awareness was insignificant, possibly due to the overall low popularity of policy propaganda, with only 23.3% of respondents in the field study having knowledge of governance policies.
3.5. ISM Analysis
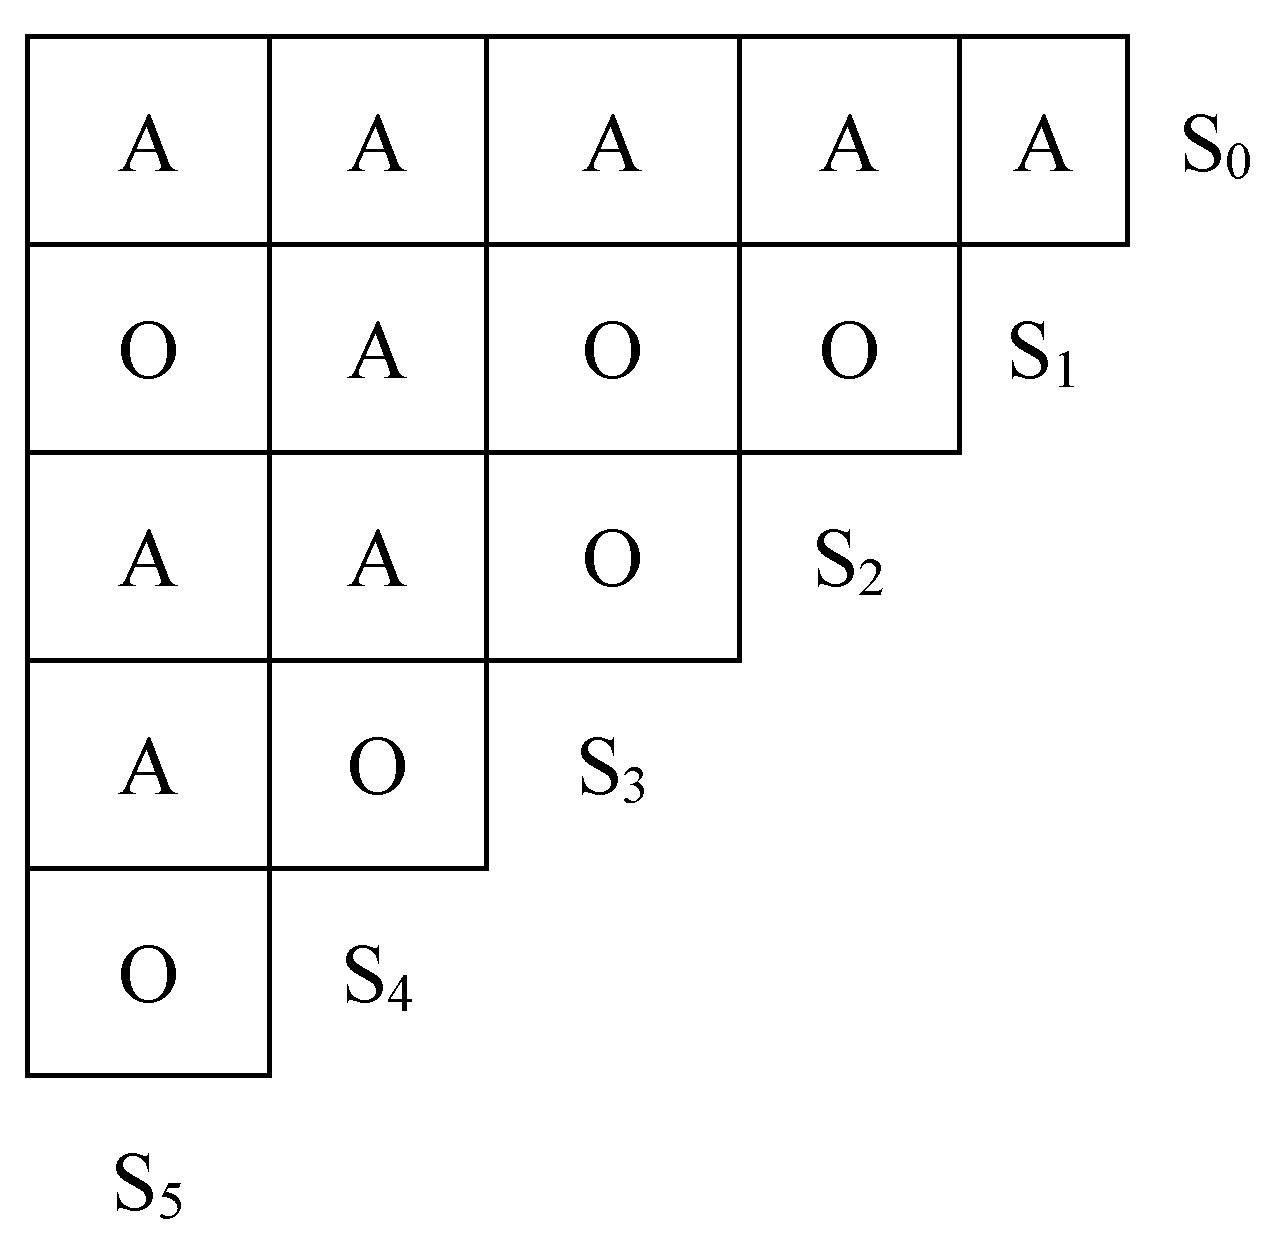
Based on the findings of the previous section, five factors affect the residents’ WTP for water quality improvements: age, education level, presence of minors in the family, government trust, and income level. To represent each of these factors, this study used
Si (
i = 1, 2, 3, 4, 5).
S0 denotes the residents’ WTP for water quality improvements.
Figure 3 [
38,
39,
40,
41] shows the logical relationship for each factor, which was established through a combination of existing literature studies and expert consultation. In this figure, V indicates that row factors have a direct or indirect influence on column factors, A indicates that column factors have a direct or indirect influence on row factors, and O indicates that there is no relationship between row and column factors.
According to the logical relationships among the influencing factors shown in the above figure and Equation (7), we obtained the adjacency matrix R. Then, using Matlab 2021b and Equation (8), we calculated the reachable matrix M from the adjacency matrix R.
Finally, the highest level factor L
1 = {
S0} was determined according to Equation (9), and the other levels of factors L
2 = {
S1,
S2} and L3 = {
S3,
S4,
S5} were also determined using this approach. Based on the use of the above hierarchy to remeasure the reachable matrix, we obtained the hierarchy T of factors affecting the willingness of residents to pay for the water quality improvements:
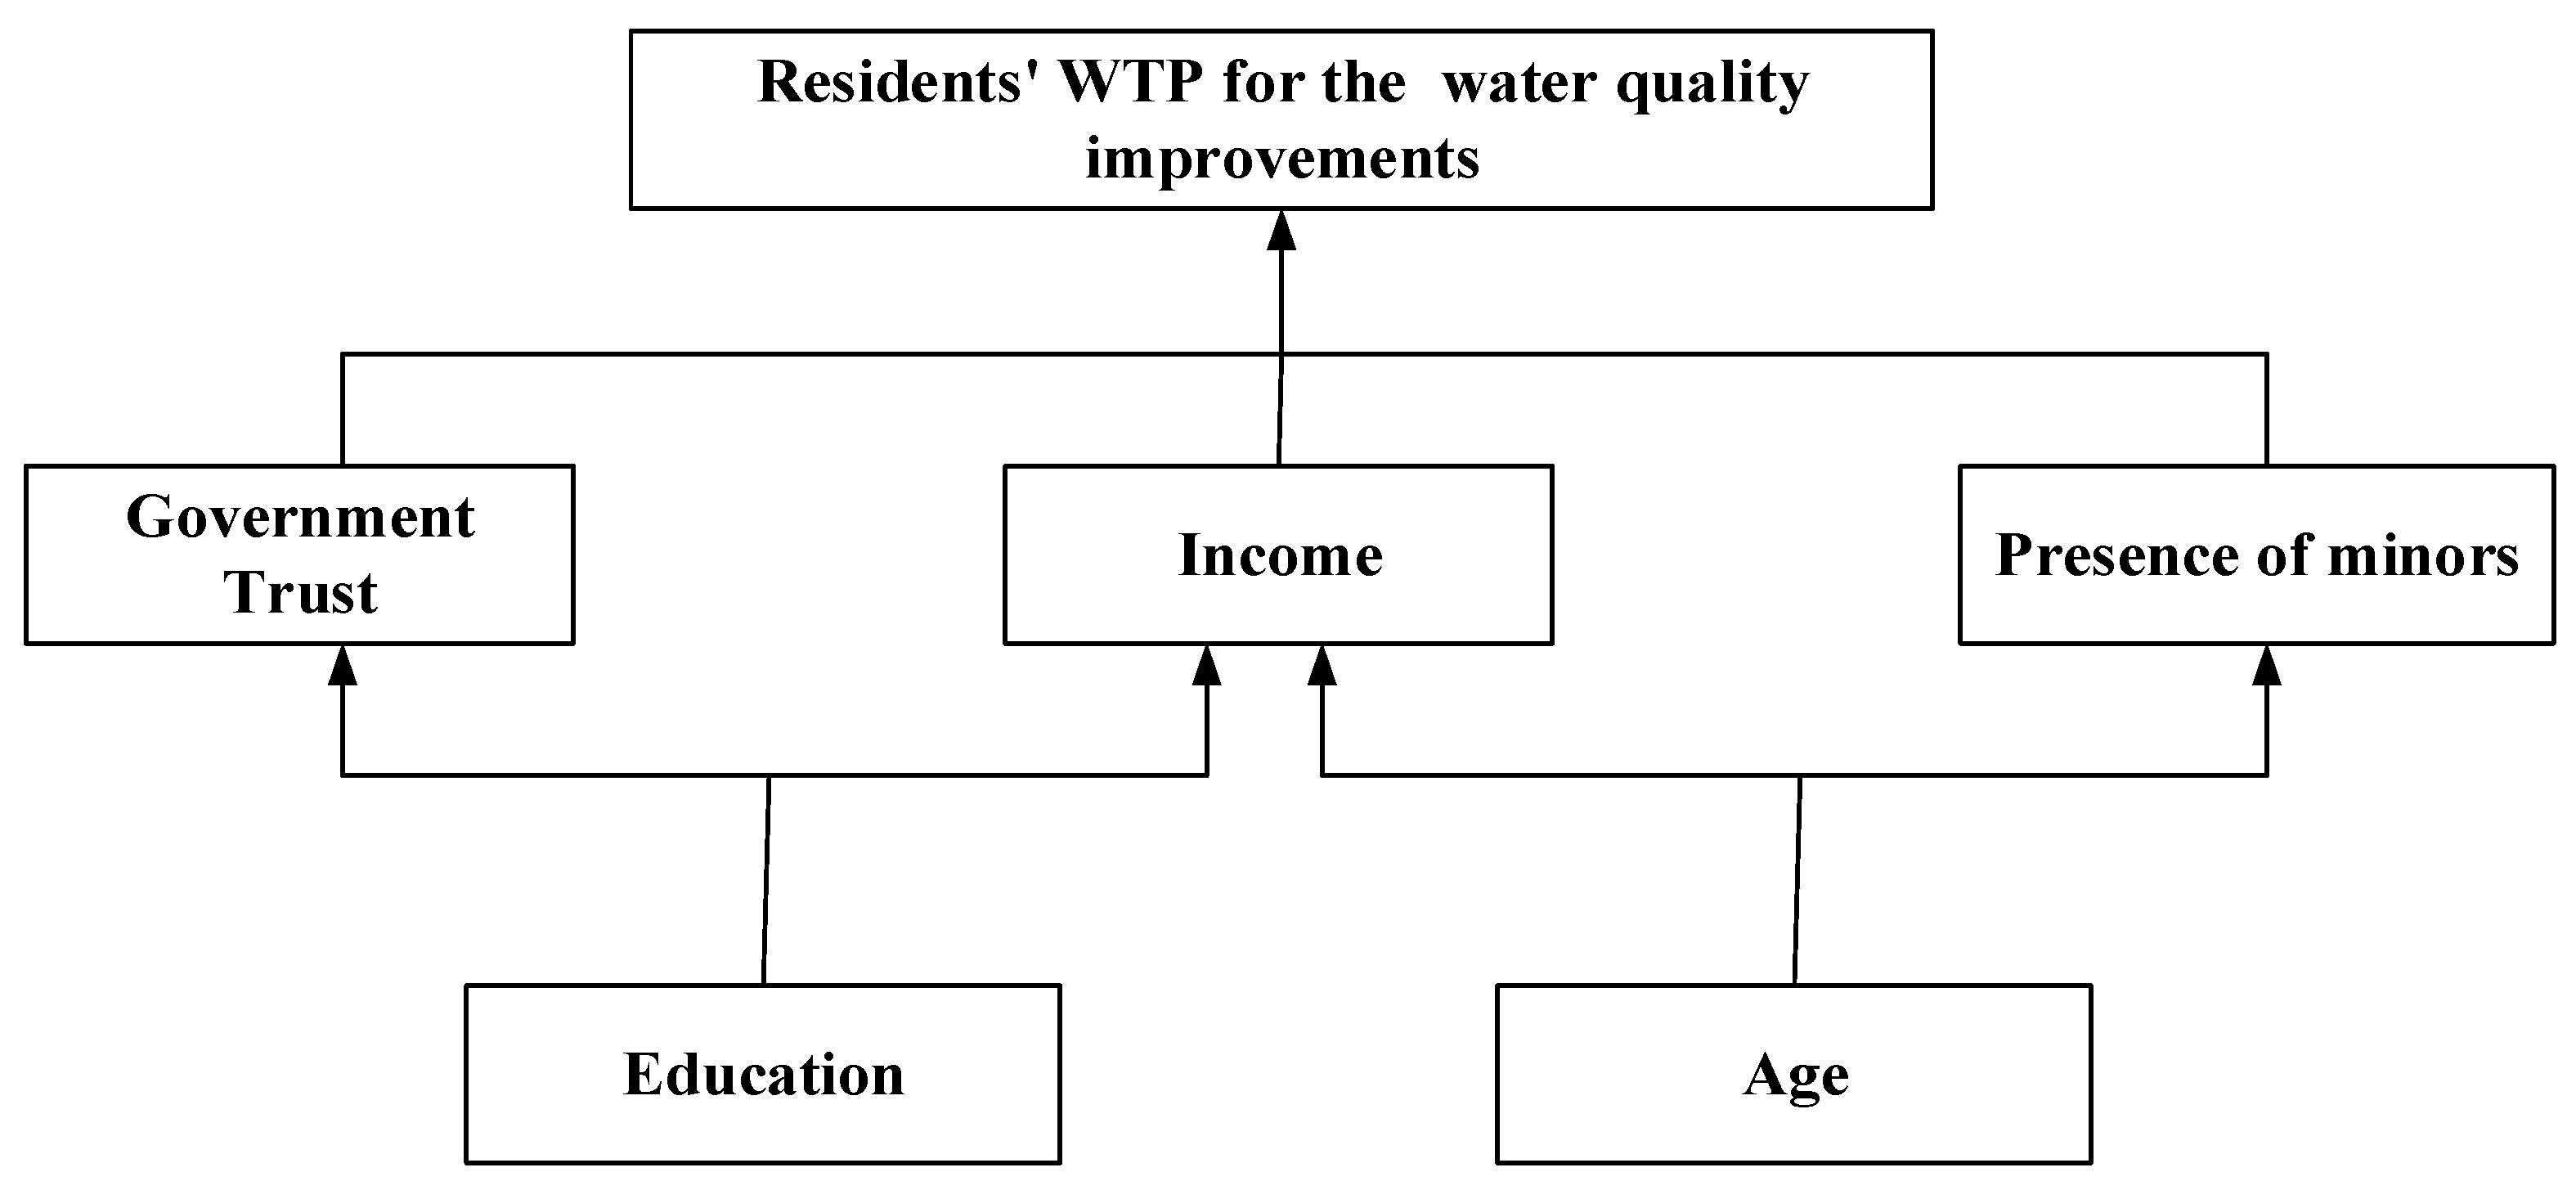
Figure 4 illustrates the mechanisms that impact residents’ inclination to participate in the enhancement of the water quality. The fundamental root factors include educational attainment, age, and ultimately, the residents’ willingness to participate in water quality improvements through indirect factors such as government trust, income level, and the presence of minors in the family. Generally, these factors are inter-related yet independent, forming a comprehensive influence mechanism. There are two specific paths that embody the influence mechanism: Path ①, education level → government trust, income level →WTP, and Path ②, age → presence of minors, income level → WTP. The more educated and younger the residents, the higher their income tends to be, and the more likely they are to be required to protect young children, making them more concerned about local government decisions, and thus the more willing they are to participate in water quality improvements. This indicates that residents’ willingness to participate is influenced by income, trust in the government, and the presence of minors, which are determined by various individual characteristics such as education and age.
4. Policy Implications
Based on the conclusions of this study, we propose the following policy recommendations: first, the publicity and education on protecting the water environment should be increased to improve residents’ understanding of the need for water quality improvements. On one hand, more residents can be made aware of the social and financial benefits of water quality improvements through face-to-face lectures and watershed observations. Meanwhile, we should use the model of propaganda demonstration and strongly encourage and guide more residents to participate in water environmental protection. Second, we found that residents’ government trust positively influences their WTP. That is to say, the greater the trust of residents in the government, the more they are willing to pay for water quality improvements. Therefore, the government should take the initiative to strictly regulate the management system for the use of governance funds and provide good water environment governance services; the government should also actively improve laws and regulations, open up participation channels, and improve the effectiveness of environmental governance, thereby enhancing residents’ government satisfaction and enthusiasm for environmental governance participation. Third, the government should enhance the development of water pollution infrastructure and implement a customized construction strategy. This involves focusing on the construction of water pollution control facilities based on the specific conditions of water pollution in different regions. For instance, in areas with a high population density, the government should prioritize the building of domestic sewage treatment plants, upgrade the sewage collection system, and maximize sewage recycling to promote water resource recycling. In areas with a low population density, the government should consider affordable and convenient sewage management options with limited energy consumption, such as artificial wetlands and land infiltration, to effectively protect water resources. Fourth, the government should adopt an individualized publicity and promotion plan for the WTP by utilizing different measures for different groups. This study indicates that age has a negative effect on WTP, suggesting that the elderly tend to pay less for water quality improvements. For younger residents, a combination of online and offline publicity methods, such as promotion through mobile phones, computers, television, knowledge contests, and lectures, should be utilized.
5. Conclusions
As one of the most important life support systems for human survival, the water environment not only provides essential resources for production and living but also has high aesthetic and cultural value. However, being the most susceptible part of the ecological environment, the water environment is highly vulnerable to pollution and damage caused by human activities. With the rapid process of urbanization, water pollution has become increasingly severe. In some regions, the water ecology has been destroyed, the water quality has worsened, and the water space has shrunk. This not only affects and impairs public health but also obstructs sustainable economic and social development. Thus, managing China’s water environment remains an arduous task, and it is imperative to promote treatment.
In recent years, a significant amount of research has been conducted by academics on water environment management. Many scholars have identified the primary cause of China’s water pollution as the excessive discharge of domestic sewage, industrial wastewater, and agricultural pollutants during the country’s economic and social development. As a result, research has been focused on governance system issues, models, subjects, and performance evaluation systems. Scholars have emphasized the need for a multifaceted and collaborative approach to water environment governance, highlighting that the government alone cannot solve environmental problems and that the public also needs to play a role. However, despite this focus on collaborative governance, studies have yet to explore public participation in water environment governance.
This study conducted a field survey in Haikou City, Hainan Province and used the double boundary dichotomous CVM and ISM to measure the social benefits of governance. It analyzed the key factors that affect the “residents’ WTP for the governance of polluted water” and explored the logical relationships and internal hierarchical structure of the significant factors. The results showed that the WTP for improving the water quality of urban residents in Haikou City is 194.2161 RMB per year, and the total annual value of Haikou water quality improvements would be at least 5.58 × 10⁸ RMB. The most important factors affecting the WTP are age, education level, income level, whether there are minors in the household, and the level of trust in the government. The ISM was used to conduct a hierarchical analysis of the factors affecting the residents’ WTP for water quality improvements. It was found that age and education level are the fundamental factors affecting the WTP for water quality improvements; having a minor family member, government trust, and income level are the superficial factors. These conclusions provide more practical and relevant guidance for water quality improvements in tropical China. This research examined the factors that affect people’s WTP for water quality improvements, not only in developing countries and economically challenged tropical regions but also in areas that have been overlooked for a long time. It further investigated the correlations and pathways of influence, which are uncommon topics in current studies about the WTP for water quality improvements. This study not only solidifies the theoretical framework of the study of factors influencing people’s WTP for water quality improvements and offers guidance for future studies at the theoretical level, it also probes the surface factors and the underlying causes of the factors that affect people’s WTP for water quality improvements at the practical level. To put it briefly, this paper’s main contribution is that it is applicable and precise and provides a more comprehensive and thorough understanding of the factors that affect residential water quality improvements.
Additionally, this study has some limitations. First, while conducting our research, we discovered that the respondents did not provide any response regarding their willingness to enhance the quality of water, which we referred to as ‘zero response’. This could have resulted in an overestimation of the final results during the analysis. However, eliminating a significant amount of zero responses would not just decrease the sample size but also produce a sampling bias by intentionally selecting favorable responses. This issue could be reduced in future studies through the use of the Spike Model or the Double-Hurdle Model. Second, there was inevitably heterogeneity among residents’ WTP for water quality improvements due to the different levels of pollution in different watersheds and in the upstream, midstream, and downstream areas of the same watershed. For example, the environmental status of upstream watersheds is usually better than that of downstream watersheds, so residents living in upstream watersheds are more likely to pay than those living downstream. In subsequent studies, the characteristics of respondents could be further subdivided to further explore the sources of heterogeneity in WTP for water quality and the possible reasons for it. Third, economic development and social environment changes may lead to continuous changes in residents’ lifestyles and behavioral choices which, in turn, may affect the factors influencing residents’ WTP for water quality improvements. Therefore, in subsequent studies, survey data could be tracked to further explore the changes in residents’ WTP for water quality improvements to obtain more robust results.
Author Contributions
Conceptualization, D.Q. and T.X.; Methodology, Q.H., S.X., Y.L., D.Q. and T.X.; Software, Q.H. and Y.L.; Validation, Q.H.; Formal analysis, Q.H. and S.X.; Investigation, S.X., Y.L., D.Q. and T.X.; Resources, D.Q. and T.X.; Data curation, Q.H. and Y.L.; Writing—original draft, Q.H., S.X. and Y.L.; Writing—review & editing, Q.H., S.X., D.Q., H.S. and T.X.; Visualization, Q.H.; Supervision, D.Q. and T.X.; Project administration, D.Q. and T.X.; Funding acquisition, D.Q., H.S. and T.X. All authors have read and agreed to the published version of the manuscript.
Funding
This study was supported by the National Natural Science Foundation of China (72003054; 72103052; 72203135); the Hainan Provincial Natural Science Foundation of China (722RC630; 720RC576); the Ministry of Education of Humanities and Social Science project (20YJC790114); the Innovation Capability Support Program of Shaanxi (2020KRM203); and the Shaanxi Philosophy and Social Science Research Project (2022HZ1796).
Institutional Review Board Statement
Not applicable.
Informed Consent Statement
Not applicable.
Data Availability Statement
The data analyzed in this study are subject to the following licenses/restrictions: The data are not publicly available due to personal privacy and the nonopen access status of the research program. Requests to access these datasets should be directed to Xu Tao, xutao_2013@outlook.com.
Conflicts of Interest
The authors declare no conflict of interest.
References
- Flynn, P.; Smith, T. Rivers, lakes and revenue streams: The heterogeneous effects of Clean Water Act grants on local spending. J. Public Econ. 2022, 212, 104711. [Google Scholar] [CrossRef]
- Hülsmann, S.; Sušnik, J.; Rinke, K.; Langan, S.; van Wijk, D.; Janssen, A.B.G.; Mooij, W.M. Integrated modelling and management of water resources: The ecosystem perspective on the nexus approach. Curr. Opin. Environ. Sustain. 2019, 40, 14–20. [Google Scholar] [CrossRef]
- Wang, Z.; Guo, J.; Ling, H.; Han, F.; Kong, Z.; Wang, W. Function zoning based on spatial and temporal changes in quantity and quality of ecosystem services under enhanced management of water resources in arid basins. Ecol. Indic. 2022, 137, 108725. [Google Scholar] [CrossRef]
- Zhang, P.; Ruan, H.; Dai, P.; Zhao, L.; Zhang, J. Spatiotemporal river flux and composition of nutrients affecting adjacent coastal water quality in Hainan Island, China. J. Hydrol. 2020, 591, 125293. [Google Scholar] [CrossRef]
- Zhang, Q.; Shen, J.; Sun, F. Spatiotemporal differentiation of coupling coordination degree between economic development and water environment and its influencing factors using GWR in China’s province. Ecol. Model. 2021, 462, 109794. [Google Scholar] [CrossRef]
- Pinto, F.S.; Simões, P.; Marques, R.C. Water services performance: Do operational environment and quality factors count? Urban Water J. 2016, 14, 773–781. [Google Scholar] [CrossRef]
- Gao, L.; Wang, Z.; Peng, X.; Su, Y.; Fu, P.; Ge, C.; Zhao, J.; Yang, L.; Yu, H.; Peng, L. Occurrence and spatial distribution of microplastics, and their correlation with petroleum in coastal waters of Hainan Island, China. Environ. Pollut. 2022, 294, 118636. [Google Scholar] [CrossRef]
- Zhang, Y.; Peter, M.I.; Ge, C.; Zhu, D. Landscape and land use in southern Hainan Island, China. Chin. Sci. Bull. 2001, 46, 102–104. [Google Scholar] [CrossRef]
- Hassenforder, E.; Clavreul, D.; Akhmouch, A.; Ferrand, N. What’s the middle ground? Institutionalized vs. emerging water-related stakeholder engagement processes. Int. J. Water Resour. Dev. 2018, 35, 525–542. [Google Scholar] [CrossRef]
- Mu, R.; Haershan, M.; Wu, P. What organizational conditions, in combination, drive technology enactment in government-led smart city projects? Technol. Forecast. Soc. Chang. 2022, 174, 121220. [Google Scholar] [CrossRef]
- Wang, R.Y.; Ng, C.N.; Qi, X. The Chinese characteristics of payments for ecosystem services: A conceptual analysis of water eco-compensation mechanisms. Int. J. Water Resour. Dev. 2019, 36, 651–669. [Google Scholar] [CrossRef]
- Wu, L.; Ma, T.; Bian, Y.; Li, S.; Yi, Z. Improvement of regional environmental quality: Government environmental governance and public participation. Sci. Total Environ. 2020, 717, 137265. [Google Scholar] [CrossRef] [PubMed]
- Aguilar, F.X.; Obeng, E.A.; Cai, Z. Water quality improvements elicit consistent willingness-to-pay for the enhancement of forested watershed ecosystem services. Ecosyst. Serv. 2018, 30, 158–171. [Google Scholar] [CrossRef]
- Hanley, N.; Adamowicz, W.; Wright, R.E. Price vector effects in choice experiments: An empirical test. Resour. Energy Econ. 2005, 27, 227–234. [Google Scholar] [CrossRef]
- Jianjun, J.; Wenyu, W.; Ying, F.; Xiaomin, W. Measuring the willingness to pay for drinking water quality improvements: Results of a contingent valuation survey in Songzi, China. J. Water Health 2016, 14, 504–512. [Google Scholar] [CrossRef] [Green Version]
- Polyzou, E.; Jones, N.; Evangelinos, K.I.; Halvadakis, C.P. Willingness to pay for drinking water quality improvement and the influence of social capital. J. Socio-Econ. 2011, 40, 74–80. [Google Scholar] [CrossRef]
- Saz-Salazar, S.; González-Gómez, F.; Guardiola, J. Valuing water supply infrastructure improvements using life satisfaction data as a complement to contingent valuation. Water Environ. J. 2019, 34, 401–413. [Google Scholar] [CrossRef]
- Tussupova, K.; Berndtsson, R.; Bramryd, T.; Beisenova, R. Investigating Willingness to Pay to Improve Water Supply Services: Application of Contingent Valuation Method. Water 2015, 7, 3024–3039. [Google Scholar] [CrossRef] [Green Version]
- Fontainhas, A.; Pires, J.; Carvalho, P.; Marques, R. Willingness to pay for the water supply service in Cape Verde—How far can it go? Water Supply 2016, 16, 1721–1734. [Google Scholar] [CrossRef] [Green Version]
- Basu, A.; Srinivasan, N. A Modified Contingent Valuation Method Shrinks Gain-Loss Asymmetry. J. Behav. Exp. Econ. 2021, 94, 101747. [Google Scholar] [CrossRef]
- Cooper, P.; Poe, G.L.; Bateman, I.J. The structure of motivation for contingent values: A case study of lake water quality improvement. Ecol. Econ. 2004, 50, 69–82. [Google Scholar] [CrossRef]
- Jørgensen, S.L.; Olsen, S.B.; Ladenburg, J.; Martinsen, L.; Svenningsen, S.R.; Hasler, B. Spatially induced disparities in users’ and non-users’ WTP for water quality improvements—Testing the effect of multiple substitutes and distance decay. Ecol. Econ. 2013, 92, 58–66. [Google Scholar] [CrossRef]
- Choi, D.S.; Ready, R.C.; Shortle, J.S. Valuing water quality benefits from adopting best management practices: A spatial approach. J. Environ. Qual. 2020, 49, 582–592. [Google Scholar] [CrossRef] [PubMed]
- Roldan, D.; Sarmiento, J.P.; Roldan-Arauz, F. Economic valuation meta-analysis of freshwater improvement in developed and developing countries. Are they different? J. Water Health 2021, 19, 736–749. [Google Scholar] [CrossRef] [PubMed]
- Guilfoos, T.; Hayden, S.; Uchida, E.; Oyanedel-Craver, V. WTP for water filters and water quality testing services in Guatemala. Water Resour. Econ. 2020, 31, 100139. [Google Scholar] [CrossRef]
- Zheng, H.; Nie, F.; Zhang, L.; Qu, C.; Siran, S. Differentiated WTP for improvement of water quality in Miyun Reservoir, Beijing. Desalination Water Treat. 2019, 168, 193–200. [Google Scholar] [CrossRef]
- Tanellari, E.; Bosch, D.; Boyle, K.; Mykerezi, E. On consumers’ attitudes and willingness to pay for improved drinking water quality and infrastructure. Water Resour. Res. 2015, 51, 47–57. [Google Scholar] [CrossRef]
- Liu, J.; Li, Y.; Lu, Y.; Fu, X.; Yan, S. Research on the influence factors of ubiquitous power Internet of things for promoting consumption of wind power based on fuzzy G1-ISM in China. Int. J. Electr. Power Energy Syst. 2020, 121, 106124. [Google Scholar] [CrossRef]
- Wu, H.; Niu, D. Study on Influence Factors of Electric Vehicles Charging Station Location Based on ISM and FMICMAC. Sustainability 2017, 9, 484. [Google Scholar] [CrossRef] [Green Version]
- López-Feldman, A. Introduction to contingent valuation using Stata. In Proceedings of the Mexican Stata Users’ Group Meetings 2013, Mexico City, Mexico, 3 May 2013. [Google Scholar]
- Bishop, R.C.; Mitchell, R.C.; Carson, R.T. Using Surveys to Value Public Goods: The Contingent Valuation Method. Conting. Valuat. Method 1989, 72, 153–163. [Google Scholar]
- Choi, K.S.; Lee, K.J.; Lee, B.W. Determining the value of reductions in radiation risk using the contingent valuation method. Ann. Nucl. Energy 2001, 28, 1431–1445. [Google Scholar] [CrossRef]
- Chung, Y.-S.; Chiou, Y.-C. Willingness-to-pay for a bus fare reform: A contingent valuation approach with multiple bound dichotomous choices. Transp. Res. Part A Policy Pract. 2017, 95, 289–304. [Google Scholar] [CrossRef]
- Malinauskaite, L.; Cook, D.; Davídsdóttir, B.; Ögmundardóttir, H.; Roman, J. Willingness to pay for expansion of the whale sanctuary in Faxaflói Bay, Iceland: A contingent valuation study. Ocean. Coast. Manag. 2020, 183, 105026. [Google Scholar] [CrossRef]
- Warfield, J.N. Binary Matrices in System Modeling. IEEE Trans. Syst. Man Cybern. 1973, SMC-3, 441–449. [Google Scholar] [CrossRef] [Green Version]
- Qiao, D.; Xu, S.; Xu, T.; Hao, Q.; Zhong, Z. Gap between Willingness and Behaviors: Understanding the Consistency of Farmers’ Green Production in Hainan, China. Int. J. Environ. Res. Public Health 2022, 19, 11351. [Google Scholar] [CrossRef]
- Qiao, D.; Li, N.; Cao, L.; Zhang, D.; Zheng, Y.; Xu, T. How Agricultural Extension Services Improve Farmers’ Organic Fertilizer Use in China? The Perspective of Neighborhood Effect and Ecological Cognition. Sustainability 2022, 14, 7166. [Google Scholar] [CrossRef]
- Grazhdani, D. Contingent Valuation of Residents’ Attitudes and Willingness-to-Pay for Non-point Source Pollution Control: A Case Study in AL-Prespa, Southeastern Albania. Environ. Manag. 2015, 56, 81–93. [Google Scholar] [CrossRef]
- He, J.; Sun, X.; Zhu, X. Spatial disparities of the willingness of the residents to pay for the wetland restoration of Taihu Lake and its integration into decision making: A case study on Wuxi, China. Environ. Monit. Assess. 2015, 187, 492. [Google Scholar] [CrossRef]
- Cheng, P.; Tang, H.; Zhu, S.; Jiang, P.; Wang, J.; Kong, X.; Liu, K. Distance to river basin affects residents’ willingness to pay for ecosystem services: Evidence from the Xijiang river basin in China. Ecol. Indic. 2021, 126, 107691. [Google Scholar] [CrossRef]
- Thapa, S.; Shrestha, S.; Adhikari, R.K.; Bhattarai, S.; Paudel, D.; Gautam, D.; Koirala, A. Residents’ willingness-to-pay for watershed conservation program facilitating ecosystem services in Begnas watershed, Nepal. Environ. Dev. Sustain. 2021, 24, 7811–7832. [Google Scholar] [CrossRef]
| Disclaimer/Publisher’s Note: The statements, opinions and data contained in all publications are solely those of the individual author(s) and contributor(s) and not of MDPI and/or the editor(s). MDPI and/or the editor(s) disclaim responsibility for any injury to people or property resulting from any ideas, methods, instructions or products referred to in the content. |
© 2023 by the authors. Licensee MDPI, Basel, Switzerland. This article is an open access article distributed under the terms and conditions of the Creative Commons Attribution (CC BY) license (https://creativecommons.org/licenses/by/4.0/).


