Article

Assessing Heavy Metal Contamination Using Biosensors and a Multi-Branch Integrated Catchment Model in the Awash River Basin, Ethiopia

1
Geology Department, State University of New York at Cortland, Cortland, NY 13045, USA
2
Oxford Molecular Biosensors, Centre for Innovation and Enterprise, Begbroke, Oxford OX5 1PF, UK
3
Africa Center of Excellence for Water Management, ACEWM, Addis Ababa University, Addis Ababa P.O. Box 1176, Ethiopia
4
Water and Land Resource Center, WLRC, Addis Ababa University, Addis Ababa P.O. Box 1176, Ethiopia
5
Water Resource Associates, Wallingford OX10 3XA, UK
6
School of Geography and the Environment, University of Oxford, Oxford OX1 3QY, UK
*
Author to whom correspondence should be addressed.
Water 2023, 15(23), 4073; https://doi.org/10.3390/w15234073
Submission received: 10 September 2023 / Revised: 5 November 2023 / Accepted: 17 November 2023 / Published: 24 November 2023
(This article belongs to the Special Issue Water Quality Assessment and Modelling)

Abstract

:
Metal pollution in rivers from untreated industrial and domestic wastewater is a major issue in economically developing countries worldwide. The Awash River Basin in Ethiopia is one of those rivers that faces rising heavy metal concentrations due to poor wastewater management and loose law enforcement controlling effluent discharge into rivers. In this study, surface water and wastewater samples were collected within the Awash River Basin, with metals analysis using ICP-MS techniques. Acute toxicity of water was determined using new molecular biosensor technology based on engineered luminescent bacteria. A multi-branch Integrated Catchment Model (INCA) for metals, including Arsenic, Cadmium, Chromium, Copper, Lead, Manganese, and Zinc was applied to the Awash River Basin to simulate the impact of tannery discharge on the river water pollution levels and to evaluate a set of treatment scenarios for pollution control. Results show that all samples from tannery wastewater have high levels of metals, such as Chromium and Manganese with high levels of toxicities. River water samples from upper Awash near Addis Ababa showed elevated concentrations of heavy metals due to the untreated wastewater from the dense population and a large number of industries in that area. The modeling scenarios indicate that improved wastewater management will reduce the metal concentration significantly. With a 50% reduction in effluent concentrations, the mean concentrations of heavy metals (such as Chromium) over two years would be able to reach 20 to 50% reduction in river water samples.

1. Introduction

Contamination of surface waters from heavy metals in industrial and domestic effluents is a common feature in many economically developing countries. Human activities, such as intensive agriculture and irrigation, urbanization, and industrialization create major issues for pollution control and, if not managed correctly, can cause major harm to river water quality and ecology and threaten public water supplies [1,2,3,4,5,6,7]. Consequently, in developing nations, water scarcity due to the water pollution of rivers and lakes represents a major challenge [8]. The UN Sustainable Development Goals (SDG 6.3) directly address this issue to close the gap on water scarcity, water quality, and pollution in order to protect the health of people and livestock, as well as to maintain and enhance livelihoods, especially of poor people, women, and children.
In Ethiopia, industrialization, urbanization, and human settlement are increasingly intense, especially around the major cities such as Addis Ababa. The impact on clean water resources from anthropogenic activities has been growing due to poor wastewater management, few monitoring systems, and weak enforcement of pollution control strategies [9,10,11]. In addition, there are many technical issues, for example, conventional treatment plants are not generally capable of removing emerging pollutants such as pesticides, pharmaceuticals, or heavy metal wastes. Heavy metal pollution in rivers is a major threat to stream ecology and human health due to metal persistence and toxicity [12,13,14,15,16]. Exposure to elevated concentrations of heavy metals, such as Chromium, Mercury, Lead, Arsenic, Cadmium, and other trace metals may cause cancer, retard human development, productivity and can cause severe health and environmental effects and also in extreme cases, death [17,18,19,20,21].
This paper focuses on the Awash River Basin in Ethiopia and, in particular, the upper reaches of the river where there are major discharges of partially treated or untreated industrial and domestic wastes. Tannery effluents are of serious concern and are typically characterized as pollution-intensive industrial complexes that generate widely varying high-strength wastewater [16,22,23]. Degradation of surface waters due to wastewater is becoming a serious problem as most of the industries in the basin are situated along the Awash or its tributaries including Modjo and Akaki Rivers. These then deliver polluting waters into the main river system, thereby degrading the river water of Awash.
Determination of heavy metals in waters has been a challenging task in Ethiopia, due to the lack of conventional instruments (ICP-MS, ICP-OES, GC-MS, UV, X-ray absorption spectroscopy), new technology (biosensors), and skilled professionals. This research provided the first comprehensive investigation of the Awash River Basin focusing on metals and water toxicity using ICP-MS and biosensors. In addition, a flow and water quality model INCA (Integrated Catchment) was applied to assess the metals and toxicity data and to simulate the Upper and Middle Awash River system. The model was used to investigate the effects of the tannery discharges, assess impacts on river water quality, and evaluate the effluent treatment levels required to meet international instream quality standards.

2. Study Area and Methods
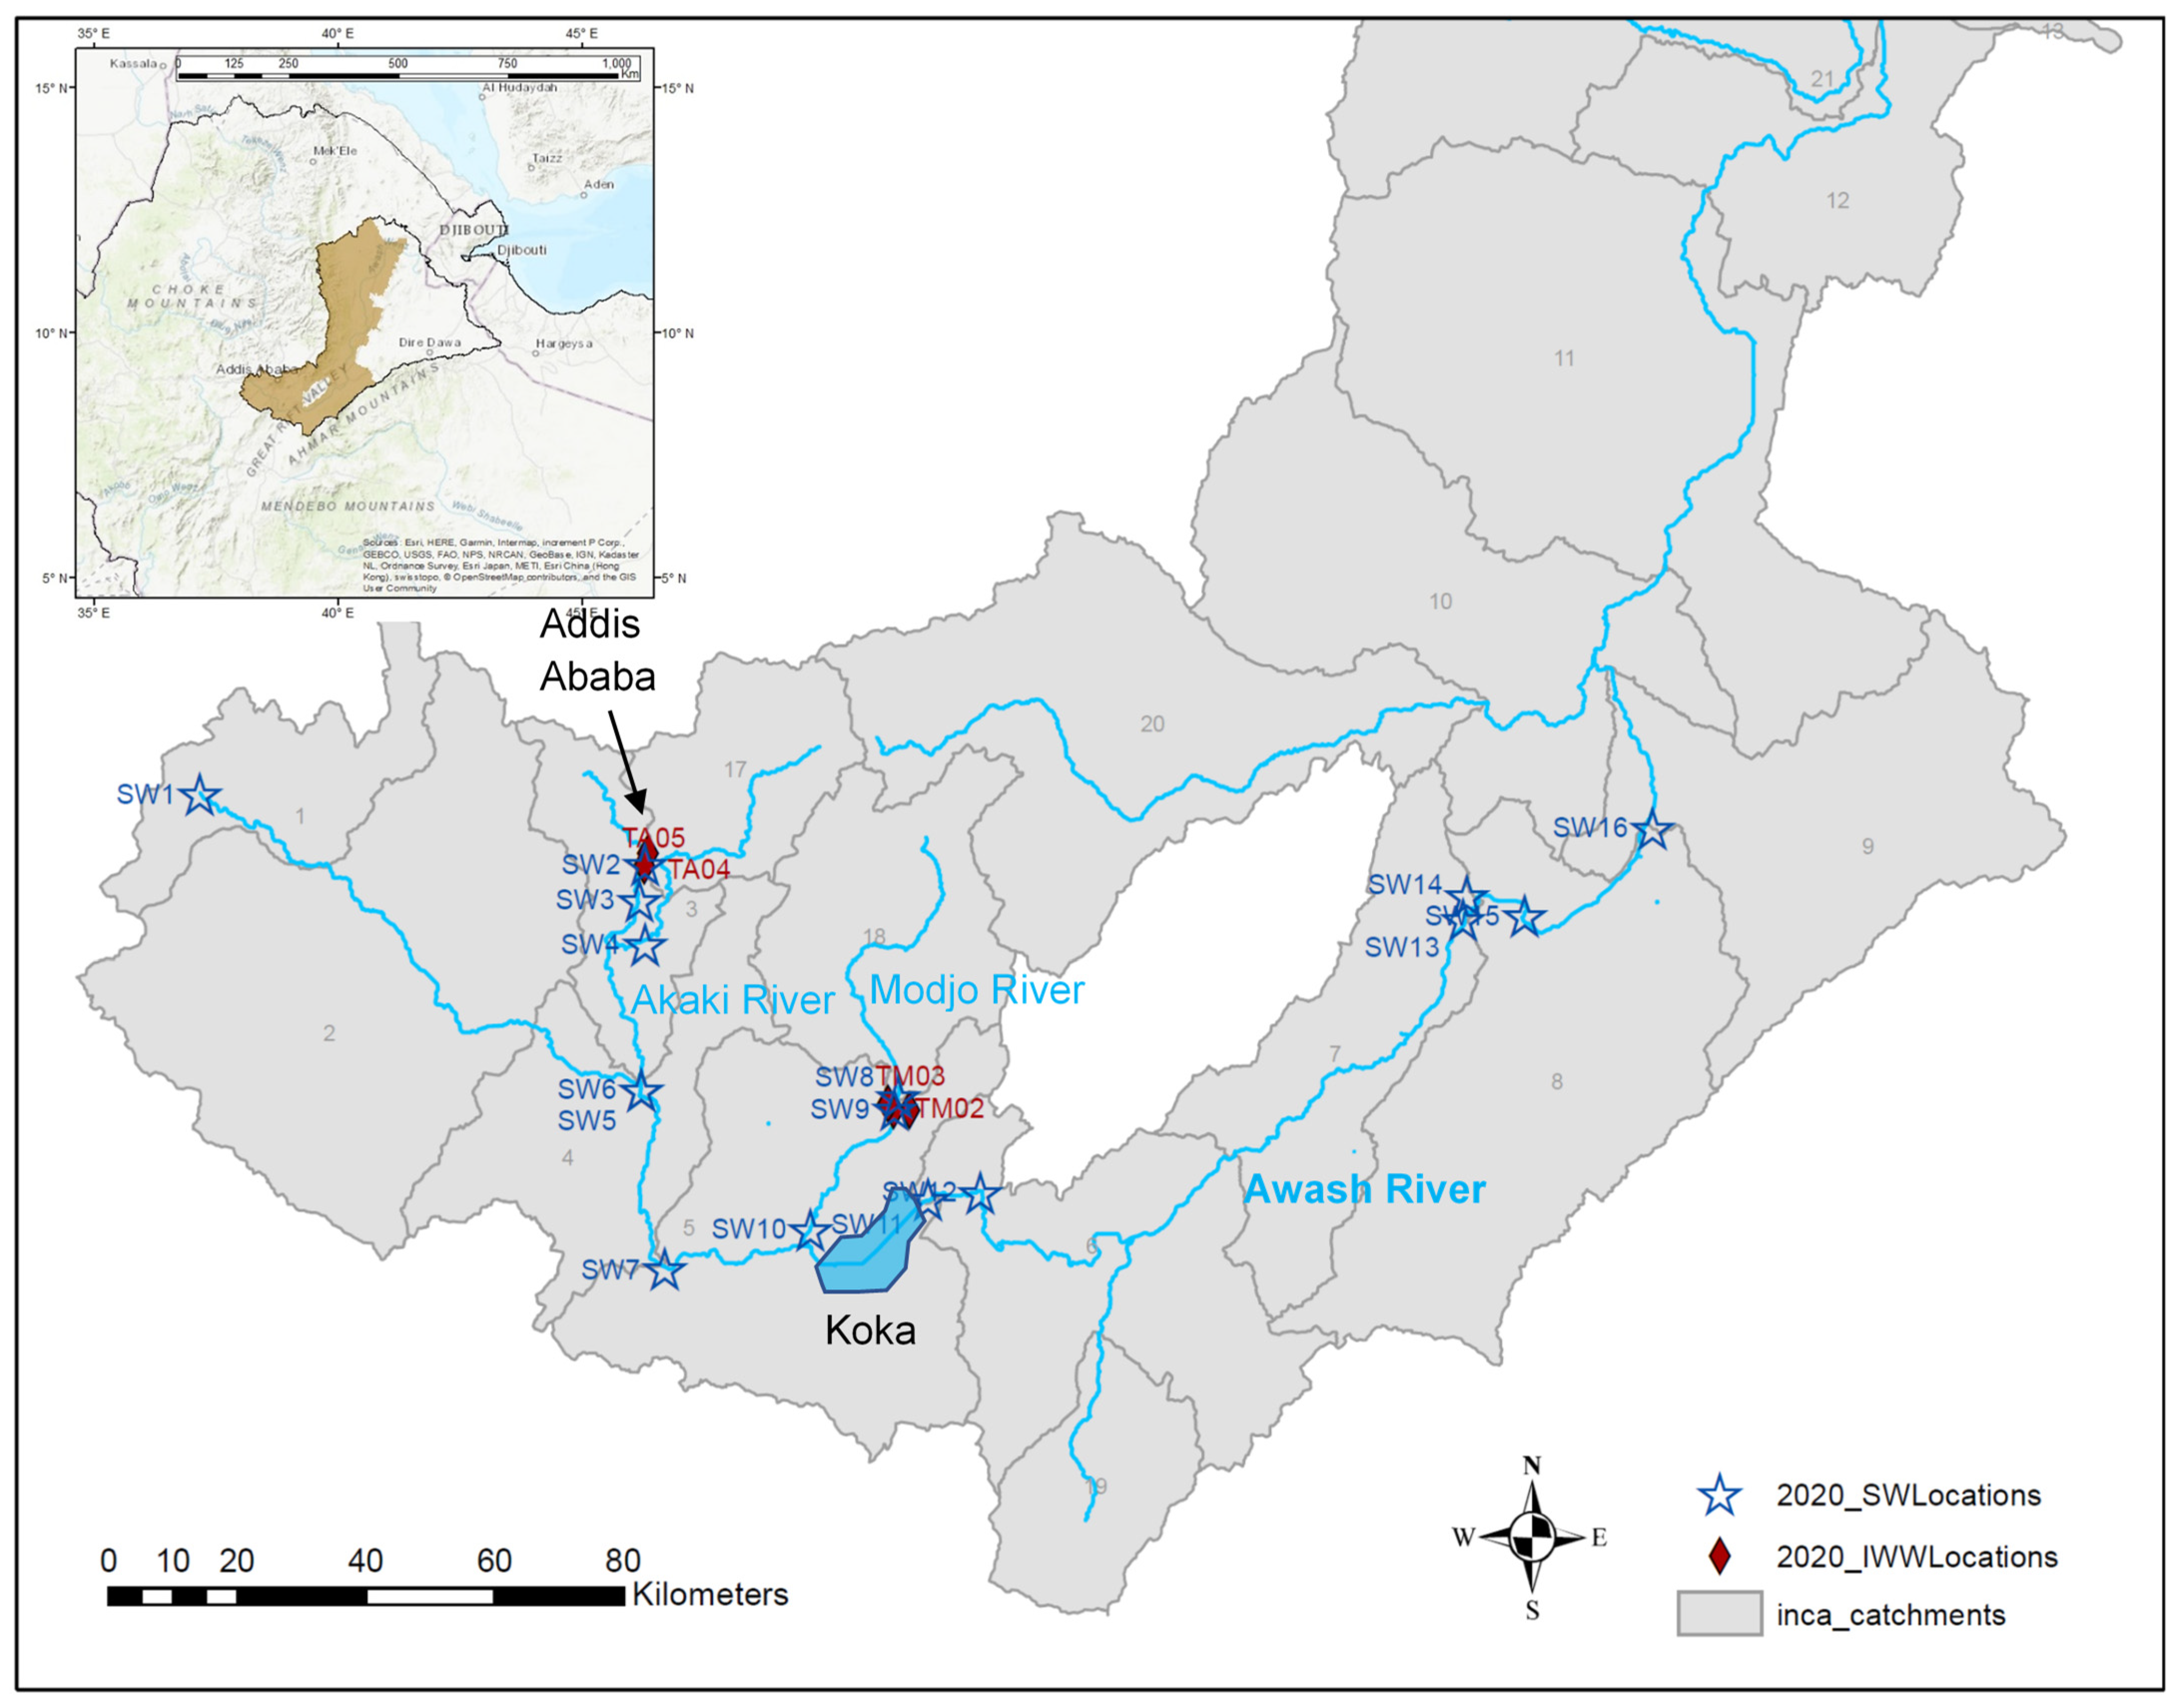
2.1. Study Area

The Awash River, 1200 km long, is one of the twelve rivers in Ethiopia (Figure 1). It originates near Ginichi town, which is located to the west of the capital Addis Ababa, and flows through the Rift Valley until it reaches Lake Abe on the border shared by Ethiopia and Djibouti. The Awash River Basin is characterized by highlands escarpments and rift valley, with an elevation ranging from 3000 to 250 m a.s.l. The entire Awash River Basin covers a total area of 116,200 km2, with the western catchment comprising 70,800 km2 that drains into the main Awash River. In contrast, the eastern catchment (45,400 km2) drains into a desert area and does not contribute flow to the main river course [24]. Thus, the eastern catchment is not considered in this study.
The recent development in the Awash River Basin such as industrialization, urbanization, and small and large-scale farming makes the Awash the most developed river basin in Ethiopia and the basin accounts for 25% of the agricultural production of the country. The upper catchment including the national capital, Addis Ababa, is densely populated. The basin comprises more than 12,500 industries and more than 65% of industries are located in the upper catchment, upstream of Koka Dam. Given the location of the industries, sampling collections were mainly focused on the upper catchment and middle valleys of the Awash River Basin (Figure 1). The modeling effort has been applied to the entire Awash River Basin so that the impact of the effluent could be assessed immediately after the discharge points as well as at the downstream sites.

2.2. Sampling and Metals Analysis
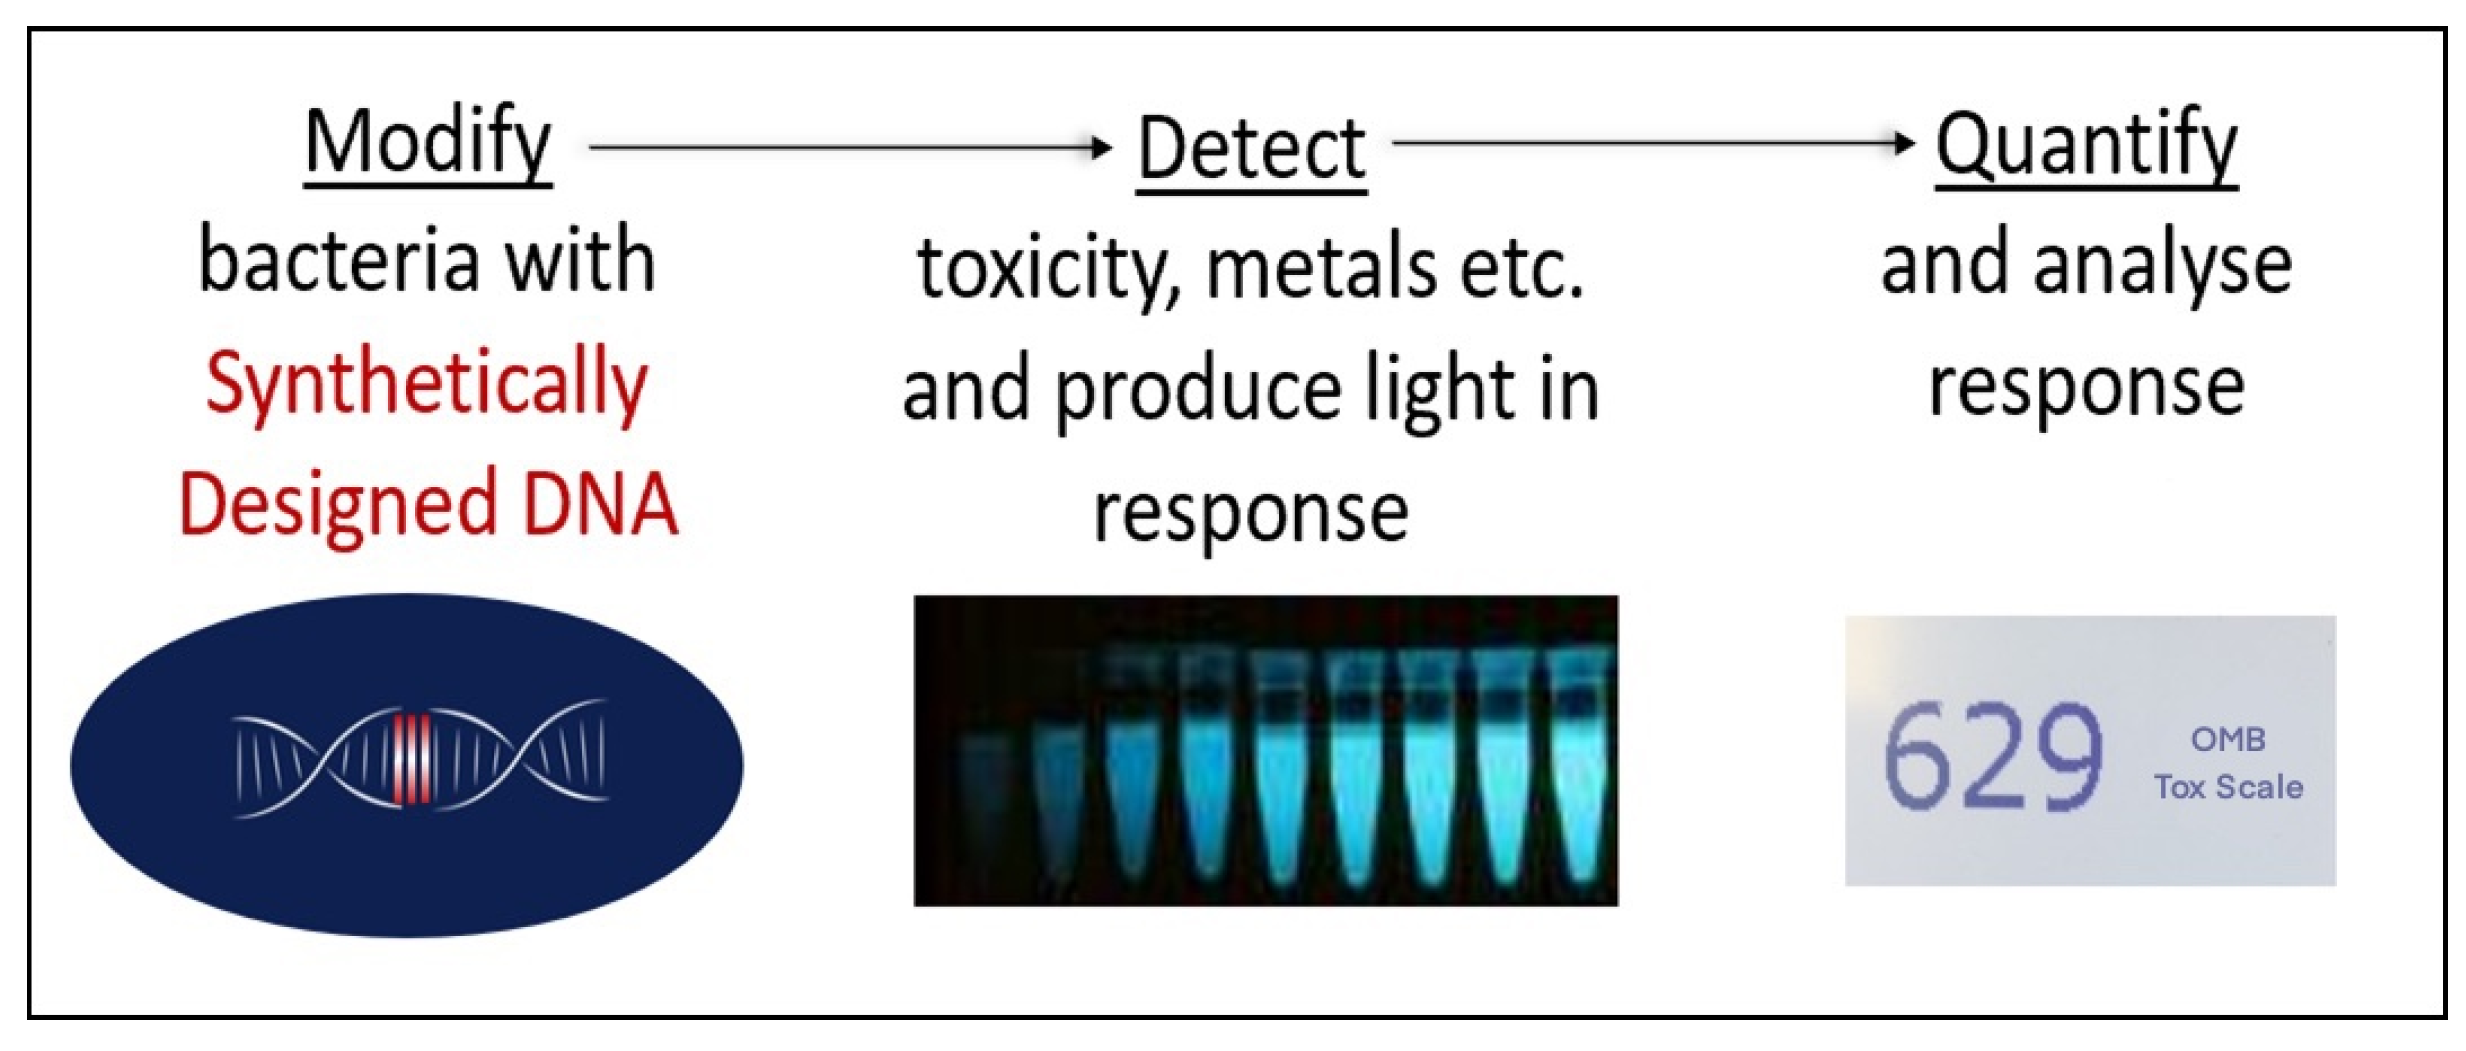
Twenty-one samples were collected from sixteen surface water locations and five industrial wastewater effluents in 2020 (Figure 1).
After sample collection in the field, they were acidified before analysis, which allowed equilibrium overnight to permit the re-dissolution of any precipitates or materials adsorbed to the bottles. Over 30 heavy metals were analyzed by inductively coupled plasma mass spectrometry (ICP-MS) using a PerkinElmer Nexion 2000B instrument, which was coupled with an Elemental Scientific prepFAST M5 autosampler at the University of Oxford. The instrument was calibrated using the method of external calibration where the concentrations for the measured sample set were extrapolated from linear regressions generated from raw counts per second data from a series of standards. Specifically, for each element, a six-point calibration curve was created by measuring the ion count of six known concentrations and applying linear regression. Two commercial references were used to validate the calibration curves. Commercial references are commercially available solutions that are independent of the calibration solutions, with certified concentrations of a range of elements. The detection limits of each element are given in Table 1.

2.3. Biosensors

Molecular biosensors are bacterially derived sensors that determine the bioavailability of both specific chemicals and the overall toxic effect. These biosensors have been developed and provided by Oxford Molecular Biosensors, a spinout company from the University of Oxford (www.omb.co.uk, accessed on 1 June 2023). For this study, we employed a metabolic-based acute toxicity sensor, Acinetobacter baylyi ADP1 Tox2, which has previously successfully demonstrated the presence of cell damage or cytotoxicity in heavy metal-contaminated seawater [25] and river water [16]. The soil bacterium-based biosensor has been engineered, using a synthetic biology approach, to luminesce brightly in low-toxicity samples, and dimly in cytotoxic conditions, as illustrated in Figure 2. They sensitively respond at very low concentrations of toxic pollutants, with resolution over several orders of magnitude. Certain bacteria such as Vibrio fischeri naturally bioluminesce and have been used commercially for the detection of toxicity in freshwater toxicity detection for decades by companies such as Microtox [26,27], however, engineered whole-cell biosensors that are genetically designed for heightened sensitivity and detection of individually toxic components are new to the market. The OMB biosensor testing protocol utilizes positive and negative controls in every assay, allowing comparison between assays and a semi-quantitative result proportional to toxicity. This can then be calibrated against known concentrations of cytotoxicants for comparison, for example, Zinc.
The acute toxicity biosensor is important in determining water quality from an ecology standpoint and also to inform public supplies. Biosensor assays are rapid, taking less than one hour and so they are uniquely placed to act as an early warning of toxic pollution. The yellowstripe goby fish, Mugilogobius chulae, is often used as a model for toxicity. When the cytotoxicity biosensor was compared with the goby results, they were found to be comparable, demonstrating that the biosensor system can function as a proxy for cytotoxicity assessments in animal models [25]. The biosensor output encompasses the presence and bioavailability of toxicity, precluding the need to use multiple sensors and hence it can be used to determine whether further testing is required. It can test both fresh and saline water without additional pre-treatment, allowing more powerful comparisons between samples and flexibility of testing. The biosensor data in this study was collected and analyzed with reference to the metals data in order to ascertain the presence of any trends or patterns that might be important in the assessment of pollution around the Awash River Basin.
Samples collected at the same 21 locations (Figure 1) were passed through a 0.2 uM filter before being challenged against the acute toxicity biosensor for 30 min. A positive control of 0.4 mM Zinc from Zinc Chloride is included as a known toxicant for reference. Results were then standardized to the negative control, 0.01 M sterile phosphate-buffered saline (PBS), and expressed as a percentage. Values above 110% (100% plus one standard deviation) were considered stimulatory; and values below 90% (100% minus one standard deviation) were considered toxic, with magnitude increasing as values decrease. When the tested value is significantly lower than the control, cell metabolism is inhibited, and toxicity is implied. When the tested value is significantly higher than the control, the result can be considered ‘stimulatory’. This may be a result of hormesis, whereby the concentration of toxic compound(s) is below the threshold for toxicity, and instead has a beneficial or stimulatory effect on an organism [28]. The adage of ‘the dose makes the poison’ attributed to Swiss philosopher Paracelcus implies that toxicity is just a matter of dose. It is also possible that when perturbed, the cell mounts a response to the mixture by mobilizing energy reserves [29]. Therefore, stimulation of luminescence may suggest an early form of toxicity to a surmountable response, or a positive stimulation/beneficial effect.

2.4. INCA-Metals Application to the Awash River Basin

The Integrated Catchment Model (INCA) is a dynamic, daily time-step, catchment scale process-based model to calculate pollutant transfer from both diffuse sources and point sources to the catchment outlet. INCA model was originally created to simulate nitrogen [30]. Over the past two decades, new versions of INCA models were developed such as INCA-Metals [31]. The updated INCA-Metals model has a multibranch structure which allows it to simulate the in-stream metal concentrations in the dendric stream network [32].
INCA-Metals is a mass-balance dynamic model that estimates the daily fluxes and concentrations of flow, ammonia, cyanide, and eight metals (Cadmium, Lead, Zinc, Mercury, Arsenic, Copper, Chromium, and Manganese) based on 1 km2 cell. The flow and metals are simulated by accounting for contributions from various inputs and transformations in the soil, groundwater, and rivers. The processes for INCA-Metals are based on those included in the Integrated Catchment model of Nitrogen but have been adapted to represent the metal adsorption to sediment, cyanide decay to ammonium, and cyanide volatilization [32]. The sources of pollutant inputs to the model include point sources such as abstractions, waste dumps, treated or untreated waste effluent as well as diffuse pollution from rural runoff. The hydrology component of the model is the same as other INCA models where the river flow is generated by the soil flow, direct runoff flow, and groundwater flow [33]. Detailed equations for calculating flow and metal chemical fluxes can be found in Whitehead et al. [32]
The INCA models (Chloride, Nitrogen, and Phosphorus version) have already been applied to the Awash basin [34,35], however, this study is the first INCA application of the metals. The same INCA setup implemented in Bussi et al. [35] and Jin et al. [34] has been used here. To simulate flow and metal concentrations in the Awash River using INCA, the catchment was divided into 24 sub-catchments (Figure 1, shows the upper and middle Awash Basin), following the same setup as in Jin et al. [34]. The sub-catchment/reach boundaries were selected at confluences, effluent discharges, flow stations, and water quality monitoring stations, using the same principle as other INCA applications. Sub-catchments were delineated using a digital elevation model (DEM) in ArcGIS, which was obtained from the Shuttle Radar Topography Mission (SRTM) [34,35,36]. The land use information was from the GlobCover Portal and the most updated dataset from January to December 2009 was used in this study [34,35,37]. For the Awash River Basin application, six land use classes including arable, grassland/mixed, forest, water, bare, and urban were selected. The percentage of each land use class, sub-catchment area, and reach river length were calculated for each sub-catchment in ArcGIS which were used as INCA basic inputs that describe river network topology, reach characteristics, and sub-catchment characteristics.
Hydrological inputs to INCA include daily time series of precipitation, temperature, hydrologically effective rainfall (HER), and soil moisture deficit (SMD). HER and SMD are estimated using the Precipitation, Evapotranspiration, and Runoff Simulator for Solute Transport (PERSiST) model, which is a conceptual, daily time-step, semi-distributed model designed primarily for use with the INCA models [34,38]. In this study, daily rainfall data were acquired from the Climate Hazards Group Infrared Precipitation with Stations v2.0 (CHIRPS) [11,39]. Daily temperature data were obtained from a network of local weather stations. Both precipitation and temperature were acquired for the period between 1981 and 2021.
The Awash River Basin was divided into three climate zones: Upper Awash, Middle Awash, and Lower Awash to account for spatial variation of rainfall and temperature. To calculate average daily rainfall and temperature, the same procedure applied to Bussi et al. [35] and Jin et al. [34] were used in this study. A gridded dataset (10 × 10 km) of daily precipitation and temperature was created to compute the average of all the 10 × 10 km cells within each of the climate zones. The daily time series of HER and SMD between 1981 and 2021 were then generated by PERSiST for the Upper, Middle, and Lower catchments.

3. Results and Discussions

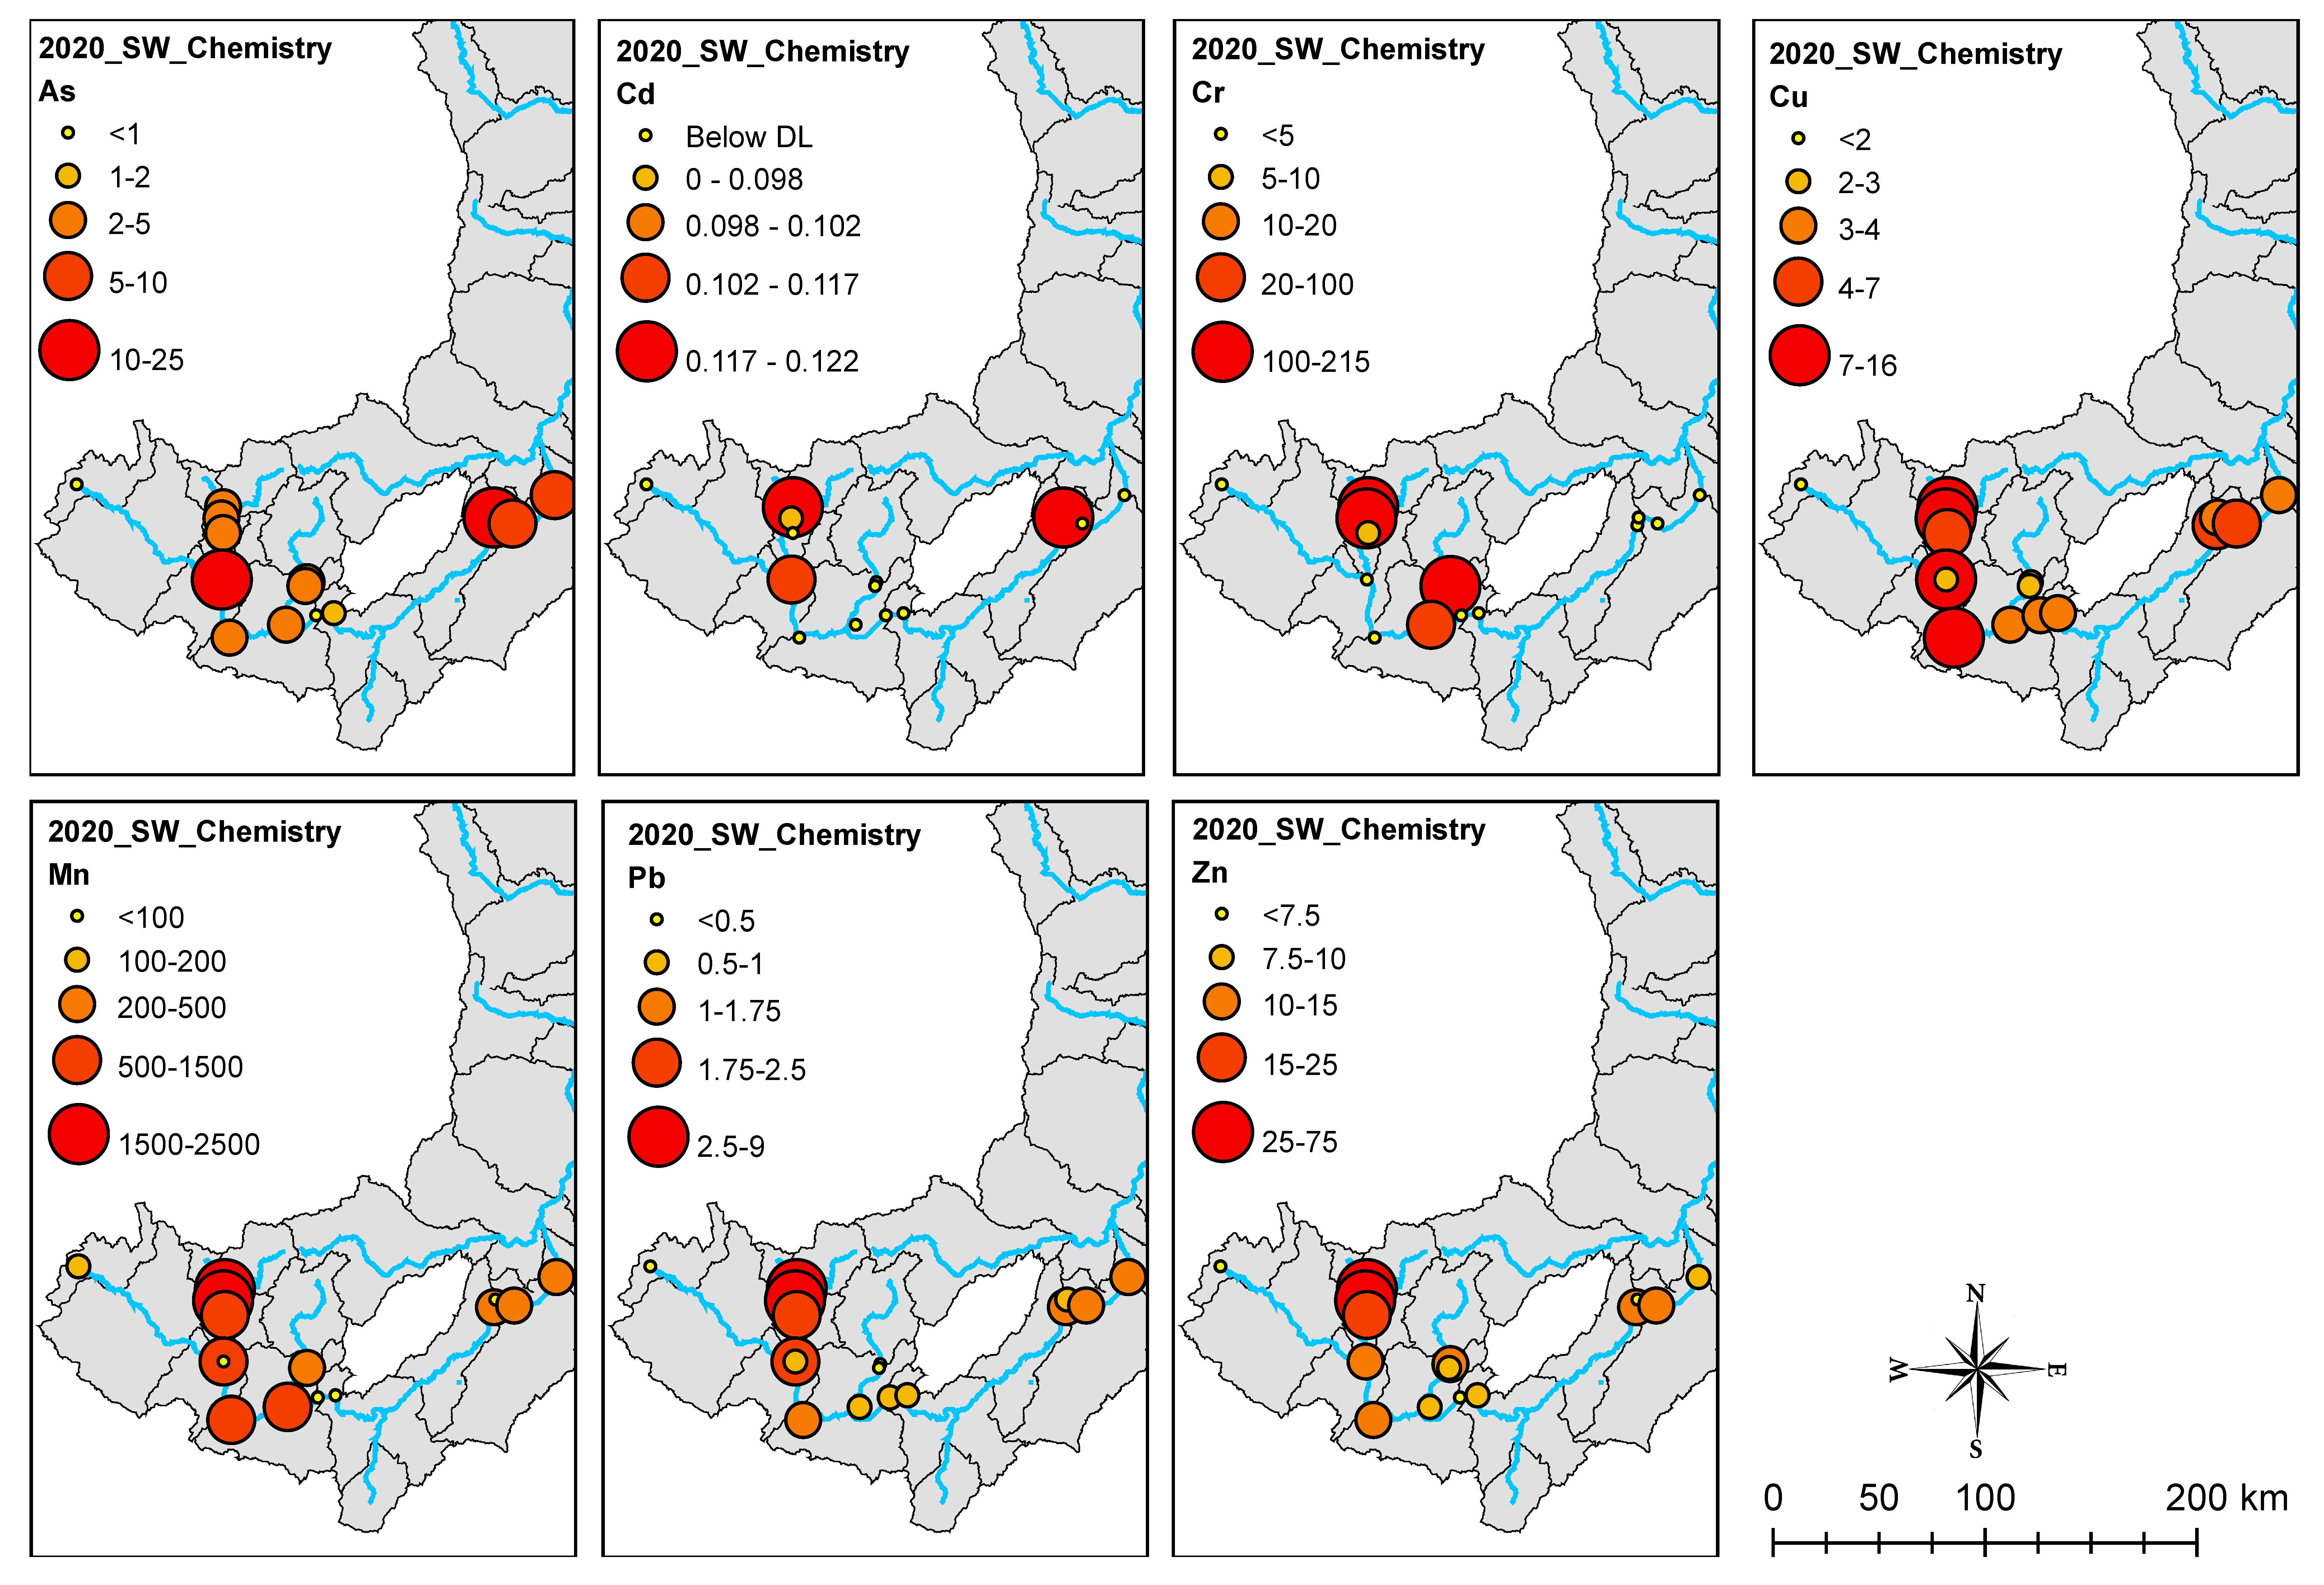
3.1. Metal Pollution in Awash River Basin

The metals results for sixteen locations along the river and five tanneries are shown in Table 1. The results indicate high concentrations of Chromium (Cr), Lithium (Li), and Cobalt (Co) in the tannery discharges, with these resulting in high concentrations in the downstream tributaries and river locations. For the river samples, at least one sample had concentrations of Iron (Fe), Aluminum (Al), Chromium (Cr), Manganese (Mn), Molybdenum (Mo), or Arsenic (As) that were higher than the WHO limits (Table 1). Specifically, for Mn, the majority of the samples (12 out of 16) exceeded the WHO limit. For As, two of out sixteen river samples had concentrations over the WHO limit. For Copper (Cu), Zinc (Zn), Cadmium (Cd), Mercury (Hg), and Lead (Pb), all samples were below the WHO limits.
Metal concentrations along the Awash River vary significantly (Figure 3). Concentrations of Cadmium, Chromium, Copper, Manganese, Lead, and Zinc were highest near the city of Addis Ababa reflecting the dense population and large number of industries in that area. Concentrations of Arsenic and Cadmium are high at the downstream locations in the middle Awash. This could be due to the mixing of the Beseka Lake water that is supported primarily by groundwater with high heavy metal concentrations [40].

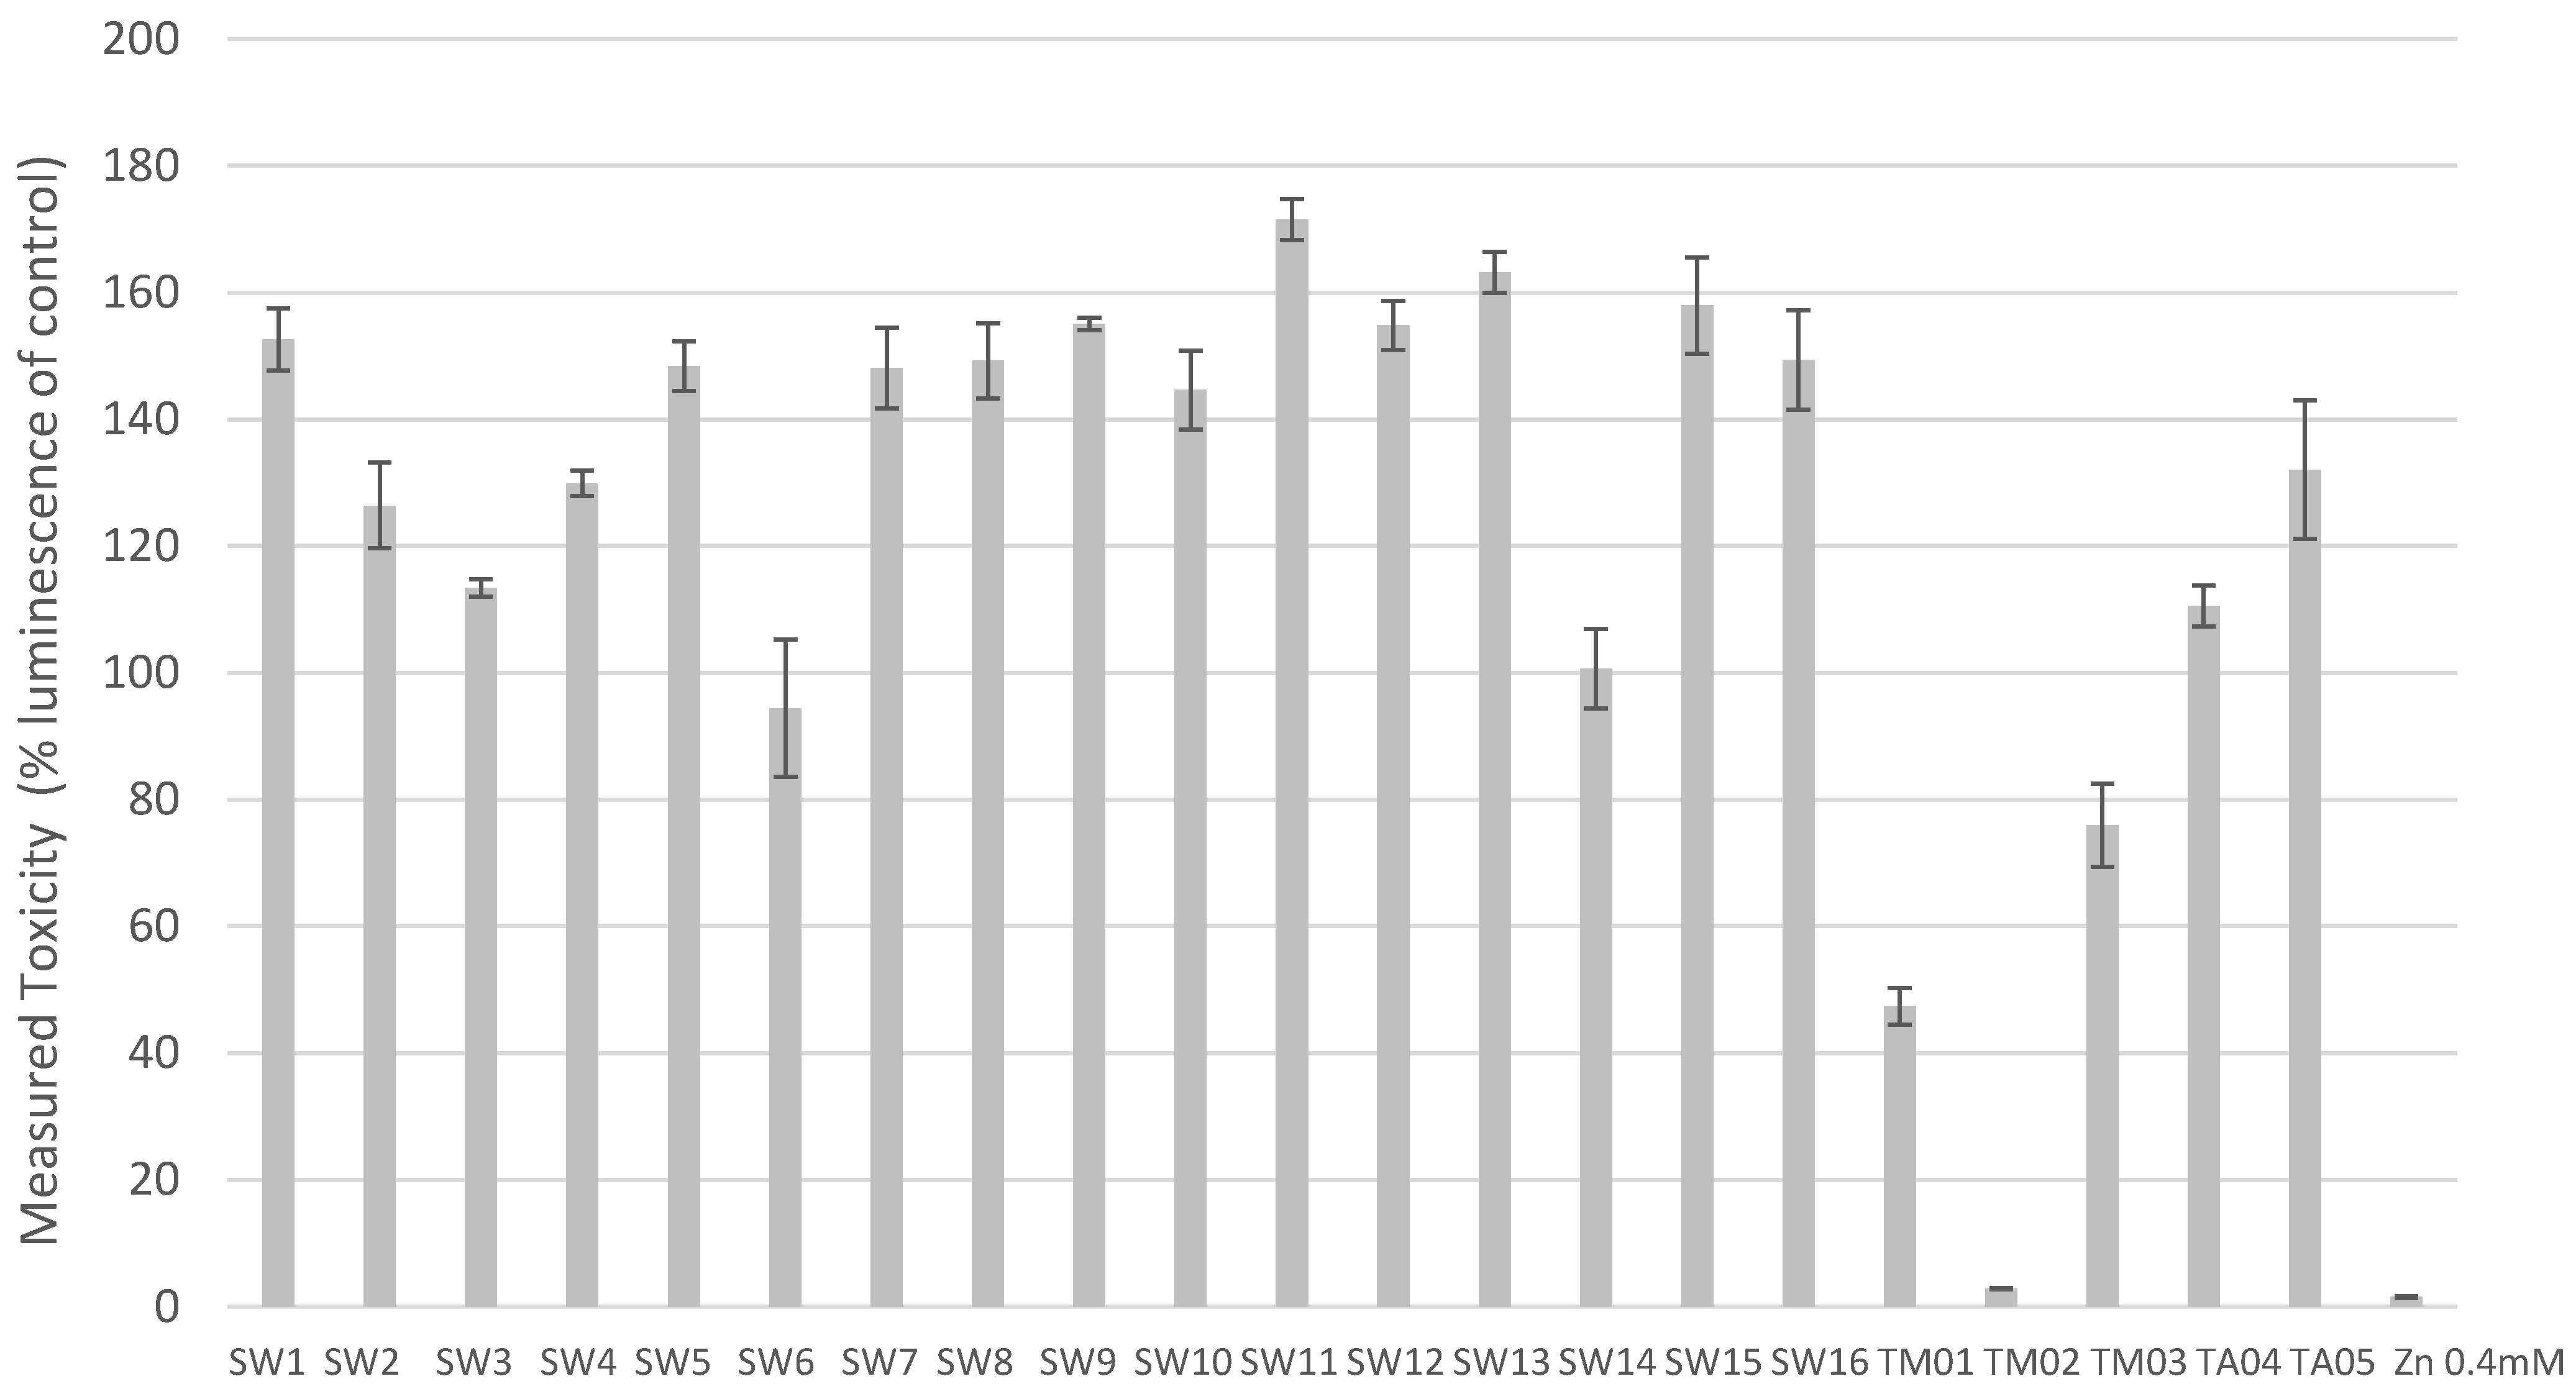
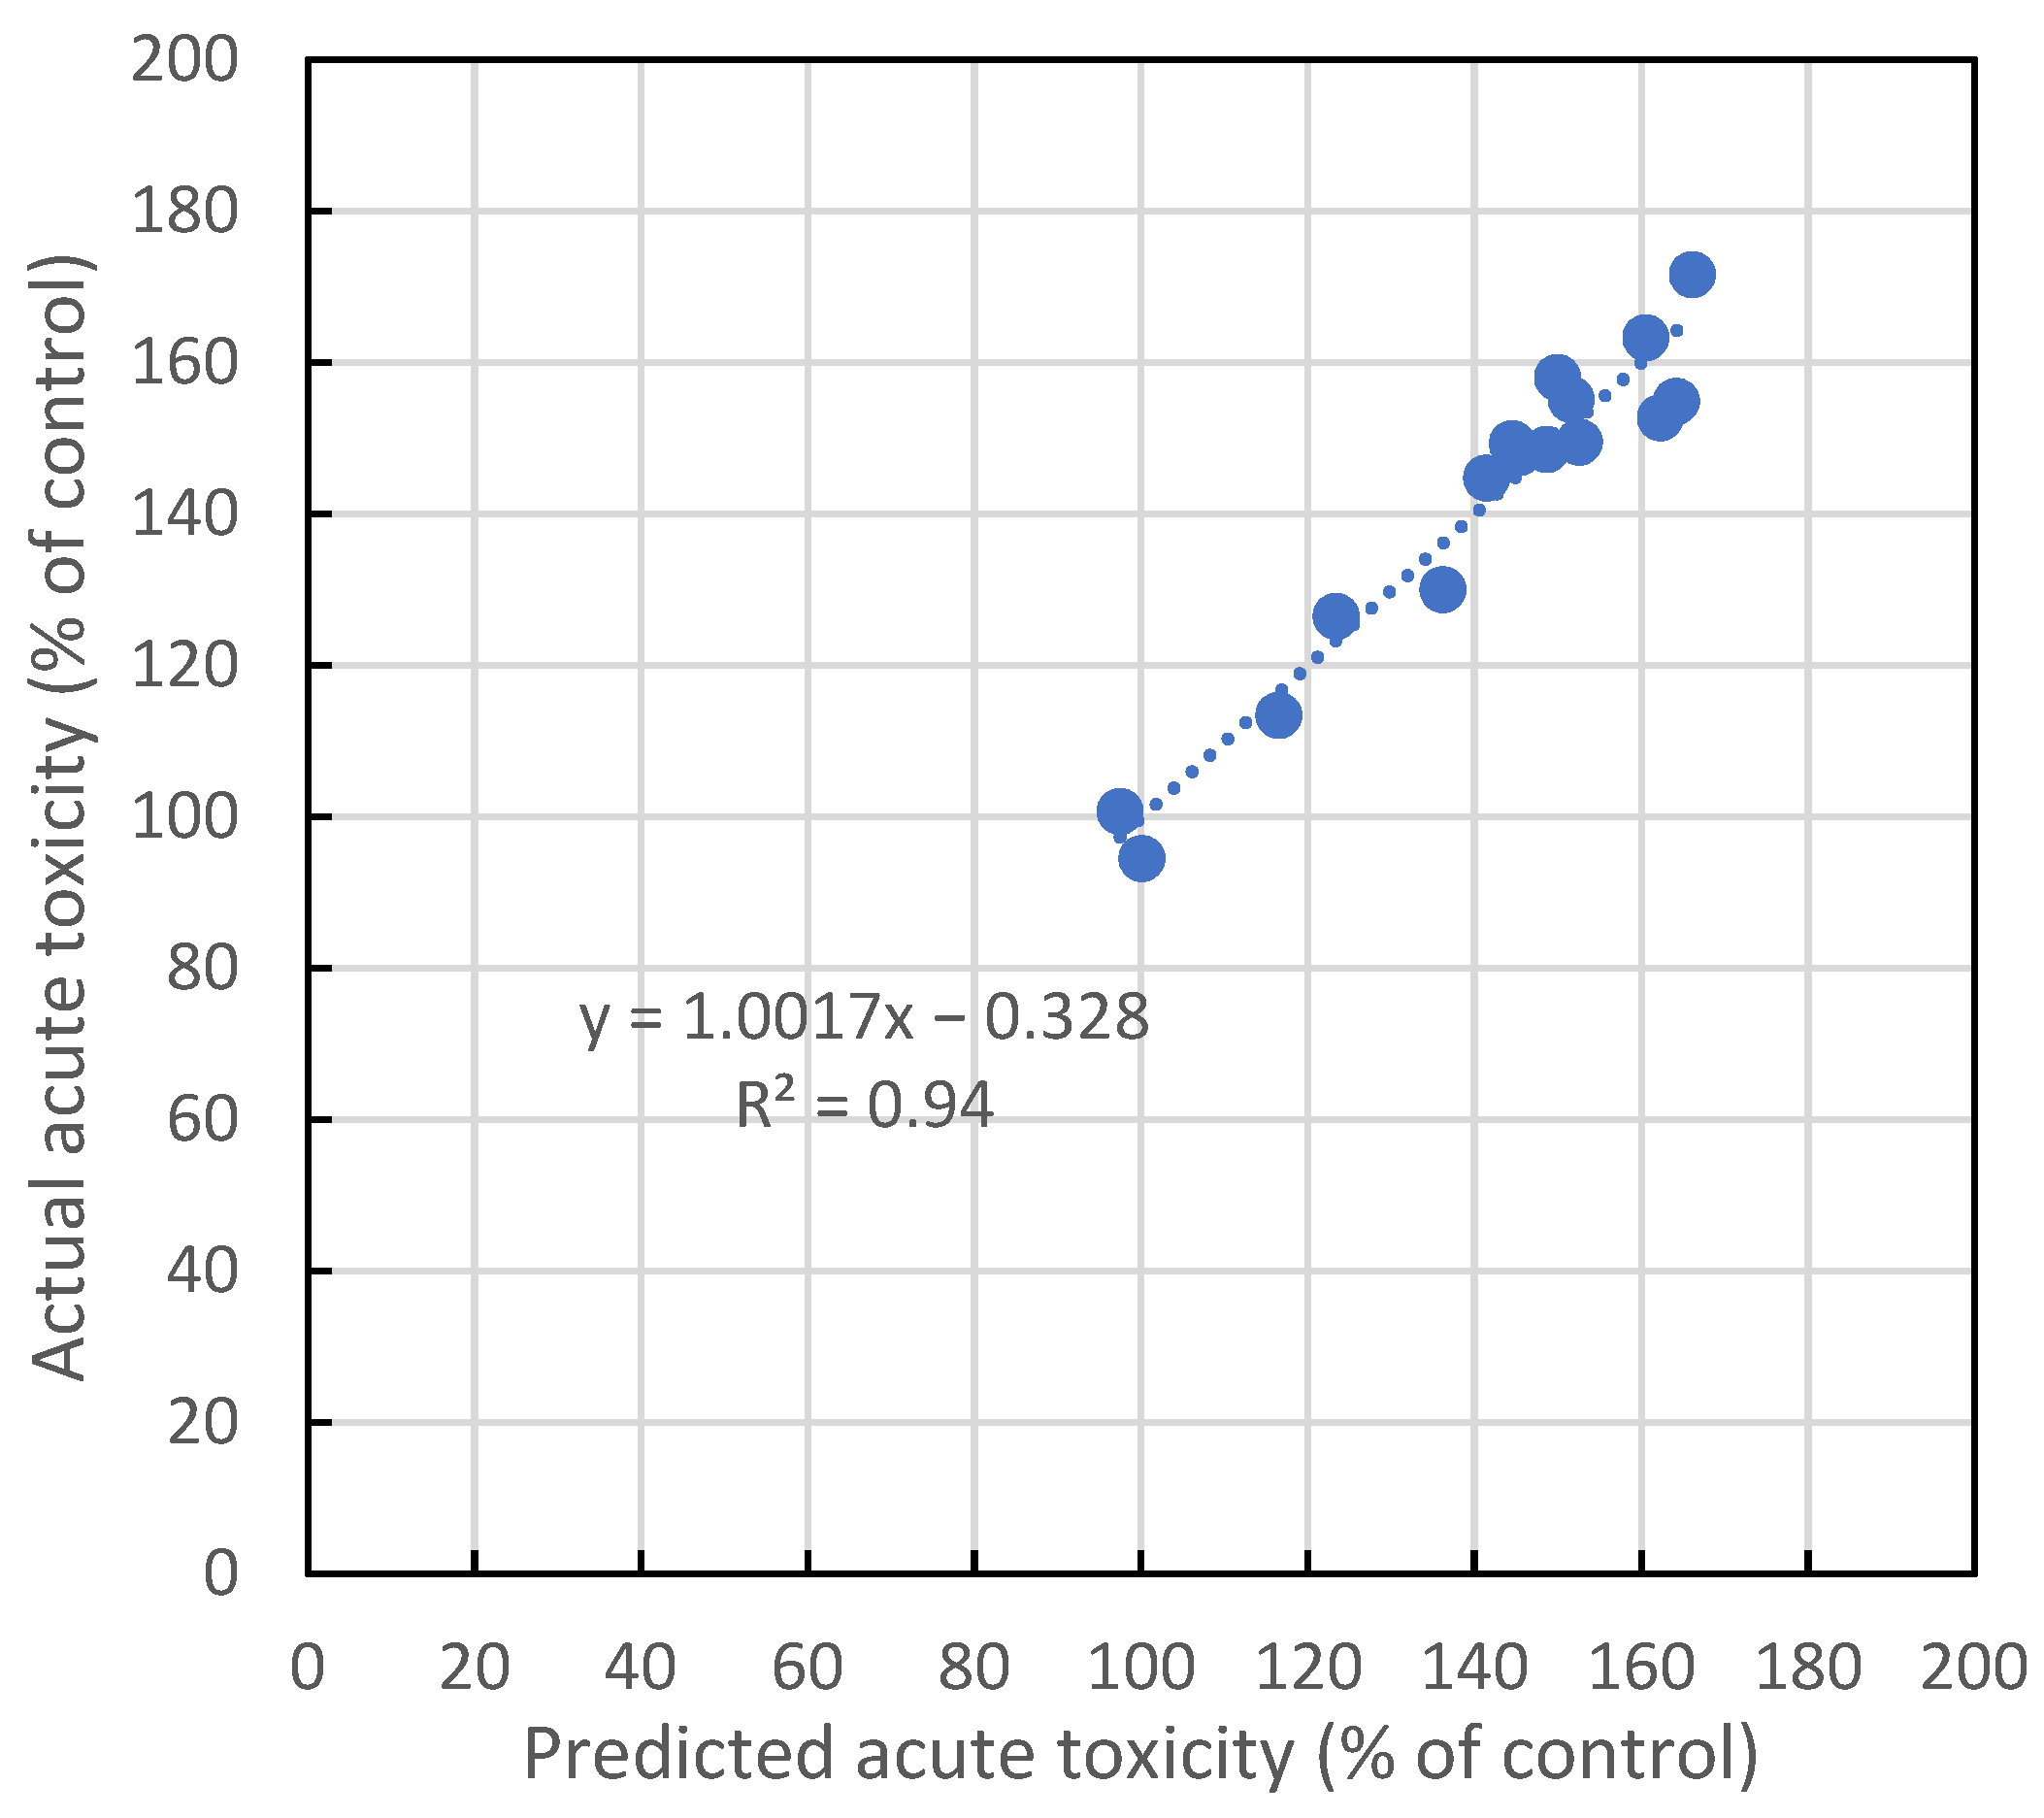
3.2. Biosensors Results and Toxicity

The results of the acute toxicity assay are displayed in Figure 4, with toxicity expressed as a percentage of luminescence relative to the PBS control.
The results from testing the instream samples using the molecular biosensors suggested that the river sample toxicity was never significantly greater than the control (less than 90% luminescence); however, there was significant stimulation in 13 out of 16 samples. The Awash after Akaki mix (SW6) and Lake Beseka samples (SW14) gave the highest toxicity readings of instream samples though they were not statistically different from the control (p > 0.5). The Akaki results may be lower than most samples tested due to the tannery discharges, and Lake Beseka may contribute high salinity levels and/or rock weathering (geogenic) effects due to subsurface flows of active rift and the presence of volcanic ash [34,40].
The stimulatory effect in the majority of samples may be a result of hormesis, whereby a low concentration of toxicant is stimulatory or beneficial to an organism. This may in turn indicate that the concentration is below the toxicity threshold; or may be due to the mobilization of energy reserves within the biosensor, in a protective response of a low-grade toxicant. With the tannery samples, three out of five samples were significantly toxic at the TM01, TM02, and TM03 locations. The sample from TA04 was not significantly different from the control, and the sample from TA05 was slightly stimulatory. The largest acute toxicity was observed at TM02 (2.9%) which was highly statistically significant.
The output from the acute toxicity biosensors can be described as the net biological impact of the complex mixtures within a water sample. It is indicative of changes in metabolic activity within the cells. These biosensors have been engineered to constitutively express luminescence until metabolically perturbed. Luminescence-based biosensors report on the holistic whole-cell effects of pollutants on cellular metabolism, and therefore the output encompasses many toxic mechanisms such as genotoxicity, cell membrane disruption, or osmotic stress as just a few examples [26]. As they are affected by the individual components of a water sample as well as their combinatorial effects, they are not necessarily suitable for identifying specific individual drivers of toxicity; however, correlations between the concentrations of certain metals and the toxicity values indicated that some metals may have more of a pronounced toxic effect on the biosensors. In particular, a previous study identified Zinc, Cadmium, and Copper as biosensor toxicants [25].
Many metal species are known to have toxic effects through the generation of reactive oxygen species (ROS) which cause oxidative stress within the cell and can cause gene damage. As a holistic snapshot of water quality, biosensor technology has the potential to be used for rapid (30 min), in situ detection of toxic compounds in water. It can be calibrated to specific sample areas, making it a valuable tool for environmental monitoring and public health.
With the detailed analysis of metals available, toxicity/stimulation data of river samples (n = 16) was related to eight metals that the INCA-Metals model simulates. This exploratory exercise was to find statistically significant metals that relate to river water toxicity in the Awash River system. With an established relationship, metal simulation output from the INCA-Metals model could potentially be used to reasonably predict river toxicity values over time at any reach in the Awash River. To do this, backward regression analysis was applied to acute toxicity and eight metals. It was found that Lead, Zinc, Arsenic, Copper, and Manganese were highly linked to acute toxicity (Table 2). Multiple regression with the metals data yielded a predictive equation based on these metals with a high correlation of r2 = 0.94 (Figure 5):
Acute toxicity = 17.364 × [Lead] − 1.715 × [Zinc] − 2.631 × [Arsenic] − 3.361 × [Copper] − 0.013 × [Manganese] + 177.861 EQ.1

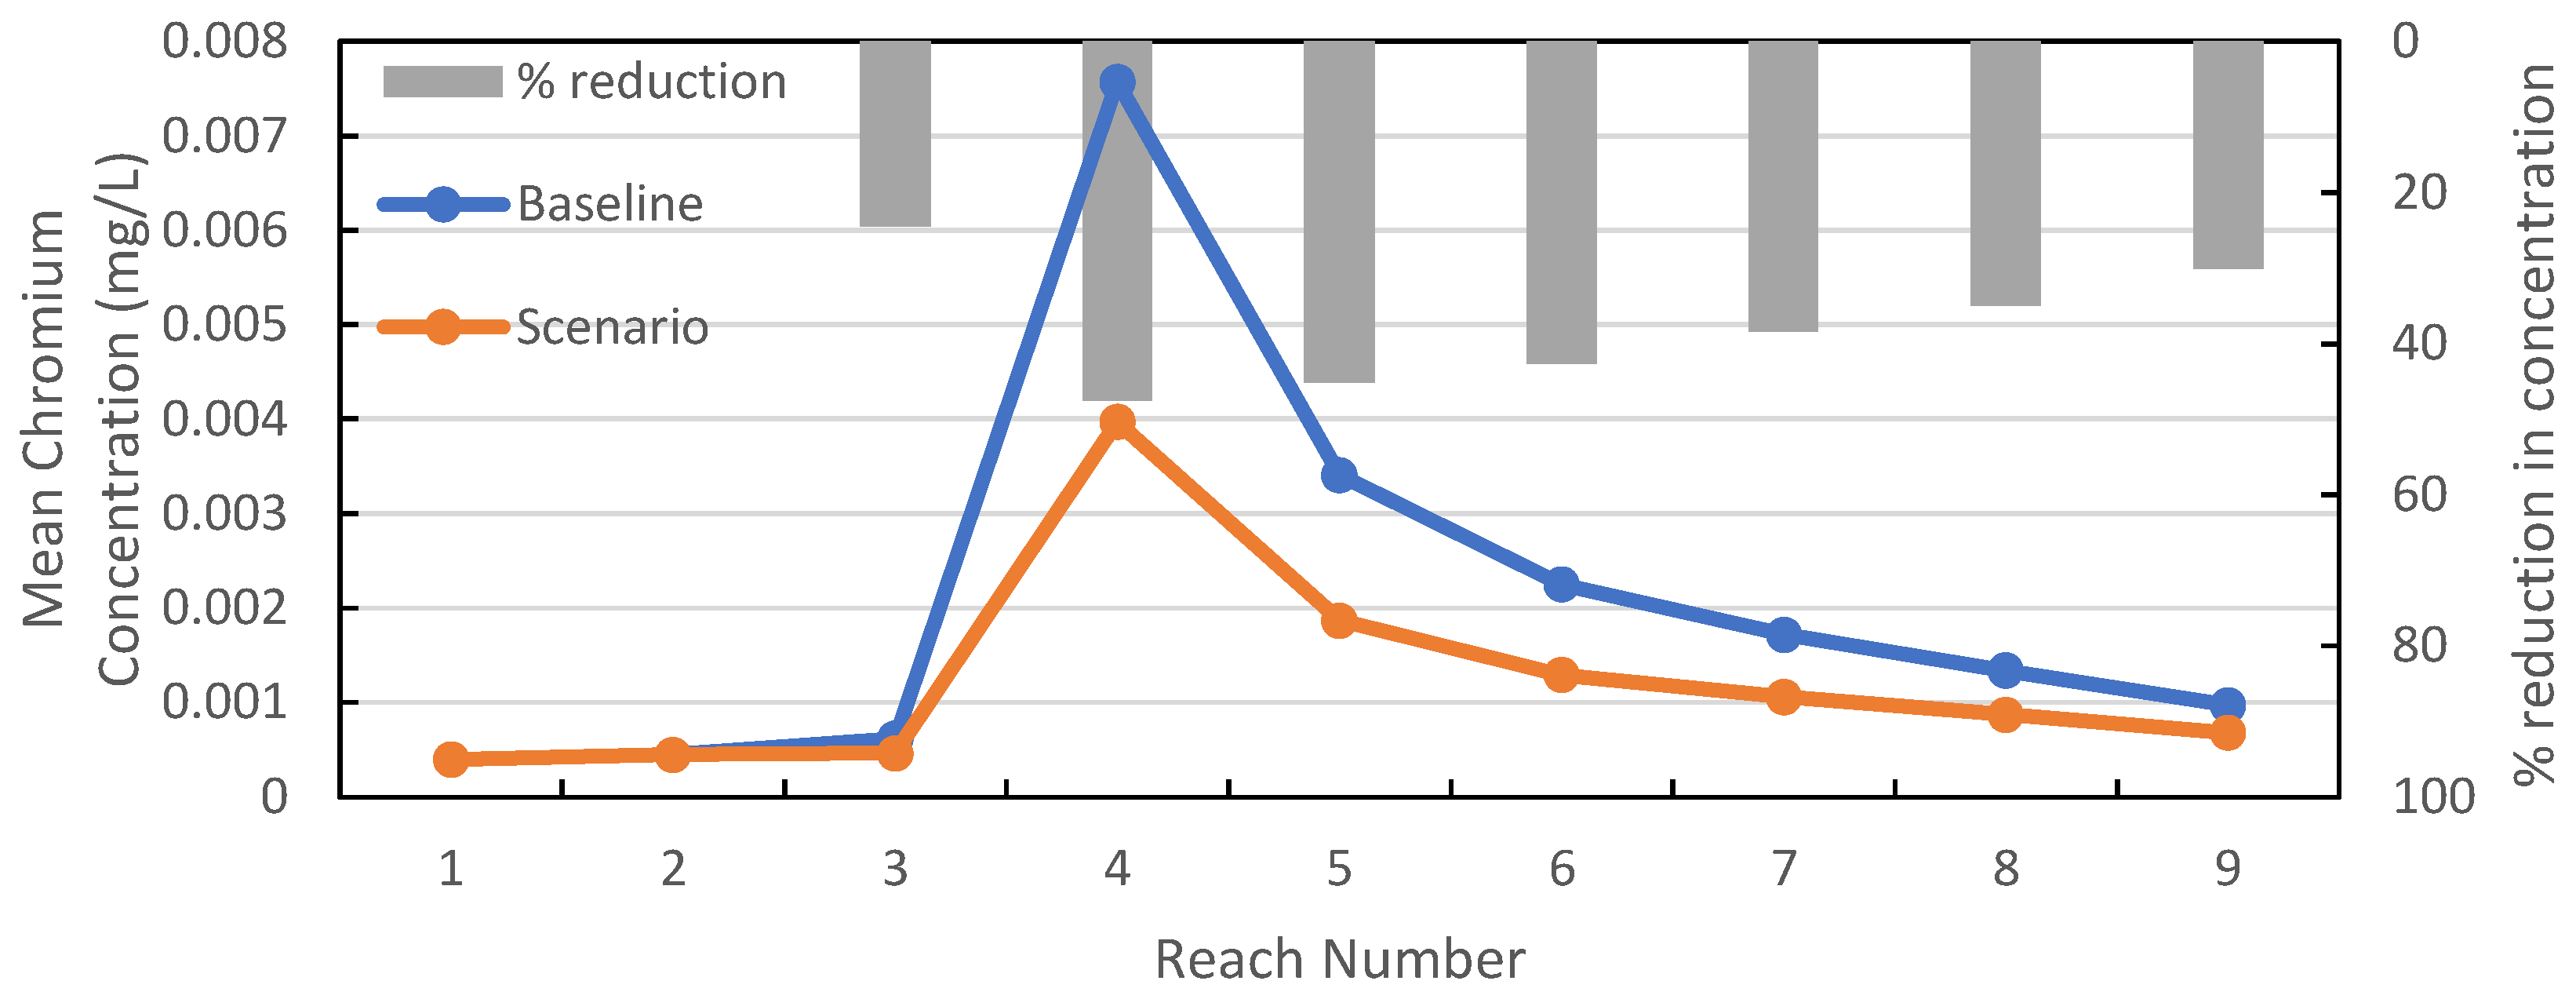
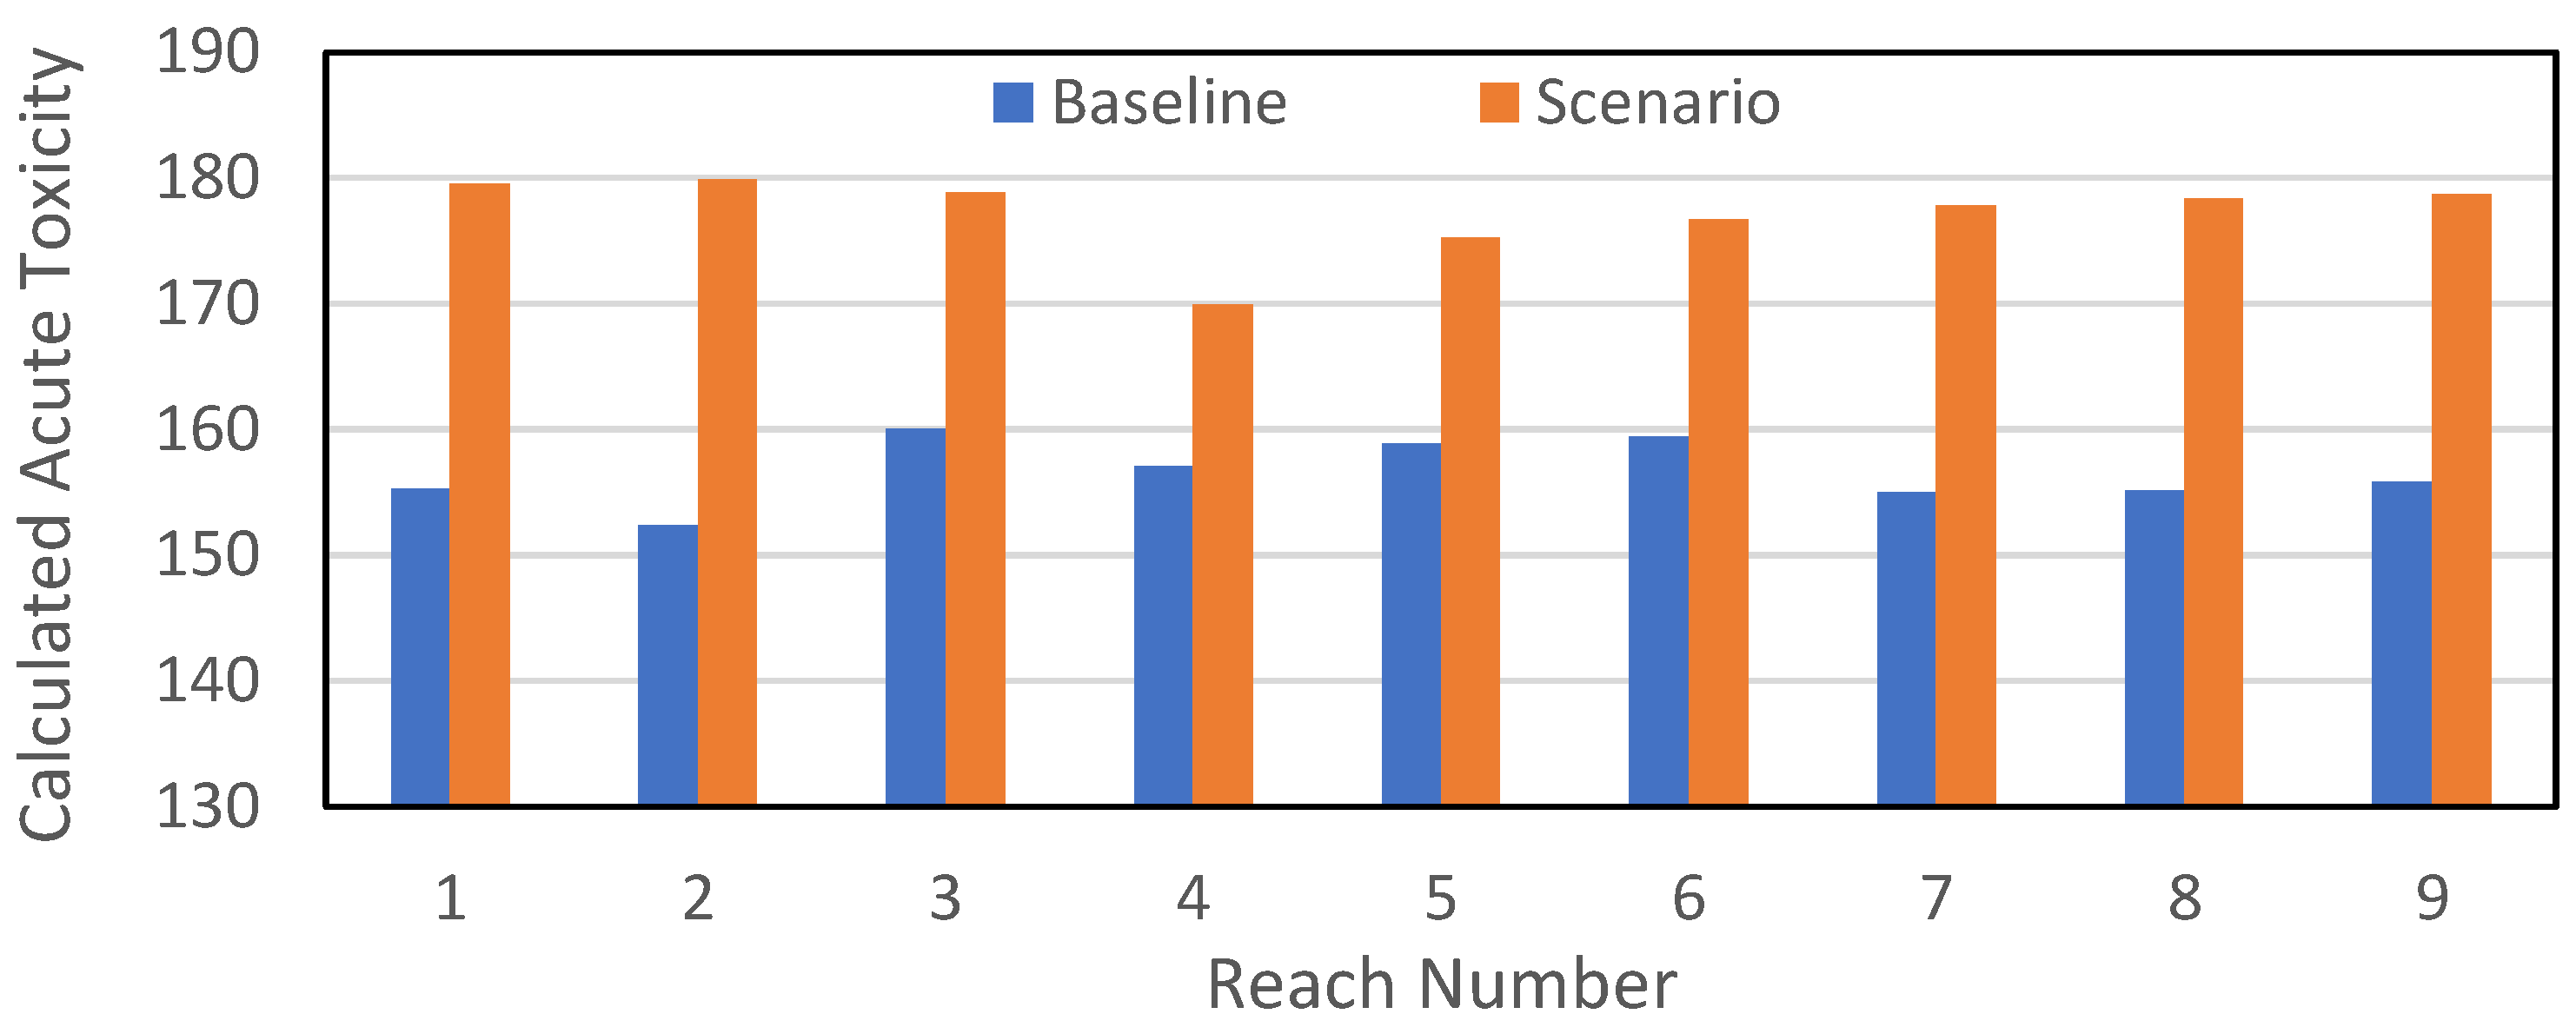
3.3. Modelling Tannery Effluent Controls

To assess the impacts of the tanneries on the Awash River, the INCA-Metals model has been set up for the Awash River System, based on the previous applications of the model by Bussi et al. [35] and Jin et al. [34]. These applications were set up to address issues on nutrient management in the Awash and also the issues of salinity in the river and Lake Beseka. These two papers discuss in detail the INCA model setup and the definition of reach boundaries using topography (Figure 1) and other spatial data such as land use, animal numbers, and population, as well as the key driving data such as the daily rainfall, temperature, and soil moisture deficit.
Typical simulations for flow and salinity are shown in Figure 6 and demonstrate reasonable fits to the observed data with KGE statistics (Kling-Gupta efficiency) [41] of 0.7 for both flow and salinity [34]. The INCA-Metals model has been set up using the same information as the other INCA applications and, in this case, the INCA-Metals model has been set up with the 5 tanneries located at their reach locations (Figure 1). The model has then been run to assess the impacts of the metals on the downstream water quality. Figure 7 illustrates the simulation over 2 years showing the daily flows and the associated Chromium and Manganese water chemistry at a downstream river reach from tanneries (reach 5). The time series of Chromium show higher concentrations in the low flow period, due to the lack of dilution from rainwaters, and much lower concentration in the high flow periods. Manganese however has a different pattern. When the flow is higher, the Manganese concentration also goes higher which might reflect the contribution of high Manganese from groundwater. Furthermore, the INCA model calculates the distributions of the simulated data. The spread of behaviors in Figure 8 indicates a non-gaussian type distribution with a mean Chromium of 0.0615 mg/L, which is above the WHO metals limit of 0.05 mg/L. Manganese has a mean of 0.112 mg/L, which is also above the WHO metals limit of 0.1 mg/L. The high mean concentrations of Chromium and Manganese in this reach are due to the discharge of tannery effluent into the Akaki River (Table 1). With untreated or partially treated effluents continuously discharging high levels of metals into the river system, the Awash River water will become increasingly impacted over time.
To help assess the future condition, a scenario analysis has been undertaken as an example to simulate metal concentrations with future effluent treatment. Figure 9 shows the simulated Chromium concentrations with a 50% reduction in effluent concentrations compared to the original Chromium concentrations. The peak metal concentration at Reach 4 in the main Awash River profile reflects the tanneries discharge (Figure 9). With a 50% reduction in Chromium concentration in tannery effluent, the reduction of the mean Chromium concentration in river water is significant with a nearly 50% reduction at reach 4 which is immediately downstream from the tanneries. Moving down the river profile, the impact became less, and the reduction reached approximately 25% at reach 9 (Figure 9). The reduction in metals (e.g., 50% Chromium) can also be translated into toxicity, as shown in Figure 10, illustrating how the water toxicity will change based on the toxicity regression model (EQ.1). The values increasing suggest a more stimulatory nature, which could suggest an environment that might be more stimulatory or beneficial to an organism which may indicate a less toxic condition. The results suggest that serious consideration should be given to the treatment of the tannery effluents so that toxic conditions are reduced downstream of the tanneries.

4. Conclusions

Water quality degradation due to rapid population growth, urbanization, and industrialization is a global environmental issue. The UN Sustainable Development Goal 6.3 aims to reduce pollution impacts globally and to encourage countries to close the gap between current poor water supplies and the ideal situation, where there are adequate water supplies for people, industry, and agriculture. Globally this gap is about 30% on average. Ethiopia has quite a long way to go to close this gap and, in many ways, the gap is expanding as industrial development continues and populations move towards the cities.
In this paper we consider elevated heavy metal concentrations such as Fe, Al, Cr, Mn, Mo, or As, resulting from untreated industrial effluent discharge into rivers. These are known to pose health concerns and risks to humans, especially where they drain into reservoirs or public water supplies. This is a serious concern for Ethiopia and requires action to put in place a suitable pollution control strategy, as well as ensure that the industry establishes adequate treatment facilities.
In countries like Ethiopia where conventional instruments and new technology are lacking, there have been few studies focusing on evaluating heavy metal levels in Ethiopian’s river basins. This is the first comprehensive study that combines field sampling from surface waters and tanneries, chemical laboratory analysis, new biosensor technology, and mathematical modeling to assess the water chemistry and water toxicity in the Awash River. It was found that Lead, Zinc, Arsenic, Copper, and Manganese were highly linked to water toxicity in this river system. The study demonstrated the importance of metal-driven responses to toxicity and the value of a biosensor-based assessment of water quality. It must be noted that it was a small dataset in comparison to the number of metals tested; however, this work serves as a proof of concept for bacterial biosensor toxicity analysis in freshwater systems.
The multi-branch water quality model (INCA) was used to estimate the heavy metal concentrations and to simulate the impact of tannery discharge on the river water pollution levels. It is important to recognize that although most river water samples had heavy metal concentrations below the WHO drinking water standards, wastewater effluents constantly discharge polluted water into water bodies, significantly deteriorating the water quality. Several wastewater treatment plants that incorporate primary treatment with secondary or secondary with tertiary are currently under construction. The new wastewater treatment plants combined with strict implementation of wastewater discharge permit systems and enforcement of the law will improve future Awash River water quality.

Author Contributions

Conceptualization, L.J., C.R. and P.G.W.; methodology, L.J., C.R., Y.A., G.B., T.Q.T., D.A. and P.G.W.; software, L.J. and G.B.; validation, L.J., C.R. and P.G.W.; formal analysis, L.J. and C.R.; investigation, L.J., C.R. and Y.A.; resources, L.J.; data curation, L.J. and C.R.; writing—original draft preparation, L.J., C.R., Y.A. and P.G.W.; writing—review and editing, L.J., C.R., Y.A., G.B., T.Q.T. and P.G.W.; visualization, L.J.; supervision, L.J.; project administration, P.G.W.; funding acquisition, P.G.W. All authors have read and agreed to the published version of the manuscript.

Funding

this research has been funded by UK Aid from the UK Foreign, Commonwealth and Development Office (FCDO) for the benefit of developing countries (Programme Code 201880).

Data Availability Statement

Data are available from L.J. upon request.

Acknowledgments

This article is an output from the REACH programme funded by UK Aid from the UK Foreign, Commonwealth and Development Office (FCDO) for the benefit of developing countries (Programme Code 201880). However, the views expressed and information contained in it are not necessarily those of or endorsed by FCDO, which can accept no responsibility for such views or information or any reliance placed on them.

Conflicts of Interest

The authors declare no conflict of interest.

References

  1. Krein, A.; Keßler, S.; Meyer, B.; Pailler, J.-Y.; Guignard, C.; Hoffmann, L. Concentrations and loads of dissolved xenobiotics and hormones in two small river catchments of different land use in Luxembourg. Hydrol. Process. 2013, 27, 284–296. [Google Scholar] [CrossRef]
  2. Phillips, P.J.; Chalmers, A.T.; Gray, J.L.; Kolpin, D.W.; Foreman, W.T.; Wall, G.R. Combined Sewer Overflows: An Environmental Source of Hormones and Wastewater Micropollutants. Environ. Sci. Technol. 2012, 46, 5336–5343. [Google Scholar] [CrossRef]
  3. Azimi, A.; Azari, A.; Rezakazemi, M.; Ansarpour, M. Removal of Heavy Metals from Industrial Wastewaters: A Review. ChemBioEng Rev. 2017, 4, 37–59. [Google Scholar] [CrossRef]
  4. Prasad, S.; Saluja, R.; Joshi, V.; Garg, J.K. Heavy Metal Pollution in Surface Water of the Upper Ganga River, India: Human Health Risk Assessment. Environ. Monit. Assess. 2020, 192, 742. [Google Scholar] [CrossRef] [PubMed]
  5. Postevaya, M.A.; Slukovskii, Z.I.; Dauvalter, V.A.; Bernadskaya, D.S. Estimation of Heavy Metal Concentrations in the Water of Urban Lakes in the Russian Arctic (Murmansk). Water 2021, 13, 3267. [Google Scholar] [CrossRef]
  6. Meng, Z.; Bai, X.; Tang, X. Short−Term Assessment of Heavy Metals in Surface Water from Xiaohe River Irrigation Area, China: Levels, Sources and Distribution. Water 2022, 14, 1273. [Google Scholar] [CrossRef]
  7. Ismail, E.; Snousy, M.G.; Alexakis, D.E.; Abdelhalim, A.; Ahmed, M.S.; Elsayed, E. Diagnosis of Groundwater Quality in North Assiut Province, Egypt, for Drinking and Irrigation Uses by Applying Multivariate Statistics and Hydrochemical Methods. Water 2023, 15, 2812. [Google Scholar] [CrossRef]
  8. UNESCO. International Initiative on Water Quality: Promoting Scientific Research, Knowledge Generation and Dissemination and Effective Policies to Respond to Water Quality Challenges in a Holistic and Collaborative Manner towards Ensuring Water Security for Sustainable Development; UNESCO: Paris, France, 2015. [Google Scholar]
  9. Dyer, S.D.; Wang, X.H. A comparison of stream biological responses to discharge from wastewater treatment plants in high and low population density areas. Environ. Toxicol. Chem. 2002, 21, 1065–1075. [Google Scholar] [CrossRef]
  10. Ayenew, T. Water management problems in the Ethiopian rift: Challenges for development. J. Afr. Earth Sci. 2007, 48, 222–236. [Google Scholar] [CrossRef]
  11. Taye, M.T.; Dyer, E.; Hirpa, F.A.; Charles, K. Climate Change Impact on Water Resources in the Awash Basin, Ethiopia. Water 2018, 10, 1560. [Google Scholar] [CrossRef]
  12. Abebe, Y.; Alamirew, T.; Whitehead, P.; Charles, K.; Alemayehu, E. Spatio-temporal variability and potential health risks assessment of heavy metals in the surface water of Awash basin, Ethiopia. Heliyon 2023, 9, e15832. [Google Scholar] [CrossRef] [PubMed]
  13. Dokmeci, A.H.; Ongen, A.; Dagdeviren, S. Environmental Toxicity of Cadmium and Health Effect. J. Environ. Prot. Ecol. 2009, 10, 84–93. [Google Scholar]
  14. Islam, M.S.; Ahmed, M.K.; Habibullah-Al-Mamun, M.; Masunaga, S. Assessment of trace metals in fish species of urban rivers in Bangladesh and health implications. Environ. Toxicol. Pharmacol. 2015, 39, 347–357. [Google Scholar] [CrossRef]
  15. Kumar, V.; Parihar, R.D.; Sharma, A.; Bakshi, P.; Sidhu, G.P.S.; Bali, A.S.; Karaouzas, L.; Bhardwaj, R.; Thukral, A.K.; Gyasi-Agyei, Y.; et al. Global evaluation of heavy metal content in surface water bodies: A meta-analysis using heavy metal pollution indices and multivariate statistical analyses. Chemosphere 2019, 236, 124364. [Google Scholar] [CrossRef] [PubMed]
  16. Rampley, C.P.N.; Whitehead, P.G.; Softley, L.; Hossain, M.A.; Jin, L.; David, J.; Shawal, S.; Das, P.; Thompson, I.P.; Huang, W.E.; et al. River toxicity assessment using molecular biosensors: Heavy metal contamination in the Turag-Balu-Buriganga river systems, Dhaka, Bangladesh. Sci. Total Environ. 2020, 703, 134760. [Google Scholar] [CrossRef]
  17. Khan, F.U.; Rahman, A.U.; Jan, A.; Riaz, M. Toxic and trace metals (Pb, Cd, Zn, Cu, Mn, Ni, Co and Cr) in dust, dustfall/soil. J. Chem. Soc. Pak. 2004, 26, 453–456. [Google Scholar]
  18. Ali, H.; Khan, E.; Ilahi, I. Environmental Chemistry and Ecotoxicology of Hazardous Heavy Metals: Environmental Persistence, Toxicity, and Bioaccumulation. J. Chem. 2019, 2019, 6730305. [Google Scholar] [CrossRef]
  19. Prasad, S.; Yadav, K.K.; Kumar, S.; Gupta, N.; Cabral-Pinto, M.M.S.; Rezania, S.; Radwan, N.; Alam, J. Chromium contamination and effect on environmental health and its remediation: A sustainable approaches. J. Environ. Manag. 2021, 285, 112174. [Google Scholar] [CrossRef]
  20. Rahman, Z.; Singh, V.P. The relative impact of toxic heavy metals (THMs) (arsenic (As), cadmium (Cd), chromium (Cr)(VI), mercury (Hg), and lead (Pb)) on the total environment: An overview. Environ. Monit. Assess. 2019, 191, 419. [Google Scholar] [CrossRef]
  21. Ravindra, K.; Mor, S. Distribution and Health Risk Assessment of Arsenic and Selected Heavy Metals in Groundwater of Chandigarh, India. Environ. Pollut. 2019, 250, 820–830. [Google Scholar] [CrossRef] [PubMed]
  22. Durai, G.; Rajasimman, M. Biological Treatment of Tannery Wastewater—A Review. J. Environ. Sci. Technol. 2011, 4, 1–17. [Google Scholar] [CrossRef]
  23. Assegide, E.; Alamirew, T.; Bayabil, H.; Dile, Y.T.; Tessema, B.; Zeleke, G. Impacts of Surface Water Quality in the Awash River Basin, Ethiopia: A Systematic Review. Front. Water 2022, 3, 790900. [Google Scholar] [CrossRef]
  24. Nigussie, A.; Getaneh, Z. Awash River Basin Water Allocation Modeling and Conflict Resolution Study Project; WP4 Water Quality Final Report; Federal Democratic Republic of Ethiopia Awash Basin Authority: Addis Ababa, Ethiopia, 2016. [Google Scholar]
  25. Cui, Z.S.; Luan, X.; Jiang, H.C.; Li, Q.; Xu, G.F.; Sun, C.J.; Zheng, L.; Song, Y.Z.; Davison, P.A.; Huang, W.E. Application of a bacterial whole cell biosensor for the rapid detection of cytotoxicity in heavy metal contaminated seawater. Chemosphere 2018, 200, 322–329. [Google Scholar] [CrossRef] [PubMed]
  26. Hao, O.J.; Lin, C.-F.; Jeng, F.-T.; Shih, C.-J. A review of microtox test and its applications. Toxicol. Environ. Chem. 1995, 52, 57–76. [Google Scholar] [CrossRef]
  27. Johnson, B.T. Microtox® Acute Toxicity Test. In Small-Scale Freshwater Toxicity Investigations: Toxicity Test Methods; Blaise, C., Férard, J.-F., Eds.; Springer: Dordrecht, The Netherlands, 2005; pp. 69–105. [Google Scholar] [CrossRef]
  28. Kwan, K.K.; Dutka, B.J. Simple 2-Step Sediment Extraction Procedure for Use in Genotoxicity and Toxicity Bioassays. Toxic. Assess. 1990, 5, 395–404. [Google Scholar] [CrossRef]
  29. Stebbing, A.R. Hormesis—The stimulation of growth by low levels of inhibitors. Sci. Total Environ. 1982, 22, 213–234. [Google Scholar] [CrossRef]
  30. Whitehead, P.G.; Wilson, E.J.; Butterfield, D. A semi-distributed Integrated Nitrogen model for multiple source assessment in Catchments (INCA): Part I—Model structure and process equations. Sci. Total Environ. 1998, 210, 547–558. [Google Scholar] [CrossRef]
  31. Whitehead, P.G.; Butterfield, D.; Wade, A.J. Simulating metals and mine discharges in river basins using a new integrated catchment model for metals: Pollution impacts and restoration strategies in the Aries-Mures river system in Transylvania, Romania. Hydrol. Res. 2009, 40, 323–346. [Google Scholar] [CrossRef]
  32. Whitehead, P.G.; Mimouni, Z.; Butterfield, D.; Bussi, G.; Hossain, M.A.; Peters, R.; Shawal, S.; Holdship, P.; Rampley, C.P.N.; Jin, L.; et al. A New Multibranch Model for Metals in River Systems: Impacts and Control of Tannery Wastes in Bangladesh. Sustainability 2021, 13, 3556. [Google Scholar] [CrossRef]
  33. Wade, A.J.; Durand, P.; Beaujouan, V.; Wessel, W.W.; Raat, K.J.; Whitehead, P.G.; Butterfield, D.; Rankinen, K.; Lepisto, A. A nitrogen model for European catchments: INCA, new model structure and equations. Hydrol. Earth Syst. Sci. 2002, 6, 559–582. [Google Scholar] [CrossRef]
  34. Jin, L.; Whitehead, P.G.; Bussi, G.; Hirpa, F.; Taye, M.T.; Abebe, Y.; Charles, K. Natural and anthropogenic sources of salinity in the Awash River and Lake Beseka (Ethiopia): Modelling impacts of climate change and lake-river interactions. J. Hydrol.-Reg. Stud. 2021, 36, 100865. [Google Scholar] [CrossRef]
  35. Bussi, G.; Whitehead, P.G.; Jin, L.; Taye, M.T.; Dyer, E.; Hirpa, F.A.; Yimer, Y.A.; Charles, K.J. Impacts of Climate Change and Population Growth on River Nutrient Loads in a Data Scarce Region: The Upper Awash River (Ethiopia). Sustainability 2021, 13, 1254. [Google Scholar] [CrossRef]
  36. Jarvis, A.; Reuter, H.I.; Nelson, A.; Guevara, E. Hole-Filled SRTM for the Globe Version 4. 2008. Available online: http://srtm.csi.cgiar.org (accessed on 2 May 2019).
  37. Bontemps, S.; Defourny, P.; Bogaert, E.V.; Arino, O.; Kalogirou, V.; Perez, J.R. Globcover 2009-Products Description and Validation Report; European Space Agency: Paris, France, 2009. [Google Scholar]
  38. Futter, M.N.; Erlandsson, M.A.; Butterfield, D.; Whitehead, P.G.; Oni, S.K.; Wade, A.J. PERSiST: A flexible rainfall-runoff modelling toolkit for use with the INCA family of models. Hydrol. Earth Syst. Sci. 2014, 18, 855–873. [Google Scholar] [CrossRef]
  39. Funk, C.; Peterson, P.; Landsfeld, M.; Pedreros, D.; Verdin, J.; Shukla, S.; Husak, G.; Rowland, J.; Harrison, L.; Hoell, A.; et al. The climate hazards infrared precipitation with stations—A new environmental record for monitoring extremes. Sci. Data 2015, 2. [Google Scholar] [CrossRef]
  40. Abebe, Y.; Whitehead, P.; Alamirew, T.; Jin, L.; Alemayehu, E. Evaluating the Effects of Geochemical and Anthropogenic factors on the concentration and treatability of Heavy Metals in Awash River and Lake Beseka, Ethiopia. Environ. Monit. Assess. 2023, 195, 1188. [Google Scholar] [CrossRef] [PubMed]
  41. Gupta, H.V.; Kling, H.; Yilmaz, K.K.; Martinez, G.F. Decomposition of the mean squared error and NSE performance criteria: Implications for improving hydrological modelling. J. Hydrol. 2009, 377, 80–91. [Google Scholar] [CrossRef]
Figure 1. Locations of sixteen surface water samples (SW1-16) and five industrial wastewater samples (TA01-02 and TM01-03) in 2020. The numeric numbers in grey indicate INCA modeling catchments.
Water 15 04073 g001
Figure 2. Luminescence from the bacterial biosensors reflecting acute toxicity.
Water 15 04073 g002
Figure 3. Spatial variations of selected metals in river water samples. Concentrations are in μg/L.
Water 15 04073 g003
Figure 4. Acute toxicity results expressed as a percentage of luminescence relative to the phosphate-buffered saline (PBS) control taken at t = 30 min. All samples (n = 21) were tested in technical triplicate and error bars denote one standard deviation above and below the mean.
Water 15 04073 g004
Figure 5. The statistical model predicted acute toxicity versus actual acute toxicity for the river samples.
Water 15 04073 g005
Figure 6. Flow and salinity model simulations (grey lines) compared to observed flow (red line) and salinity data (red circles) 2005–2014.
Water 15 04073 g006
Figure 7. The simulated flow, Chromium, and Manganese concentrations in the main Awash River below the tanneries at reach 5, over 2 years 2020–2021.
Water 15 04073 g007
Figure 8. Distributions of flow, Chromium, and Manganese in the river system downstream of the tanneries (reach 18).
Water 15 04073 g008
Figure 9. Profile down the main Awash River shows the reductions along the river using the mean Chromium concentrations from the model simulations.
Water 15 04073 g009
Figure 10. Calculated baseline and scenario river water toxicity along the main Awash River.
Water 15 04073 g010
Table 1. Metal concentrations at sixteen sites in the river system and five tanneries. Concentrations are in μg/L (ppb). BDL indicates below the detection limit. The metal detection limits and the World Health Organization (WHO) drinking water standards were listed at the bottom.
Sample IDTypeFeAlRbSrCrMnCoNiCuMoZnAsLiCdHgPb
SW1River155.1121.42.1293.40.3108.10.81.92.01.74.90.51.3BDLBDL0.1
SW2River3896.81980.435.3442.4214.22170.44.49.89.31.372.32.87.40.12BDL7.9
SW3River2695.01455.438.6414.5138.32240.25.512.115.41.875.72.67.50.10BDL9.0
SW4River1741.81065.019.7314.45.41455.03.87.45.13.224.02.812.4BDLBDL2.5
SW5River1657.61659.817.2319.93.0678.05.013.49.13.914.03.08.3BDLBDL2.4
SW6River1082.71256.932.773.42.165.10.62.82.7103.810.223.028.60.10BDL0.6
SW7River1431.51560.417.3323.52.6850.54.412.77.04.511.92.98.3BDLBDL1.7
SW8River307.7386.410.1320.80.6137.61.15.12.66.313.82.323.2BDLBDL0.4
SW9River272.1314.912.0322.4139.1330.21.34.72.25.68.62.725.9BDLBDL0.4
SW10River410.9382.315.6374.269.4747.13.612.33.18.59.34.136.9BDLBDL0.6
SW11River1003.41164.23.9150.31.557.50.83.73.51.97.30.92.9BDLBDL0.9
SW12River1162.31406.24.6151.51.667.60.94.33.72.38.51.04.2BDLBDL1.0
SW13River1833.01908.56.7169.82.1277.41.95.65.12.411.91.76.9BDLBDL1.6
SW14River1014.81208.832.475.92.067.10.62.63.4108.77.225.028.00.12BDL0.6
SW15River2158.12135.110.5162.42.4370.21.75.84.116.110.05.910.1BDLBDL1.3
SW16River1732.51870.211.6173.82.0239.51.55.53.719.98.45.410.6BDLBDL1.1
TM01IWW729.62239.677.5469.018,038.1168.30.817.53.2BDL31.9BDL67.9BDLBDL0.6
TM02IWW37.267.985.7235.11229.06.30.55.4BDLBDL7.4BDL76.3BDLBDLBDL
TM03IWW525.3146.2187.9453.3474.960.210.610.70.9BDL35.41.855.1BDLBDL0.3
TA04IWW2278.83358.1150.7582.84329.53097.17.428.610.13.377.1BDL234.0BDLBDL1.1
TA05IWW74.31881.046.2438.834.1472.63.53.50.81.111.1BDL23.4BDL1.810.1
Detection Limits0.6400.0590.0130.3920.0060.0080.0020.0030.0440.1500.1980.0030.0570.0010.6500.015
WHO standards300200--50100-20130070500010-3210
Table 2. Statistical results of multiple regression analysis.
Coefficients Estimate Coefficients Standard Errortp
(Intercept)177.8616.10629.127<0.001
Lead17.3647.0752.4540.034
Zinc−1.7150.650−2.6380.025
Arsenic−2.6310.248−10.605<0.001
Copper−3.3611.779−1.8900.088
Manganese−0.0130.006−2.0580.067
Disclaimer/Publisher’s Note: The statements, opinions and data contained in all publications are solely those of the individual author(s) and contributor(s) and not of MDPI and/or the editor(s). MDPI and/or the editor(s) disclaim responsibility for any injury to people or property resulting from any ideas, methods, instructions or products referred to in the content.

