Article

Experimental Study on the Stability of Shallow Landslides in Residual Soil

1
State Grid Jiangxi Electric Power Co., Ltd., Nanchang 330069, China
2
School of Civil and Architectural Engineering, East China University of Technology, Nanchang 330013, China
3
Geographic Information Engineering Brigade,JiangXi Provincial Bureau of Geology, Nanchang 330001, China
*
Author to whom correspondence should be addressed.
Water 2023, 15(21), 3732; https://doi.org/10.3390/w15213732
Submission received: 21 July 2023 / Revised: 22 September 2023 / Accepted: 9 October 2023 / Published: 26 October 2023
(This article belongs to the Special Issue Effects of Groundwater and Surface Water on the Natural Geo-Hazards)

Abstract

:
Landslide disasters are one of the most severe geological hazards in China. Soil slopes are prone to triggering landslides under the influence of main factors such as rainfall, resulting in economic losses, casualties, and ecological damage. Taking a residual soil landslide in Xingguo County as an example, this study investigated the influencing factors and mechanical properties of soil slope stability under rainfall infiltration through physical model experiments. The main conclusions were as follows: with the increase in rainfall intensity, the amount of rainwater infiltration and the weight of the soil mass increased, which led to greater changes in soil pressure. The maximum amplitude of the experimental process was 5.51 kPa. The response time of pore water pressure under a rainfall intensity of 45 mm/h was 20–30 min earlier than that under a rainfall intensity of 21 mm/h, with a larger fluctuation range. The maximum amplitude of the experimental process was 6.66 kPa. Under the condition of rainfall intensity of 21 mm/h, the slope undergone local shallow sliding failure, while under the condition of rainfall intensity of 45 mm/h, the slope undergone overall shallow sliding failure. The physical model experimental results were consistent with the historical deformation of the landslide and the actual situation on site. The conclusions of the experiment can provide a reference for the research on the failure mechanism of similar landslides.

1. Introduction

China has a vast territory, complex geological condition, a large population, and a changeable climate. In recent years, affected by human engineering activities, extreme climate, and secondary disasters caused by earthquakes, various geological disasters have occurred frequently. Geological disasters have the characteristics of suddenness, concealment, and contingency, which pose a serious threat to people’s life and property safety, among which landslides are the most frequent types of geological disasters. Landslides are affected by various factors such as its own geological structure, human activities, rainfall, and earthquakes [1,2,3,4,5,6]. Since the 20th century, many scholars have summarized and analyzed the causal mechanism of major landslide disasters and believe that heavy rain or continuous rainfall is one of the main factors leading to landslides [7,8,9,10,11,12]. Yang Qian [13] analyzed 122 major geological disasters that occurred from 2004 to 2019 and found that geological disasters are more concentrated during the flood season, indicating that rainfall is the main factor inducing geological disasters. Wen Haijia et al. [14]. discussed the main types and controlling factors of rainfall-type landslides and sorted out the research status of the instability mechanism of rainfall-type landslides. According to a large number of studies, rainfall is the most important factor causing landslides.
According to the “2021 National Geological Disaster Situation and 2022 Geological Disaster Trend Forecast” published by the “Ministry of Natural Resources of the People’s Republic of China”, among the geological disasters that will occur nationwide in 2021, there will be 2335 landslides, accounting for 48.9%. According to the “2021 Jiangxi Provincial Geological Disaster Notification” published by the “Jiangxi Provincial Mineral Resources Security Service Center”, there will be 198 geological disasters in Jiangxi Province in 2021, including 150 landslides, accounting for 75.8%. It is pointed out that heavy rainfall is the main cause of geological disasters. Disasters mainly occurred during the period of concentrated heavy rainfall from May to June. Among the 198 disasters and dangerous situations, 189 were induced by precipitation; and 120 disasters and dangerous situations occurred during the main flood season from May to June. Landslides, debris flow and other geological disaster by rainfall have caused serious harm to many regions and cities in our country.
Due to the high cost of field tests, most scholars currently use physical model tests to study the impact of rainfall on slope stability. Model tests can visually monitor the soil deformation and failure process of slopes under rainfall conditions, and at the same time, they can verify the results of slope failure mechanisms, theoretical calculation models, and engineering design and construction. Indoor model tests need to strictly control the test conditions, environment, and test process [15,16,17,18]. The ordinary 1 g model test of the rainfall slope refers to the rainfall model test of the slope under the action of the earth’s gravity field, measuring the stress and strain data of the soil during the rainfall process, and verifying the results through certain theoretical or numerical calculations. Shao et al. [19] developed a coupled dual permeability and slope stability model to simulate the effects of preferential flow on subsurface hydrology and consequent slope failure zones. The dual permeability model is capable of simulating both preferential and matrix flow. Moradi et al. [20] found that accounting for variable bedrock topography can have a significant impact on slope stability, and this impact is highly dependent on the intensity of event rainfall. Additionally, accounting for 3D flow may increase or decrease the stability of the predictions, depending on how the bedrock topography affects the redistribution of seeping water. Guo et al. [21] combined MHFEM with XFEM and applied it to the HM process of the fracture domain. MHFEM and XFEM are applied to flow and mechanics equations, respectively. This coupling allows efficient extension of mixed-dimensional methods to handle coupled HM processes in fracture domains. The mass lumping technique is extended to fracture domains and mechanical processes. It shows how to implement this technique using a fixed stress splitting scheme to improve the performance and stability of the numerical scheme.
Huang et al. [22] analyzed the slope rainfall response time through slope rainfall model tests and found that soil water content and pore water pressure are closely related to slope rainfall response time. Tohari et al. [23] used slope rainfall model tests to analyze the impact of rainfall on soil volumetric water content, groundwater level, and set volumetric water content changes for slope instability warning. Chueasamat et al. [24] studied the influence of surface sand layer density and rainfall intensity on rainfall-induced slope damage through rainfall slope model tests and pointed out that a large amount of sand accumulated in the rain at the beginning of the rainfall flowed out at the toe of the slope. When surface landslide damage occurred, the entire sand layer was almost saturated. Tang et al. [25] analyzed the influence of the intermediate coarse layer on the slope stability through the physical model test of the water entry failure mode of the multi-layer slope under heavy rainfall. The flow diverges along the interface and then breaks through in the downhill direction of the middle coarse layer.
Ye Wanjun et al. [26] conducted model tests on loess slopes under rainfall conditions and pointed out that soil pressure, pore water pressure, and wetting peak displacement rate all showed an overall increase phenomenon under long-term rainfall. Bao Xiaohua et al. [27] conducted indoor rainfall model tests on the infiltration of the upper, lateral, and bottom boundaries of the slope to analyze the changes in matrix suction, volumetric water content, and pore water pressure at different positions inside the slope during rainfall infiltration, as well as the slope failure process. Sun Yongshuai et al. [28] conducted indoor model tests on the stability of sandy soil slopes and silt slopes under rainfall and studied the slope stability change process under rainfall conditions by combining soil types, slope angles, and rainfall intensities with different working conditions. Li Hailiang et al. [29] conducted model tests on heterogeneous soil slopes by rainfall infiltration to explore the relationship between soil volumetric water content and pore water pressure changes with depth and physical properties of soil under the action of rainfall infiltration.
Landslide disasters occur frequently in many areas of Jiangxi Province; especially during the rainfall phase, the probability of landslides increases significantly, which not only poses a great threat to the lives and properties of local residents, but also seriously affects the operation of infrastructure [30,31,32,33,34]. Taking a residual soil landslide in Jiangxi Province as an example, this paper studies the rainfall infiltration law and deformation and failure characteristics of the soil slope by means of model tests and comprehensively evaluates its stability and influencing factors. The research results have important practical significance.

2. Physical Model Test Design

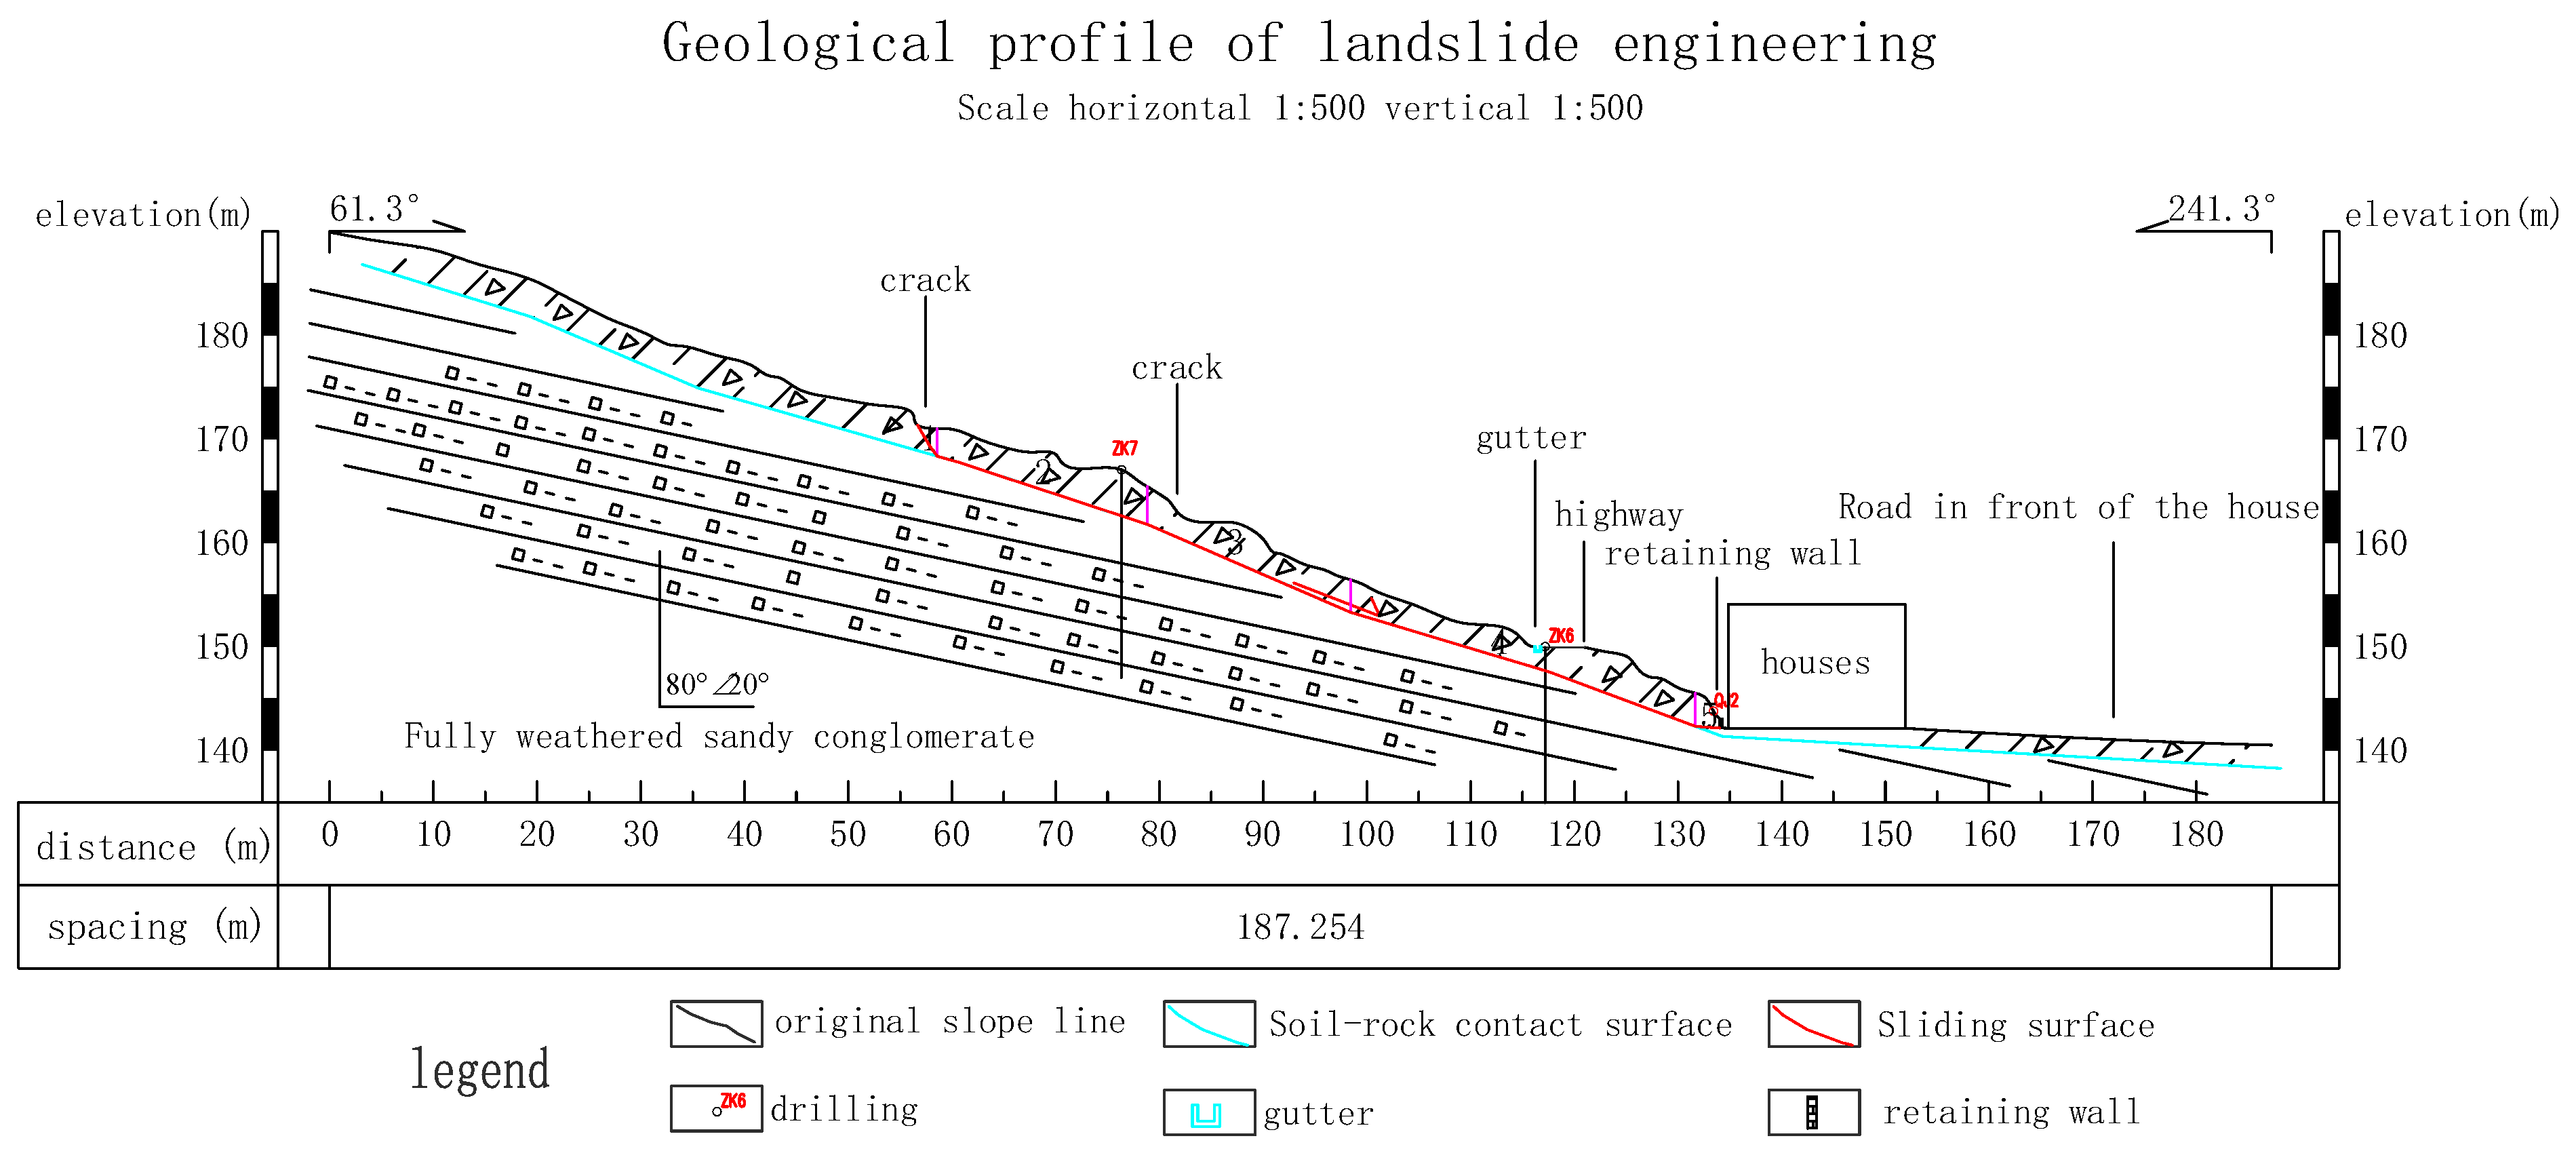
2.1. Landslide Overview

The landslide body is in the shape of a long tongue. The rear wall of the landslide is relatively steep, and the rear edge slope is relatively gentle. There are many jagged cracks in the road. The elevation of the curved tensile crack in the road is about 175 m. The terrain at the trailing edge of the landslide is relatively gentle, and the possibility of sliding is small; the sides of the landslide perimeter are steep, and sliding may occur. The layout of the landslide survey in the study area is shown in Figure 1. The main influencing factors of the landslide deformation in the study area include:
To sum up: the landslide in this project is a shallow soil landslide, and the slip volume is about 30,000 m3. The main reasons for sliding are as follows: the residual slope accumulation layer structure is loose and easy to be infiltrated by rain, resulting in the increase of soil volume water content; rainfall infiltration not only increases the weight of the soil body, but also reduces the shear strength of the soil body itself; artificial slope cutting changes the original terrain. In order to explore the deformation evolution trend of landslides under extreme rainfall conditions, this study selected this landslide as a typical geological model, select different rainfall intensities, analyze their effects, and provide the experimental basis for similar landslide projects.

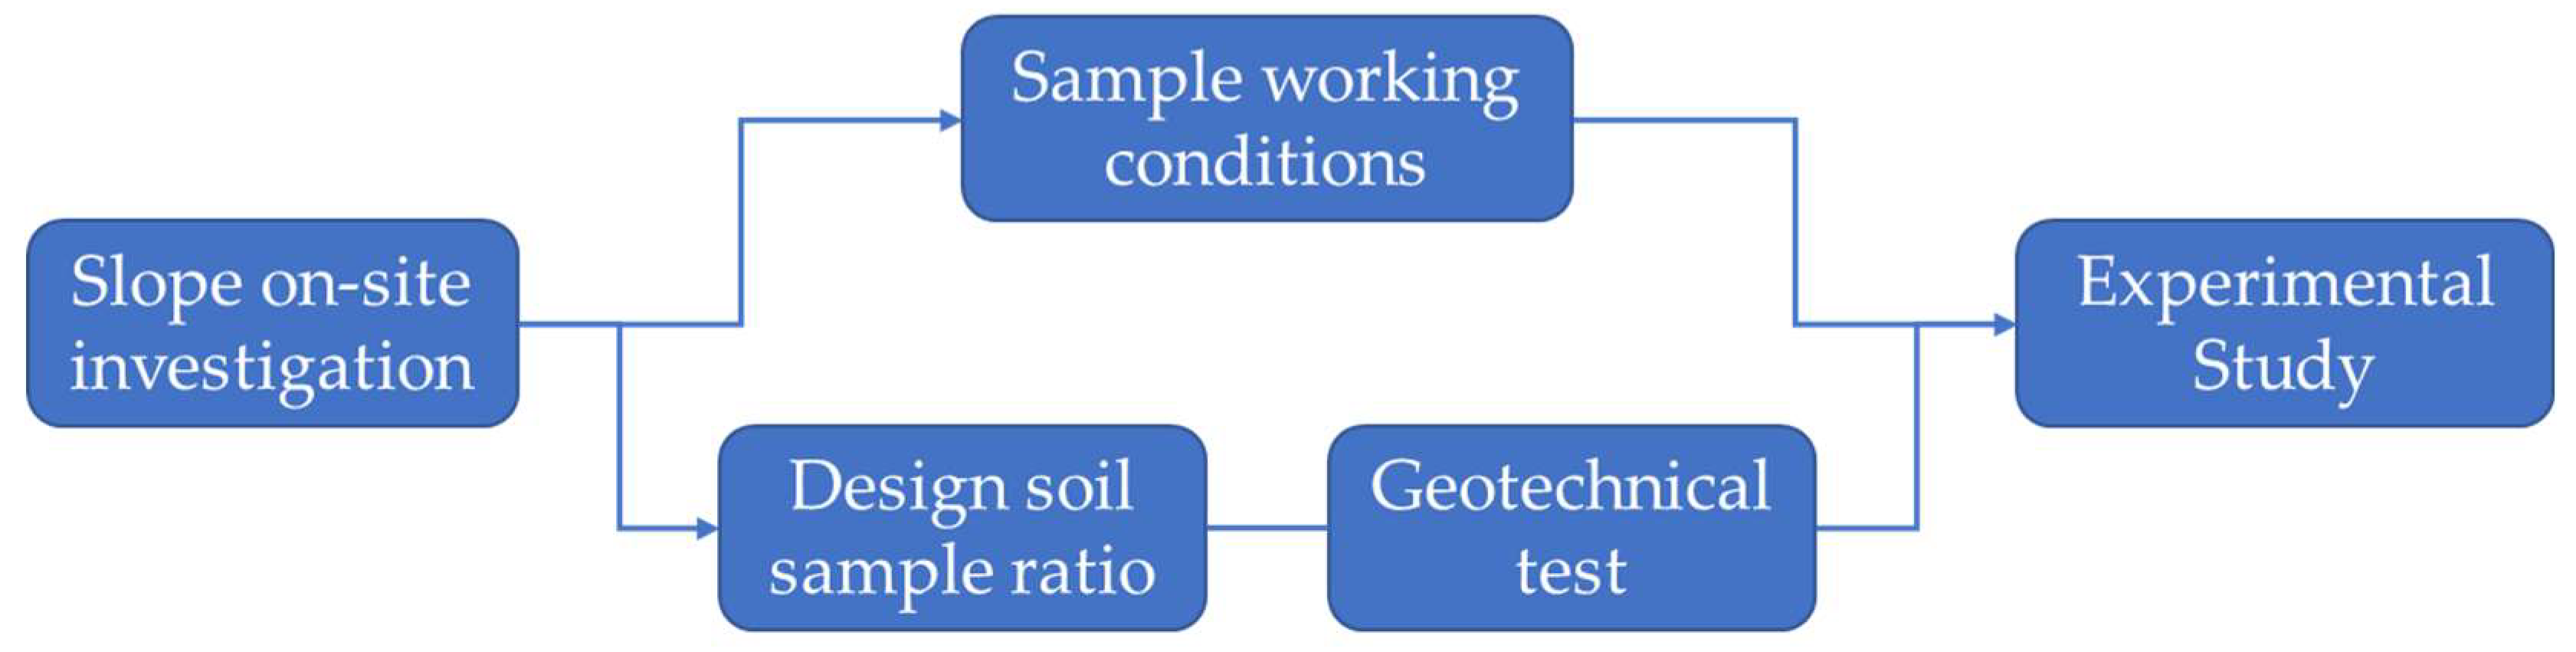
2.2. Model Test Similarity Ratio Design

The landslide model test studies the similarity between the prototype system and the model system in terms of physical mechanics. The similarity generally meets the four aspects of geometric similarity, kinematic similarity, dynamic similarity, and material physical similarity. The similarity ratio of dimensionless physical quantities is 1, so C ν = C ε = C ϕ = C w = 1 under the same gravity condition C g = 1 ; because the test soil is taken from the landslide area, there is C ρ = C E = C C = C k = 1 ; because the geometric similarity ratio is determined C l = 90 , then
C u = C σ = C l C ρ C g = 90
C d = C l = 90
C q = C l 1 / 2 C g 1 / 2 = 90 9.5
C t = C l 1 / 2 C g 1 / 2 = 90 9.5
The selection of similar materials is determined by geotechnical testing. The final determined similar material consists of clay, sand, gypsum, cement, and barite powder in a ratio of 4:7:2:1:1; the specific parameters are shown in Table 1.

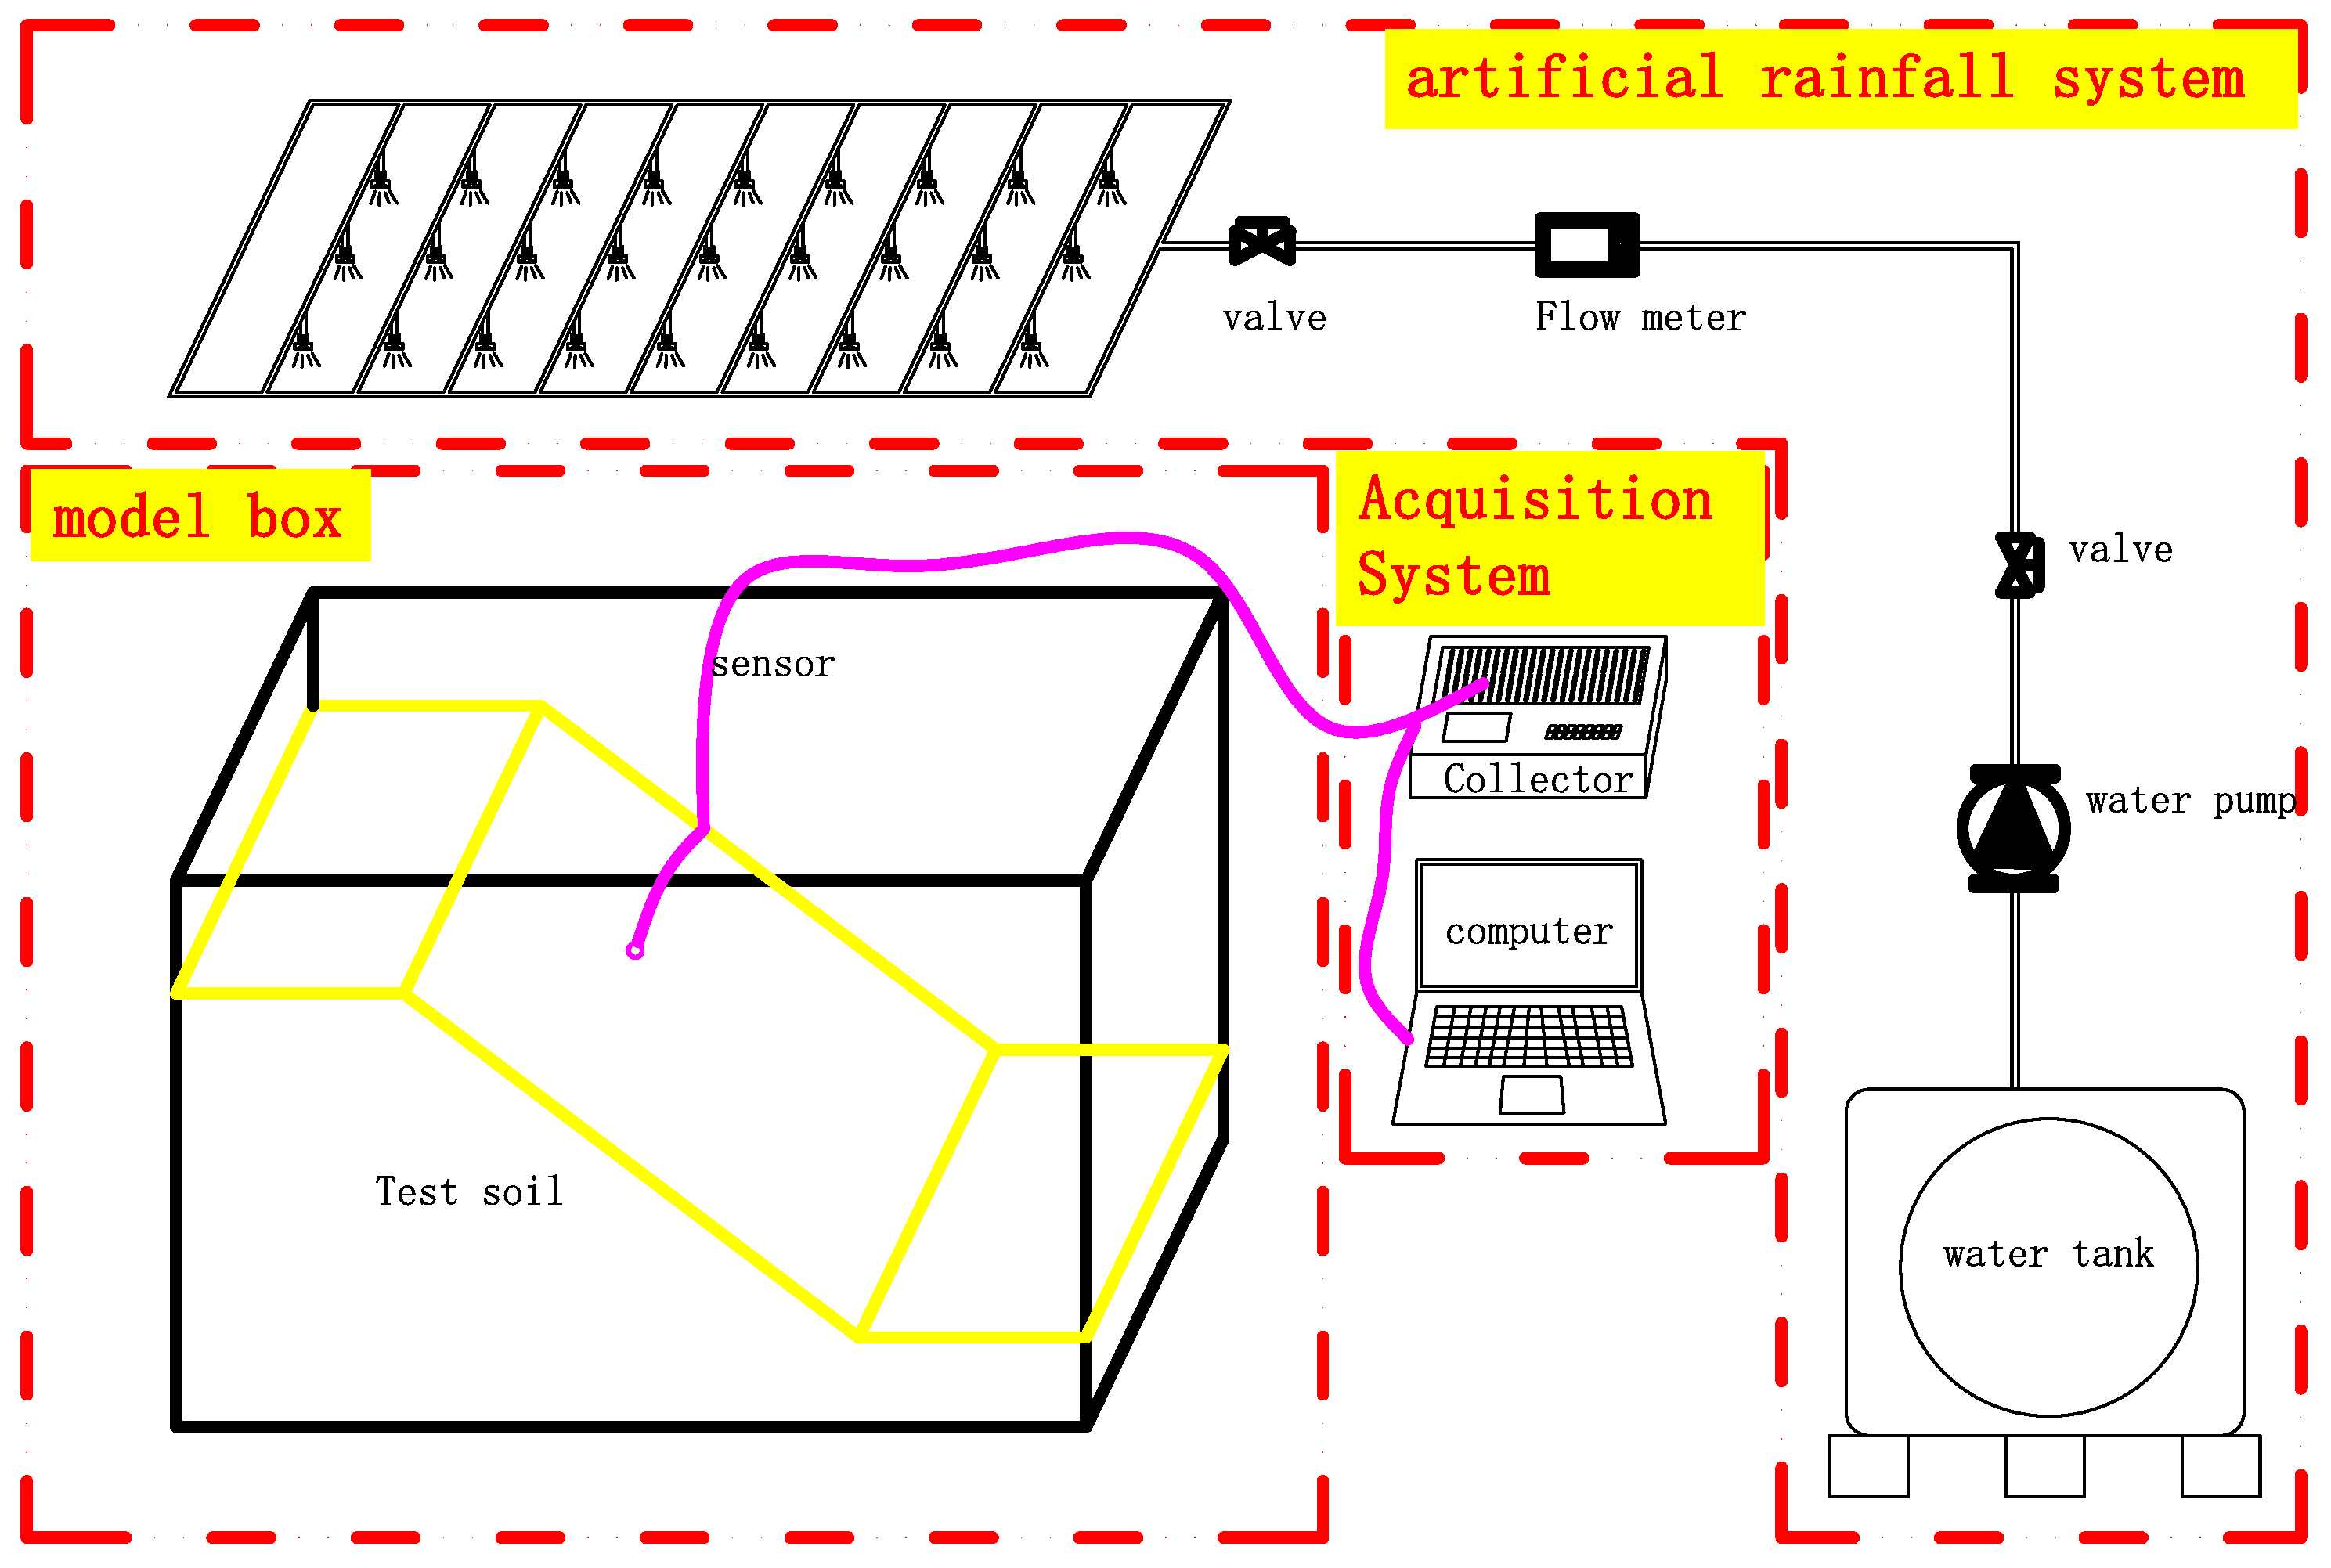
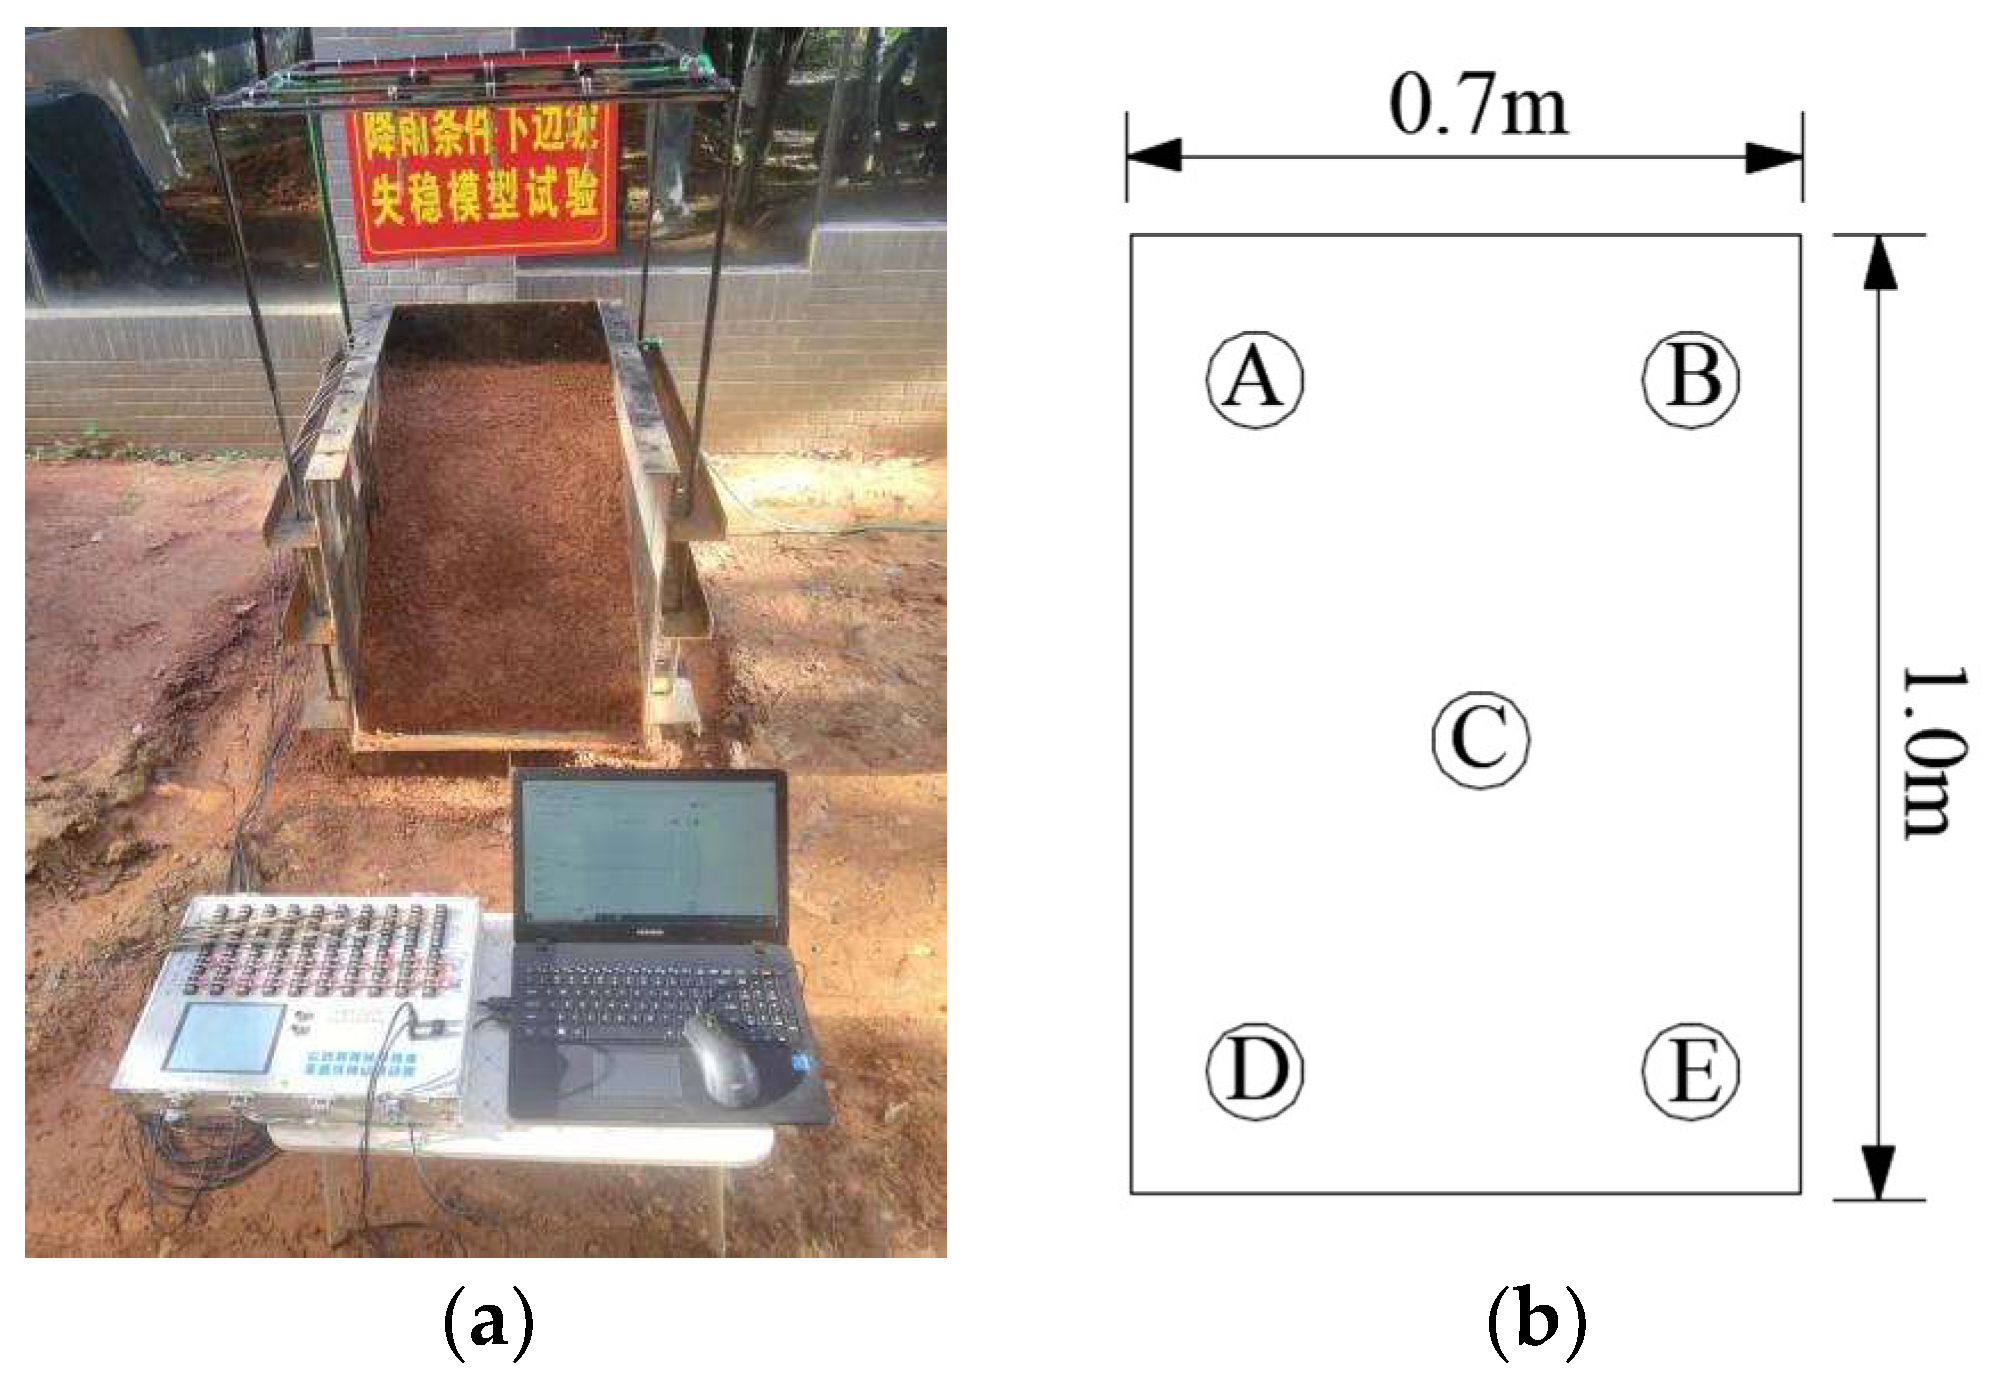
2.3. Model Test Device

The test model box was formed by welding steel plates. The size of the model box was 1.0 m long, 0.7 m wide, and 0.7 m high; the size of the water storage tank was 1.0 m long, 1.0 m wide, and 1.0 m high. The rainfall support was customized and processed by hollow steel pipes. The rainfall was controlled by adjusting the nozzle and the water valve. The use of vase line at the steel plate boundary could effectively eliminate the boundary effect. The monitoring instruments used in the test were soil pressure sensors and pore water pressure sensors. The maximum range of the soil pressure sensors was 200 kPa and the maximum range of the pore water pressure sensor was 100 kPa. The data acquisition instrument used the YBY-2001 dynamic and static strain test and analysis system to meet the test requirements for real-time collection of soil pressure and pore water pressure. The model test was carried out by a self-developed rainfall device and calibration of the rainfall. A 60 W pump and a nozzle with a maximum spray diameter of 1 m were selected for rainfall. The maximum rainfall of each nozzle was 8.4 mm/h during the test; the rainfall intensity was controlled by controlling the opening of the valve. The methodological flow chart is shown in Figure 2.The model test device is shown in Figure 3, and the basic parameters of the test soil are shown in Table 1.

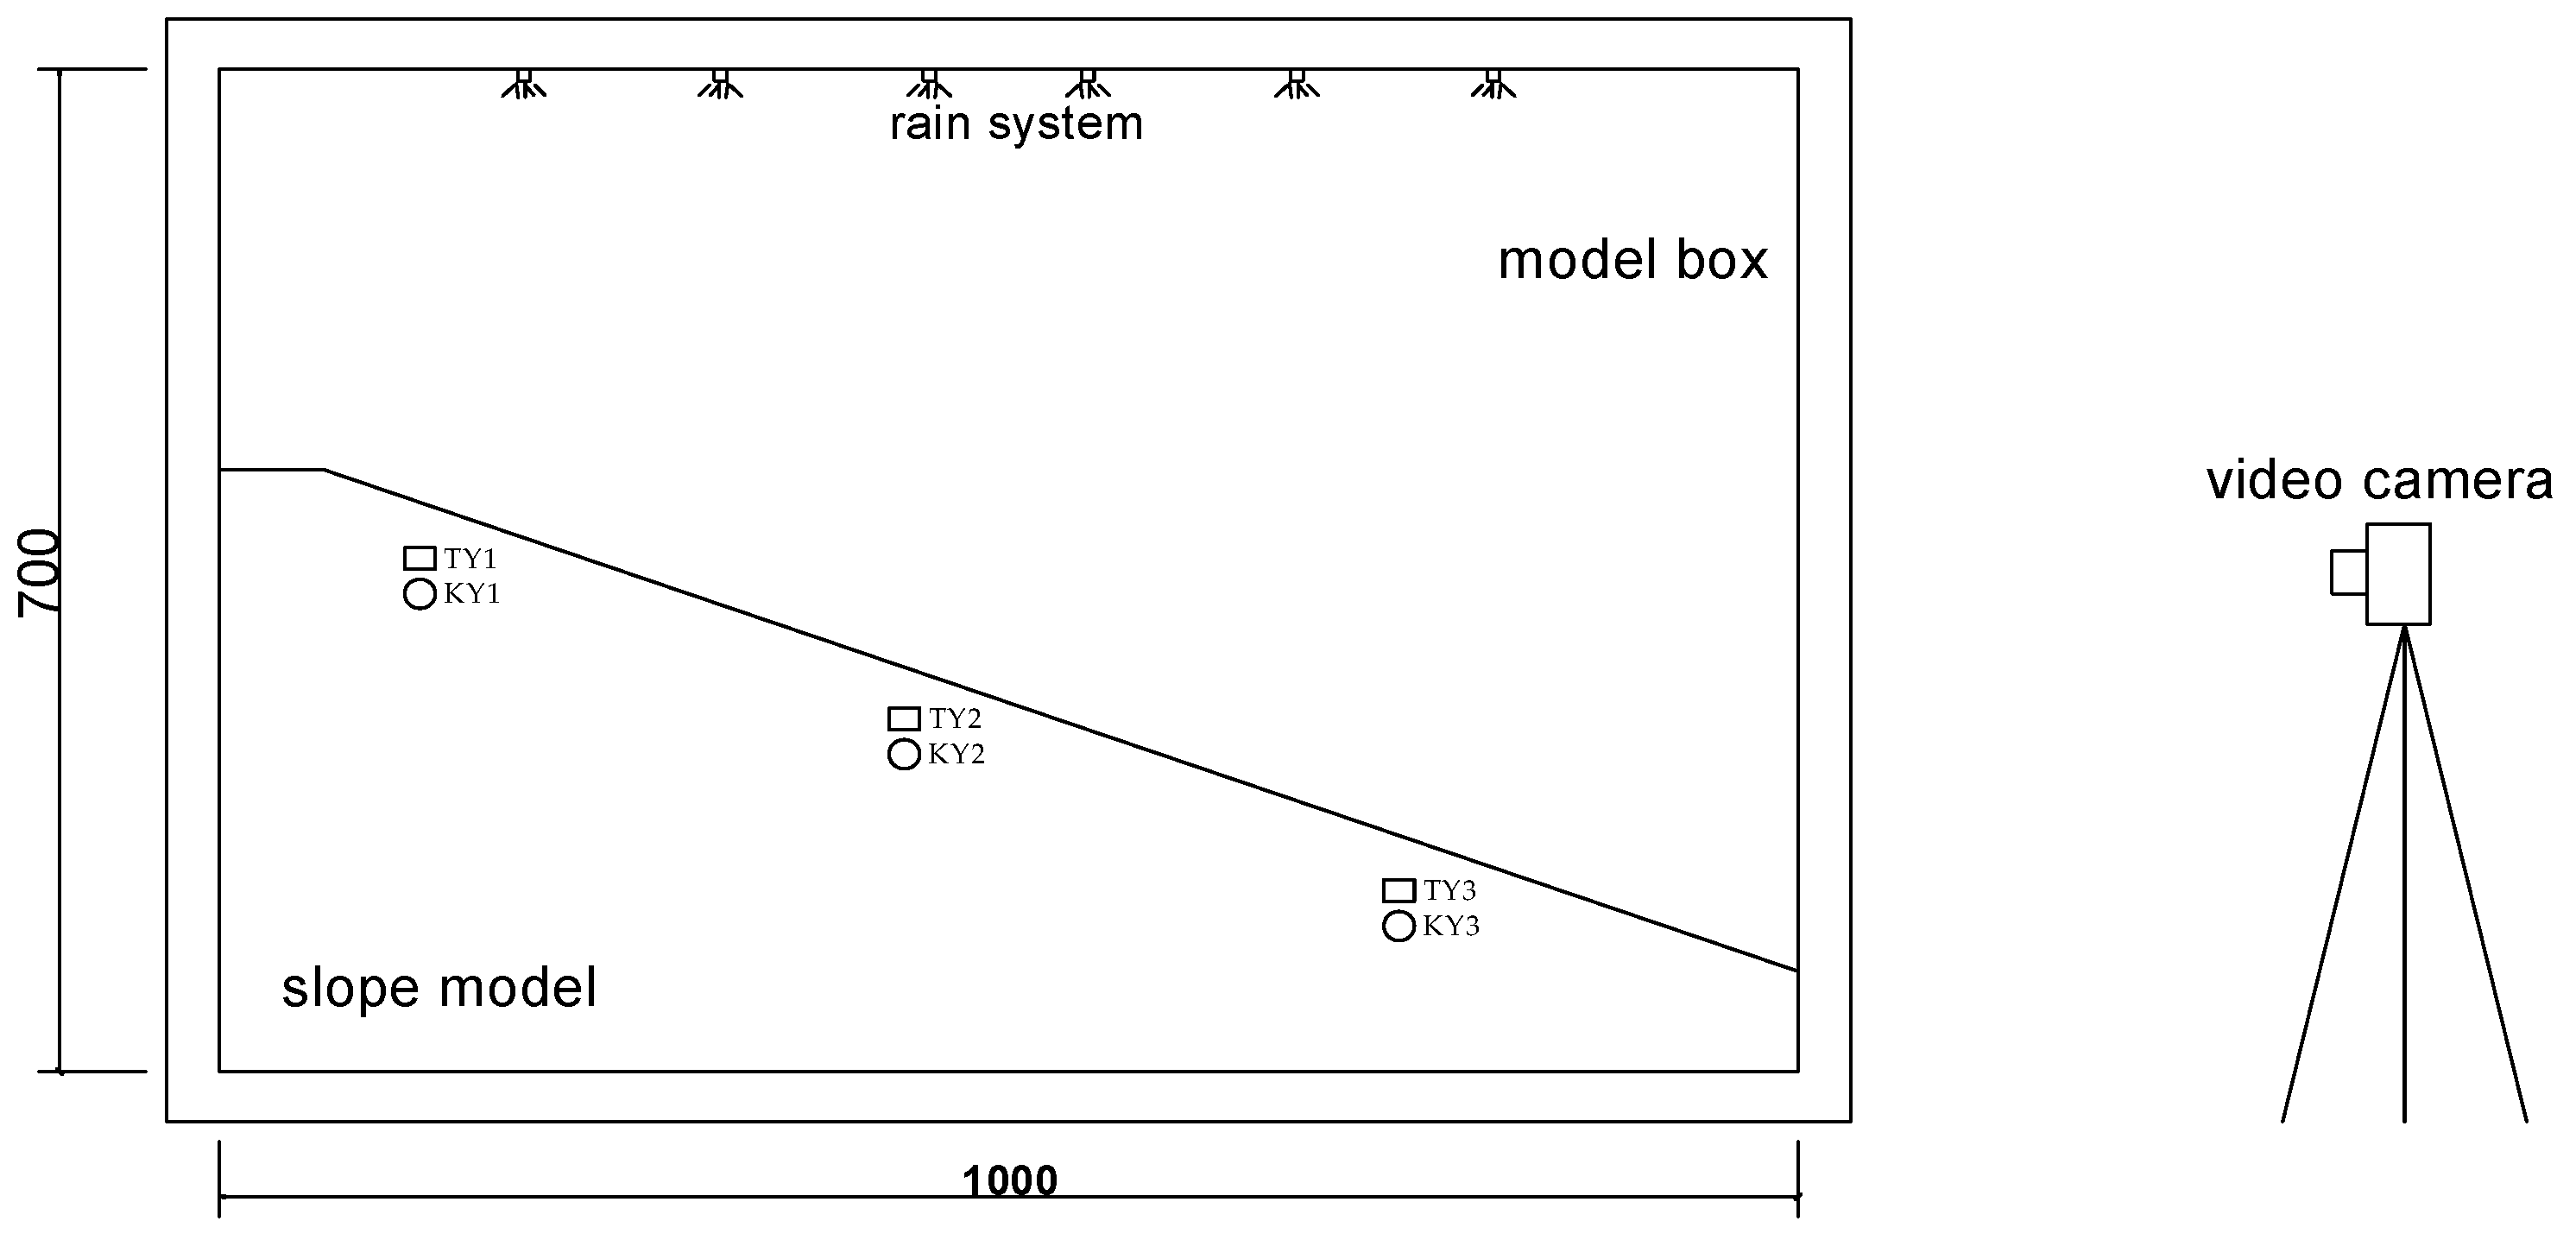
2.4. Arrangement of Monitoring Points for Model Test
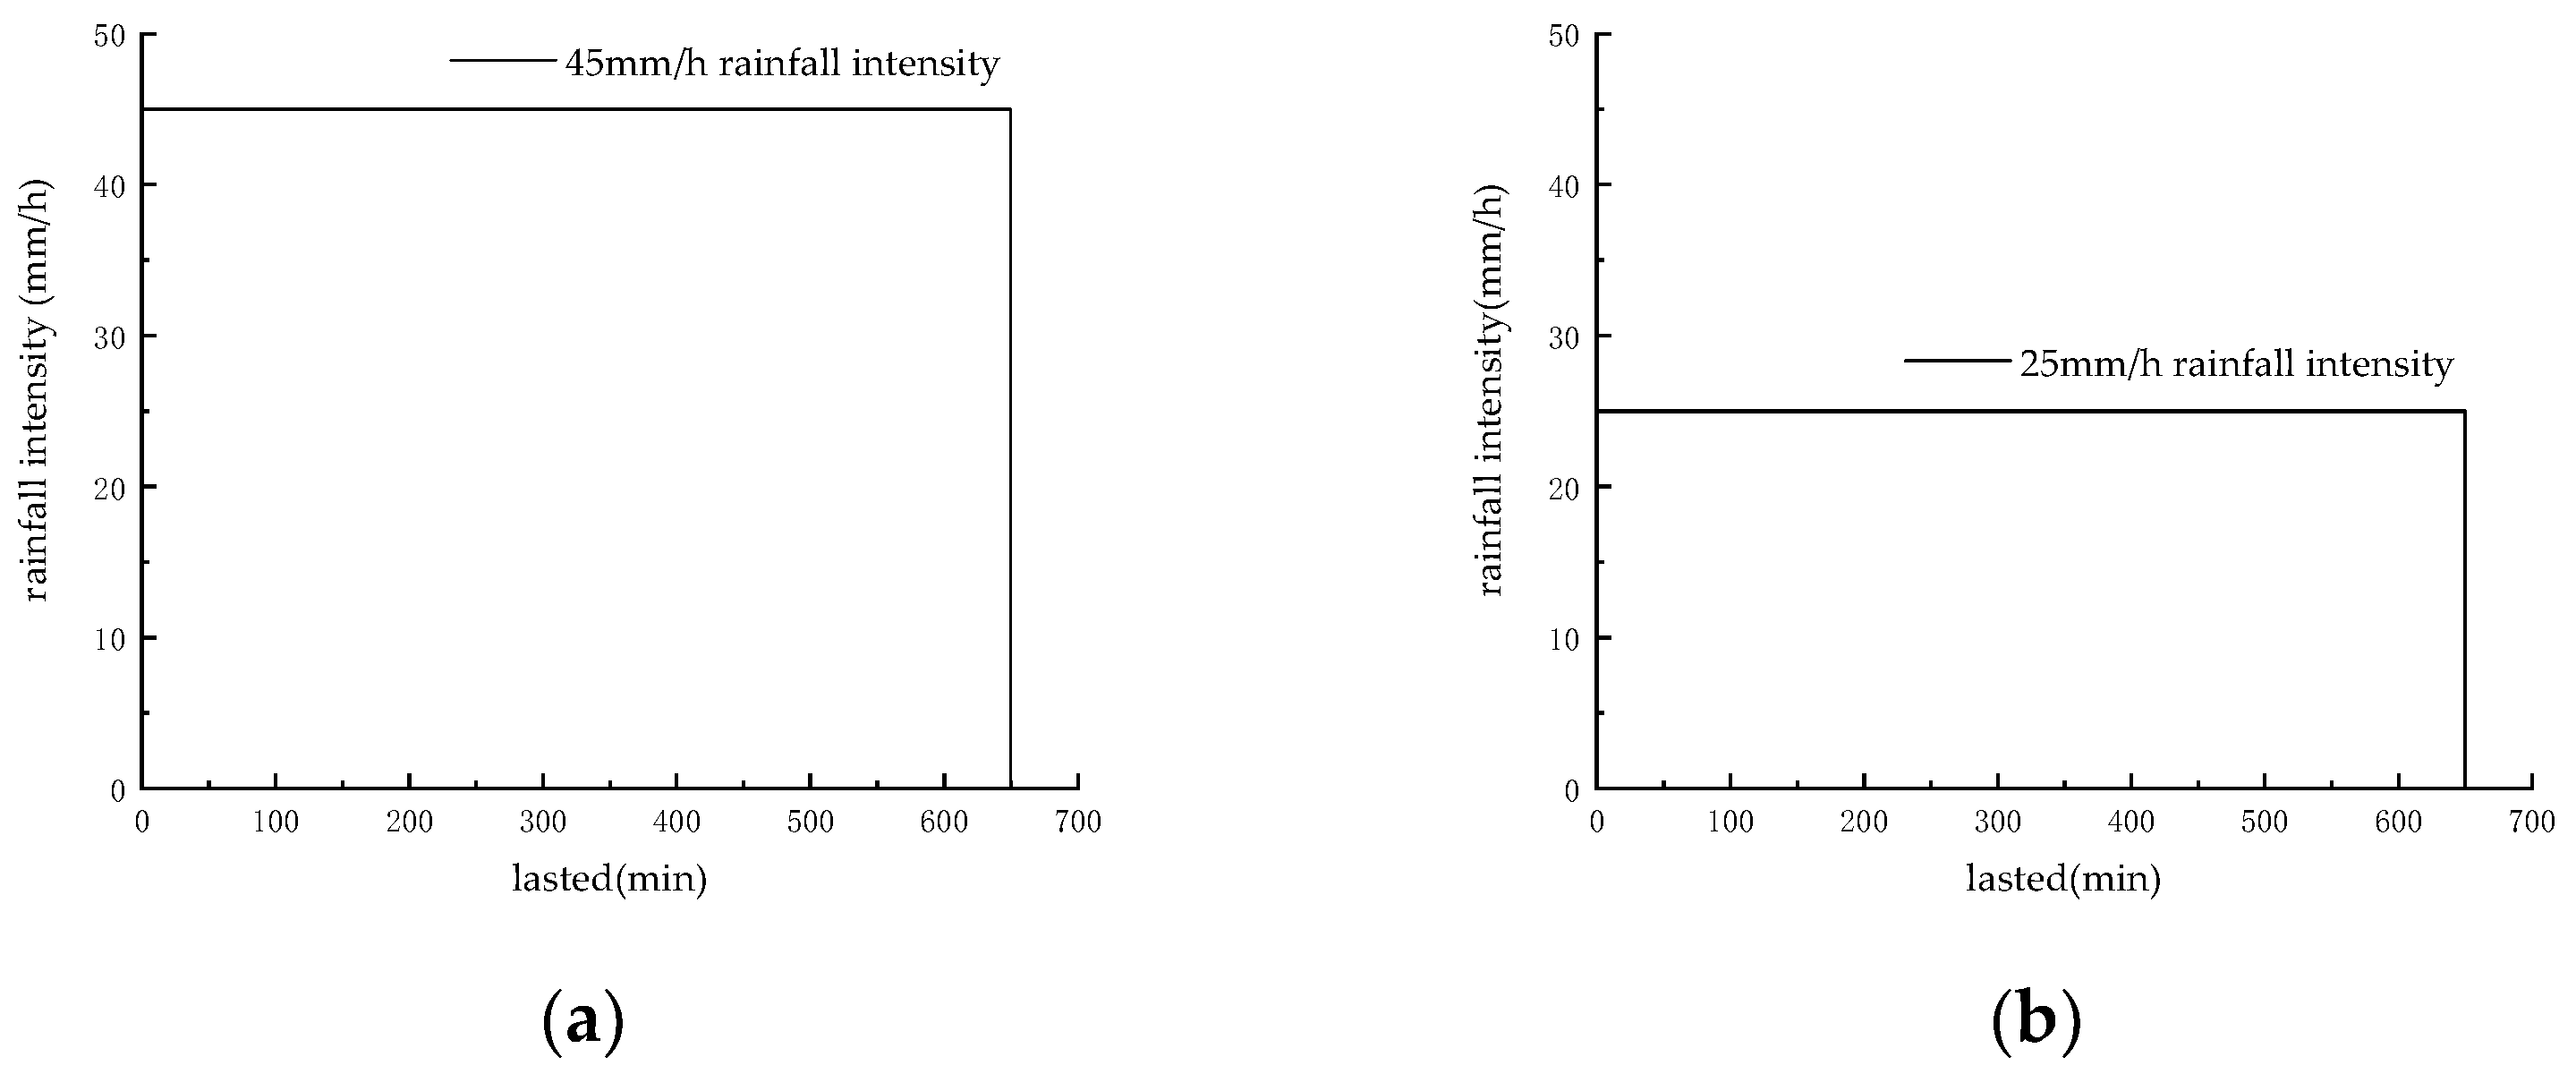
This model test mainly studied the changes of pore water pressure and soil pressure inside the soil slope under different heavy rainfall conditions, as well as the characteristics of soil deformation and failure. As shown in Figure 4, pore water pressure gauges and an soil pressure cell were arranged at the slope toe, mid-slope, and top of the slope in the shallow soil range. The two sensors were divided into one group and buried at the same position.In the test, three sets of sensors were buried at the slope foot, the middle of the slope, and the top of the slope. The first group 101 was buried near the top of the slope, and the second group 102 was buried in the middle of the slope; the third group 103 was buried near the slope foot, and the buried depth was 10 cm. Through the analysis of the change characteristics of the sensors at different positions inside the slope, the damage process of the landslide caused by the residual soil slope under the condition of heavy rainfall and the change of the soil pressure and pore water pressure inside the slope were monitored.

2.5. Test Condition

The main purpose of the test was to study the law of rainwater infiltration and slope deformation and failure characteristics of the soil slope under the action of heavy rainfall. According to the meteorological and hydrological data of Xingguo County mentioned above, combined with the model test, the rainfall rate test was carried out through the rainfall valve and the opening of the rainfall nozzle.
The determination of rainfall uniformity and intensity was one of the keys to simulate natural rainfall. According to the “Technical Specifications for Sprinkler Irrigation Engineering” (GB/T50085-2007), it is pointed out that the rainfall uniformity of rainfall simulation tests is not less than 80%. The nozzles were combined to measure the uniformity and intensity of rainfall. The maximum flow rate of each nozzle was 0.14 L/min, which translates into a maximum rainfall of 8.4 mm/h; the rainfall levels of the two preset rainfall conditions were within the range of heavy rain and heavy rain, and six rainfall sprinklers were considered to be installed. In the first test, six rainfall nozzles were turned on, and in the second test, three rainfall nozzles were turned on for the rainfall rate test. Rain intensity is defined by the beaker rain mass per unit time. The rainfall rate test is shown in Figure 5.
The test rainfall test time was 30 min. After the rainfall stops, the valve switch and the water pump were used to close the rainfall test to prevent the residual rainwater from dripping into the beaker and affect the rainfall calibration test results. This was measured by weighing the quality of rainwater in the four beakers A, B, C, D, and E, and then calculating the measured rainfall uniformity U according to Formula (5).
U = 1 M i M ¯ n M ¯
In the formula: M i —Rainfall of monitoring point i within the rainfall range within the predetermined rainfall time, in g;
n —Number of rainwater collection points;
M ¯ —Average rainfall within the predetermined rainfall time within the rainfall range, in g.
Rainfall intensity refers to the amount of rain that falls on the ground per unit area, and the unit is mm/h. Place beakers at five points in the rainfall controlled device to measure and counted the rainfall intensity at each location. The measurement method was consistent with the rainfall uniformity. The rainfall intensity is calculated according to Equation (6).
R = 1000 M i π r 2 × 1 t
In the formula: R —rainfall intensity, unit is mm/h;
M i —rainfall volume of monitoring point i within the rainfall range within the predetermined rainfall time, unit is g;
r —beaker measurement radius, 40 mm;
t —rainfall predetermined time.
The calculation and statistical results were shown in Table 2. The test statistics of rainfall lasted 30 min, and the rainfall collected by the beaker was selected. The size of the raindrops was controlled by adjusting the valve switch and the spray hole of the rainfall nozzle, and the rainfall uniformity U and rainfall intensity were calculated. Two groups of different rainfall intensities of 21 mm/h and 45 mm/h were used in the test, and the time was measured until the slope was destroyed. Figure 6 shows the model rainfall history.

3. Analysis of Physical Model Test Results

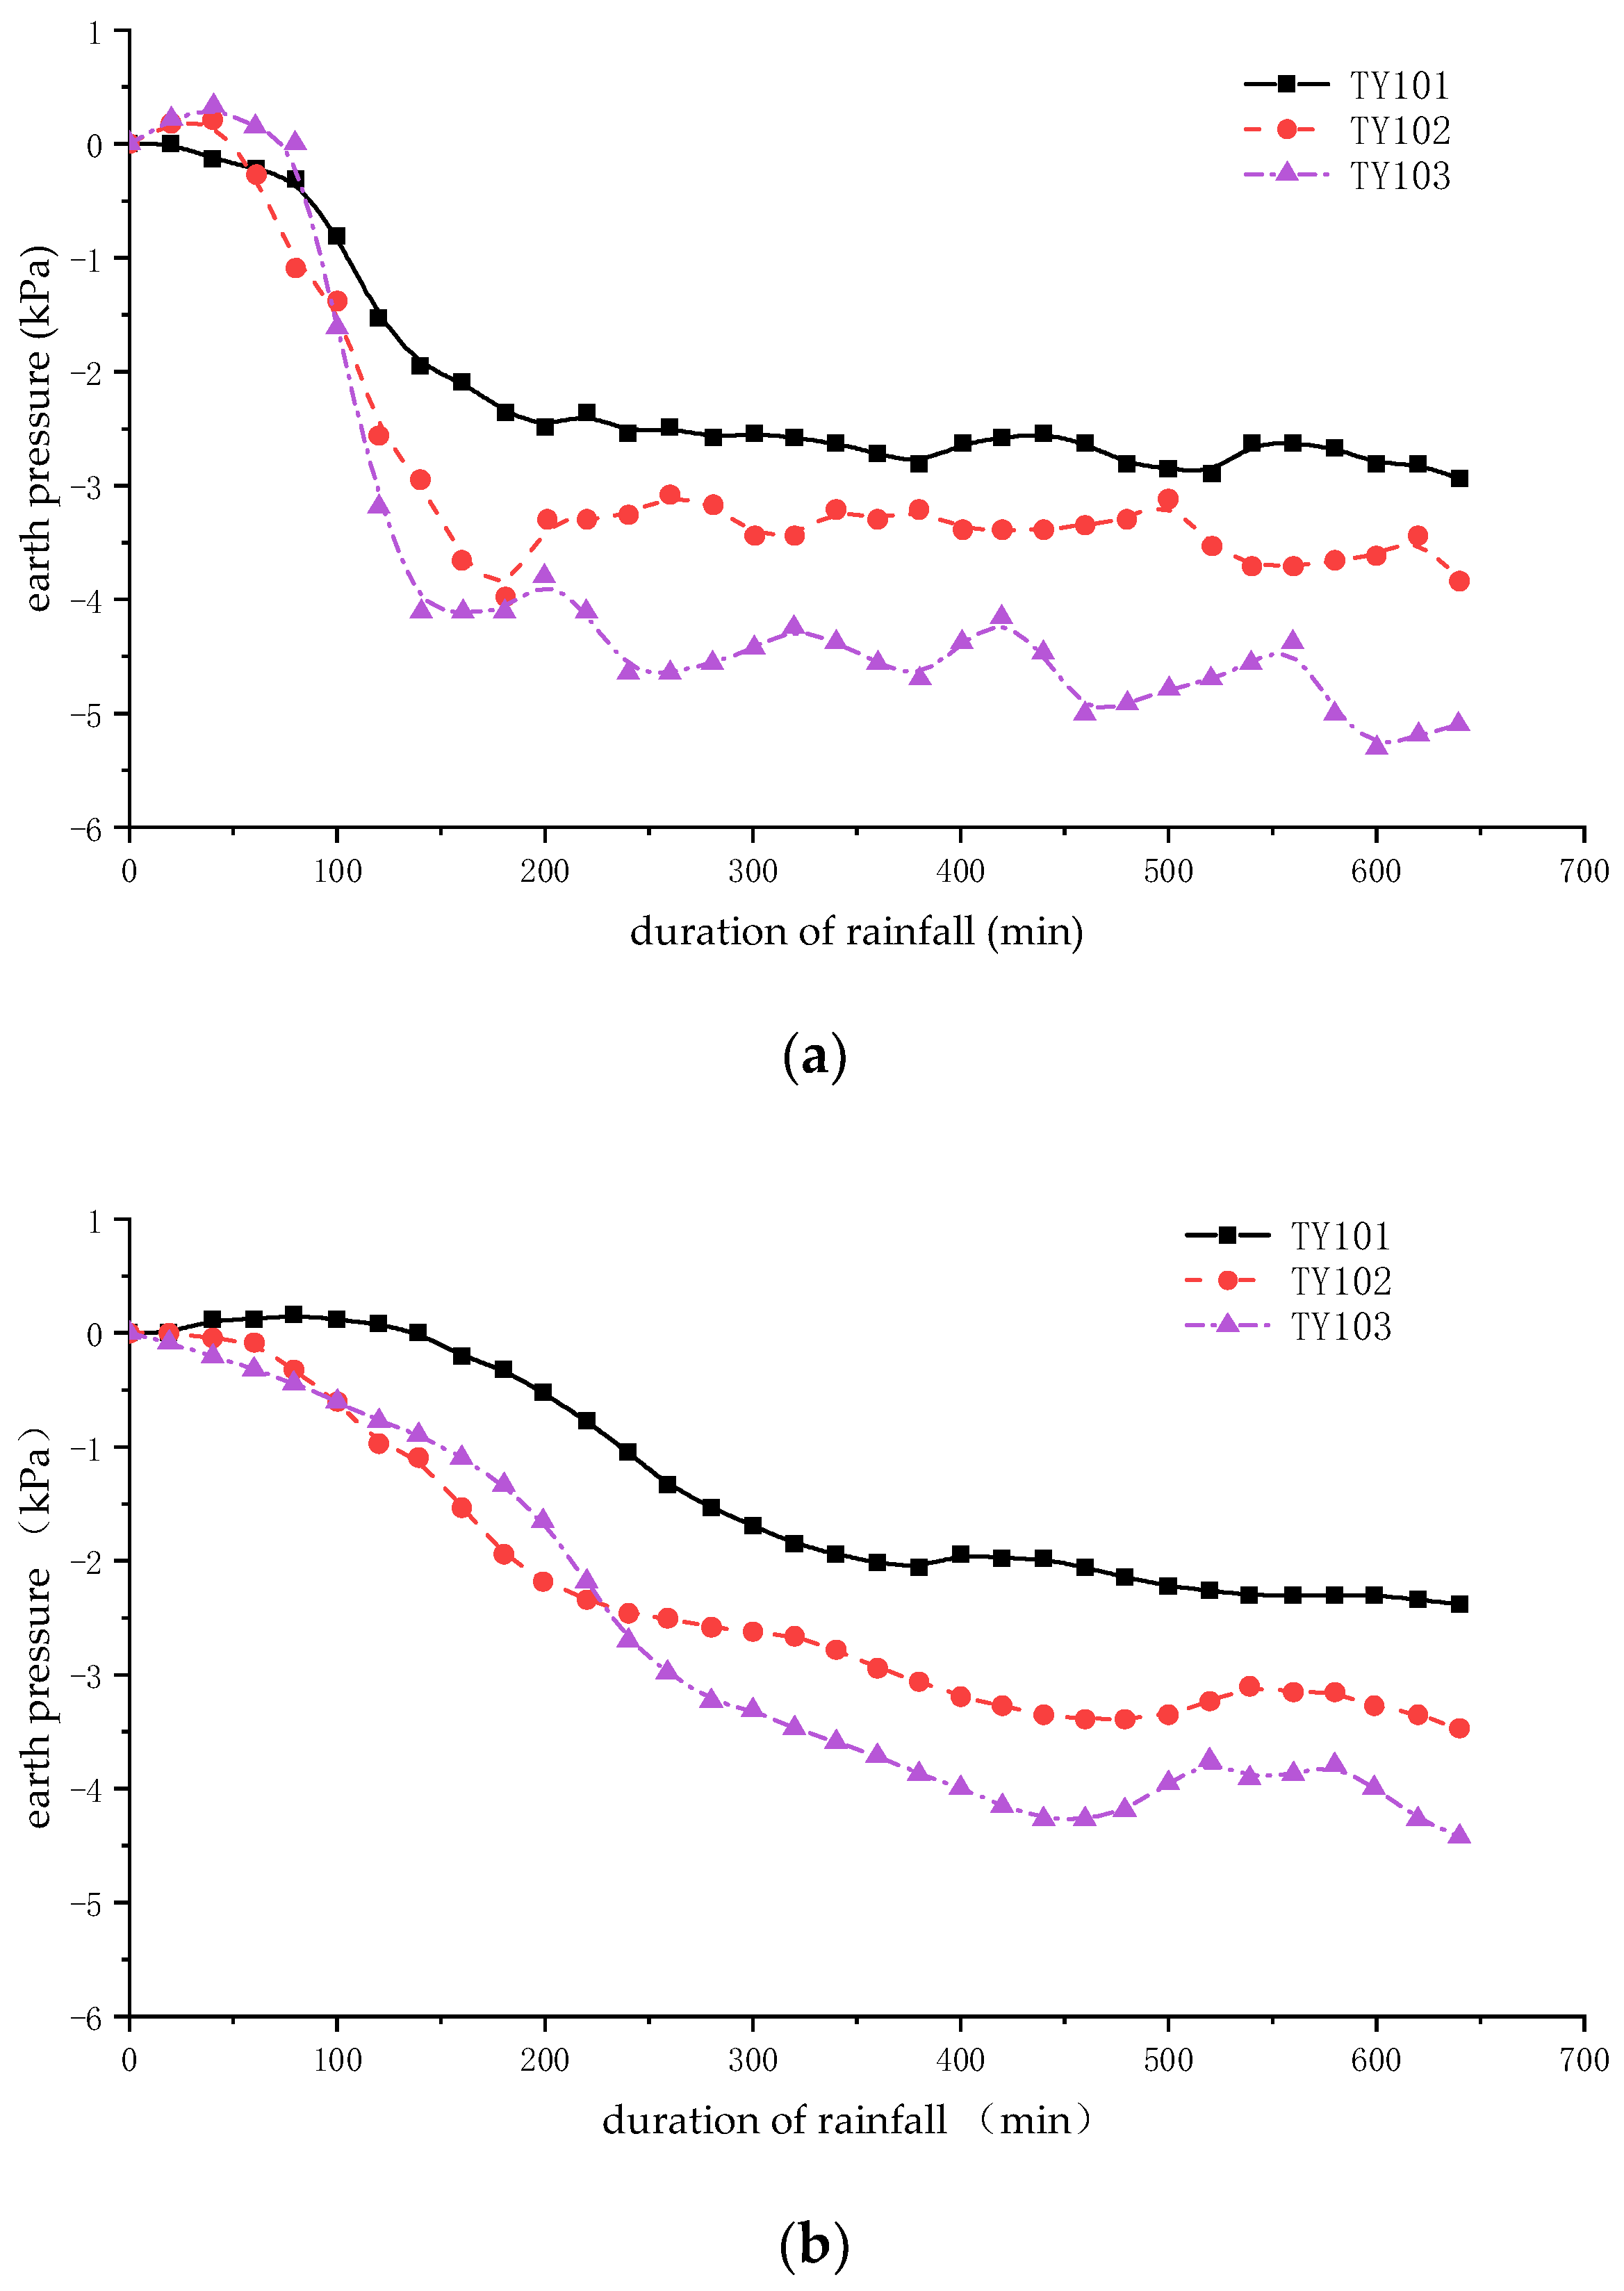
3.1. Analysis of Earth Pressure Change

Figure 7 showed the soil pressure changes at different positions on the slope top TY101, slope middle TY102, and slope foot TY103 when the rainfall intensity was 45 mm/h and 21 mm/h, respectively. According to Figure 6, the change of soil pressure presented a law of first increasing and then tends to be stable, and the soil gradually became saturated from an unsaturated state. Among them, the change of soil pressure at the slope foot TY103 was the most severe, because during the rainfall process, the rainwater not only penetrated into the slope body, but also collected at the slope foot, causing the soil to absorb water and consolidate; the weight of the upper soil increases, so the slope foots TY103 causes the soil pressure to increase. With the passage of time, the surface soil gradually became saturated, and the seepage effect of rainwater weakened. Excessive rainwater began to gather from runoff to scour the slope and erosion gullies. This led to the loss of fine-grained soil from the slope. Cracks appeared on the top surface of the slope and changed the condition of the slope. After the soil was deformed, the stress release was the reason for the decrease in the soil pressure. The measured change in soil pressure at TY101 at the top of the slope was relatively small, and the degree of damage to the surface soil was small. After a long period of rainfall, the soil pressure at TY101 at the top of the slope increased slightly, with a change in amplitude of 2.94 kPa. The variation range in TY102 in the middle of the slope in TY103 at the foot of the slope were 4.20 kPa and 5.51 kPa, respectively. During the period from 80 min to 600 min, the soil pressure fluctuated due to the influence of rainfall. This was because during the rainfall process, the water content of the soil above the sensor burial site increased, its own weight increased, and the gravitational sliding force increased. After that, it continued to creep and collapse, and the fine-grained soil was washed away by the rain, resulting in a decrease in the pressure of the overlying soil. The soil pressure sensor located at the slope toe TY103 had the largest value change before the slope slides: during the rainfall process, the slope toe was damaged first, and the damage range extended upward step by step, resulting in a decrease in soil pressure. In general, from Figure 6, we could draw the change law and mechanism of the slope during the rainfall process.
Comparing Figure 8 and Figure 9, it can be found that when the rainfall intensity was small, the change of earth pressure in the initial stage of rainfall was very small. However, when the rainfall intensity was21 mm/h, the soil pressure increased slowly at the beginning of the rainfall, and when the rainfall intensity was 45 mm/h, the soil pressure increased sharply at the beginning of the rainfall. When the rainfall intensity was 21 mm/h, the soil pressure change amplitudes of TY101 at the top of the slope, TY102 at the middle of the slope, and TY103 at the foot of the slope were 2.54 kPa, 3.47 kPa, and 4.42 kPa, respectively. During the two rainfall processes, the soil pressure at the toe of the slope changed first. At the same time, during the rainfall process, the soil pressure at the slope toe and the middle of the slope with the same buried depth changed greatly due to the rainfall, and the growth rate of the soil pressure showed a trend of being first fast and then slow. In addition, TY102 in the middle of the slope and TY103 at the toe of the slope fluctuated greatly in the late period of rainfall, mainly due to the loosening of the covering soil on the sensor at the toe of the slope, resulting in multiple landslides. With the increase in rainfall intensity, the infiltration rate of rainwater increased, and the growth rate of soil weight also accelerated, so the time required for soil pressure to change was shorter. At the same time, as the rainfall intensity increased, the time required for the soil to reach saturation became shorter, resulting in more drastic changes in soil pressure. Under different rainfall intensities, the infiltration of rainwater into the slope body will cause the upper part of the slope to increase in weight. As the rainfall progresses, the gravity sliding force of the soil will increase, resulting in varying degrees of sliding in the shallow soil. Therefore, all soil pressures will have a certain increase, which indicates that the increase in soil weight caused by rainfall was not conducive to slope stability.

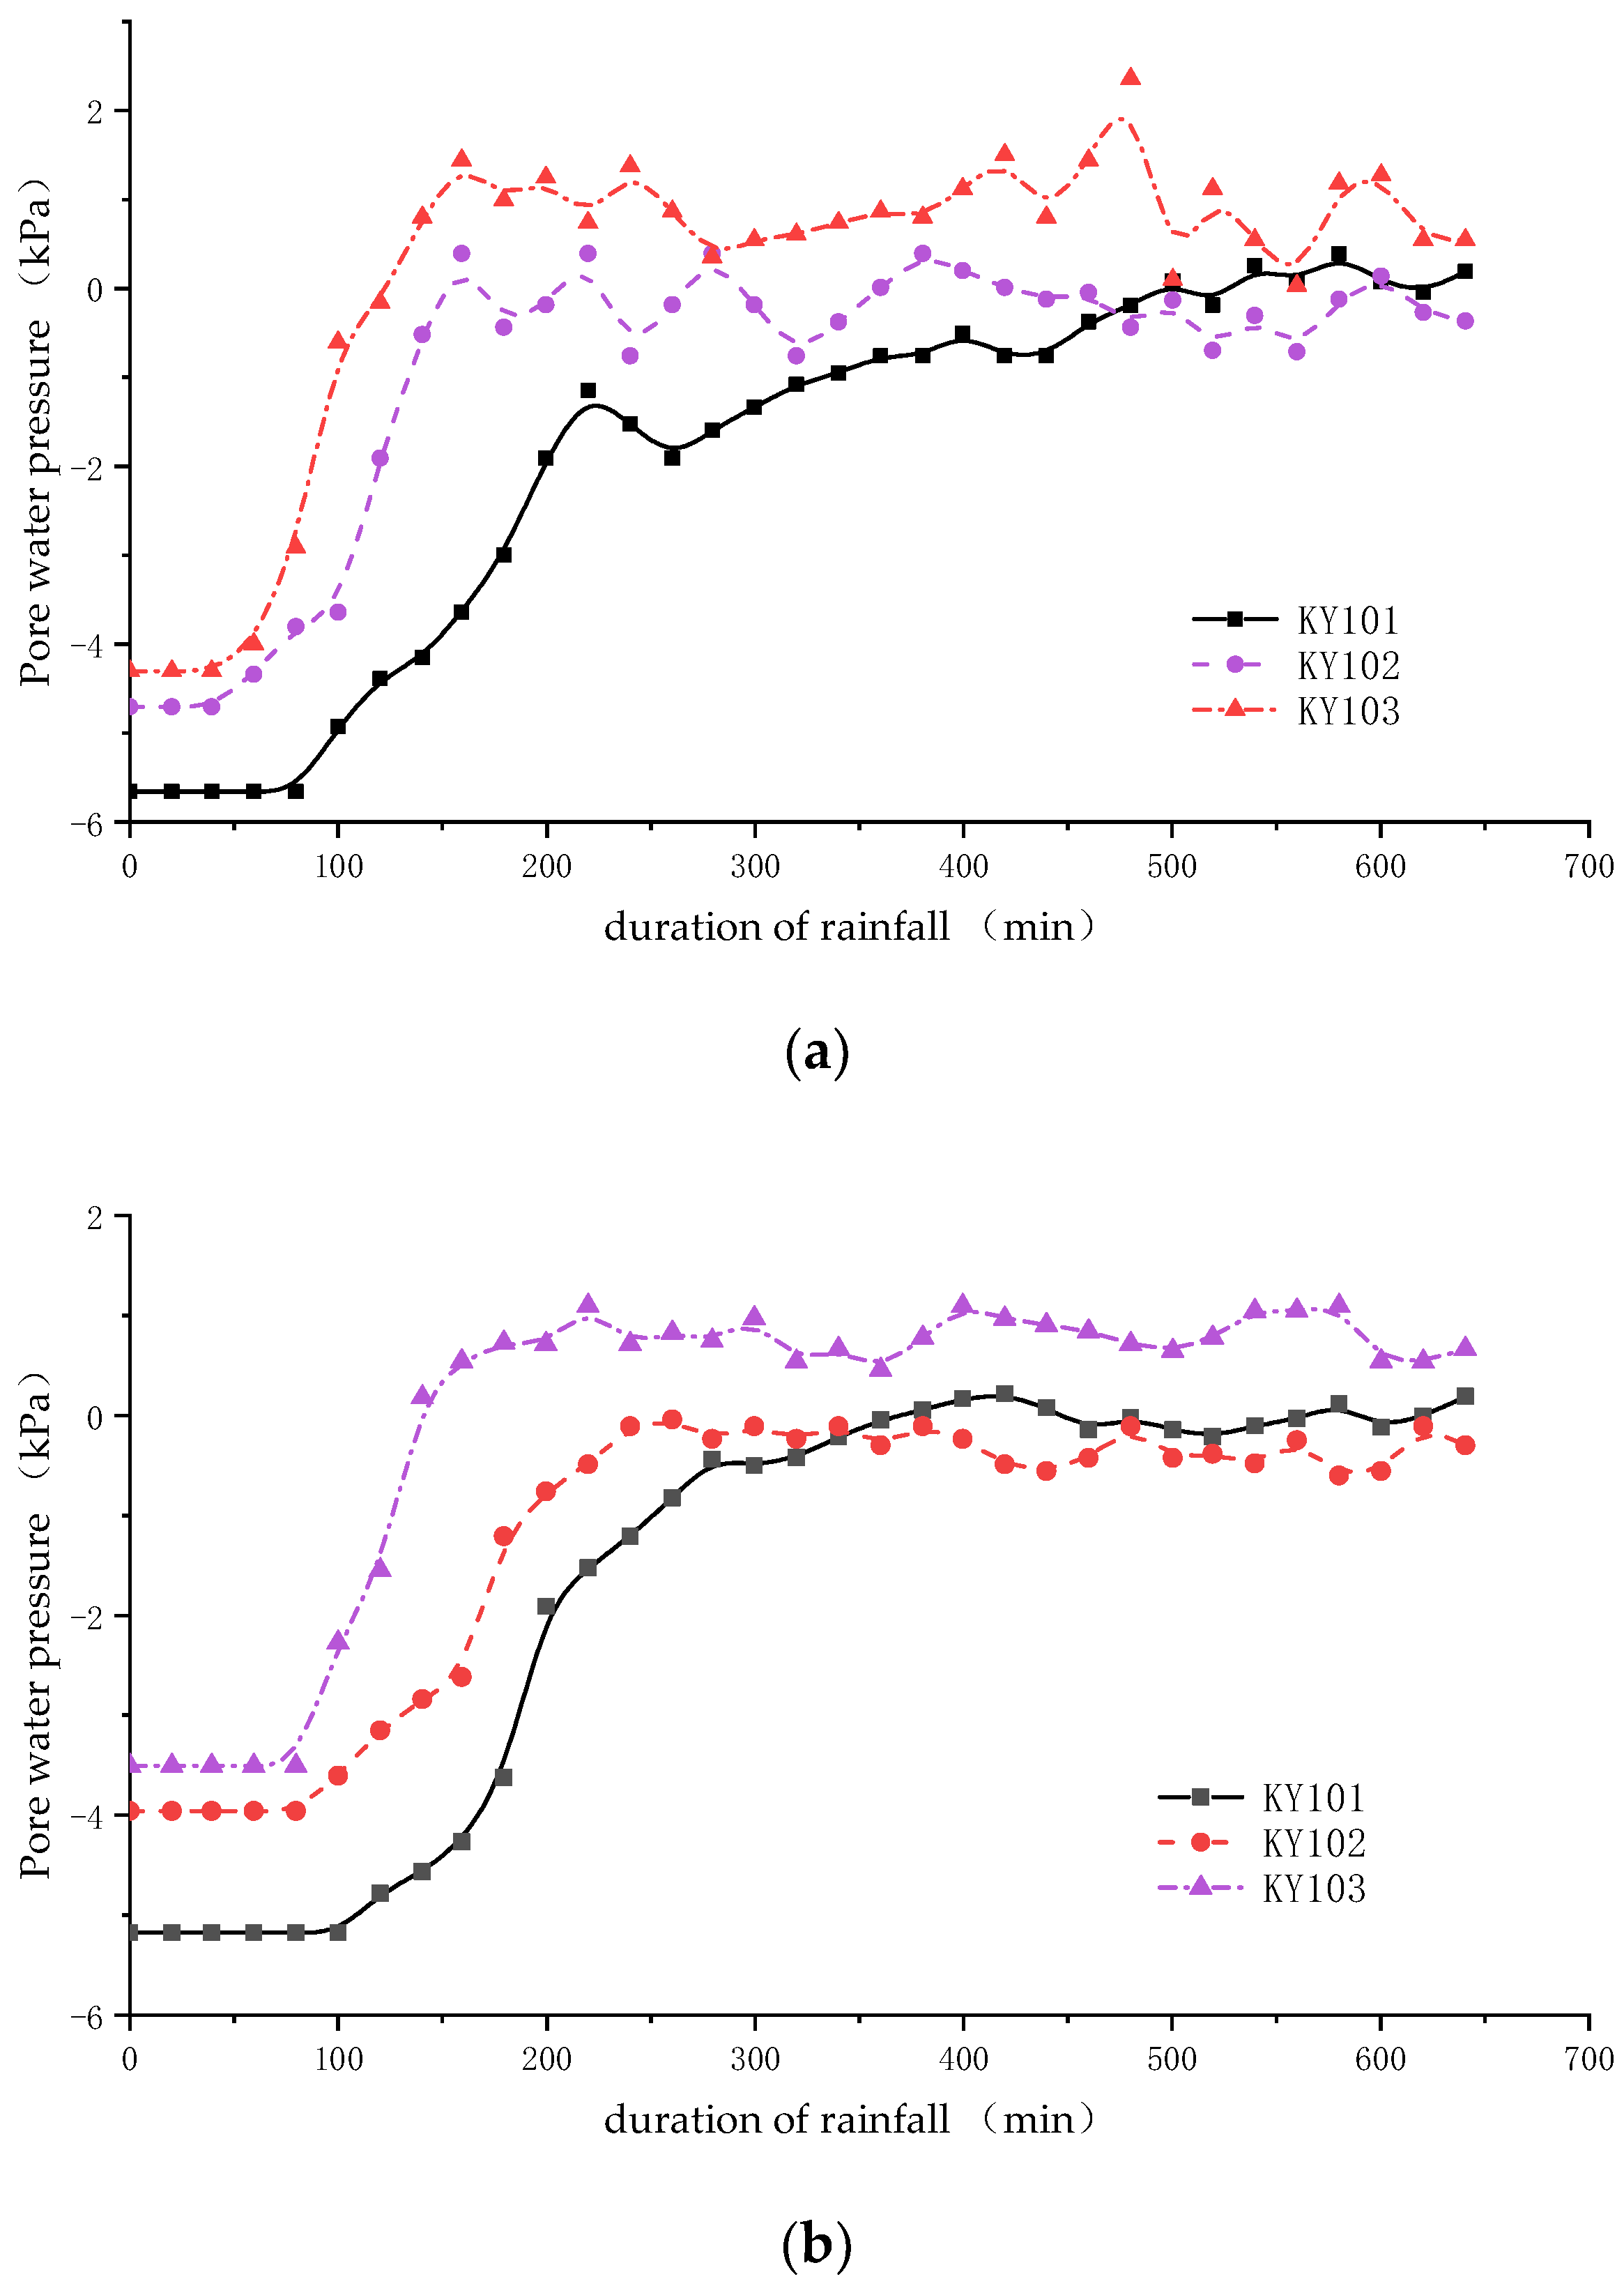
3.2. Pore Water Pressure Change Analysis

From Figure 7, it could be seen that during the rainfall process, the pore water pressure on the slope foots KY103, the slope middle KY102, and the slope top KY101 increased with the increase in the rainfall duration, and the increase rate was first fast and then slow. In the early stage of rainfall, the values of these three sensors basically showed a stable state. Since the rainwater did not infiltrate into the burial place of the pore pressure sensor at the beginning of the rainfall, the sensor did not change significantly. When reached 200–300 min, the pore water pressure increased aggressively. The reason for the sudden increase in pore water pressure was that as the rainfall proceeds, the humidification front approached the sensor and became saturated, causing the pore water pressure to increase aggressively during this period. When the rainfall intensity was 45 mm/h, as the rainfall continued, the pore water pressure at each monitoring point of the slope changed gradually. At the moment, when the soil slid down the slope, the pore water pressure at the monitoring point changed suddenly, and the KY103 pore water pressure at the foot of the slope changed most obviously. When the landslide stopped moving, the pore water pressure gradually fell back. As the position of the soil particle’s changed during sliding, the stress borne by the soil skeleton was transferred to the water, resulting in a sudden increase in the pore water pressure of the soil near the sliding area.
Analyzing Figure 9, it can be observed that the change in slope pore water pressure was also affected by rainfall intensity under the same rainfall duration. When the rainfall intensity was 45 mm/h, the pore water pressure variation amplitudes at KY101, KY102, and KY103 were 5.28 kPa, 5.10 kPa, and 6.66 kPa, respectively. When the rainfall intensity was 21 mm/h, the amplitudes of pore water pressure changes at KY101, KY102, and KY103 were 5.45 kPa, 3.85 kPa, and 4.62 kPa, respectively. The reason for the difference between KY102 and KY103 under different rainfall intensities may be that in the case of 25 mm/h, the seepage speed was greater than the rainwater infiltration speed, resulting in large fluctuations in pore water pressure, while in the case of 45 mm/h, the seepage velocity tended to the infiltration velocity until the curve was smooth. The difference between KY102 and KY103 was caused by the spatial position relationship, rainfall intensity, and seepage velocity. The reason for the difference between KY102 and KY103 under different rainfall intensities may be that in the case of 25 mm/h, the seepage speed was greater than the rainwater infiltration speed, resulting in large fluctuations in pore water pressure, while in the case of 45 mm/h, the seepage velocity tends to the infiltration velocity until the curve was smooth. The difference between KY102 and KY103 was caused by the spatial position relationship, rainfall intensity, and seepage velocity. As the rainfall intensity increased, the response time of pore water pressure on the slope was earlier by about 20–30 min. This was because the greater the rainfall intensity, the deeper the rainwater infiltrates into the slope, and the closer the rainwater was to the sensor, resulting in more obvious changes in the sensor. Additionally, the greater the rainfall intensity, the greater the fluctuation in pore water pressure.

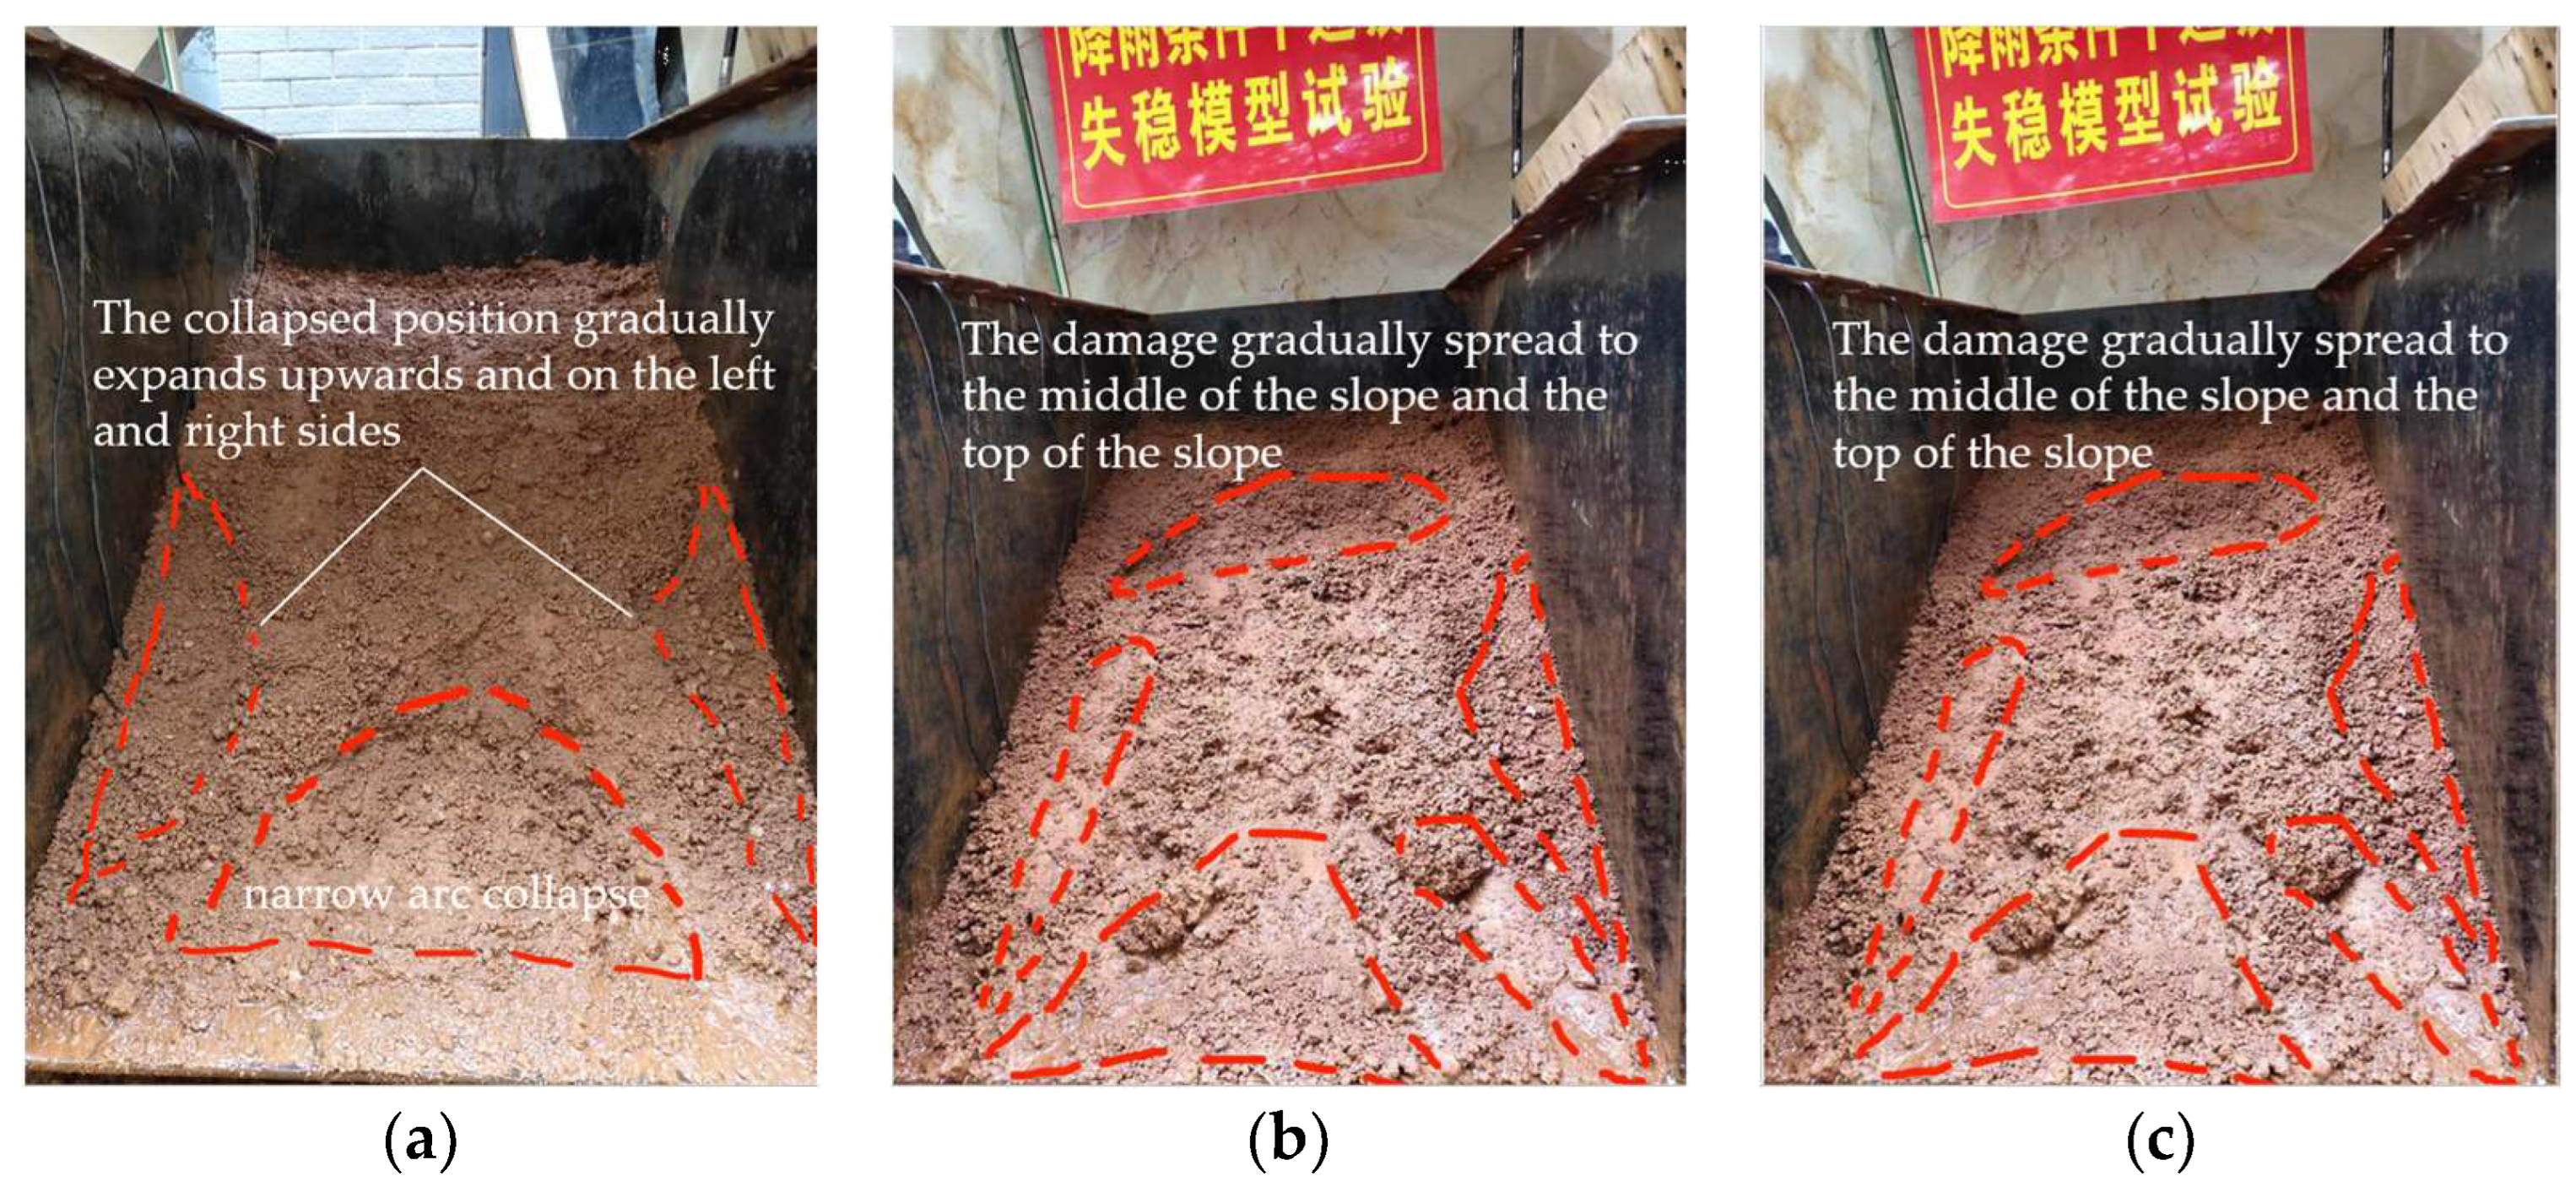
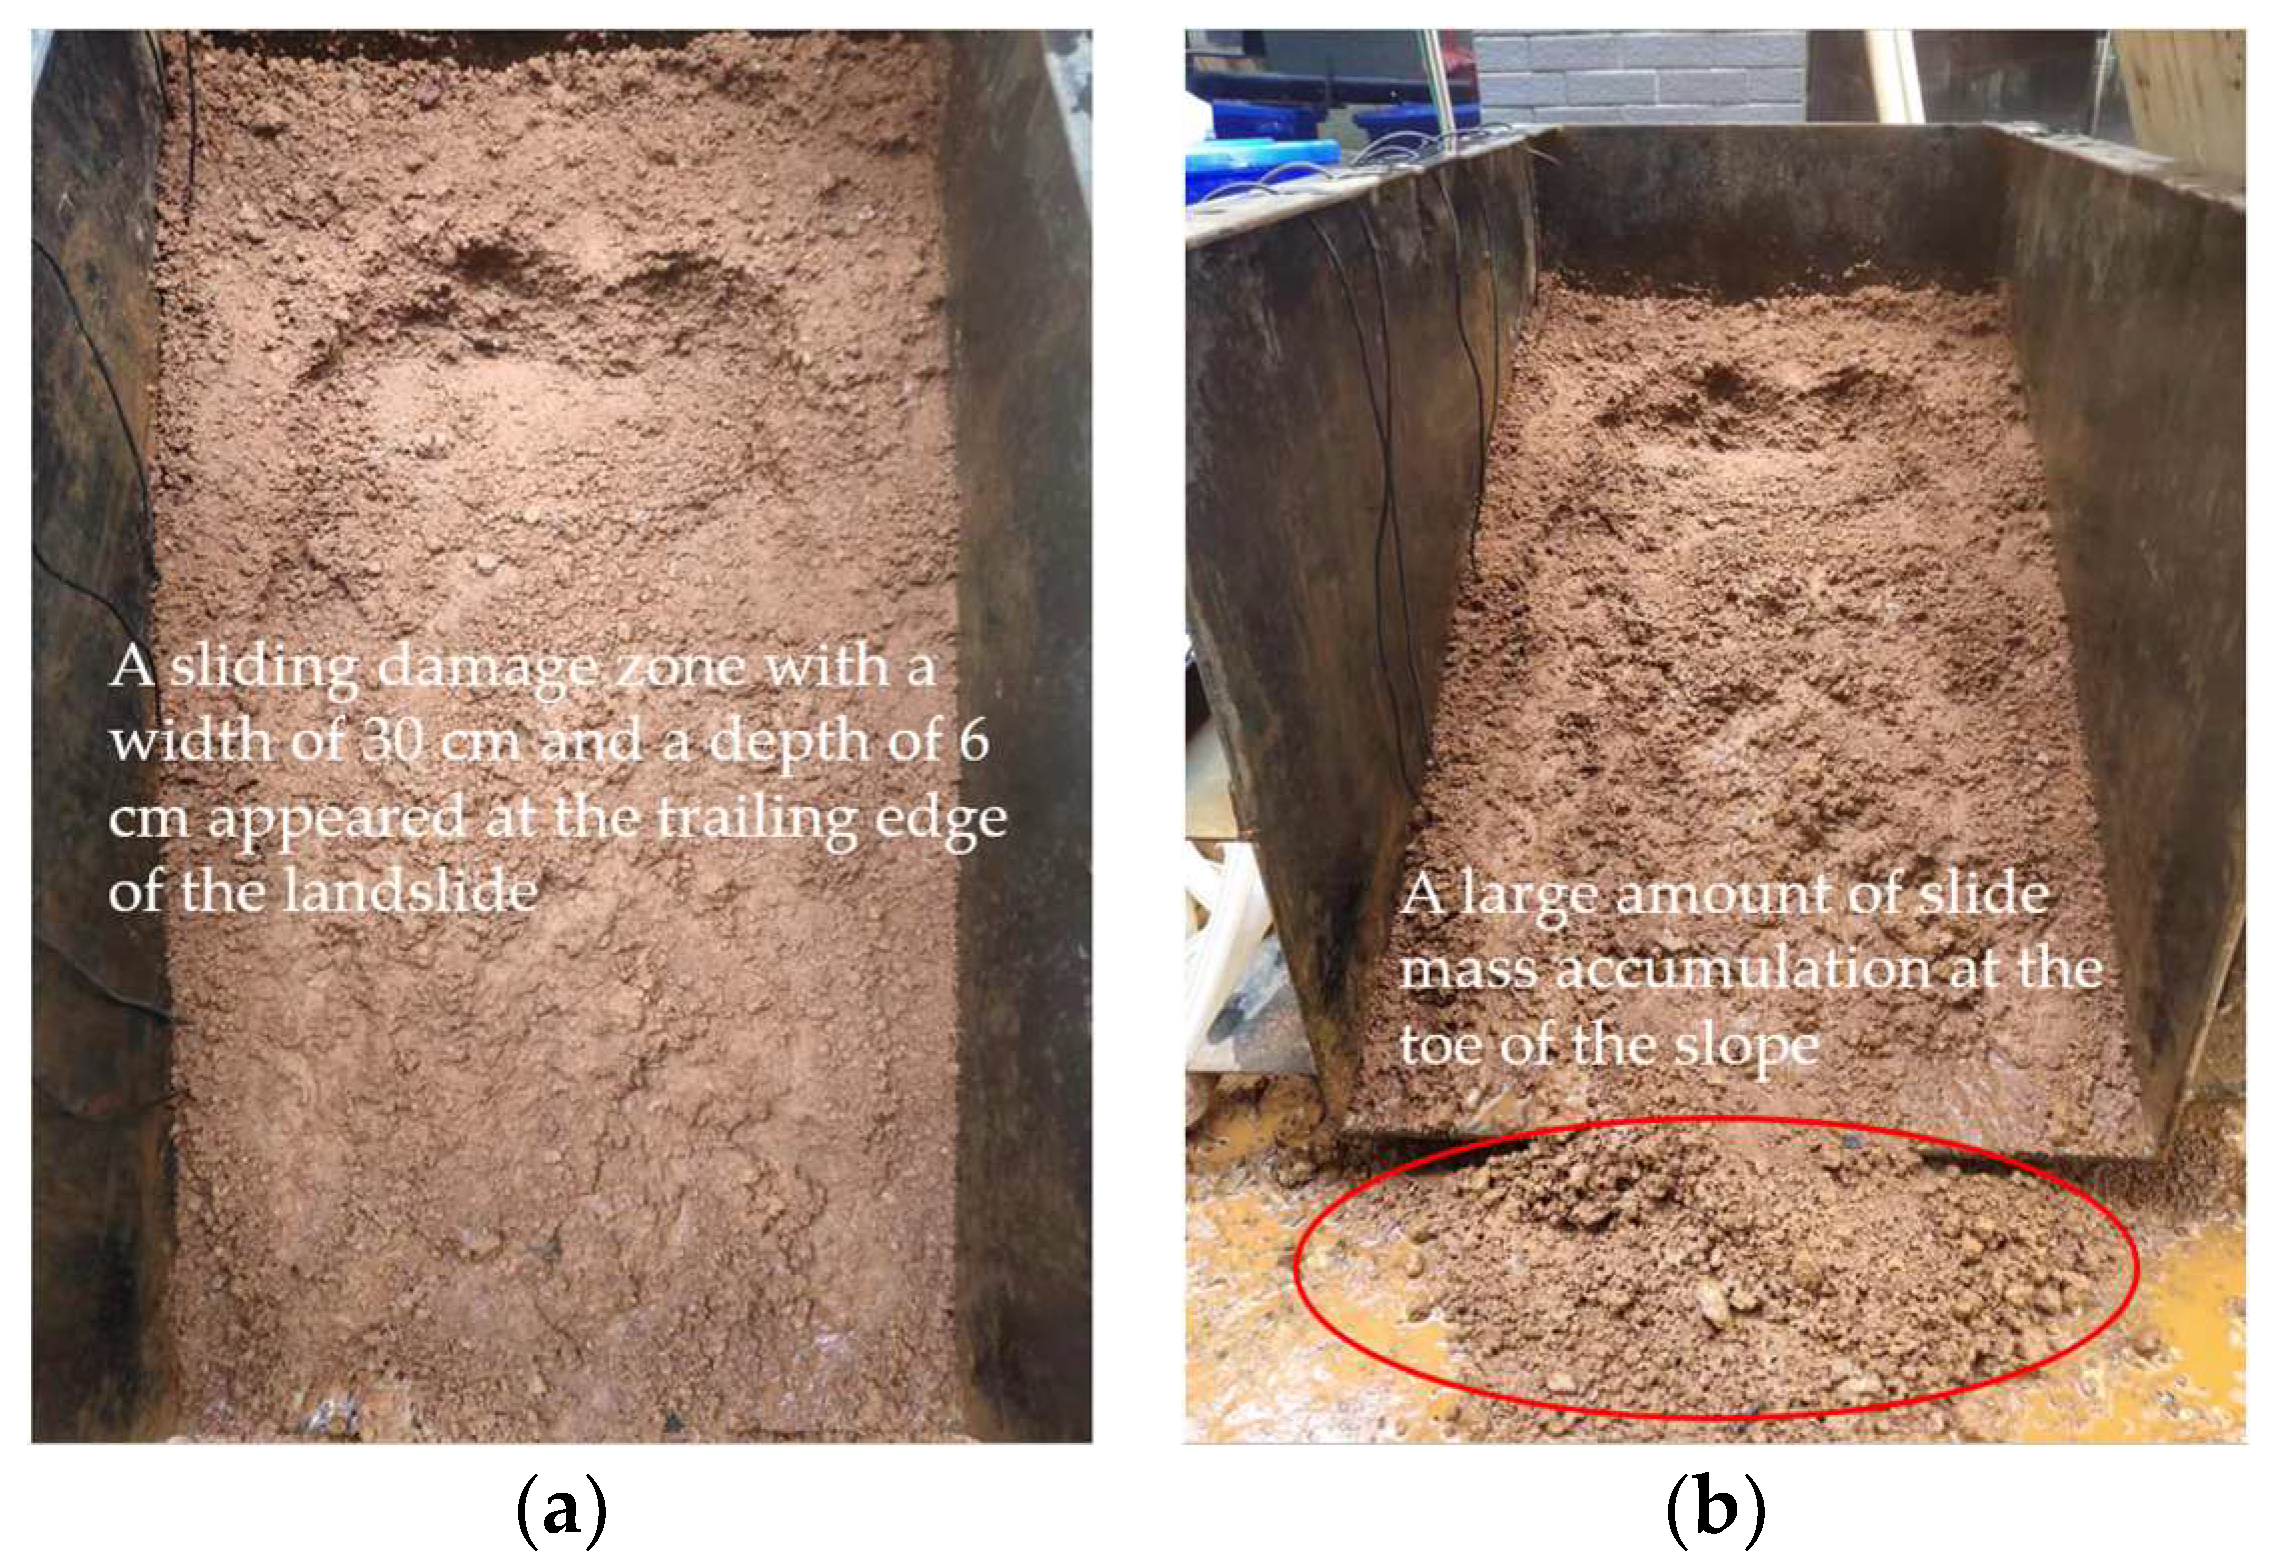
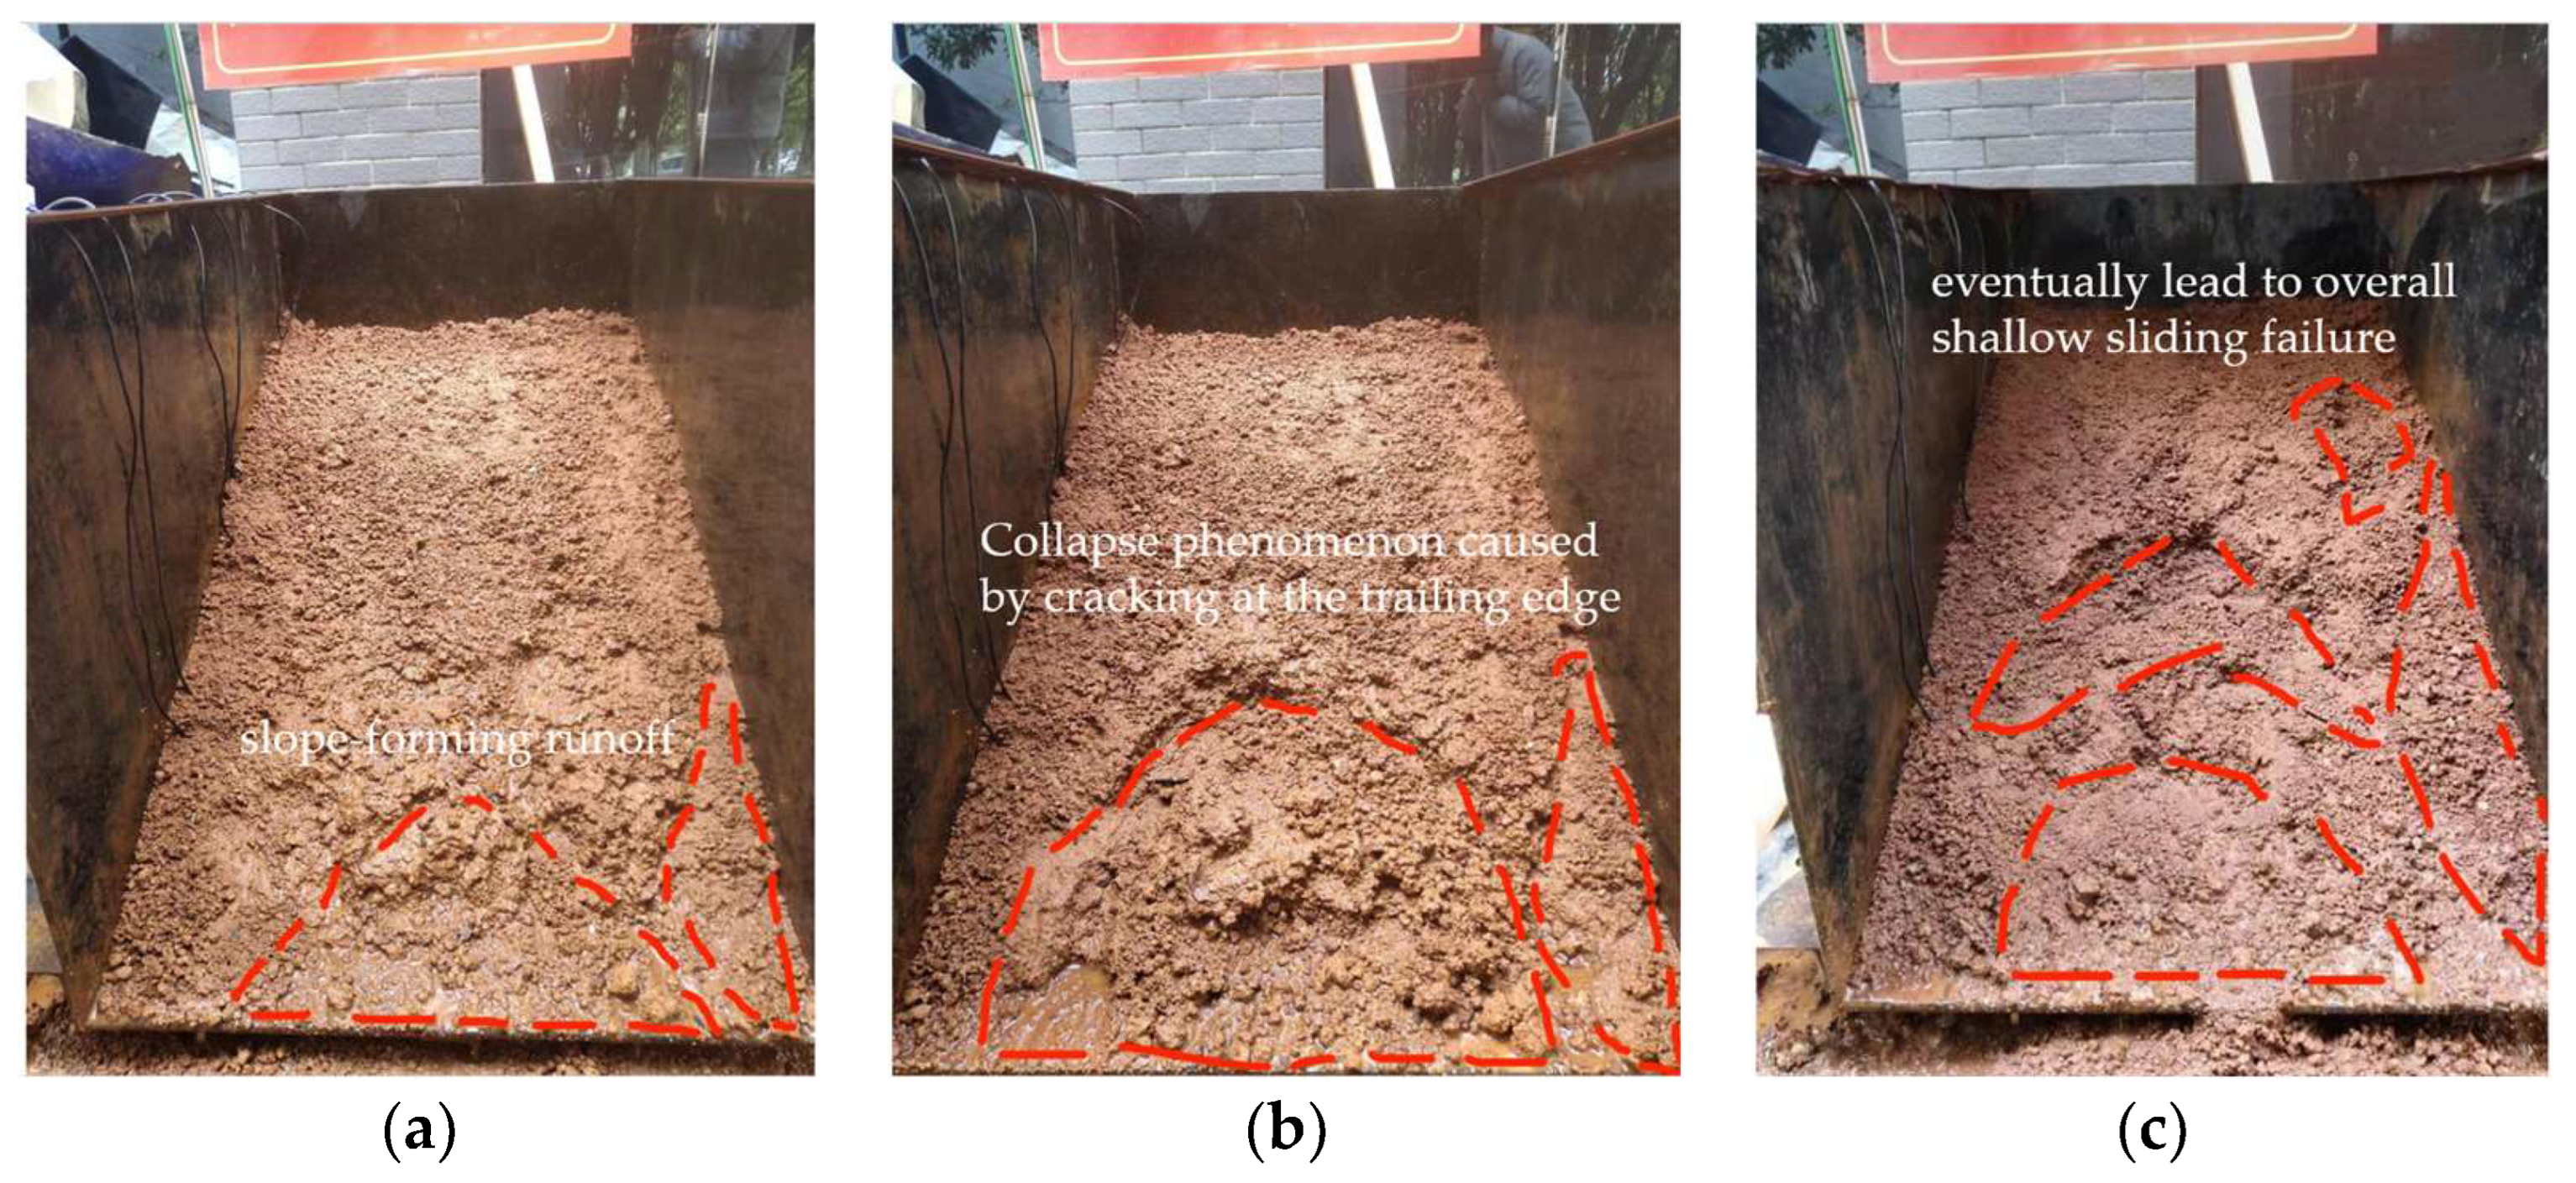
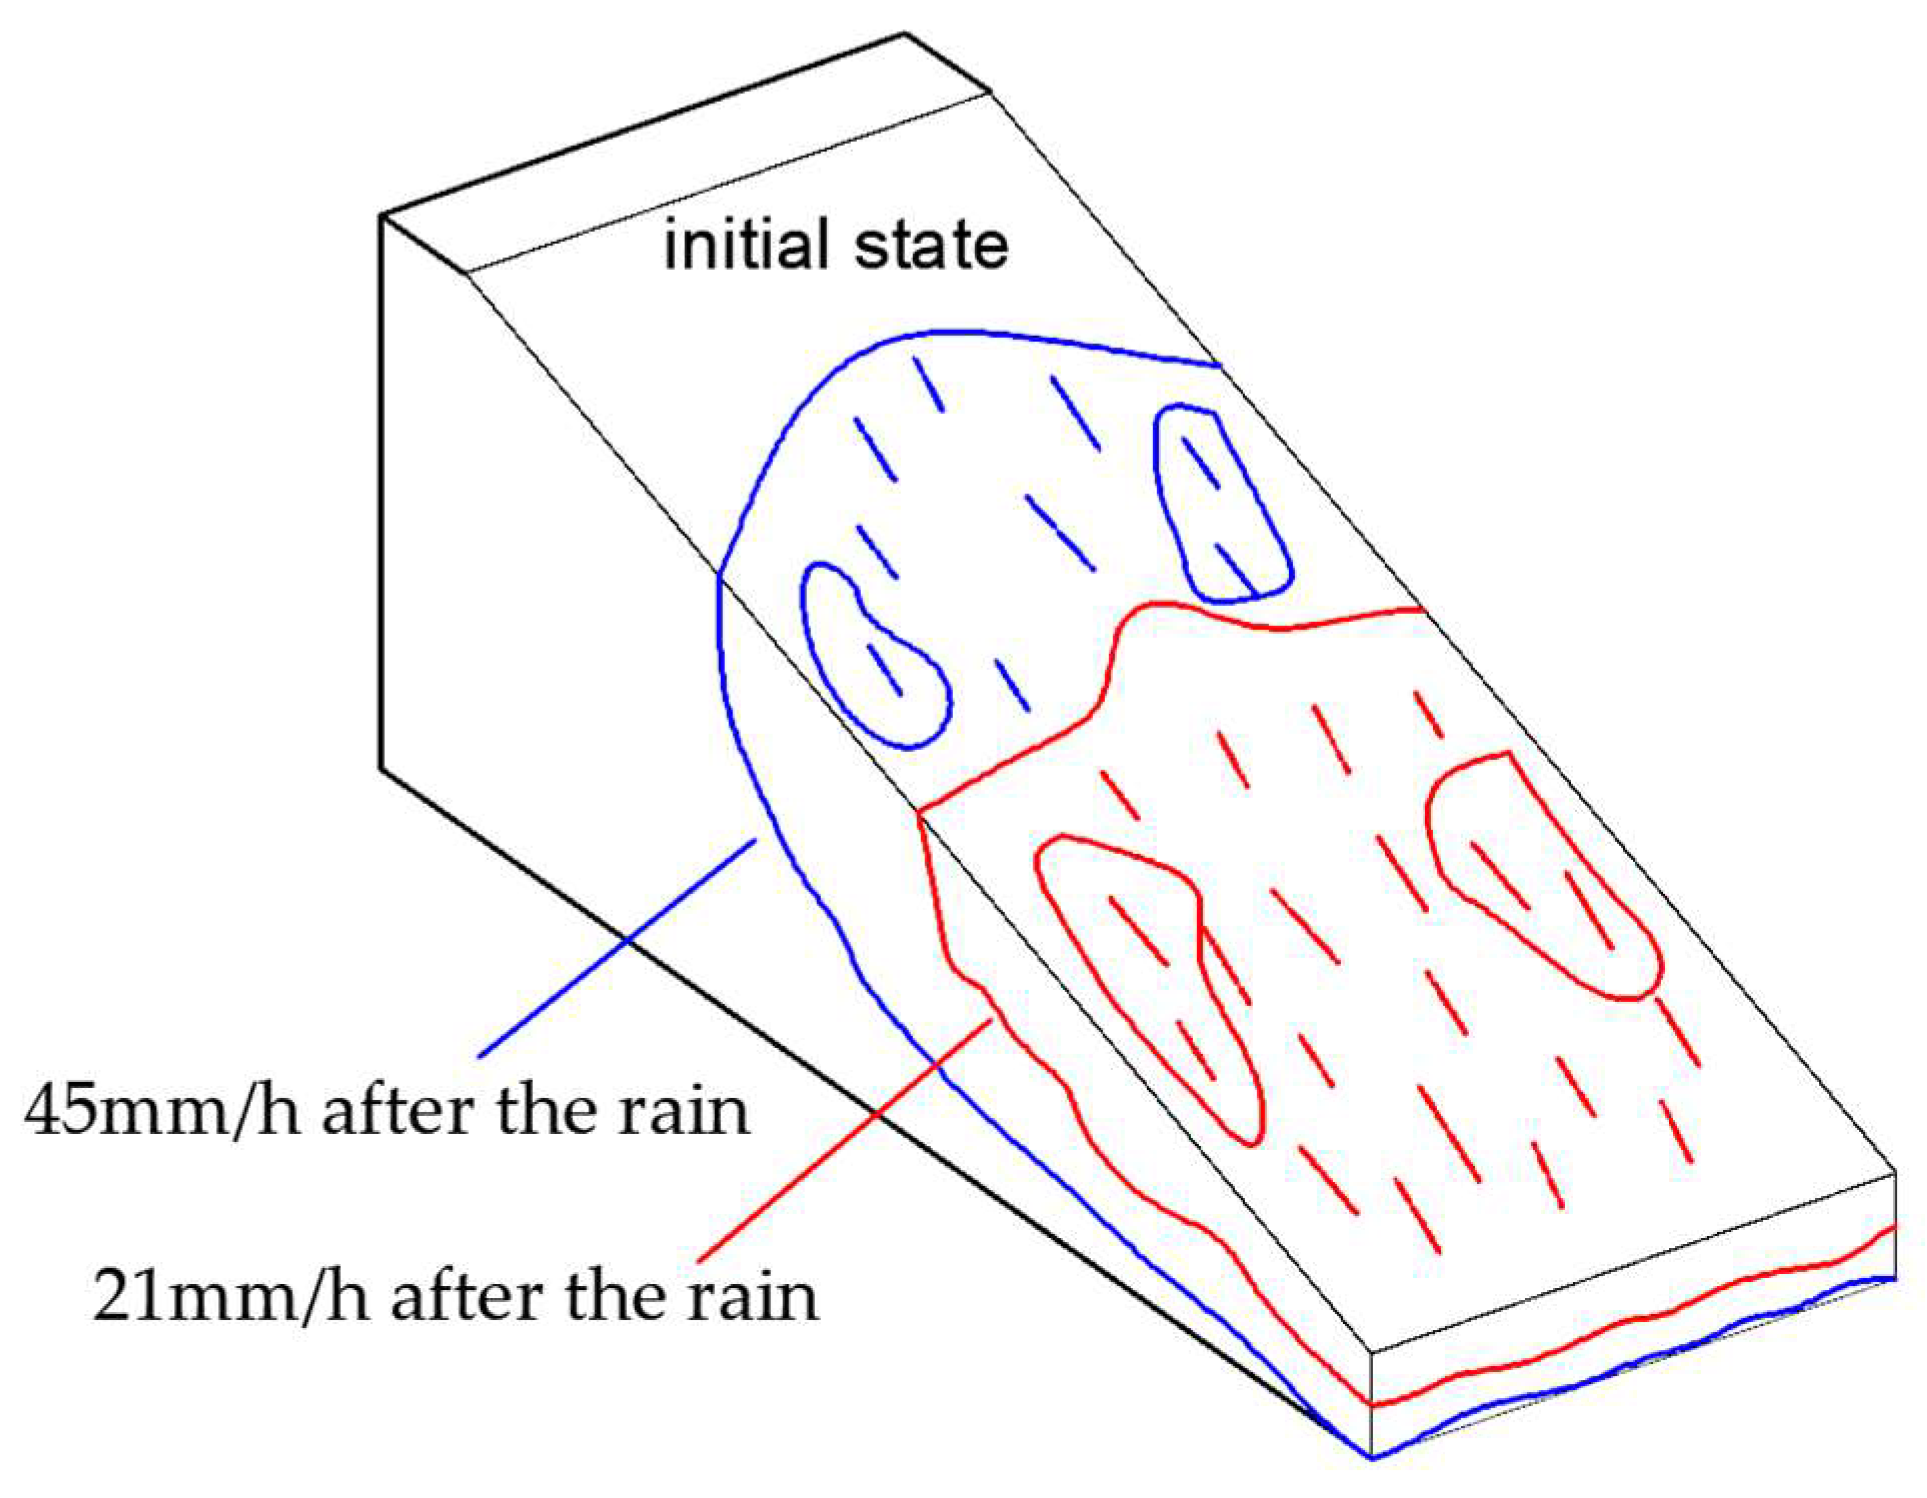
3.3. Deformation Response Characteristics

In the experiment, the deformation of the slope surface had a greater impact on the results, causing some fluctuations in the readings. During the rainfall process, the slope appeared the phenomena of pulling cracks at the trailing edge, slope surface erosion, migration of fine particles, and damage to the slope toe. When the rainfall intensity was 45 mm/h, the test results were shown in Figure 9 and Figure 10. As the rainfall began, water gradually seeped into the soil, causing the water content of the soil to gradually became saturated from unsaturated. After 180 min of rainfall, the soil at the foot of the slope was completely saturated, resulting in a circular arc-shaped collapse with a depth of about 2 cm at the bottom, wide at the bottom, and narrow at the top. As the rainfall continued, the collapse, little by little, expanded upwards and on the left and right sides. At 450 min, many erosion holes and uneven places appeared on the slope surface, and the erosion of fine soil at the foot of the slope also increased, and the damage progressively spread to the middle of the slope and the top of the slope. At this time, a pulling crack appeared on the trailing edge. At 610 min, a sliding damage zone with a width of 30 cm and a depth of 6 cm appeared on the trailing edge of the landslide. The erosion at the foot of the slope was more serious, and the erosion ditch on the slope surface was wider and deeper than that at 450 min. A large number of landslides at the foot of the slope accumulated.
The development process of this type of slope failure was as follows: as the rainfall continued, the rainwater progressively infiltrated into the soil, resulting in a decrease in the shear strength of the soil, creep deformation at the foot of the slope, small cracks on the top of the slope, and erosion ditch on the slope surface. Imperceptibly deepening and widening was conducive to the loss of rainwater carrying fine-grained soil along the erosion ditch. As the rainfall continued, soil collapsed at the trailing edge, forming a steep ridge, while sliding mass accumulation occurred at the leading edge, eventually leading to overall shallow sliding failure.
The test results for a rainfall intensity of 21 mm/h were shown in Figure 11. When the rainfall lasted for 220 min, the soil at the foot of the slope was completely saturated, a minute part of the arc collapsed, and there was a minuscule amount of water around. Subsequently, the soil collapse and cracks at the trailing edge and on both sides gradually expanded. At 410 min, the arc-shaped collapse at the foot of the slope intensified, with a collapse height difference of 2–3 cm, and several narrow erosion gullies appeared from the middle of the slope to the foot of the slope. As the rainfall continued, the deformation and destruction of the slope became more and more severe. When the rainfall lasted for 640 min, the soil in the middle of the slope collapsed in layers and the soil at the foot of the slope was always in a saturated state. Next, the sliding force of the landslide increased. The shear strength decreased. The slope began to slide shallowly, and the sliding mass accumulated at the foot of the slope and uplifted. Due to the gentle slope of the junior part of the slope and the toe of the slope was close to saturation, local shallow sliding failures had formed in the subordinate part of the slope.
By comparing the schematic diagrams of the two different rainfall intensity conditions, it could be known that when the rainfall intensity was 45 mm/h, part of the rainwater forms runoff on the slope surface, resulting in serious rainfall erosion on the slope surface, and many uneven places. The soil gradually softened in the soaking of rainwater, and many fine soil particles flowed away along the erosion ditch on the slope. The skin deep soil mass at the time of its destruction had reached a saturated state, resulting in more accumulations at the front edge, and collapse caused by pulling cracks at the rear edge, which eventually led to the overall superficial sliding failure. However, when the rainfall intensity was 21 mm/h, the surface of the slope body was less eroded by rainwater, and the rainwater continued to infiltrate into the interior of the slope body, making the slope foot easy to approach saturation. Due to the slow failure of the leading edge, local shallow sliding failure occurred in the lower part of the slope.
The development process of the deformation and failure mode of residual soil slope mainly included three stages: erosion and damage at the slope toe, formation of tensile cracks on the slope surface, and landslide instability. Generally, shallow sliding caused by erosion occurs. Regardless of whether the rainfall intensity was 45 mm/h or 21 mm/h, the slope failure starts from the toe of the slope. During the continuous infiltration of rainwater, the soil at the toe of the slope tended to be saturated and had a high water content, so the shear strength was low. As the rainfall continued, the scope of damage gradually expanded, causing erosion gullies and small cracks to appear in the middle and top of the slope. At this time, rainwater tended to flow through the erosion ditch and cracks. Fine soil particles were lost along the erosion ditch, and cracks expanded to easily from a large area of potential landslides. When the shear strength of the soil itself was less than the shear stress, it will lead to slope instability and failure. The schematic diagram of shallow sliding damage caused by two kinds of rainfall intensities was shown in Figure 12. Under the same rainfall duration, the damage area caused by the rainfall intensity of 45 mm/h was wider and deeper, and the loss of fine-grained soil on the slope surface was also more serious.

4. Discussion

By comparing the rainfall intensities of 45 mm/h and 21 mm/h under the same duration, it can be observed that fine rainfall intensity led to finer slope damage and greater accumulation at the foot of the slope after sliding. The soil pressure and pore water pressure exhibited similar response laws under the two rainfall intensities. During the initial stage of rainfall, when the soil water content was low, soil pressure and pore water pressure grew relatively rapidly as rainfall infiltrates. When the soil water content approached saturation, the growth rate of the soil pressure and pore water pressure diminished As the slope body experienced varying degrees of damage, the equilibrium state within the slope’s internal system changed, resulting in significant fluctuations of soil pressure and pore water pressure again. Once sliding occured, the interior of the landslide reached a new equilibrium state. Through on-site surveys and model tests, the rainfall infiltration rules and deformation and damage characteristics of shallow residual soil landslides under different rainfall intensities were studied. While studying the impact of rainfall on the slope, there was no analysis of the impact of rainfall on the slope after reinforcement, and no comparative study with numerical calculations. These findings suggest that rainfall intensity impacts slope stability and that changes in soil pressure and pore water pressure serve as critical indicators of the processes leading to slope failure. Such observations provided an effective basis for assessing and predicting slope stability.

5. Conclusions

Taking Xingguo County in Jiangxi Province as an example, distinctive working conditions were established to analyze the change law of slope soil pore water pressure and soil pressure under rainfall conditions, based on unusual rainfall intensities. Additionally, the deformation and failure characteristics of soil slopes caused by rainfall infiltration were examined in detail. Research results show that as rainfall intensity increased, the change range of slope soil pressure and the response speed increased accordingly. At 45 mm/h, the soil pressure only took 136 min from 0 to 4.5 kPa, while at 25 mm/h, it took 450 min. It could be seen that the response time and mutation rate of rainfall intensity to soil pressure were positively correlated. Specifically, the greatest variation amplitude of 5.51 kPa was recorded when the rainfall intensity was 21 mm/h and 45 mm/h. Furthermore, it was noted that the response time of slope soil pore water pressure was 20–30 min earlier for rainfall intensity of 45 mm/h compared to 21 mm/h; the fluctuation range was wider with the highest variation amplitude of 6.66 kPa. The study identified three stages of deformation and failure modes of residual soil slopes, which include: erosion at the foot of the slope, formation of tensile cracks on the slope surface, and instability of surface landslides. Local skin-deep sliding failure occurred on slopes under the condition of a rainfall intensity of 21 mm/h; overall, shallow sliding failure occurred on the slope when the rainfall intensity was 45 mm/h.

Author Contributions

L.Y. is responsible for the design of model experiments, data processing and article writing; C.H. and S.H. are responsible for model testing and article writing and proofreading; L.M. and J.L. are responsible for data processing and equipment debugging; Y.Q. is in charge of proofreading the thesis; H.L. is in charge of data processing. All authors have read and agreed to the published version of the manuscript.

Funding

This research was funded by the Donghua University of Science and Technology Doctoral Research Start-up Fund Project (grant No. DHBK2019240), the Natural Science Foundation of China (grant No. 42002258), the Jiangxi Geological Environment and Underground Space EngineeringResearch Center (grant No. JXDHJJ2022-013).

Acknowledgments

Thanks to State Grid Jiangxi Electric Power Co., Ltd. and Ji’an Power-Supply Branch of State Grid Jiangxi Electric Power Co., Ltd. for their financial support.

Conflicts of Interest

The authors declare no conflict of interest.

References

  1. Wu, H.; Nian, T. Shan, ZResearch progress on formation evolution mechanism and hazard prediction methods of landslides blocking rivers and forming dams. Chin. J. Rock Mech. Eng. 2023, 42, 3192–3205. [Google Scholar]
  2. Editorial Department of China Journal of Highway and Transport. A Summary of Academic Research on Traffic Tunnel Engineering in China·2022. China J. High-Way Transp. 2022, 35, 1–40. [Google Scholar]
  3. Zhang, Y.; Ren, S.; Guo, C.; Yao, X.; Zhou, N. Engineering Geology Research on Active Fault Zones. Acta Geol. Sin. 2019, 93, 763–775. [Google Scholar]
  4. Xie, W.; Gu, S.; Xiang, X.; Peng, S. Zoning evaluation of landslide susceptibility in clastic rock area based on information amount and mul-ti-model coupling. J. Nat. Disasters 2023, 32, 236–244. [Google Scholar]
  5. Yang, G.; Xu, X.; Li, P. Research on the Construction of Green Ecological Corridor in the Yangtze River Economic Belt. Prog. Geogr. 2015, 34, 1356–1367. [Google Scholar]
  6. Mu, W.; Yu, F.; Li, C.; Xie, Y.; Tian, J.; Liu, J.; Zhao, N. Effects of Rainfall Intensity and Slope Gradient on Runoff and Soil Moisture Content on Different Growing Stages of Spring Maize. Water 2015, 7, 2990–3008. [Google Scholar] [CrossRef]
  7. Runqiu, H. Large-scale landslides and their mechanism in China since the 20th century. Chin. J. Rock Mech. Eng. 2007, 182, 433–454. [Google Scholar]
  8. Mingjing, J. A New Vision of Modern Soil Mechanics Research—Macro and Micro Soil Mechanics. Chin. J. Geotech. Eng. 2019, 41, 195–254. [Google Scholar]
  9. Xu, Q.; Tang, R. Research on Red Bed and Its Geological Hazards. Chin. J. Rock Mech. Eng. 2023, 42, 28–50. [Google Scholar]
  10. Huiming, T. Research Progress and Prospect of Major Landslide Prediction and Forecasting. Bull. Geol. Sci. Technol. 2022, 41, 1–13. [Google Scholar]
  11. Yang, T.; Zhang, F.; Yu, Q.; Cai, M.; Li, H. Research status and development trend of high and steep slope stability in open-pit mines. Rock Soil Mech. 2011, 32, 1437–1451. [Google Scholar]
  12. Xie, Y. Evolution of Surface Drainage Network for Spoil Heaps under Simulated Rainfall. Water 2021, 13, 3475. [Google Scholar]
  13. Yang, Q.; Wang, Y.; Ma, Y. Distribution law and triggering factors of geological hazards in China from 2001 to 2019. J. Geol. Hazards Environ. Preserv. 2020, 31, 43–48. [Google Scholar]
  14. Wen, H.; Zhang, Y.; Fu, H.; Xie, P.; Hu, J. Research progress on instability mechanism and stability evaluation methods of rainfall-type land-slides. China J. Highw. Transp. 2018, 31, 15–29. [Google Scholar]
  15. Zhang, L.Y.; Chen, T.L.; Zhang, D.L. Study on Progressive Failure of Expansive Soil Slope Induced by Rainfall. Chin. J. Geotech. Eng. 2019, 41, 70–77. [Google Scholar]
  16. Pan, J.; Hou, D.; Li, R.; Zhu, Q.; Wei, Y.; Zhang, Z. Rainfall infiltration test and analysis of loess slope under different rainfall intensities. J. Eng. Geol. 2018, 26, 1170–1177. [Google Scholar]
  17. Zhang, S.; Pei, X.; Huang, R.; Zhang, X.; Chang, Z.; Zhang, Z. Model Test of Rainfall Infiltration Characteristics and Deformation and Failure Modes of Loess Fill Slopes. China J. Highw. Transp. 2019, 32, 32–41. [Google Scholar]
  18. Ni, W.; Tang, H.; Hu, X.; Wu, Y.; Su, A. Study on the evolution law of deformation and stability of Huangtupo Linjiang No. 1 landslide mass. Rock Soil Mech. 2013, 34, 2961–2970. [Google Scholar]
  19. Shao, W.; Bogaard, T.A.; Bakker, M. Greco R. Quantification of the influence of preferential flow on slope stability using a numerical modelling approach. Hydrol. Earth Syst. Sci. 2015, 19, 2197–2212. [Google Scholar] [CrossRef]
  20. Moradi, S.; Huisman, J.A.; Class, H.; Vereecken, H. The Effect of Bedrock Topography on Timing and Location of Landslide Initiation Using the Local Factor of Safety Concept. Water 2018, 10, 1290. [Google Scholar] [CrossRef]
  21. Guo, L.; Fahs, M.; Koohbor, B.; Hoteit, H.; Younes, A.; Gao, R.; Shao, Q. Coupling mixed hybrid and extended finite element methods for the simulation of hydro-mechanical processes in fractured porous media. Comput. Geotech. 2023, 161, 105575. [Google Scholar] [CrossRef]
  22. Huang, C.C.; Yuin, R.C. Experimental investigation of rainfall criteria for shallow slope failures. Geomorphology 2010, 120, 326–338. [Google Scholar] [CrossRef]
  23. Tohari, A.; Nishigaki, M.; Komatsu, M. Laboratory experiments on initiation of rainfall- induced slope failure with moisture content measurements. In Proceedings of the Unsaturated Soils for Asia Asian Conference on Unsaturated Soil, Singapore, 18–19 May 2000. [Google Scholar]
  24. Chueasamat, A.; Hori, T.; Saito, H.; Sato, T.; Kohgo, Y. Experimental tests of slope failure due to rainfalls using 1g physical slope models. Soils Found. 2018, 58, 290–305. [Google Scholar] [CrossRef]
  25. Junfeng, T. Physical Model Experiments on Water Infiltration and Failure Modes in Multi-Layered Slopes under Heavy Rainfall. Appl. Sci. 2020, 10, 3458. [Google Scholar]
  26. Ye, W.; Zhang, Y. Model test of loess slope instability under long-term rainfall. China Sci. 2021, 16, 603–609. [Google Scholar]
  27. Bao, X.; Liao, Z.; Xu, C.; Pang, X.; Xie, X.; Cui, H. Model test research on instability of silt slope under different seepage boundary conditions. Rock Soil Mech. 2019, 40, 3789–3796. [Google Scholar]
  28. Sun, Y.; Jia, C.; Wang, G. Model test and numerical simulation research on the influence of sudden drop in water level on slope stability. Geotech. Investig. Surv. 2012, 40, 22–27. [Google Scholar]
  29. Li, H.; Wu, L.; Huang, R. Model Experimental Research on Double-layer Soil Slopes under Rainfall Conditions. J. Yangtze River Sci. Res. Inst. 2012, 29, 102–107. [Google Scholar]
  30. Chenggang, B. Behavior of Unsaturated Soil and Stability of Expansive Soil Slope. Chin. J. Geotech. Eng. 2004, 26, 1–15. [Google Scholar]
  31. Chen, Z.; Guo, N. New Progress in the Research of Unsaturated Soil and Special Soil Mechanics and Engineering Application. Rock Soil Mech. 2019, 40, 1–54. [Google Scholar]
  32. Fu, H.; Zeng, L.; Wang, G. Stability analysis of soft rock slope under rainfall infiltration condition. Rock Soil Mech. 2012, 33, 2359–2365. [Google Scholar]
  33. Zhou, C.; Li, D. Research progress on disaster-causing mechanism and mitigation methods of landslides induced by torrential rain. Adv. Earth Sci. 2009, 24, 477–487. [Google Scholar]
  34. Ye, S.; Shi, Y. Stability analysis of multi-level loess high slope under rainfall infiltration condition. J. Eng. Geol. 2018, 26, 1648–1656. [Google Scholar]
Figure 1. Geological profile of landslide engineering.
Water 15 03732 g001
Figure 2. Methodological flow chart.
Water 15 03732 g002
Figure 3. Model test device.
Water 15 03732 g003
Figure 4. Model test monitoring point layout.
Water 15 03732 g004
Figure 5. Rain test calibration process: (a) Rain rate determination test; (b) Layout of rainwater collection points.
Water 15 03732 g005
Figure 6. Model test rainfall history: (a) Model test history of rainfall intensity 45 mm/h; (b) Model test history of rainfall intensity 25 mm/h.
Water 15 03732 g006
Figure 7. Variation law of soil pressure under different rainfall intensities: (a) Variation of slope soil pressure when rainfall intensity was 45 mm/h; (b) Variation of slope soil pressure when rainfall intensity was 25 mm/h.
Water 15 03732 g007
Figure 8. Variation law of pore water pressure under different rainfall intensities: (a) Variation of slope pore water pressure when rainfall intensity was 45 mm/h; (b) Variation of slope pore water pressure when rainfall intensity was 25 mm/h.
Water 15 03732 g008
Figure 9. Slope failure process when the rainfall intensity was 45 mm/h: (a) Rainfall 180 min; (b) Rainfall 450 min; (c) Rainfall 610 min.
Water 15 03732 g009
Figure 10. Degree of slope damage: (a) Slope slide failure; (b) Accumulation of sliding mass at the toe of the slope.
Water 15 03732 g010
Figure 11. Slope failure process when the rainfall intensity was 21 mm/h: (a) Rainfall 220 min; (b) Rainfall 410 min; (c) Rainfall 640 min.
Water 15 03732 g011
Figure 12. Schematic diagram of the degree of damage to the slope with different rainfall intensities.
Water 15 03732 g012
Table 1. Physical and mechanical parameters of landslide prototypes and similar materials.
Soil TypeDry Density (g/cm3)Natural Density (g/cm3)Cohesion (kPa)Angle of Internal Friction (°)Permeability Coefficient (m/s)Elastic Modulus
(MPa)
gravelly silty clay (prototype materials)1.641.9126.118.64.42 × 10−625
gravelly silty clay (similar materials)1.831.83~1.976.822.31.25 × 10−73.52
Table 2. Calibration test rainfall intensity and rainfall uniformity.
Condition SettingMonitoring ContentMonitoring Collection PointAverage Value
ABCDE
Working condition one M i g 47.248.458.549.756.852.1
R mm / h 18.819.323.319.822.620.8
U 98.1%98.6%97.5%99.1%98.2%98.3%
Working condition two M i g 106.8103.7124.8110.2121.1113.3
R mm / h 42.541.349.743.948.245.1
U 98.9%98.3%98.0%99.5%98.6%98.7%
Disclaimer/Publisher’s Note: The statements, opinions and data contained in all publications are solely those of the individual author(s) and contributor(s) and not of MDPI and/or the editor(s). MDPI and/or the editor(s) disclaim responsibility for any injury to people or property resulting from any ideas, methods, instructions or products referred to in the content.

