Article

Assessing the Susceptibility of Landslides in the Tuoding Section of the Upper Reaches of the Jinsha River, China, Using a Combination of Information Quantity Modeling and GIS

1
College of Transportation and Civil Engineering, Fujian Agriculture and Forestry University, Fuzhou 350002, China
2
Key Laboratory of Hydraulic and Waterway Engineering, Ministry of Education, Chongqing Jiaotong University, Chongqing 400074, China
3
Fujian Communications Planning and Design Institute Co., Ltd., Fuzhou 350004, China
4
China Northeast Architectural Design & Research Institute Co., Ltd., Shenyang 110006, China
*
Author to whom correspondence should be addressed.
Water 2023, 15(20), 3685; https://doi.org/10.3390/w15203685
Submission received: 19 September 2023 / Revised: 15 October 2023 / Accepted: 19 October 2023 / Published: 21 October 2023
(This article belongs to the Special Issue Effects of Groundwater and Surface Water on the Natural Geo-Hazards)

Abstract

:
Combined with visible light remote sensing technology and InSAR technology, this study employed the fundamental principles of the frequency ratio model, information content model, and analytic hierarchy process to assess the susceptibility of the study area. Nine susceptibility assessment factors such as elevation, slope, aspect, water system, vegetation coverage, geological structure, stratum lithology, rainfall, and human activities were selected, and the factor correlation degree was calculated by using the relative area density value of the landslide. The frequency ratio model and information content model were selected to carry out landslide susceptibility zoning, and the accuracy of the two models was verified by the ROC curve and density method. The results indicate that the information content model performed relatively well. Therefore, the information model, combined with the analytic hierarchy process and fuzzy superposition method using the landslide point density map, was chosen to evaluate landslide susceptibility. The study area was divided into five levels of landslide hazard, ranging from low to high, using the natural discontinuity point method. The results show that the area of each hazard zoning is 197.48, 455.72, 408.21, 152.66, and 16.22 km2 from low to high, and the proportion of landslides in the corresponding area is 0.17%, 1.60%, 3.88%, 8.41%, and 16.65%, respectively. It can be seen that with the increase in the hazard level, the proportion of landslides also increases significantly, which verifies the accuracy of the hazard results. Additionally, four representative landslides in the study area were selected for analysis to understand their characteristics and underlying mechanisms. The results revealed that these landslides were notably influenced by the density of the Jinsha River and the surrounding roads. The susceptibility assessment outcomes for geological disasters align well with the current situation of landslide occurrences in the Tuoding river section, demonstrating high accuracy. This study provides a scientific foundation for effective prevention and control measures against local landslide disasters.

1. Introduction

A landslide is a geological phenomenon that occurs in hilly terrains, resulting in significant ramifications on human lives and financial resources. It possesses the potential to inflict substantial damage on both the ecosystem and society within a specific geographical area [1,2,3]. As the world’s population grows, due to the increase in human engineering activities, and the complex and changeable world climate, the impact of landslides on human beings is progressively growing, and its frequency of attention has also increased year by year. At present, the landslide has become the second-largest geological disaster in the world after the earthquake disaster, which seriously endangers human engineering activities and the safety of human life and property [4,5,6,7,8,9]. Landslide hazard assessment is very important for disaster prevention and mitigation. The Tuoding section of the study area is located in the upper reaches of the Jinsha River, northwest of Yunnan and the southeast edge of the Qinghai–Tibet Plateau. Under the special tectonic background in the region, there is a complex high ground stress field, strong tectonic activity, frequent occurrence of geological disasters such as landslides, and complex and changeable climatic conditions. These geological hazards frequently lead to river blockages, triggering landslides and earthquakes, as well as the formation of dammed lakes that can result in devastating floods. These events pose a significant threat to the safety of residents living downstream of the affected river [10,11]. The Baige landslide and river blocking occurred twice in the upper reaches of Jinsha River, resulting in the destruction of a large number of houses and a direct economic loss of about 963.5 million US dollars [11]. In addition, there exist numerous historical landslide formations on both banks of the Jinsha River [12,13], threatening the lives of downstream residents and buildings. Therefore, it is necessary to carry out the study on the susceptibility assessment of potential landslides along the Jinsha River.
At present, domestic and foreign scholars mainly use artificial neural network [14], logistic regression [15], frequency ratio [16], weight of evidence [17], and other methods to evaluate landslide susceptibility. The United States and some European countries were the first to study landslide susceptibility. The United States Geological Survey (USGS) commenced landslide susceptibility assessment during the 1970s, and developed a variety of assessment models, such as the weighted stability index model (WIS), the physical stability index model (PSI), etc. These models take into account multiple factors such as topography, geology, and climate, and have high accuracy. In addition, European countries have also conducted in-depth research on landslide hazard zoning, and countries such as Germany and France have also proposed corresponding assessment methods, such as the landform evolution influence factor method (FOSM). The earliest systematic exploration results can be traced back to 1964. Dobrovony analyzed and interpreted the geological map, topographic map, and geomorphic features of the Anchorage area, and classified the sensitivity of the local landslide [18]. Regmi et al. evaluated the susceptibility to landslides through GIS techniques using Bayes’ theorem based on weights of evidence [19]. During the 1976 International Engineering Geological Congress, the attribution of natural disasters to geological phenomena was established, and the term “geological disaster” was formally defined for the first time. The analysis and research work of landslide disasters has also become more clear. In the 1980s, the geographic information system officially entered the stage of landslide hazard classification. The powerful data analysis function of the system made the study of landslide hazards gradually transform from qualitative research to quantitative research, making the evaluation methods more diverse and scientific. Brand E W used quantitative methods to try to calculate the susceptibility of disasters, expounded the development of landslide geological disasters in Hong Kong, and put forward suggestions for susceptibility management and prevention [20]. Wei chen combined GIS technology to use a new hybrid computational intelligence model on different mapping units to evaluate landslide susceptibility [21]. Bourenane validated and compared the landslide susceptibility maps (LSMs) produced by applying four geographic information system (GIS)-based statistical approaches including frequency ratio (FR), statistical index (SI), weights of evidence (WoE), and logistic regression (LR) for the urban area of Azazga [22]. Based on the distribution characteristics and scale of landslides in the field survey, the study area was divided into susceptibility zones by using the superposition analysis function of GIS. This study made the landslide susceptibility assessment more systematic for the first time. In the 1990s, geographic information technology developed rapidly. GIS technology, with its powerful spatial analysis ability, provides a powerful means for the extraction of landslide disaster characteristics and the calculation of landslide susceptibility. It has been combined with various types of machine learning and artificial intelligence to make landslide susceptibility zoning more and more scientific [23,24,25]. Basofi used the analytic hierarchy process combined with the natural discontinuity method in the process of landslide susceptibility assessment in Indonesia, and achieved good results [26].
In recent years, the focus of research on landslide susceptibility assessment has shifted from exploring new models to utilizing a combination of GIS and various mathematical statistical models, along with advanced technologies such as InSAR, satellite and aerial photography, and machine learning. Skillful integration of these technologies enables more scientific and rational discovery and interpretation of landslides (including potential ones), enhances the reliability of data, and improves the accuracy of susceptibility assessment results [27]. For example, Liu Jing successfully employed GIS in combination with UAV technology to assess landslide susceptibility in Zhouqu County, Gansu Province, yielding positive outcomes [28]. Novellino A utilized InSAR technology and machine-learning methods in the process of landslide susceptibility assessment within the study area, showcasing their effectiveness [29]. In the regional landslide susceptibility assessment conducted by Fang Ranke, machine-learning methods are comprehensively summarized, and novel insights for susceptibility assessment are proposed [30].
The advancements in InSAR technology have opened up possibilities for landslide susceptibility assessment [31]. InSAR technology has been utilized for surface deformation monitoring since 1969 and has proven effective in identifying various geological disasters such as earthquakes, surface subsidence, and landslides. This technology plays a crucial role in our efforts toward disaster prevention and mitigation [32,33,34,35,36]. Currently, domestic research primarily focuses on identifying indicators for landslide susceptibility assessment and improving assessment methods. For instance, Wu Shuren et al. successfully evaluated landslide susceptibility in Fengdu County, Chongqing, using a geological disaster information system and information quantity method [37]. Fan Linfeng and other scholars employed a weighted information model to assess landslide susceptibility in Enshi City, Hubei Province [38]. Li Wenyan and colleagues compared the frequency ratio and information quantity models in their study of landslide susceptibility in certain areas of Gaolan County, Gansu Province [39]. Foreign research generally possesses a mature theoretical framework and diverse evaluation models, but the applicability of these models is limited by geological and climatic conditions. Domestic research, on the other hand, places more emphasis on practical application and has achieved significant results through the continuous improvement and optimization of evaluation methods. When combined with optical imagery and on-site field investigations, this approach can effectively verify and validate the accuracy of the findings [40,41,42,43].
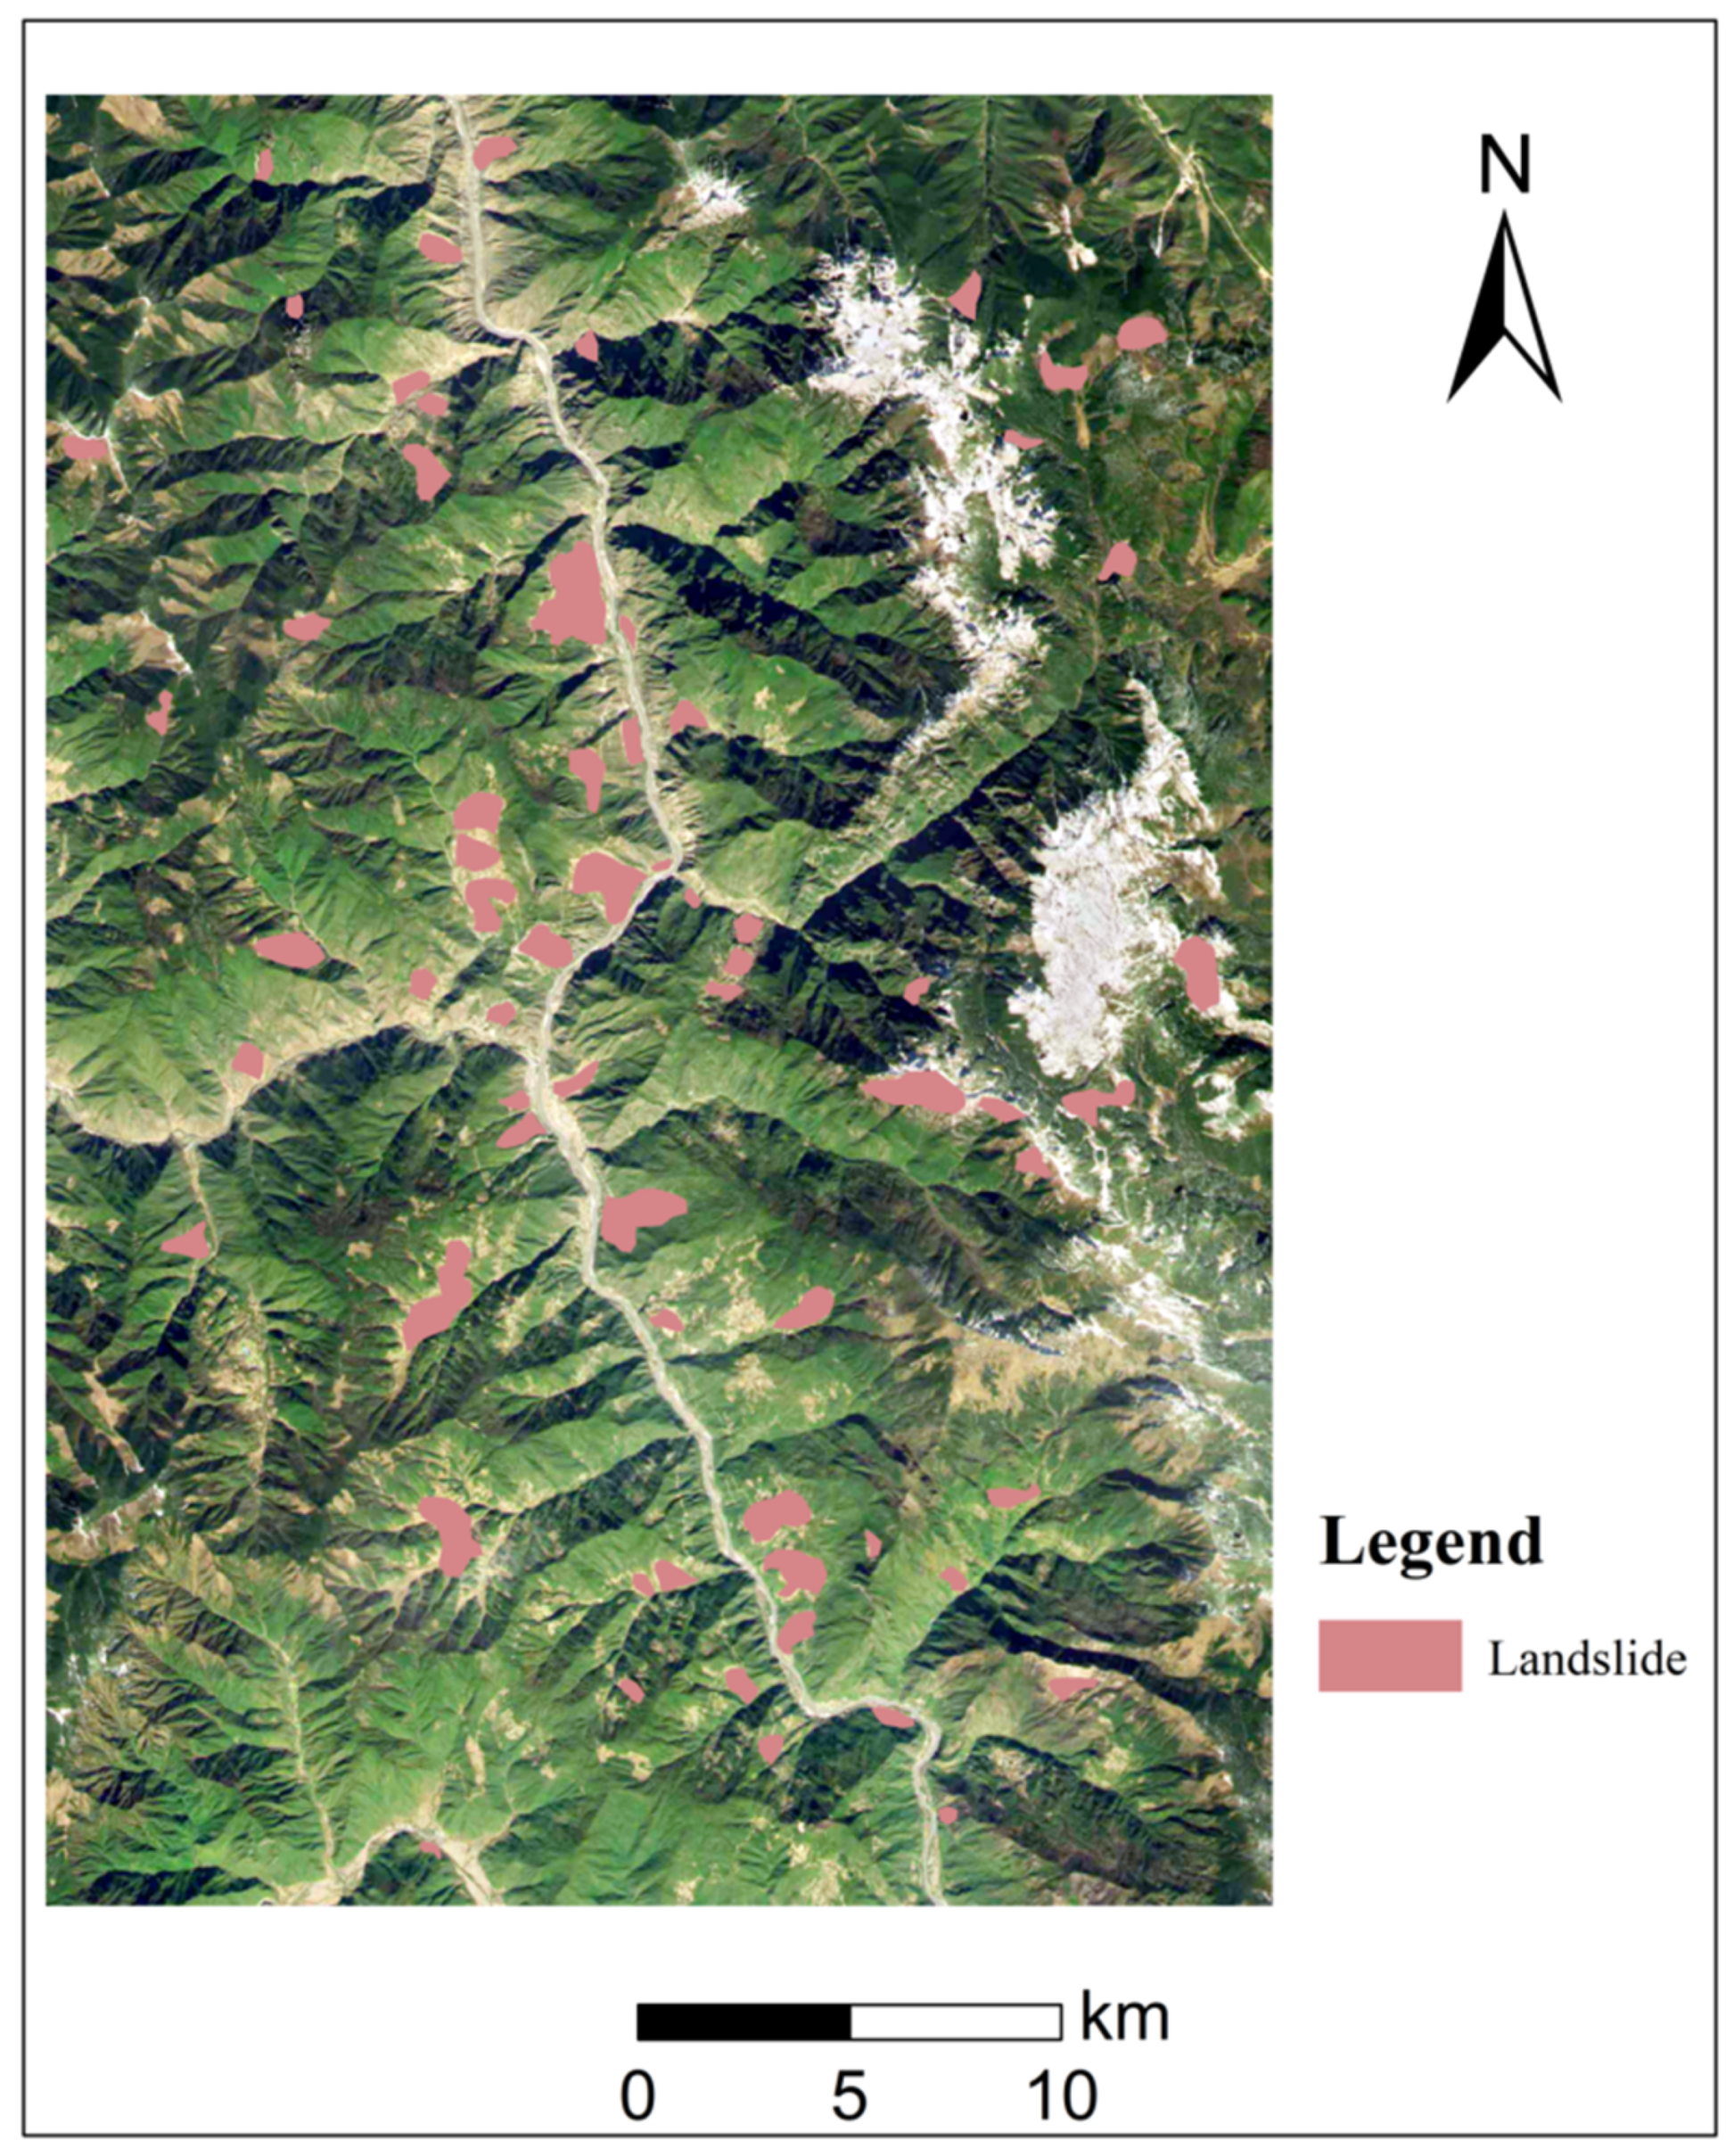
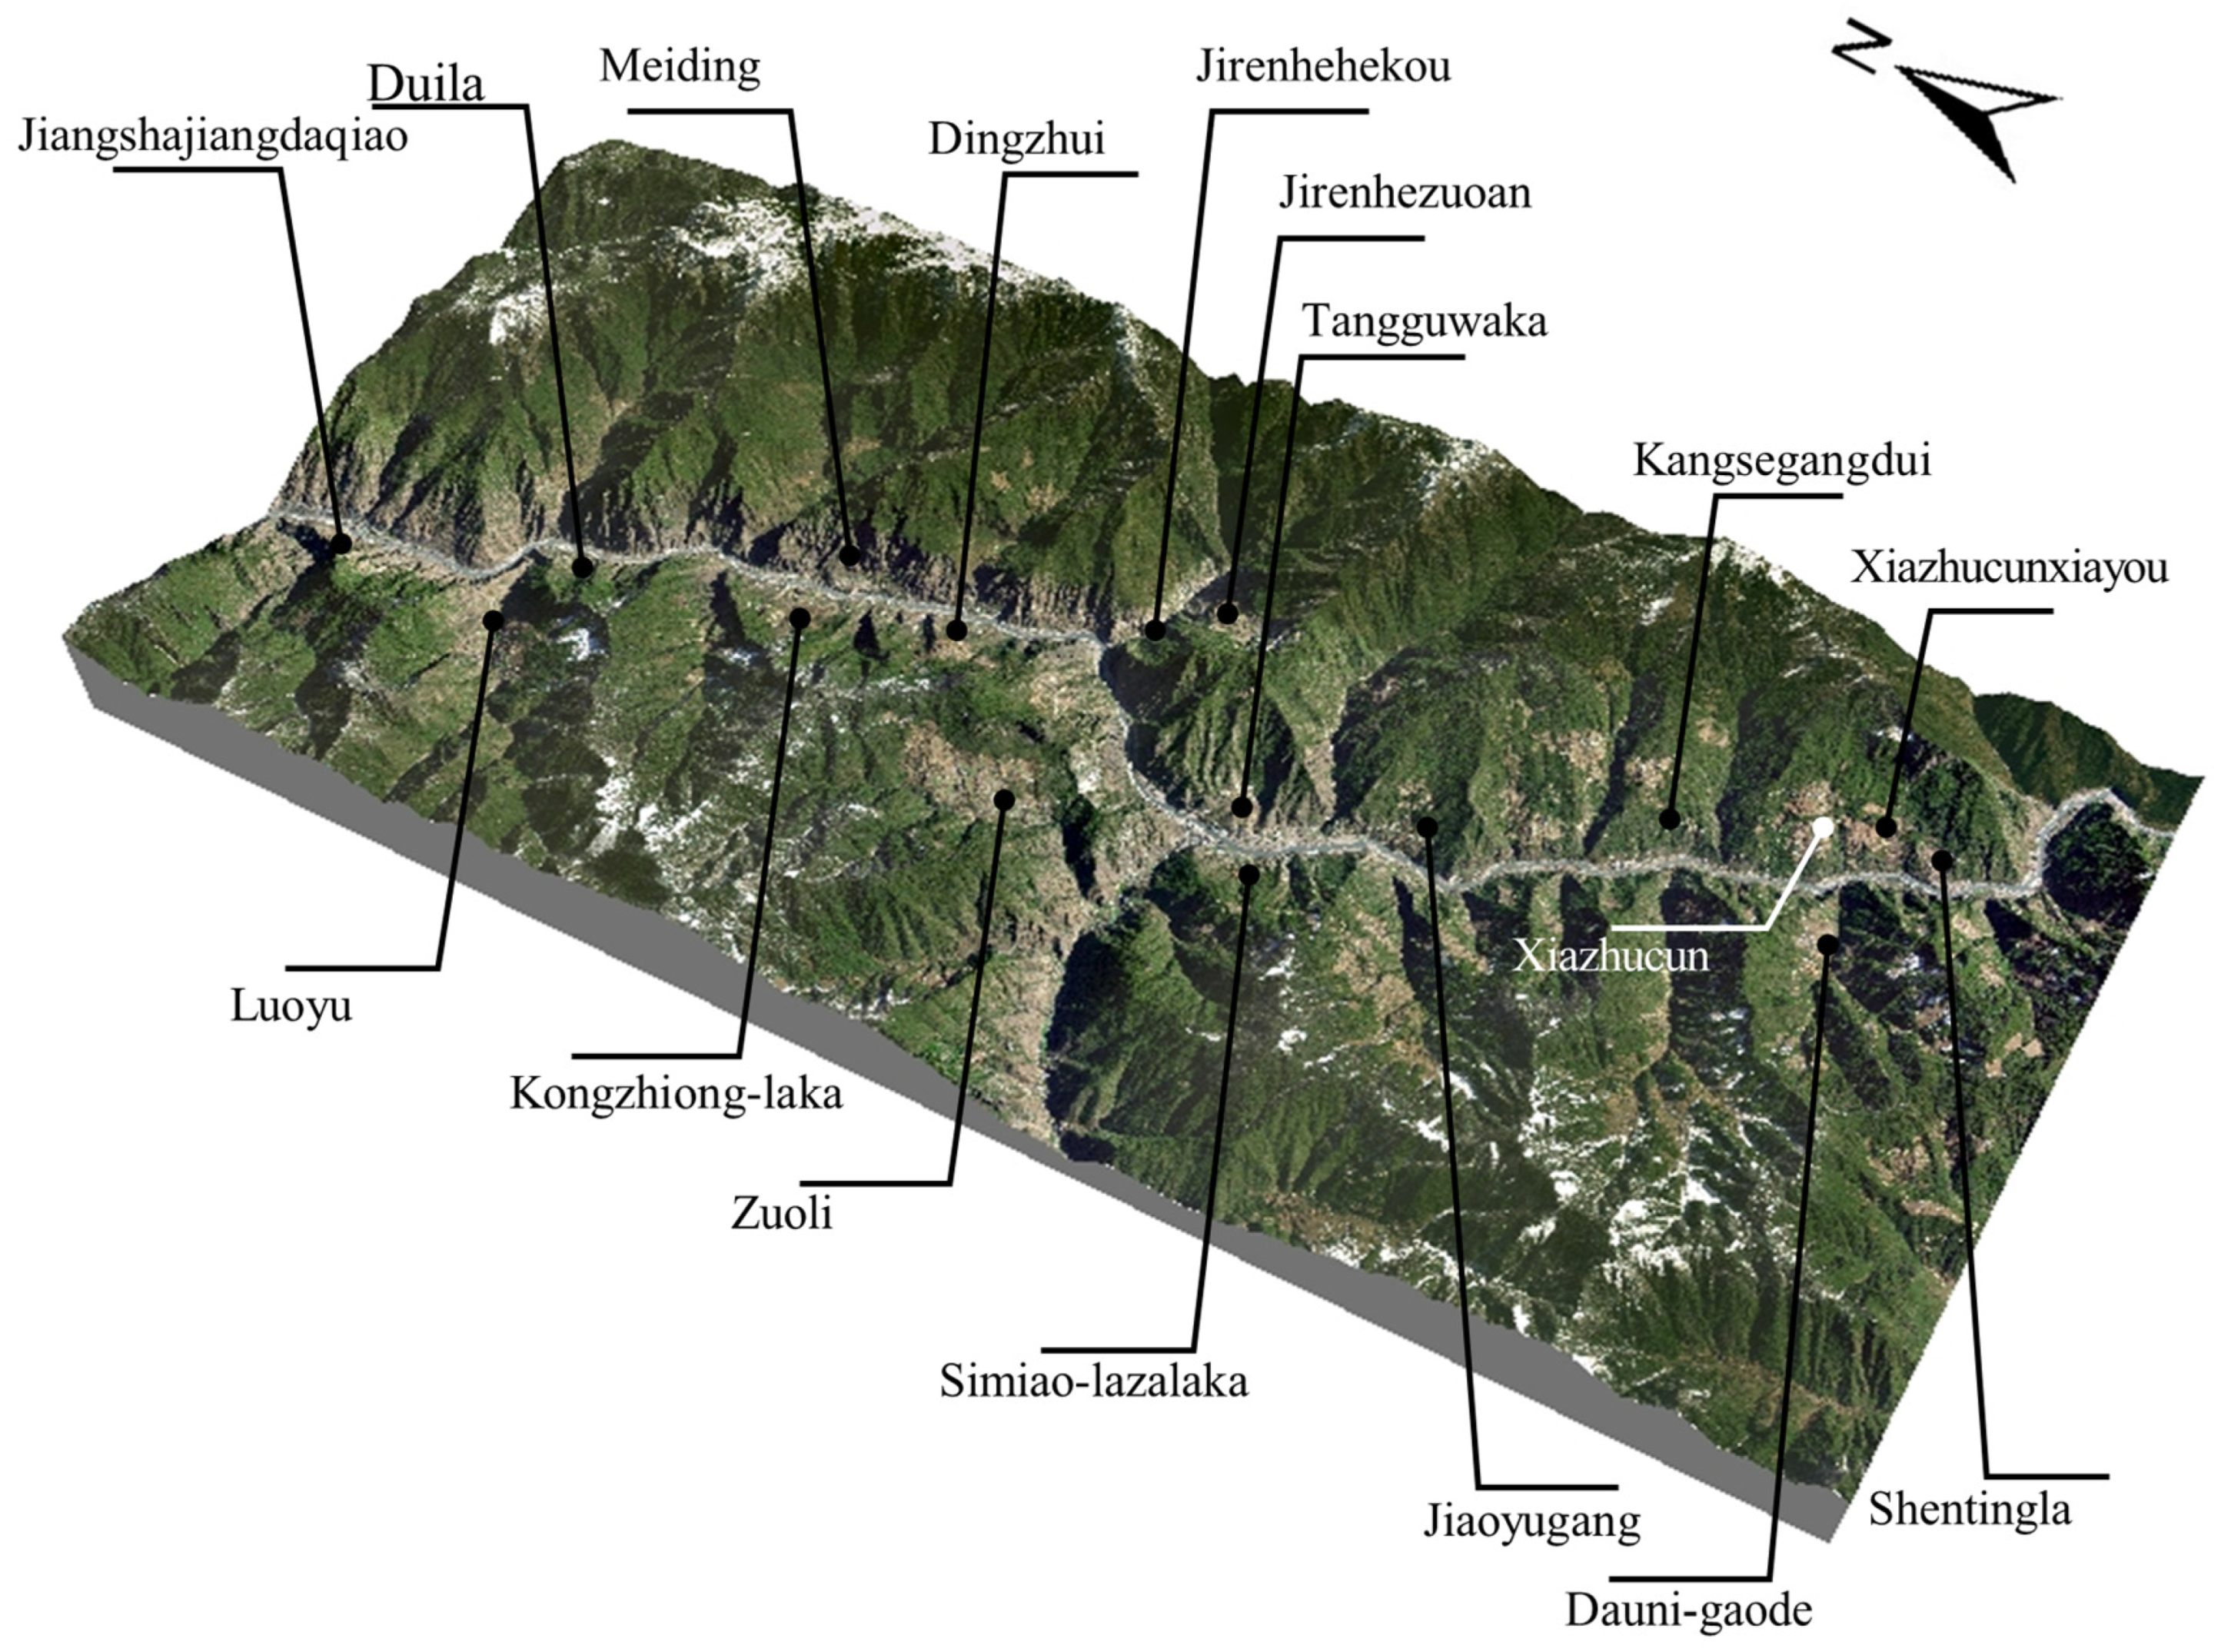
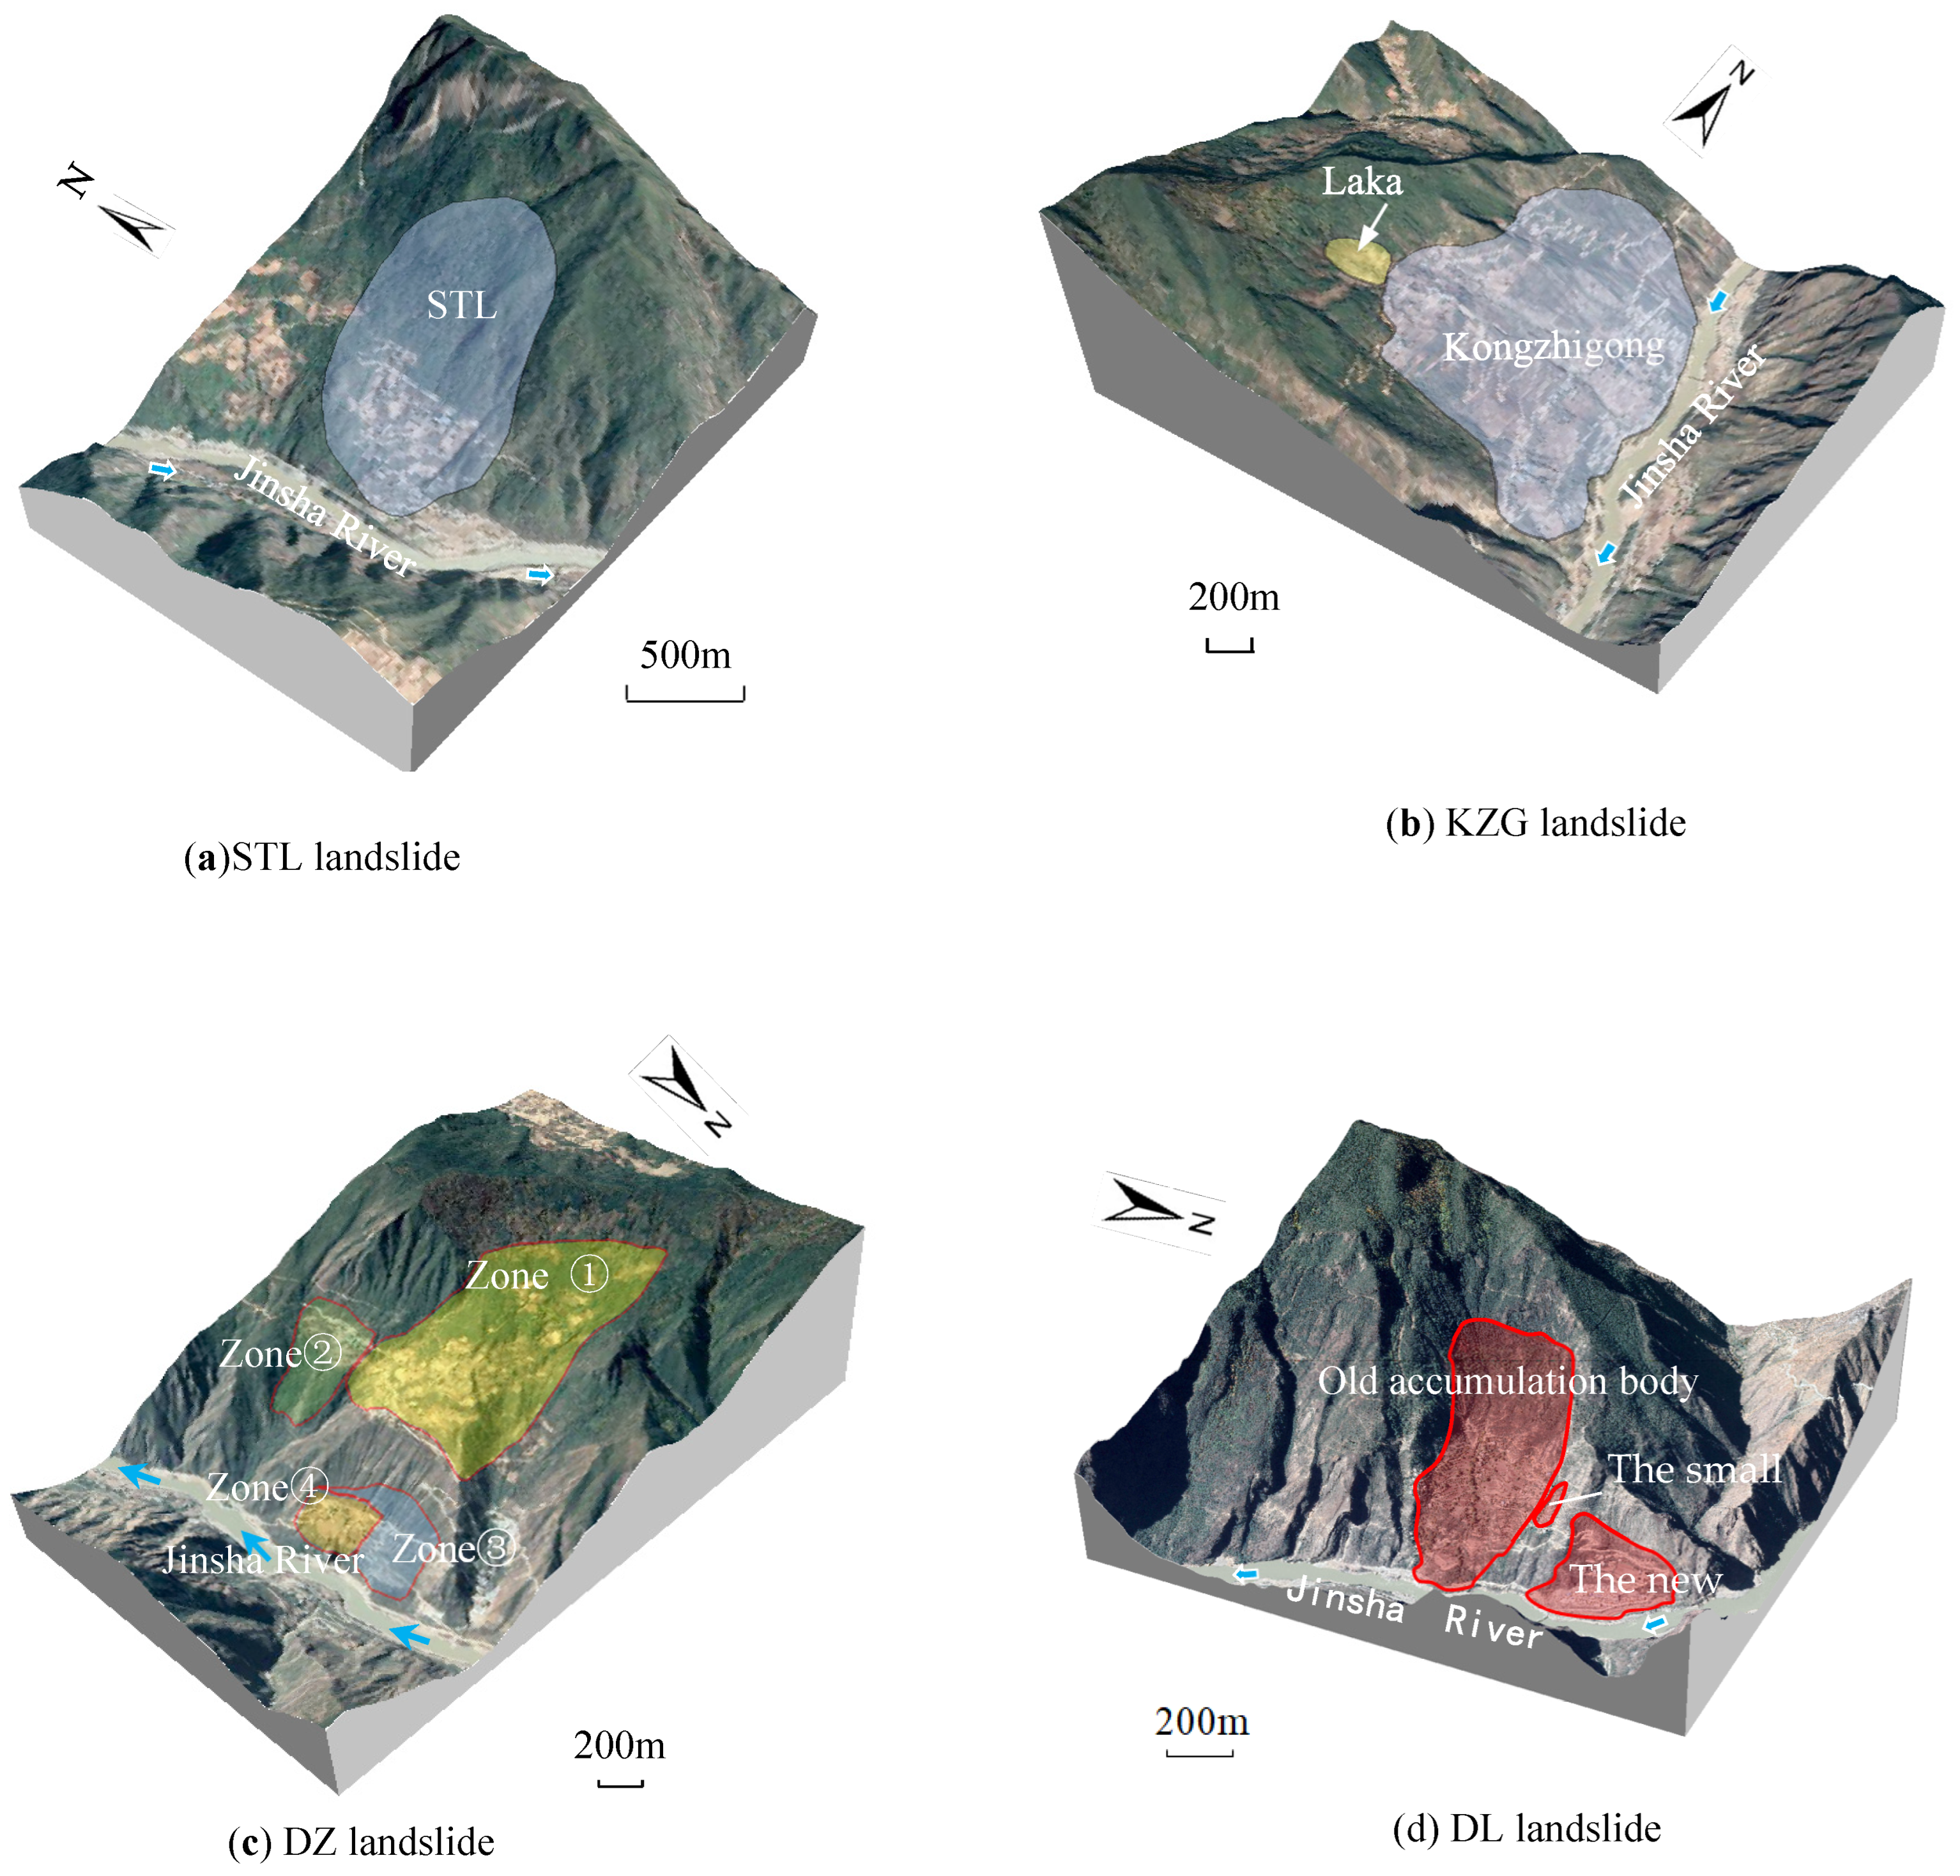
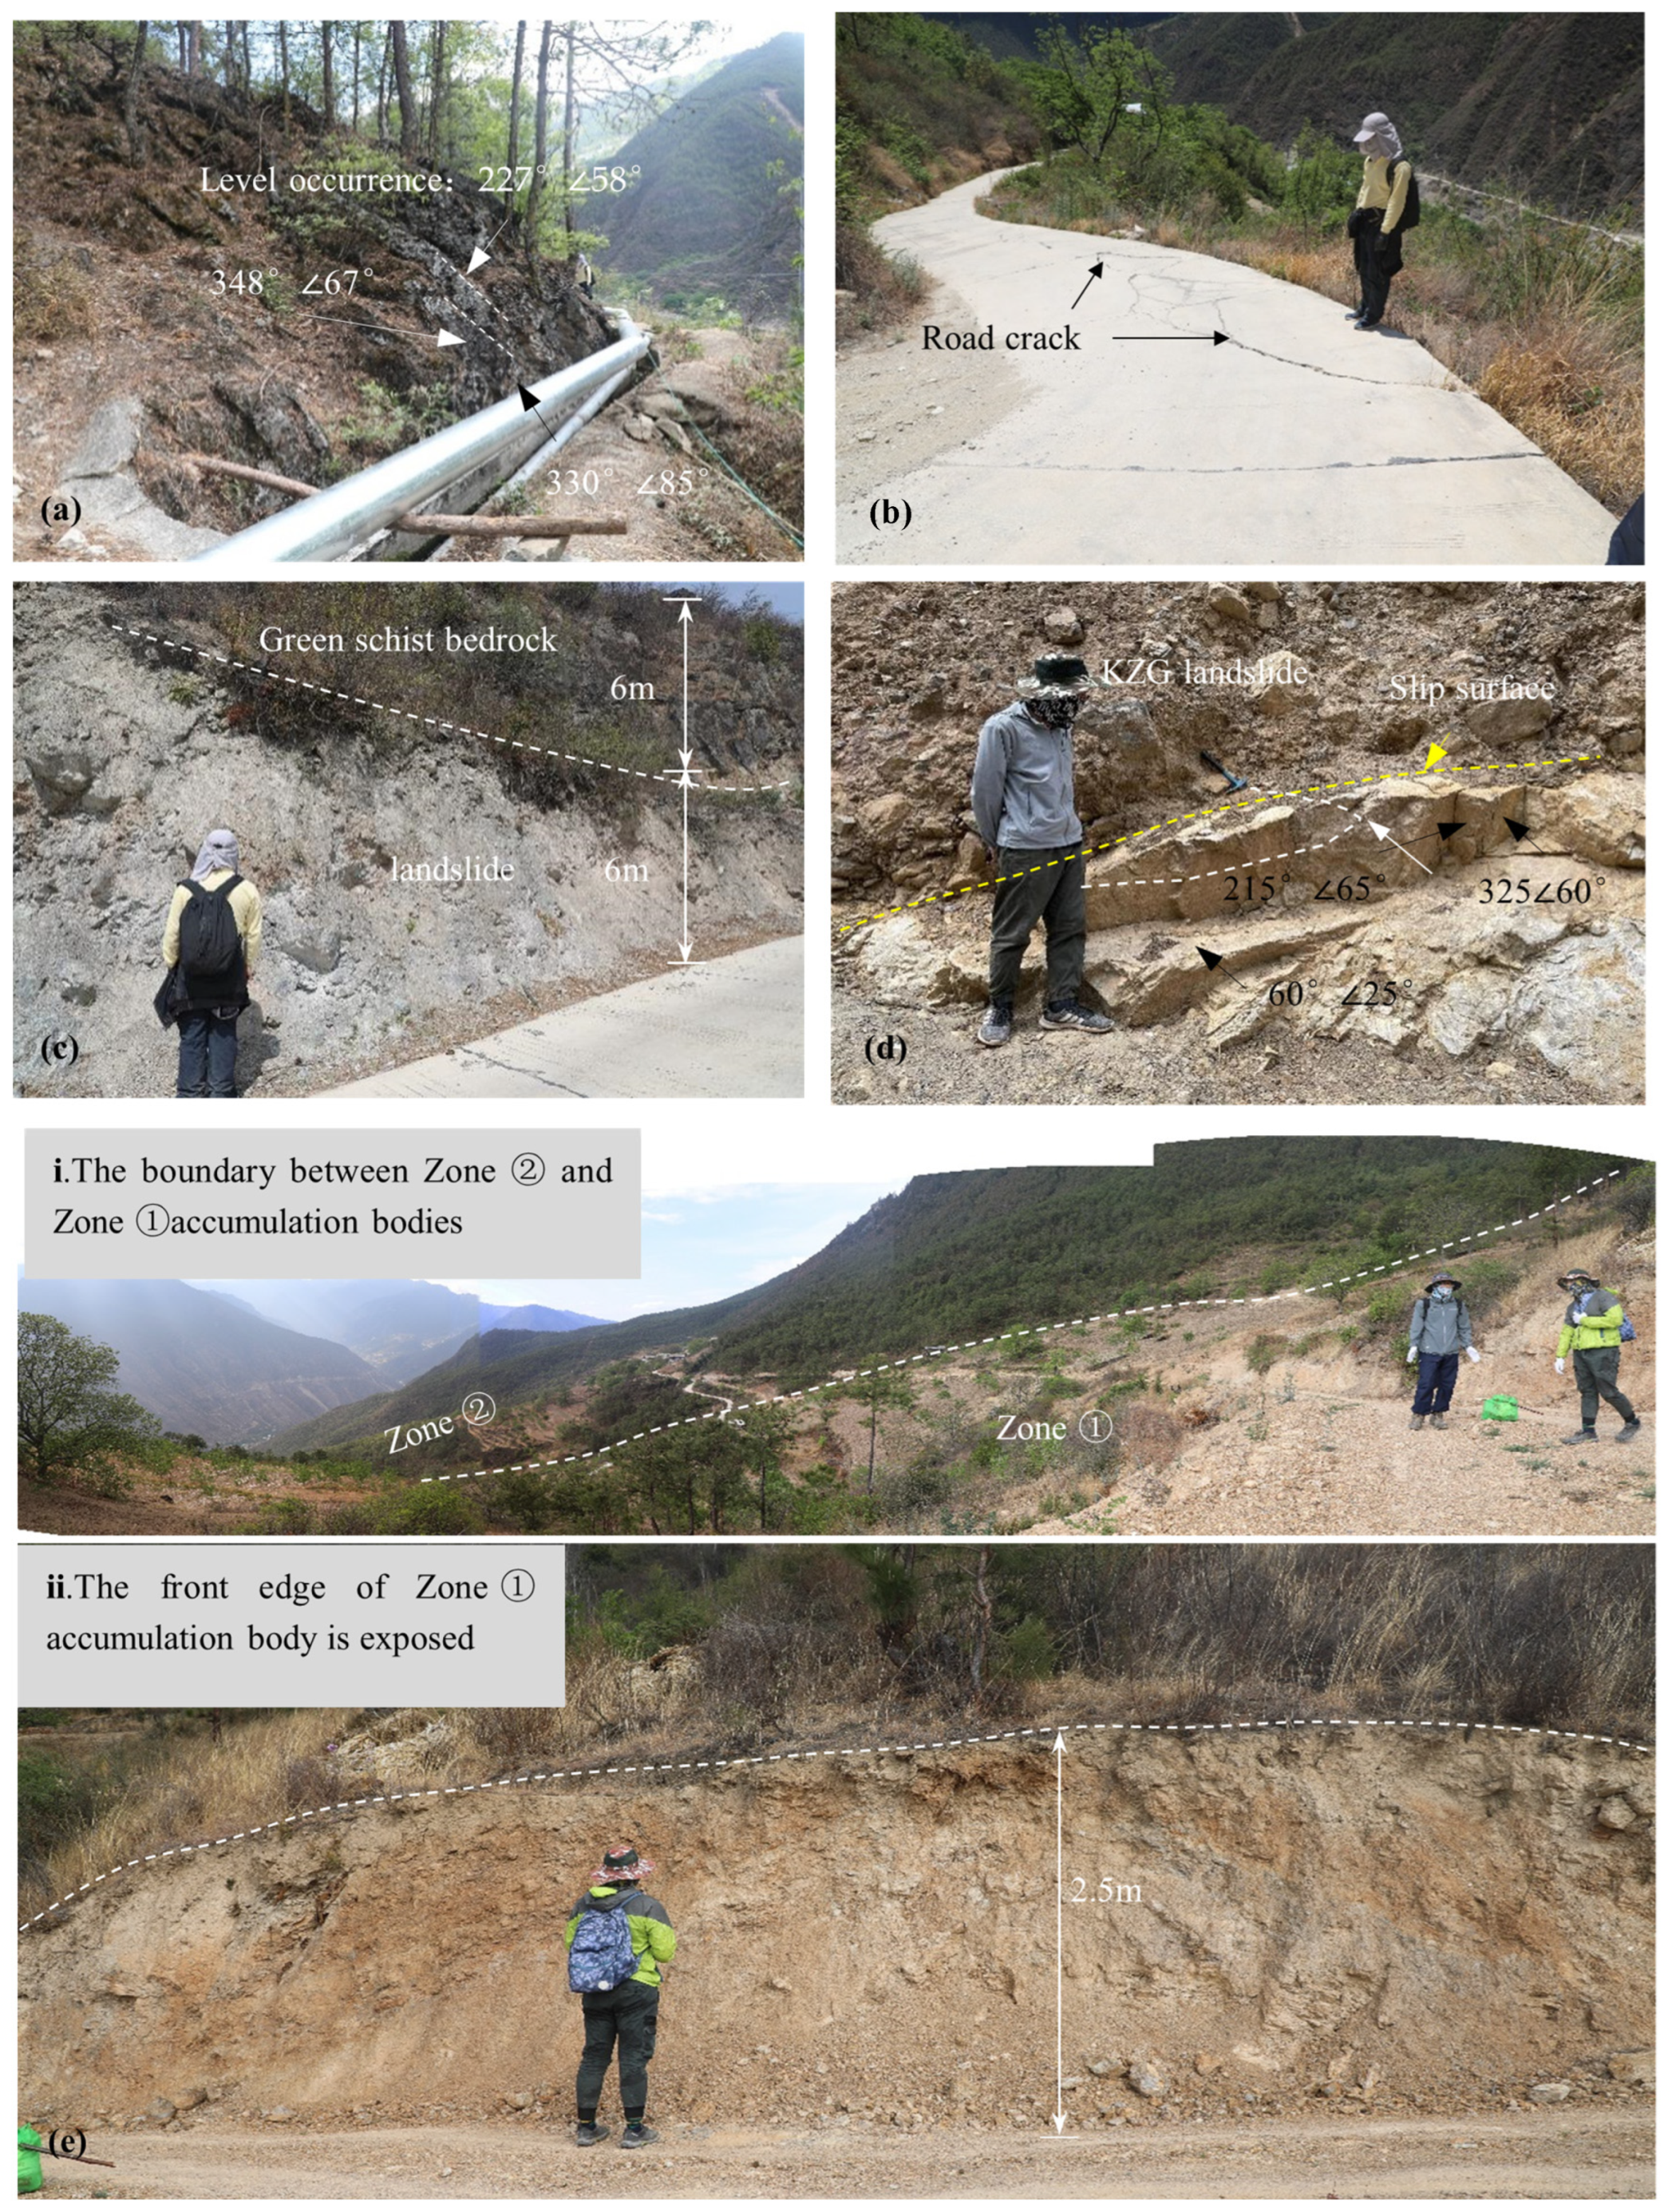
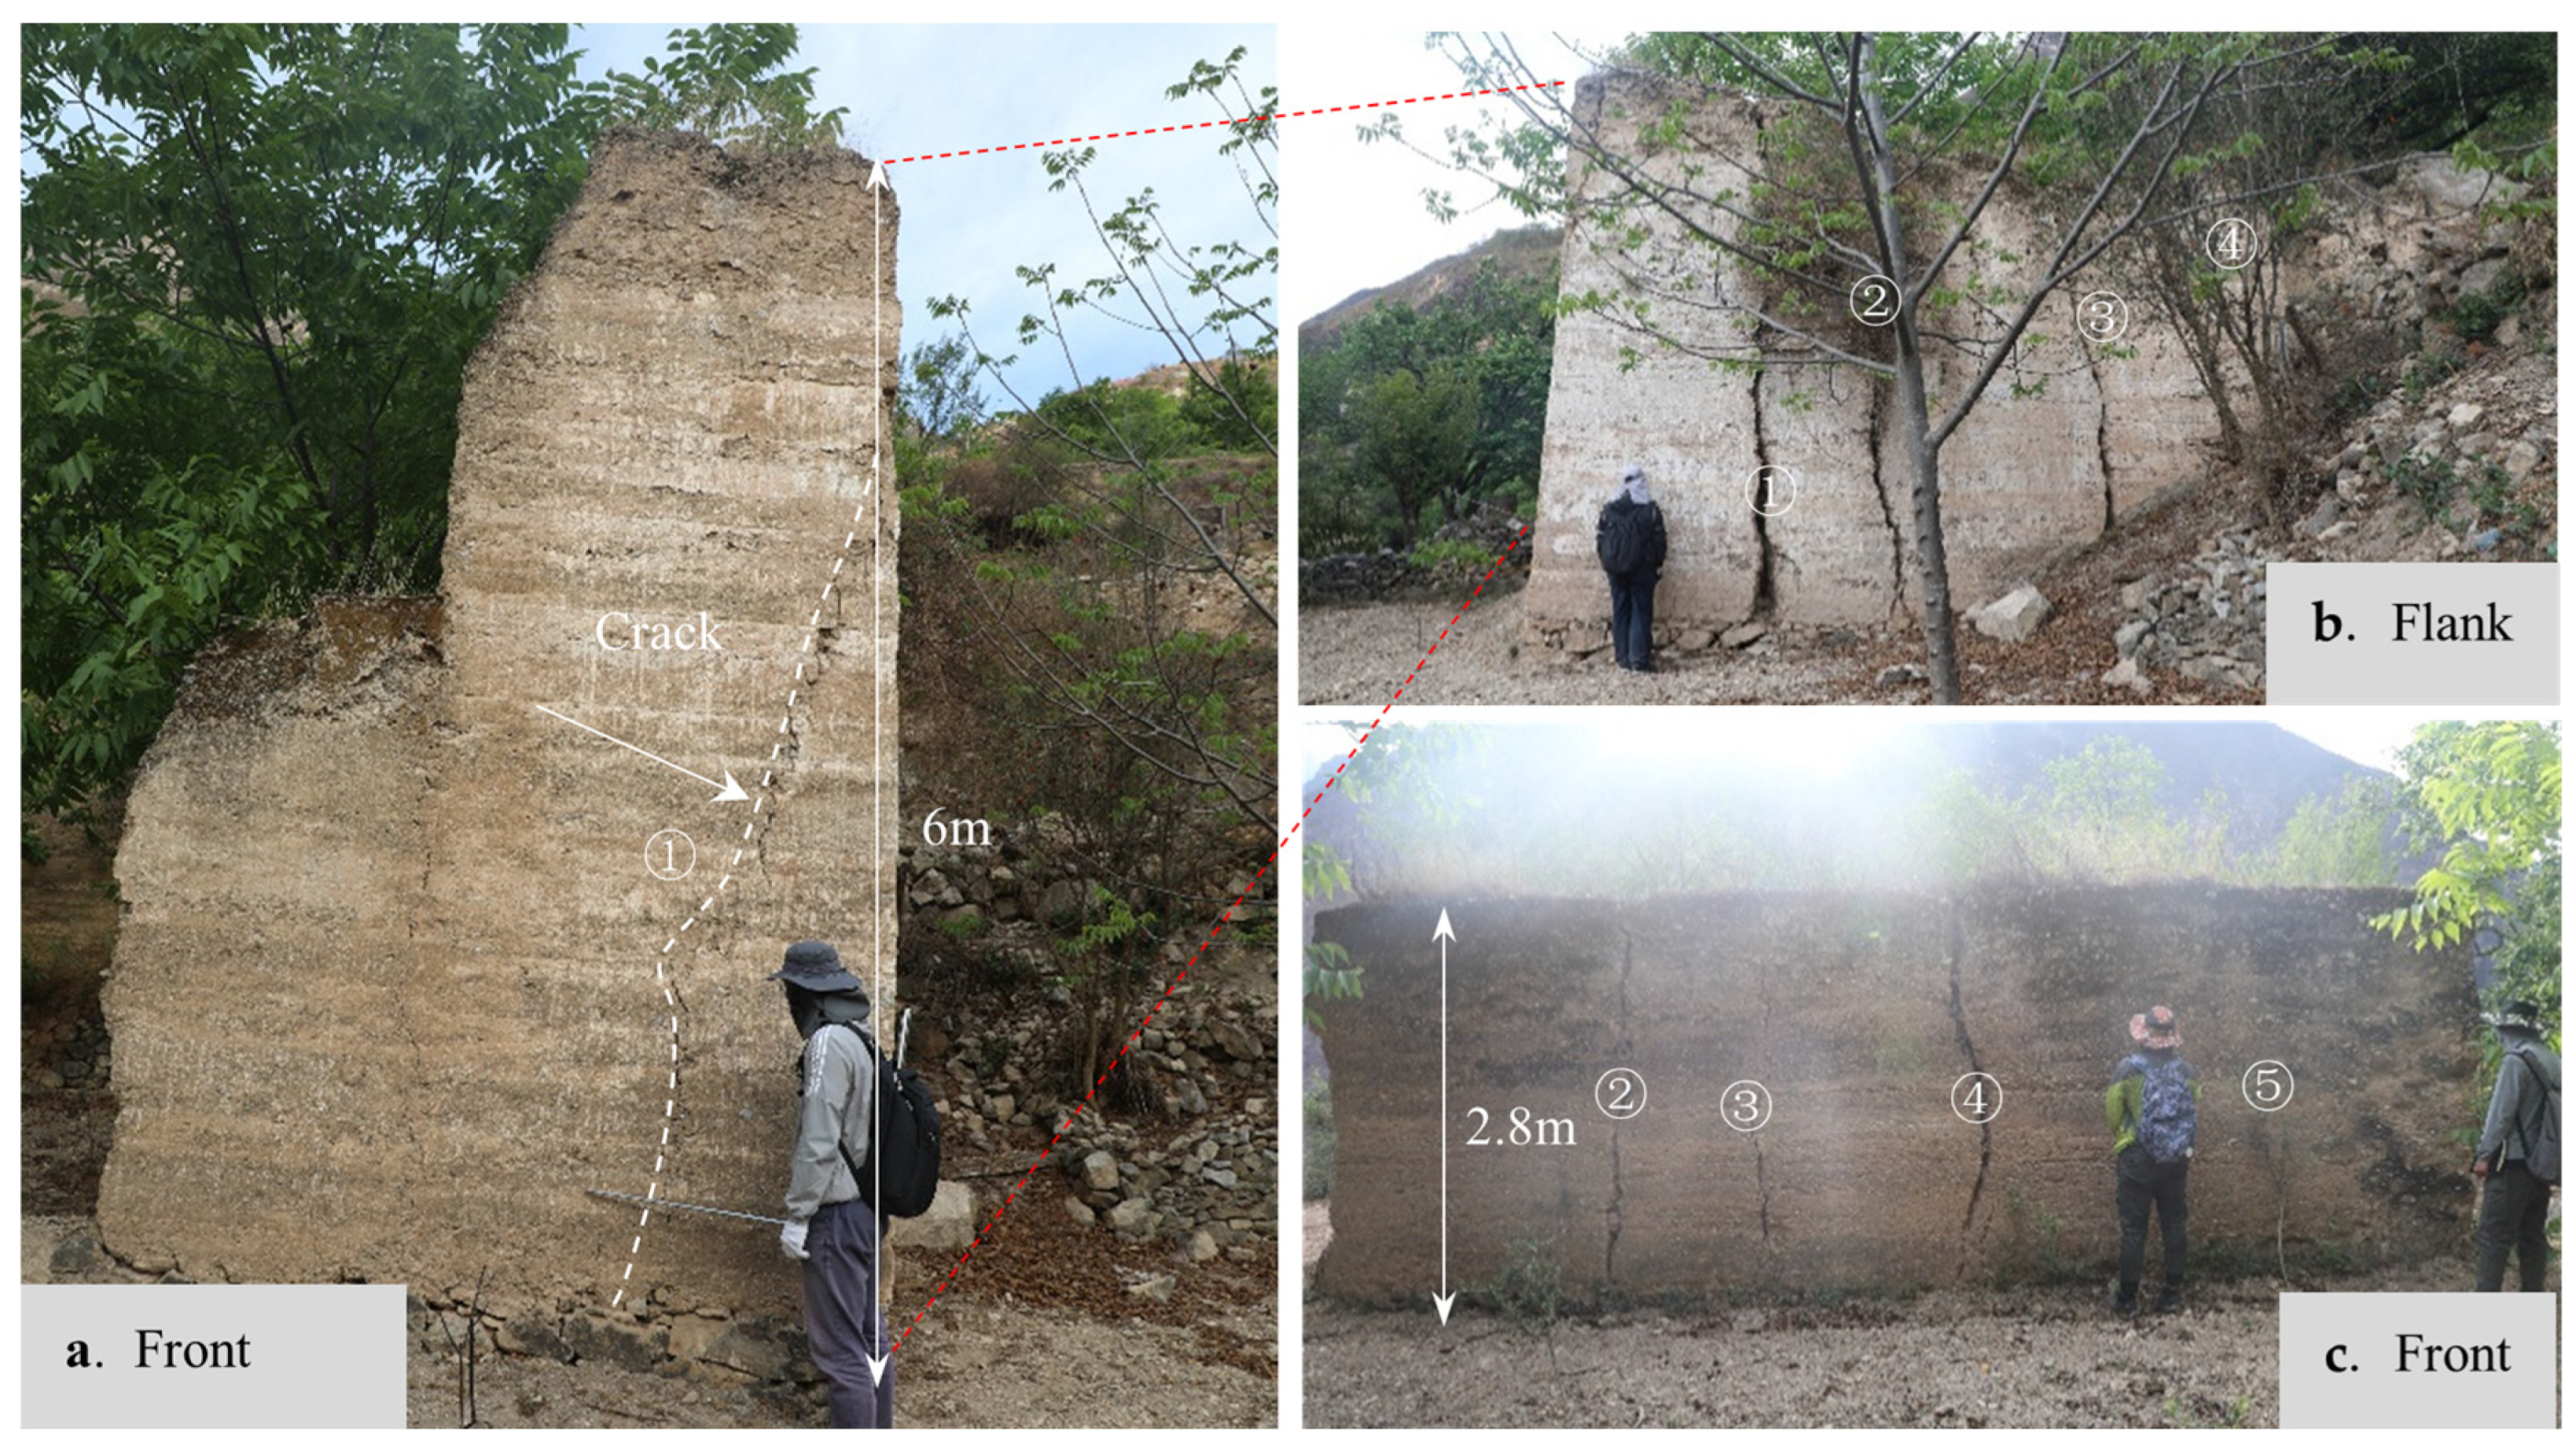
The objective of this study is to utilize ALOS-2 and Sentinel-1A data to detect potential landslides in the Tuoding section of the Jinsha River and assess the suitability of the data. The study is conducted in three stages: (a) SBAS-InSAR technology is employed to analyze the long-term phase changes, while multi-period Google Earth images are utilized to identify potential landslides. This approach helps reduce result uncertainties. (b) Field investigations are carried out to verify the identification results and analyze the genetic mechanisms of typical landslides. (c) Based on the findings from ALOS-2 and Sentinel-1A, the deformation characteristics of specific landslides such as Shentingla (STL), Kongzhigong (KZG), Dingzhui (DZ), and Duila (DL) are analyzed. Finally, the reliability and applicability of the ALOS-2 and Sentinel-1A data are validated.

2. Study Area

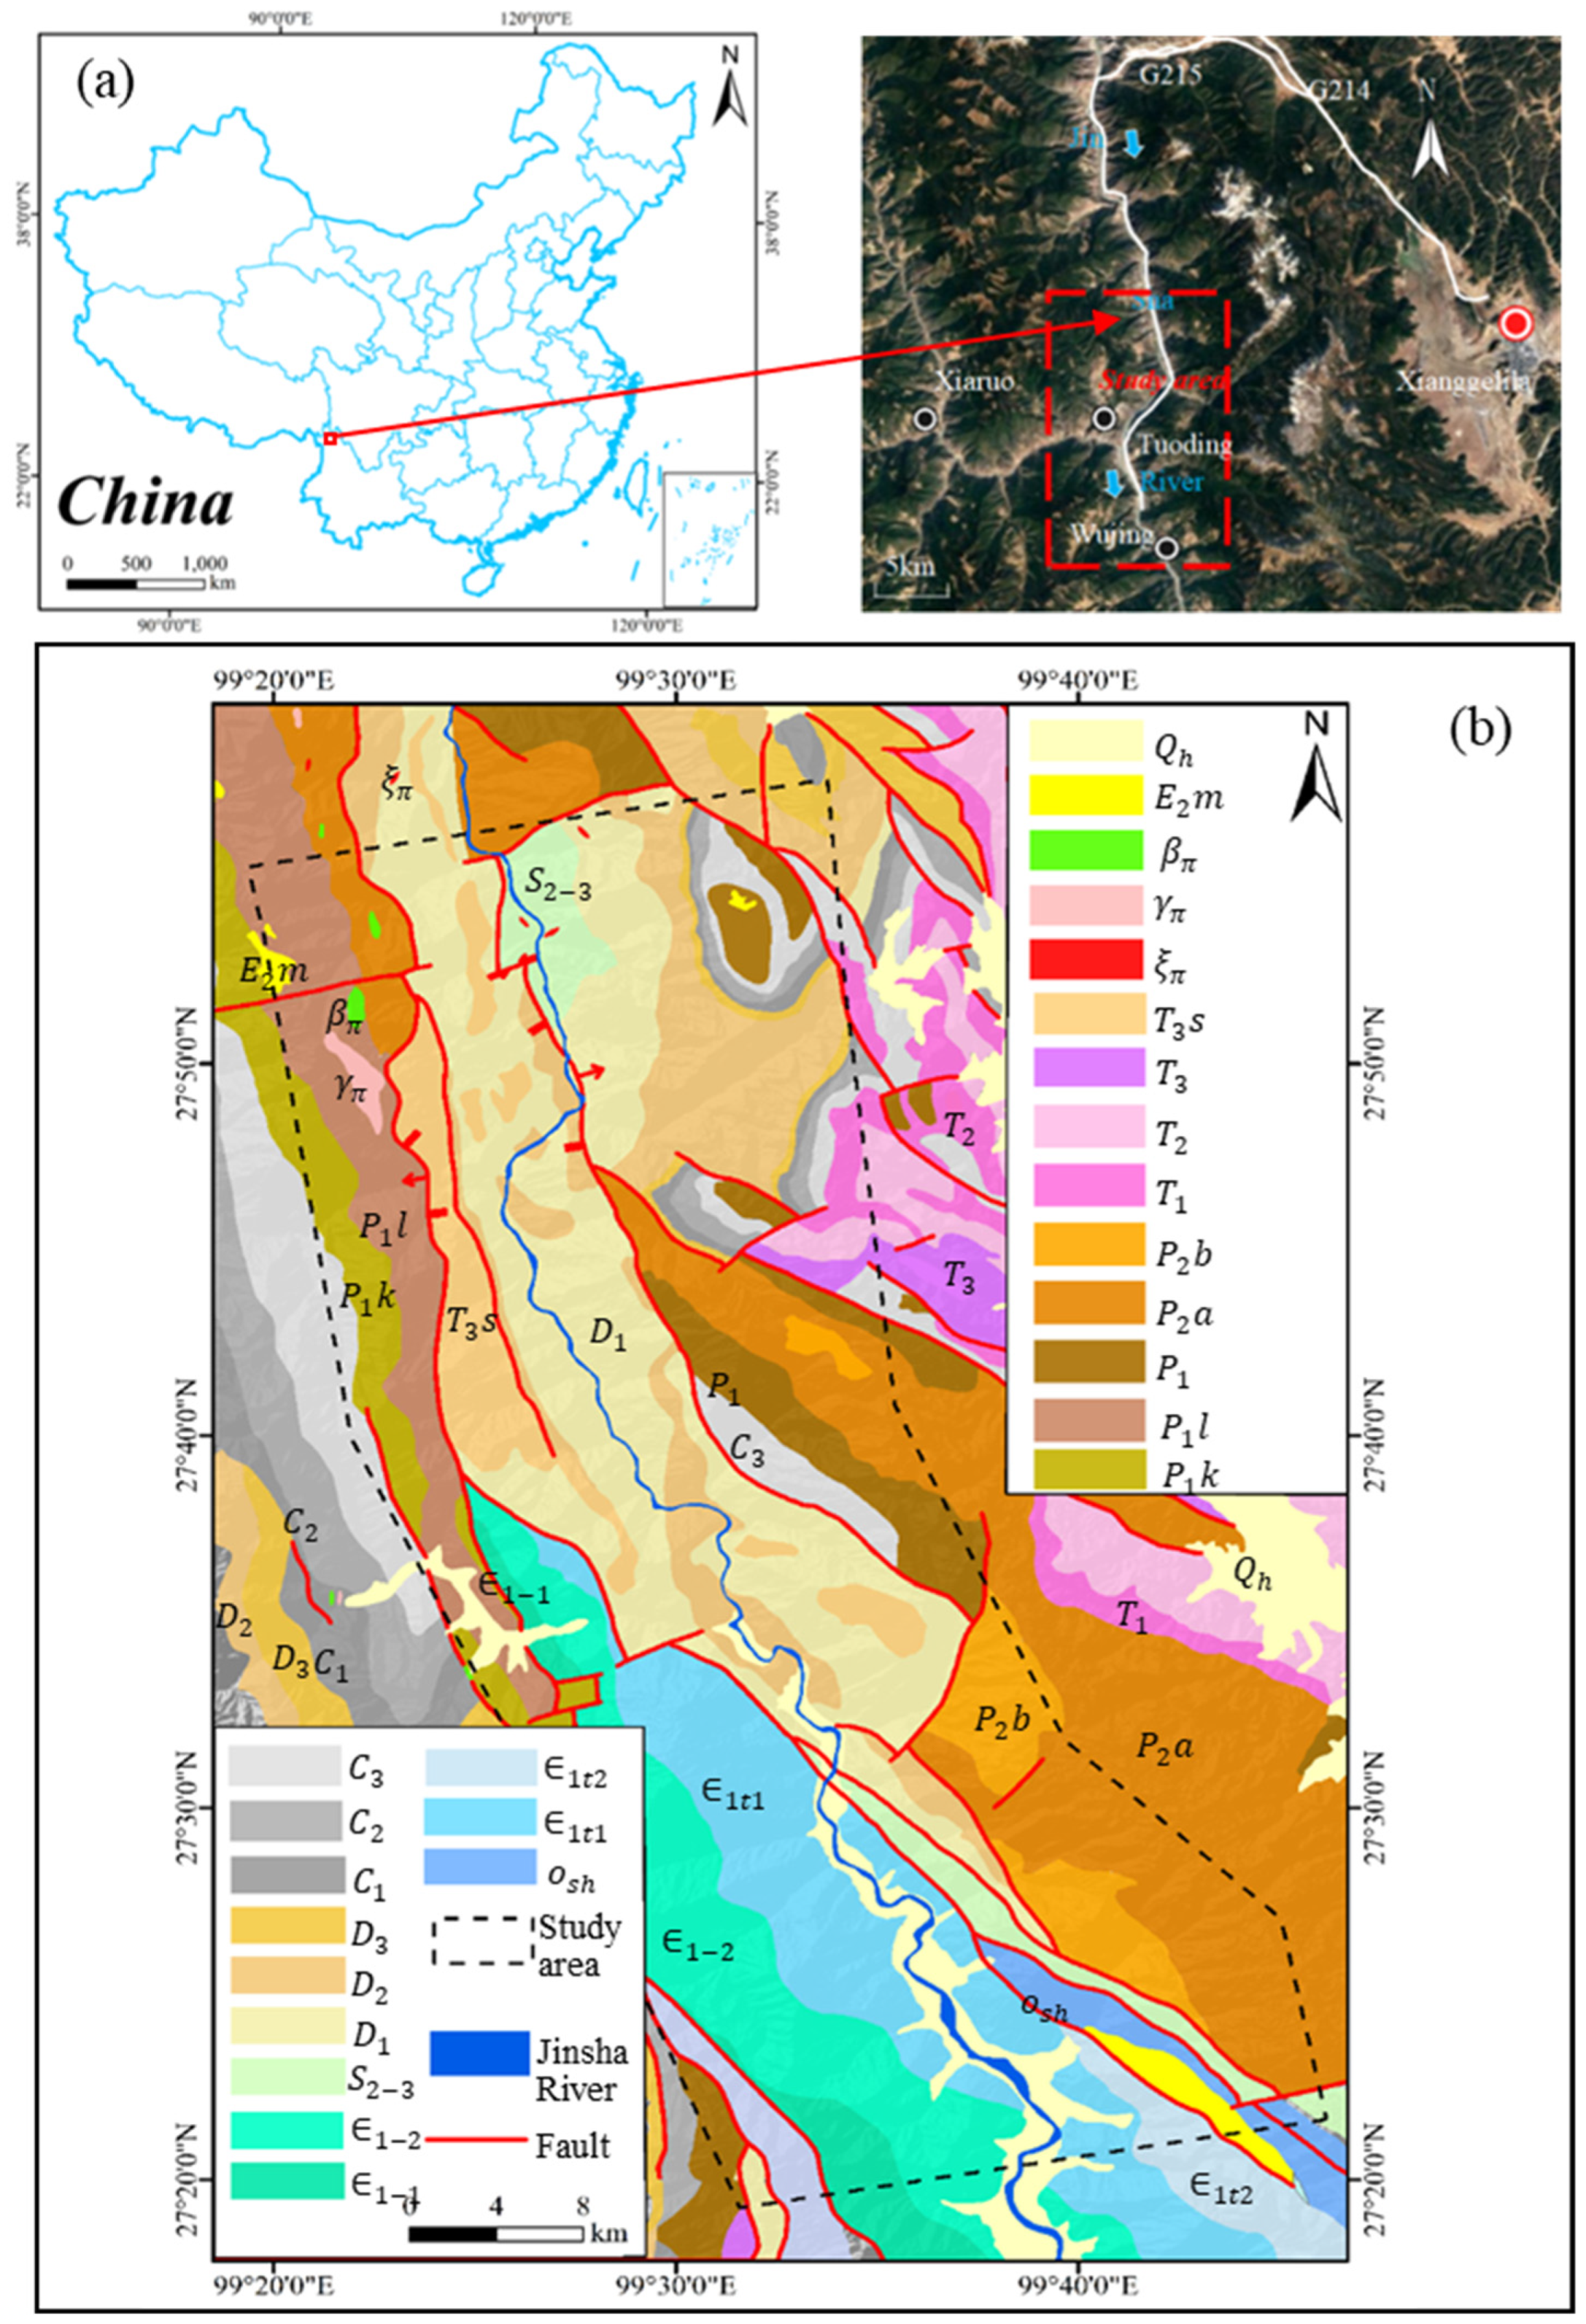
The study region is situated within Tuoding Lisu Township, Deqin County, Diqing Tibetan Autonomous Prefecture, northern Yunnan Province (Figure 1a). The area is 28 km east of Shangri-La City, 13 km west of Xiaruo Lisu Township, 19 km south of Tacheng Town, and 30 km north of Nixi Township. Jinsha River passes through the study area from north to south. The left bank is Wujing Township, and the right bank is Tuoding Lisu Township. The study section flows through Shengli, Baishugong, Chigutang, Guilong, Badong, and other places. The specific range is (99°18′41″–99°36′14″ E), (27°18′23″–27°58 ′30″ N) rectangular area, with an area of 1230.36 square kilometers. The residents in the area are mainly Lisu people, and there are Tibetan, Han, and other population distributions. Tuoding Township is connected with Shangri-La City and surrounding major towns through national highways G214 and G215.
The study site is situated within the tectonically active region where the Indian plate subducts beneath the Eurasian continental plate. The tectonic compression is strong, and the vegetation in the area is developed, which is a heavy forest area. The region’s robust topographical uplift has resulted in the formation of a V-shaped, deeply incised valley, characterized by prominent denudation processes and glacial erosion, thus rendering it an alpine canyon landform [42]. The river width of the study area is usually between 60 m and 100 m. The study area is an incised river section, with high mountains and deep slopes. The villages in the area are distributed in strips on both sides of the Jinsha River. The elevation of the study area is 1862~4502 m, and the height difference is 2640 m.
The geological formations exposed within the investigated region comprise Cenozoic Quaternary (Q) Holocene and Pleistocene strata, Tertiary (E) Eocene Lumeiyi Formation strata, Mesozoic Triassic (T) Upper Zhongwo Formation, Middle Beiya Formation and Hewanjie Formation, Lower Lamei Formation, Permian (T) Upper Basalt Formation, Paleozoic Carboniferous (C) Lower Formation, Devonian (D) Lower Xiaoyangpo Formation, Middle Lingpaishan Formation and Guangtoupo Formation, Lower Ranjiawan Formation and Hailuo Formation, and Cambrian (∈) Lower Tacheng Formation and Yangpo Formation. The stratigraphic age spans from the Cenozoic to the Paleozoic, and there are many types of strata. The missing strata are Cretaceous (K), Jurassic (J), and Ordovician (O). The distribution patterns of the geological strata within the study area exhibit discernible regularities, and the strata gradually become older from W to E. Different series are usually in fault contact. The fault is a sub-fault of the eastern branch fault zone of Jinsha River in F1 and the Zhongdian–Longpan–Qiaohou fault zone in F2, while the strata in the same series are generally in integrated contact (Figure 1b).
The seasonal performance of the study area is that the rainy season of the basin is from May to October every year. Influenced by both the southwest and southeast monsoons, the study area experiences an abundance of atmospheric moisture, resulting in concentrated precipitation. The mean annual precipitation measures 954.0 mm, while the average annual evaporation stands at 2179 mm. Furthermore, the region exhibits an annual mean runoff of 1360 m3/s, accompanied by an average annual temperature of 12.6 °C. According to the “China ground motion parameter zoning map”, the peak acceleration of the ground motion of the class II site in Tuoding Township, Deqin County, Diqing City, Yunnan Province is 0.20 g. The ground motion response spectrum within the study area exhibits a distinctive peak at a period of 0.40 s, corresponding to a seismic intensity of VIII on the scale. The predisposition to slope instability on both sides of the river, as well as the recurring incidents of landslides, can be attributed to a confluence of factors, including robust tectonic activity, ongoing fluvial incision erosion, prolonged weathering processes, a complex high ground stress field, and the effects of free surface unloading [43].

3. Research Methods

3.1. Data Collection

SBAS-InSAR is a time-series InSAR technology based on multi-scene SAR images. The principle of this technology is to collect a specific number of SAR images. The number of interference pairs can be limited according to the set spatial and temporal baseline threshold range. The existing SAR image data are combined according to the set threshold to obtain a series of short spatial baseline differential interferograms, which can well overcome the influence of time decorrelation. Finally, the SVD method can also be used to obtain the time series of the deformation rate and deformation. This method can be used to form interference pairs of SAR images for a long period of time, thereby increasing the number of interference pairs and increasing the time density of deformation monitoring. In the long-term deformation monitoring work, the time sampling rate is effectively improved, and the influence of atmospheric error can be suppressed to a certain extent. At present, this method has been widely used in the study of the slow creep process of landslides and the slow deformation of the interseismic deformation of fault zones, which is of great help in the analysis of the slow evolution of disaster bodies.
The SBAS-InSAR methodology was employed in this study, utilizing ascending orbit data from ALOS-2 and Sentinel-1A satellites, in conjunction with digital elevation model (DEM) data. ALOS-2, launched by the Japan Aerospace Exploration Agency (JAXA) in May 2014, provided the satellite imagery, while Sentinel-1A, launched by the European Space Agency in October 2014, contributed additional satellite data. The DEM used in this investigation was acquired through the Shuttle Radar Topography Mission (SRTM) sensor, featuring a spatial resolution of 30 m [3].
ALOS-2, the sole operational L-band SAR satellite, operates at a frequency of 1.2 GHz with a wavelength of approximately 23.5 cm. It acquires observation data independent of weather conditions and time constraints. The L-band wavelength enables penetration through vegetation, making it particularly suitable for monitoring surface deformation in densely forested areas. It offers a resolution of 10 m and an incident angle of 36.28°. Due to satellite imaging schedules, the data acquisition intervals are irregular. On the other hand, Sentinel-1A is a C-band radar satellite with a wavelength of around 5.6 cm. While it has limitations in densely vegetated regions, it can effectively penetrate clouds and remains unaffected by weather and climate conditions. Sentinel-1A is employed in various applications such as monitoring flood areas, landslides, and forest fires. It operates in interferometric wide (IW) swath imaging mode, with VV polarization and an average incident angle of 33.91°. The ground resolution is 5 × 20 m [3]. Specific details pertaining to the satellite data utilized are presented in Table 1.
We applied SBAS-InSAR technology for the identification of 65 landslides within the Tuoding segment of the Jinsha River (Figure 2). To ascertain the precision of potential landslide identifications, a field investigation was conducted, during which our research team visited the study area on 25 April 2021 and conducted a 17-day field geological survey on the identified landslides. The main object of the survey was the large-scale gravity geological disasters that occurred in the early stage, including 17 accumulation bodies from the downstream to the upstream. Based on the ArcGIS platform, combined with the remote sensing images and elevation maps of the study area, the three-dimensional geological model of the study area is shown in Figure 3.

3.2. Field Investigation and Analysis of Typical Landslide Formation Mechanism

We focused on the analysis of four typical landslides: Shentingla (STL), Kongzhigong (KZG), Dingzhui (DZ), and Duila (DL). The STL, TGLK, DZ, and DL landslides were analyzed by remote sensing image interpretation and InSAR technology (Figure 4). On-site investigations and sample analyses were conducted to gain an in-depth understanding of the landslide formation mechanisms.
The STL landslide is distributed on the left bank of the Jinsha River under study; the occurrence of the STL bedrock layer is mostly located between 227–300°∠29–58° (Figure 5a,b), while the slope of the deposit along the river is 240–250°. Therefore, the bank slope structure is a moderately inclined slope intersecting with the slope at a small angle. In addition, at the bottom of the field investigation, a group of structural planes in the nearly vertical steep slope are more developed. Hence, it can be deduced that the accumulation body undergoes slip-bending failure as its genetic mechanism. The presence of the steep structural plane in this group can be attributed to the tensile fracture resulting from the bending arch of the lower rock mass when it slides toward the bank of the Jinsha River. Subsequently, the slope slows down and encounters obstruction from the terrain ahead. The KZG, DZ, and DL landslides are situated along the tight bank of the studied Jinsha River. The bedrock lithology in the KZG area is medium-thin schist or dolomite. The occurrence of the rock stratum is 102–135°∠39–60°. The geological stratum exhibits a gentle intersection with the slope surface at a shallow angle, forming a subsequent slope area outside the central and steeper slope region. The surface rock layer is characterized by a relatively fragmented structure and displays a moderate degree of weathering. Based on the above bedrock rock mass structure and bank slope structure characteristics, the genetic mechanism of the Kongzhigong deposit is bedding sliding (Figure 5c,d). The No. 1 accumulation body of the DZ landslide is located at an altitude of more than 2500 m. It was once located in the range of glacier movement. The alternating freeze–thaw cycle during the glacial and interglacial periods is the main reason for the formation of the No. 1 accumulation body (Figure 5e). The No. 2 accumulation body is formed by the overall deformation of the landslide body along the fragile sliding surface. In area 2, there are obvious landslide platforms and landslide back walls. The overall shape of the accumulation body is the tongue-shaped terrain uplifted in the ditch, which has the topographic characteristics of the accumulation of landslide materials in the ditch. The No. 3 accumulation body is distributed along the steep slope of the rear edge of area 3, with a large width, but a thin thickness, and the arrangement of the fragments is irregular, no sorting, mainly angular, with typical characteristics of near-source accumulation. The elevation of the front edge of the platform (about 2067 m) is much higher than that of the front edge of the opposite bank (about 1952 m), so the No. 4 accumulation body is not the remnant of the opposite bank landslide dam. In the study area of the DL landslide, there are houses with cracks in the wall, and a crack is developed in the east–west wall. The extension length of the crack is about 3 m, and the opening width increases gradually from the upper part to the lower part. The upper part is closed, and the bottom opening width can reach 5 cm (Figure 6). The rock mass belongs to the thin layer structure, and the strength of the rock layer is low. The weak bedding phyllite slips downward under the action of the surface accumulation body and its own gravity. The front edge of the phyllite extends to the bottom of the ditch, and the front edge is squeezed and uplifted by the rear rock layer. On the whole, the accumulation body should be the traction failure caused by the sliding bending of the bedding phyllite.

3.3. Selection of Evaluation Factors

The process of selecting factors for landslide susceptibility assessment offers a wide array of options, and the choice of pertinent factors can be guided by historical landslide survey data or the relevant literature specific to the study area. Furthermore, it is feasible to consider a broad spectrum of factors associated with landslide occurrences based on the literature references and subsequently discern the most suitable ones for the present study during the landslide susceptibility evaluation process. By analyzing the development characteristics and formation mechanism of geological disasters in Tuoding Township, the susceptibility assessment indexes of geological disasters in Tuoding Township are divided into two levels: dominant factors (environmental conditions for landslide formation) and inducing factors (landslide triggering conditions). The dominant factors include elevation, slope, slope direction, water system, vegetation coverage, stratigraphic lithology, and geological structure [44,45,46,47]. Two evaluation indexes were selected for inducing factors: human activities and rainfall [48,49] (Figure 7).
Elevation data, derived from SRTM 30 m DEM, along with slope and aspect data, obtained from DEM sources, were utilized in this study. River and road data were sourced from the National Geographic Information Resource Catalog Service System (www.webmap.cn, accessed on 5 October 2021) (Table 1). These selected factors exhibit a strong correlation with landslide occurrences. In order to determine the dominant interval of each factor affecting landslide susceptibility, it is necessary to analyze the susceptibility of each factor interval. Most of the previous studies used the number of landslides or landslide area indicators in each interval of the factor for analysis. However, this method cannot well explain the distribution of landslides with the change in the impact factor value. Therefore, in this paper, the relative area density (Dij) of the landslide is used to represent the activity degree of the landslide in each interval of different factors. Its equation is as follows [3,8,13,36]:
D i j = A i j / A S i j / S
where Dij is the relative area density value of the landslide in the j sub-classification under the i factor; Aij represents the landslide area in j grade under i factor; Sij is the total area of the ith factor j sub-classification; and A and S represent the total area of the landslide and the total area of the study area, respectively.
We calculate the size of the landslide correlation degree (Dij), and assigned each level to 1, 2, 3, 4, and four sub-level reclassification data according to the order of the landslide area density values from small to large for subsequent susceptibility weighting calculations. In consideration of the dimensions of the study area, all grid data employed in the computation process were rescaled to a uniform 30 m resolution. Detailed classifications for each factor, the respective areas encompassing various landslide grades, and the resultant Dij values are meticulously presented in Table 2 and Table 3, as well as Figure 8, respectively.

3.4. Selection of Susceptibility Assessment Model

3.4.1. Frequency Ratio Model

The frequency ratio model has reached a relatively advanced stage in the assessment of landslide susceptibility [48]. Empirical evidence has demonstrated that this approach effectively captures the relative importance of different factors contributing to landslide occurrences when on-site landslide data are collected. As a result, the assessment outcomes are more accurate and well supported. This methodology is particularly suitable for conducting quantitative assessments of landslide susceptibility in areas prone to toppling events. The method calculates the probability of landslides within each classification interval of a specific factor and then aggregates the frequency ratios across intervals to determine the factor’s influence on landslides, known as the landslide susceptibility index (LSI). The calculation equation for this model is [3,8,13,36]:
F R i j = N i j / N M i j / M
where FRij is the frequency ratio of j-graded under i-factor; nij is the number of graded landslides under factor i; mij is the number of grids classified by j under factor i; and N and M represent the total number of landslides and the total number of grids in the study area, respectively.
Considering different influence factors FRij, for a specific spatial location, it is assumed that the interval it belongs to is F, and the susceptibility index of landslide disaster LSI in this spatial location is obtained by adding the frequency ratios of different factors. The current factor landslide susceptibility index can be obtained by summing the frequency ratio of each factor [3,8,13,36]:
L S I = F R i j
where LSI is the landslide susceptibility evaluation index.

3.4.2. Information Quantity Model

The information model has evolved from the principles and concepts established in information theory. It is a method that uses the landslide density to calculate the amount of information of landslide occurrence under each influence factor interval. It realizes the zoning of landslide susceptibility by the weighted superposition of single-factor information [49,50,51,52,53]. This method can not only objectively evaluate the contribution of each influencing factor to the occurrence of landslides, but also more accurately and intuitively reflect the landslide-prone areas, and provide a scientific basis for the prediction and prevention of geological disasters. The specific equation is as follows [3,8,13,36]:
I x j A = I n Q j / Q M j / M = I n Q j / M j Q / M
where IxjA is the information value of the occurrence of event A (landslide) under the j interval of x factor; qj is the number of landslide grids in the xj sub-interval; mj is the total number of grids of sub-interval xj; and Q and M represent the total number of landslide grids in the study area and the total number of grids in the study area, respectively.
The obtained information value of each interval is multiplied by the corresponding number of landslides, and then the total weight index value of factor i can be obtained by summing the internal factors [3,8,13,36]:
T W I ( x ) = Q j × I x j A
where TWI(x) is the total weight value of the x factor.

3.4.3. Analytic Hierarchy Process

In the context of employing the analytic hierarchy process (AHP) to formulate the judgment matrix, the conventional approach typically relies heavily on expert judgment to assess and score the importance of each factor, which is subsequently used to calculate their respective weights. In this paper, in order to prevent the problem of excessive subjectivity of expert scoring, the correlation degree of each factor is sorted (Table 3), and the judgment matrix is constructed by combining the method of expert scoring. The specific modeling steps of the AHP are as follows: (1) develop the hierarchical structure of the target problem; (2) create the judgment matrix, incorporating both expert scoring and factor correlation rankings; (3) calculate the weights assigned to each factor based on the judgment matrix; and (4) perform a consistency test to evaluate the reliability of the judgment matrix.
Steps (3) and (4) are calculated using Equations (6) and (7) [3,8,13,36,38].
C R = C I / R I
C I = λ max n n 1
where CR is the random consistency ratio; CI is the consistency index; RI is a random consistency index; λmax is the maximum eigenvalue of the judgment matrix; and n is the order number.

3.5. Model Calculation

3.5.1. Frequency Ratio Model Calculation

To calculate the landslide susceptibility index of each factor, the frequency ratio Equation (2) was utilized to determine the frequency ratio of each interval of the nine factors. This was followed by using Equation (3) to generate Table 4 and Table 5, which were sorted accordingly.
Based on the outcomes of the frequency ratio model computations, the study area’s susceptibility is classified into five distinct levels, namely, very low, low, moderate, high, and very high susceptibility, using the natural breakpoint method. Subsequently, the landslide susceptibility zoning map under the frequency ratio model is generated (Figure 9).

3.5.2. Calculation of Information Quantity Model

To obtain this map, we first utilized Equation (4) to calculate the information quantity of each sub-interval of the nine factors in this study. We then employed Equation (5) to determine the total weight value (TWI) of each factor. After standardizing the output of the TWI value using Equation (4) and converting it into an interval of 1–10, we repeated this process for the TWI values using Equation (8) and converted them into intervals of 1–10. This yielded the information value of each factor, which was used to generate Table 6 and Table 7 [3,8,13,36].
W F i = T W I A i M i n T W I A i M a x T W I A i M i n T W I A i × 9 + 1
where WFi is the single-factor weight value, MaxTWIAi is the maximum total weight index value, and MinTWIAi is the minimum total weight index value.
Combined with the information algorithm, the natural breakpoint method is used to carry out five levels of landslide susceptibility zoning, and the landslide susceptibility zoning map under the information model is obtained, as shown in Figure 10.

3.6. Model Comparison and Verification

3.6.1. ROC Curve Validation

The ROC curve is a valuable quantitative evaluation method used to effectively assess the accuracy of model predictions. By plotting the ROC curve, we can calculate the AUC value, which represents the area under the curve and ranges from 0.5–1. The closer the AUC value is to 1, the more accurately the model predicts, as indicated by a curve that is more curved toward the upper-left corner. In this study, we employed the ROC curve to verify the prediction results of the two models. Figure 11 illustrates the verification results, with AUC values of 0.792 and 0.806 for the two models, respectively. These results indicate that the evaluation outcomes are more accurate, and that the information model’s evaluation results are superior.

3.6.2. Verification of Density Method

The landslide density verification method uses the ratio of the number of landslides N to the area S in each prone interval to obtain the landslide density value in each zoning range. In theory, the numerical value should increase with the increase in the susceptibility level, that is, the greater the susceptibility of the landslide, the greater the density of the landslide, and the larger the slope of the broken line diagram, the more accurate the model calculation results. The GIS platform is used to calculate the susceptibility zoning area of the two models, and the number of landslide points in each region is counted by the method of vector intersection. Table 8 presents a summary of verification of the density method, and the density value is plotted by the broken line diagram to obtain the Figure 12.

3.7. Susceptibility Assessment and Analysis

After obtaining the susceptibility evaluation results of the information model and the factor weights of the AHP, in order to make the results of the landslide hazard more reliable, we also need to analyze the density of the landslide points. The specific procedure entails the vectorization of the landslide points within the study area, followed by the utilization of GIS’s density analysis function. A search radius of 1500 m is specified to generate a landslide point density analysis map of the study area, which is illustrated in Figure 13.
Combined with the point density map, the superposition function of ArcGIS software is used to analyze the fuzzy superposition of the landslide point density map and the susceptibility data of the AHP + information method. The reclassification method still uses the natural discontinuity method. The study region is stratified into five distinct categories based on susceptibility levels, encompassing very low, low, moderate, high, and very high susceptibility zones. Consequently, the resulting landslide susceptibility assessment map for the study area is presented in Figure 14.

3.8. Result Analysis

The landslide hazard assessment map and grid reclassification data are collated and counted. The area of each grade is calculated by GIS software, and the landslide points in each area are counted by using the function of vector intersection. The data pertaining to the extent of each sub-level, the corresponding landslide areas within each sub-level, and the proportional distribution of landslides across different regions are compiled to generate the tabulated results presented in Table 9.
Based on our calculations, the study area has a high-susceptibility area of 16.22 km2, which accounts for 1.32% of the total area. Despite its small size, this area has the highest proportion of landslides and is primarily located in the north-central part of the study area, along the riverbanks and roads. The high-susceptibility area covers 152.66 km2 (12.4%) and is almost entirely coincident with the main rivers and the central eastern tectonic fault zone, as well as the dense road network in the south. This area has a high probability of landslide occurrence, with an 8.41% ratio of landslide occurrence. The moderate-susceptibility area covers 408.21 km2 (33.18%) and is mainly distributed in the northeast, central, and southern parts of the study area. The proportion of landslides in this area is at a medium level, accounting for 3.88%. The lower-susceptibility area is the largest, covering 455.72 km2 (37.04%) and is widely distributed throughout the study area except for the middle part. The proportion of landslides in this area is relatively stable at 1.60%. Lastly, the low-susceptibility area covers 197.48 km2 (16.05%), mainly located in the marginal zone far away from the river, with the western region having the highest distribution. The landslide area in this area accounts for only 0.17%, indicating a stable state with the smallest landslide susceptibility. Overall, these findings provide valuable insight into the distribution of landslide susceptibility in the study area and can be used to inform effective prevention measures.

4. Discussion

InSAR technology is a reliable method for identifying potential landslides. Previous studies have utilized Sentinel-1 and ALOS-2 satellite data for surface deformation monitoring, which we also used in this study to identify potential landslides in the study area. However, while interpretation methods such as visible light remote sensing technology and InSAR technology are generally scientific, their measurement accuracy can be impacted by factors such as cloud cover and surface reflectance. This can result in individual landslide data being accidental and unreliable. Therefore, we should not rely solely on remote sensing technology for landslide data survey and instead aim to collect data through multiple channels. Furthermore, we need to enhance the processing capacity of InSAR technology to reduce interference and improve accuracy, ensuring that our survey work is more precise. By doing so, we can obtain more reliable data to inform our analysis and decision-making related to landslides.
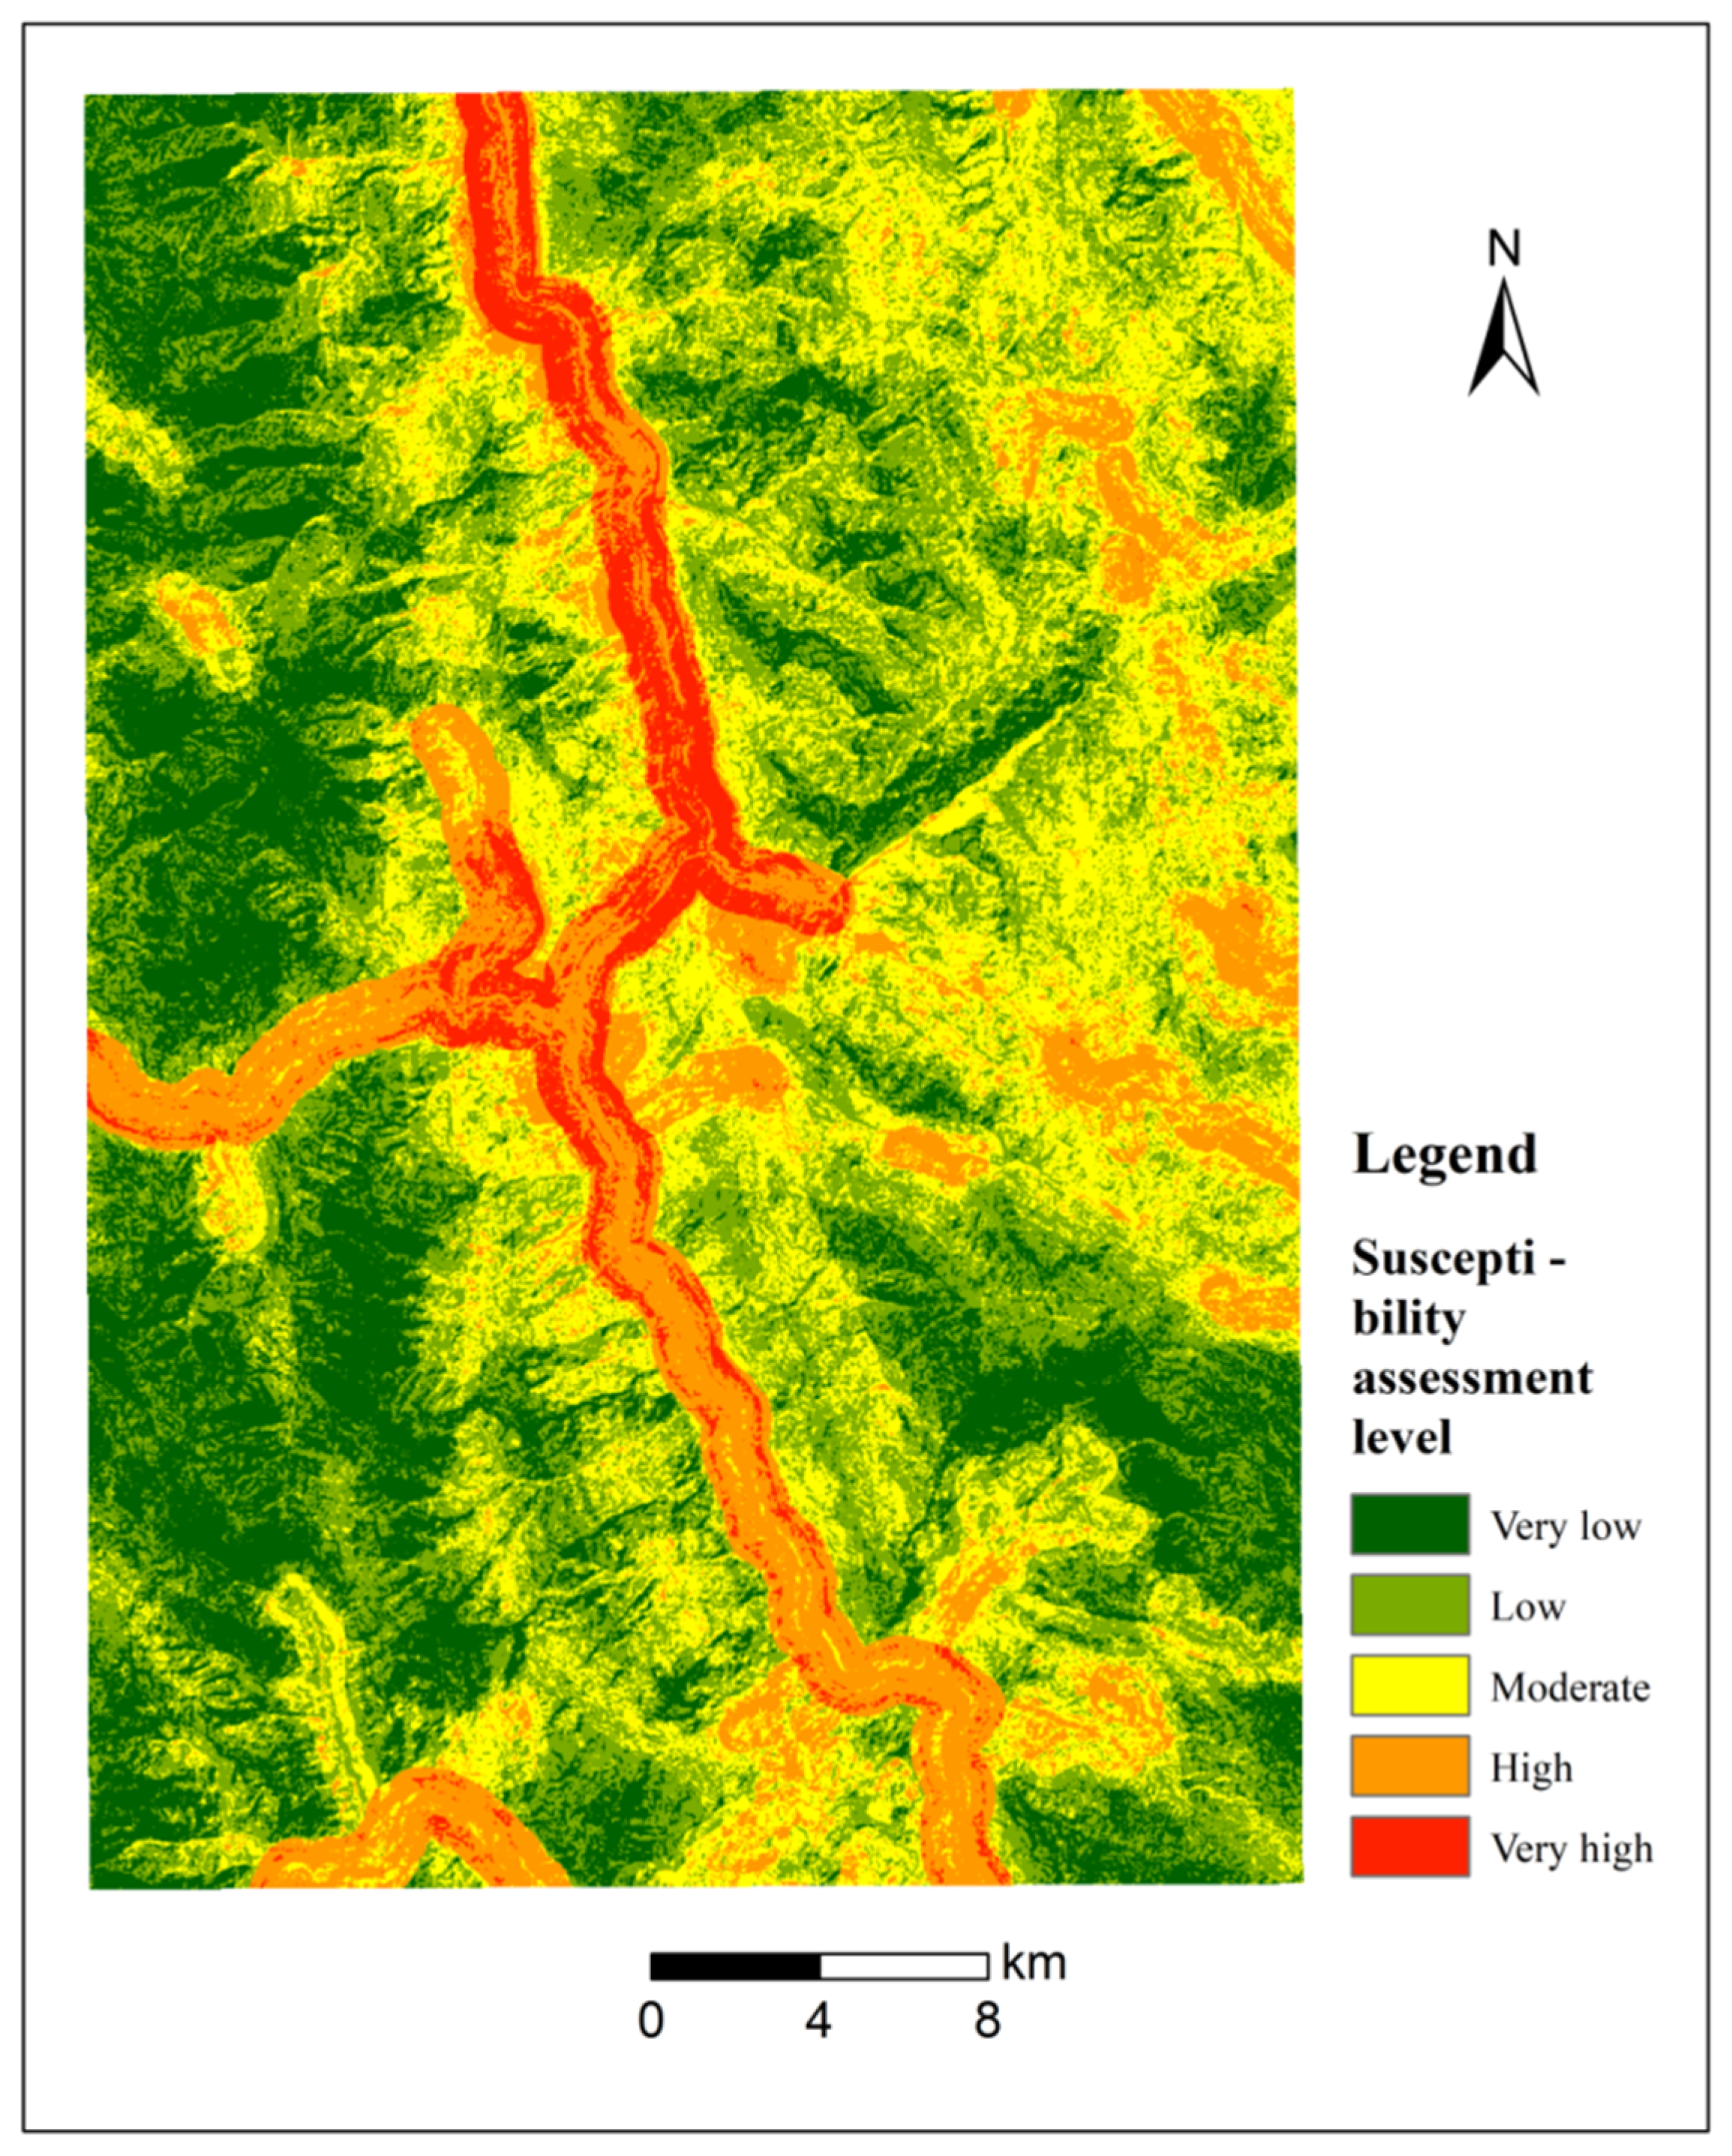
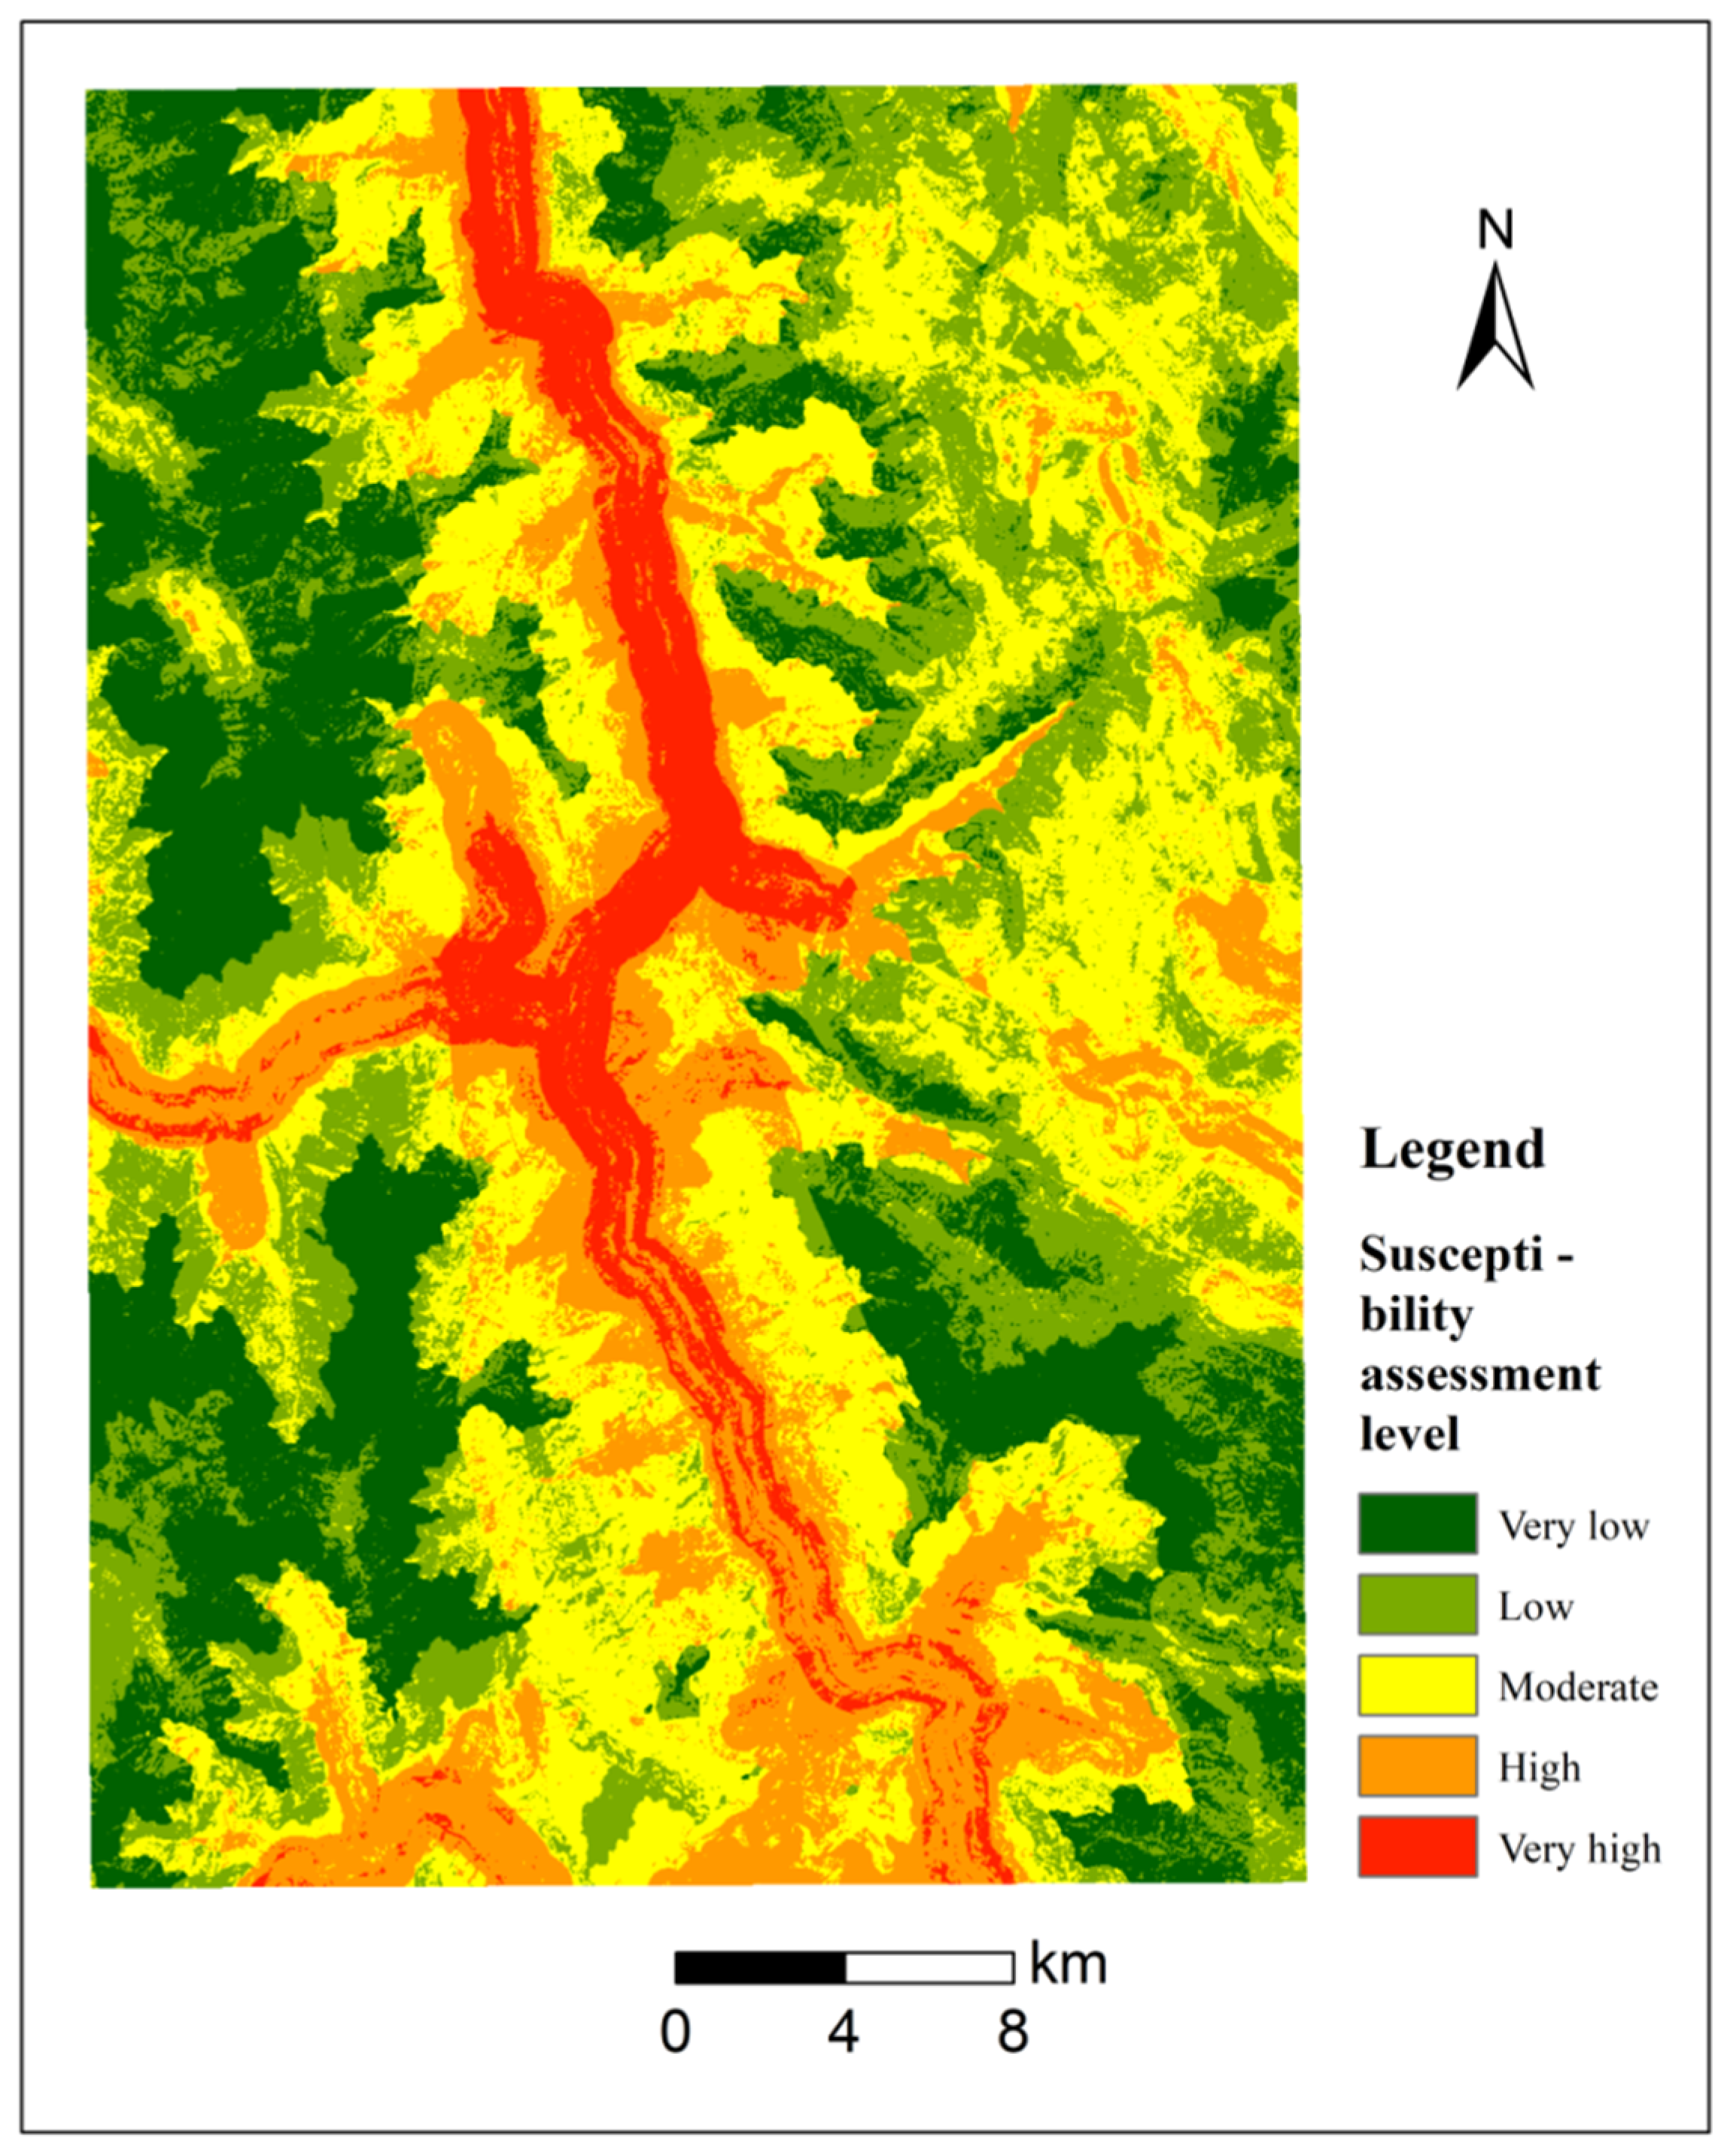
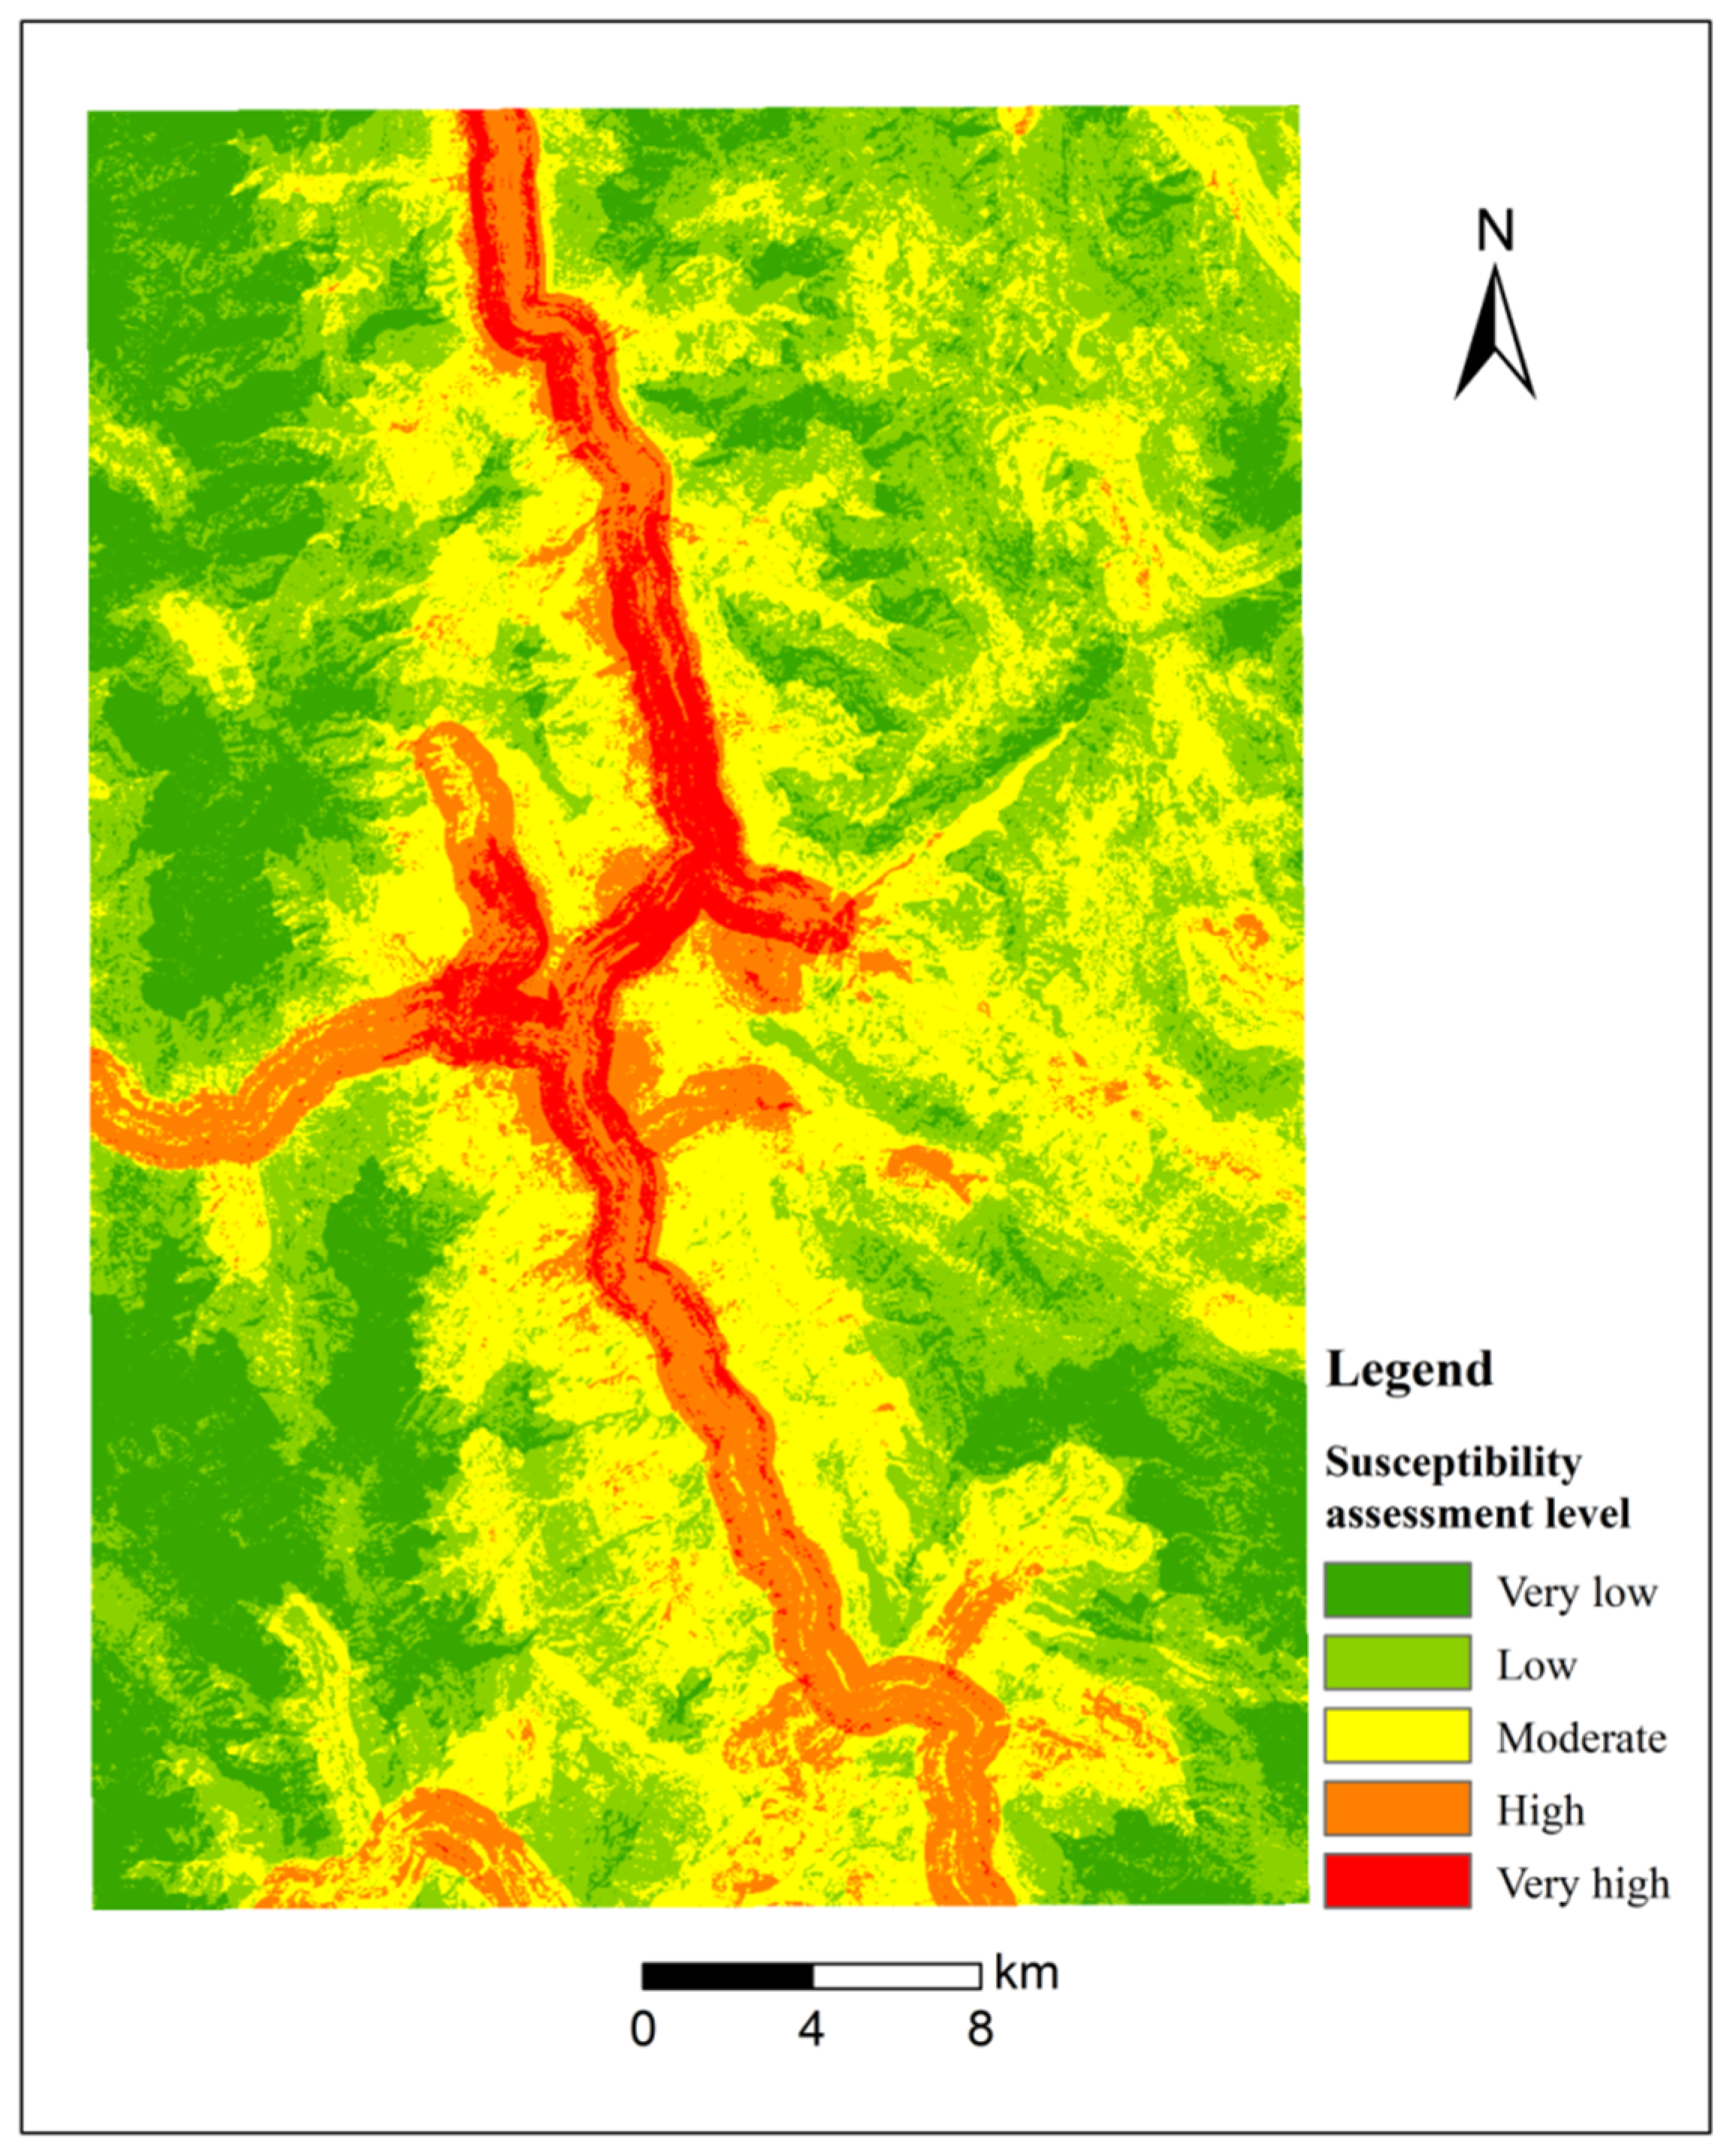
The examination of factors contributing to landslide susceptibility zoning reveals that regions characterized by very low susceptibility and low susceptibility are primarily clustered in the western sector, and in the southeast part of the region, these areas are characterized by high altitudes and dense vegetation, which in turn contribute to enhanced slope protection through the presence of vegetation on the slopes, and because of its high altitude, rivers, and roads. It is difficult to affect these areas, making these places safer; the high-susceptibility and higher-susceptibility areas are mainly concentrated on both sides of the Jinsha River and near the highways along the river. This phenomenon can likely be attributed to the persistent erosive forces exerted by the river along the base of the slopes on both flanks, coupled with the adverse impacts stemming from construction activities along the adjacent highways, which have resulted in damage and disruption to the slopes. The slope is more fragile, and because the elevation of the region is lower, the lower the vegetation in the low-altitude area closer to the foot of the slope on both sides is, the rock mass is bare and vulnerable to erosion, so the landslide susceptibility is greater. As a result, it is crucial to prioritize the protection of landslides on both sides of the river and implement appropriate preventive measures to reduce the dangerous consequences of landslides. By doing so, we can minimize the impact of landslides and ensure the safety of the local population.
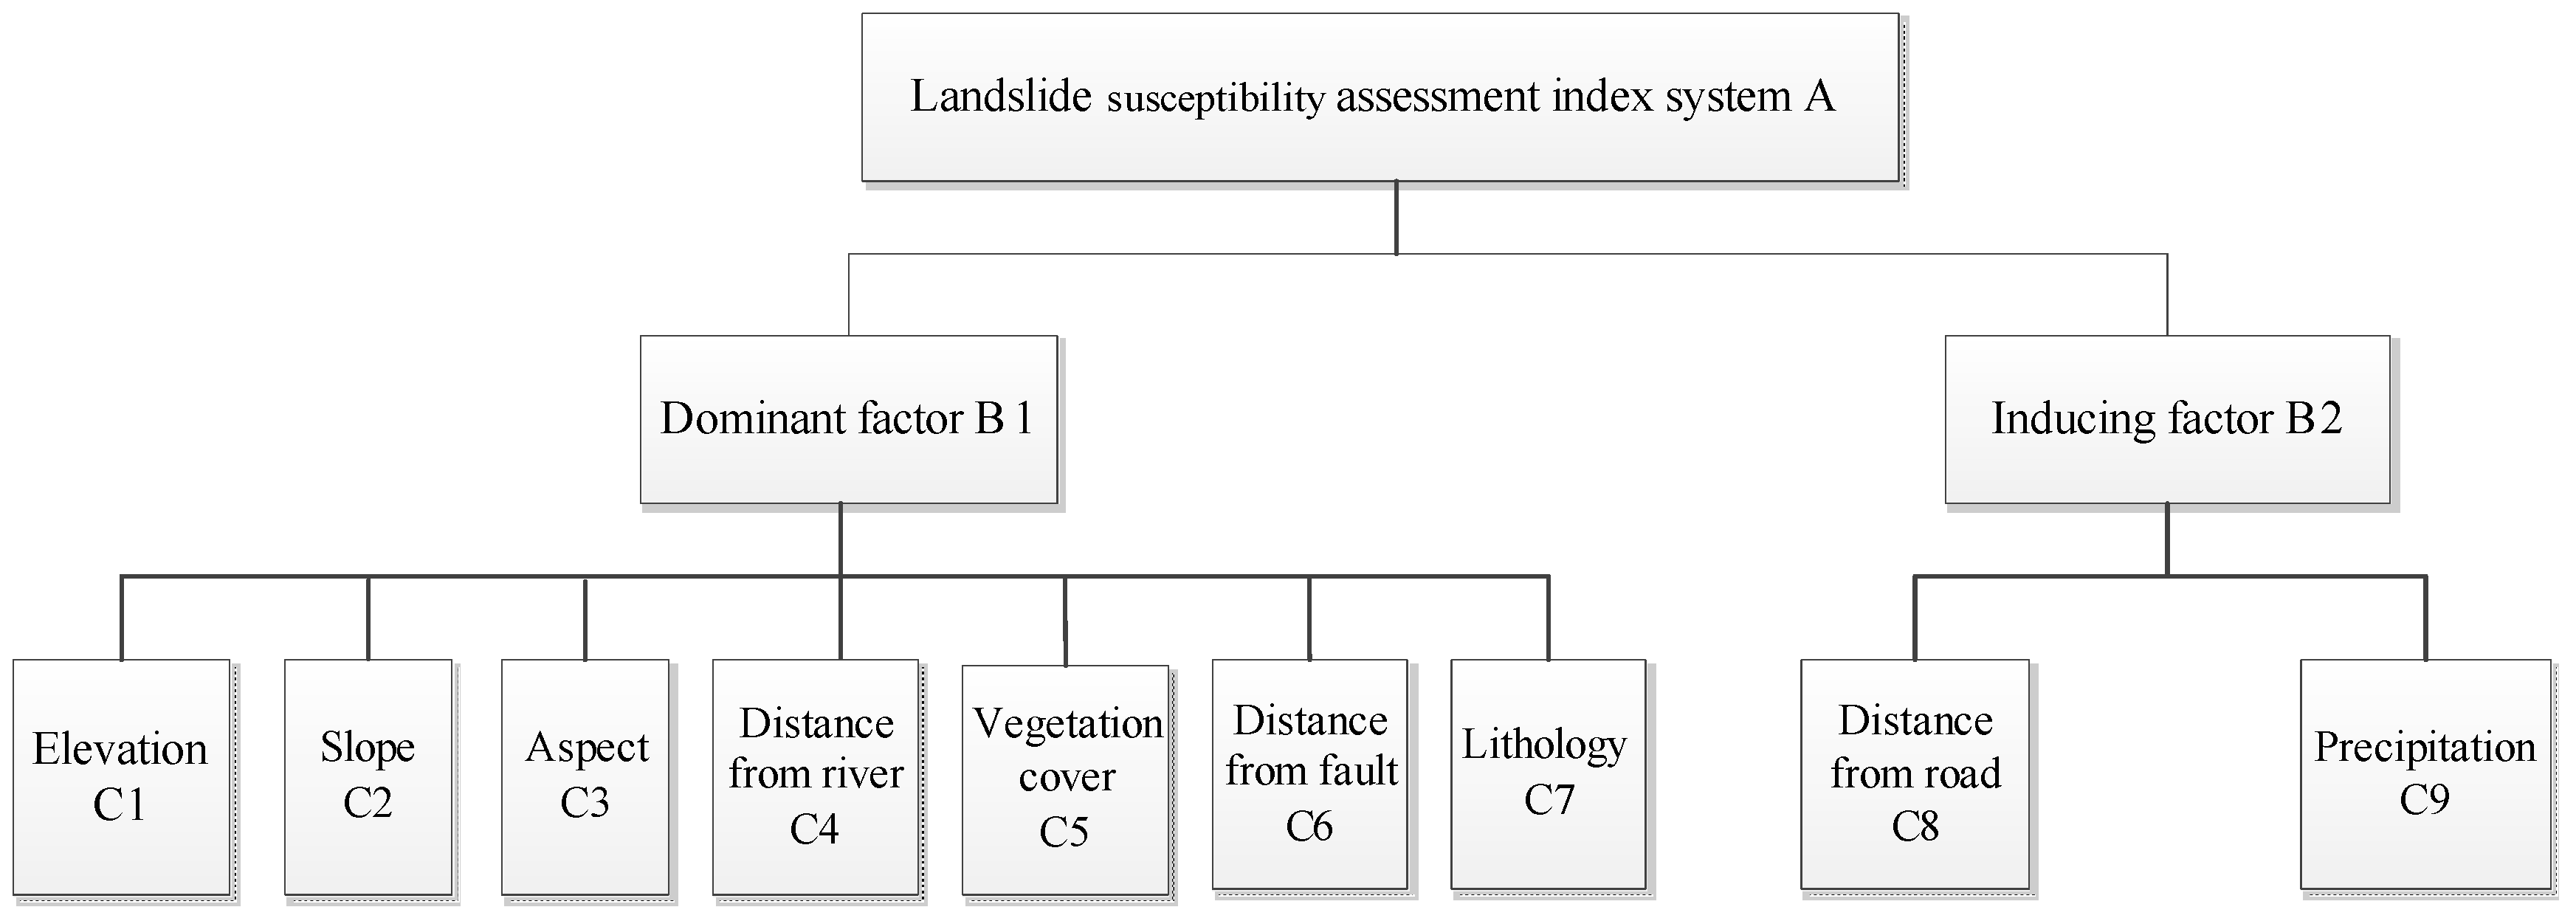
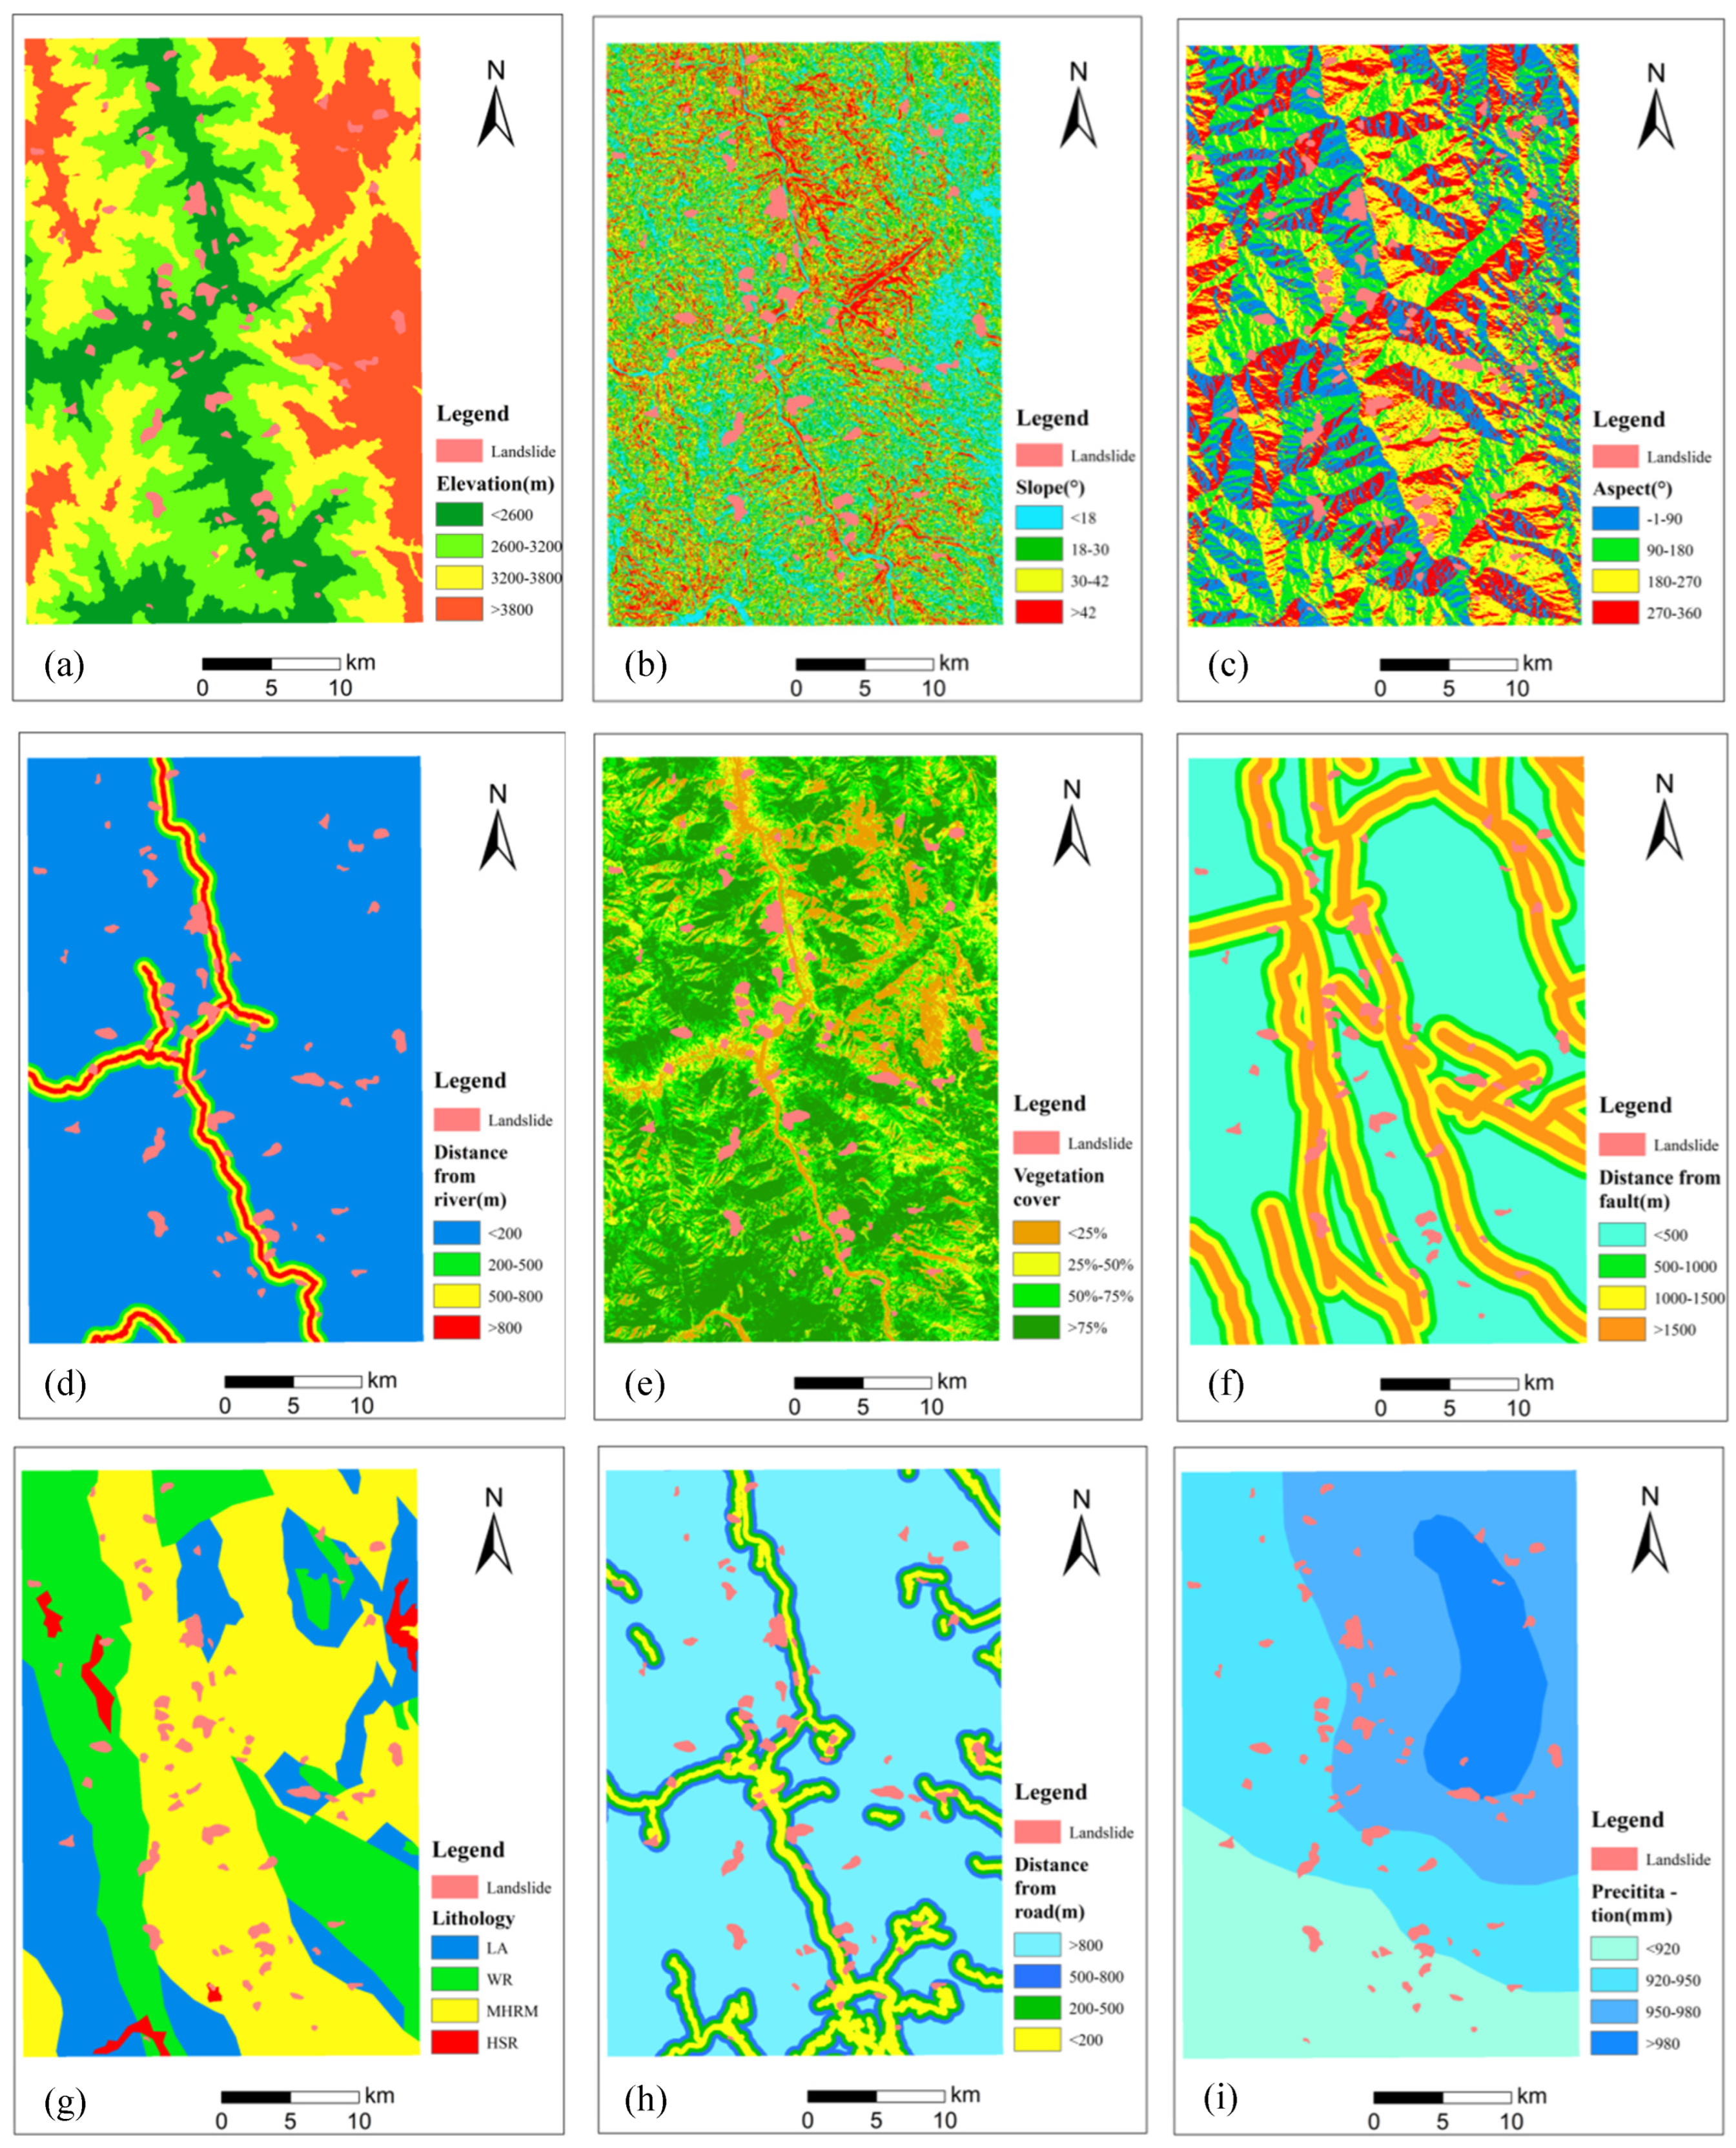
We organized and calculated the correlation between nine evaluation factors: elevation, slope, aspect, distance from river, vegetation coverage, distance from road, distance from fault, lithology, and precipitation. This allowed us to have a more intuitive understanding of the relationship between each factor’s range and landslide occurrence, facilitating a deeper understanding of local landslides. Based on the results of the landslide hazard analysis and single-factor data in the study area, it is known that landslides in the study area are mainly concentrated in areas with elevations below 2600 m, slopes of 18–30 degrees, aspects of 0–90 degrees, distances from rivers of 500–800 m, distances from roads of 200–500 m, vegetation coverage below 25%, distances from faults less than 500 m, and rainfall exceeding 980 mm. Areas with a higher overall landslide risk in the study area are concentrated along the rivers and roads running north–south, as well as near geological faults. There is still room for development in the selection of factors. Some factor data only reflect the moment of collection and do not consider the impact of time. In future research, in addition to ensuring the screening capability of factors, the timeliness of factors should also be considered.
Based on the results of the landslide sensitivity analysis, the study area should pay special attention to the banks of the Jinsha River, Jirenshui, Shenta, Lulu Ge, Guiba, and the easternmost part of the study area near the Shangri-La region. Monitoring measures should be strengthened and early preventive measures taken to reduce or avoid significant losses caused by landslides to the local area. Local governments should develop prevention plans, enhance mountain monitoring during heavy rainfall periods, and establish emergency overtime systems during flood seasons. At the same time, it is necessary to regulate construction work and strengthen supervision of the construction process to minimize disturbance to local slopes caused by construction activities. This can enhance the understanding of the hazards posed by rainfall and human engineering activities as landslide triggering factors, effectively protect the interests of the local people, and minimize harm.

5. Conclusions

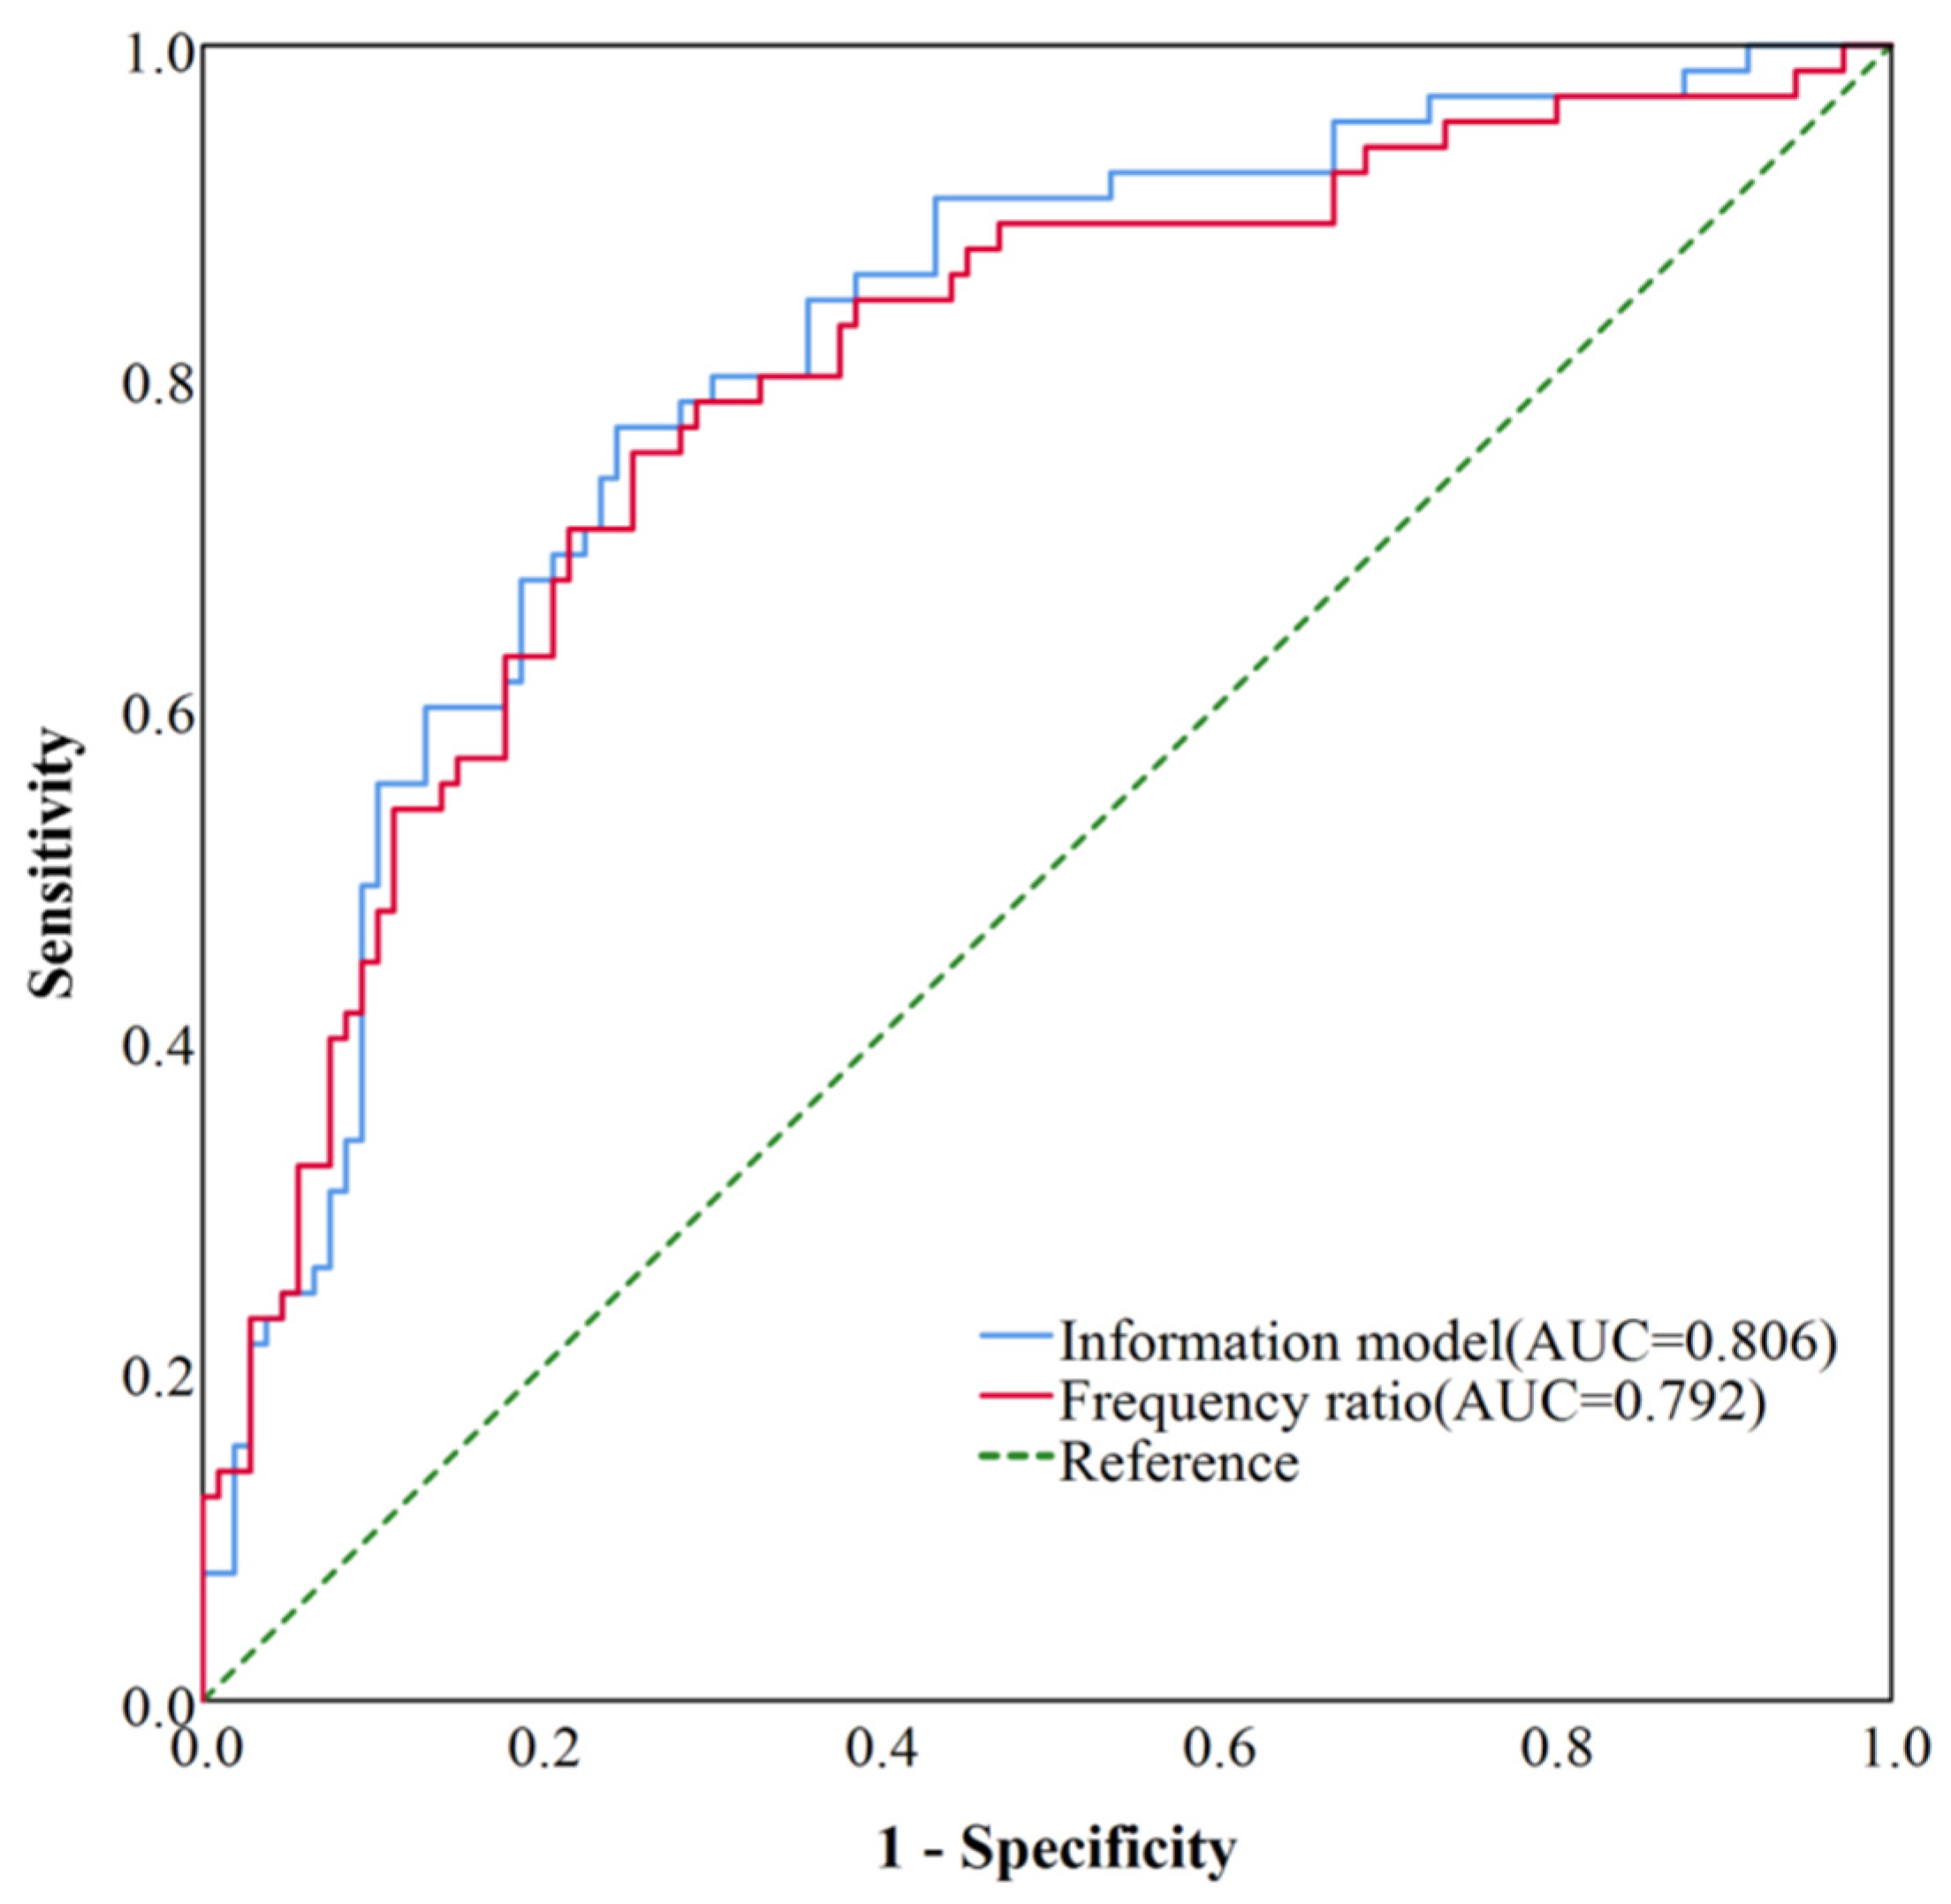
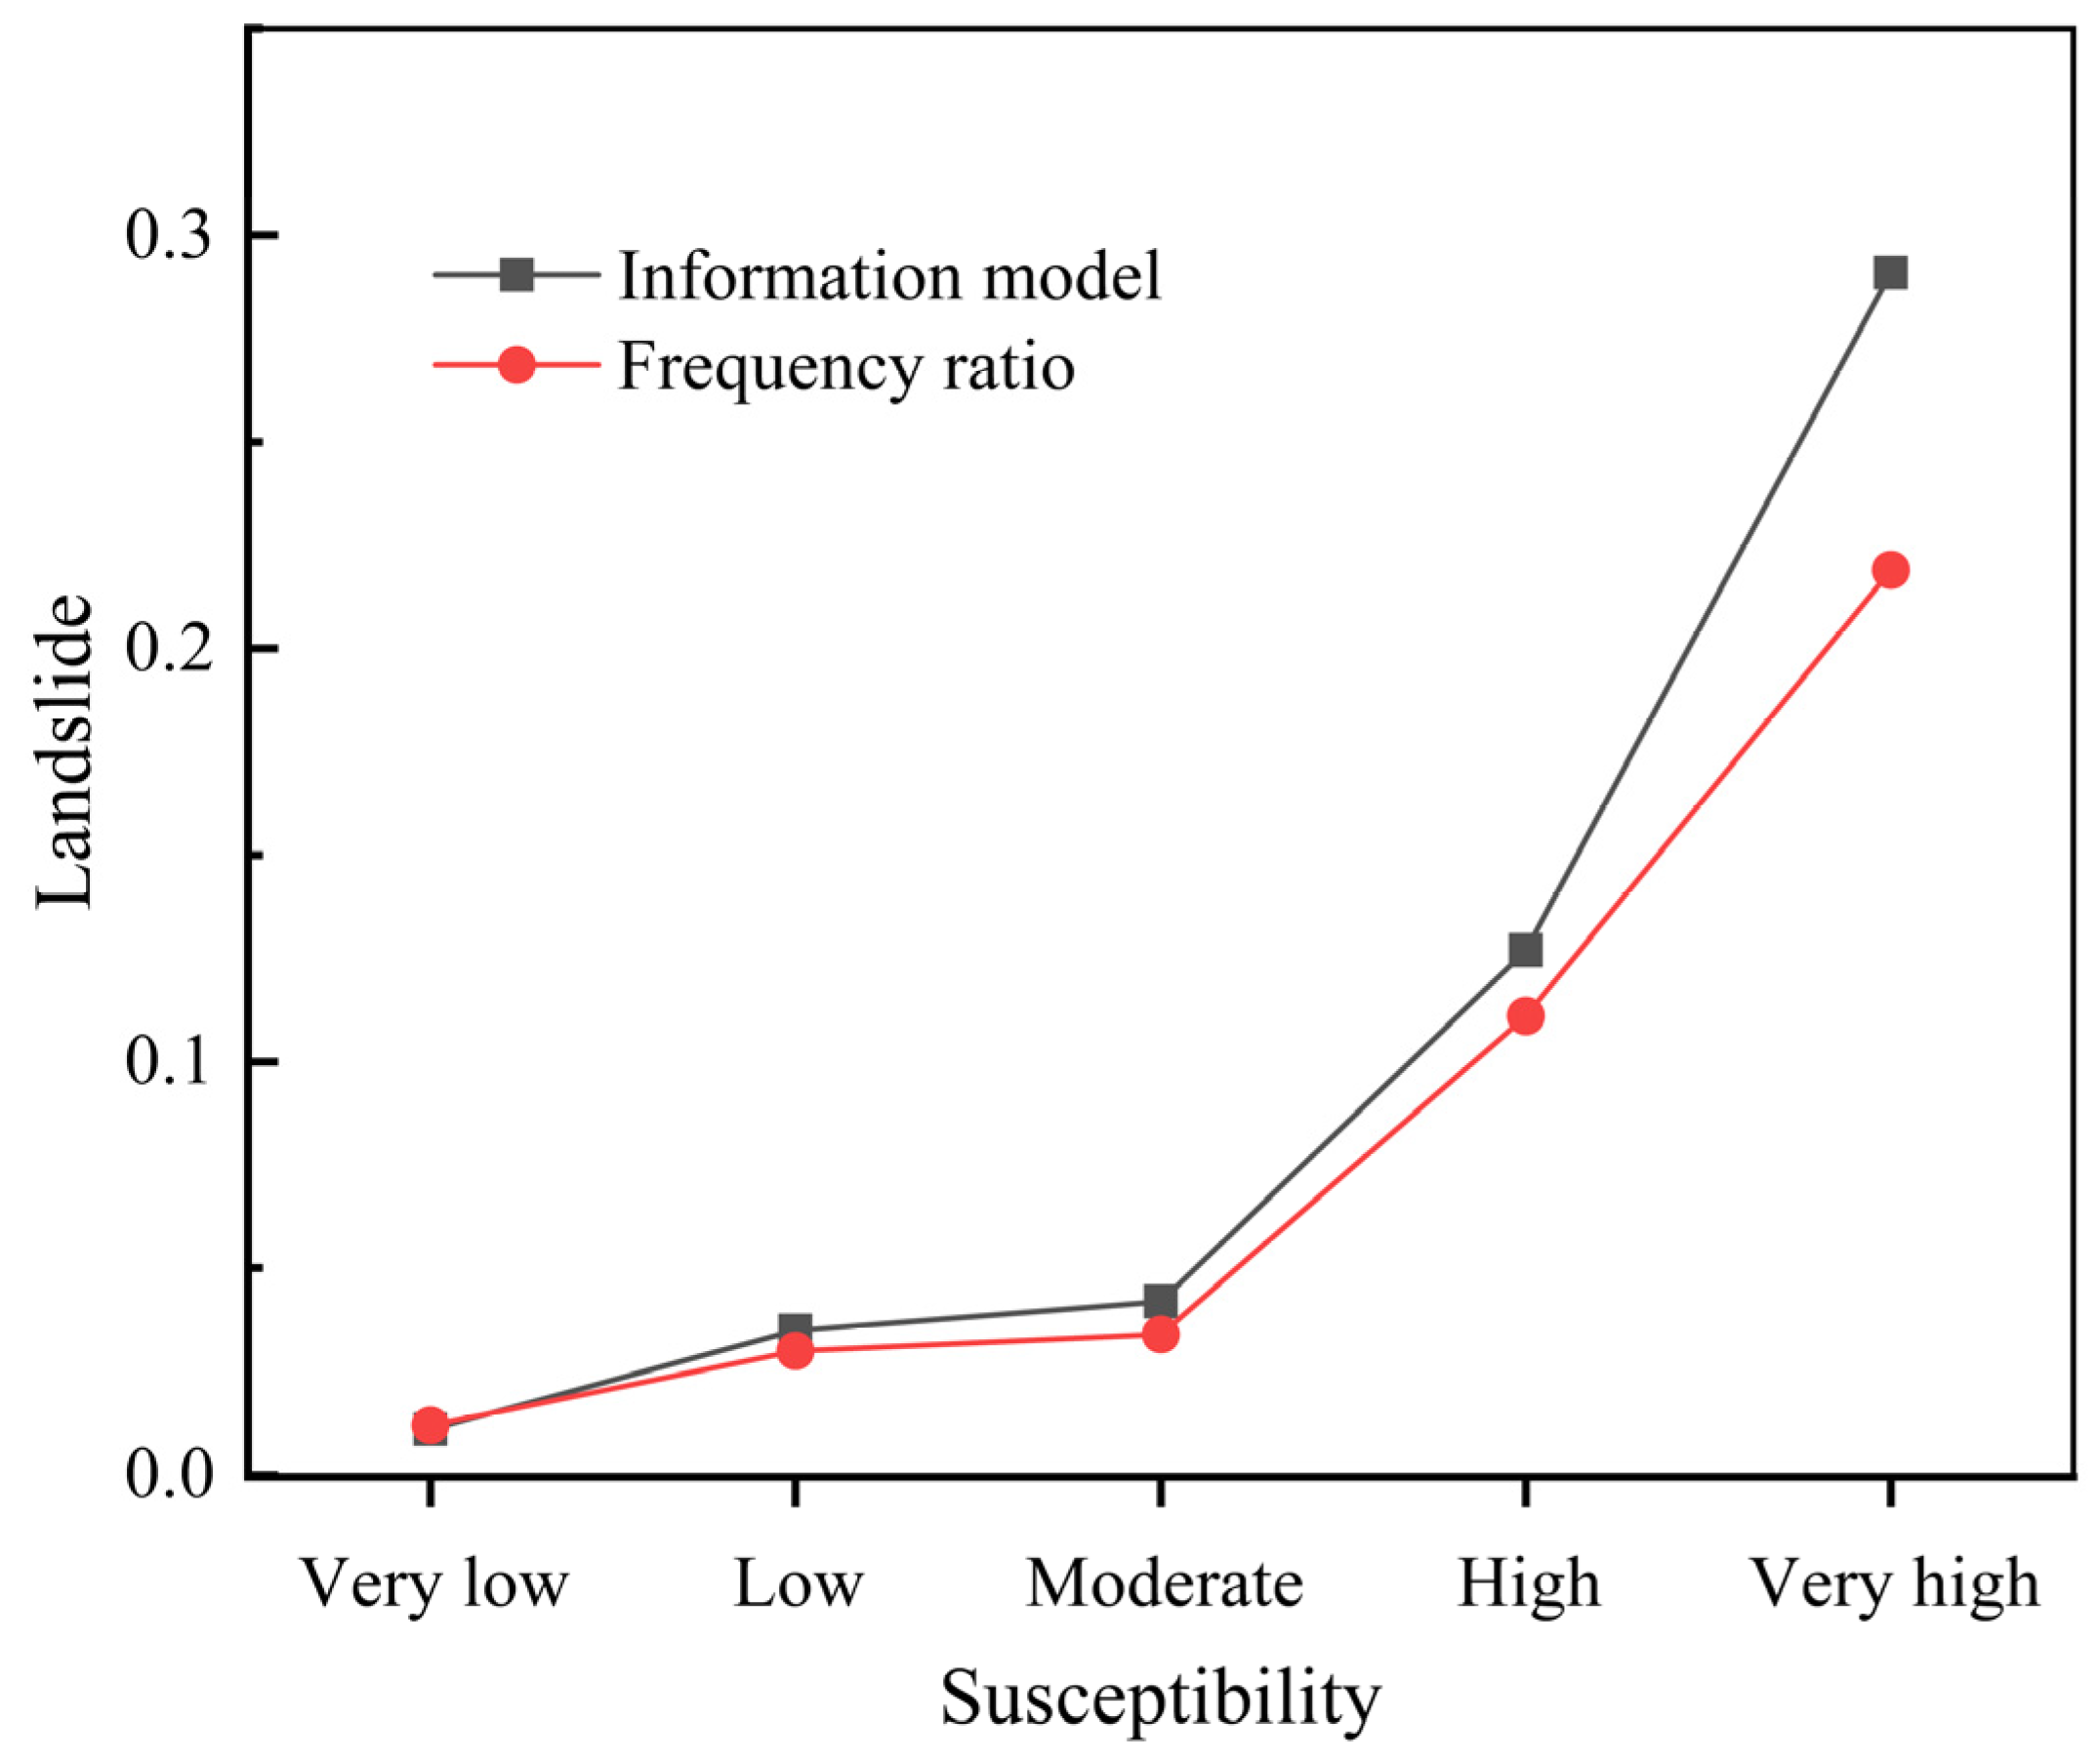
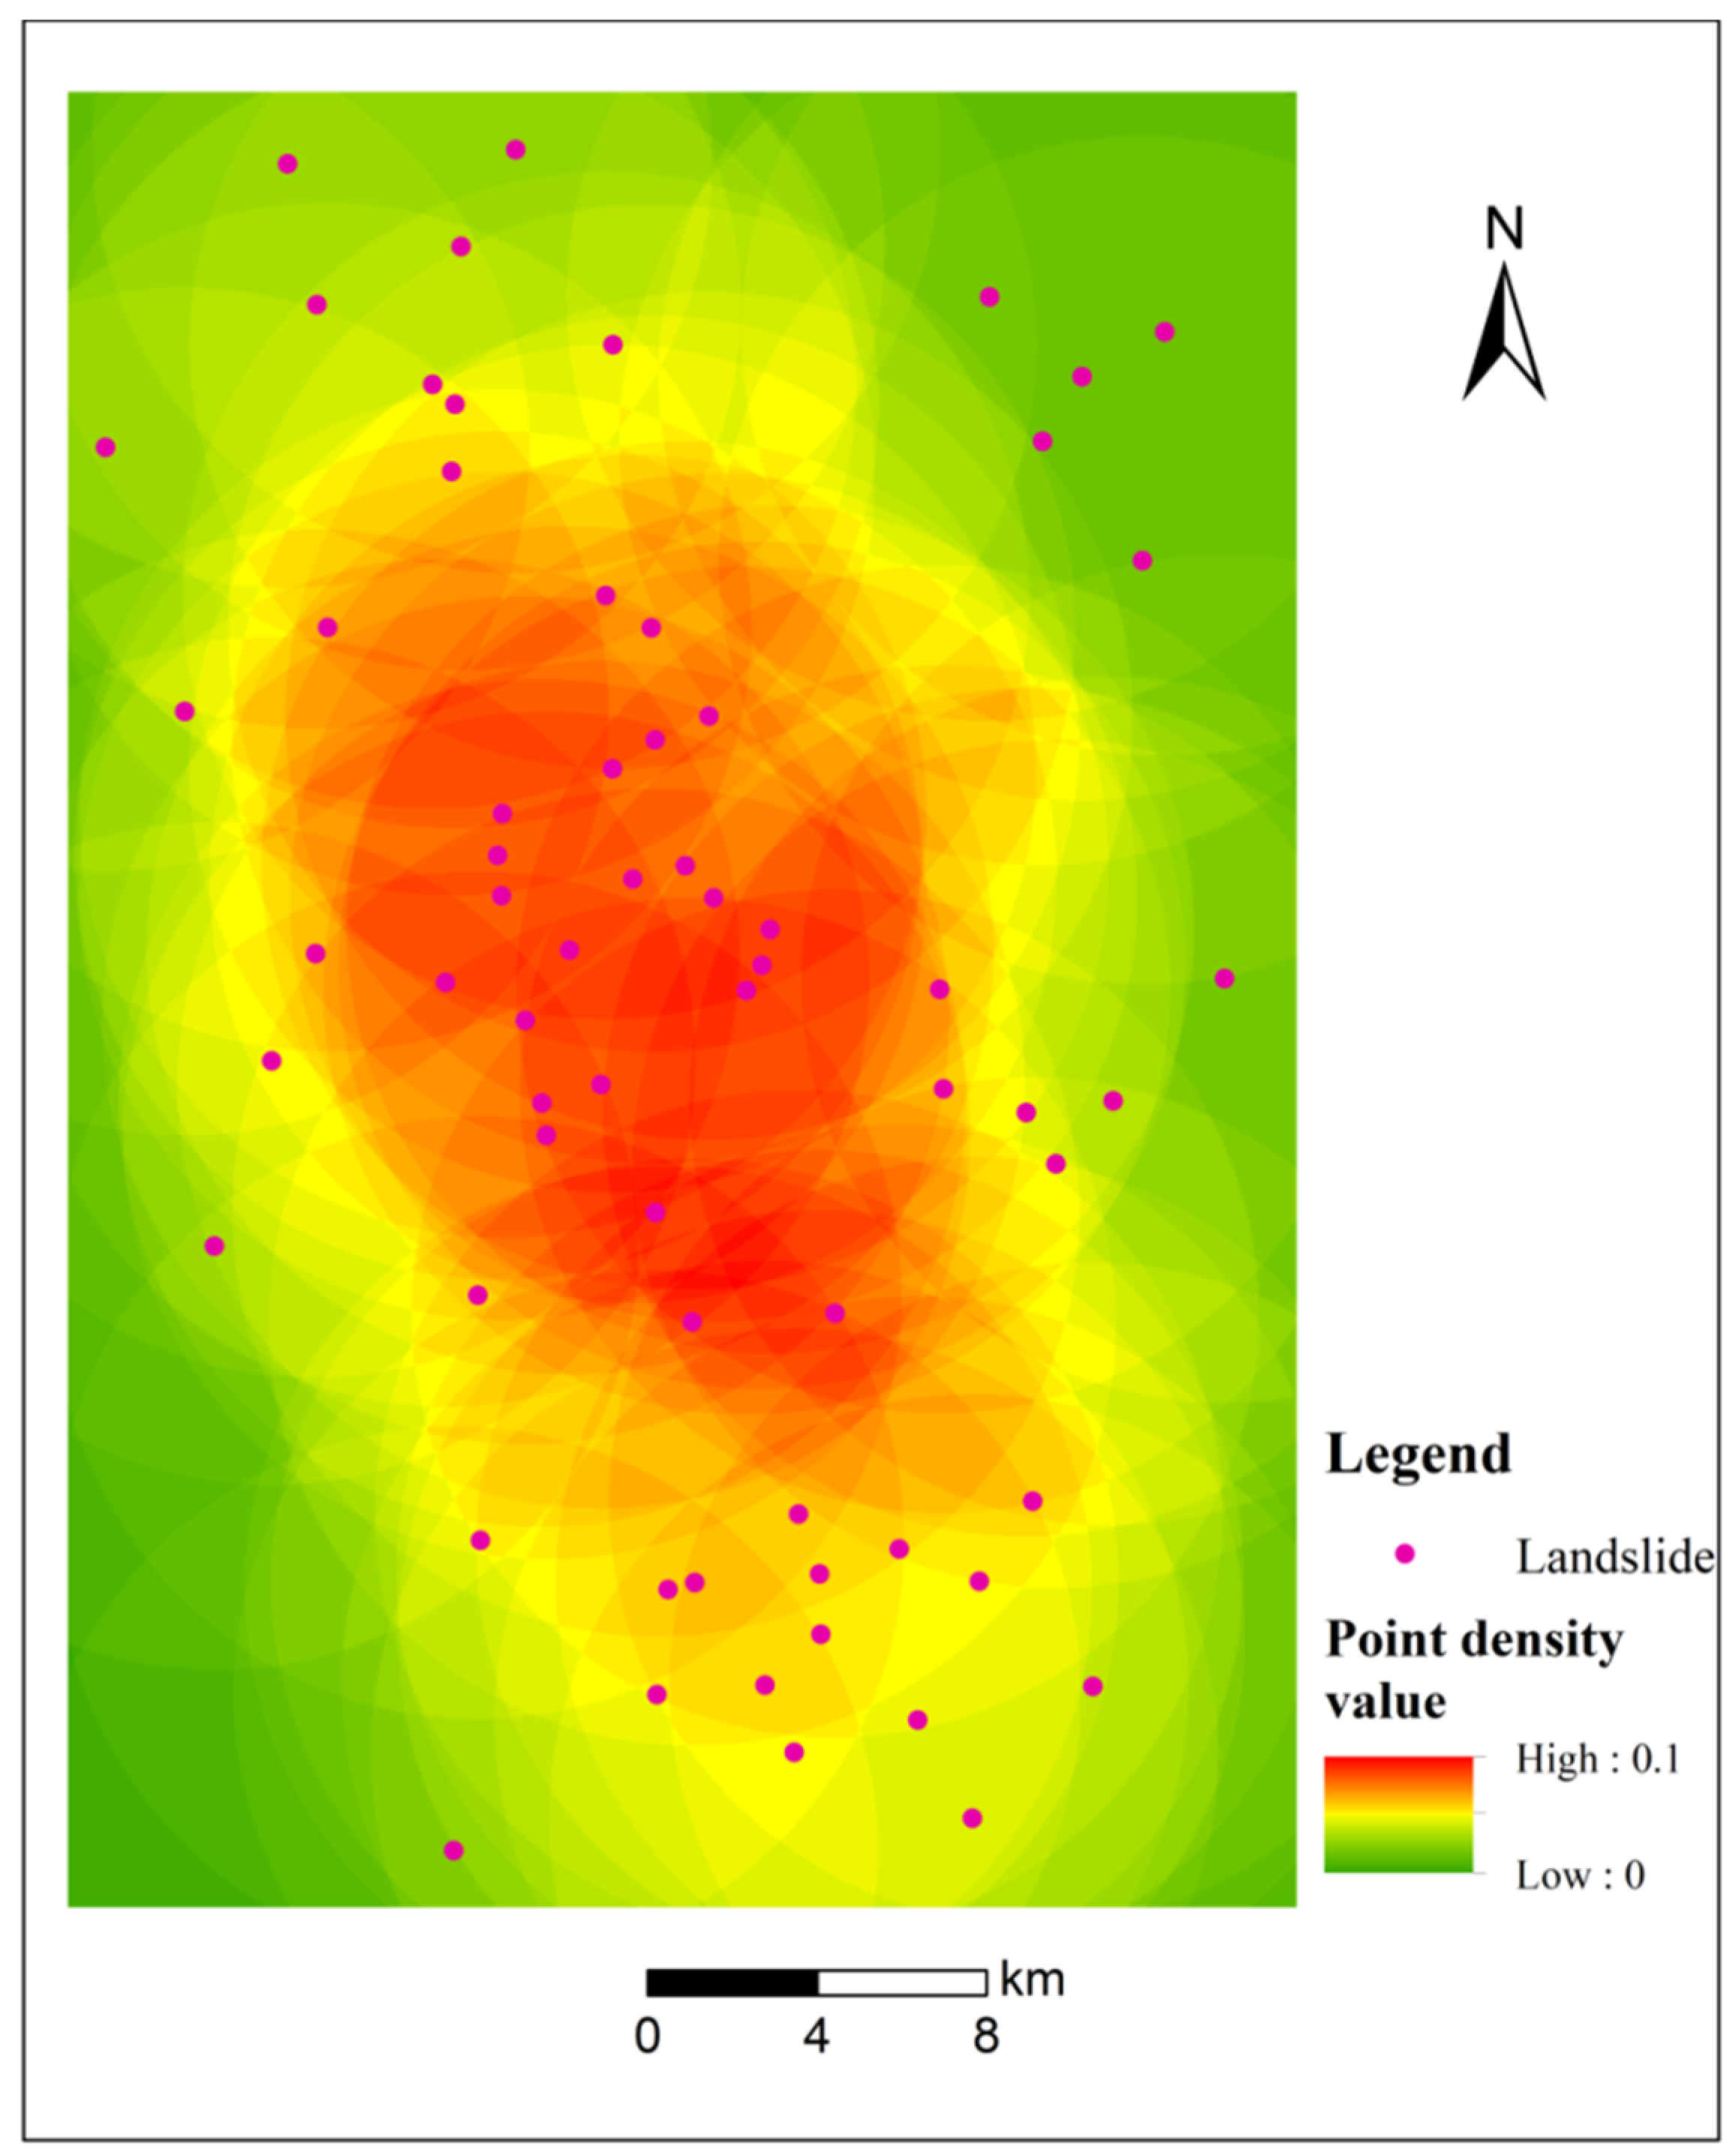
This paper employs InSAR technology to acquire surface deformation monitoring data for the Topping River section in the study area. These data are utilized to identify potential landslide boundaries, which are further validated through field investigations. Vulnerability zoning of the nine influencing factors is conducted using the frequency ratio model and information quantity model. The accuracy of the results is verified using the ROC curve and density method, with the information quantity model outperforming the frequency ratio model. The information quantity model’s calculation results, combined with the analytic hierarchy process and superposition point density map, are utilized to perform landslide susceptibility zoning in the study area. The results reveal five susceptibility zones, ranging from low to high, with respective areas of 197.48, 455.72, 408.21, 152.66, and 16.22 km2. The corresponding proportion of landslides in each zone is 0.17%, 1.60%, 3.88%, 8.41%, and 16.65%. As expected, the proportion of landslides significantly increases with higher susceptibility levels, confirming the accuracy of the susceptibility results. Finally, this study analyzes the single-factor classification map of the study area based on the susceptibility zoning results. This analysis provides a reasonable explanation for the varying distribution of local landslide susceptibility. The insights gained from this study contribute to the understanding of landslide susceptibility zoning and can inform the development of effective preventive measures.

Author Contributions

Conceptualization, Y.R., J.C., W.L., R.H., T.W. and M.H.; Data curation, R.H. and W.H.; Formal analysis, W.L., X.Z. and T.W.; Investigation, Y.R., J.C. and R.H.; Methodology, Y.R., W.L., X.Z., T.W., M.H. and W.H.; Resources, J.C. and X.Z.; Software, R.H., X.Z. and M.H.; Validation, J.C., W.L. and W.H.; Writing—original draft, Y.R.; Writing—review & editing, Y.R. All authors have read and agreed to the published version of the manuscript.

Funding

This work was supported by the National Natural Science Foundation of China (Grant No. 42007261), Natural Science Foundation of Fujian Province, China (Grant No. 2021J05026), Key Laboratory of Hydraulic and Waterway Engineering of the Ministry of Education, Chongqing Jiaotong University (Grant No. SLK2021B09).

Data Availability Statement

The datasets generated and analyzed in the current study may be obtained from the corresponding author upon reasonable request.

Conflicts of Interest

The authors declare no conflict of interest.

References

  1. Wen, H.; Liu, L.; Zhang, J.; Hu, J.; Huang, X. A hybrid machine learning model for landslide-oriented risk assessment of long-distance pipelines. J. Environ. Manag. 2023, 342, 118177. [Google Scholar] [CrossRef]
  2. Sergey, S.; Andrée, B. Satellite interferometry for regional assessment of landslide hazard to pipelines in northeastern British Columbia, Canada. Int. J. Appl. Earth Obs. Geoinf. 2023, 118, 103273. [Google Scholar]
  3. Cao, C.; Zhu, K.; Song, T.; Bai, J.; Zhang, W.; Chen, J.; Song, S. Comparative Study on Potential Landslide Identification with ALOS-2 and Sentinel-1A Data in Heavy Forest Reach, Upstream of the Jinsha River. Remote Sens. 2022, 14, 1962. [Google Scholar] [CrossRef]
  4. The, U.S. Geological Survey. Landslide hazards. In USGS Fact Sheet Fs-071-00; The U.S. Geological Survey: Reston, VA, USA, 2000. [Google Scholar]
  5. Courture, R. Landslide Terminology-National Technical Guidelines and Best Practices on Landslides; Open File 6824; Geological Survey of Canada: Calgary, AB, Canada, 2011; p. 12. [Google Scholar]
  6. Cruden, D.M.; Varnes, D.J. Landslide Types and Processes. In Landslides: Investigation and Mitigation, Special Report 247-Transportation Research Board, National Research Council; Turner, A.K., Schuster, R.L., Eds.; National Academy Press: Washington, DC, USA, 1996; pp. 36–75. [Google Scholar]
  7. Brototi, B.; Aneesah, R.; Jonmenjoy, B. Comparative Assessment of FR and AHP Models for Landslide Susceptibility Mapping for Sikkim, India and Preparation of Suitable Mitigation Techniques. J. Geol. Soc. India 2023, 99, 791–801. [Google Scholar]
  8. Dai, C.; Li, W.; Lu, H.; Zhang, S. Landslide Hazard Assessment Method Considering the Deformation Factor: A Case Study of Zhouqu, Gansu Province, Northwest China. Remote Sens. 2023, 15, 596. [Google Scholar] [CrossRef]
  9. Hossein, M.; Ahmadi, A.D. A new combined approach of neural-metaheuristic algorithms for predicting and appraisal of landslide susceptibility mapping. Environ. Sci. Pollut. Res. Int. 2023, 30, 82964–82989. [Google Scholar]
  10. Yao, J.M.; Lan, H.X.; Li, L.P.; Cao, Y.M.; Wu, Y.M.; Zhang, Y.X.; Zhou, C.D. Characteristics of a rapid landsliding area along Jinsha River revealed by multi-temporal remote sensing and its risks to Sichuan-Tibet railway. Landslides 2022, 19, 703–718. [Google Scholar] [CrossRef]
  11. Tian, S.; Chen, N.; Wu, H.; Yang, C.; Zhong, Z.; Rahman, M. New insights into the occurrence of the Baige landslide along the Jinsha River in Tibet. Landslides 2020, 17, 1207–1216. [Google Scholar] [CrossRef]
  12. Yan, J.; Chen, J.; Zhou, F.; Li, Y.; Zhang, Y.; Gu, F.; Zhang, Y.; Li, Y.; Li, Z.; Bao, Y.; et al. Numerical simulation of the Rongcharong paleolandslide river-blocking event: Implication for the longevity of the landslide dam. Landslides 2022, 19, 1339–1356. [Google Scholar] [CrossRef]
  13. Meng, T.; Xu, X.; Liu, H. Landslide risk assessment in high altitude areas based on slope unit optimization: Taking the Baigelandslide in Jinsha River as an example. J. Henan Polytech. Univ. Nat. Sci. 2021, 40, 65–72. (In Chinese) [Google Scholar]
  14. Kalantar, B.; Pradhan, B.; Naghibi, S.A.; Motevalli, A.; Mansor, S. Assessment of the effects of training data selection on the landslide susceptibility mapping: A comparison between support vector machine (SVM), logistic regression (LR) and artificial neural networks (ANN). Geomat. Nat. Hazards Risk 2018, 9, 49–69. (In Chinese) [Google Scholar] [CrossRef]
  15. Zhang, Z.Y.; Deng, M.G.; Xu, S.G.; Zhang, Y.B.; Fu, H.L.; Li, Z.H. Comparative study on evaluation models of landslide susceptibility in Zhenkang County. Chin. J. Rock Mech. Eng. 2022, 41, 157–171, (In Chinese with English abstract). [Google Scholar]
  16. Shano, L.; Raghuvanshi, T.K.; Meten, M. Landslide susceptibility mapping using frequency ratio model: The case of Gamo highland, South Ethiopia. Arab. J. Geosci. 2021, 14, 1–18. [Google Scholar] [CrossRef]
  17. Malka, A.N. Landslide susceptibility mapping of Gdynia using geographic information system-based statistical models. Nat. Hazards 2021, 107, 639–674. [Google Scholar] [CrossRef]
  18. Dobrovolny, E. Landslide susceptibility in and near Anchorage as interpreted from topographic and geologic maps. Great Alsk. Earthq. 1964, 735–745. [Google Scholar]
  19. Regmi, N.R.; Giardino, J.R.; Vitek, J.D. Modeling susceptibility to landslides using the weight of evidence approach: Western Colorado, USA. Geomorphology 2010, 115, 172–187. [Google Scholar] [CrossRef]
  20. Brand, E.W. Landslide risk assessment in Hong Kong. Landslide 1988, 1059, 1074. [Google Scholar]
  21. Chen, W.; Li, Y. GIS-based evaluation of landslide susceptibility using hybrid computational intelligence models. Catena 2020, 195, 104777. [Google Scholar] [CrossRef]
  22. Bourenane, H.; Meziani, A.A.; Benamar, D.A. Application of GIS-based statistical modeling for landslide susceptibility mapping in the city of Azazga Northern Algeria. Bull. Eng. Geol. Environ. 2021, 80, 7333–7359. [Google Scholar] [CrossRef]
  23. Michael, M.; Zahor, Z. GIS-based analysis of landslides susceptibility mapping: A case study of Lushoto district, north-eastern Tanzania. Nat. Hazards 2023, 118, 1085–1115. [Google Scholar]
  24. Zhang, T.; Han, L.; Zhang, H.; Zhao, Y.-H.; Li, X.-A.; Zhao, L. GIS-based landslide susceptibility mapping using hybrid integration approaches of fractal dimension with index of entropy and support vector machine. J. Mt. Sci. 2019, 16, 1275–1288. [Google Scholar] [CrossRef]
  25. C.L, X.; Z.Y, S.; W.X, R. Geological hazard zoning in Beishan Mountain of Tianshui District. J. Lanzhou Univ. Nat. Sci. 2020, 56, 16–24. [Google Scholar]
  26. Basofi, A.; Fariza, A.; Safitri, E.I. Landslide Risk Mapping in East Java, Indonesia, Using Analytic Hierarchy Process-Natural Breaks Classification. In Proceedings of the 2018 International Seminar on Research of Information Technology and Intelligent Systems (ISRITI), Yogyakarta, Indonesia, 21–22 November 2018; IEEE: Piscataway, NJ, USA, 2018; pp. 77–82. [Google Scholar]
  27. Guzzetti, F.; Reichenbach, P.; Ardizzone, F.; Cardinali, M.; Galli, M. Estimating the quality of landslide susceptibility models. Geomorphology 2006, 81, 166–184. [Google Scholar] [CrossRef]
  28. Jing, L. 3D Modeling of landslide based on UAV Aerial Photography and Risk Assessment Research. Master’s Thesis, Lanzhou University of Technology, Lanzhou, China, 2020. [Google Scholar]
  29. Novellino, A.; Cesarano, M.; Cappelletti, P.; Di Martire, D.; Di Napoli, M.; Ramondini, M.; Sowter, A.; Calcaterra, D. Slow-moving landslide risk assessment combining Machine Learning and In SAR techniques. Catena 2021, 203, 105317. [Google Scholar] [CrossRef]
  30. Ranke, F.; Yanhui, L.; Zhiquan, H. A review of the methods of regional landslide hazard assessment based on machine learning. Chin. J. Geol. Hazard Control. 2021, 32, 1–8. [Google Scholar]
  31. Zhou, C.; Cao, Y.; Hu, X.; Yin, K.L.; Wang, Y.; Catani, F. Enhanced dynamic landslide hazard mapping using mt-insar method in the three gorges reservoir area. Landslides 2022, 19, 1585–1597. [Google Scholar] [CrossRef]
  32. Guo, R.; Li, S.M.; Chen, Y.N.; Yuan, L. A method based on SBAS-In SAR for comprehensive identification of potential landslide. J. Geo-Inf. Sci. 2019, 21, 1109–1120. (In Chinese) [Google Scholar]
  33. Crippa, C.; Valbuzzi, E.; Frattini, P.; Crosta, G.B.; Spreafico, M.C.; Agliardi, F. Semi-automated regional classification of the style of activity of slow rock-slope deformations using PS InSAR and Squee SAR velocity data. Landslides 2021, 18, 2445–2463. [Google Scholar] [CrossRef]
  34. Cascini, L.; Fornaro, G.; Peduto, D. Advanced low-and full-resolution DInSAR map generation for slow-moving landslide analysis at different scales. Eng. Geol. 2010, 112, 29–42. [Google Scholar] [CrossRef]
  35. Calvello, M.; Peduto, D.; Arena, L. Combined use of statistical and DInSAR data analyses to define the state of activity of slow-moving landslides. Landslides 2017, 14, 473–489. [Google Scholar] [CrossRef]
  36. Gao, B.; He, Y.; Zhang, L.; Yao, S. Dynamic evaluation of landslide susceptibility by CNN considering InSAR deformation: A case study of Liujiaxia reservoir. Chin. J. Rock Mech. Eng. 2022, 42, 450–465. (In Chinese) [Google Scholar]
  37. Wu, S.; Zhang, Y.; Shi, J.; Dong, C.; Lei, W.; Tan, C.; Hu, D. Assessments of landslide hazards in Fengdu County, Chongqing City, Three Gorges reservoir region of the Yangtze River, China. Geol. Bull. China 2007, 26, 574–582. (In Chinese) [Google Scholar]
  38. Fan, L.; Hu, R.; Zeng, F.; Wang, S.; Zhang, X. Application of weighted information value model to landslide susceptibility assessment-a case study of Enshi city, Hubei province. J. Eng. Geol. 2012, 20, 508–513. (In Chinese) [Google Scholar]
  39. Li, W.; Wang, X. Application and comparison of frequency ratio and information value model for evaluating landslide susceptibility of loess gully region. J. Nat. Disasters 2020, 29, 213–220. (In Chinese) [Google Scholar]
  40. Zhu, K.; Xu, P.; Cao, C.; Zheng, L.; Liu, Y.; Dong, X. Preliminary Identification of Geological Hazards from Songpinggou to Feihong in Mao County along the Minjiang River Using SBAS-InSAR Technique Integrated Multiple Spatial Analysis Methods. Sustainability 2021, 13, 1017. [Google Scholar] [CrossRef]
  41. Yao, J.; Yao, X.; Liu, X. Landslide detection and mapping based on SBAS-InSAR and PS-InSAR: A case study in Gongjue County, Tibet, China. Remote Sens. 2022, 14, 4728. [Google Scholar] [CrossRef]
  42. Chen, J.; Peng, W.; Sun, X.; Wang, Q.; Han, X. Comparisons of several methods for landslide susceptibility mapping: Case of the Benzilan and Waka Towns, Southwest China. Arab. J. Geosci. 2021, 14, 1622. [Google Scholar] [CrossRef]
  43. Li, Y.; Chen, J.; Zhou, F.; Li, Z.; Mehmood, Q. Stability evaluation and potential damage of a giant paleo-landslide deposit at the East Himalayan Tectonic Junction on the Southeastern margin of the Qinghai-Tibet Plateau. Nat. Hazards 2022, 111, 2117–2140. [Google Scholar] [CrossRef]
  44. Niu, P.F. Evaluation of Landslide Susceptibility in Zhouqu County Based on Comprehensive Index Model. Master’s Thesis, MEng Hebei GEO University, Shijiazhuang, China, 2021. (In Chinese). [Google Scholar]
  45. Mao, J.R. Geological Hazards Monitoring and Dynamic Susceptibility Assessment in the Bailong River Basin Based on Multi-Source Remote Sensing. Ph.D. Thesis, China University of Geosciences, Beijing, China, 2021. (In Chinese). [Google Scholar]
  46. Cui, S.; Yang, Q.; Pei, X.; Huang, R.; Guo, B.; Zhang, W. Geological and morphological study of the Daguangbao landslide triggered by the Ms. 8.0 Wenchuan earthquake, China. Geomorphology 2020, 370, 107394. [Google Scholar] [CrossRef]
  47. Xu, W.J.; Wang, L.; Cheng, K. The failure and river blocking mechanism of large-scale anti-dip rock landslide induced by earthquake. Rock Mech. Rock Eng. 2022, 55, 4941–4961. [Google Scholar] [CrossRef]
  48. Yang, J.; Huang, X. The 30 m annual land cover dataset and its dynamics in China from 1990 to 2019. Earth Syst. Sci. Data 2021, 13, 3907–3925. [Google Scholar] [CrossRef]
  49. Azarafza, M.; Azarafza, M.; Akgün, H.; Atkinson, P.M.; Derakhshani, R. Deep learning-based landslide susceptibility mapping. Sci. Rep. 2021, 11, 24112. [Google Scholar] [CrossRef]
  50. Xin, Q.; Bolin, H.; Guangning, L.; Shichang, W. Landslide susceptibility assessment in the three gorges area, China, Zigui synclinal basin, using GIS technology and frequency ratio model. J. Geomech. 2017, 23, 97–104. (In Chinese) [Google Scholar]
  51. Zhang, X.D.; Ye, P.; Wu, Y. Enhanced technology for sewage sludge advanced dewatering from an engineering practice perspective: A review. J. Environ. Manag. 2022, 321, 115938. [Google Scholar] [CrossRef]
  52. Zhang, X.D. Study on Geological Disaster Risk Assessment Based on RS and GIS in Yanchi County, Ningxia. Ph.D. Thesis, China University of Geosciences, Beijing, China, 2018. (In Chinese). [Google Scholar]
  53. Zebker, H.A.; Rosen, P.A.; Hensley, S. Atmospheric effects in interferometric synthetic aperture radar surface deformation and topographic maps. J. Geophys. Res.-Solid Earth 1997, 102, 7547–7563. [Google Scholar] [CrossRef]
Figure 1. (a) The geographical location of the study area; (b) the geological map of the study area (adapted with permission from Ref. [3], 2022, Cen C).
Water 15 03685 g001
Figure 2. Stacking-InSAR technology was utilized for landslide detection based on descending data in this study.
Water 15 03685 g002
Figure 3. The three-dimensional geological model map of the study area and the distribution location of the corresponding gravity geological disasters.
Water 15 03685 g003
Figure 4. Deformation features of old landslide deposits.
Water 15 03685 g004
Figure 5. Field investigation of old landslide deposits. (a) Occurrence characteristics of bedrock level and structural plane; (b) a typical road crack; (c) a typical section of the middle and lower boundary of the upper reaches of the deposit body; (d) a small landslide in the direction of highway free face; (e) DZ landslide.
Water 15 03685 g005
Figure 6. The cracks in the middle and upper reaches of the old accumulation body in the old area.
Water 15 03685 g006
Figure 7. Landslide susceptibility evaluation index system in the study area.
Water 15 03685 g007
Figure 8. Landslide susceptibility factor classification in Tuoding: (a) elevation; (b) slope; (c) aspect; (d) distance from river; (e) vegetation cover; (f) distance from fault; (g) lithology; (h) distance from road; and (i) precipitation.
Water 15 03685 g008
Figure 9. Landslide susceptibility assessment evaluation map of frequency ratio method.
Water 15 03685 g009
Figure 10. Landslide susceptibility assessment via information method.
Water 15 03685 g010
Figure 11. ROC curves obtained for the model accuracy evaluation.
Water 15 03685 g011
Figure 12. Comparison chart of density method model validation.
Water 15 03685 g012
Figure 13. Landslide point density analysis diagram.
Water 15 03685 g013
Figure 14. Landslide susceptibility assessment map of the study area.
Water 15 03685 g014
Table 1. Basic information on the ALOS-2 and Sentinel-1A images.
SatelliteALOS-2Sentinel-1A
LevelL1.1L1.1
Time overlap7 September 2014–26 June 202017 January 2017–2 January 2021
Wavelength23.5 cm5.6 cm
BandL-bandC-band
PolarizationHHVV
Resolution10 m5 × 20 m
Table 2. Correlation degree and ranking table of each factor.
FactorsCorrelationRank
Elevation8.541
Slope6.342
Aspect4.783
Distance from river4.514
Vegetation cover4.425
Distance from fault4.016
Lithology3.877
Distance from road3.698
Precipitation2.939
Table 3. Statistical table of correlation degree and reclassification of each factor.
FactorsClassificationAij (km2)Aij/ASij (km2)Sij/SDijValue
Elevation (m)2600−19.1249.01%245.7619.97%2.4544
2600–320010.4426.77%334.0027.15%0.9863
3200–38002.305.91%362.7929.49%0.2001
3800+7.1418.32%287.8123.39%0.7832
Slope (°)18−9.0923.30%256.7620.87%1.1173
18–3015.0338.53%403.7832.82%1.1744
30–4210.9728.12%382.2331.07%0.9052
42+3.9210.05%183.3714.90%0.6741
Aspect (°)90−9.9225.44%302.0424.55%1.0364
90–1808.7522.43%290.6423.62%0.9501
180–27010.9428.05%339.0027.55%1.0183
270+9.3924.07%294.4523.93%1.0062
Distance from river (m)200−1.975.06%34.282.79%1.8172
200–5004.6411.90%49.804.05%2.9403
500–8004.5611.70%48.223.92%2.9844
800+27.8371.34%1098.0389.24%0.7991
Vegetation cover (%)0.25−7.6319.56%149.2812.13%1.6124
0.25–0.510.0125.67%201.8916.41%1.5643
0.5–0.7512.3031.53%370.8130.14%1.0462
0.75+9.0623.24%508.8741.36%0.5621
Distance from road (m)200−6.8017.44%102.358.32%2.0973
200–5007.4819.18%110.769.00%2.1304
500–8004.6411.88%102.688.35%1.4242
800+20.0951.50%914.5274.33%0.6931
Distance from fault (m)500−11.3128.99%253.2720.59%1.4094
500–10009.0023.07%225.7818.35%1.2573
1000–15007.1518.33%189.3015.39%1.1912
1500+11.5829.69%561.9645.67%0.6501
LithologyWeak rock5.1613.22%281.5022.88%0.5783
Medium hard rock mass5.5614.25%343.5527.92%0.5102
Loose accumulation28.0571.90%591.6148.08%1.4954
Hard soil rock0.240.62%22.251.81%0.3451
Precipitation (mm)920−1.794.58%123.3610.03%0.4571
920–9505.8014.86%303.4924.67%0.6022
950–98017.8745.80%530.7743.14%1.0623
980+13.5634.76%272.6822.16%1.5684
Table 4. Frequency ratio index statistical table.
FactorsClassificationNijNij/NMij (km2)Mij/MFRijLSI Index
Elevation (m)2600−3452.31%245.7619.97%2.6194.449
2600–32001421.54%334.0027.15%0.793
3200–380069.23%362.7929.49%0.313
3800+1116.92%287.8123.39%0.724
Slope (°)18−1015.38%256.7620.87%0.7374.031
18–302843.08%403.7832.82%1.313
30–421523.08%382.2331.07%0.743
42+1218.46%183.3714.90%1.239
Aspect (°)90−1624.62%302.0424.55%1.0034.002
90–1801116.92%290.6423.62%0.716
180–2701929.23%339.0027.55%1.061
270+1929.23%294.4523.93%1.222
Distance from river (m)200−34.62%34.282.79%1.6549.752
200–500812.31%49.804.05%3.039
500–8001116.92%48.223.92%4.317
800+4366.15%1098.0389.24%0.741
Vegetation cover (%)0.25−1421.54%149.2812.13%1.7764.898
0.25–0.51827.69%201.8916.41%1.688
0.5–0.751523.08%370.8130.14%0.766
0.75+1827.69%508.8741.36%0.670
Distance from road (m)200−1116.92%102.358.32%2.0347.138
200–5002030.77%110.769.00%3.419
500–80069.23%102.688.35%1.105
800+2843.08%914.5274.33%0.580
Distance from fault (m)500−1929.23%253.2720.59%1.4204.451
500–10001523.08%225.7818.35%1.258
1000–15001116.92%189.3015.39%1.100
1500+2030.77%561.9645.67%0.674
LithologyWeak rock913.85%281.5022.88%0.6053.423
Medium hard rock mass913.85%343.5527.92%0.496
Loose accumulation4670.77%591.6148.08%1.472
Hard soil rock11.54%22.251.81%0.850
Precipitation (mm)920−1218.46%123.3610.03%1.8414.446
920–9502335.38%303.4924.67%1.434
950–9802741.54%530.7743.14%0.963
980+34.62%272.6822.16%0.208
Table 5. Ranking table of frequency ratio susceptibility index.
FactorsLSIWeightRank
Elevation4.4499.55%5
Slope4.0318.65%7
Aspect4.0028.59%8
Distance from river9.75220.93%1
Vegetation cover4.89810.51%3
Distance from fault4.4519.55%4
Lithology3.4237.35%9
Distance from road7.13815.32%2
Precipitation4.4469.54%6
Table 6. Information content susceptibility index ranking table.
FactorsWFWeightRank
Elevation10.00020.93%1
Slope1.4914.17%8
Aspect1.0002.80%9
Distance from river4.76913.33%3
Vegetation cover3.60310.07%5
Distance from fault2.6137.30%7
Lithology4.39012.27%4
Distance from road4.79813.41%2
Precipitation3.1148.70%6
Table 7. Statistical table of information index and standardized weight index.
FactorsClassificationInformation ValueTWIjTWIWF
Elevation (m)2600−0.8981716.2331155.88110.000
2600–3200−0.014−14.721
3200–3800−1.609−370.863
3800+−0.245−174.768
Slope (°)18−0.111100.57977.5401.491
18–300.160241.082
30–42−0.100−109.503
42+−0.395−154.618
Aspect (°)90−0.03535.09915.3611.000
90–180−0.051−44.879
180–2700.01819.523
270+0.0065.618
Distance from river (m)200−0.597117.932492.9564.769
200–5001.078500.695
500–8001.093498.769
800+−0.224−624.440
Vegetation cover (%)0.25−0.477364.343345.1953.603
0.25–0.50.447447.846
0.5–0.750.04555.317
0.75+−0.576−522.310
Distance from road (m)200−0.741503.871496.6164.798
200–5000.756565.572
500–8000.353163.851
800+−0.367−736.678
Distance from fault (m)500−0.343387.798219.7832.613
500–10000.229205.855
1000–15000.175124.977
1500+−0.431−498.847
LithologyWeak rock−0.548−282.774444.9924.390
Medium hard rock mass−0.673−374.258
Loose accumulation0.4021127.896
Hard soil rock−1.064−25.871
Precipitation (mm)920−−0.783−139.857283.2763.114
920–950−0.507−294.202
950–9800.060107.472
980+0.450609.863
Table 8. Verification summary table of density method.
Susceptibility ClassificationFrequency Ratio ModelInformation Model
Area (km2)NumberDensityArea (km2)NumberDensity
Very low256.6330.012281.6930.011
Low303.9290.03402.83140.035
Moderate379.77130.034331.03140.042
High207.74230.111165.49210.127
Very high77.67170.21944.67130.291
Table 9. Statistical table of landslide susceptibility assessment results.
Susceptibility ClassificationPercentage of RegionArea (km2)Proportion of LandslideLandslide Area
(km2)
Landslide Ratio in the Area
Very low16.05%197.480.88%0.340.17%
Low37.04%455.7218.72%7.301.60%
Moderate33.18%408.2140.58%15.833.88%
High12.41%152.6632.90%12.838.41%
Very high1.32%16.226.92%2.7016.65%
Disclaimer/Publisher’s Note: The statements, opinions and data contained in all publications are solely those of the individual author(s) and contributor(s) and not of MDPI and/or the editor(s). MDPI and/or the editor(s) disclaim responsibility for any injury to people or property resulting from any ideas, methods, instructions or products referred to in the content.

