Article

Application of the Weighted Arithmetic Water Quality Index in Assessing Groundwater Quality: A Case Study of the South Gujarat Region

by
Divya D. Patel
1,
Darshan J. Mehta
1,*,
Hazi M. Azamathulla
2,
Mohdzuned Mohmedraffi Shaikh
3,
Shivendra Jha
3 and
Upaka Rathnayake
4,*
1
Department of Civil Engineering, Dr. S. & S. S. Ghandhy Government Engineering College, Surat 395008, Gujarat, India
2
Department of Civil Engineering, Faculty of Engineering, University of the West Indies, St. Augustine P.O. Box 331310, Trinidad and Tobago
3
Department of Civil Engineering, Lalbhai Dalpatbhai College of Engineering, Opp Gujarat University, Navrangpura, Ahmedabad 380015, Gujarat, India
4
Department of Civil Engineering and Construction, Faculty of Engineering and Design, Atlantic Technological University, F91 YW50 Sligo, Ireland
*
Authors to whom correspondence should be addressed.
Water 2023, 15(19), 3512; https://doi.org/10.3390/w15193512
Submission received: 25 August 2023 / Revised: 15 September 2023 / Accepted: 26 September 2023 / Published: 8 October 2023
(This article belongs to the Special Issue Advanced Technologies for Wastewater Treatment and Water Reuse)

Abstract

:
Groundwater is a natural resource used for drinking, agriculture, and industry, apart from surface water. Its quality should be assessed regularly, and the condition of water resources should be maintained accordingly. The most common analytical method for describing and assessing the general water quality is the Water Quality Index (WQI). This study aims to assess the South Gujarat Region’s groundwater quality using the WQI. Various physicochemical parameters like pH, turbidity, total dissolved solids, total hardness, calcium, magnesium, chloride, sulphate, nitrate, fluorides, and total alkalinity are considered for the present study. The data period from 2018 to 2022 is considered for the same. The Weighted Arithmetic Water Quality Index Technique is used to evaluate these data. For checking the potability of the parameters within the acceptable limit, the Indian Standard Drinking Water Specification code (IS: 10050-2012) is adopted. According to the study mentioned above, a few wells’ groundwater quality has been found to be higher than the WQI value. It is also observed that four wells were found unsuitable for drinking purposes in 2018. It is noted that if the WQI value of groundwater is above 51, it is considered harmful to human health; therefore, it requires some kind of processing before use. This study will be beneficial to the policymakers for identifying and providing details about groundwater quality in the form of a specific value, i.e., WQI.

1. Introduction

The term “groundwater” refers to water that is present underground in saturated areas below the surface. India’s massive rural and urban populations, the ecosystem, and agriculture are all significantly impacted by the country’s water crisis [1]. India has nearly 1.39 billion people, yet just 4% of the world’s freshwater resources. Groundwater makes up around 30% of the world’s readily accessible fresh water. Surface water and groundwater are the only two main sources of drinking water [2]. Groundwater resources are employed for many various purposes: drinking; irrigation; and industrial uses. Groundwater is typically used by farmers to irrigate their crops more frequently than other sources, such as surface water [3]. Groundwater quality and quantity are significantly impacted by both natural and man-made activities [4,5].
Almost 80% of human illnesses, according to the report of the World Health Organisation (WHO), are brought on by contaminated water [6]. Seasonal variations, depth, the subsurface environment, and leached dissolved salts all affect groundwater quality differently [7]. As a result, monitoring and management of groundwater and surface water are now essential processes for sustainable development to establish the availability of freshwater [8,9]. Although some groundwater is a renewable resource that may be recharged by rains and snowmelt, it can be depleted if used more quickly than it can be restored [10]. Physical, chemical, and biological properties are three different categories of water quality. These parameters are dangerous if their values are outside the ranges specified [11]. Sodium, calcium, magnesium, potassium, chloride, bicarbonate, sulphate, and other dissolved minerals are the most common [12].
The majority of South Gujarat is classified as having a coastal ecosystem and a subtropical climate, with considerable variability in climatic parameters is seen at the taluka level. The entire eastern strip is classed as subhumid (moist/dry), but the southeast region, which includes Gandevi taluka of Navsari district, is humid [13]. The most significant issues in the command region of South Gujarat include secondary salinisation and waterlogging brought on by heavy textured soils, high rainfall, deviations from recommended crop patterns, improper irrigation practices, etc. [14]. The district and source-specific irrigated and daily consumption area indicate that ground and surface water resources in South Gujarat contribute nearly equally, at 46% and 54%, respectively, According to research on water management in South Gujarat [15]. According to a district report survey conducted in 2022 from February to March, 82% of villages reported having improved dug and bore wells, and 9% had recharging structures.
However, assessing water quality poses several difficulties, including the need for extensive sample collection, lab testing, and data processing. It is difficult for the local public to know and describe the quality of water, and for certain uses, they are unable to describe the impact of a single parameter. There are numerous techniques, such as analytical, modelling, remote sensing, and sampling and analysis of the water quality [16]. The Water Quality Index is one of the methods used for measuring the quality of water. WQI can reduce a large volume of data into a specific term and present the facts in a clear, logical manner [17,18]. The WQI concept was first introduced by Horton in 1965, and later, various studies have been carried out by different researchers to understand the ground water quality [19]. The weighted arithmetic water quality index method is a modified form of Horton’s formula, created by Brown et al. (1970). WQI, a way of assessing or classifying the quality of water type, is effective for determining the regional and physical variance in groundwater conditions and providing knowledge on water quality to concerned locals and policymakers [20,21].
Artificial intelligence (AI) and its potential uses for managing and monitoring water quality are currently gaining more interest [22]. For processing, evaluating, and identifying the quality of a water resource, groundwater quality data are essential. Based on WQIs, classifying groundwater becomes much more practical. Water quality indices (WQIs) are mathematical tools employed to classify water quality [23,24]. By combining different datasets to generate a single number that represents the quality of the water, problems with water quality can be more easily understood. It offers data on groundwater quality and serves as a reliable, consistent unit of measurement. The WQI cannot be accurately represented by a numerical value that precisely captures the physicochemical and biological properties of water. WQI is typically calculated using measurements of T°C, electrical conductivity (EC), organic matter, metals, and all other parameters [25]. Due to its ability to determine the final state of the water quality without interpreting each variable, it has an advantage over other evaluation techniques [26,27].
Different calculation techniques have been introduced or used in the field of hydrology for prediction, analysis, equation formation, etc. [28]. The water quality simulation method has a few benefits, including low or no simulation cost, quick simulation time, reduced need for measurement or laboratory equipment and staff, ability to generate significant amounts of synthetic data for analysis, regeneration of data gaps, measurement, and control calibration equipment, and ability to generate large amounts of data quickly [29]. To save time and effort, an artificial neural network (ANN) method has recently been used to estimate groundwater quality [30]. In the area of water quality modelling, ANNs have found a variety of uses [31]
It gives data on groundwater quality and works as a consistent, precise unit of measurement [32]. Although WQI cannot be accurately expressed, as mentioned above, WQI can determine the water quality’s final state without conducting an interpretation of each variable, which gives it an edge over other evaluation methods [33].
To know the water quality of the district and to demonstrate the capacity and use of the Weighted Arithmetic Water Quality Index method for the groundwater quality has been carried out. According to the survey, the water quality of the wells is good quality rather than excellent water quality type, but sometimes they need treatment before consumption [34]. The review obtained regarding the tap water system by the government body has not yet covered the whole district area. Moreover, in some of the villages, there is no proper drainage alignment; therefore, sometimes, there is a chance of dirty water infiltrating into the ground. This present work’s main objective is to employ WQI to find out if the state of groundwater in the South Gujarat Region is acceptable for drinking purposes. The study area is located between 20.07 to 21.00 North Latitude and 72.43 to 73.00 East Longitude. Also, the impact of each parameter, as well as the attentiveness of the physicochemical parameters is assessed for the research areas and status of groundwater quality.

2. Materials and Methods

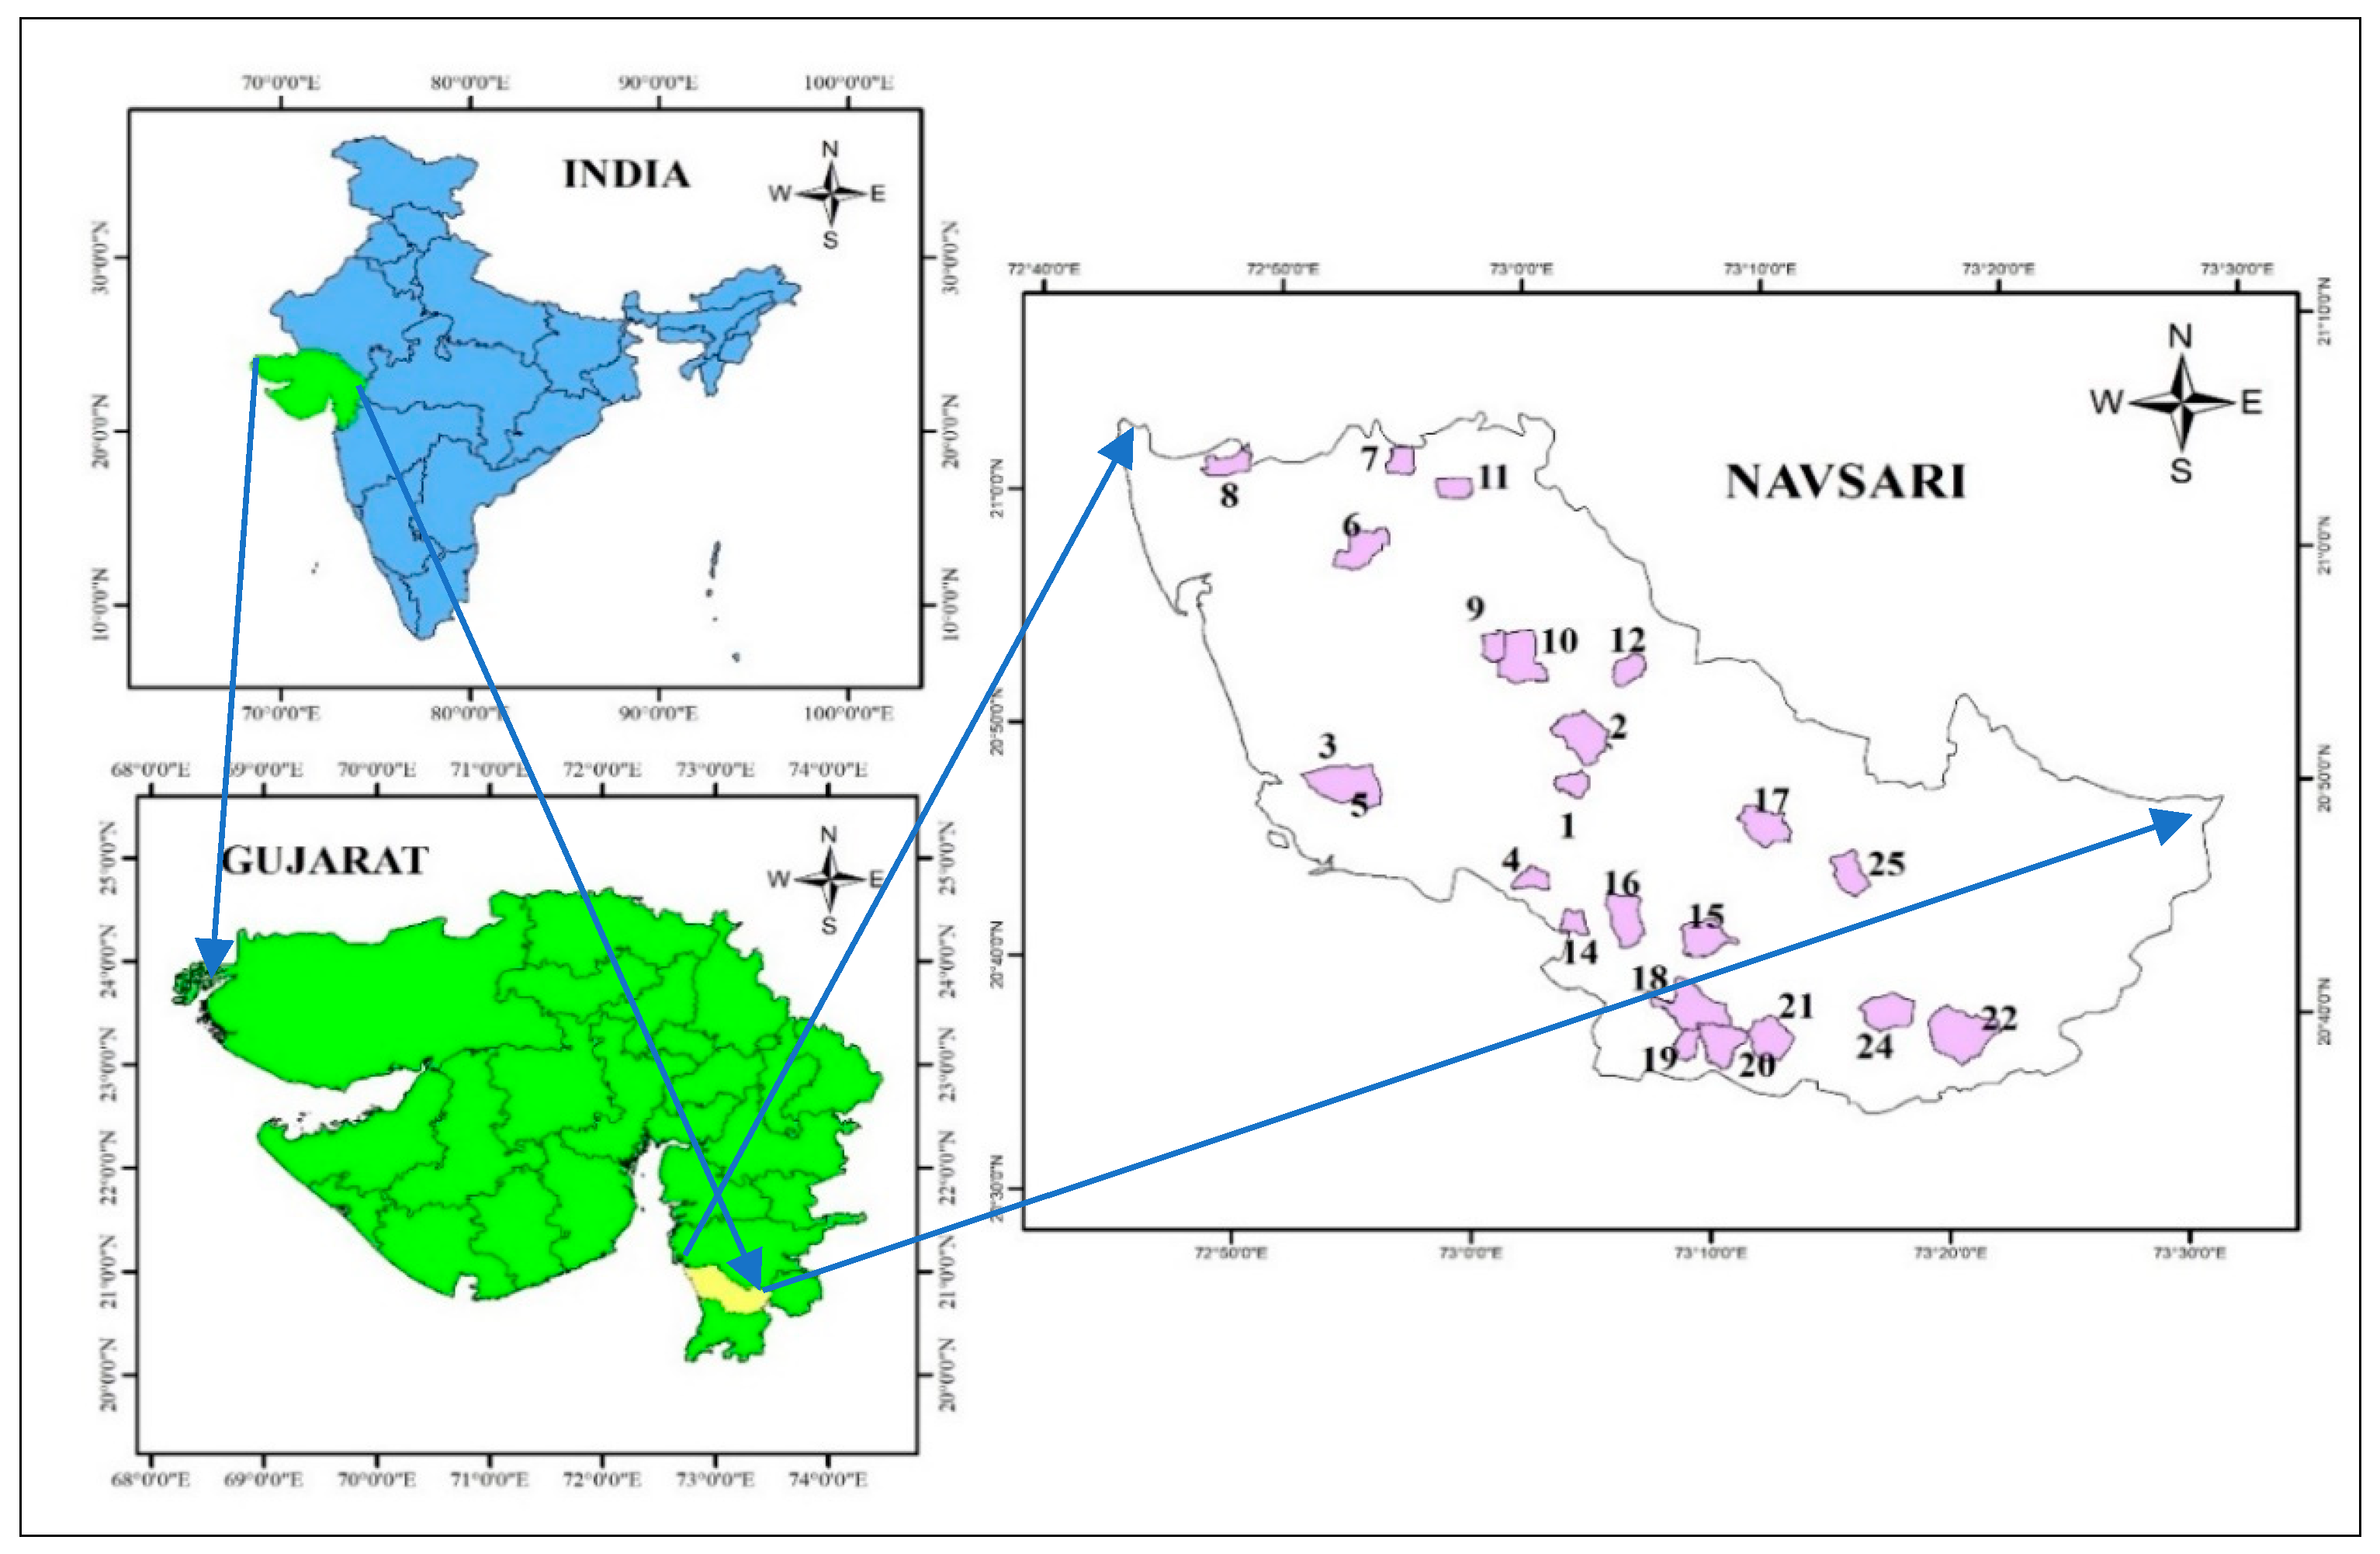
2.1. Study Area and Data Collection

The Navsari district is located on the Arabian Sea coast on the southern edge of the Gujarat state. It is situated between latitudes 20.07 and 21.00 in the north and 72.43 and 73.00 in the east. The district has an area of 2196 km2 and a population of 1,329,672 per the 2011 Census. The district has a total area of 2246 km2, of which 73 km2 is urban and 2173 km2 is rural. Due to its location in the southern part of the state, four physiographic units have been formed there: (1) Top Relief Zone; (2) Zone in the Piedmont; (3) Alluvial Plain; and (4) The Coastal Plain. The terrain and lineaments of the district regulate the drainage. The main and secondary porosity of the interrelated geological units that make up the aquifers, as well as the distribution of rainfall and falls, all play a significant role in the hydrogeological framework of the region. Because of the rapid expansion of industrialisation in the western portion of Navsari in recent years, groundwater pollution has increased. Due to groundwater depletion, rivers and ponds drying up, and other factors, there is a severe water shortage in some regions of the Vansda and Chikhali taluka, as per the news in 2019. According to an article in 2022, locals were reluctant to walk 2–3 km for drinking water since it would be contaminated in the steep sections or the interior villages of the district despite the district receiving the most rainfall.
Rural areas where groundwater is used for drinking and other reasons are the subject area for this study. The analysis is carried out to obtain the quality and water type of groundwater sources (wells) and variations in the WQI values for consecutive years, for the study data for the sites (wells) are gathered from the government body-GWSSB Laboratory, Navsari. The data period is from 2018 to 2022. Microsoft Office Excel 2021 was used to do statistical analyses on the data that had been collected. The sites where the wells are located are represented as N1, N2, N3, N4, N5, N6, N7, N8, N9, N10, N11, N12, N13, N14, N15, N16, N17, N18, N19, N20, N21, N22, N23, N24, N25 for Kalvach, Endhal, Masa Gamtal, Dhikri, Harijansvas, Tavdi, Chokhad, Parsoli, Kachhol, Khadsupa, Parthan, Mahudi, Maliadhara, Hond, Gholar, Pipalgabhan, Donja, Achhavani, Jamanpada, Toranvera, Debarpada, Kandha Bari, Khadkbari, Rawaniya, Vaghabari, respectively. Figure 1 shows the study area map of the South Gujarat Region.

2.2. Methods

The laboratory used the 23rd APHA method for the collection and testing of water quality parameters for the assessment of groundwater quality. Following the recommendations made by the Indian Standard Drinking Water Specification Code, the values of the specified physical and chemical parameters were evaluated [35]. Several other water quality factors were measured by an analytical technique called the WQI, which determines how they affect the water’s overall quality.
Water Quality Index studies (Horton 1965; Landwehr and Deininger 1976; Brown 1972; Steinhart 1982; Canadian Council of Ministers of the Environment (CCME), 2005; Bhargava, 1983, and many others) have reported on the various techniques used for calculating WQI and for comparing physicochemical parameters with the recommendations in the literature. Horton introduced the WQI in 1965, and other various approaches for its calculation have subsequently been introduced or modified in the literature [20]. The WQIs can be considered as simplified representations of a complicated reality or models for water quality, where variables are chosen, and weighting and aggregation methods are defined [1]. Using the most frequently measured water quality parameters, the weighted arithmetic water quality index technique assessed the water quality according to the degree of purity [30]. It has been applied repeatedly. Although this method was employed in surface water research, the majority of investigations on the various conditions found that it succeeded when applied to groundwater studies. An assessment of the WQI was carried out using the WAWQI method in the following studies [21,22]. Analysis of eleven parameters of water quality was carried out (pH, turbidity, total dissolved solids, total hardness, calcium, magnesium, chloride, sulphate, nitrate, fluorides, and total alkalinity). The potability of the variables was considered using the Bureau of Indian Standards (BIS) [35]. The WQI values for the research area were determined independently for the considered years.
The WAWQI method was used in this study, consisting of 4 steps, which are as follows [23,24]:
  • Select parameters to measure the quality of the groundwater;
  • Quality ratings are scaled for each parameter;
  • The unit weight (Wi) is calculated, and Wi is inversely dependent upon the standard value (Si) of the parameters recommended;
  • Calculating the overall WQI by summing the subindex value.
The following equations were used to calculate the WQI. Each water quality parameter’s unit weight ( W i ) was computed using Equation (1) as follows [25,26]:
W i = K S i
where W i stands for the unit weight of ith parameters. K is a proportionality constant. S i is the standard value of each parameter [35].
K = 1 Σ 1 S i
Each parameter’s quality rating scale ( Q i ) was calculated using Equation (3):
Q i = V i V 0 S i V 0
For the pH, the quality rating scale was determined by Equation (4),
Q i = V i 7 S i 7
where V i is the concentration value for the i th analysed parameter and V 0 is the ideal value of the parameter. Whereas, except for pH (ideal value 7, all other parameter’s ideal value is zero. The final equation can be presented in Equation (5).
S I i = Σ W i Q i Σ W i W Q I = S I i
S I i is the subindex of the i th parameter and i represents the number of parameters taken into consideration [5,27]. In Table 1, the ideal values and unit weights for the water quality variables and their standard values are shown [10,30].

3. Results and Discussion

The physicochemical parameters of groundwater assessed for the open wells were compared and evaluated against the BIS (10500: 2012) drinking water quality standards. Table 2 shows the range of water quality according to the Weight Arithmetic Water Quality Index method [26,27]. It was noted that the concentration of various parameters in Table 3 was high and had surpassed the acceptable limit for the area (number of wells) under consideration. In the majority of the cases, the TDS, TH, Ca, Mg, Cl, and total alkalinity concentrations were higher than the allowable limit for the specific year and well number. It has been noted that the TH, TDS, Mg, and total alkalinity influence the water quality and contribute to the WQI with other parameters. Total hardness and TDS, on the other hand, were much higher than the values for TH and TDS given in the BIS guidelines. None of the wells had pH, nitrate, or turbidity contents above the allowable limits. Whilst calcium and chloride hardly changed in wells over the different periods. Fluoride levels in the water were raised in wells 3 and 18. With rising values for these parameters, the WQI score increases. WQI, which is often used for the recognition and analysis of groundwater quality and state of pollution, can be considered as the representation of the combined impact of various water quality variables on the overall water quality [28]. The ecological status of water may be assessed using the WQI value produced using the WAWQI method procedure. The WQI value rises with increasing values of these parameters.
A low range in the WQI indicates the best water quality, whilst a higher number indicates poor quality, according to the range. Estimated WQI values for the locations ranged from 18.29 to 94.76, which corresponds to good to extremely poor water quality, and between 100 and 137, which corresponds to water that is unfit for drinking. Three samples from the research area had very poor water quality, and six samples had poor water. In the study area, 14 samples resulted in excellent water, and 25 samples had good water quality during the years of analysis. Four samples were not fit to be consumed as drinking water, and the groundwater from such places needs to undergo thorough water treatment before use. The categorisation of the obtained results according to the WQI classification is presented in Table 4.
According to the range of the WQI, a low number denotes the best water quality, whilst a higher number denotes the worst quality. Table 4 shows the calculated WQI values for the study area. The WQI for wells N1, N2, N5, N6, N7, N8, N10, N11, N15, N16, N17, N22, N23, and N24 was between 0 and 25, which indicates excellent quality of water. The remaining wells had WQI values that ranged from 26.8938 to 50.4052, which indicates good water quality, whereas a value between 100 and 137 corresponds to water that is unfit for drinking. Three samples from the study area had extremely poor water quality, and six samples had poor water quality.

4. Conclusions

The WQI approach used in the current study to analyse sites’ groundwater quality was helpful. According to the WQI value, the majority of the sites had high water quality, which was followed in descending order by excellent water, poor water, unfit for drinking water, and extremely poor water quality. These data were also used to monitor annual fluctuations in the concentration values of nutrients in groundwater. The results found the total hardness and TDS levels were observed to be at or above the permitted limit for the period taken into consideration and for all sites. This indicates one reason for the WQI value to be impacted in the groundwater. The advantage of the WAWQI approach is that it combines data from numerous groundwater quality parameters into a mathematical equation that depicts the water’s ecological state. Additionally, it shows the significance that each parameter has in the evaluation and control of the quality of water and can be used to define whether a source of groundwater is fit for human use.

Author Contributions

Conceptualisation, D.J.M.; methodology, D.D.P.; software, D.D.P.; validation, H.M.A. and M.M.S.; formal analysis, D.D.P.; investigation, D.D.P.; resources, D.J.M. and S.J.; data curation, D.J.M.; writing—original draft preparation, D.D.P.; writing—review and editing, D.J.M. and U.R.; visualisation, D.D.P.; supervision, D.J.M.; project administration, U.R. All authors have read and agreed to the published version of the manuscript.

Funding

This research received no external funding.

Data Availability Statement

Data are only available for research purposes from the corresponding author.

Acknowledgments

The precipitation data used in this study were provided by the Water Resource Department, Raipur Chhattisgarh (CGWRD), and reservoir release corresponding to demand were made available from the Water Resource Department (Mahanadi reservoir project complex), Rudri division, Chhattisgarh, and are highly appreciated. Suggestions and comments from reviewers are greatly acknowledged.

Conflicts of Interest

The authors declare no conflict of interest.

References

  1. Patel, P.; Mehta, D.; Sharma, N. A review on the application of the DRASTIC method in the assessment of groundwater vulnerability. Water Supply 2022, 22, 5190–5205. [Google Scholar] [CrossRef]
  2. Chaudhari, A.N.; Mehta, D.J.; Sharma, D.; Neeraj, D. An assessment of groundwater quality in South-West zone of Surat city. Water Supply 2021, 21, 3000–3010. [Google Scholar] [CrossRef]
  3. Derdour, A.; Abdo, H.G.; Almohamad, H.; Alodah, A.; Al Dughairi, A.A.; Ghoneim, S.S.M.; Ali, E. Prediction of Groundwater Quality Index Using Classification Techniques in Arid Environments. Sustainability 2023, 15, 9687. [Google Scholar] [CrossRef]
  4. Kulisz, M.; Kujawska, J.; Przysucha, B.; Cel, W. Forecasting Water Quality Index in Groundwater Using Artificial Neural Network. Energies 2021, 14, 5875. [Google Scholar] [CrossRef]
  5. Patel, P.; Mehta, D.J.; Sharma, N.D. A GIS-based DRASTIC Model for Assessing Groundwater Quality Vulnerability: Case Study of Surat and its Surroundings. J. Geol. Soc. India 2023, 99, 578–582. [Google Scholar] [CrossRef]
  6. Rajput, D.; Mistry, K.; Bhoraniya, J.; Umrigar, J.; Waikhom, S.; Mehta, D. Assessing the Decadal Groundwater Level Fluctuation—A Case Study of Gujarat, India. LARHYSS J. 2023, 54, 175–191. [Google Scholar]
  7. Saqib, N.; Rai, P.K.; Kanga, S.; Kumar, D.; Đurin, B.; Singh, S.K. Assessment of Ground Water Quality of Lucknow City under GIS Framework Using Water Quality Index (WQI). Water 2023, 15, 3048. [Google Scholar]
  8. Azzirgue, E.M.; Cherif, E.K.; Tchakoucht, T.A.; El Azhari, H.; Salmoun, F. Testing Groundwater Quality in Jouamaa Hakama Region (North of Morocco) Using Water Quality Indices (WQIs) and Fuzzy Logic Method: An Exploratory Study. Water 2022, 14, 3028. [Google Scholar] [CrossRef]
  9. Brown, R.M.; McClelland, N.I.; Deininger, R.A.; Tozer, R.G. A water quality index-do we dare. Water Sew. Work. 1970, 117, 339–343. [Google Scholar]
  10. Călmuc, V.A.; Călmuc, M.; Țopa, M.C.; Timofti, M.; Iticescu, C.; Georgescu, L.P. Various methods for calculating the water quality index. Analele Univ. “Dunărea De Jos” Din Galați. Mat. Fiz. Mec. Teor./Ann. “Dunarea De Jos” Univ. Galati. Fascicle II Math. Phys. Theor. Mech. 2018, 41, 171–178. [Google Scholar] [CrossRef]
  11. Mehta, D.; Patel, P.; Sharma, N.; Eslamian, S. Comparative analysis of DRASTIC and GOD model for groundwater vulnerability assessment. Model. Earth Syst. Environ. 2023, 6, 1–24. [Google Scholar] [CrossRef]
  12. Ram, A.; Tiwari, S.K.; Pandey, H.K.; Chaurasia, A.K.; Singh, S.; Singh, Y.V. Groundwater quality assessment using water quality index (WQI) under GIS framework. Appl. Water Sci. 2021, 11, 1–20. [Google Scholar] [CrossRef]
  13. Makubura, R.; Meddage, D.P.P.; Azamathulla, H.M.; Pandey, M.; Rathnayake, U. A Simplified Mathematical Formulation for Water Quality Index (WQI): A Case Study in the Kelani River Basin, Sri Lanka. Fluids 2022, 7, 147. [Google Scholar] [CrossRef]
  14. Tyagi, S.; Sharma, B.; Singh, P.; Dobhal, R. Water Quality Assessment in Terms of Water Quality Index. Am. J. Water Resour. 2013, 1, 34–38. [Google Scholar] [CrossRef]
  15. Al-Hadithi, M. Application of water quality index to assess suitability of groundwater quality for drinking purposes in Ratmao-Pathri Rao watershed, haridwar district India. J. Sci. Ind. Res. 2012, 23, 1321–1336. [Google Scholar] [CrossRef]
  16. Badeenezhad, A.; Tabatabaee, H.R.; Nikbakht, H.-A.; Radfard, M.; Abbasnia, A.; Baghapour, M.A.; Alhamd, M. Estimation of the groundwater quality index and investigation of the affecting factors their changes in Shiraz drinking groundwater, Iran. Groundw. Sustain. Dev. 2020, 11, 100435. [Google Scholar] [CrossRef]
  17. Nayak, J.G.; Patil, L.G.; Patki, V.K. Artificial neural network based water quality index (WQI) for river Godavari (India). Mater. Today Proc. 2021, 81, 212–220. [Google Scholar] [CrossRef]
  18. Salami, E.S.; Salari, M.; Ehteshami, M.; Bidokhti, N.T.; Ghadimi, H. Application of artificial neural networks and mathematical modeling for the prediction of water quality variables (case study: Southwest of Iran). Desalination Water Treat. 2016, 57, 27073–27084. [Google Scholar] [CrossRef]
  19. Kachroud, M.; Trolard, F.; Kefi, M.; Jebari, S.; Bourrié, G. Water Quality Indices: Challenges and Application Limits in the Literature. Water 2019, 11, 361. [Google Scholar] [CrossRef]
  20. Yan, T.; Shen, S.L.; Zhou, A. Indices and models of surface water quality assessment: Review and perspectives. Environ. Pollut. 2022, 308, 119611. [Google Scholar] [PubMed]
  21. Patki, V.K.; Jahagirdar, S.; Patil, Y.M.; Karale, R.; Nadagouda, A. Prediction of water quality in municipal distribution system. Mater. Today Proc. 2022. [Google Scholar] [CrossRef]
  22. Islam, M.S.; Azadi, M.A.; Nasiruddin, M.; Islam, M.S. Water quality index of Halda River, Southeastern Bangladesh. Am. J. Environ. Eng. 2020, 10, 59–68. [Google Scholar]
  23. Horton, R.K. An index number system for rating water quality. J. Water Pollut. Control Fed. 1965, 37, 300–306. [Google Scholar]
  24. Chaudhari, A.N.; Mehta, D.J.; Sharma, N.D. Coupled effect of seawater intrusion on groundwater quality: Study of South-West zone of Surat city. Water Supply 2022, 22, 1716–1734. [Google Scholar] [CrossRef]
  25. Abualhaija, M.M.; Mohammad, A.H. Assessing Water Quality of Kufranja Dam (Jordan) for Drinking and Irrigation: Application of the Water Quality Index. J. Ecol. Eng. 2021, 22, 159–175. [Google Scholar] [CrossRef]
  26. Tokatli, C. Application of water quality index for drinking purposes in dam lakes: A case study of thrace region. Sigma J. Eng. Nat. Sci. 2020, 38, 393–402. [Google Scholar]
  27. Mehta, D.; Chauhan, P.; Prajapati, K. Assessment of ground water quality index status in Surat City. Next Front. Civ. Eng. Sustain. Resilient Infrastruct. 2018, 16, JCE60. [Google Scholar]
  28. Ghoderao, S.B.; Meshram, S.G.; Meshram, C. Development and evaluation of a water quality index for groundwater quality assessment in parts of Jabalpur District, Madhya Pradesh, India. Water Supply 2022, 22, 6002–6012. [Google Scholar]
  29. Smith, J.; Petrovic, P.; Rose, M.; De Souz, C.; Muller, L.; Nowak, B.; Martinez, J. Placeholder Text: A Study. J. Cit. Styles 2021, 3. [Google Scholar]
  30. Zolghadr, M.; Zomorodian, S.M.A.; Fathi, A.; Tripathi, R.P.; Jafari, N.; Mehta, D.; Sihag, P.; Azamathulla, H.M. Experimental Study on the Optimum Installation Depth and Dimensions of Roughening Elements on Abutment as Scour Countermeasures. Fluids 2023, 8, 175. [Google Scholar]
  31. Patel, P.; Mehta, D.; Sharma, N. Assessment of groundwater vulnerability using the GIS approach-based GOD method in Surat district of Gujarat state, India. Water Pract. Technol. 2023, 18, 285–294. [Google Scholar] [CrossRef]
  32. Surati, M.H.; Prajapati, K.J.; Parmar, U.K.; Mehta, D.J. Assessment of Water Quality Index of Tapi River: A Case Study of Surat City. In Groundwater and Water Quality: Hydraulics, Water Resources and Coastal Engineering; Springer International Publishing: Cham, Switzerland, 2022; pp. 263–277. [Google Scholar]
  33. Mehta, D.J.; Yadav, S. Meteorological drought analysis in Pali District of Rajasthan State using standard precipitation index. Int. J. Hydrol. Sci. Technol. 2023, 15, 1–10. [Google Scholar] [CrossRef]
  34. Mangukiya, N.K.; Mehta, D.J.; Jariwala, R. Flood frequency analysis and inundation mapping for lower Narmada basin, India. Water Pract. Technol. 2022, 17, 612–622. [Google Scholar]
  35. IS10500; Indian Standard Drinking Water–Specification (Second Revision). Bureau of Indian Standards (BIS): New Delhi, India, 2012.
Figure 1. Study area map.
Water 15 03512 g001
Table 1. Standard limits for parameters (BIS IS–10500:2012).
Sr. No.ParametersAcceptable LimitIdeal Values (V0)KWi
1pH6.5–8.570.7104610.083584
2Turbidity100.7104610.083584
3TDS50000.7104610.001421
4Total Hardness20000.7104610.003552
5Calcium7500.7104610.009473
6Magnesium3000.7104610.023682
7Chloride25000.7104610.002842
8Sulfate20000.7104610.003552
9Nitrate4500.7104610.015788
10Fluoride100.7104610.710461
11Total Alkalinity20000.7104610.003552
Table 2. Water quality range as per WAWQI.
WQIWater Types (Class)
0–25Excellent Water
26–50Good Water
51–75Poor Water
76–100Very Poor Water
Above 100Water Unsuitable for Drinking Purposes
Table 3. Physicochemical parameters analysed and comparison with BIS-IS: 10050-2012.
SiteYearTDSTHMgFClAlkalinityCa
N1201876523535 452
N2201891049360 41299
N32018602289311.4 291
N4201895032339 523404
N5201831641471178 1034291295
N6201867435643 226
N8201877032339 331
N7201884646153 31592
N92018652 259
N10201882054166 404108
2019570218 424
202038961519184 4122549304
202188755368 110
202290139860 55899
N11201859839648 27579
2019660242 218
202098440449 58289
202196540045 25849783
202289739139 57277
N122018384250 250
201932027533 356
202055633140 339
202168033741 456
202262032539 383
N132018840242 525
N142018102044454 32342889
201964263444 226
202076539763 36979
N15201859839648 27579
2020 250
N16201862842051 35684
N17201856026732 210
N182018624384561.26 232
2019 246 300
2022524240
N192018398234
N202018 222
2019 26533
2020 232
2021 224
N212018 284 236
2019 32039
202055933840 265
2021 232
202262836044 244
N222018 216
2019 232
2020614232 344
2022 239
N232018 20831 204
2019 216
2020 232
2022 242
Table 4. Categorisation of obtained results according to the WQI classification.
Sr. No.WQIStatusSiteYear
10–25Excellent waterN12018
N22019
N52019
N62018, 2021, 2022
N72019
N82021
N102019
N112018
N152018
N162019, 2021, 2022
N172018
N222018
N232018, 2020
N242021
225–50Good WaterN12019, 2020, 2021, 2022
N22020, 2021
N32019, 2020, 2021, 2022
N42019, 2020, 2021, 2022
N52020, 2021, 2022
N62019, 2020
N72020, 2021, 2022
N82018, 2019, 2020, 2021, 2022
N92018, 2019, 2020, 2021, 2022
N102018, 2020, 2021, 2022
N112019, 2020, 2021, 2022
N122018, 2019, 2020, 2021, 2022
N132018, 2019, 2020, 2021, 2022
N142018, 2019, 2020, 2021, 2022
N152019, 2022
N162020
N172019, 2020, 2021, 2022
N182019
N192019, 2020, 2021, 2022
N202021, 2022
N212018, 2019, 2020, 2021, 2022
N222019, 2020, 2021, 2022
N232019, 2021, 2022
N242018, 2019, 2020, 2022
N252018, 2019, 2020, 2021, 2022
351–75Poor WaterN22022
N82018
N152020, 2021
N162018
N182020, 2021, 2022
N202018
476–100Very poor waterN22018
N72018
N202019
5Above 100Water Unsuitable for Drinking PurposesN32018
N42018
N52018
N182018
N202020
Disclaimer/Publisher’s Note: The statements, opinions and data contained in all publications are solely those of the individual author(s) and contributor(s) and not of MDPI and/or the editor(s). MDPI and/or the editor(s) disclaim responsibility for any injury to people or property resulting from any ideas, methods, instructions or products referred to in the content.

