Article

Intrinsic Vulnerability Assessment of the Qingduo Karst System, Henan Province

1
College of Transportation Science & Engineering, Nanjing Tech University, Nanjing 211800, China
2
Center for Hydrogeology and Environmental Geology Survey, China Geological Survey, Baoding 071051, China
3
School of Water Resources & Environment, China University of Geosciences, Beijing 100083, China
*
Author to whom correspondence should be addressed.
Water 2023, 15(19), 3425; https://doi.org/10.3390/w15193425
Submission received: 28 August 2023 / Revised: 22 September 2023 / Accepted: 26 September 2023 / Published: 28 September 2023
(This article belongs to the Special Issue Soil-Groundwater Pollution Investigations)

Abstract

:
Groundwater vulnerability assessments are vital for protecting valuable resources by revealing susceptibility to contamination. This study developed an enhanced index model to assess the intrinsic vulnerability of a supplied karst aquifer in Qingduo, Henan Province. The model considered the 3-D geological structure and modified indices to account for Northern China’s mild karstification. Emphasizing the absolute infiltration capacity of surface contaminants, the model also integrated the groundwater sources and sinks (SS) index. The vulnerability map revealed that over 60% of the aquifers, including the Qingduo wellfield, exhibited very low to low vulnerability. Conversely, only small areas (<5%) along the Kejing (KJ) fault’s southern wall were classified as highly vulnerable. These findings highlighted the significant role of groundwater flow alongside aquifer conditions. The upward groundwater flow through the Fengmenkou (FMK) faults slowed the downward infiltration of surface contaminants into the lower karst aquifer, effectively reducing vulnerabilities. Lower levels of dissolved lead (Pb) and nitrate (NO3) in Qingduo groundwater aligned with PISSR vulnerability mapping. Sensitivity analysis assessed the results’ sensitivity to index weight assignment. The inclusion of the sources and sinks (SS) index holds implications for semi-quantitatively assessing dynamic groundwater vulnerability by delineating flow patterns.

1. Introduction

The quality of groundwater is a crucial concern for sustainable resource development. Groundwater pollution is often hidden and persistent because of its underground circulation. Therefore, it is crucial to pre-evaluate a region’s pollution risks or groundwater vulnerability before construction or groundwater exploitation [1,2,3,4]. Groundwater vulnerability is the tendency and possibility of pollution reaching a specific location in the upper aquifer [5], which is distinguished as intrinsic vulnerability and special vulnerability. The intrinsic vulnerability mainly considers the physical properties of the groundwater system, i.e., inherent geological and hydrogeological characteristics, but is independent of the pollutant species [6]. By contrast, the specific vulnerability considers the specific pollution sources and properties (i.e., point or non-point sources, heavy metals or organic pollutants, physical and biogeochemical attenuation processes), as well as their transport features and relationship with intrinsic vulnerability components [7,8]. Intrinsic vulnerability provides a fundamental base for assessing either groundwater special vulnerability or pollution risks by highlighting the inherent impacts of the groundwater system on pollution distributions.
The groundwater system affecting groundwater intrinsic vulnerability includes two parts. One is the near-surface geological matrix, such as soil type, vadose zone medium, aquifer structure, and geological formations [9]. The other is the groundwater flow system, presented as the hydraulic distribution and circulation pattern, including sources and sinks [10]. The orderly transport of the groundwater flow system not only controls the spatial and temporal evolution of salinity and heat but also significantly impacts groundwater pollution risks by influencing the infiltration, transport, and accumulation of contaminants. Distributions of the sources and sinks in groundwater flow systems, for example, have an impact on the absolute infiltration capacity of surface contaminants for controlling the hydrodynamic pressure. The groundwater vulnerability may become lower in the discharge zone because a strong, upward outflow can block the vertical infiltration of surface contaminants. Conversely, when surface contaminants infiltrate more extensively in the recharge zone, the intrinsic vulnerability of groundwater may increase [11,12,13,14,15].
Index-based methods have been widely used to assess groundwater intrinsic vulnerability since the 1990s [16,17,18,19,20]. The methods are cost-effective as the vulnerability indexes are easily operated in the spatial domain, and the results can be intuitively presented by vulnerability mapping in a GIS framework [21]. The index-based assessment model consists of multiple primary indicator layers that represent properties related to specific aspects, like the “protective layer” of the vadose zone or the “runoff condition” in the saturated zone. Additionally, there is a set of subordinate indices used for more detailed characterization; for instance, “vadose lithology” serves as a subordinate index under the “protective layer” category. Moreover, the model relies on fundamental factors related to hydrology and hydrogeology, such as annual precipitation, aquifer structure, and permeability, which are essential for scoring these indices. The vulnerability values in the maps are computed by spatially aggregating weighted indices according to certain criteria. The commonly used index-based methods, such as the DRASTIC [22,23,24,25], GOD [26,27], and AVI [28,29], often compose indices, such as the topographic slope, medium of the vadose zone, groundwater level, soil type, and aquifer recharge, which are suitable for the porous aquifers (Table 1). On the contrary, vulnerability assessment indices must undergo adjustments in karst aquifers due to the typically heterogeneous nature of rock dissolvability and the prevalent presence of geological structures in karst regions.
In addition, karstification degrees are different in South and North China. For example, sinkholes and vertical shafts are commonly found in well-developed karst regions in South or Southwest China, and pollutants may infiltrate into the karst system through those zones with a higher probability as a result. Index models such as the PI and COP methods [30,31,32] are developed for assessing intrinsic vulnerability in fully-karstified areas (Table 1), considering factors including the overlying protective layer, precipitation, runoff and infiltration conditions, and fracture developments. Conversely, in weaker karst systems like the Cambrian-Ordovician limestone in the North China Plain, sinkholes and caves are not as prevalent. Instead, dissolution pores and fissures dominate, and they tend to be more evenly distributed. Particularly, faults buried in the thick limestones greatly affect the karst flow system on a regional scale. The index systems, such as the COPK and RISKEC, have been devised for those karsts (Table 1), which highlight factors such as the dissolution degrees of the fissured karst to conform to the system [33,34,35]. Furthermore, assessment models in some case studies in the North China Plain are adjusted and simply based on the porous DRASTIC one, as the characteristics of those weakly dissolved limestone aquifers are similar to those of porous media [36].
Current index-based methods for assessing the vulnerability of karst aquifers primarily focus on qualitative descriptions of the aquifer matrix and contaminant penetration. These descriptions encompass attributes of the protective/cover (vadose) zone and the extent of karst development (including dissolution pores, fissures, or cavities). Although external recharge rates of groundwater have been considered, such as precipitation, river/irrigation percolation, and artificial drainage, the delineation of the overall groundwater flow system, including the source and sink distribution and hydrodynamic variables, is still insufficient in vulnerability assessments [34,37,38]. On the other hand, there have been few attempts to utilize an accurate hydrogeological model based on borehole data to identify the hydrogeological indices or fundamental factors, such as the thickness of vadose zones, soil, and lithology distributions, in vulnerability assessments, which is essential for a precise assessment since the geological structure is usually complex and the aquifer medium is spatially heterogeneous in the karst area.
Table 1. Index-based methods for groundwater vulnerability assessment.
TypeModelParametersEquationApplication Examples
Porous aquiferDRASTICDepth to water, Net recharge, Aquifer media, Soil media, Topography, Impact of the vadose zone, and Hydraulic conductivity DRASTIC = i = 1 n W i × R i  aSalem et al. [22]
Yang et al. [23]
Wu et al. [24]
Babiker et al. [25]
GODGroundwater confinement, Overlying strata, and Depth to the groundwaterGOD = G × O × DSekar et al. [26]
Sartika et al. [27]
SINTACSWater table depth, Unsaturated conditions, Soil media, Net recharge, topographic slope, Aquifer media, and Hydraulic conductivity SIN TACS = i = 1 n W i × R i Sahu et al. [39]
Civita et al. [40]
AVINumber of sedimentary layers above the aquifer, Thickness of each sedimentary unit, and Estimated hydraulic conductivity of each sedimentary unit AVI = log D K Vias et al. [28]
Putranto et al. [29]
SIDepth to the water table, Net recharge, Water ground media, Topography, and Land use SI = i = 1 n W i × R i Roohollah et al. [41]
Ghouili et al. [42]
Karst aquifer (strongly developed)EPIKEpikarst, Protective cover, Infiltration conditions, and Degree of karstic network development EPIK = i = 1 n W i × R i Doerfliger et al. [7]
PIProtective cover and Infiltration conditionsPI = P × IRiyanto et al. [30]
Xu et al. [31]
COPConcentration flow, Overlying layers, and PrecipitationCOP = C × O × PBagherzadeh et al. [32]
Karst aquifer (limited developed)COPKWater table, Concentration of flow, Precipitation over the aquifer, and Degree of karstic network developmentCOPK = C × O × P × KSun et al. [33]
Du et al. [34]
RISKECRock of aquifer media, Infiltration, Soil media, Karst, Epikarst, and Coal mine RISKEC = i = 1 n W i × R i Yang et al. [35]
DRWMLPEDepth to water, Net recharge, Aquifer storage coefficient, Unsaturated zone lithology, Land use, Pollution sources, and Extraction DRWMLPE = i = 1 n W i × R i Guo et al. [36]
Note: a Wi represents the weight of the i th index, and Ri represents the rating value (or score) of the i th index.
Considering the aforementioned constraints, this study seeks to enhance an index-based method to emphasize groundwater flow patterns in weakly dissolved karst systems, particularly those found in North China, for intrinsic vulnerability assessments. The Qingduo karst supply area was chosen as the study area, which is located in the alluvial plain of the Mang River in Henan Province, North China (Figure 1a). The supply provides over 80,000 m3 of groundwater each day for Jiyuan City as the drinking water source. However, industrial activities such as mining and smelting, along with agricultural practices, have led to pollution in the surrounding soil and water systems. Based on our previous sampling conducted from 2016 to 2018, we observed accumulations of heavy metals, including Pb, As, and Cd, in soils near the water supply (as detailed in Table 2). Notably, the Pb concentrations in nearly one-third of the soil samples exceeded the maximum contaminant level of 170 mg/kg (for farmland soil, pH > 7.5, GB15618-2018 [43]), with the highest Pb concentration exceeding 2500 mg/kg. Furthermore, the increased levels of dissolved Pb, As, and nitrate in local river water (as shown in Table 2) also signaled contamination from industrial and agricultural sources. Consequently, it becomes imperative to assess groundwater vulnerability in the context of such external contamination loads.
Four specific contents and objectives are outlined: i. Develop the PISSR index-based evaluation model, consisting of three main indicator layers and eight indices. Emphasize the source-sink distribution (SS index) to assess contaminant infiltration influenced by groundwater flow. ii. Create a precise three-dimensional geological structure model using borehole data and geological profiles to obtain accurate index scores. iii. Validate the groundwater vulnerability map generated by the PISSR index model by comparing it with the spatial distribution of observed water quality parameters (dissolved Pb and NO3) in groundwater. Evaluate the impact of considering the SS index on intrinsic vulnerabilities. iv. Analyze the sensitivity of index weights and explore the significance of the flow system, discussing its implications for dynamical groundwater vulnerability assessment.

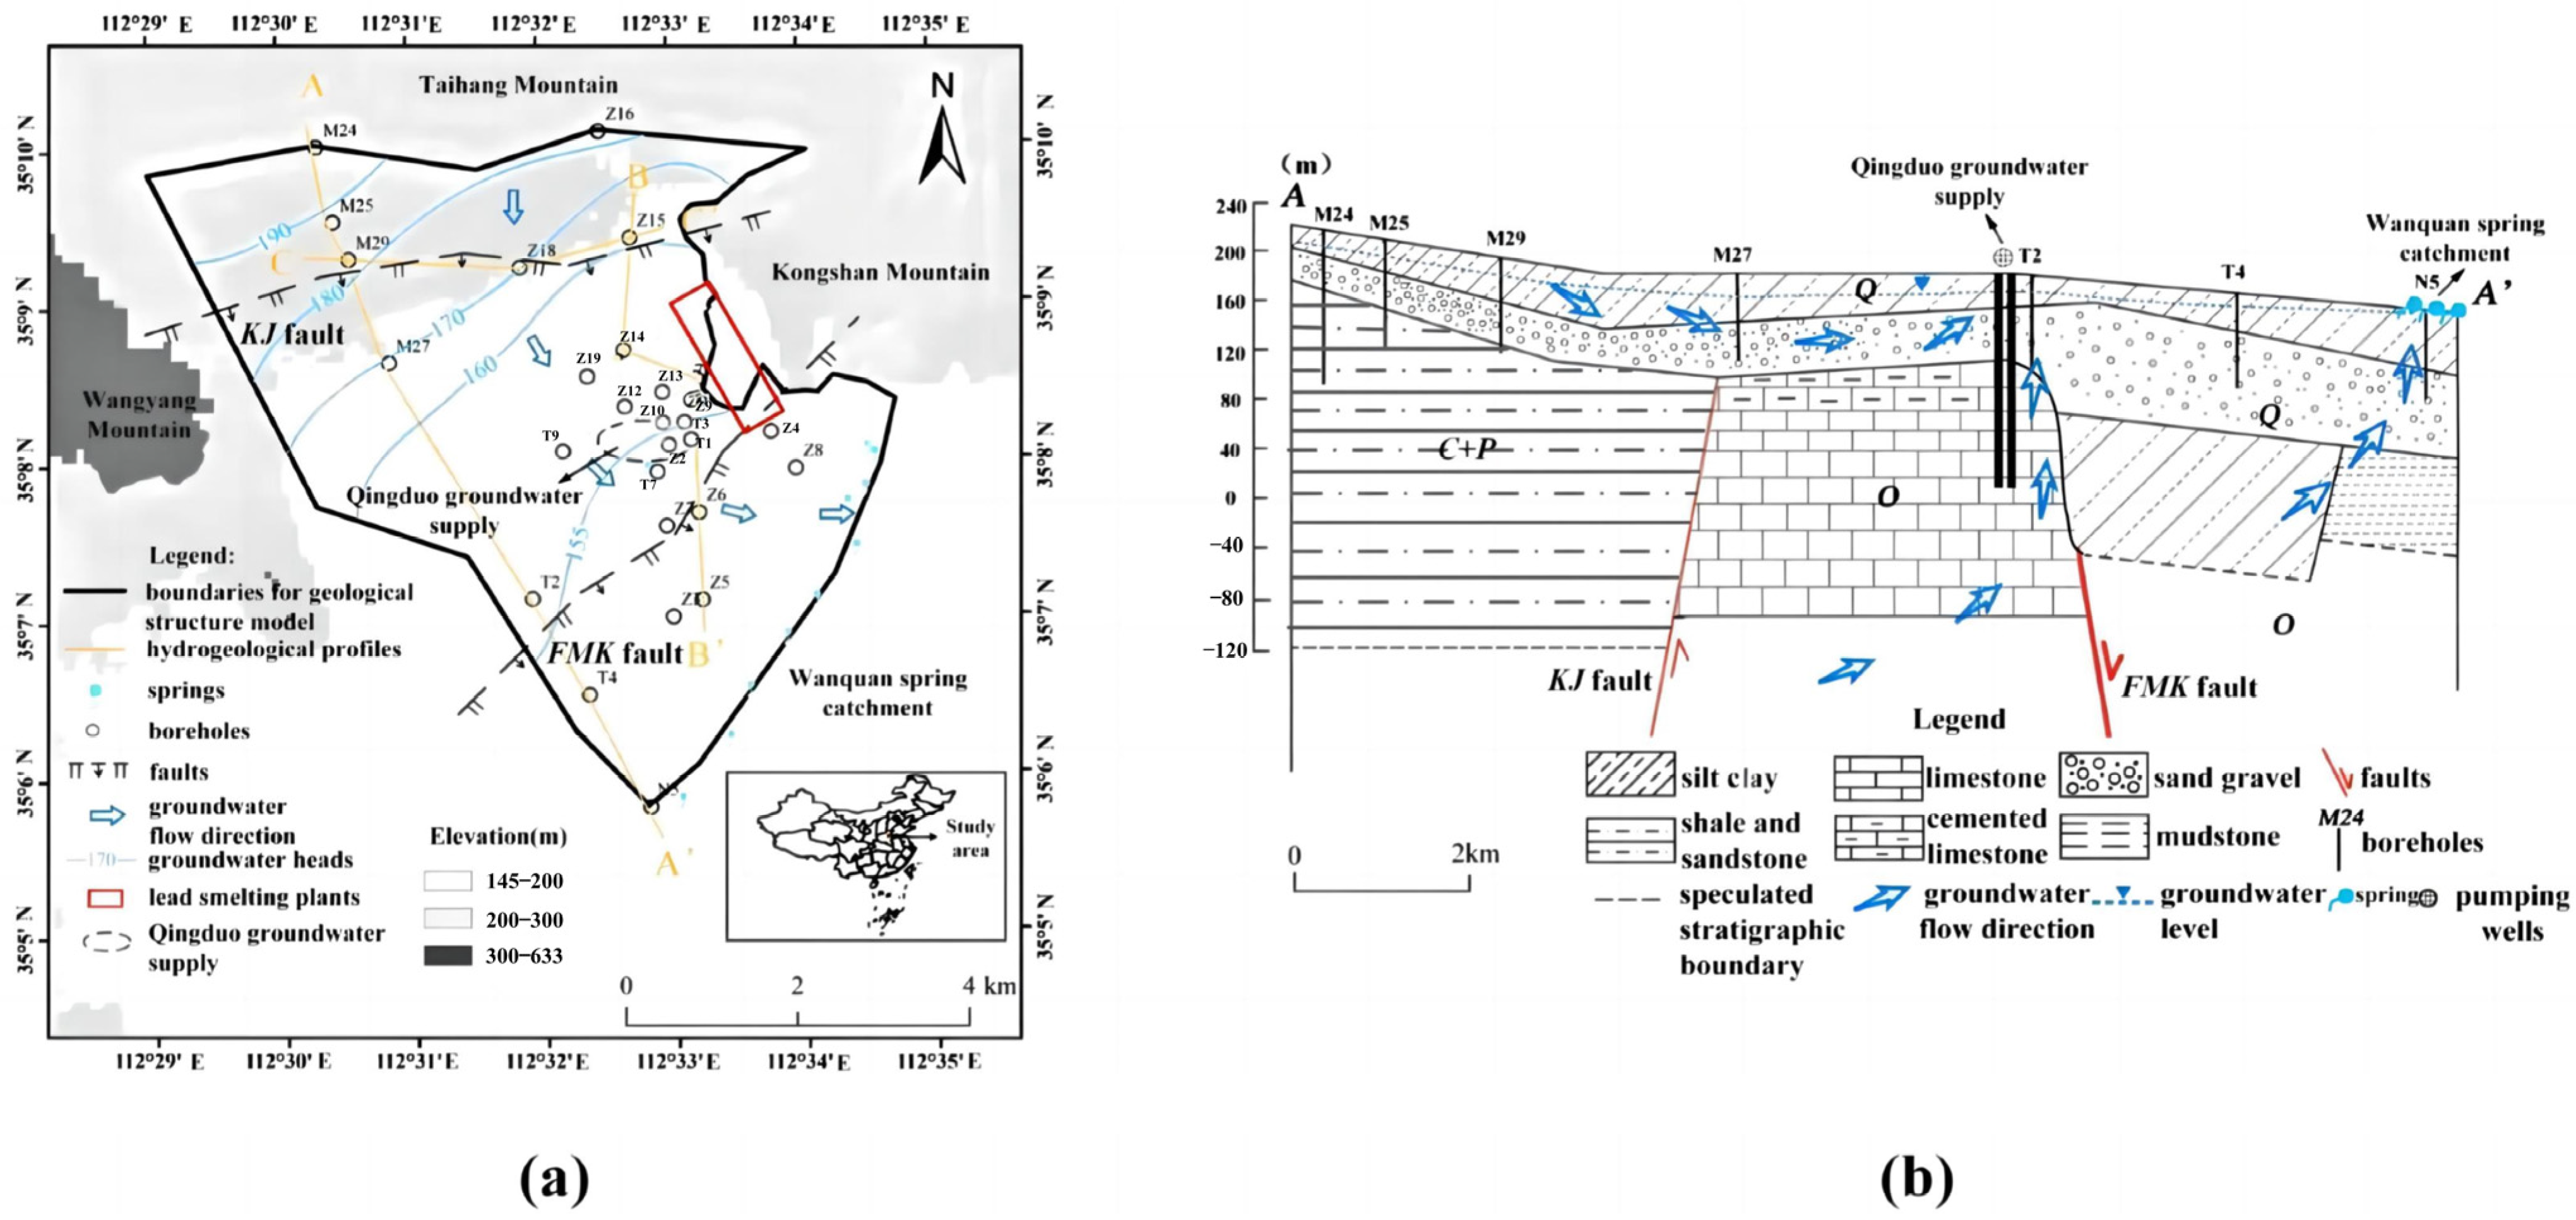
2. Hydrogeological Settings

The study area is located at the southern foot of the Taihang Mountains, in the Mang River alluvial plain (Figure 1a). The area is surrounded by the Wanyang and Kong Mountains in the east and west, respectively, and the elevation of the flat areas is often less than 200 m. The study area features a warm tropical sub-humid monsoon climate, characterized by an annual average temperature of 14.4 °C and a precipitation of 616.8 mm, respectively. The flood seasons in the study area appear from July to September, while the dry seasons are from May to June.
The Quaternary (Q) loose sediments widely cover the study area; the underlying strata include the Permian (P) and Carboniferous (C) coal-bearing shales and the Ordovician (O) limestones. There are two main geological fractures in the study area, affecting the development of stratigraphic dislocations. The Kejing (KJ) fault is developed in the north as part of the regional fold structures. In the north wall of the KJ fault, impermeable shale and sandstone (C+P, thickness up to 100 m) are developed under the Q sediments. While in the south plate, due to the absence of the uplifted C+P strata, the O limestones are directly in contact with the Q layer (depth of about 50–150 m, in Figure 1b). Within the central region of the study area, the Fengmenkou (FMK) normal fault has developed with a steep dip angle ranging from 50° to 70° beneath the Q loose sediments. Both the northern and southern walls of the FMK fault interface with the underlying limestone formation. The primary fault runs in an east-west direction, with a southward inclination of the fault plane. Additionally, there are secondary faults that run parallel to the FMK primary fault, and the level of karst fragmentation intensifies as one approaches the main fault. Furthermore, the FMK faults play a key role in the formation of the Qingduo block, which is east-west-oriented between the two faults (Figure 1b).
The groundwater types in this area include the pore water in the loose sediments above and the karst water in the limestone aquifers. The aquifer structures and groundwater flow systems are greatly impacted by the faults. In the north plate of the KJ fault, which is the core of the KJ syncline, the karst water is deeply buried under the impermeable C+P shales at a depth of 250–350 m. The buried karsts in the region receive limited vertical recharge from atmospheric precipitation because of the impervious rocks overlaying them. From the south limb of the KJ syncline to the Qingduo block, including most of the study area, the groundwaters consist of the Q-pore water and O-covered karsts, which have consistent water heads (depth of about 30–35 m) because there is no continuous aquitard between two aquifers. Therefore, the covered karsts get recharged from the rain and irrigation water along the flow path. On the other hand, the confined karst water flows upward from depth via the FMK conduits in the middle of the study area (Figure 1a,b), resulting in shallower groundwater depths (depths of 15–20 m) near the faults. Groundwater also flows at the surface as springs in the Wanquan spring catchment in the south, where flow is blocked by impermeable strata such as the Tertiary (N and E) semi-colluvial mudstone and sandstone (Figure 1a,b). The hydraulic conductivity (K) of the covered limestones with dissolved pores and fissures ranges from 50–200 m/d, while the K of the fractured limestones increases to over 500 m/d in the FMK fault damage zones. The permeability reduces in parts of the fault contact zone because the fractures are cemented by the fault gouge.

3. Materials and Methods

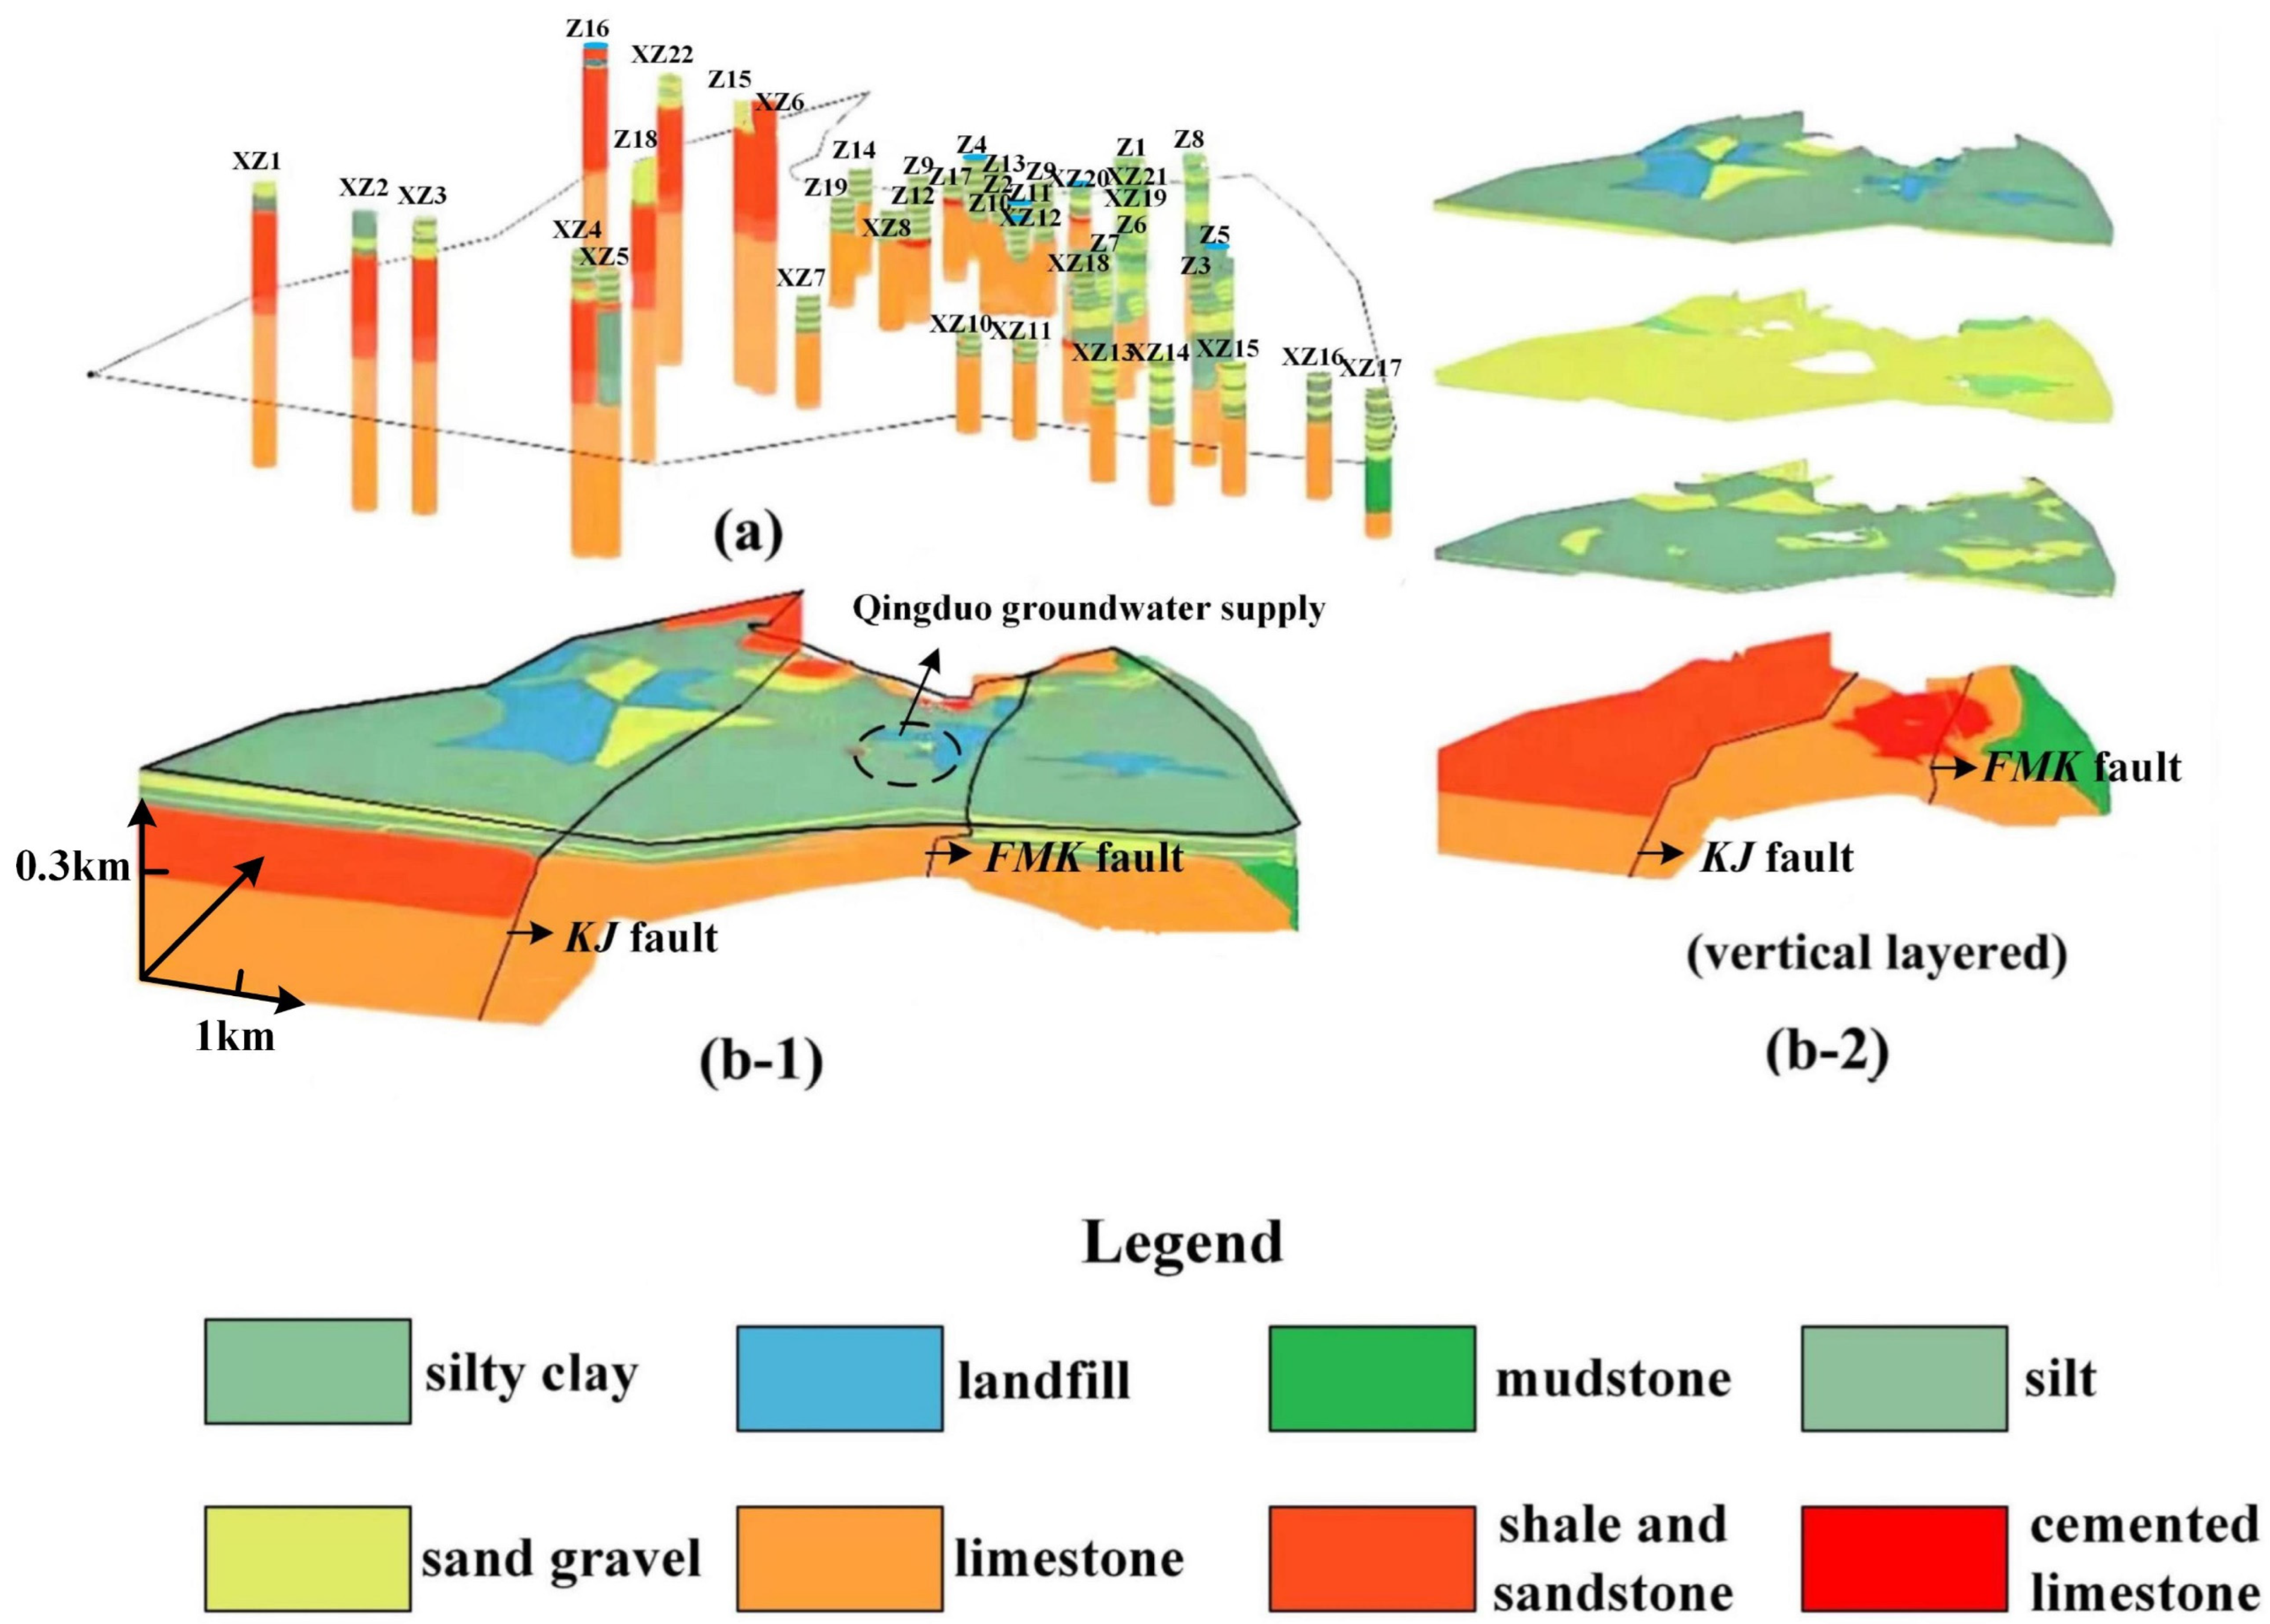
3.1. Three-Dimensional Geological Model

To characterize the features of the vadose zone and aquifer structures and provide the basis for the groundwater vulnerability index model, a three-dimensional (3-D) geological model of the study area has been constructed using core data from 27 hydrogeological investigation boreholes (Z1-T4, Figure 1a). In addition to the actual boreholes, stratum sequences extracted from documented hydrogeological profiles (A–A’, B–B’, and C–C’, Figure 1a) at 22 locations were employed as virtual boreholes (designated as XZ1 to XZ22 in Figure 2a) to enhance the model. The borehole lithology information was imported using the Borehole module in the Groundwater Modeling System (GMS 10.4) [45], and the spatial distribution of the eight geological media in the study area was interpolated using the natural neighborhood method in the Solid module (Figure 2b-1).
The 3-D geological model with 100 layers, 200 rows, and 200 columns was constructed using the Ugrid module in the GMS, and the spatial lithological information, including medium type and thickness at each grid (total of 302,549 grids), can be quantitatively extracted from the model. The medium distributed from the top to the bottom can be generally described as follows: landfill (thickness of 0–10.7 m), silty clay (thickness of 0–150.2 m), silt (thickness of 0–37.2 m), sand gravel (thickness of 0–70.6 m), cemented limestone (Oc, thickness of 0–40.1 m), dissolved limestone (O, thickness of 0–300 m), shale and sandstone (C + P, thickness of 0–300 m), and mudstone (N, thickness of 0–150 m). Additionally, the thickness of the vadose zone was determined using the average annual groundwater level within the study area (Figure 1a).

3.2. PISSR Index Model

In this study, the improved “PISSR” index-based evaluation model comprises three indicator layers: “Protective layer (P)”, “Infiltration condition (ISS)”, and “Runoff condition (R)” (Equation (1)), and subordinate eight indices. Indices such as the vadose zone lithology (LV), vadose zone thickness (DV), topsoil medium (M), terrain slope (T), land use type (Lu), and saturated zone transmissibility (TS) are normally used in the karst aquifer vulnerability assessment. Furthermore, the Sources and Sinks (SS) index was introduced to emphasize the impact of flow patterns, including net recharge and outflow intensity, on the infiltration of surface pollutants. The fault damage zone (F) index was also added to represent the potential transmission of pollution through water-conducting faults.
The classification and weight assignments of the indices were generally based on the expert score method referred to the relevant studies [5,37,46,47,48,49,50,51,52] and groundwater vulnerability assessment guidelines by the Chinese Academy of Sciences and Ministry of Water Resources (CAS and CMWR, 2012) [53], with adjustments according to the local hydrogeological conditions. The values spanned from one to five, with each scale corresponding to varying degrees of importance, ranging from “low importance” to “critical importance.” Detailed explanations of each indicator layer are described in the following text and Table 3.

3.2.1. Protective Layer (P)

The indicator layer of the “Protective layer (P)” included evaluation indices of the vadose zone lithology (LV), thickness (DV), and surface soil medium (M) (Table 3, Equation (2)). The lithologies of vadose zones mainly consisted of silty clay, silt, and sand gravel, according to the three-dimensional (3D) geological model. Medium type and thickness in the study area can be extracted at each grid from the model. The value of the vadose zone lithology (LV) was obtained using the following equation:
L V = i = 1 n L V i . D V i D V
where LVi represents the score assigned to lithology i, primarily associated with its permeability and adsorption characteristics. DVi stands for the thickness of lithology i in vadose zones. DV is the total thickness of the vadose zone, which was based on the annual average groundwater depths in the study area (Figure 1a).
The overlying topsoil can act as the first barrier for pollutants to vertically enter the vadose zone, as pollutants can be biogeochemically degraded in those media. In addition to small areas in the north of the FMK fault being covered with silty loam, topsoil is usually thin or even missing in most parts of the study area. Ranges with values of the vadose zone lithology (LV), thickness (DV), and soil medium (M) in the study area are shown in Table 4. The loose sediment of the vadose zone in the study area is typical in the North China Plain. The weights of the LV, DV, and M indices in this study were set at 3, 4, and 2 according to the weight assignments in the CAS and CMWR guidelines [53].

3.2.2. Infiltration Condition (ISS)

The infiltration condition included three evaluation indices: the terrain slope (T), land use type (Lu), and sources and sinks (SS) (Table 3, Equation (3)). In this case, the flat terrain meant high groundwater vulnerability (Table 4), because the Ordovician limestones in the study area are mostly covered or buried under the deposits or shales without sinkholes developing. In areas with gentler terrain, surface pollutants tend to have a longer residence time, resulting in a higher risk of pollution [55]. The terrain slope (T) in the study area is 1.5–11.5% according to the DEM data; the value ranged from 5 to 10 according to the expert scoring list [46] (Table 4). The main types of land use (Lu) in the study area were grass and cultivated lands, villages and towns, and industrial and mining plants, according to the satellite image. Surface pollution may infiltrate easily in grass and cultivated lands, while the infiltration risks can be lower in cement ground in habitations or factories [56]. The classification and weight assignments of terrain (slope) (T) and land use type (Lu) were adopted from the COP method employed in spring karst aquifers in northern China [37] (Table 3 and Table 4).
Furthermore, the sources and sinks (SS) index was developed to reflect the impacts of vertical flow patterns and intensity in the groundwater flow system on surface pollution infiltration risks. Here, the absolute infiltration per unit area (If, m/d) was used to represent the hydraulic driving capacity of pollutants entering an aquifer system. The positive If value denoted the infiltration in the groundwater recharge zone, and a larger If value implied a higher risk of surface pollution infiltration. This was similar to the previous studies, considering that more precipitation and irrigation recharges can increase groundwater pollution risks [2]. On the contrary, if the If value of an area becomes negative, the place can be in the discharge or overflow zone of the flow system, thus surface contaminants can hardly infiltrate. This was similar to hydrogeological buffering in the groundwater discharge area or riparian zones [57]. In this way, a negative If with a higher absolute value could represent an intense discharge or outflow, implying stronger flow buffering for the external pollutants. The calculation equation for absolute infiltration per unit area was as follows:
I f = R D = R p + R i D f + D s
where ∑R and ∑D represented the total recharge and discharge, respectively, at the same location. Rp was the precipitation recharge, Ri was the irrigation recharge, Df was the vertical discharge of the deep karst water via the FMK water conducting faults, and Ds was the spring discharge in the Wanquan spring catchment.
The spatial distribution of the Rp in the study area was calculated by multiplying the annual average precipitation (P, mm) by the precipitation infiltration recharge coefficients (α) at each top cell in the 3-D geological structure model (Figure 2). For the buried karst under layers of shale and sandstone in the north plate of the KJ fault, the replenishments from the precipitation can be very limited. Therefore, an additional coefficient x = 0.2 was set for those impermeable covering beds, which was used to multiply the α to give a smaller infiltration recharge. The annual P in the study area is approximately 600 mm, and the α coefficients of the silty clay, silt, and sand gravel at the top were set as 0.1, 0.18, and 0.27, respectively [58]. Accordingly, the precipitation infiltration recharge Rp in the study area was calculated from 0.0001 to 0.0004 m/d. An extensive irrigation network has been built in this alluvial plain since the 1960s, which was the main source of irrigation recharge in the study area [59]. The irrigation recharge Ri was calculated as about 0.0003 m/d using the equation Ri =Cd × Ia × Uc. Cd is the channel diversion volume of the irrigation water (average 5.91 m3/s), and Ia is the irrigation area (approximately 8 × 10⁸ m2). Uc stands for the effective utilization coefficient of irrigation, which signifies the ratio of the effective water amount entering the field to the water quantity originating from the canal’s source. Uc is predominantly influenced by factors like the size of irrigation areas, canal levels, anti-seepage measures, and irrigation technology standards [60]. In Henan, it typically maintains an average value of 0.472 [61].
Since the FMK faults connected the upper Q pore water and the deep O karst water, water from the highly confined karst would flow upward to the shallow Q aquifers. The annually averaged upward discharge of the O karst water can reach 6 × 10⁴–8 × 10⁴ m3/d, accounting for approximately 60% of the total discharge according to the previous modeling [62]. In addition, the spring discharge in the Wanquan area in the south was from 5 × 10⁴ to 7 × 10⁴ m3/d [59].
As a result, the If values in the study area were calculated from −0.0008 to 0.0012 m/d, and the values of the sources and sinks (SS) ranged from 1 to 10, as shown in Table 4. The SS index represents the absolute infiltration capacity influenced by external recharge (such as rainfall and irrigation) and the internal groundwater cycling system. The weight for the SS index was set at 4 (as shown in Table 3), akin to the weight assigned to the Recharge (R) index in the DRASTIC model [5].

3.2.3. Runoff Condition (R)

The indicator layer of runoff condition mainly considered the migration and accumulation risk of pollutants in saturated zones, including the fault damage zone (F) and the transmissibility below the water table (TS) (Table 3, Equation (4)). The area with open fractures was characterized by high-density crevices that developed regionally. The sharply increased permeability in the fault damage zone often had a great impact on groundwater runoff conditions and pollution migration [63]. In this study, the “distance from faults” was used to explore the influence of the fault damage zone on groundwater pollution risks. This concept referred to the index “distance from sinkholes” used in the vulnerability assessment in well-developed karst areas [48].
The fractured degree and permeability of limestones were supposed to increase as they approached the FMK main fault for two reasons. Firstly, the development of secondary faults was observed running parallel to the main fault, approximately 50–100 m to the north. Secondarily, a pumping test conducted in the karst aquifers with an average depth of 250 m, as reported by CGS, indicated a decrease in the hydraulic conductivity (K) of limestones. Specifically, K decreased from 513 m/d along the main fault to a range of 12–30 m/d at a distance of about 500 m south of the main fault. However, quantitative statistical variations in K with respect to the distance from the FMK main fault were not available due to the lack of sufficient data. Instead, we utilized a qualitative approach to gauge the “degree of damage” concerning distance, pinpointing an approximate distance of 500 m as the point where it becomes predominantly damaged (Table 4). The weight value for F was set to 4 (as seen in Table 3), following the weight assignment for the “sinkhole distance” [48].
The transmissibility (TS) in the saturated zone reflects the ability of groundwater to move through the aquifer, which in turn indicates its capability to transport pollutants. The calculation equation for the TS in this study area was as follows:
T S = i = 1 n P S i . D S i D s
where TS was the score of the transmissibility in the saturated zone, PSi was the score of the permeability of the medium i, DSi was the thickness of the medium i, and DS was the total thickness of the saturated zone. The stratigraphic lithology and thickness of each grid were extracted from the 3-D geological model. The aquifer medium and its respective permeability scores in the study area are shown in Table 4. The flow characteristics of the O karst in the study area resembled those of the Q pore water since the O limestone aquifers were dominated by dissolved pores and fissures that were uniformly connected. Therefore, the TS classifications were adjusted based on the assessment model for porous aquifers, and the weight of the TS was set as 3, according to that in the DRASTIC model [50,51,52] (Table 3).

3.3. Intrinsic Vulnerability Classification and Global Vulnerability Parameter

Intrinsic vulnerability can be classified into five grades: very low, low, medium, high, and very high based on the calculated scores by the PISSR model, and the vulnerability class values (cl) were set from 1 to 5, respectively (Table 5). This classification was similar to that in studies by Salem et al. (2011), Sadi et al. (2019), and Syafarni et al. (2021) [22,57,64]. However, the vulnerability score range for each level was a little higher with the addition of the sources and sinks (SS) index in the model. Accordingly, the higher the vulnerability score, the more vulnerable the groundwater was to pollution; otherwise, it was the opposite.
The global vulnerability parameter (Gv), as described in Vías J et al. (2010) [65], assesses the overall vulnerability level of an aquifer by computing a weighted average of vulnerability class values (cl, Table 5) obtained from the vulnerability map.
G v = c l   ×   ω v
where ωv represents the percentage of surface for each vulnerability class. The Gv parameter enables the comparison of vulnerability levels among different sites and the identification of the most vulnerable aquifer, irrespective of distinct scores [66]. In this study, the Gv parameter was also employed to assess variations in the overall vulnerability level in the results following weight changes.

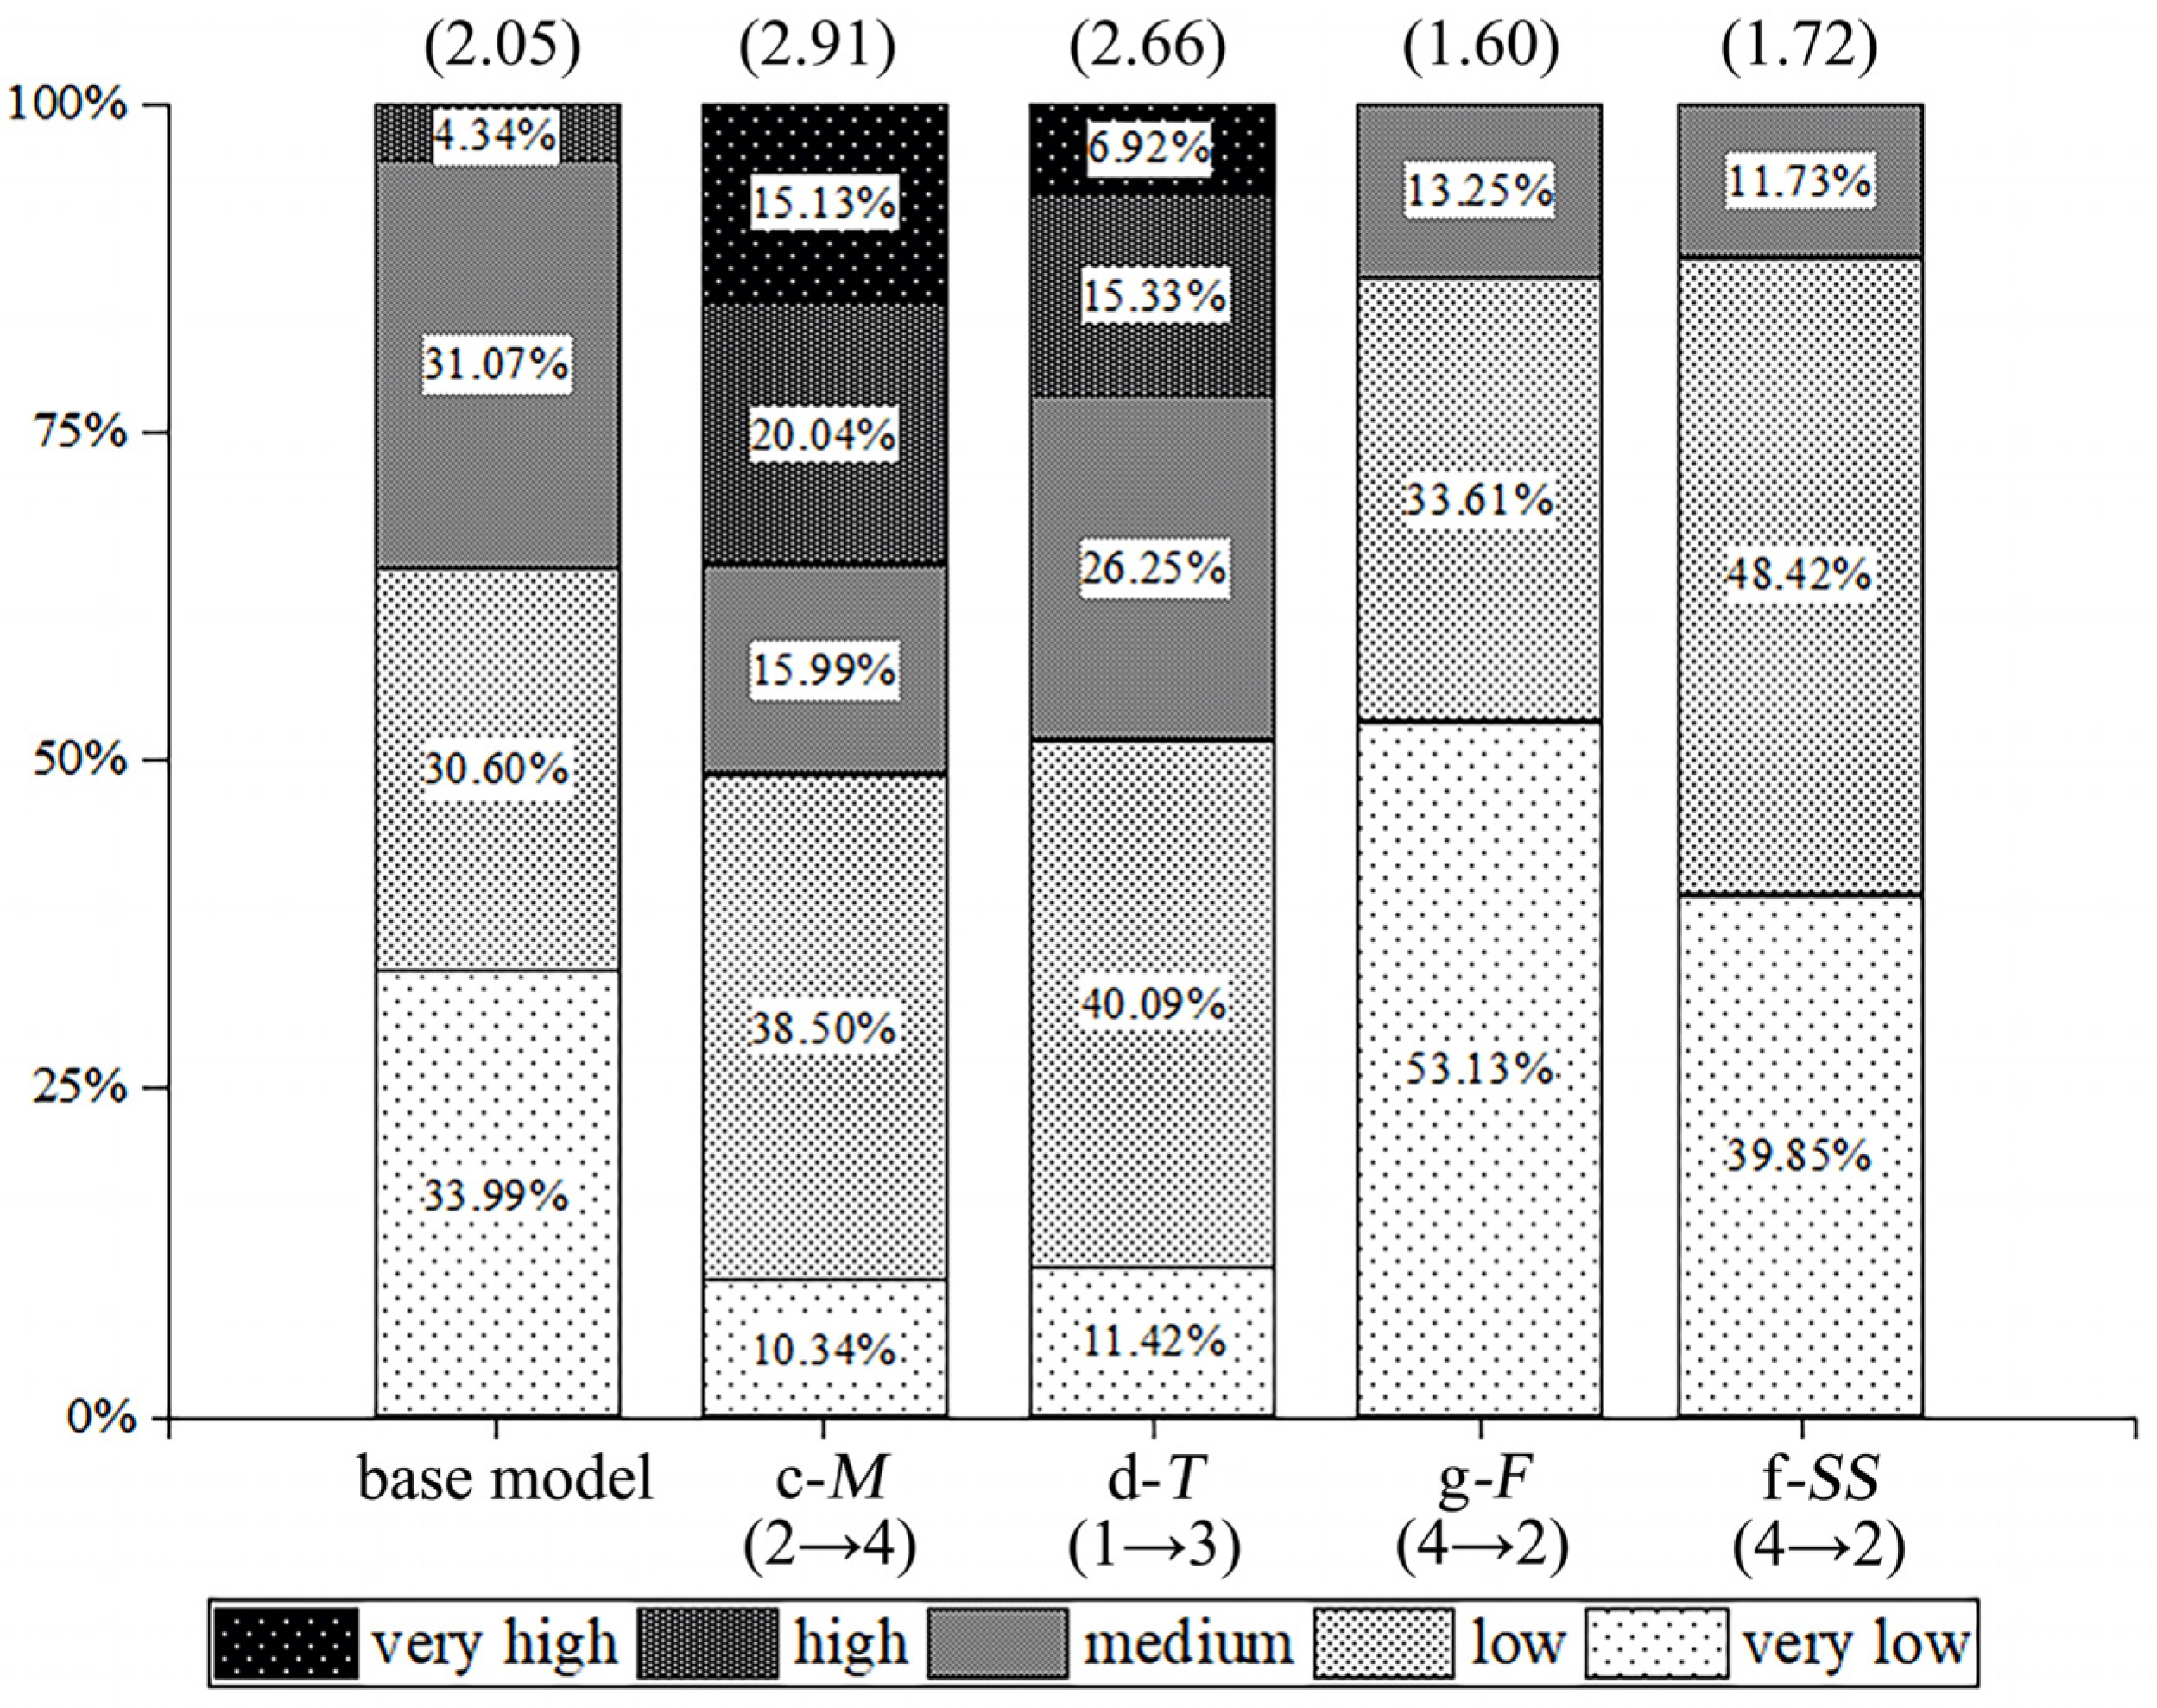
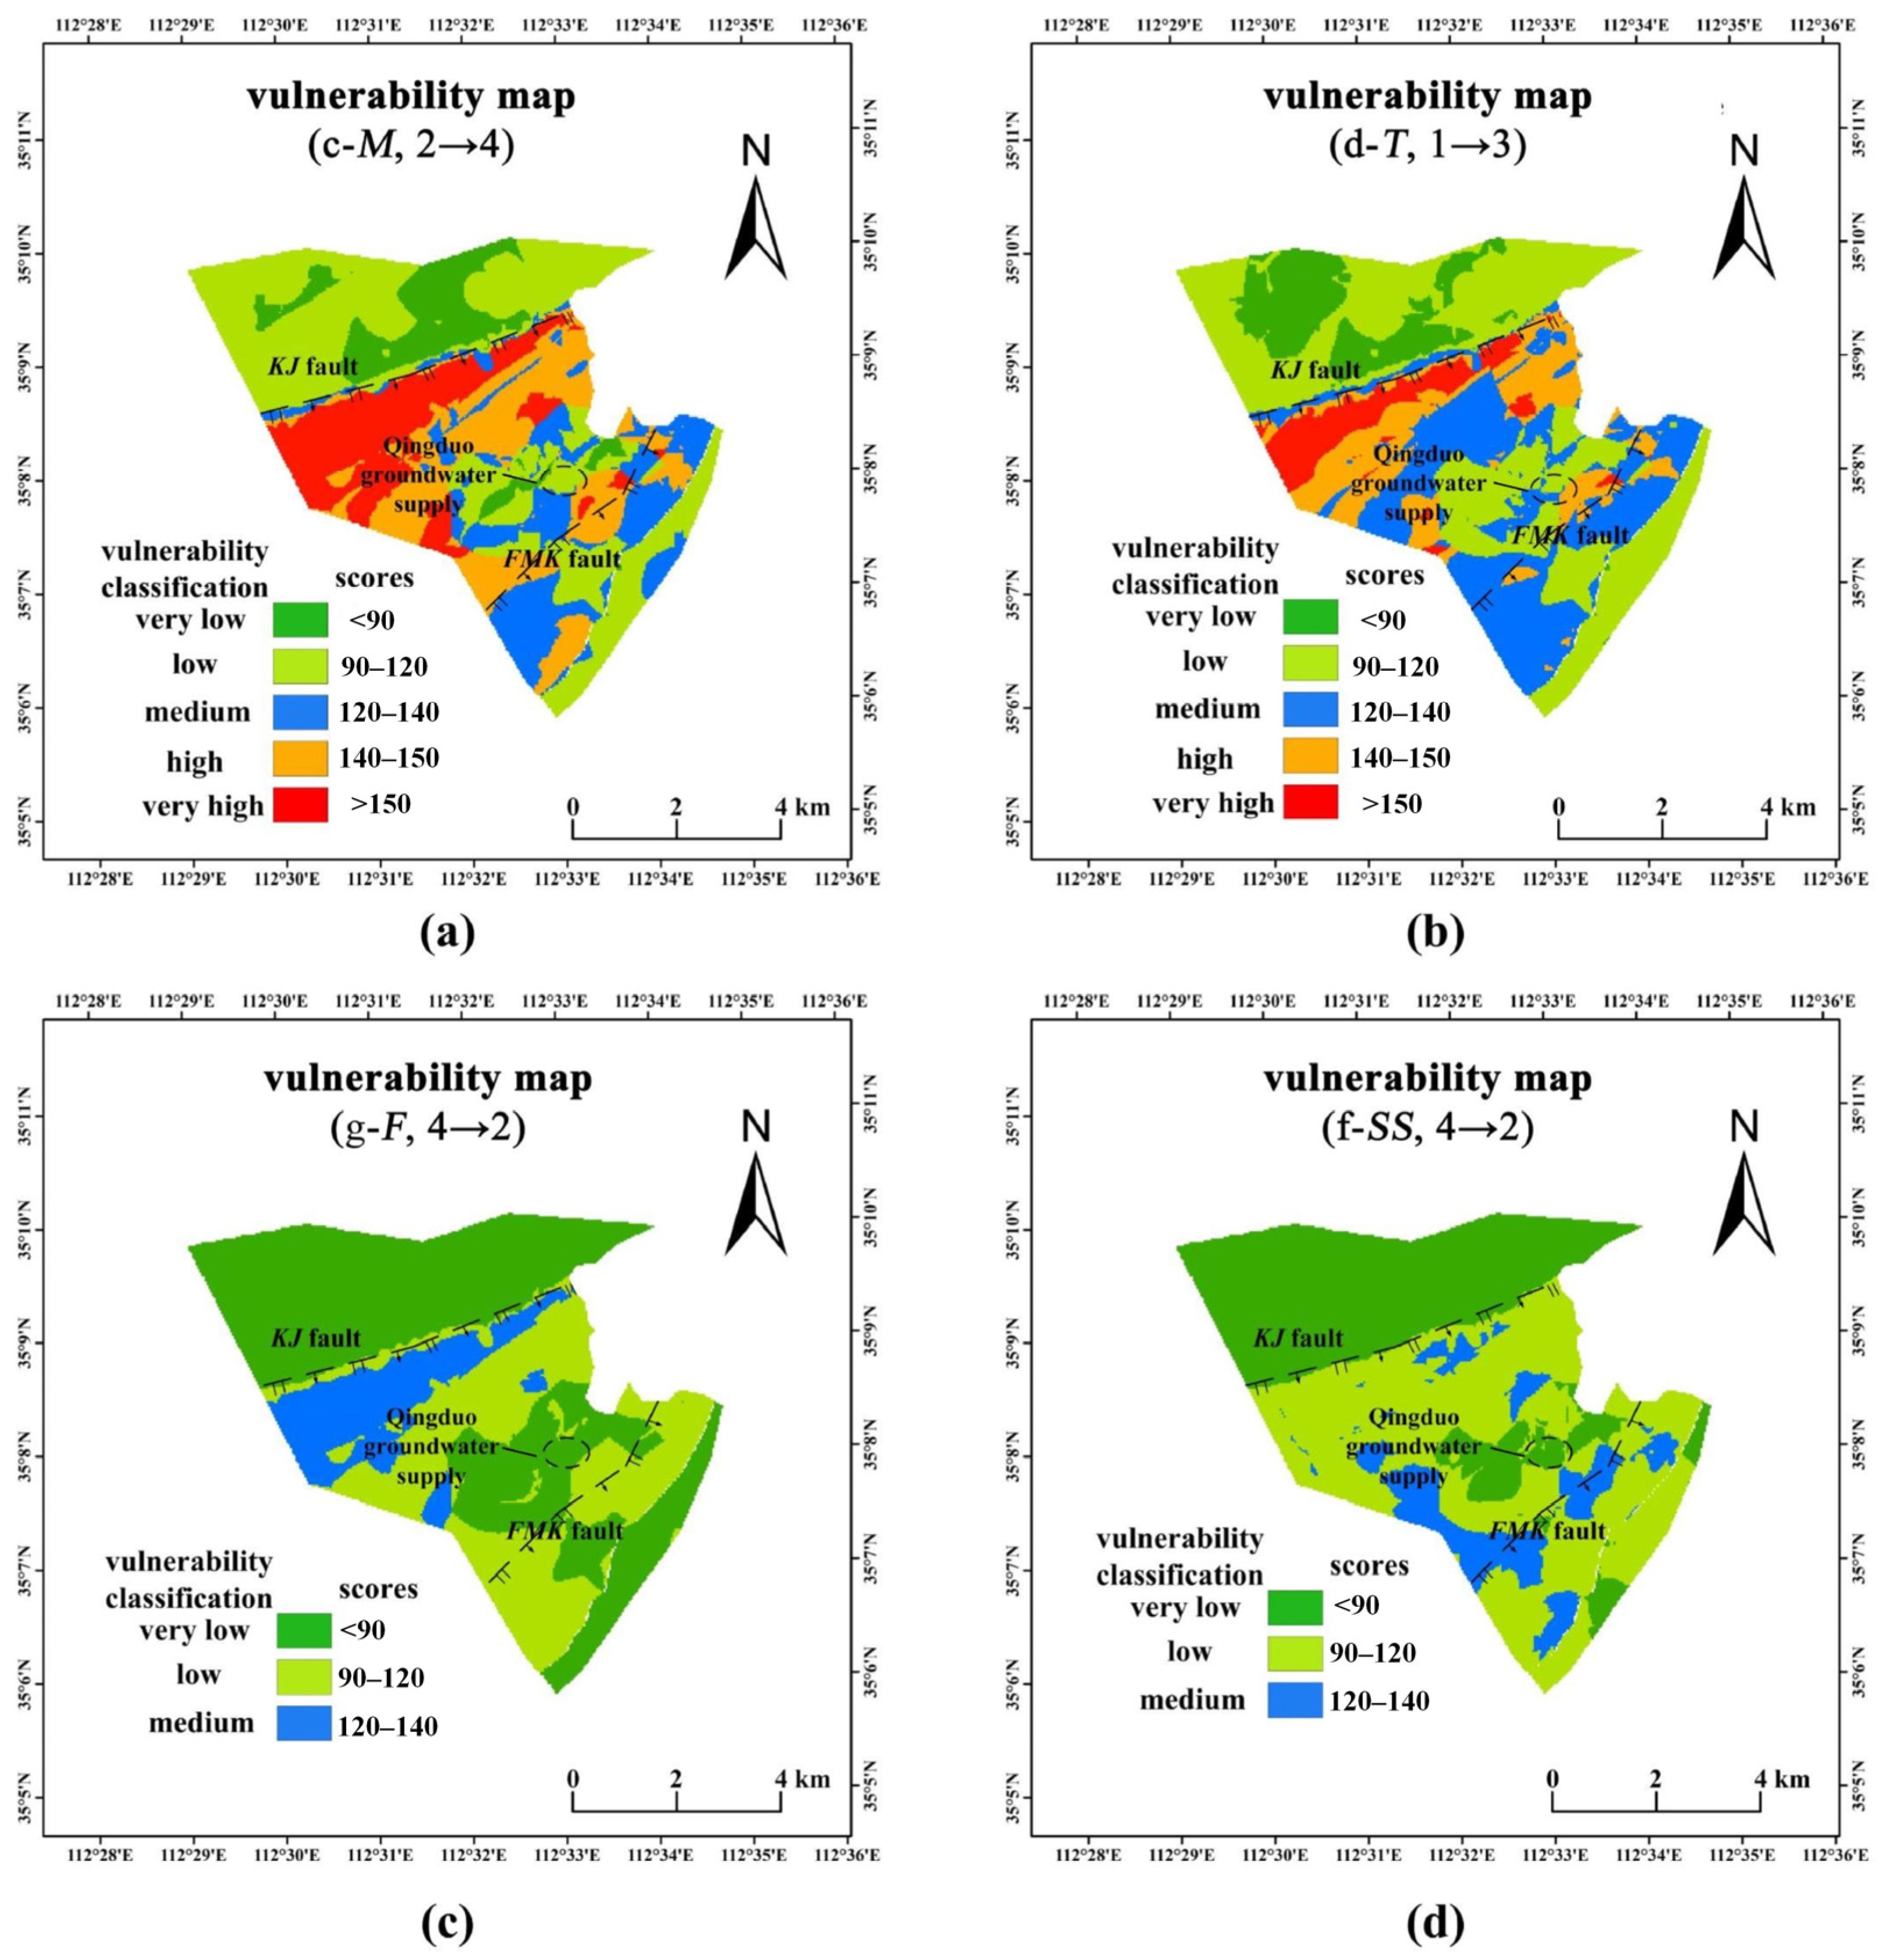
3.4. Sensitive Analysis of the Index Weight

The sensitivity of vulnerability results to index weight was assessed using a local sensitivity coefficient [67]. This coefficient measures the change in the system output, represented by the vulnerability score (Vi) at location i on a vulnerability map, resulting from variations in a specific parameter (i.e., the weight, Wj, of index j). The local sensitivity coefficient (Sij) of a weight (Wj) can be calculated at any location (i) using the following equation:
S i j = V i W j
In the context of a scaled aquifer vulnerability map, the vulnerability score varies across space due to distinct natural attributes, and its sensitivity to a specific weight (Wj) can vary spatially. To assess the overall impact of weight (Wj) changes on the aquifer’s vulnerability, a comprehensive local sensitivity coefficient (Swj) was employed. This coefficient can be determined by averaging the sensitivity coefficients (Sij) across all locations:
S w j = i = 1 n S i j n
where n represents the number of vulnerability scores for locations on the map. In accordance with the linear index formula used in the PISSR model of this study (Equation (1)), the partial derivative of weight Wj in location i (∂Vi/∂Wj, Equation (9)) corresponds to the score of that index (Iij). Thus, Equation (10) can be rewritten as follows:
S w j = i = 1 n i i j n = I j   ×   ω I  
where Ij represents the grading values (i.e., 1–10 in this study, as shown in Table 4) for index j, and ωI represents the percentage of surface area associated with each index value.
We can further analyze the effects of higher Sw values by examining how changes in the weights’ values impact the vulnerability map, including class distribution and the global vulnerability (Gv) parameter.

4. Results

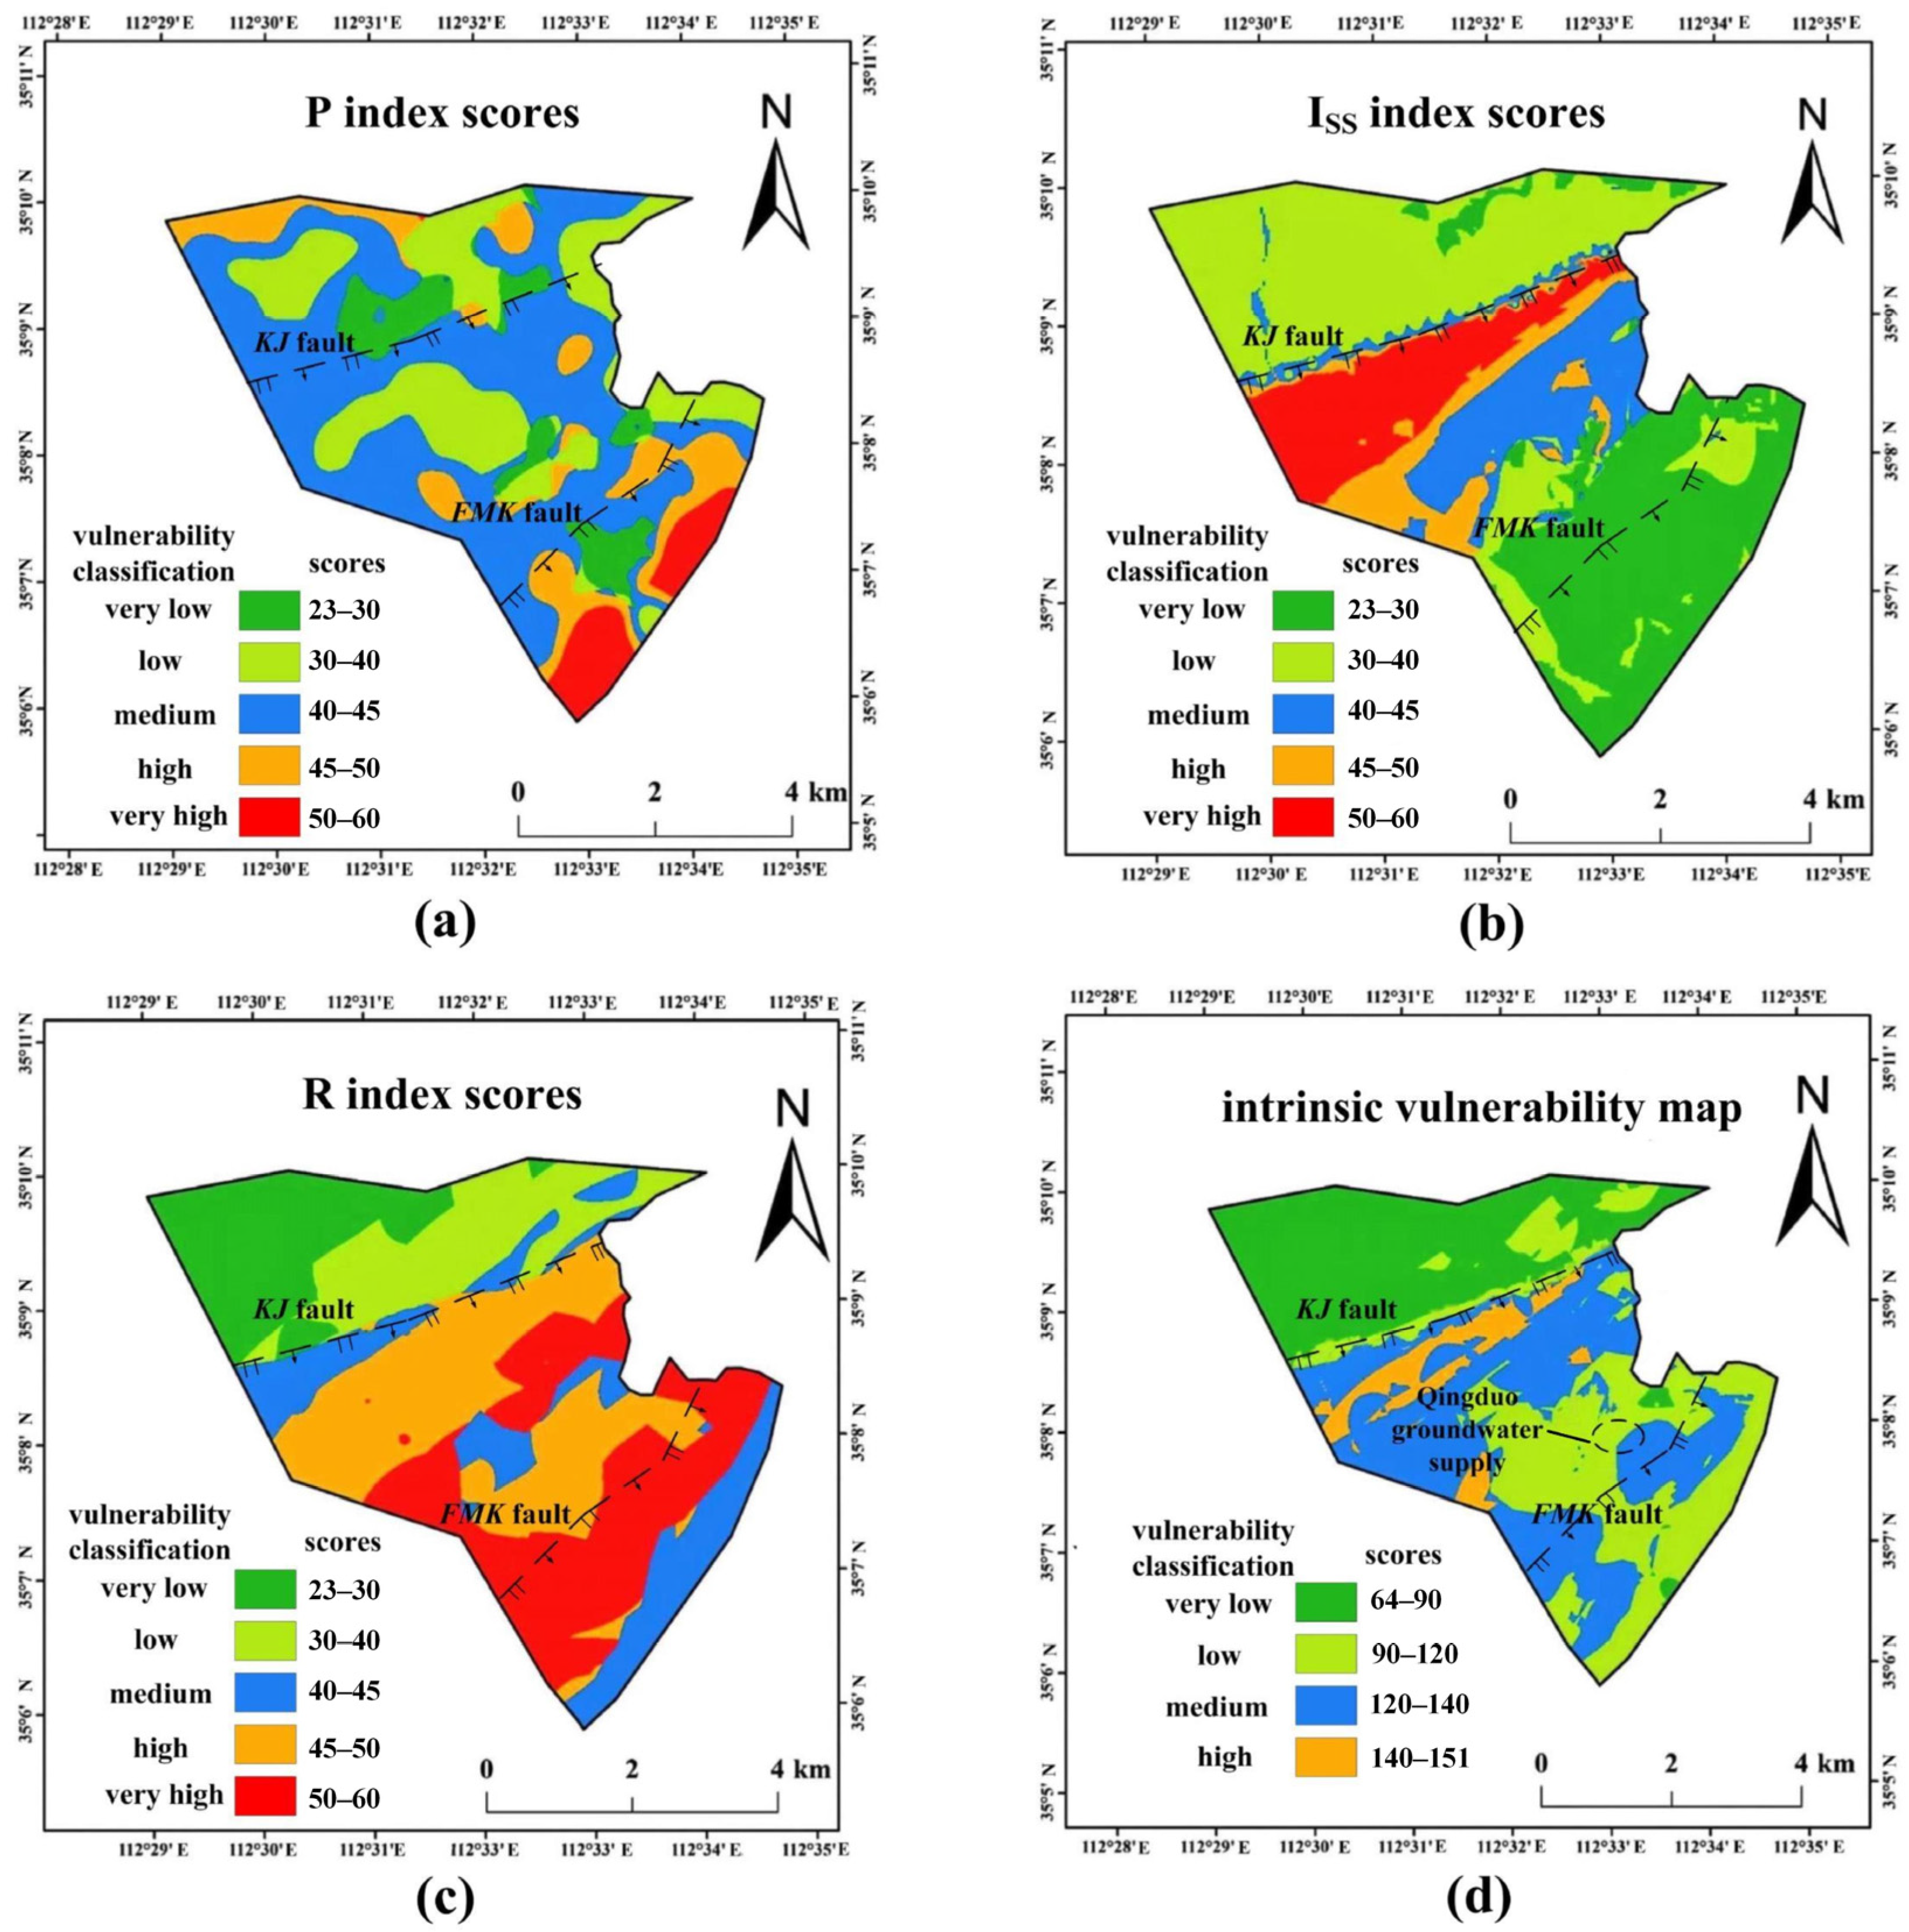
4.1. Spatial Distributions of the P, ISS, and R Scores

Scores of the protective layer (P), infiltration condition (ISS), and runoff condition (R) indexes in the study area were calculated and mapped using the ArcGIS (10.2) platform (Figure 3). The maps showed that the score distributions differentiated spatially into three regions: the north wall of the KJ fault, the area between the KJ and FMK faults, and the south plate of the FMK faults. The regions featured significantly different aquifer structures and groundwater flow characteristics; detailed descriptions of the hydrogeology can be found in Section 2.
The P indicator layer represented the vulnerability of the vadose layers, which were greatly impacted by the uneven distributions of the medium. The P scores ranged from 23 to 45 (average 40) in most of the study areas without a clear spatial pattern, except for the increasing vulnerability ratings (45–60) in the south, near the spring catchment (read areas in Figure 3a). This is because the highly permeable medium of the sand and gravel increasingly developed in this area, which lowered the protective ability of the sediments.
In the north plate of the KJ fault, the limestone is buried under 100-m-thick (coal-bearing) shales and sandstones with low permeability. Although this area is located upstream of the flow path due to its high terrain, the precipitation recharge for the buried karsts was very limited as it was blocked by the covering layer. The groundwater flow conditions in those strata were also poor because of the less developed fissures. Therefore, the scores of both the ISS and R indices were relatively lower in the north plate of the KJ fault (green areas in Figure 3b,c).
In the south wall of the KJ fault, the karst water became well-connected with the upper Q pore water and can be recharged by rainfall and irrigation water directly because the impermeable roof (C and P) upon the O limestone was missing. Therefore, the absolute recharge (If) increased, increasing the ISS scores (orange and red areas in Figure 3b). On the other hand, the upper loose sediments and the lower limestone with the dissolved pores and fissures composed a unified aquifer system that had higher permeability and good flow conditions (see higher R scores, orange, and red areas in Figure 3c). The limestone fractured as it was closer to the FMK faults (the main and secondary fault groups). The rock permeability increased, resulting in a higher rating of the R index (red belt in Figure 3c). However, the fault gauge developed in the hanging wall of the FMK main fault, resulting in parts of the limestone nearby being cemented, resulting in reduced rock permeability near the fault (see decreased R scores, presented as orange areas in Figure 3c).
Conversely, the FMK faults create zones of high transmissivity and expose deep karst water that was previously confined within the cemented portions of limestone. As a result, the buried karst water ascends through this fault damage zone, forming a localized discharge area within the karst flow system. The upwelling of the deep karst water retarded the shallow groundwater flow near the fault by decreasing the hydraulic gradient (Figure 1a). As a result, the residence time of contaminants in the surface or shallow subsurface was longer, reducing the likelihood of their reaching the lower karst aquifer or karst supply wells. According to the definition of absolute infiltration in this work (If, Equation (6)), the If volumes to the karst aquifer in this “sink” area were quite limited, and the ISS score came lower (blue areas in Figure 3b).
In addition, groundwater was also discharged as springs in the Wanquan area, as blocked by the impermeable mudstone and sandstone developed to the north and east. Both the infiltration and runoff conditions were low in this area; therefore, the scores of the ISS and R indexes were reduced (green and blue areas in Figure 3b,c).

4.2. Intrinsic Vulnerability of the Qingduo Karst

The intrinsic vulnerability map for pollution with the PISSR scores of the Qingduo karst is shown in Figure 3d. The vulnerability scores in the study area ranged from 64 to 151 and were graded into four levels according to Table 5: very low, low, medium, and high. The vulnerability of the karst system in the majority of areas (over 95%) was categorized as low to medium levels (green and blue areas in Figure 3d). Specifically, nearly 60% of the total area exhibited very low and low vulnerability, primarily concentrated in two regions: the northern side of the KJ fault, where the karsts are deeply buried, and the groundwater discharge zones surrounding the FMK faults and Wanquan springs, as indicated by the green areas in Figure 3d.
In contrast, the karst vulnerability escalated to a high level in the southern region of the KJ fault, as indicated by the orange areas in Figure 3d. In these areas, groundwater in karst (comprising less than 4% of the total area) was deemed to be more susceptible to contamination, likely due to higher surface replenishment. Additionally, medium-vulnerability areas (depicted in blue in Figure 3d) were distributed throughout the remaining portion, constituting approximately one-third of the study area. Assessing the vulnerability classes and their respective surface percentages, the global vulnerability (Gv) parameter for this site was calculated as 2.05, signifying a relatively lower sensitivity to pollution.

5. Discussion

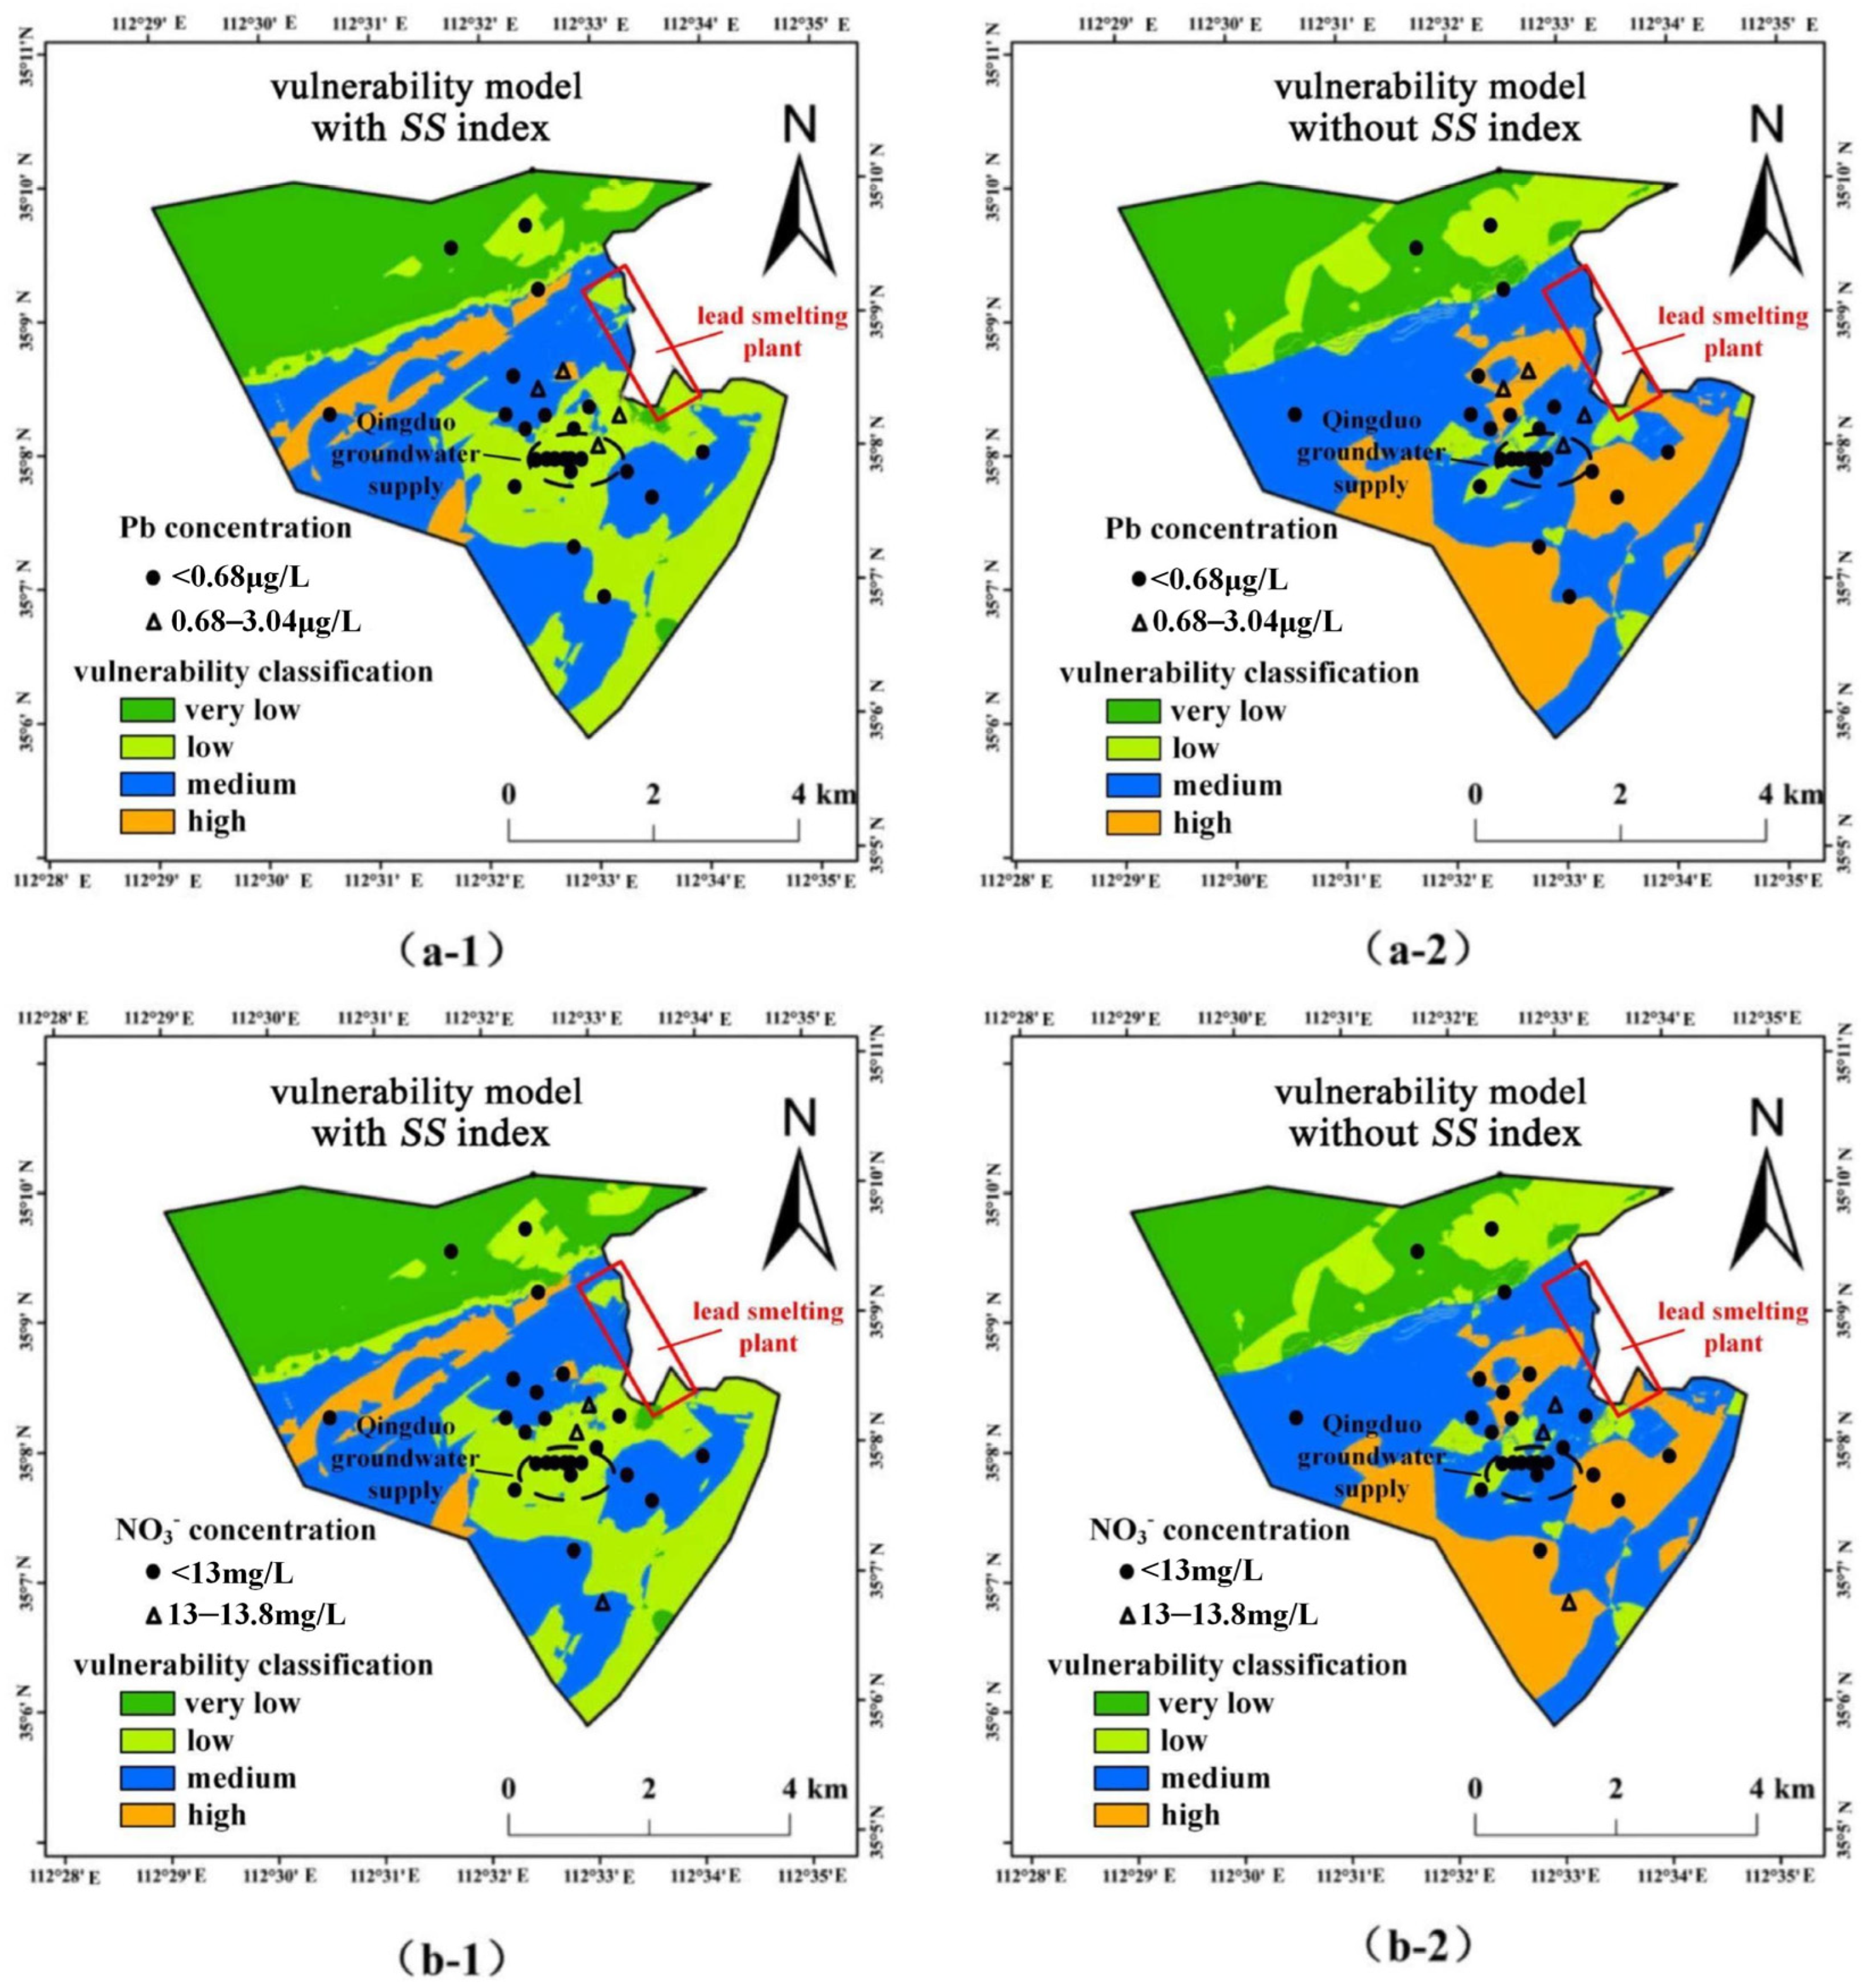
5.1. Validation of the PISSR Index Model

The groundwater flow system has a significant impact on the groundwater intrinsic vulnerability as well as the aquifer system because the flow is the main driving force of pollutant migration and distribution [11,12]. Vulnerability assessment without identifying the groundwater cycling path, including sources and sinks, may cause a deviation from the evaluation results. Taking this case as an example, the content distributions (mg/L) of the dissolved lead (Pb, ug/L) and nitrate (NO3, calculated in N, mg/L) from 29 sampling wells in the study area are shown in Figure 4. The Pb and NO3 contents from all sites have not exceeded the Class III standard values (10 ug/L for Pb and 20 mg/L for NO3, GB/T 14848-2017) [44], including zones near the lead industrial park (Figure 4). The high outlier values of Pb and NO3 in groundwater were 0.68 ug/L and 13 mg/L, respectively, according to the quartile method. It turns out that over 85% of the Pb and NO3 contents have not exceeded the high outlier values (small dots in Figure 4), and the main hydrogeochemical type was HCO3-Ca-Mg. The observed groundwater quality indices implied that the groundwater has not been much affected by the surface pollutants, given that much heavier pollution of heavy metals and nitrate was observed in ambient soil and surface water (Table 2).
The limited groundwater pollution in the study area can be predominantly credited to the distinctive groundwater discharge or overflow pattern, complemented by the protective influence of the thick vadose zones. In general, the central and southern regions of the study area were situated within large groundwater discharge zones influenced by the faults, which initially hindered the downward infiltration of surface pollutants. Furthermore, the vulnerability map based on the PISSR index model considering the sources and sinks (SS) generally agreed with the distributions of the measured groundwater quality indicators of Pb and NO3 (Figure 4a-1,b-1). Conversely, the groundwater vulnerability would be overestimated without taking the SS index into account. If the direction of upward flow remains unidentified, the fault damage zone may be mistakenly interpreted as a facilitated pathway for contaminant infiltration in a conventional manner. In such a scenario, the medium- to high-vulnerability areas would extend across a significant portion of the study area, particularly in the vicinity of the FMK faults (blue and orange areas in Figure 4a-2,b-2).

5.2. Sensitive Analysis of the Index Weight

In this paper, the weight assigned to each vulnerability index primarily relied on the widely accepted expert scoring method. We determined the order of importance for the eight indices (see Table 3) regarding groundwater intrinsic vulnerability based on insights from previous studies and local hydrogeological conditions [46,47,48,49,50,51,52,53]. Specifically, in this study, we considered assessment indices such as vadose zone lithology and thickness (LV and DV), source and sink (SS), and fault damage zone (F) to be of moderate to high importance to the vulnerability results, with weight values set above 3. Conversely, indices like terrain slope (T) and land usage (Lu) were regarded as having a lower impact on the model outcomes, with weight values set at 1. It should be noted that the groundwater vulnerability index represents the relative sensitivity of groundwater systems to external contamination. While statistical methods like the Analytical Hierarchy Process (AHP) and Data-Driven Approaches [68,69] have been employed for objective indicator weight determination in groundwater vulnerability assessments, it is important to note that our study primarily focuses on identifying key indices related to the groundwater flow system. Therefore, we have opted to use sensitivity analysis to evaluate the influence of varying weight assignments on vulnerability results, as the comprehensive application of statistical methods is beyond the scope of our research.
Based on the local sensitivity coefficients (Sw) for the eight weights provided in Table 6, it is evident that the intrinsic vulnerability results are more sensitive to changes in the weights of the following indices: topsoil medium (c-M), terrain slope (d-T), fault damage zone (g-F), and source and sinks (f-SS), with Sw values of 8.94, 7.16, 6.13, and 4.12, respectively. In contrast, the Sw values for other index weights were relatively lower, ranging from 2.73 to 3.07. The Sw value for each weight is determined by the weighted average score of the corresponding index, following the linear function used in this study—a common approach in previous vulnerability assessments [70,71,72]. In the linear model of index superposition, greater attention should be given to the weight assignment of indices with higher scores and wider distributions.
We conducted a detailed analysis of the variations in intrinsic vulnerability results resulting from different assignments of high-sensitivity weights (c-M, d-T, g-F, and f-SS). When we increased the weight of the surface soil medium (c-M) from 2 (mild importance) to 4 (high importance), the percentage distribution of high and very high vulnerabilities on the surface increased substantially from approximately 4% in the base model to over 35%. Concurrently, the Gv parameter rose by more than 40% (see Figure 5). Similarly, elevating the weight of the terrain slope (d-T) from 1 (low importance) to 3 (moderate importance) resulted in an almost 30% increase in the Gv parameter, primarily because the percentage distribution of high and very high vulnerabilities increased by over 20% (see Figure 5). Conversely, reducing the weights of the fault damage zone (g-F) and source and sinks (f-SS) from 4 (high importance) to 2 (mild importance) led to vulnerabilities falling below the medium level and a decrease in the Gv parameter by 22% and 16%, respectively (see Figure 5). Significantly, even as highly sensitive weights were adjusted, resulting in substantial fluctuations of up to 40% in global vulnerability values, more than 80% of the karst aquifer surrounding the Qingduo source supply consistently exhibited low to very low vulnerability levels (see Figure 6). This agreed with the validation from groundwater chemistry data of Pb and NO3 (see Figure 4a-1,b-1).

5.3. Implications for a Dynamic Vulnerability Assessment

The sources and sinks (SS) index serves as a simplified means to semi-quantitatively characterize the groundwater flow system, holding significant importance in groundwater vulnerability assessment. Additionally, it serves as a crucial reminder of the dynamic changes in groundwater circulation and the resulting pollution risks, which are influenced by both natural processes and human activities.
Presently, the low intrinsic vulnerability observed in the study area can be primarily attributed to a natural flow barrier created by the upwelling of deep karst water through faults located near the polluted area. Nevertheless, historical data revealed a concerning trend: the volume of overflow springs in Wanquan declined from 3.5 m3/d in 1970 to a mere 0.3 m3/d in 2010. Additionally, the fault springs of FMK have completely disappeared since the 1980s, owing to prolonged centralized pumping and mine drainage practices. The reduction in the upward flow of the karst water suggests an elevated risk of surface pollutant infiltration due to the weakening of the natural flow barrier.
Furthermore, the level of heavy metal pollution in soil, coupled with elevated nitrate concentrations in surface water, indicates the need for ongoing caution to prevent the potential migration of near-surface pollution into groundwater. This becomes especially crucial if the current high rate of water usage persists, necessitating careful consideration of both pollution prevention and the sustainable yield of groundwater resources in the future.

6. Conclusions

This study focused on assessing groundwater intrinsic vulnerability in the Qingduo karst resource area, which provides drinking water for domestic use and is located near an industrial pollution site. An improved index-based vulnerability assessment model, known as PISSR, was developed. This model takes the unique characteristics of the karst system in Northern China into account and highlights the influence of sources and sinks (SS) distributions in the groundwater flow system. A 3-D geological model was utilized to obtain hydrogeological factors for the assessment model. Subsequently, an intrinsic vulnerability map of the Qingduo groundwater was created using GIS techniques.
The intrinsic vulnerability map reveals that the majority of the karst resources in the study area (>95%) exhibit low to medium vulnerability to pollution. This lower vulnerability of Qingduo karst water primarily results from the upward outflow of the karst via the FMK faults, which acts as a barrier, slowing down the downward penetration of surface or near-subsurface pollutants and establishing a ‘flow buffering’ effect against contamination. In this paper, we introduced the assessment index of sources and sinks (SS), which reflects the absolute infiltration intensity and migration ability of surface pollution influenced by hydraulic conditions. The inclusion of the SS index is crucial for a more accurate vulnerability assessment. The vulnerability map generated using the PISSR index model with the SS index aligns better with the observed groundwater quality distribution of dissolved Pb and NO3 compared to the model without the SS index.
Furthermore, the sensitivity analysis indicated that the weight assignments of the topsoil medium (c-M), terrain slope (d-T), fault damage zone (g-F), and source and sinks (f-SS) exerted more significant influences on the vulnerability map. However, it is worth noting that the vulnerability assessment of the ambient karst aquifers surrounding the Qingduo wellfield appeared to be less affected by these weight adjustments.
In the future, as the extraction of karst water increases, it may lead to reduced outflow in groundwater sinks and an elevation in the absolute infiltration of surface pollutants. Consequently, this could escalate the pollution risks within the aquifer. Hence, it is not advisable to promote further exploitation in aquifers already burdened with contamination and possessing a delicate flow-buffering capacity. The incorporation of the sources and sinks (SS) index has significant implications for assessing the long-term vulnerability or risk of an aquifer, considering the integrity and dynamism of the groundwater flow system.

Author Contributions

Conceptualization, B.X.; investigation, W.C. and L.Y. (Li Yang); methodology, B.X.; resources, B.X. and W.C.; software, L.Y. (Leihao Yin); validation, L.Y. (Leihao Yin); writing—original draft, L.Y. (Leihao Yin); writing—review and editing, B.X. and P.Z. All authors have read and agreed to the published version of the manuscript.

Funding

This research was funded by the National Natural Science Foundation of China (Grant 41807189), the China Geological Survey (12120115047901 and DD20160310), and the Guangdong Provincial Key Laboratory of Soil and Groundwater Pollution Control (Grant 2017B030301012). Field assistance from Y. Li, J.T. Liu, M.G. Wang, and S.L. Liu is gratefully acknowledged. The authors would like to thank Prof. G.C. Wang of the China University of Geosciences for the valuable comments.

Data Availability Statement

The data presented in this study are available on request from the corresponding author. The data are not publicly available due to [Confidentiality principle].

Conflicts of Interest

The authors declare no conflict of interest.

References

  1. Rajput, H.; Goyal, R.; Brighu, U. Modification and optimization of DRASTIC model for groundwater vulnerability and contamination risk assessment for Bhiwadi region of Rajasthan, India. Environ. Earth Sci. 2020, 79, 136. [Google Scholar] [CrossRef]
  2. Jin, Y.X.; Wu, G.Y.; Zhang, F.Y. Application of DRASTIC model based on GIS in groundwater vulnerability assessment of Qinhuangdao Plain area. Water Resour. Dev. Manag. 2019, 17, 26–31. [Google Scholar]
  3. Jia, X.Q.; Liu, J.; Luo, M.M.; Zhou, H. Groundwater vulnerability assessment of Xiangxi river karst basin based on modified DRASTIC model. Bull. Geol. Sci. Technol. 2019, 38, 255–261. [Google Scholar]
  4. Medici, G.; Lorenzi, V.; Sbarbati, C.; Manetta, M.; Petitta, M. Structural classification, discharge statistics, and recession analysis from the springs of the Gran Sasso (Italy) carbonate aquifer; comparison with selected analogues worldwide. Sustainability 2023, 17, 10125. [Google Scholar] [CrossRef]
  5. Aller, L.; Robert, S. DRASTIC: A Standardized System for Evaluating Groundwater Pollution Potential Using Hydrogeologic Settings; Kerr Environmental Research Laboratory, Environmental Protection Agency: Ada, OK, USA, 1985. [Google Scholar]
  6. Gogu, R.C.; Dassargues, A. Current trends and future challenges in groundwater vulnerability assessment using overlay and index methods. Environ. Geol. 2000, 39, 549–559. [Google Scholar] [CrossRef]
  7. Doerfliger, N.; Jeannin, P.; Zwahlen, F. Water vulnerability assessment in karst environments: A new method of defining protection areas using a multi-attribute approach and GIS tools (EPIK method). Environ. Geol. 1999, 39, 165–176. [Google Scholar] [CrossRef]
  8. Ducci, D.; Sellerino, M. Vulnerability mapping of groundwater contamination based on 3D lithostrati-graphical models of porous aquifers. Sci. Total Environ. 2013, 447, 315–322. [Google Scholar] [CrossRef]
  9. Zhang, W.; Zhao, X.; Wu, Y.K. Evaluation of groundwater vulnerability in Baiyin District of Baiyin City based on GIS and DRASTIC models. Ground Water 2021, 6, 32–35. [Google Scholar]
  10. Huang, D. Study on Groundwater Vulnerability of Beijing Plain. Master’s Thesis, Capital Normal University, Beijing, China, 2009. [Google Scholar]
  11. Chen, J.Y.; Tang, C.Y.; Sakura, Y.; Yu, J.J.; Fukushima, Y. Nitrate pollution from agriculture in different hydrogeological zones of the regional groundwater flow system in the North China Plain. Hydrogeol. J. 2005, 13, 481–492. [Google Scholar] [CrossRef]
  12. Nakaya, S.; Natsume, H.; Masuda, H.; Mitamura, M.; Biswas, D.K.; Seddique, A.A. Effect of groundwater flow on forming arsenic contaminated groundwater in Sonargaon, Bangladesh. J. Hydrol. 2011, 409, 724–736. [Google Scholar] [CrossRef]
  13. Zhang, R.Q.; Liang, X.J.; On, M.G. Researches and practices in hydrogeology and environmental geology for sustainable development. Hydrogeol. Eng. Geol. 2004, 48, 82–86. [Google Scholar]
  14. Tóth, J. Gravitational Systems of Groundwater Flow: Theory, Evaluation, Utilization; Cambridge University Press: Cambridge, UK, 2009. [Google Scholar]
  15. Wang, P.; Jin, M.G.; Lu, D.C.; Guo, W.X. Distribution characteristics and source identification of shallow groundwater pollution in Yongcheng City. Bull. Geol. Sci. Technol. 2022, 41, 260–268. [Google Scholar]
  16. Krogulec, E.; Zabłocki, S.; Zadrożna, D. Variability of intrinsic groundwater vulnerability to pollution in river valley due to groundwater depth and recharge changes. Appl. Sci. 2019, 9, 1133. [Google Scholar] [CrossRef]
  17. Wang, X.; Ma, B.Q.; Tang, C.; Zhang, W.T.; Song, R.; Wang, C.C. Groundwater pollution risk assessment based on grading index method: A case study in plain area of Jiayuguan City, Gansu Province. Environ. Pollut. Control. 2021, 43, 1555–1561. [Google Scholar]
  18. Yan, R. Risk Assessment of Groundwater Pollution in Typical Metal Mining Area of Tongling. Master’s Thesis, China University of Geosciences, Beijing, China, 2020. [Google Scholar]
  19. Witkowski, A.J.; Kowalczyk, A.; Vrba, J. Groundwater Vulnerability Assessment and Mapping; IAH Selected Papers; Taylor & Francis: London, UK, 2007; Volume 11, pp. 1–260. [Google Scholar]
  20. Witkowski, A.J.; Jakóbczyk-Karpierz, S.; Czekaj, J.; Grabala, D. Groundwater Vulnerability and Pollution Risk Assessment; IAH Selected Papers; Taylor & Francis: London, UK, 2020; Volume 24, pp. 1–214. [Google Scholar]
  21. Tilahun, K.; Merkel, B. Assessment of groundwater vulnerability to pollution in Dire Dawa, Ethiopia using DRASTIC. Environ. Earth Sci. 2010, 59, 1485–1496. [Google Scholar] [CrossRef]
  22. Salem, Z.E.; Sefelnasr, A.M.; Hasan, S.S. Assessment of groundwater vulnerability for pollution using DRASTIC Index, young alluvial plain, Western Nile Delta, Egypt. Arab. J. Geosci. 2019, 12, 727. [Google Scholar] [CrossRef]
  23. Yang, N.; Tao, Z.B.; Gao, S.; Wang, Y.F.; Yu, L.H. Study of groundwater vulnerability in Laizhou using AHP–based DRASTIC model. Acta Geol. Sin. 2019, 93, 133–137. [Google Scholar]
  24. Wu, Z.H. Application of improved DRASTIC model in groundwater vulnerability assessment of Pingtan Island. Hydraul. Sci. Technol. 2021, 1, 1–4. [Google Scholar]
  25. Babiker, I.S.; Mohamed, M.A.A.; Hiyama, T.; Kato, K. A GIS-based DRASTIC model for assessing aquifer vulnerability in Kakamigahara Heights, Gifu Prefecture, central Japan. Sci. Total Environ. 2005, 1–3, 127–140. [Google Scholar] [CrossRef]
  26. Sekar, S.; Kamaraj, J.; Poovalingam, S.; Duraisamy, R.; Senapathi, V.; Yong, C.S. Appraisal of Groundwater Vulnerability Pollution Mapping Using GIS Based GOD Index in Tiruchendur, Thoothukudi District, India. Water 2023, 3, 520. [Google Scholar] [CrossRef]
  27. Sartika, D.; Muhni, A.; Rifqan, R.; Putra, H.S. Groundwater vulnerability to pollution using the GOD method in Banda Aceh City, Aceh Province. J. Aceh Phys. Soc. 2020, 3, 84–90. [Google Scholar] [CrossRef]
  28. Vias, J.M.; Andreo, B.; Perles, M.J.; Carrasco, F. A comparative study of four schemes for groundwater vulnerability mapping in a diffuse flow carbonate aquifer under mediterranean climatic conditions. Environ. Geol. 2005, 4, 586–595. [Google Scholar] [CrossRef]
  29. Putranto, T.T.; Santi, N.; Widiarso, D.A.; Pamungkas, D.; Setiadji, B.H.; Han, A.L.; Widodo, A.; Setiawan, J.D.; Kurdi, O.; Hatmoko, J.U.D. Application of Aquifer Vulnerability Index (AVI) method to assess groundwater vulnerability to contamination in Semarang urban area. MATEC Web Conf. 2018, 159, 01036. [Google Scholar] [CrossRef]
  30. Riyanto, I.A.; Widyastuti, M.; Cahyadi, A.; Agniy, R.F.; Adji, T.N. Groundwater management based on vulnerability to contamination in the tropical karst region of guntur spring, gunungsewu karst, java island, Indonesia. Environ. Process. 2020, 4, 1277–1302. [Google Scholar] [CrossRef]
  31. Xu, H.Z.; Gao, Z.D. Assessment of groundwater vulnerability in karst areas using pi method. Xinjiang Geol. 2006, 3, 318–321. [Google Scholar]
  32. Bagherzadeh, S.; Kalantari, N.; Nobandegani, A.F.; Derakhshan, Z.; Cont, G.O.; Ferrante, M.; Malekahmadi, R. Groundwater vulnerability assessment in karstic aquifers using COP method. Environ. Sci. Pollut. Res. 2018, 25, 18960–18979. [Google Scholar] [CrossRef]
  33. Sun, S.Y.; Ma, J.C.; Liu, Q.G.; Li, S.J.; Yang, N.; Pan, M. Evaluation model and its improvement of vulnerability of karst water in North China. Urban Geol. 2017, 12, 87–90. [Google Scholar]
  34. Du, S.S.; Wang, H.Q.; Liu, S.Y. A groundwater vulnerability assessment method based on typical karst region in north China. Environ. Sci. Technol. 2014, S1, 471–475. [Google Scholar]
  35. Yang, R.F.; Jin, H.; Hao, X.Y.; Liu, H.; Wang, X.; Zhang, Y. Assessment of karst groundwater vulnerability in xin’an spring area based on modified riske model. Environ. Ence Technol. 2016, 39, 170–174. [Google Scholar]
  36. Guo, Y.L.; Zhai, Y.Z.; Wu, Q.; Teng, Y.G.; Jiang, G.H.; Wang, J.S.; Guo, F.; Tang, Q.J.; Liu, S.H. Proposed aplie method for groundwater vulnerability assessment in karst-phreatic aquifer, shandong province, China: A case study. Environ. Earth Sci. 2016, 2, 1–14. [Google Scholar] [CrossRef]
  37. Hao, X.Y.; Jin, H.; Yang, R.F.; Liu, H. Groundwater vulnerability evaluation in the northern karst areas. Yellow River 2015, 37, 77–80. [Google Scholar]
  38. Yu, H.; Wang, Z.X.; Liu, F.T.; Jiang, W.J.; Chang, W.; Zhang, J.; Wan, J.W. Genesis of karst groundwater contamination based on system spatial feature recognition. Bull. Geol. Sci. Technol. 2022, 41, 367–376. [Google Scholar]
  39. Sahu, I.; Prasad, A.D.; Ahmad, I. Groundwater vulnerability assessment using sintacs model and gis: A case study in raipur city. IOP Conf. Ser. Earth Environ. Sci. 2021, 982, 012070. [Google Scholar] [CrossRef]
  40. Civita, M.; Maio, M.D. Assessing and mapping groundwater vulnerability to contamination: The Italian “combined” approach. Geofísica Int. 2004, 4, 513–532. [Google Scholar] [CrossRef]
  41. Roohollah, N.; Hooman, G. Modified-drastic, modified-sintacs and si methods for groundwater vulnerability assessment in the southern tehran aquifer. J. Environ. Sci. Health Part A Toxic Hazard. Subst. Environ. Eng. 2018, 54, 89–100. [Google Scholar]
  42. Ghouili, N.; Jarraya-Horriche, F.; Hamzaoui, F.; Zagrarni, M.F.; Zammouri, M. Groundwater vulnerability mapping using the susceptibility index (si) method: Case study of takelsa aquifer, northeastern tunisia. J. Afr. Earth Sci. 2020, 173, 104035. [Google Scholar] [CrossRef]
  43. GB/T 15618–2018; Soil Environmental Quality Risk Control Standard for Soil Contamination of Agricultural Land. Ministry of Ecology and Environment of the People’s Republic of China: Beijing, China, 2018.
  44. GB/T 14848-2017; Quality Standard for Ground Water. General Administration of Quality Supervision, Inspection and Quarantine of the People’s Republic of China: Beijing, China, 2017.
  45. Zhu, X.B. Groundwater modeling system (GMS) software. Hydrogeol. Eng. Geol. 2003, 47, 53–55. [Google Scholar]
  46. Goldscheider, N.; Klute, M.; Sturm, S.; Hotzl, H. The PI method-a GIS based approach to mapping groundwater vulnerability with special consideration on karst aquifers. Z Anget Geol. 2000, 46, 157–166. [Google Scholar]
  47. Abdullah, T.O.; Ali, S.S.; Al-Ansari, N.A.; Knutsson, S. Groundwater vulnerability mapping using lineament density on standard drastic model: Case study in Halabja Saidsadiq basin, Kurdistan region, Iraq. Engineering 2015, 10, 644–667. [Google Scholar] [CrossRef]
  48. Xin, L.T.; Lv, H.; Gao, Z.D.; Zhou, R. Evaluation of groundwater vulnerability in karst areas using COP method. Nonferrous Met. Eng. 2009, 61, 138–142. [Google Scholar]
  49. Villholth, K.G.; Rajasooriyar, L.D. Groundwater resources and management challenges in sri lanka—An overview. Water Resour. Manag. 2010, 8, 1489–1513. [Google Scholar] [CrossRef]
  50. Barbulescu, A. Assessing groundwater vulnerability: DRASTIC and DRASTIC-like methods: A review. Water 2020, 5, 1356. [Google Scholar] [CrossRef]
  51. Saatsaz, M.; Sulaiman, A.N.W.; Eslamian, S.; Mohammadi, K. GIS DRASTIC model for groundwater vulnerability estimation of Astaneh-Kouchesfahan Plain, Northern Iran. Int. J. Water 2011, 1, 1–14. [Google Scholar] [CrossRef]
  52. Jesiya, N.P.; Gopinath, G. A Customized FuzzyAHP-GIS based DRASTIC-L model for intrinsic groundwater vulnerability assessment of urban and peri urban phreatic aquifer clusters. Groundw. Sustain. Dev. 2019, 8, 654–666. [Google Scholar] [CrossRef]
  53. Technical Guide for Regional Shallow Groundwater Vulnerability Assessment; Institute of Hydrogeology and Environmental Geology, Chinese Academy of Geological Sciences: Beijing, China, 2012.
  54. Handbook of Hydrogeology, 2nd ed.; China Geological Survey: Beijing, China, 2012.
  55. Wang, X.M.; Yin, X.T. Vulnerability assessment of groundwater based on DRECT. J. Hunan Univ. Sci. Technol. Nat. Sci. Ed. 2011, 26, 69–73. [Google Scholar]
  56. Zhang, P.; Zhen, X.Q.; Zang, H.F. Assessment of karst groundwater vulnerability in Jinci spring area based on revised PI method. Yellow River 2016, 38, 47–51. [Google Scholar]
  57. Saidi, S.; Bouri, S.; Dhia, B.H.; Anselme, B. Assessment of groundwater risk using intrinsic vulnerability and hazard mapping: Application to Souassi aquifer, Tunisian Sahel. Agric. Water Manag. 2011, 10, 1671–1682. [Google Scholar] [CrossRef]
  58. Li, J.Z. An analysis of the coefficient of replenishment from infiltration of precipitation. Hydrogeol. Eng. Geol. 2009, 36, 29–33. [Google Scholar]
  59. Zhao, L.J.; Chen, G.B.; Shao, X.J. Study on technical conditions of groundwater exploitation in Jiyuan Manghe plain. Henan Water Resour. South North Water Divers. 2011, 56, 72–74. [Google Scholar]
  60. Yang, L.; Heng, T.; Yang, G.; Gu, X.; Wang, J.; He, X. Analysis of Factors Influencing Effective Utilization Coefficient of Irrigation Water in the Manas River Basin. Water 2021, 13, 189. [Google Scholar] [CrossRef]
  61. Zhang, Y.S.; Lu, Z.G.; Wang, M.; Qin, H.X.; Wang, Y.P.; He, G.; Qiu, X.Q. Calculation and analysis of irrigation water use efficiency of Henan province. China Rural Water Hydropower 2017, 1, 9–12. [Google Scholar]
  62. Xu, B.Y.; Cai, W.T.; Zhen, Y. Geologic structure forms flow barrier to increase resilience of Qingduo groundwater supply aquifer in Jiyuan basin. In Proceedings of the 8th International Conference on Medical Geology, Guiyang, China, 12–15 August 2019. [Google Scholar]
  63. Denny, S.C.; Allen, D.M.; Journeay, J.M. DRASTIC-Fm: A modified vulnerability mapping method for structurally controlled aquifers in the southern Gulf Islands, British Columbia, Canada. Hydrogeol. J. 2007, 15, 483–493. [Google Scholar] [CrossRef]
  64. Syafarini, H.; Hendrayana, H.; Winardi, S. Application of the APLIS Method for Groundwater Vulnerability Assessment in Rote Island Karst Areas. IOP Conf. Ser. Earth Environ. Sci. 2021, 926, 012071. [Google Scholar] [CrossRef]
  65. Vias, J.; Andreo, B.; Ravbar, N.; Hoetzl, H. Mapping the vulnerability of groundwater to the contamination of four carbonate aquifers in Europe. J. Environ. Manag. 2010, 7, 1500–1510. [Google Scholar] [CrossRef]
  66. Deepesh, M.; Kumar, J.M.; Singh, V.P.; Chinchu, M. Assessment and mapping of groundwater vulnerability to pollution: Current status and challenges. Earth Sci. Rev. 2018, 185, 901–927. [Google Scholar]
  67. Tamás, T. Sensitivity analysis in chemical kinetics. Int. J. Chem. Kinet. 2008, 40, 685–686. [Google Scholar]
  68. Focazio, J.; Reilly, T.E.; Rupert, M.G.; Helsel, D.R. Assessing Ground-Water Vulnerability to Contamination: Providing Scientifically Defensible Information for Decision Makers; U.S. Geological Survey Circular; US Government Printing Office: Washington, DC, USA, 2002; Volume 1224.
  69. Mair, A.; El-Kadi, A.I. Logistic regression modeling to assess groundwater vulnerability to contamination in Hawaii, USA. J. Contam. Hydrol. 2013, 153C, 1–23. [Google Scholar] [CrossRef]
  70. Polemio, M.; Casarano, D.; Limoni, P.P. Karstic aquifer vulnerability assessment methods and results at a test site (Apulia, southern Italy). Nat. Hazards Earth Syst. Sci. 2009, 4, 1461–1470. [Google Scholar] [CrossRef]
  71. Tayer, T.D.C.; Leila, N.M.V. Assessment of intrinsic vulnerability to the contamination of karst aquifer using the cop method in the carste lagoa santa environmental protection unit, Brazil. Environ. Earth Ences 2017, 13, 445. [Google Scholar] [CrossRef]
  72. Entezari, M.; Yamani, M.; Jafari Aghdam, M. Evaluation of intrinsic vulnerability, hazard and risk mapping for karst aquifers, khorein aquifer, kermanshah province: A case study. Environ. Earth Sci. 2016, 5, 435. [Google Scholar] [CrossRef]
Figure 1. (a) Main geological features of the study area, with the locations of the Qingduo karst water supply (oval dashed circle) and the lead smelting plant (red square). The elevation of terrain gradually decreases from north to south, with two major structures of the Kejing (KJ) and Fengmenkou (FMK) faults (black lines) developed in the north and middle of the area, respectively. Groundwater flows along the topography with annual average heads of 155–190 m and discharges in two ways: outflows via the FMK water conduit in the middle and springs in the south Wanquan catchment. Geological data from three profiles (A–A’, B–B’, and C–C’, yellow lines) and 27 boreholes (Z1–T4, circles) were used to construct the geological structure model, with the model boundary delineated using bold black lines. (b) Hydrogeological profile (A–A’) and groundwater flow. The Quaternary (Q) sediments covered in the top area include silty clay, silt, sand, and gravel. In the north wall of the KJ fault, the impermeable Permian (P) and Carboniferous (C) coal-bearing shales and sandstones underlie the Q sediments, thus blocking the lower karst water in the Ordovician (O) limestones from the Q pore water in the upper layer. By contrast, the C+P blocks are missing in the south plates of the KJ fault, and groundwater flow in the limestones with dissolved pores and fissures contacts well with the upper Q-pore water as a result. Furthermore, the conduit of the FMK fault develops through the Q and covered O aquifers, resulting in a local discharge zone of the deeper karst water. In addition, groundwater also discharges as overflow springs in the Wanquan catchment, owing to the blocks of the Tertiary (N and E) mudstone in the south.
Water 15 03425 g001
Figure 2. Three-dimensional (3D) geological structure model of the study area. (a) Borehole data (n = 49, including 22 virtual boreholes extracted from geological profiles) used for geological model construction; (b-1,b-2) spatial distribution of stratigraphic lithology in the study area.
Water 15 03425 g002
Figure 3. Scores of the (a) P, (b) ISS, and (c) R indicators, along with (d) the intrinsic vulnerability map of the Qingduo karst system.
Water 15 03425 g003
Figure 4. Intrinsic vulnerability map and distributions of the measured water quality indexes (Pb and NO3) based on the index model (a-1,b-1) with and (a-2,b-2) without considering the sources and sinks (SS) index of the groundwater flow system.
Water 15 03425 g004
Figure 5. Percent distributions of vulnerability classes on the aquifer surface and global vulnerability (Gv) values at the top. The weight values of the topsoil medium (c-M), terrain slope (d-T), fault damage zone (g-F), and source and sinks (f-SS) were modified as indicated within each respective bracket.
Water 15 03425 g005
Figure 6. Vulnerability maps after changing the weight value of (a) the topsoil medium (c-M) from 2 to 4, (b) the terrain slope (d-T) from 1 to 3, (c) the fault damage zone (g-F) from 4 to 2, and (d) the source and sinks (f-SS) from 4 to 2. The modification of each weight was indicated within the respective bracket.
Water 15 03425 g006
Table 2. Heavy metal and salt contents in rivers, groundwater, and soil a.
WATER (N = 41)Pb (ug/L)As (ug/L)Cd (ug/L)NO3 (N, mg/L)SO42− (mg/L)Cl (mg/L)
Standard for groundwater quality b1010520250250
River water (N = 10)
Range0.06–12.430.44–14.70.02–0.786.54–74.88103.79–229.95.8–64
Mean ± S.D.3.83 ± 4.529.81 ± 5.730.24 ± 0.2425.13 ± 23.90160.53 ± 29.530.65 ± 15.85
Groundwater (N = 31)
Range0.05–3.040.23–1.740.003–0.171.24–13.8043.5–261.3211.70–108
Mean ± S.D.0.39 ± 0.580.57 ± 0.390.03 ± 0.049.68 ± 2.33112.42 ± 37.9127.61 ± 17.86
SOIL (N = 30)Pb (mg/kg)As (mg/kg)Cd (mg/kg)
Risk screening values (pH > 7.5) c170251
Range14.6–2551.87.5–101.80.09–69.83
Mean ± S.D.337.2 ± 598.930.0 ± 27.09.4 ± 18.3
Notes: a The chemical data for the soil and water were acquired through a previous investigation conducted from 2016 to 2018. b Groundwater quality standard for domestic drinking sources (class III, GB/T 14848-2017) [44]. c Soil environmental quality risk control standard for soil contamination of agricultural land (GB15618-2018) [43], risk screening values.
Table 3. PISSR index model.
PISSR Index ModelPISSR = P + ISS + R(1)
Indicator Layer
(n = 3)
Index
(n = 8)
Weight aEquation
protective layer (P)vadose zone lithology (LV)a = 3P = a·LV + b·DV + c·M(2)
vadose zone thickness (DV)b = 4
topsoil medium (M)c = 2
infiltration conditions (ISS)terrain slope (T)d = 1ISS = d·T + e·Lu + f·SS(3)
land use type (Lu)e = 1
sources and sinks (SS)f = 4
runoff conditions (R)fault damage zone (F)g = 4R = g·F + h·TS(4)
saturated zone transmissibility (TS)h = 3
Note: a The weight assigned to each index was determined through a comprehensive approach, incorporating the expert score method, reference to groundwater vulnerability assessment guidelines (CAS and CMWR, 2012), and insights from related studies [5,37,46,47,48,49,50,51,52,53]. Additionally, we considered the specific hydrogeological characteristics and expert knowledge of the study area. The scale for weight importance is: 1 (Low importance), 2 (Mild importance), 3 (Moderate importance), 4 (High importance), and 5 (Critical importance).
Table 4. Grades of groundwater intrinsic vulnerability indexes in the study area.
ValueProtective Layer (P)Infiltration Condition (ISS)Runoff Condition (R)
Medium Lithology in the Vadose Zone
(LVi) a
Vadose Zone Thickness
(DV, m)
Topsoil Medium
(M)
Terrain Slope
(T, %)
Land Use Type
(Lu)
Absolute Infiltration
(SS-If, m/d)
Fault Damage Zone (Distance from Faults) (F, m)Medium Permeability (K) in the Saturated Zone
(PSi) b
1/>50//villages, towns, industrial and mining land<0>5000silty clay, cemented limestone (0.001–0.05 m/d) c
2silty clay30–50silty clay//0–0.0001/mudstone with partially cemented pores (0.01–0.1 m/d)
3/20–30////3500–5000shale and sandstone with a few cracks (0.05–0.5 m/d)
4silt10–20//cultivated land0.0001–0.0003/silt and sand (0.1–5 m/d)
5 //6–12//2000–3500/
6/5–10///0.0003–0.0005//
7//////500–2000/
8sand and gravel2–5//grassland0.0005–0.0007//
9///2–6////
10/0–2thin layers or missing0–2/>0.0007<500limestone with well-developed dissolution pores and fissures (50–500 m/d)
Notes: a The score of the vadose zone lithology (LV) index was calculated by summing the product of individual medium lithology scores (LVi) and their respective thickness proportions. b The score of the saturated zone transmissibility (TS) index was calculated by summing the product of the permeability score (PSi) for each individual medium and its corresponding thickness proportion. c The ranges of hydraulic conductivity (K) corresponding to medium permeability were based on empirical data from the Handbook of Hydrogeology by the China Geological Survey (CGS) [54].
Table 5. Intrinsic vulnerability classification.
Intrinsic Vulnerability ScoresIntrinsic Vulnerability ClassificationsClass Values (cl)
20–70very low1
70–100low2
100–120medium3
120–150high4
150–200very high5
Table 6. Comprehensive local sensitivity coefficient (Sw) of the index weight.
Weighta-LVab-DVc-Md-Te-Luf-SSg-Fh-Ts
(3)(4)(2)(1)(1)(4)(4)(3)
Sw2.89 2.73 8.94 7.16 2.98 4.12 6.13 3.07
Notes: a Weights of a–h correspond to indices of Lv-Ts. The values in brackets are the weights in the model according to the expert scoring.
Disclaimer/Publisher’s Note: The statements, opinions and data contained in all publications are solely those of the individual author(s) and contributor(s) and not of MDPI and/or the editor(s). MDPI and/or the editor(s) disclaim responsibility for any injury to people or property resulting from any ideas, methods, instructions or products referred to in the content.

