Article

Explainable Artificial Intelligence in Hydrology: Interpreting Black-Box Snowmelt-Driven Streamflow Predictions in an Arid Andean Basin of North-Central Chile

by
Jorge Núñez
*,
Catalina B. Cortés
and
Marjorie A. Yáñez
Departamento Ingeniería de Minas, Universidad de La Serena, Benavente 980, La Serena 1700000, Chile
*
Author to whom correspondence should be addressed.
Water 2023, 15(19), 3369; https://doi.org/10.3390/w15193369
Submission received: 17 August 2023 / Revised: 15 September 2023 / Accepted: 19 September 2023 / Published: 26 September 2023
(This article belongs to the Special Issue The Application of Artificial Intelligence in Hydrology, Volume II)

Abstract

:
In recent years, a new discipline known as Explainable Artificial Intelligence (XAI) has emerged, which has followed the growing trend experienced by Artificial Intelligence over the last decades. There are, however, important gaps in the adoption of XAI in hydrology research, in terms of application studies in the southern hemisphere, or in studies associated with snowmelt-driven streamflow prediction in arid regions, to mention a few. This paper seeks to contribute to filling these knowledge gaps through the application of XAI techniques in snowmelt-driven streamflow prediction in a basin located in the arid region of north-central Chile in South America. For this, two prediction models were built using the Random Forest algorithm, for one and four months in advance. The models show good prediction performance in the training set for one (RMSE:1.33, R2: 0.94, MAE:0.55) and four (RMSE: 5.67, R2:0.94, MAE: 1.51) months in advance. The selected interpretation techniques (importance of the variable, partial dependence plot, accumulated local effects plot, Shapley values and local interpretable model-agnostic explanations) show that hydrometeorological variables in the vicinity of the basin are more important than climate variables and this occurs both for the dataset level and for the months with the lowest streamflow records. The importance of the XAI approach adopted in this study is discussed in terms of its contribution to the understanding of hydrological processes, as well as its role in high-stakes decision-making.

1. Introduction

Machine Learning (ML) and Deep Learning (DL) algorithms, largely representative of the so-called Artificial Intelligence (AI) [1], are increasingly being used in earth and environmental modeling, including application to the resolution of problems of interest in hydrology and water resources [2,3,4,5].
The adoption of AI/ML/DL techniques in the context of water sciences, mostly applied to hydrological prediction and forecasting problems, is part of a growing trend of AI use in Earth System Science, consistent with the so-called Digital Age [6,7,8,9,10].
Although the study and application of AI/ML/DL in the field of hydrology (AI/ML/DL/Hydro) has undergone accelerated growth in the last decade, its adoption continues to be slow compared to other disciplines such as computer science, engineering, mathematics, physics, and astronomy, to name a few [1,11]. According to some authors, this is due to an initial lack of interest in AI and certain techniques associated with information and communication technologies (ICT) that are perceived as if they were a “black box”, which has generated a certain degree of skepticism in their actual contribution to the progress of hydrology [12,13]. This initial perception has changed notably as AI/ML/DL has been consolidated as a set of powerful tools to transform large volumes of data—that grow exponentially—into actionable and practical knowledge [9,13]. Indeed, a couple of decades ago, some researchers asked: what does AI contribute to hydrology? [14] Today, as a result of the paradigm shift in science that includes the increasingly predominant role of AI- and ICT-based techniques, the question has been posed in completely opposite terms. That is: what role does hydrological science play in the age of machine learning? [15,16].
Despite the high degree of incorporation of AI/ML/DL into hydrological research and practice, the dilemma regarding the role that these techniques have in the discipline—which, to a large extent, shows a strong predilection for process-based understanding—is not yet resolved. Indeed, some authors state that techniques such as ML are central to the future of hydrological modeling, while others still question whether ML actually has a role in the field [17]. Part of this duality is explained by the central role, as in any scientific discipline, that understanding and explanation have in the progress of hydrological knowledge, “where the ultimate goal is to understand hydrological causality” [18]. However, as the future becomes more uncertain, prediction—precisely one of the most distinctive features of AI/ML/DL—as a scientific value in itself, becomes increasingly important, and is placed, along with understanding, as a key epistemological value for the advancement of the discipline of hydrology [19,20,21].
It is not strange, then, that recent reviews of the application of AI/ML/DL in hydrology coincide in noting that interpretability, an attribute closely linked to understanding and explanation [22,23], is the most widely criticized aspect regarding the use of AI/ML/DL in the field, since some of these techniques “are particularly difficult to interrogate or justify in physical terms” [2,4,24,25,26,27].
The two above-mentioned aspects, predictability and interpretability, the latter of which is considered the basis of scientific understanding, represent a greater challenge due to the so-called prediction/interpretability (also known as performance/transparency, performance/interpretability, accuracy/explainability) trade-off in the AI/ML/DL context. That is, the general idea that indicates the existence of an inverse relationship between the interpretability of black-box models and the degree of precision reached by their predictions, although this relationship is not as simple as has been argued [28,29,30]. Recent studies on the challenge posed by the prediction/interpretability trade-off [28,29,31] and its explicit incorporation into hydrological modeling show that this is a hot topic and therefore transcendental in the discussion on the role that AI/ML/DL has in current hydrology and will continue to have in an increasingly digitized world [32,33,34].
In this regard, some authors state that integrating theoretical or disciplinary knowledge aspects with data-driven techniques, an approach known as theory-driven or hydrologically informed machine learning, it is the only “way that we can take full advantage of machine-aided knowledge discovery and advance our understanding of physical processes” [35]. Contrary to that statement, a new and emergent discipline recently adopted in the field of hydrology, known as Explainable Artificial Intelligence (XAI) or Interpretable Machine Learning (iML) [36,37,38], can provide Machine Learning with more tools to address the prediction/interpretability trade-off in AI-based hydrological research and, in that way, contribute to the progress of hydrological understanding.
However, the adoption of XAI/iML as a complementary discipline to the exponential growth that AI/ML/DL is experiencing in the hydrological field shows important challenges to date. One challenge relates to the heterogeneous distribution, on a global scale, of AI/ML/DL in hydrological research. Figure 1, for example, shows that although AI/ML/DL/Hydro has grown exponentially in recent decades (Figure 1a), countries of the southern hemisphere, apart from Australia, still contribute a very low or even no contribution to the development of the discipline (Figure 1a).
The situation is more unfavorable in the case of XAI/iML in hydrological research (XAI/iML/Hydro), where there are a small number of published articles compared to AI/ML/DL/Hydro in the same period (Figure 1b) and where only a few countries have contributed to XAI/iML research in the field (Figure 1c); none of them, apart from Australia, belong to the southern hemisphere.
Another important challenge of XAI/iML/Hydro is the need to expand research topics to fill knowledge gaps that have not been sufficiently addressed. Thus, for example, Figure 1d shows that the motor themes of XAI/iML/Hydro (first quadrant, top right), that is, themes that are well-developed and crucial for structuring a research subject [40], are currently related to topics such as climate and runoff models (terms such as river, soil moisture, water management, hydrological modeling, streamflow, and flood are subsumed under these two labels). In turn, topics such as water quality, drought or lakes are considered emerging issues (third quadrant, bottom left), implying that they are minimally developed and marginal. The graph allows us to verify that research areas such as seasonal streamflow prediction or snowmelt-driven streamflow prediction in arid regions have not yet been addressed within XAI/iML/Hydro, despite the progress that AI/ML/DL/Hydro has experienced in those research areas. This suggests that there is still room to contribute to filling these gaps with new research in the above-mentioned themes.
Based on the above considerations, this study aims to contribute to the progress of XAI/iML/Hydro with regard to snowmelt-driven streamflow prediction in a basin placed in the southern edge of the Chilean Atacama Desert in South America, an area highly prone to water scarcity and water stress [41], where the need to improve water availability prediction is an urgent and permanent requirement for water resource management. Specifically, this study deals with the application of XAI/iML techniques to the interpretation of snowmelt-driven streamflow prediction in an Andean basin of semi-arid north-central Chile. The study is justified as the selected basin has been affected by a megadrought that has extended over the last decade [42] and its position in the arid zone of the country makes streamflow prediction difficult and prone to large numbers of errors using conventional statistical methods [43]. In this context, an aspect not explored to date is the incorporation of hydrometeorological predictors outside the basin boundaries (e.g., precipitation and streamflow records from stations placed in the basin). Thus, the present study hypothesizes that the inclusion of variables from the vicinity of the basin may have not only predictive but also interpretative importance regarding the outputs of the prediction model. The use of XAI/iML, together with a black-box ML method, allows us to address the prediction/interpretability trade-off mentioned previously with the aim of increasing the prediction accuracy without sacrificing its interpretability.
Finally, the main findings of this study are complemented with a general discussion of the role that XAI/iML could have in hydrological research and practice, in which the authors argue the two main reasons that greater adoption of XAI/iML is necessary in hydrological research. These reasons are (a) its contribution to the progress of hydrological understanding and (b) the role of accountability in the adoption of AI/ML/DL-based hydrological solutions in a context of growing public and political scrutiny and regulatory control.

2. Materials and Methods

2.1. A Case of XAI/iML Application to Prediction of Snowmelt-Driven Streamflows in a Basin of the Semi-Arid Region of North-Central Chile

As an example of XAI/iML application in the hydrological prediction context, the prediction of monthly snowmelt-driven streamflow in the Elqui River basin (ERB), located in the semi-arid region of north-central Chile, was selected as a case study. The prediction was performed using regression models constructed with Random Forest [44], an ML algorithm categorized as a black box [45,46]. The models were built to predict monthly streamflow at two lead times: one and four months in advance with respect to the prediction month (August), consistent with the official procedure adopted for monthly streamflow estimation in the study basin by the General Water Directorate of Chile (GWD). It is recognized that in the past such forecasts had high error levels in the study area [43]. An explanation for this low level of performance could be associated with the use of conventional statistical models with a high degree of transparency but very low predictive performance. Thus, the case study adequately represents the prediction/interpretability trade-off problem discussed in this paper. Improving predictive performance without sacrificing interpretability is key in the search for new reliable forecasting tools, which could also be subject to intense public and political scrutiny due to the effects of forecasting on water management in the basin [47], especially in a context in which the ERB is affected by harsh megadrought conditions that have dragged on for more than a decade [42].

2.2. Study Area

The Elqui River basin is one of the main exorheic basins that make up the Coquimbo Region, north-central Chile. It is located in the Elqui Province, (29°35′ and 30°20′ S, 71°18′ and 69°55′ W), covering an area of 9826 km2.
The ERB is composed primarily of 4 neighboring sub-basins (Lower Elqui River, Middle Elqui River, Claro River, and Turbio River), with the Río Elqui en Algarrobal (Q_IV_RElquiMedio_Alg) stream gauge station being the monitoring point at which the official prediction of monthly streamflows for the September–March period, coinciding with the snowmelt season, is performed. Figure 2 shows the location of the basin and neighboring basins, as well as the locations of the stream and rain gauge stations, snow courses, and points of interest considered in this study.
From a hydrological perspective, precipitation in the ERB presents marked seasonal and interannual variability, with greater precipitation during the wet seasons of autumn and winter (MJJA) and scant precipitation during the rest of the year. The ERB drainage network presents a water regime marked by snow and rainfall in the mountains. The Elqui River, the main stream of the basin, receives contributions from the Turbio and Claro rivers, both from the easternmost region of the basin, in the Andes Mountains.
Regarding the estimated mean monthly streamflow of the Elqui River, at the height of the Río Elqui en Algarrobal station (Q_IV_RElquiMedio_Alg, 760 m.a.s.l.) (see Figure 2), which is the monitoring point used for prediction, the maximum value is presented during the months of December and January, with around 20 m3/s on average, while the rest of the year the values fall to 10 m3/s on average [48]. Figure 3 shows the boxplot of monthly streamflow at Río Elqui en Algarrobal stream gauge station, used as the monitoring point for streamflow prediction.

2.3. Data Sources and Analysis Tools

Table 1 shows the data sources used. Details regarding the collection and treatment of each of the variables have been described in a previous work [48]. In summary, the main treatment was applied only to streamflow and precipitation variables, not to the variables obtained from gridded sources or those generated with ERA5 (see Table 1). Thus, the treatment included, for the streamflow and precipitation variables, the collection of daily data, analysis of missing and outlier data, elimination of data with a high percentage of missing data, the filling in of missing values using the R package missRanger R [49] and the aggregation of monthly values.
The prediction (regression) models were built in the RStudio integrated development environment based on R language v4.0.5 [50]. The packages used included caret v6.0-42 [51] for model construction, Boruta v8.0.0 [52] for attribute selection, DALEX v2.4.2 and DALEXtra v2.2.1 [53,54] for model interpretation, and tidyverse v1.3.1 [55] for general database management.

2.4. Procedure

The general procedure is described in Figure 4. All the records described in Table 1 were aggregated to a monthly scale to produce a reliable record period of 41 years (1980–2020). The 2020 record was left out of this database in order to use it as an instance of local model interpretation, such that the final database for regression model construction had a total of 40 instances and 680 attributes (predictors), all numerical. The initial set of predictors was reduced sequentially through (a) elimination of streamflow and precipitation attributes outside the ERB vicinity (outside of the Huasco, Elqui, and Limarí basins), (b) elimination of minimum variance attributes (using the “nearZeroVar” function of the “caret” package with freqCut = 30/10 and uniqueCut = 25), and (c) elimination of attributes with high correlation (using the “findCorrelation” function of the “caret” package with cutoff = 0.8), and (d) standardization (mean = 0, SD = 1). The response variable (streamflow) was used in its original form, and no transformation (c.a. log-transformation) was adopted prior to the assessment of prediction performance and the interpretation analysis [56].
The study objective was defined as the comparison of two prediction models: for one and four months of lead time with respect to the prediction month, consistent with the official methodology currently used by the GWD. From the reduced database, an attribute set was selected for each prediction model with the Boruta algorithm (with default arguments), recognized for its high performance in such tasks [57,58,59].
Finally, the selected attributes in each model were combined to create a single attribute pool to use in the construction of the two regression models. The models were constructed in Random Forest, using R’s ranger v0.13.1 implementation [60]. For the validation, the repeated k-fold cross-validation (args: number = 5, repeats = 10) was used instead of the traditional hold-out partition because it “can provide a more stable estimate of prediction accuracy, as compared with simple k-fold CV,” which is highly advantageous for ML applications with small samples where it is not desired to affect the model validity estimation performance [53,56,58,61,62].
For assessment of the prediction performance, the RMSE, R2, and MAE metrics were used. For the interpretation of results at model (dataset) level, the variable importance (VI) [53,56], partial dependence plot (PDP) and accumulated local effects plot (ALE) techniques were used, while for local (instance)-level interpretation for the year of the series with the lowest streamflow (2020), the Shapley value (SHAPv) and local interpretable model-agnostic explanation (LIME) techniques were used [53,56]. Variable importance resides in the idea that if a variable is important it can be expected that, after permuting the values of the variable, the model’s performance will worsen. The amount of change in the performance is a measure of the importance of the variable [56]. Partial dependence plot shows how the expected value of model prediction behaves as a function of a selected explanatory variable [56,63]. Accumulated local effects plot, an unbiased alternative to PDP, describes how features influence the prediction of an ML model, on average [64].
The Shapley value calculates the contribution of each attribute to the predicted value. Put another way, “The value of feature j contributes ϕj to the prediction of this particular instance, compared to the average prediction for the data set.”[64]. Finally, the idea behind LIME is to locally approximate a black-box model using a simpler transparent model which is easy to interpret. In the implementation adopted in this study, the surrogate local model corresponds to a weighted LASSO lineal regression model [56].

3. Results

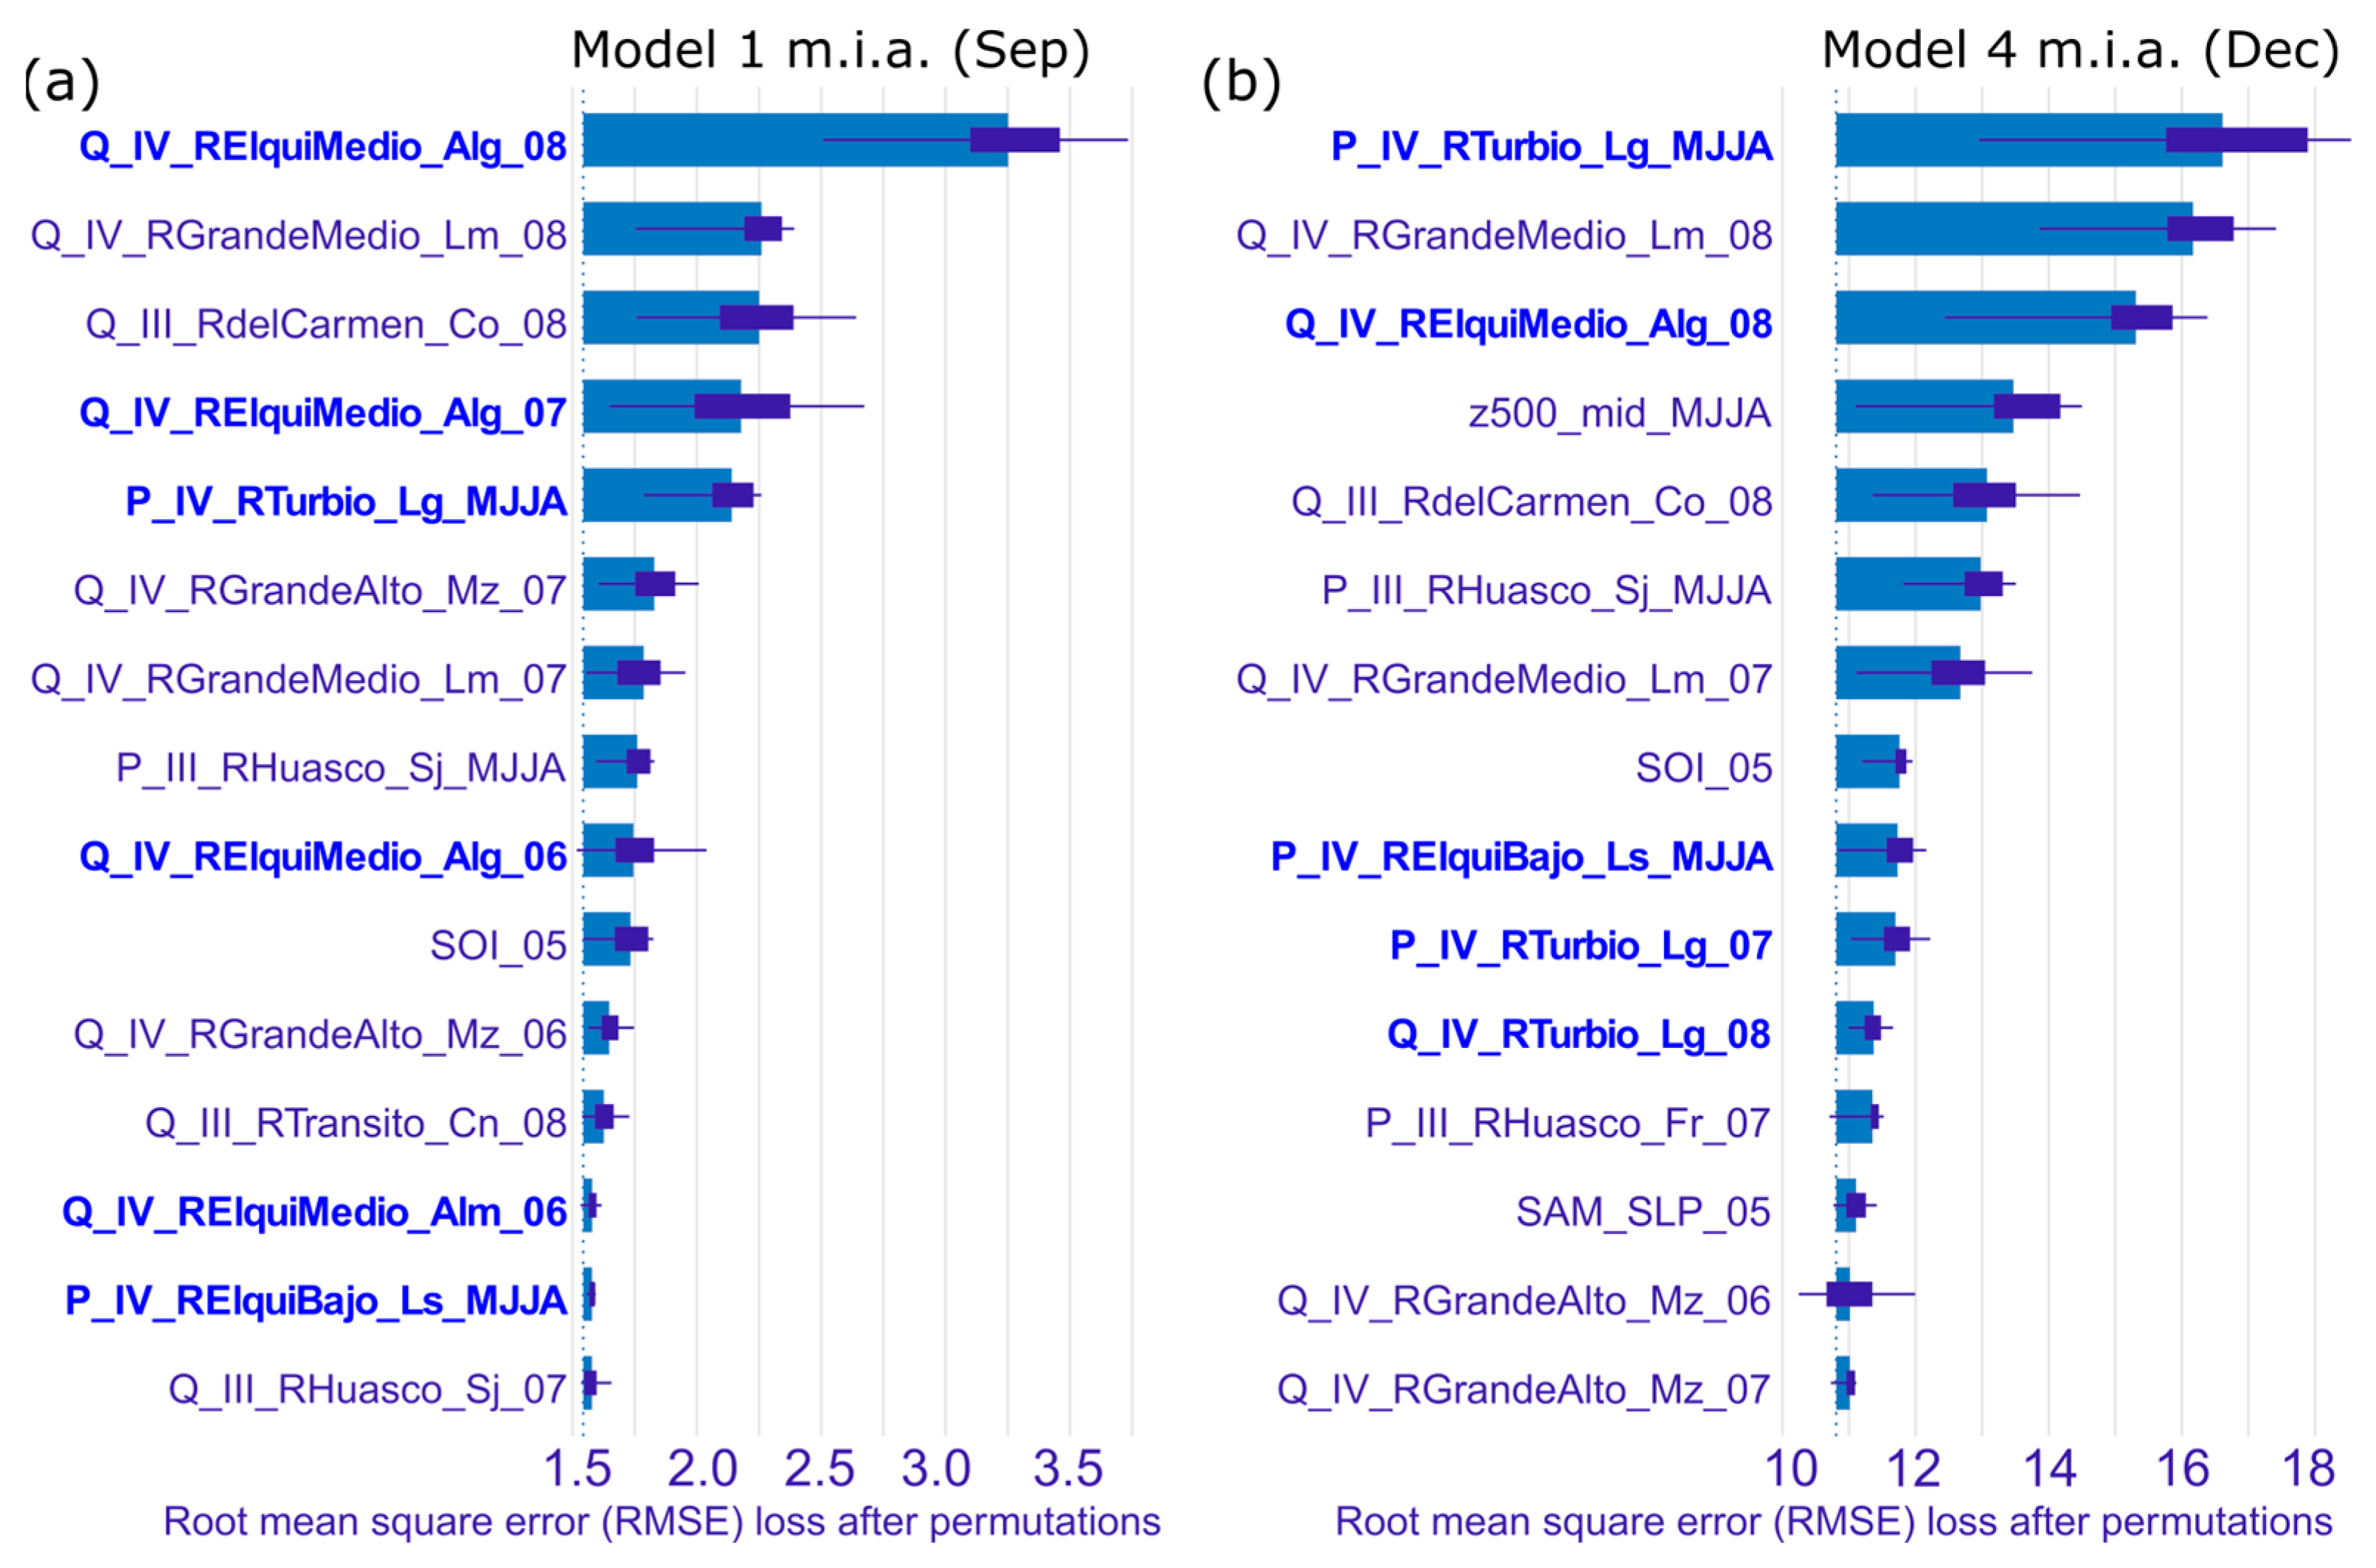
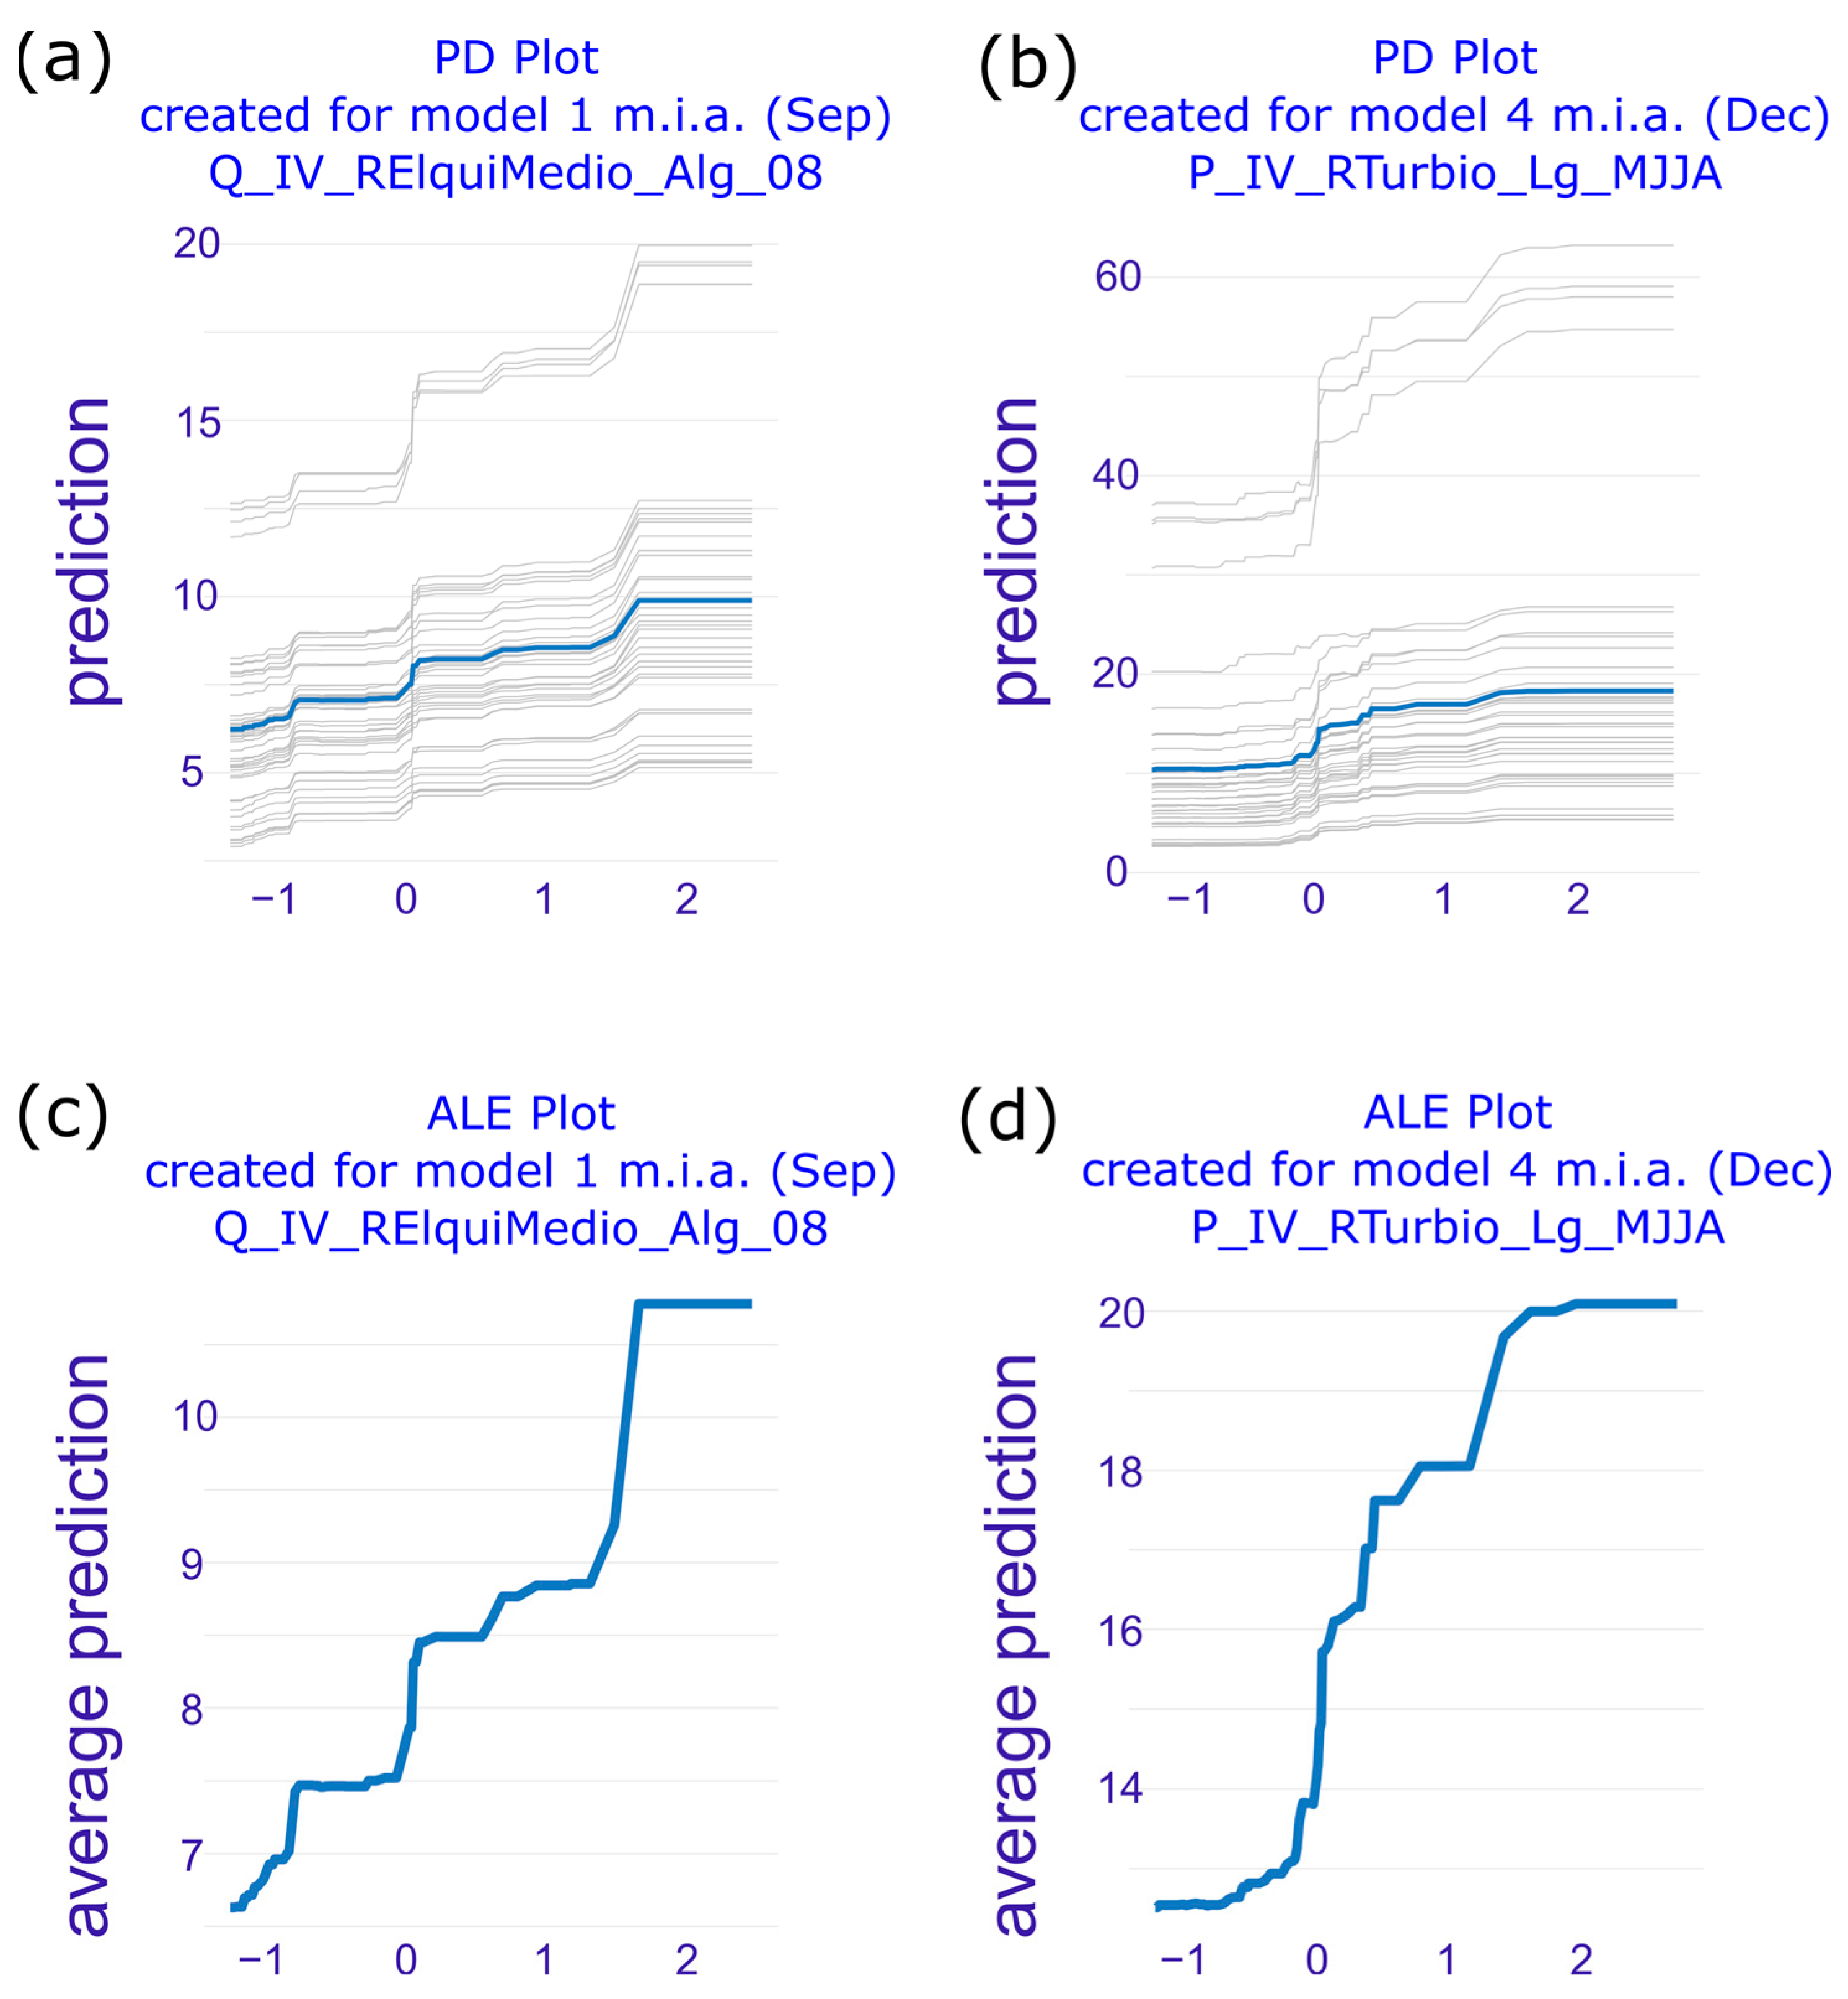
3.1. Model (Dataset)-Level Interpretation

The AI/ML/DL model interpretation process begins at model performance level, “as interpretation can only be as good as its underlying model” [62]. Accordingly, Table 2 presents the performance metrics of the streamflow prediction models for 1 month in advance (m.i.a.) (September: Sep) and 4 m.i.a. (December: Dec), respectively.
The results show high performance (i.e., R2 = 0.94) for the sample used for training, and lower performance (i.e., R2 = 0.85) for the validation sample (obtained by CV) in the different metrics for the 1-month-in-advance model (Sep). The 4-months-in-advance model (Dec) presents high performance (i.e., R2 = 0.95) for the training sample and lower performance (i.e., R2 = 0.73) for the validation sample (obtained by CV). The results are consistent with other streamflow prediction studies in the same basin, although they have different methodologies in terms of predictive performance. Likewise, they are consistent with the fact that predictive performance in the ERB tends to decrease as the prediction lead time increases [65]. In addition, the results are positive compared to those obtained historically on an official basis by the General Water Directorate of Chile in this basin, as studies indicate that no forecast performed in northern Chile has entered the “good forecast” category [43]. These results suggest the possibility of comparing, in the future, a set of ML/DL models with different levels of complexity, taking account for the fact that, within the XAI/iML framework, models with approximately equally predictive performance could give rise to different interpretations.
Regarding the most important variables for prediction, Figure 5 shows the mean importance of the variables by prediction model.
As seen in the graph, the order of variable importance is not the same in the two models. In the case of 1 month ahead (Sep), the four most important variables are: streamflow at the Río Elqui en Algarrobal station (Q_IV_RElquiMedio_Alg_08), streamflow at the Río Los Molles en Ojos de Agua station (Q_IV_RGrandeMedio_Lm_08) in August, streamflow at the Río Carmen en el Corral station (Q_III_RdelCarmen_Co_08) in August, and streamflow at the Río Elqui en Algarrobal station (Q_IV_RElquiMedio_Alg_08) in July. In the case of 4 months ahead (Dec), the four most important variables are cumulative precipitation in the rainy season (MJJA) at the La Laguna Embalse station (P_IV_RTurbio_Lg_MJJA), streamflow at the Río Los Molles en Ojos de Agua station (Q_IV_RGrandeMedio_Lm_08) in August, streamflow at the Río Elqui en Algarrobal station (Q_IV_RElquiMedio_Alg_08) in August, and the 500 hPa geopotential height in the Amundsen–Bellingshausen sector. It is possible to interpret the set of precipitation and streamflow variables in terms of the water status in the ERB vicinity. Climatic variables, which have traditionally been incorporated as predictors of the water regime in a large part of continental Chile [42,66], have less importance, depending on the model. For 1 m.i.a. (Sep), only the Southern Oscillation Index (SOI) for the month of May appears among the 15 most important variables, with very low importance. For 4 m.i.a. (Dec), meanwhile, 500 hPa geopotential height for the rainy season (MJJA) in the Amundsen–Bellingshausen sector appears in fourth place of importance. This finding is consistent with what has been found by other authors who indicate that this variable is associated with the current megadrought conditions affecting a large part of continental Chile [42]. This aspect is important, as December is the month of peak snowmelt in the streamflows in the ERB and, therefore, when the greatest contribution to the cumulative water volume in the basin occurs. In the same model, the SOI for the month of May is less important, which could be explained by the fact that El Niño conditions have lost precipitation prediction ability in central and north-central Chile. Indeed, El Niño has presented less predictive ability in the last decade due to the influence of other ocean climate factors, with the 500 hPa geopotential height in the Amundsen–Bellingshausen sector standing out [42,67].
Figure 6a,b presents the partial dependence plots (PDP), also known as partial dependence profiles, for both models, to show how the expected prediction value behaves as a function of some variable of interest, using the most important variable in each model [56,62,63]. The graphs highlight two important aspects for interpretation: first, it is observed that the individual ceteris paribus (CP) profiles, similar to the individual conditional expectation (ICE) plots, are parallel, which is indicative of an additive model without interaction between predictors, and facilitating extrapolation in the predictor space by making the PDP adequately represent the profile of each instance [56,65,68]. Second, the graphs show that for values between −1 and 1 SD from the predictor mean, the estimated streamflow at Río Elqui en Algarrobal presents a low linear increase, although it is clearly staggered throughout the prediction domain. With predictor values of more than 1 SD from the mean, a faster increase in estimated streamflow at the monitoring station is observed, of up to approximately 2 SD from the mean.
This can be interpreted in terms of thresholds in the predictors that indicate the occurrence of a staggered change in predictor–response relationships, which seems reasonable since hydrological relationships between precipitation and snowmelt-driven streamflows in mountainous areas are generally parameterized in terms of threshold values [68,69]. The foregoing is confirmed by the accumulated local effects (ALE) plots, also called accumulated local profiles, which are shown in Figure 6c,d. The ALE plots in this case have an interpretation similar to that of the PDP, thanks to the lack of interaction between predictors. It is more clearly seen that both models present three predictor–predicted streamflow relationship levels. For 1 m.i.a. (Sep) (Figure 6c), streamflow at the Río Elqui en Algarrobal station (Q_IV_RElquiMedio_Alg_08) in August presents a first level between −1 SD and 0, a second level for values between 0 and 1.3 SD, and a third level for values above 1.3 SD. Meanwhile, for 4 m.i.a. (Dec) (Figure 6d), cumulative precipitation in the rainy season (MJJA) at the La Laguna Embalse station (P_IV_RTurbio_Lg_MJJA) presents a first level between approximately −1 and 0, a second between 0.3 and 1, and a third for values over 1.2 SD.
Thus, ALE plots make it possible to verify that the effect of predictors on forecast streamflow is consistent not only with intuition, but also with what is postulated by the domain knowledge on hydrological relationships in high mountain conditions [68,69,70].

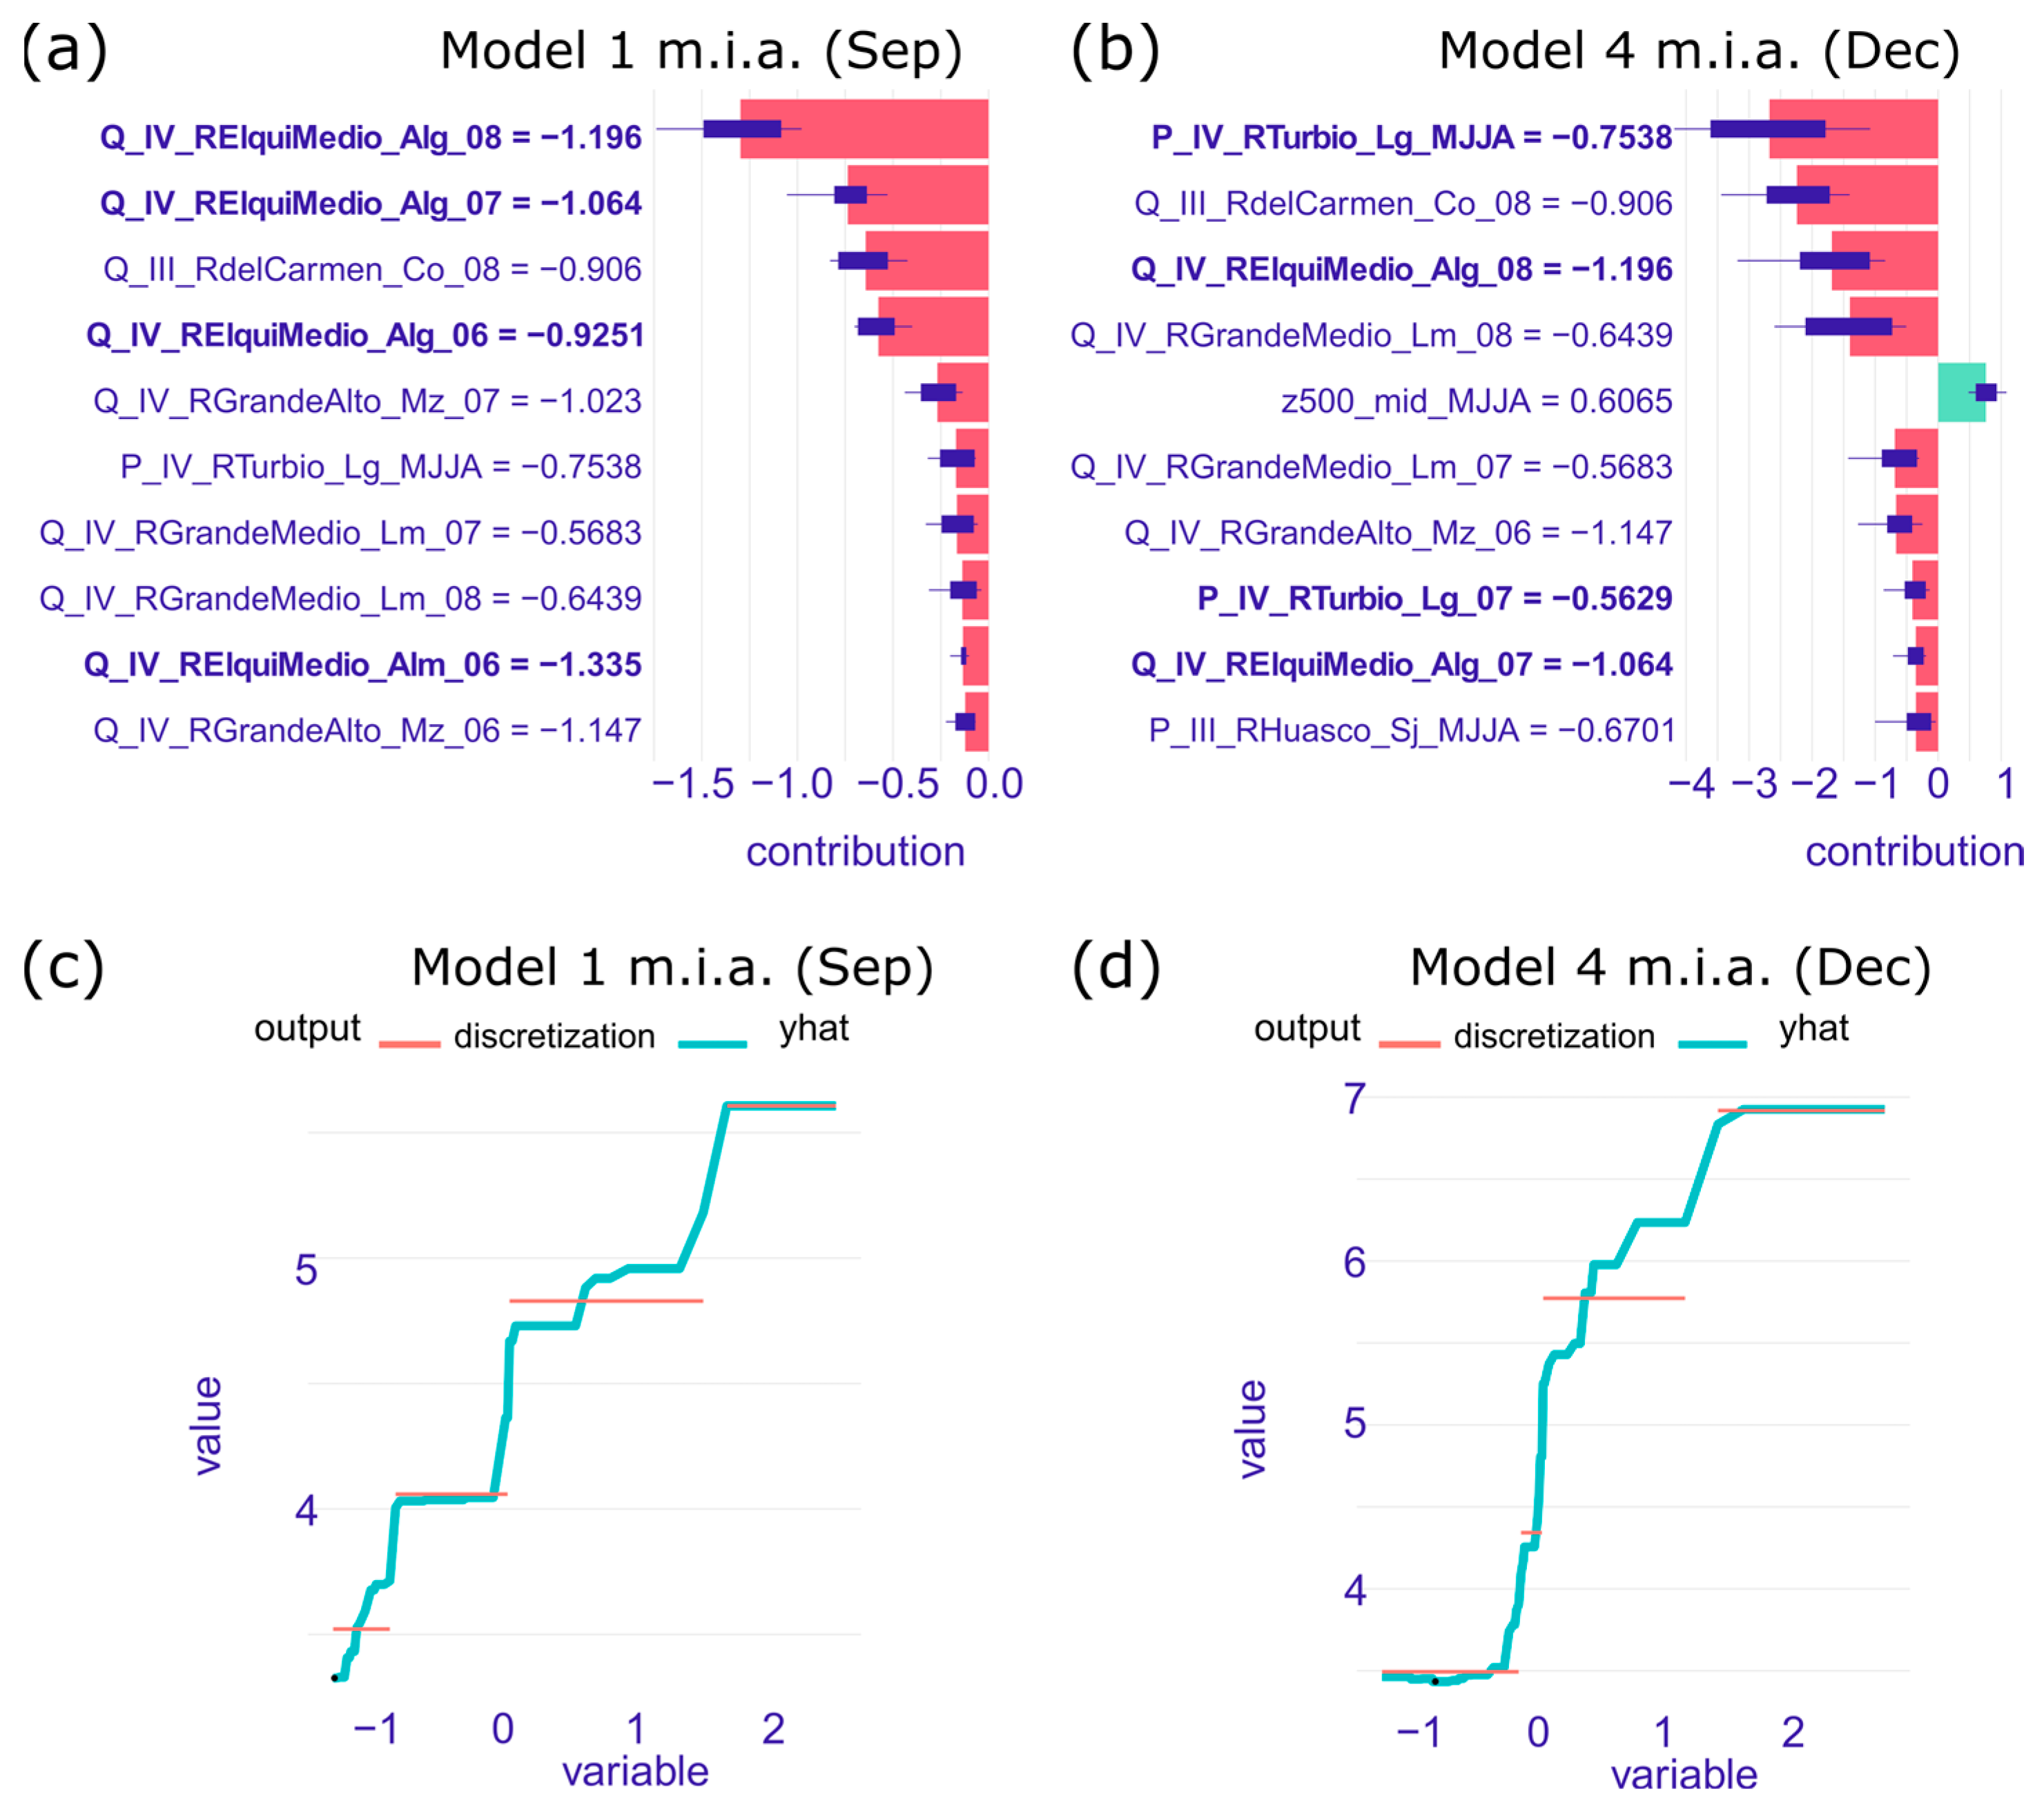
3.2. Local (Instance)-Level Interpretation

Because the study area has experienced megadrought conditions in the last decade, associated with various factors [42,66,67], it is important to analyze how the selected attributes explain the lower streamflow recorded in the available database. To this end, the September (December) 2020 streamflow was selected as the event to forecast, and the results were interpreted in terms of the Shapley value (SHAPv) and LIME, two of the most-used local techniques for hydrological applications in the XAI/iML context [56,63,64].
Figure 7, below, shows the SHAPv and LIME values for the main variables that explain the September (December) 2020 streamflow. SHAPv assigns each feature an importance value for a particular prediction. As seen in the figure, for September 2020 (Figure 7a) the three most important variables are streamflow at the Río Elqui en Algarrobal station in August (QIV_RElquiMedio_Alg_08), streamflow at the Río Elqui en Algarrobal station in July (QIV_RElquiMedio_Alg_07), and streamflow at the Río Carmen en el Corral (Q_III_RdelCarmen_Co_08) in August. Meanwhile, for December (Figure 7b), the three most important variables are precipitation at the Laguna Embalse station in winter (MJJA) (P_IV_RTurbio_Lg_MJJA), streamflow at the Río Carmen en el Corral station (Q_III_RdelCarmen_Co_08) in August, and streamflow at the Río Elqui en Algarrobal station (QIV_RElquiMedio_Alg_08) in August. Thus, in predictive terms, the water status of the vicinity of the Elqui River basin explains, to a large extent, the minimum streamflow recorded in September (December) 2020. The use of SHAPv, therefore, allows the importance of the selected variables for a particular instance-level prediction to be distinguished from their importance in a dataset-level model.
LIME, meanwhile, is a surrogate model, trained to approximate the predictions of the underlying black-box model to explain individual predictions by learning an interpretable model locally around the prediction [56,64,71]. LIME prediction curves were generated using the main variable in each model obtained by SHAPv. It can clearly be observed that the low estimated streamflow in both months is explained because, in each model, the value of the most important predictor variable was found on the lower predictor–response relationship level.
These findings are important from the perspective of streamflow prediction models for the study area if they are compared, for example, to the official findings of the General Water Directorate of Chile or those of local and research organizations, which base their forecasts on a combination of global climatic variables and exclusively local variables (within ERB boundaries); that is, variables that do not incorporate information from the basin vicinity into the forecasting models [65,72,73,74]. This can be explained by the role that scientific knowledge and understanding have in hydrological research and practice, in which the variables selected by the analyst are expected to obey some mechanism that is plausible in physical terms; this is typical of the culture some call “data modeling,” the purpose of which is “[t]o extract some information about how nature is associating the response variables to the input variables” [75,76]. By contrast, in a data-driven approach, the variables are selected algorithmically based on the minimization of a loss function. The role of XAI/iML in this context is precisely to generate an explanation, that is, “the process of describing one or more facts, such that it facilitates the understanding of aspects related to said facts” [77].

4. Discussion

Even though recent studies have shown the utility of XAI/iML in hydrological research, such as in the interpretation of black-box prediction models in tropical areas of Brazil in the southern hemisphere [78], in the prediction of levels of groundwater in a aquifer in the semi-arid region of the southern United States [79] or in the prediction of groundwater levels in a desert region of China [80], to mention a few, this is the first study, according to the best knowledge of the authors, looking at the application of XAI/iML to snowmelt-driven streamflow prediction in an Andean basin of South America.
The XAI/iML techniques used in this study contributed to the interpretation of the black-box model outputs in two ways: first, the results allowed us to identify the importance of hydrometeorological variables outside the basin boundaries, which is a novel element of our research, since most of previous research in the study area restricts the set of this type of variables to those located locally within basin boundaries [43,65]. Due to the scarcity of data in most of the South American countries in particular, and in arid and mountain regions, the use of local variables beyond the basin boundaries, as a way of compensating space for time (similar to the idea of “trading space for time” used in regional frequency analysis in hydrology [81]), offers the possibility of improving the performance of predictive models under conditions of data scarcity, which is common in several countries of the southern hemisphere. Second, the results are consistent with hydrological knowledge, regarding threshold values in the relationship between precipitation and streamflow, for example, which reinforces what has been indicated at the beginning of the study, that XAI/iML techniques constitute valid tools for the progress of the discipline in terms of its contribution to hydrological understanding. The above is part of a broader debate regarding the role that XAI/iML and AI/ML/DL have on scientific progress and on high-stakes decision making that may impact society, as described below.
Various authors have addressed the reasons that XAI/iML is considered important and even necessary amid the increasing advancement of AI/ML/DL in today’s society. These considerations include the need for transparency, “to trust the model, especially when they are used for high-stakes application” [82]; the need to open black-box models, “not only for acceptability within society, but also for regulatory purposes” [83]; to meet various requirements and address concerns that arise from various domains, including “social, cognitive, philosophical, ethical and legal” concerns [84]; “To facilitate greater human acceptability” of AI-based systems [85]; to address the challenge of greater transparency due to the relationship between transparency and trustworthy AI, the basis for some recent regulations [86]; and “To amend the lack of understanding of AI-based systems, their reasoning processes, and their outputs” [87], to name a few. As stated in a recent study on the matter, “Many further reasons [including legal reasons] of public interest, like fairness or security, as well as business interests like ease of debugging, knowledge retrieval, or appropriate user trust have been identified” [63].
In the hydrology context, unlike the reasons expressed in the general AI/ML/DL community, the main reasons stated by researchers for the incorporation of XAI/iML are related to their contribution to greater understanding of the hydrological process, coinciding with the epistemic value of understanding in the progress of the discipline [18,19,20,21]. In the opinion of the authors of this paper, however, the incorporation of XAI/iML into the discipline should involve at least two main reasons based on the factors that have historically shaped the progress of the discipline: technological development and the needs of society [88]. These reasons are: (a) the contribution of XAI/iML to the progress of hydrological understanding in the first place, and (b) accountability in the use of AI/ML/DL techniques in a context increasingly permeated by ethical, political, and regulatory considerations, where AI-based solutions are increasingly more embedded in high-stakes decision-making systems [47,89].
Each of the mentioned reasons is detailed below:
(a)
Contribution to the understanding and progress of the discipline: The first reason for which it is considered not only important but also necessary to deepen the adoption of XAI/iML in hydrological research is that this discipline aids in facing the transparency limitations of the black-box techniques that have undergone major expansion in the discipline. This reason is argued by the authors of this paper, contrary to what is stated by those who, regarding the theory-guided approach, indicate that “It is only in this way that we can take full advantage of machine-aided knowledge discovery and advance our understanding of physical processes.” [35]. The reasons presented in hydrological applications of XAI/iML to date clearly reinforce this conviction. For example, some of the reasons expressed by researchers for including XAI/iML in their applications of AI/ML/DL are: that interpretable machine learning methods are adopted for better physical understanding [90]; to interpret the optimum modeling and understand how each input variable affects the selected output [80]; to extend the interpretability of machine learning models so the results can be better understood by humans [91]; to show that ML methods can provide accurate predictions for various tasks and that the hydrological processes involved can be interpreted so that results are more understandable to humans [92]; and to overcome black-box model limitations related to practical implications for water resource research [93]. Thus, as stated in other studies, in terms of contribution to the understanding of hydrological processes based on the application of AI/ML/DL, the authors of this paper also “recommend that the hydrological community makes more use of the novel methods of interpretable machine learning” [94].
(b)
Accountability in trustworthy AI/ML/DL for high-stakes decision-making systems: The second reason that XAI/iML can contribute significantly to hydrological research and practice, which has been tangentially recognized in the hydrology community, is the importance that ethical and regulatory issues concerning the use of AI/ML/DL overall have taken on [83,85,95,96,97,98]. The regulatory aspect has emerged as a natural extension of the ethical debate on AI toward the field of AI governance, the main objective of which is to achieve what has been called Trustworthy AI [99]. Hydrology, a discipline that throughout its history has known how to adapt to the context of technological development and social needs in which it is immersed [88], due to its own evolution, is inextricably linked to human affairs. And while an understanding of the processes and the progress of hydrological knowledge continue to be the main value of the discipline [19,20,21], the contribution of hydrology to solving the problems of society will require consideration of the ethical issues behind the solutions it provides [18,100]. This idea is reinforced when the discipline itself has explicitly recognized the increasingly substantial role of human–water interactions, and where communication of scientific knowledge and the acquisition of feedback from stakeholders are key factors in the progress of the discipline and its mission to be a “science for solutions” [101]. Various authors have begun to analyze and recognize the ethical and accountability implications brought about by the use of AI/ML/DL in hydrological research (see, for example, a recent discussion on the ethical aspects of DL in hydrology [3]), and it is expected that as the future of hydrology is increasingly connected to the provision of solutions to society’s water-related problems, the need to generate reliable solutions in a context in which many of them will be generated by AI/ML/DL, especially those linked to high-stakes decision-making, will be more pressing [8,47,89,102].
The reasons for a greater incorporation of XAI/iML into hydrological research, acknowledging the gaps mentioned in the Introduction section, cannot be separated from the advantages and limitations that these techniques possess. Thus, for example, the most recognized advantage of XAI/iML is its ability to untangle how AI/ML/DL black-box models make their predictions [91], that is, make a model interpretable. In this sense, a model is interpretable if it gives rise to not only mechanistic understanding (transparency) but also to a functional understanding [63]. Regarding the limitations of XAI/iML, some authors mention, for example, that XAI techniques cannot explain events that never happened in the past. “When faced with new and unprecedented circumstances, the explanations provided by XAI may not adequately account for these events, leading to potentially inaccurate forecasts” [103]. This could clearly explain the difficulty of obtaining a higher performance, as we found in this study, when the record includes the effects of an unprecedented drought, such as the one currently affecting the study area. Likewise, limitations are mentioned such as the lack of standardization of metrics and technique evaluation frameworks, a large number of taxonomies of very diverse XAI/iML techniques and, sometimes inconsistent among them, a lack of agreed definitions, etc. [63,103]. At the level of specific techniques, advantages and limitations are also recognized. For LIME, for example, while one advantage might be that “LIME’s explanations for an ML model’s prediction are optimized to be as simple as possible”, some disadvantages are that “LIME only remains faithful in its predictions for an ML model on a localized level” or “Despite the best efforts of LIME’s developers to simplify the explanations generated by this algorithm, the interpretability of the final results is still mediocre for non-expert users” [104]. The same occurs in the case of SHAP, where one of its advantages is that “As a mathematically enforced concept Shapley values have additional beneficial properties such as consistency and accuracy” while one of its disadvantages would be that “SHAP has been shown to be inconsistent and vulnerable to adversarial attacks despite the mathematical properties of Shapley Values” [104].
Finally, and even though this study aims to contribute to filling in the current knowledge gaps in XAI/iML/Hydro, there are clearly still several aspects that can be developed in future work. Among them is continuing to investigate issues not yet addressed, or the so-called emerging issues (see Figure 1d, in Section 1, Introduction). Among these, the role of XAI/iML in the interpretation of predictive black-box models associated with drought, water quality, lakes or downscaling applications are a few examples. Another relevant aspect mentioned by other authors is related to the so-called Rashomon Effect, “which describes the following phenomenon: for a given dataset there may exist many models with equally good performance but with different solution strategies. The Rashomon Effect has implications for Explainable Machine Learning, especially for the comparability of explanations” [105]. As recognized by a recent XAI/iML/Hydro study on the matter: “[…] while the field of interpretable ML has started to blossom in the recent past, little attention has been directed to this topic.” [106]. The findings of our study, as well as the recognized advantages and limitations of XAI/iML, guide future work in this direction.

5. Conclusions

The present study seeks to contribute to addressing the challenge of expanding the use of XAI/iML globally, particularly in the southern hemisphere, where, apart from in Australia, there is a large adoption gap. It examines the challenge of expanding its application to new research topics, and presents the application of XAI/iML to the prediction of snowmelt-driven streamflow in an arid basin in the north-central region of Chile in the southern hemisphere. The work shows that the use of XAI/iML techniques such as variable importance, partial dependence plots, accumulated local effects plots, Shapley values and local interpretable model-agnostic explanations contribute significantly to the interpretation of the black-box prediction models generated with the Random Forest ML technique. At the model level, the hydrometeorological variables in the vicinity of the basin are more important than the climatic variables in streamflow prediction for one and four months ahead.
The findings also show that the models predict the low streamflow values at the monitoring station for the year 2020 in terms of the hydrometeorological variables in the vicinity of the basin associated with low streamflow and precipitation under drought conditions.
Finally, the importance of contributing to the adoption of XAI/iML in the hydrological community is not only justified by the contribution that this discipline can have in the progress of the understanding of hydrological processes, but also by the role it is having regarding accountability in trustworthy AI/ML/DL for high-stakes decision-making systems.

Author Contributions

Conceptualization, J.N.; methodology, J.N., M.A.Y. and C.B.C.; software, J.N.; validation, J.N.; formal analysis, J.N.; writing—original draft preparation, J.N.; writing—review and editing, J.N., M.A.Y. and C.B.C.; project administration, J.N.; funding acquisition, J.N. All authors have read and agreed to the published version of the manuscript.

Funding

The financial support of DIDULS/ULS is received through the project N° PAAI21195.

Data Availability Statement

This work has been developed from public databases, as described in the manuscript.

Conflicts of Interest

The authors declare no conflict of interest.

Appendix A

Plots in panel a were generated after processing 2008 scientific papers obtained from three bibliographic databases (collections) extracted from the Scopus search engine (www.scopus.com) accessed on 16 May 2023 using three keyword combinations (i.e., (a) Machine learning AND hydrolog*, (b) Deep learning AND hydrolog*, and (c) Artificial intelligence AND hydrolog*), with their respective restriction criteria, for the 2003–2022 record period. The search was conducted in titles, keywords, and abstracts. Publication period (2003–2022), document type (articles), language (English), and subject area (environmental sciences, earth and planetary sciences, agricultural and biological sciences, engineering, computer science, mathematics, energy, multidisciplinary, and decision sciences) were used as inclusion criteria (filters). Each result dataset (collection) was downloaded in csv format, incorporating all available download attributes. The three datasets were combined to then remove duplicates and refine the database (delete records with missing data in the Author, Keyword Plus, and DOI fields)
Plots in panels b, c and d were generated with the same search criteria but using the following keyword combinations (explainable artificial intelligence + hydrolog*; Interpretable machine learning + hydrolog*, XAI + hydrolog*, explainable machine learning + hydrolog*).

References

  1. Mukhamediev, R.I.; Popova, Y.; Kuchin, Y.; Zaitseva, E.; Kalimoldayev, A.; Symagulov, A.; Levashenko, V.; Abdoldina, F.; Gopejenko, V.; Yakunin, K.; et al. Review of Artificial Intelligence and Machine Learning Technologies: Classification, Restrictions, Opportunities and Challenges. Mathematics 2022, 10, 2552. [Google Scholar] [CrossRef]
  2. Lange, H.; Sippel, S. Machine Learning Applications in Hydrology. In Forest-Water Interactions; Levia, D.F., Carlyle-Moses, D.E., Iida, S., Michalzik, B., Nanko, K., Tischer, A., Eds.; Ecological Studies; Springer International Publishing: Cham, Switzerland, 2020; pp. 233–257. [Google Scholar] [CrossRef]
  3. Sit, M.; Demiray, B.Z.; Xiang, Z.; Ewing, G.J.; Sermet, Y.; Demir, I. A Comprehensive Review of Deep Learning Applications in Hydrology and Water Resources. Water Sci. Technol. 2020, 82, 2635–2670. [Google Scholar] [CrossRef]
  4. Xu, T.; Liang, F. Machine Learning for Hydrologic Sciences: An Introductory Overview. WIREs Water 2021, 8, e1533. [Google Scholar] [CrossRef]
  5. Chang, F.-J.; Chang, L.-C.; Chen, J.-F. Artificial Intelligence Techniques in Hydrology and Water Resources Management. Water 2023, 15, 1846. [Google Scholar] [CrossRef]
  6. Stafford, N. Science in the Digital Age. Nature 2010, 467, S19–S21. [Google Scholar] [CrossRef]
  7. Jandrić, P. Digital: The Three Ages of the Digital; Brill: Leiden, The Netherlands, 2019; pp. 161–176. [Google Scholar] [CrossRef]
  8. Doorn, N. Artificial Intelligence in the Water Domain: Opportunities for Responsible Use. Sci. Total Environ. 2021, 755, 142561. [Google Scholar] [CrossRef]
  9. Luers, A.L. Planetary Intelligence for Sustainability in the Digital Age: Five Priorities. One Earth 2021, 4, 772–775. [Google Scholar] [CrossRef]
  10. Sun, Z.; Sandoval, L.; Crystal-Ornelas, R.; Mousavi, S.M.; Wang, J.; Lin, C.; Cristea, N.; Tong, D.; Carande, W.H.; Ma, X.; et al. A Review of Earth Artificial Intelligence. Comput. Geosci. 2022, 159, 105034. [Google Scholar] [CrossRef]
  11. Ho, Y.-S.; Wang, M.-H. A Bibliometric Analysis of Artificial Intelligence Publications from 1991 to 2018. COLLNET J. Scientometr. Inf. Manag. 2020, 14, 369–392. [Google Scholar] [CrossRef]
  12. See, L.; Solomatine, D.; Abrahart, R.; Toth, E. Hydroinformatics: Computational Intelligence and Technological Developments in Water Science Applications—Editorial. Hydrol. Sci. J. 2007, 52, 391–396. [Google Scholar] [CrossRef]
  13. Babovic, V.; Han, D.; Chen, Y. Artificial Intelligence within IAHR: Past, Present and Future. Hydrolink 2021-2 Artificial Intelligence. Available online: https://www.iahr.org/library/infor?pid=10796 (accessed on 15 October 2022).
  14. Raclot, D.; Puech, C. What Does Ai Contribute to Hydrology? Aerial Photos and Flood Levels. Appl. Artif. Intell. 2003, 17, 71–86. [Google Scholar] [CrossRef]
  15. Nearing, G.S.; Kratzert, F.; Sampson, A.K.; Pelissier, C.S.; Klotz, D.; Frame, J.M.; Prieto, C.; Gupta, H.V. What Role Does Hydrological Science Play in the Age of Machine Learning? Water Resour. Res. 2021, 57, e2020WR028091. [Google Scholar] [CrossRef]
  16. Li, J.; Huang, W. Paradigm Shift in Science with Tackling Global Challenges. Natl. Sci. Rev. 2019, 6, 1091–1093. [Google Scholar] [CrossRef] [PubMed]
  17. Nearing, G.; Kratzert, F.; Pelissier, C.; Klotz, D.; Frame, J.; Gupta, H. Machine Learning Is Central to the Future of Hydrological Modeling. In Proceedings of the EGU General Assembly 2020, Online, 4–8 May 2020. EGU2020-6111. [Google Scholar] [CrossRef]
  18. Blöschl, G.; Bierkens, M.F.P.; Chambel, A.; Cudennec, C.; Destouni, G.; Fiori, A.; Kirchner, J.W.; McDonnell, J.J.; Savenije, H.H.G.; Sivapalan, M.; et al. Twenty-Three Unsolved Problems in Hydrology (UPH)—A Community Perspective. Hydrol. Sci. J. 2019, 64, 1141–1158. [Google Scholar] [CrossRef]
  19. Wagener, T.; Sivapalan, M.; Troch, P.A.; McGlynn, B.L.; Harman, C.J.; Gupta, H.V.; Kumar, P.; Rao, P.S.C.; Basu, N.B.; Wilson, J.S. The Future of Hydrology: An Evolving Science for a Changing World. Water Resour. Res. 2010, 46. [Google Scholar] [CrossRef]
  20. Montanari, A.; Young, G.; Savenije, H.H.G.; Hughes, D.; Wagener, T.; Ren, L.L.; Koutsoyiannis, D.; Cudennec, C.; Toth, E.; Grimaldi, S.; et al. “Panta Rhei—Everything Flows”: Change in Hydrology and Society—The IAHS Scientific Decade 2013–2022. Hydrol. Sci. J. 2013, 58, 1256–1275. [Google Scholar] [CrossRef]
  21. McMillan, H.; Montanari, A.; Cudennec, C.; Savenije, H.; Kreibich, H.; Krueger, T.; Liu, J.; Mejia, A.; Van Loon, A.; Aksoy, H.; et al. Panta Rhei 2013–2015: Global Perspectives on Hydrology, Society and Change. Hydrol. Sci. J. 2016, 61, 1174–1191. [Google Scholar] [CrossRef]
  22. Erasmus, A.; Brunet, T.D.P.; Fisher, E. What Is Interpretability? Philos. Technol. 2021, 34, 833–862. [Google Scholar] [CrossRef]
  23. Beisbart, C.; Räz, T. Philosophy of Science at Sea: Clarifying the Interpretability of Machine Learning. Philos. Compass 2022, 17, e12830. [Google Scholar] [CrossRef]
  24. Abrahart, R.J.; Anctil, F.; Coulibaly, P.; Dawson, C.W.; Mount, N.J.; See, L.M.; Shamseldin, A.Y.; Solomatine, D.P.; Toth, E.; Wilby, R.L. Two Decades of Anarchy? Emerging Themes and Outstanding Challenges for Neural Network River Forecasting. Prog. Phys. Geogr. Earth Environ. 2012, 36, 480–513. [Google Scholar] [CrossRef]
  25. Elgin, C.Z. Interpretation And Understanding. Erkenntnis 2000, 52, 175–183. [Google Scholar] [CrossRef]
  26. Moreido, V.; Gartsman, B.; Solomatine, D.P.; Suchilina, Z. How Well Can Machine Learning Models Perform without Hydrologists? Application of Rational Feature Selection to Improve Hydrological Forecasting. Water 2021, 13, 1696. [Google Scholar] [CrossRef]
  27. Shen, C.; Chen, X.; Laloy, E. Editorial: Broadening the Use of Machine Learning in Hydrology. Front. Water 2021, 3, 681023. [Google Scholar] [CrossRef]
  28. Barredo Arrieta, A.; Díaz-Rodríguez, N.; Del Ser, J.; Bennetot, A.; Tabik, S.; Barbado, A.; Garcia, S.; Gil-Lopez, S.; Molina, D.; Benjamins, R.; et al. Explainable Artificial Intelligence (XAI): Concepts, Taxonomies, Opportunities and Challenges toward Responsible AI. Inf. Fusion 2020, 58, 82–115. [Google Scholar] [CrossRef]
  29. Dziugaite, G.K.; Ben-David, S.; Roy, D.M. Enforcing Interpretability and Its Statistical Impacts: Trade-Offs between Accuracy and Interpretability. arXiv 2020, arXiv:2010.13764. [Google Scholar] [CrossRef]
  30. Bell, A.; Solano-Kamaiko, I.; Nov, O.; Stoyanovich, J. It’s Just Not That Simple: An Empirical Study of the Accuracy-Explainability Trade-off in Machine Learning for Public Policy. In Proceedings of the 2022 ACM Conference on Fairness, Accountability, and Transparency, FAccT ’22, Seoul, Republic of Korea, 21–24 June 2022; Association for Computing Machinery: New York, NY, USA, 2022; pp. 248–266. [Google Scholar] [CrossRef]
  31. Gosiewska, A.; Kozak, A.; Biecek, P. Simpler Is Better: Lifting Interpretability-Performance Trade-off via Automated Feature Engineering. Decis. Support Syst. 2021, 150, 113556. [Google Scholar] [CrossRef]
  32. Boge, F.J.; Grünke, P.; Hillerbrand, R. Minds and Machines Special Issue: Machine Learning: Prediction Without Explanation? Minds Mach. 2022, 32, 1–9. [Google Scholar] [CrossRef]
  33. Feng, D.; Liu, J.; Lawson, K.; Shen, C. Differentiable, Learnable, Regionalized Process-Based Models with Physical Outputs Can Approach State-of-the-Art Hydrologic Prediction Accuracy. arXiv 2022, arXiv:2203.14827. [Google Scholar] [CrossRef]
  34. Varadharajan, C.; Appling, A.P.; Arora, B.; Christianson, D.S.; Hendrix, V.C.; Kumar, V.; Lima, A.R.; Müller, J.; Oliver, S.; Ombadi, M.; et al. Can Machine Learning Accelerate Process Understanding and Decision-Relevant Predictions of River Water Quality? Hydrol. Process. 2022, 36, e14565. [Google Scholar] [CrossRef]
  35. Chadalawada, J.; Herath, H.M.V.V.; Babovic, V. Hydrologically Informed Machine Learning for Rainfall-Runoff Modeling: A Genetic Programming-Based Toolkit for Automatic Model Induction. Water Resour. Res. 2020, 56, e2019WR026933. [Google Scholar] [CrossRef]
  36. Başağaoğlu, H.; Chakraborty, D.; Lago, C.D.; Gutierrez, L.; Şahinli, M.A.; Giacomoni, M.; Furl, C.; Mirchi, A.; Moriasi, D.; Şengör, S.S. A Review on Interpretable and Explainable Artificial Intelligence in Hydroclimatic Applications. Water 2022, 14, 1230. [Google Scholar] [CrossRef]
  37. Kok, I.; Okay, F.Y.; Muyanli, O.; Ozdemir, S. Explainable Artificial Intelligence (XAI) for Internet of Things: A Survey. arXiv 2022, arXiv:2206.04800. [Google Scholar] [CrossRef]
  38. Vishwarupe, V.; Joshi, P.M.; Mathias, N.; Maheshwari, S.; Mhaisalkar, S.; Pawar, V. Explainable AI and Interpretable Machine Learning: A Case Study in Perspective. Procedia Comput. Sci. 2022, 204, 869–876. [Google Scholar] [CrossRef]
  39. Aria, M.; Cuccurullo, C. Bibliometrix: An R-Tool for Comprehensive Science Mapping Analysis. J. Informetr. 2017, 11, 959–975. [Google Scholar] [CrossRef]
  40. Alkhammash, R. Bibliometric, Network, and Thematic Mapping Analyses of Metaphor and Discourse in COVID-19 Publications from 2020 to 2022. Front. Psychol. 2023, 13, 1062943. [Google Scholar] [CrossRef] [PubMed]
  41. Morante-Carballo, F.; Montalván-Burbano, N.; Quiñonez-Barzola, X.; Jaya-Montalvo, M.; Carrión-Mero, P. What Do We Know about Water Scarcity in Semi-Arid Zones? A Global Analysis and Research Trends. Water 2022, 14, 2685. [Google Scholar] [CrossRef]
  42. Garreaud, R.D.; Boisier, J.P.; Rondanelli, R.; Montecinos, A.; Sepúlveda, H.H.; Veloso-Aguila, D. The Central Chile Mega Drought (2010–2018): A Climate Dynamics Perspective. Int. J. Climatol. 2020, 40, 421–439. [Google Scholar] [CrossRef]
  43. Correa, H. Análisis de rutas de nieve y pronóstico de caudales en Chile Central: Variabilidad espacial y temporal. Tesis de Pregrado, Universidad de Chile, Santiago, Chile, 2013. Available online: https://repositorio.uchile.cl/handle/2250/115278 (accessed on 18 June 2023).
  44. Cutler, A.; Cutler, D.R.; Stevens, J.R. Random Forests. In Ensemble Machine Learning: Methods and Applications; Zhang, C., Ma, Y., Eds.; Springer: New York, NY, USA, 2012; pp. 157–175. [Google Scholar] [CrossRef]
  45. Guidotti, R.; Monreale, A.; Ruggieri, S.; Naretto, F.; Turini, F.; Pedreschi, D.; Giannotti, F. Stable and Actionable Explanations of Black-Box Models through Factual and Counterfactual Rules. Data Min. Knowl. Discov. 2022, 1–38. [Google Scholar] [CrossRef]
  46. Vergni, L.; Todisco, F. A Random Forest Machine Learning Approach for the Identification and Quantification of Erosive Events. Water 2023, 15, 2225. [Google Scholar] [CrossRef]
  47. Fleming, S.W.; Garen, D.C.; Goodbody, A.G.; McCarthy, C.S.; Landers, L.C. Assessing the New Natural Resources Conservation Service Water Supply Forecast Model for the American West: A Challenging Test of Explainable, Automated, Ensemble Artificial Intelligence. J. Hydrol. 2021, 602, 126782. [Google Scholar] [CrossRef]
  48. Cortés, C.; Yáñez, M. Pronóstico de Caudales de Deshielo en las Cuencas de los ríos HUASCO y Elqui, Chile Centro-Norte; Memoria; Universidad de La Serena: La Serena, Chile, 2021. [Google Scholar]
  49. Mayer, M. MissRanger: Fast Imputation of Missing Values. 2021. Available online: https://CRAN.R-project.org/package=missRanger (accessed on 9 September 2023).
  50. R Core Team. R: A Language and Environment for Statistical Computing; R Foundation for Statistical Computing: Vienna, Austria, 2021. [Google Scholar]
  51. Kuhn, M. Building Predictive Models in R Using the Caret Package. J. Stat. Softw. 2008, 28, 1–26. [Google Scholar] [CrossRef]
  52. Kursa, M.B.; Rudnicki, W.R. Feature Selection with the Boruta Package. J. Stat. Softw. 2010, 36, 1–13. [Google Scholar] [CrossRef]
  53. Biecek, P. DALEX: Explainers for Complex Predictive Models in R. J. Mach. Learn. Res. 2018, 19, 3245–3249. [Google Scholar]
  54. Maksymiuk, S.; Gosiewska, A.; Biecek, P. Landscape of R Packages for EXplainable Artificial Intelligence. arXiv 2020, arXiv:2009.13248. [Google Scholar]
  55. Wickham, H.; Averick, M.; Bryan, J.; Chang, W.; McGowan, L.D.; François, R.; Grolemund, G.; Hayes, A.; Henry, L.; Hester, J.; et al. Welcome to the Tidyverse. J. Open Source Softw. 2019, 4, 1686. [Google Scholar] [CrossRef]
  56. Biecek, P.; Burzykowski, T. Explanatory Models Analysis: Explore, Explain, and Examine Predictive Models; CRC Press: Boca Raton, FL, USA, 2021. [Google Scholar]
  57. Speiser, J.L.; Miller, M.E.; Tooze, J.; Ip, E. A Comparison of Random Forest Variable Selection Methods for Classification Prediction Modeling. Expert Syst. Appl. 2019, 134, 93–101. [Google Scholar] [CrossRef]
  58. Song, Q.C.; Tang, C.; Wee, S. Making Sense of Model Generalizability: A Tutorial on Cross-Validation in R and Shiny. Adv. Methods Pract. Psychol. Sci. 2021, 4, 2515245920947067. [Google Scholar] [CrossRef]
  59. Bag, S.; Gupta, K.; Deb, S. A Review and Recommendations on Variable Selection Methods in Regression Models for Binary Data. arXiv 2022, arXiv:2201.06063. [Google Scholar] [CrossRef]
  60. Wright, M.N.; Ziegler, A. Ranger: A Fast Implementation of Random Forests for High Dimensional Data in C++ and R. J. Stat. Softw. 2017, 77, 1–17. [Google Scholar] [CrossRef]
  61. Eertink, J.J.; Heymans, M.W.; Zwezerijnen, G.J.C.; Zijlstra, J.M.; de Vet, H.C.W.; Boellaard, R. External Validation: A Simulation Study to Compare Cross-Validation versus Holdout or External Testing to Assess the Performance of Clinical Prediction Models Using PET Data from DLBCL Patients. EJNMMI Res. 2022, 12, 58. [Google Scholar] [CrossRef]
  62. Molnar, C.; König, G.; Herbinger, J.; Freiesleben, T.; Dandl, S.; Scholbeck, C.A.; Casalicchio, G.; Grosse-Wentrup, M.; Bischl, B. General Pitfalls of Model-Agnostic Interpretation Methods for Machine Learning Models. In Proceedings of the xxAI-Beyond Explainable AI: International Workshop, Held in Conjunction with ICML 2020, Vienna, Austria, 18 July 2020; Revised and Extended Papers. Holzinger, A., Goebel, R., Fong, R., Moon, T., Müller, K.-R., Samek, W., Eds.; Lecture Notes in Computer Science. Springer International Publishing: Cham, Switzerland, 2022; pp. 39–68. [Google Scholar] [CrossRef]
  63. Schwalbe, G.; Finzel, B. A Comprehensive Taxonomy for Explainable Artificial Intelligence: A Systematic Survey of Surveys on Methods and Concepts. Data Min. Knowl. Discov. 2023, 1–59. [Google Scholar] [CrossRef]
  64. Molnar, C. Interpretable Machine Learning: A Guide for Making Black Box Models Explainable, 2nd ed.; Independent Publisher: Munish, Germany, 2022. [Google Scholar]
  65. Delorit, J.; Gonzalez Ortuya, E.C.; Block, P. Evaluation of Model-Based Seasonal Streamflow and Water Allocation Forecasts for the Elqui Valley, Chile. Hydrol. Earth Syst. Sci. 2017, 21, 4711–4725. [Google Scholar] [CrossRef]
  66. Núñez, J.; Rivera, D.; Oyarzún, R.; Arumí, J.L. Influence of Pacific Ocean Multidecadal Variability on the Distributional Properties of Hydrological Variables in North-Central Chile. J. Hydrol. 2013, 501, 227–240. [Google Scholar] [CrossRef]
  67. Núñez, J.; Vergara, A.; Leyton, C.; Metzkes, C.; Mancilla, G.; Bettancourt, D. Reconciling Drought Vulnerability Assessment Using a Convergent Approach: Application to Water Security in the Elqui River Basin, North-Central Chile. Water 2017, 9, 589. [Google Scholar] [CrossRef]
  68. Zhou, G.; Cui, M.; Wan, J.; Zhang, S. A Review on Snowmelt Models: Progress and Prospect. Sustainability 2021, 13, 11485. [Google Scholar] [CrossRef]
  69. Garen, D.C.; Marks, D. Spatially Distributed Energy Balance Snowmelt Modelling in a Mountainous River Basin: Estimation of Meteorological Inputs and Verification of Model Results. J. Hydrol. 2005, 315, 126–153. [Google Scholar] [CrossRef]
  70. Apley, D.W.; Zhu, J. Visualizing the Effects of Predictor Variables in Black Box Supervised Learning Models. J. R. Stat. Soc. Ser. B Stat. Methodol. 2020, 82, 1059–1086. [Google Scholar] [CrossRef]
  71. Ribeiro, M.T.; Singh, S.; Guestrin, C. “Why Should I Trust You?”: Explaining the Predictions of Any Classifier. In Proceedings of the 22nd ACM SIGKDD International Conference on Knowledge Discovery and Data Mining, KDD ’16, San Francisco, CA, USA, 13–17 August 2016; Association for Computing Machinery: New York, NY, USA, 2016; pp. 1135–1144. [Google Scholar] [CrossRef]
  72. Mendoza, P.A.; Rajagopalan, B.; Clark, M.P.; Cortés, G.; McPhee, J. A Robust Multimodel Framework for Ensemble Seasonal Hydroclimatic Forecasts. Water Resour. Res. 2014, 50, 6030–6052. [Google Scholar] [CrossRef]
  73. Sproles, E.A.; Kerr, T.; Orrego Nelson, C.; Lopez Aspe, D. Developing a Snowmelt Forecast Model in the Absence of Field Data. Water Resour. Manag. 2016, 30, 2581–2590. [Google Scholar] [CrossRef]
  74. Araya, D. Evaluación de la metodología ESP para la generación de pronósticos de caudales de deshielo en cuencas de Chile Central. Tesis Pregrado, Memoria para optar al título de Ingeniero Civil, Universidad de Chile, Santiago, Chile, 2022. Available online: https://repositorio.uchile.cl/handle/2250/185501 (accessed on 18 June 2023).
  75. Breiman, L. Statistical Modeling: The Two Cultures (with Comments and a Rejoinder by the Author). Stat. Sci. 2001, 16, 199–231. [Google Scholar] [CrossRef]
  76. Gelman, A. Reflections on Breiman’s Two Cultures of Statistical Modeling. Obs. Stud. 2021, 7, 95–98. [Google Scholar] [CrossRef]
  77. Palacio, S.; Lucieri, A.; Munir, M.; Hees, J.; Ahmed, S.; Dengel, A. XAI Handbook: Towards a Unified Framework for Explainable AI. arXiv 2021, arXiv:2105.06677. [Google Scholar] [CrossRef]
  78. Althoff, D.; Rodrigues, L.N.; da Silva, D.D. Addressing Hydrological Modeling in Watersheds under Land Cover Change with Deep Learning. Adv. Water Resour. 2021, 154, 103965. [Google Scholar] [CrossRef]
  79. Chakraborty, D.; Başağaoğlu, H.; Gutierrez, L.; Mirchi, A. Explainable AI Reveals New Hydroclimatic Insights for Ecosystem-Centric Groundwater Management. Environ. Res. Lett. 2021, 16, 114024. [Google Scholar] [CrossRef]
  80. Liu, Q.; Gui, D.; Zhang, L.; Niu, J.; Dai, H.; Wei, G.; Hu, B.X. Simulation of Regional Groundwater Levels in Arid Regions Using Interpretable Machine Learning Models. Sci. Total Environ. 2022, 831, 154902. [Google Scholar] [CrossRef] [PubMed]
  81. Li, M.; Wang, G.; Cao, F.; Zong, S.; Chai, X. Determining Optimal Probability Distributions for Gridded Precipitation Data Based on L-Moments. Sci. Total Environ. 2023, 882, 163528. [Google Scholar] [CrossRef]
  82. Saranya, A.; Subhashini, R. A Systematic Review of Explainable Artificial Intelligence Models and Applications: Recent Developments and Future Trends. Decis. Anal. J. 2023, 7, 100230. [Google Scholar] [CrossRef]
  83. Angelov, P.P.; Soares, E.A.; Jiang, R.; Arnold, N.I.; Atkinson, P.M. Explainable Artificial Intelligence: An Analytical Review. WIREs Data Min. Knowl. Discov. 2021, 11, e1424. [Google Scholar] [CrossRef]
  84. Graziani, M.; Dutkiewicz, L.; Calvaresi, D.; Amorim, J.P.; Yordanova, K.; Vered, M.; Nair, R.; Abreu, P.H.; Blanke, T.; Pulignano, V.; et al. A Global Taxonomy of Interpretable AI: Unifying the Terminology for the Technical and Social Sciences. Artif. Intell. Rev. 2022, 56, 3473–3504. [Google Scholar] [CrossRef]
  85. Islam, M.R.; Ahmed, M.U.; Barua, S.; Begum, S. A Systematic Review of Explainable Artificial Intelligence in Terms of Different Application Domains and Tasks. Appl. Sci. 2022, 12, 1353. [Google Scholar] [CrossRef]
  86. Larsson, S.; Heintz, F. Transparency in Artificial Intelligence. Internet Policy Rev. 2020, 9. [Google Scholar] [CrossRef]
  87. Speith, T. A Review of Taxonomies of Explainable Artificial Intelligence (XAI) Methods. In Proceedings of the 2022 ACM Conference on Fairness, Accountability, and Transparency, FAccT ’22, Seoul, Republic of Korea, 21–24 June 2022; Association for Computing Machinery: New York, NY, USA, 2022; pp. 2239–2250. [Google Scholar] [CrossRef]
  88. Sivapalan, M.; Blöschl, G. The Growth of Hydrological Understanding: Technologies, Ideas, and Societal Needs Shape the Field. Water Resour. Res. 2017, 53, 8137–8146. [Google Scholar] [CrossRef]
  89. Fleming, S.W.; Vesselinov, V.V.; Goodbody, A.G. Augmenting Geophysical Interpretation of Data-Driven Operational Water Supply Forecast Modeling for a Western US River Using a Hybrid Machine Learning Approach. J. Hydrol. 2021, 597, 126327. [Google Scholar] [CrossRef]
  90. Cheng, S.; Cheng, L.; Qin, S.; Zhang, L.; Liu, P.; Liu, L.; Xu, Z.; Wang, Q. Improved Understanding of How Catchment Properties Control Hydrological Partitioning Through Machine Learning. Water Resour. Res. 2022, 58, e2021WR031412. [Google Scholar] [CrossRef]
  91. Althoff, D.; Bazame, H.C.; Nascimento, J.G. Untangling Hybrid Hydrological Models with Explainable Artificial Intelligence. H2Open J. 2021, 4, 13–28. [Google Scholar] [CrossRef]
  92. Yang, Y.; Chui, T.F.M. Modeling and Interpreting Hydrological Responses of Sustainable Urban Drainage Systems with Explainable Machine Learning Methods. Hydrol. Earth Syst. Sci. 2021, 25, 5839–5858. [Google Scholar] [CrossRef]
  93. El Bilali, A.; Abdeslam, T.; Ayoub, N.; Lamane, H.; Ezzaouini, M.A.; Elbeltagi, A. An Interpretable Machine Learning Approach Based on DNN, SVR, Extra Tree, and XGBoost Models for Predicting Daily Pan Evaporation. J. Environ. Manag. 2023, 327, 116890. [Google Scholar] [CrossRef]
  94. Stein, L.; Clark, M.P.; Knoben, W.J.M.; Pianosi, F.; Woods, R.A. How Do Climate and Catchment Attributes Influence Flood Generating Processes? A Large-Sample Study for 671 Catchments Across the Contiguous USA. Water Resour. Res. 2021, 57, e2020WR028300. [Google Scholar] [CrossRef]
  95. Adadi, A.; Berrada, M. Peeking Inside the Black-Box: A Survey on Explainable Artificial Intelligence (XAI). IEEE Access 2018, 6, 52138–52160. [Google Scholar] [CrossRef]
  96. Carvalho, D.V.; Pereira, E.M.; Cardoso, J.S. Machine Learning Interpretability: A Survey on Methods and Metrics. Electronics 2019, 8, 832. [Google Scholar] [CrossRef]
  97. Jobin, A.; Ienca, M.; Vayena, E. The Global Landscape of AI Ethics Guidelines. Nat. Mach. Intell. 2019, 1, 389–399. [Google Scholar] [CrossRef]
  98. Tidjon, L.N.; Khomh, F. The Different Faces of AI Ethics across the World: A Principle-Implementation Gap Analysis. arXiv 2022, arXiv:2206.03225. [Google Scholar] [CrossRef]
  99. Larsson, S. On the Governance of Artificial Intelligence through Ethics Guidelines. Asian J. Law Soc. 2020, 7, 437–451. [Google Scholar] [CrossRef]
  100. King, E.G.; O’Donnell, F.C.; Caylor, K.K. Reframing Hydrology Education to Solve Coupled Human and Environmental Problems. Hydrol. Earth Syst. Sci. 2012, 16, 4023–4031. [Google Scholar] [CrossRef]
  101. Brunner, M.I.; Slater, L.; Tallaksen, L.M.; Clark, M. Challenges in Modeling and Predicting Floods and Droughts: A Review. WIREs Water 2021, 8, e1520. [Google Scholar] [CrossRef]
  102. Sahoh, B.; Choksuriwong, A. The Role of Explainable Artificial Intelligence in High-Stakes Decision-Making Systems: A Systematic Review. J. Ambient Intell. Humaniz. Comput. 2023, 14, 7827–7843. [Google Scholar] [CrossRef]
  103. Yang, W.; Wei, Y.; Wei, H.; Chen, Y.; Huang, G.; Li, X.; Li, R.; Yao, N.; Wang, X.; Gu, X.; et al. Survey on Explainable AI: From Approaches, Limitations and Applications Aspects. Hum.-Centric Intell. Syst. 2023, 3, 161–188. [Google Scholar] [CrossRef]
  104. Knap, M. Model-Agnostic XAI Models: Benefits, Limitations and Research Directions. Bachelor’s Thesis, Delft University of Technology, Delft, The Netherlands, 2022. Available online: https://repository.tudelft.nl/islandora/object/uuid%3A34785364-3a1a-4ac0-be8b-668e4fd01721 (accessed on 16 August 2023).
  105. Müller, S.; Toborek, V.; Beckh, K.; Jakobs, M.; Bauckhage, C.; Welke, P. An Empirical Evaluation of the Rashomon Effect in Explainable Machine Learning. arXiv 2023, arXiv:2306.15786. [Google Scholar] [CrossRef]
  106. Schmidt, L.; Heße, F.; Attinger, S.; Kumar, R. Challenges in Applying Machine Learning Models for Hydrological Inference: A Case Study for Flooding Events Across Germany. Water Resour. Res. 2020, 56, e2019WR025924. [Google Scholar] [CrossRef]
Figure 1. Descriptive statistical plots of AI/ML/DL and XAI/iML hydrological research during 2003–2022. (a) Collaboration World Map and Average Growth Rate (AGR) plot for AI/ML/DL; (b) Average Growth Rate (AGR) plot for XAI/iML; (c) Collaboration Network for XAI/iML; (d) Thematic map of XAI/iML. Al plots were generated with the R package bibliometrix [39] using the procedure explained in Appendix A.
Water 15 03369 g001
Figure 2. Location map of the Elqui River basin, neighboring basins, and points of interest. Only the names of stations and points of interest in the vicinity of ERB have been placed on the map and labeled.
Water 15 03369 g002
Figure 3. Boxplot of monthly streamflow at Río Elqui en Algarrobal stream gauge station. Boxplots of the months used for prediction are highlighted in green. Vertical axis is plotted in log scale.
Water 15 03369 g003
Figure 4. Data pipeline for snowmelt-driven streamflow prediction in the study basin.
Water 15 03369 g004
Figure 5. Permutation-based variable importance by prediction model: (a) Model for 1 month in advance (m.i.a.) (Sep) and (b) Model for 4 months in advance (m.i.a.) (Dec). Names of stations located inside ERB are shown in bold.
Water 15 03369 g005
Figure 6. PDP and ALE plots by prediction model: (a) PDP—1 m.i.a. (Sep), (b) PDP—4 m.i.a. (Dec), (c) ALE–1 m.i.a. (Sep) and (d) ALE–4 m.i.a. (Dec). m.i.a. = Month(s) in advance.
Water 15 03369 g006
Figure 7. Shapley value and LIME plots based on prediction model: (a) SHAPv—September; (b) SHAPv—December; (c) LIME—September; (d) LIME—December. Names of stations located inside ERB are shown in bold.
Water 15 03369 g007
Table 1. Description of main data sources.
Type of Data SourceData
Category
Index or VariableSymbol in
Database
Main Source
Oceanic–AtmosphericEl NiñoEl Niño 3.4 SSTA
Niño 1.2 SSTA
SST_34
SST_12
HadISST, KNMI Climate Explorer and Met
Office Hadley Center
Antarctic OscillationAntarctic Oscillation index
Southern Annular Mode SLP
SAM_Z700
SAM_SLP
NOAA/NCEP/CPC

Natural Environment Research Council (NERC)
Geopotential heightSubtropical 500 hPa GH
Amundsen
Bellingshausen 500 hPa GH
Z500_sub
Z500_mid
NCEP/NCAR Reanalysis V1
Pacific Decadal OscillationPDO IndexPDOJoint
Institute for the Study of the Atmosphere and Ocean (JISAO)
Niño ModokiEl Niño Modoki IndexEMIJapan Agency for Marine-Earth Science
and Technology (JAMSTEC)
Southern OscillationSouthern Oscillation IndexSOINOAA/NCEP/CPC
Maden Julian OscillationMaden Julian OscillationMJ for each phase [1,…10]KNMI Climate Explorer
and NOAA/NCEP/CPC
Subtropical Southwest Pacific SSTSubtropical Southwest Pacific SST indexSST_SSPNCEP/NCAR Reanalysis V1
StreamflowStream gauge monthly streamflowQ_x_Ry_z: where
x: region
y: name of river
z: name of place
General Water Directorate of Chile
PrecipitationPrecipitation recordP_x_Ry_z: where
x: region
y: name of main river
z: acronym of rain gauge name
General Water Directorate of Chile
Grid-based precipitationERA5 monthly precipitationP_ERA5_i: where
i: name of polygon location
ERA 5 Reanalysis
Snow coverNormalized Difference Snow Index (NDSI)ndsiClimate Engine
Table 2. XAI/iML techniques potentially applicable to the field of hydrology.
ModelRMSER2MAE
TrainCross-VTrainCross-VTrainCross-V
1 m.i.a. (Sep)1.33132.59050.94210.85300.55171.8426
4 m.i.a. (Dec)5.674712.19060.94950.72821.51528.3943
Disclaimer/Publisher’s Note: The statements, opinions and data contained in all publications are solely those of the individual author(s) and contributor(s) and not of MDPI and/or the editor(s). MDPI and/or the editor(s) disclaim responsibility for any injury to people or property resulting from any ideas, methods, instructions or products referred to in the content.

