
Isotope Discrimination of Source Waters, Flowpaths, and Travel Times at an Acid-Generating, Lead–Zinc–Silver Mine, Silver Valley, Idaho, USA
 , , ,
, , ,
Abstract
:
1. Introduction
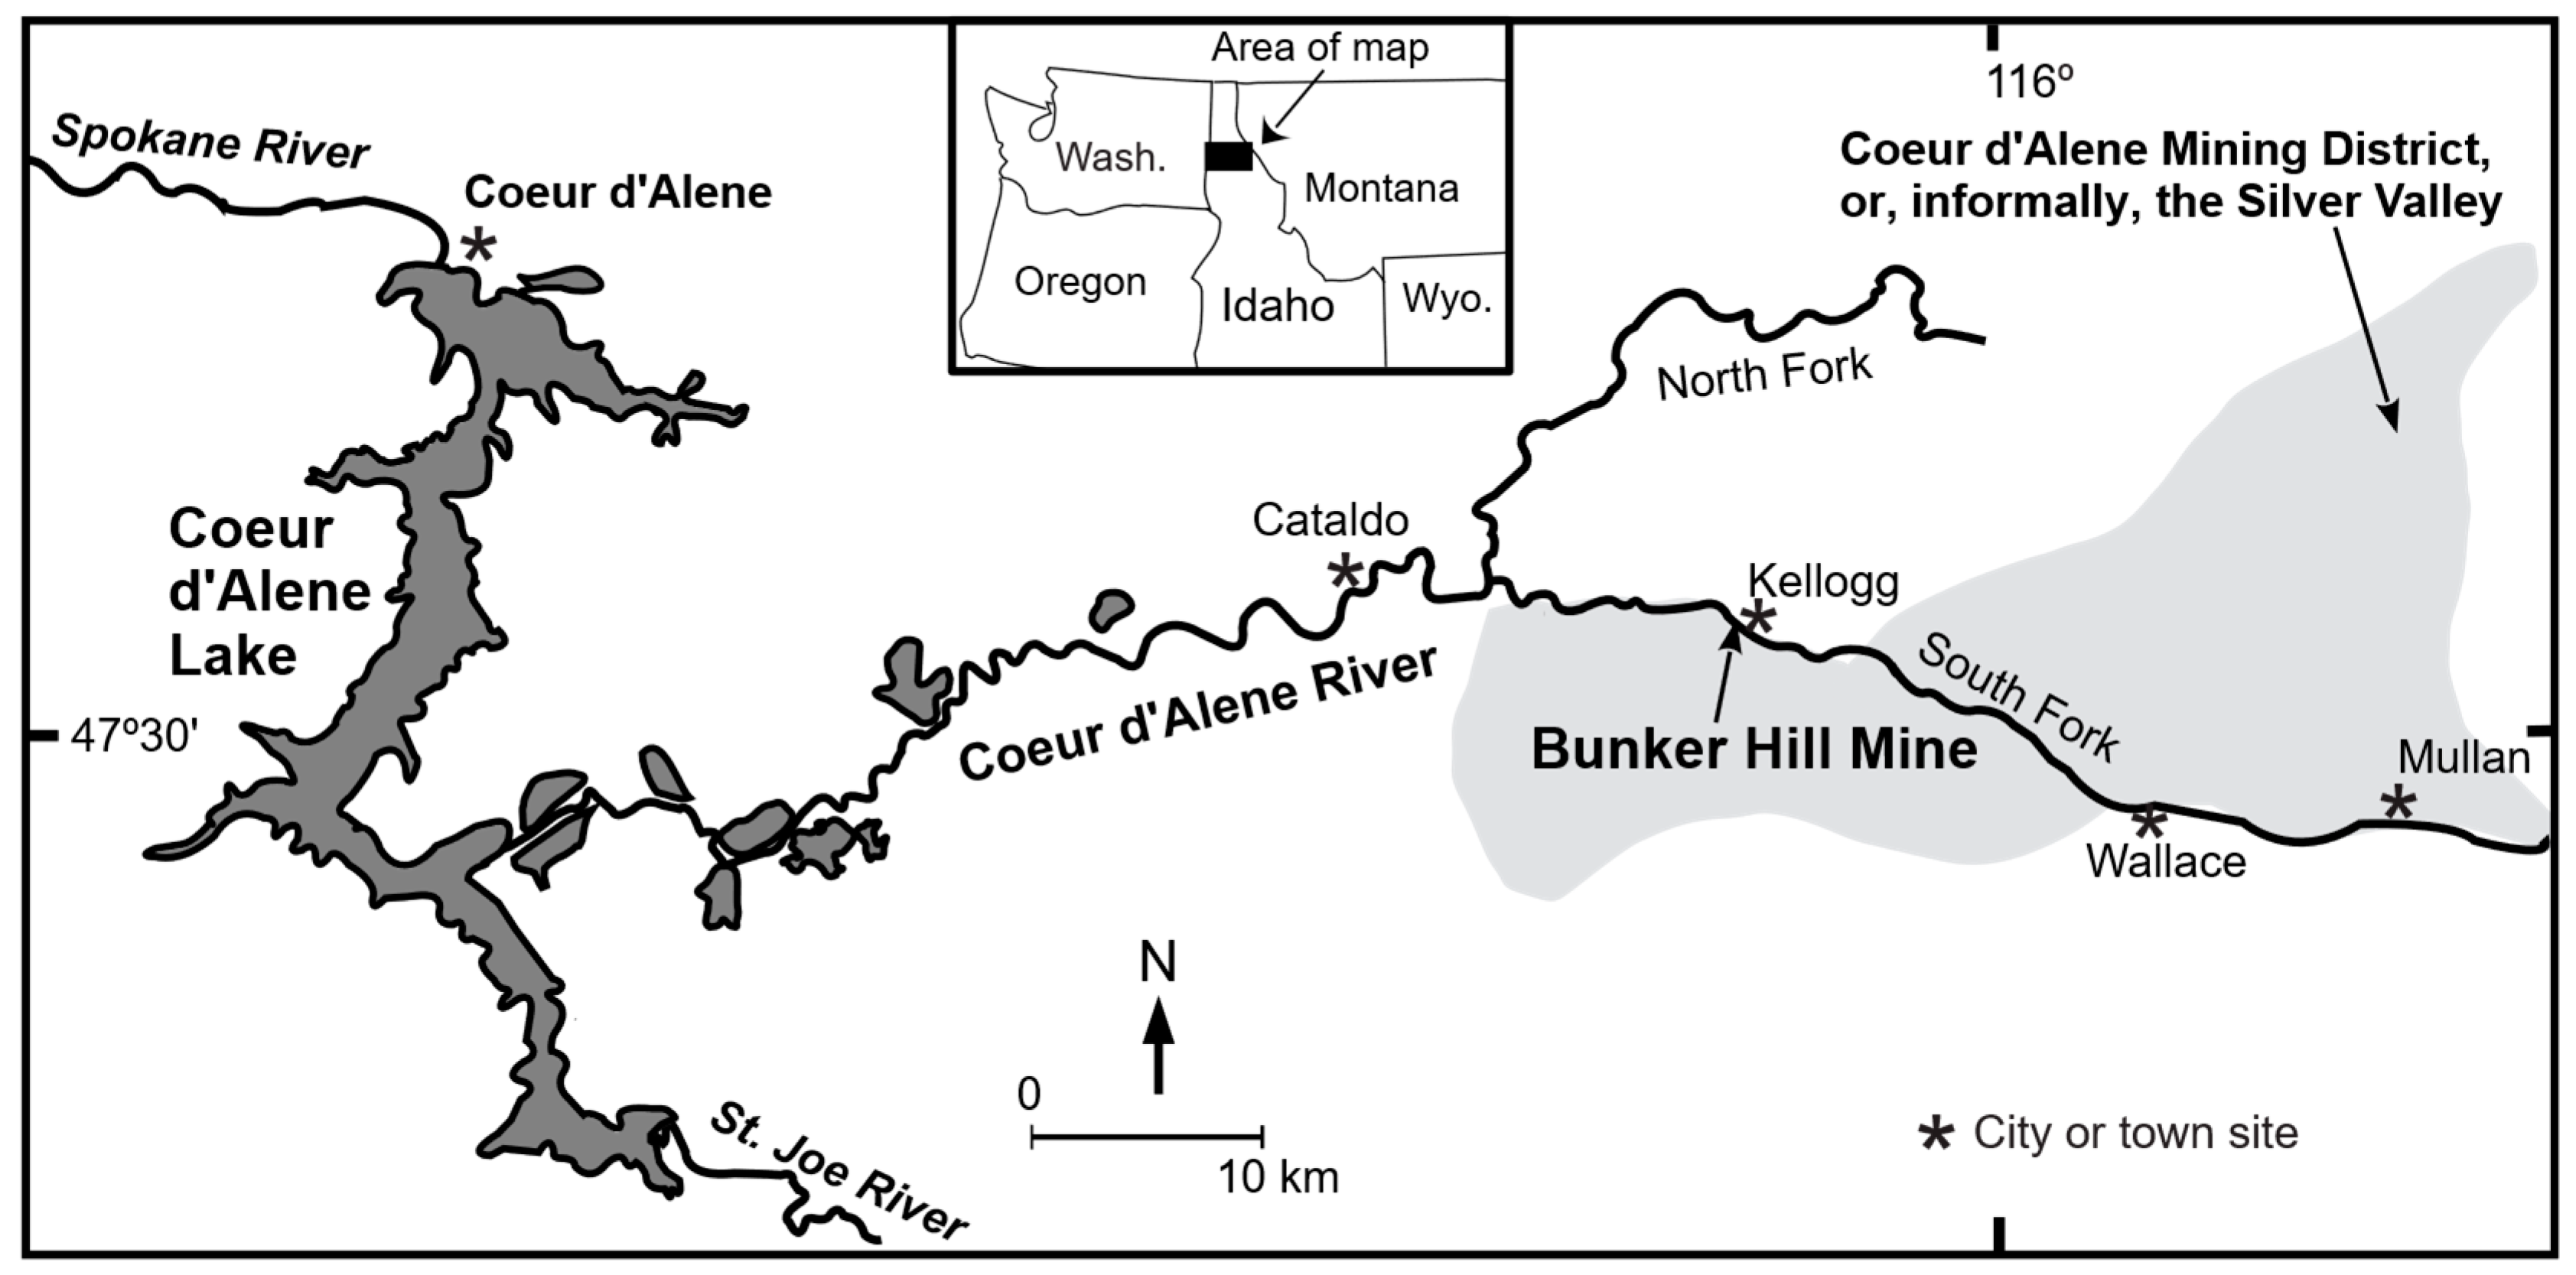
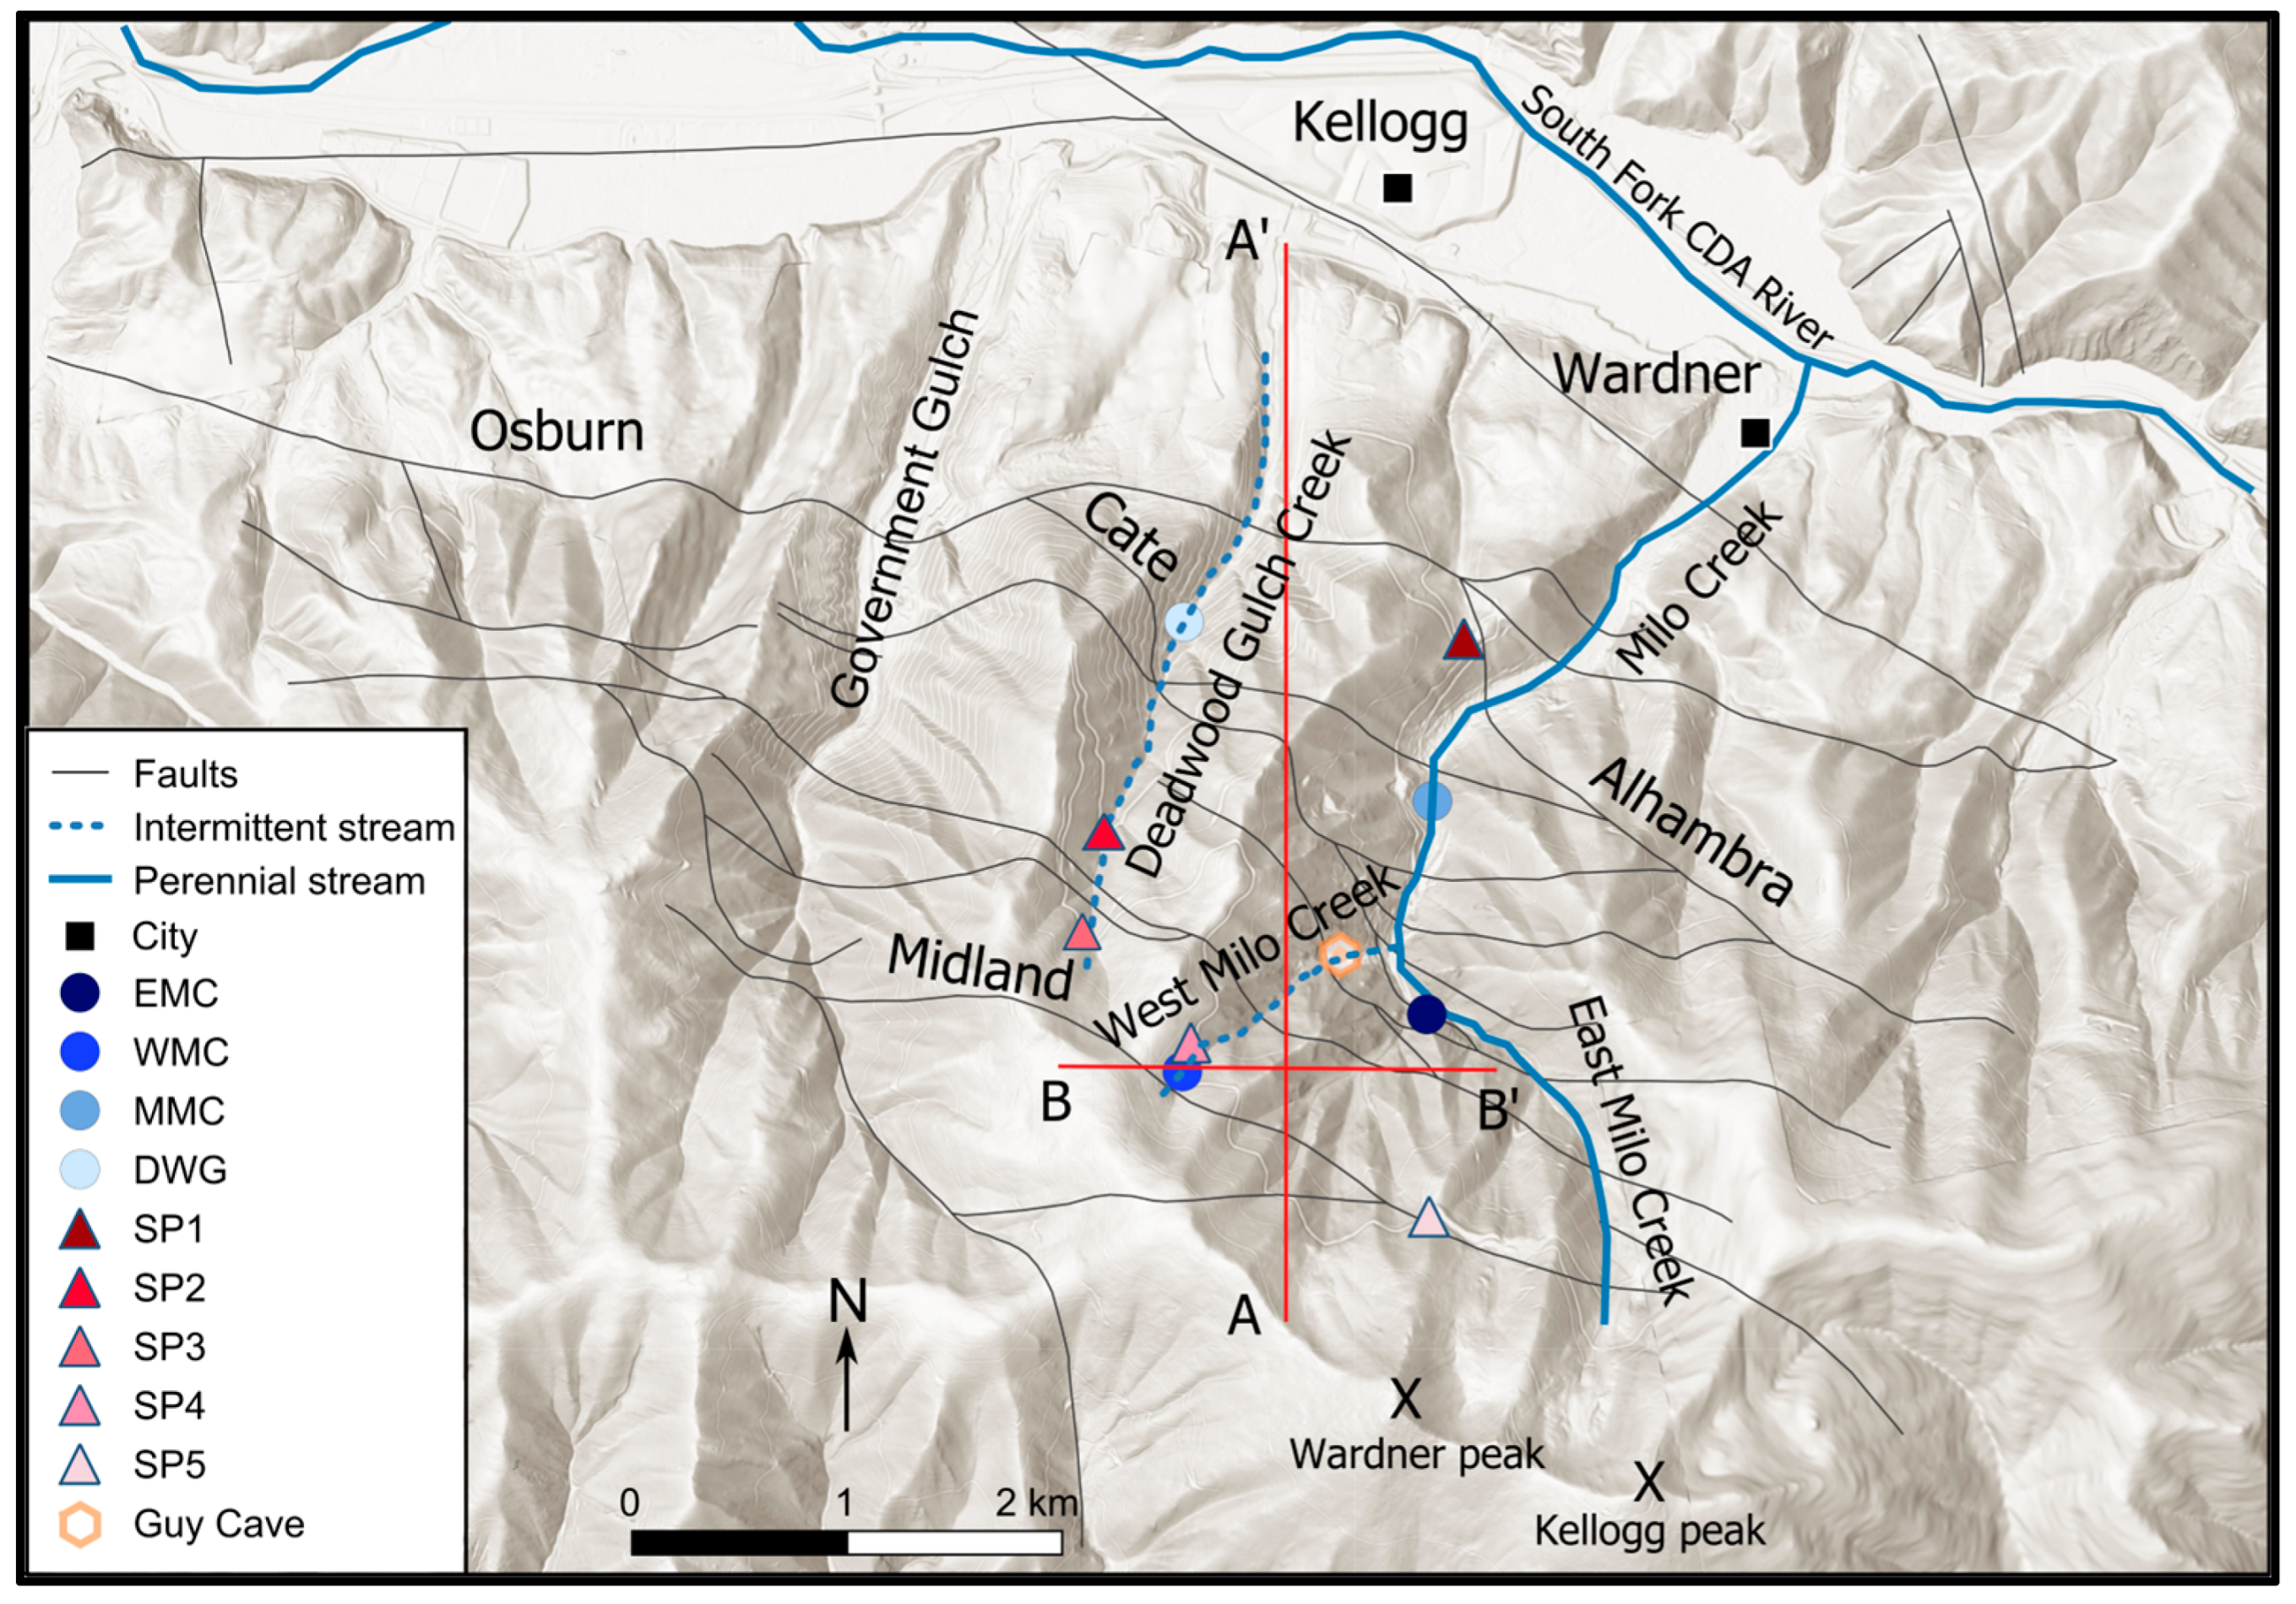
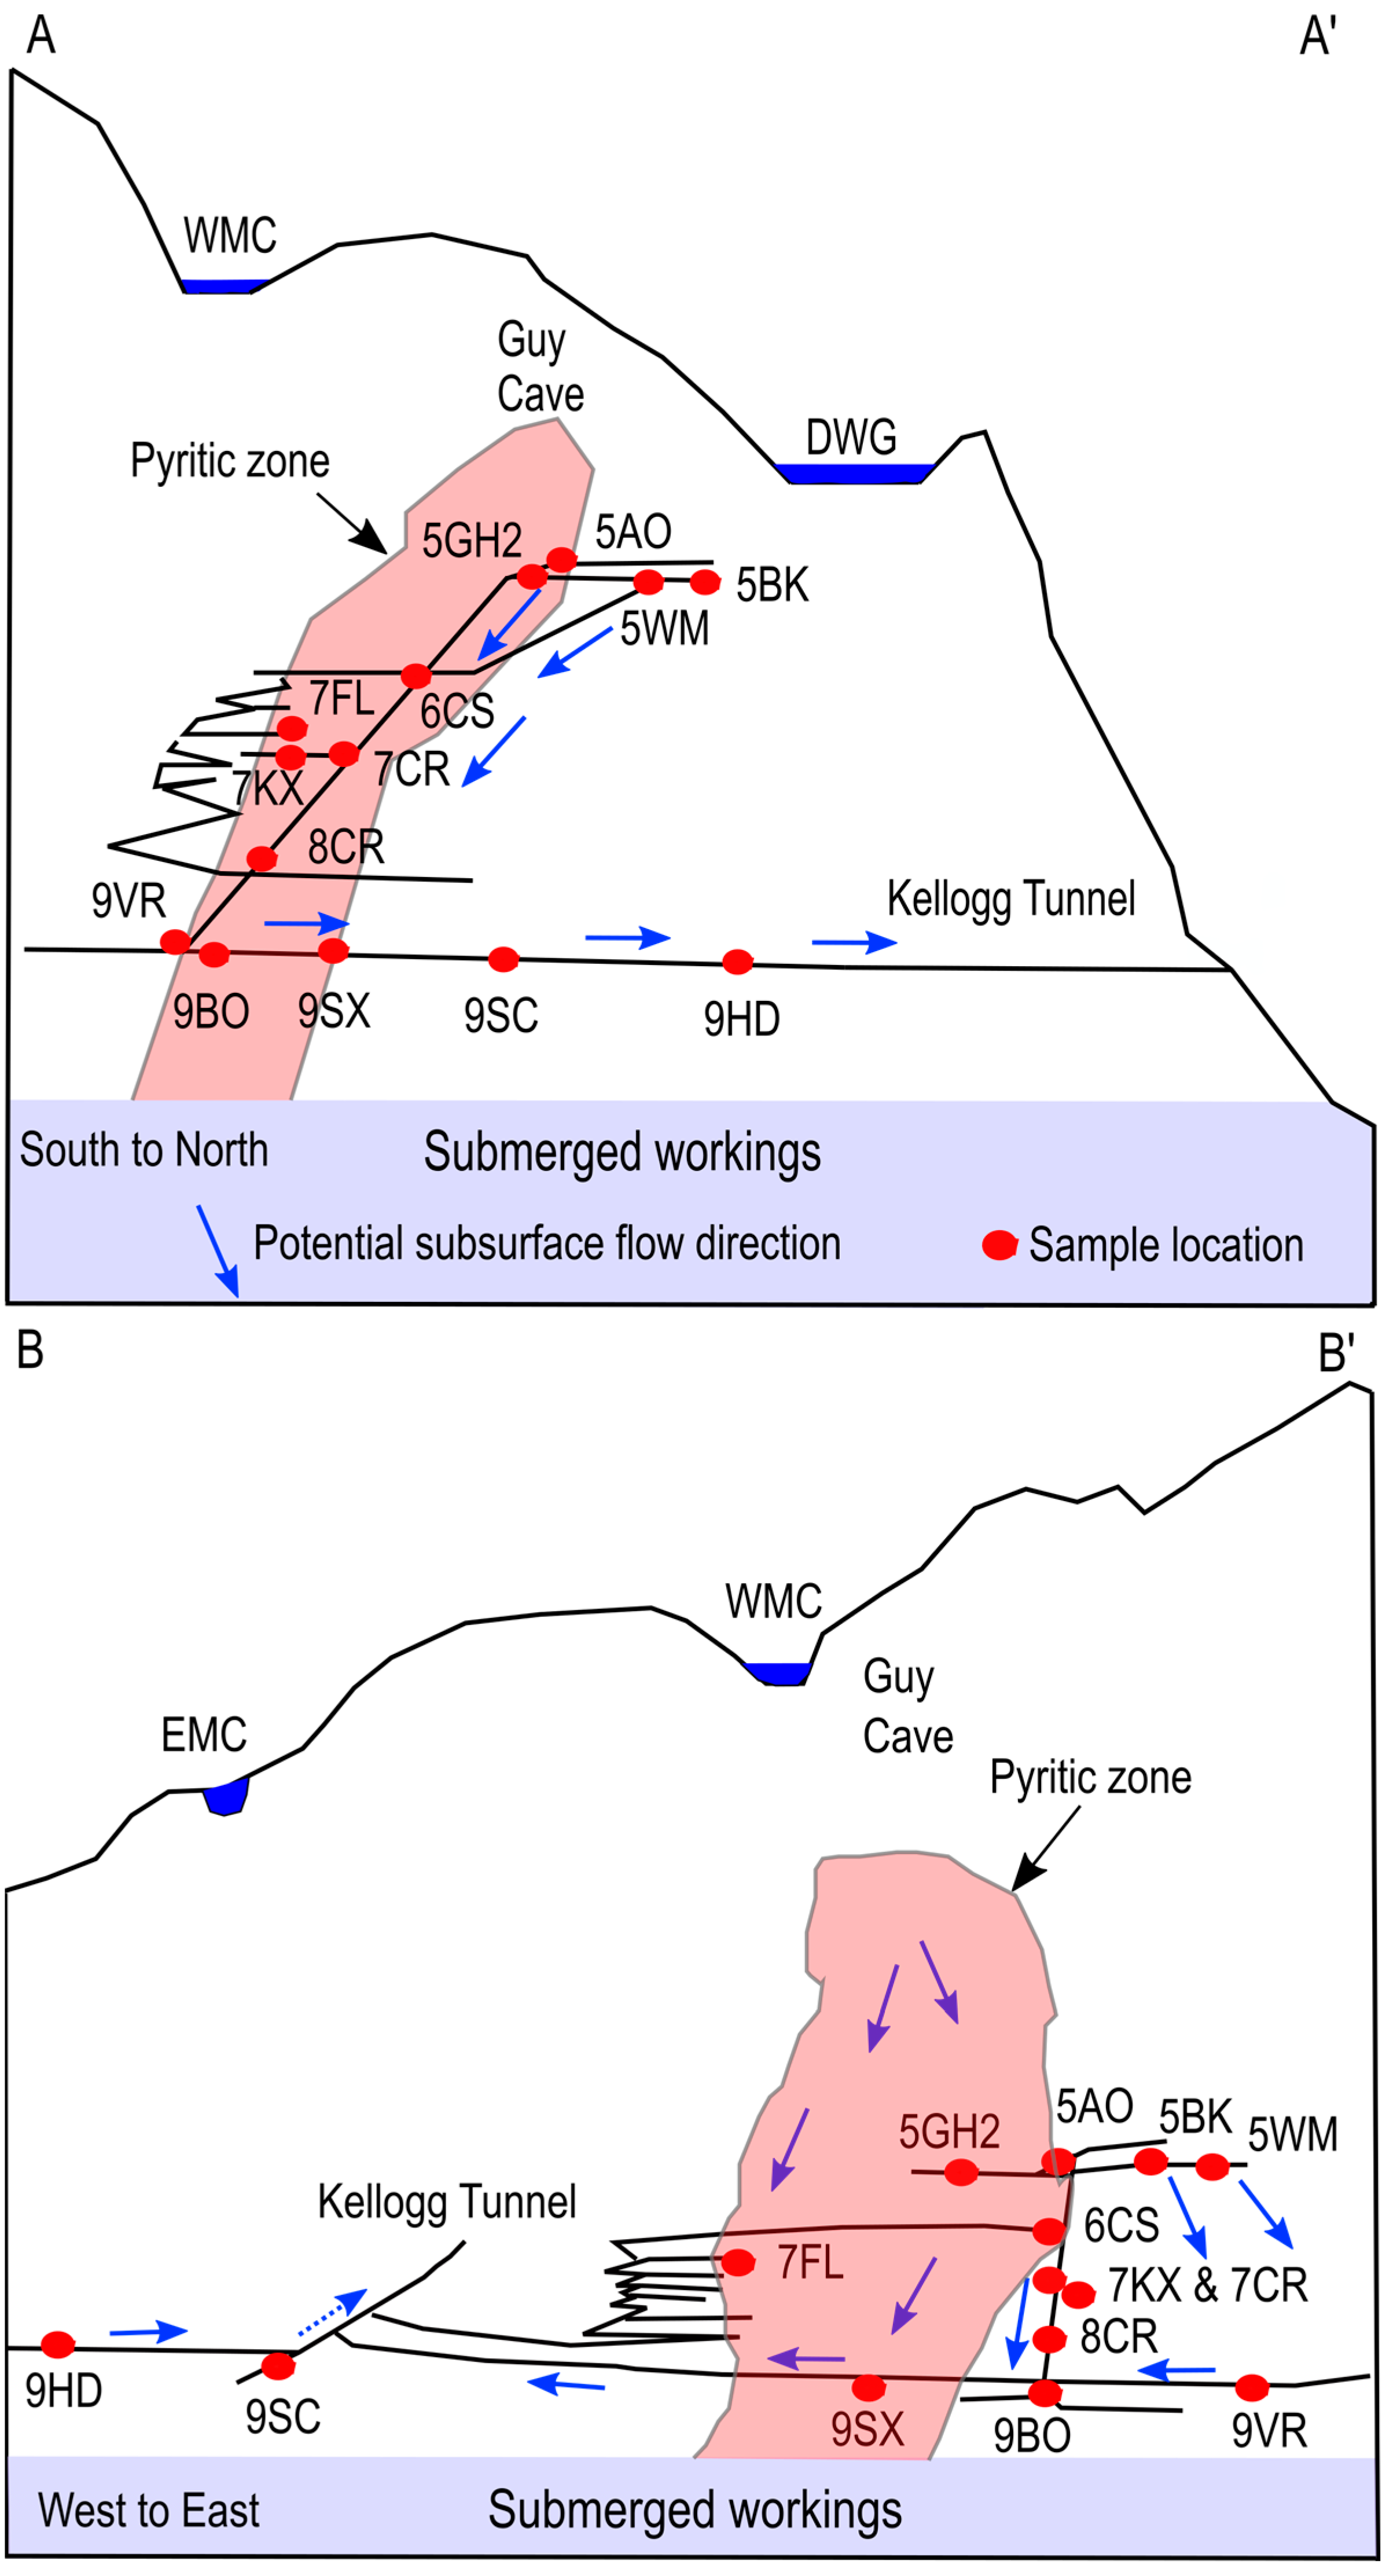
1.1. Basin and Mine Geology
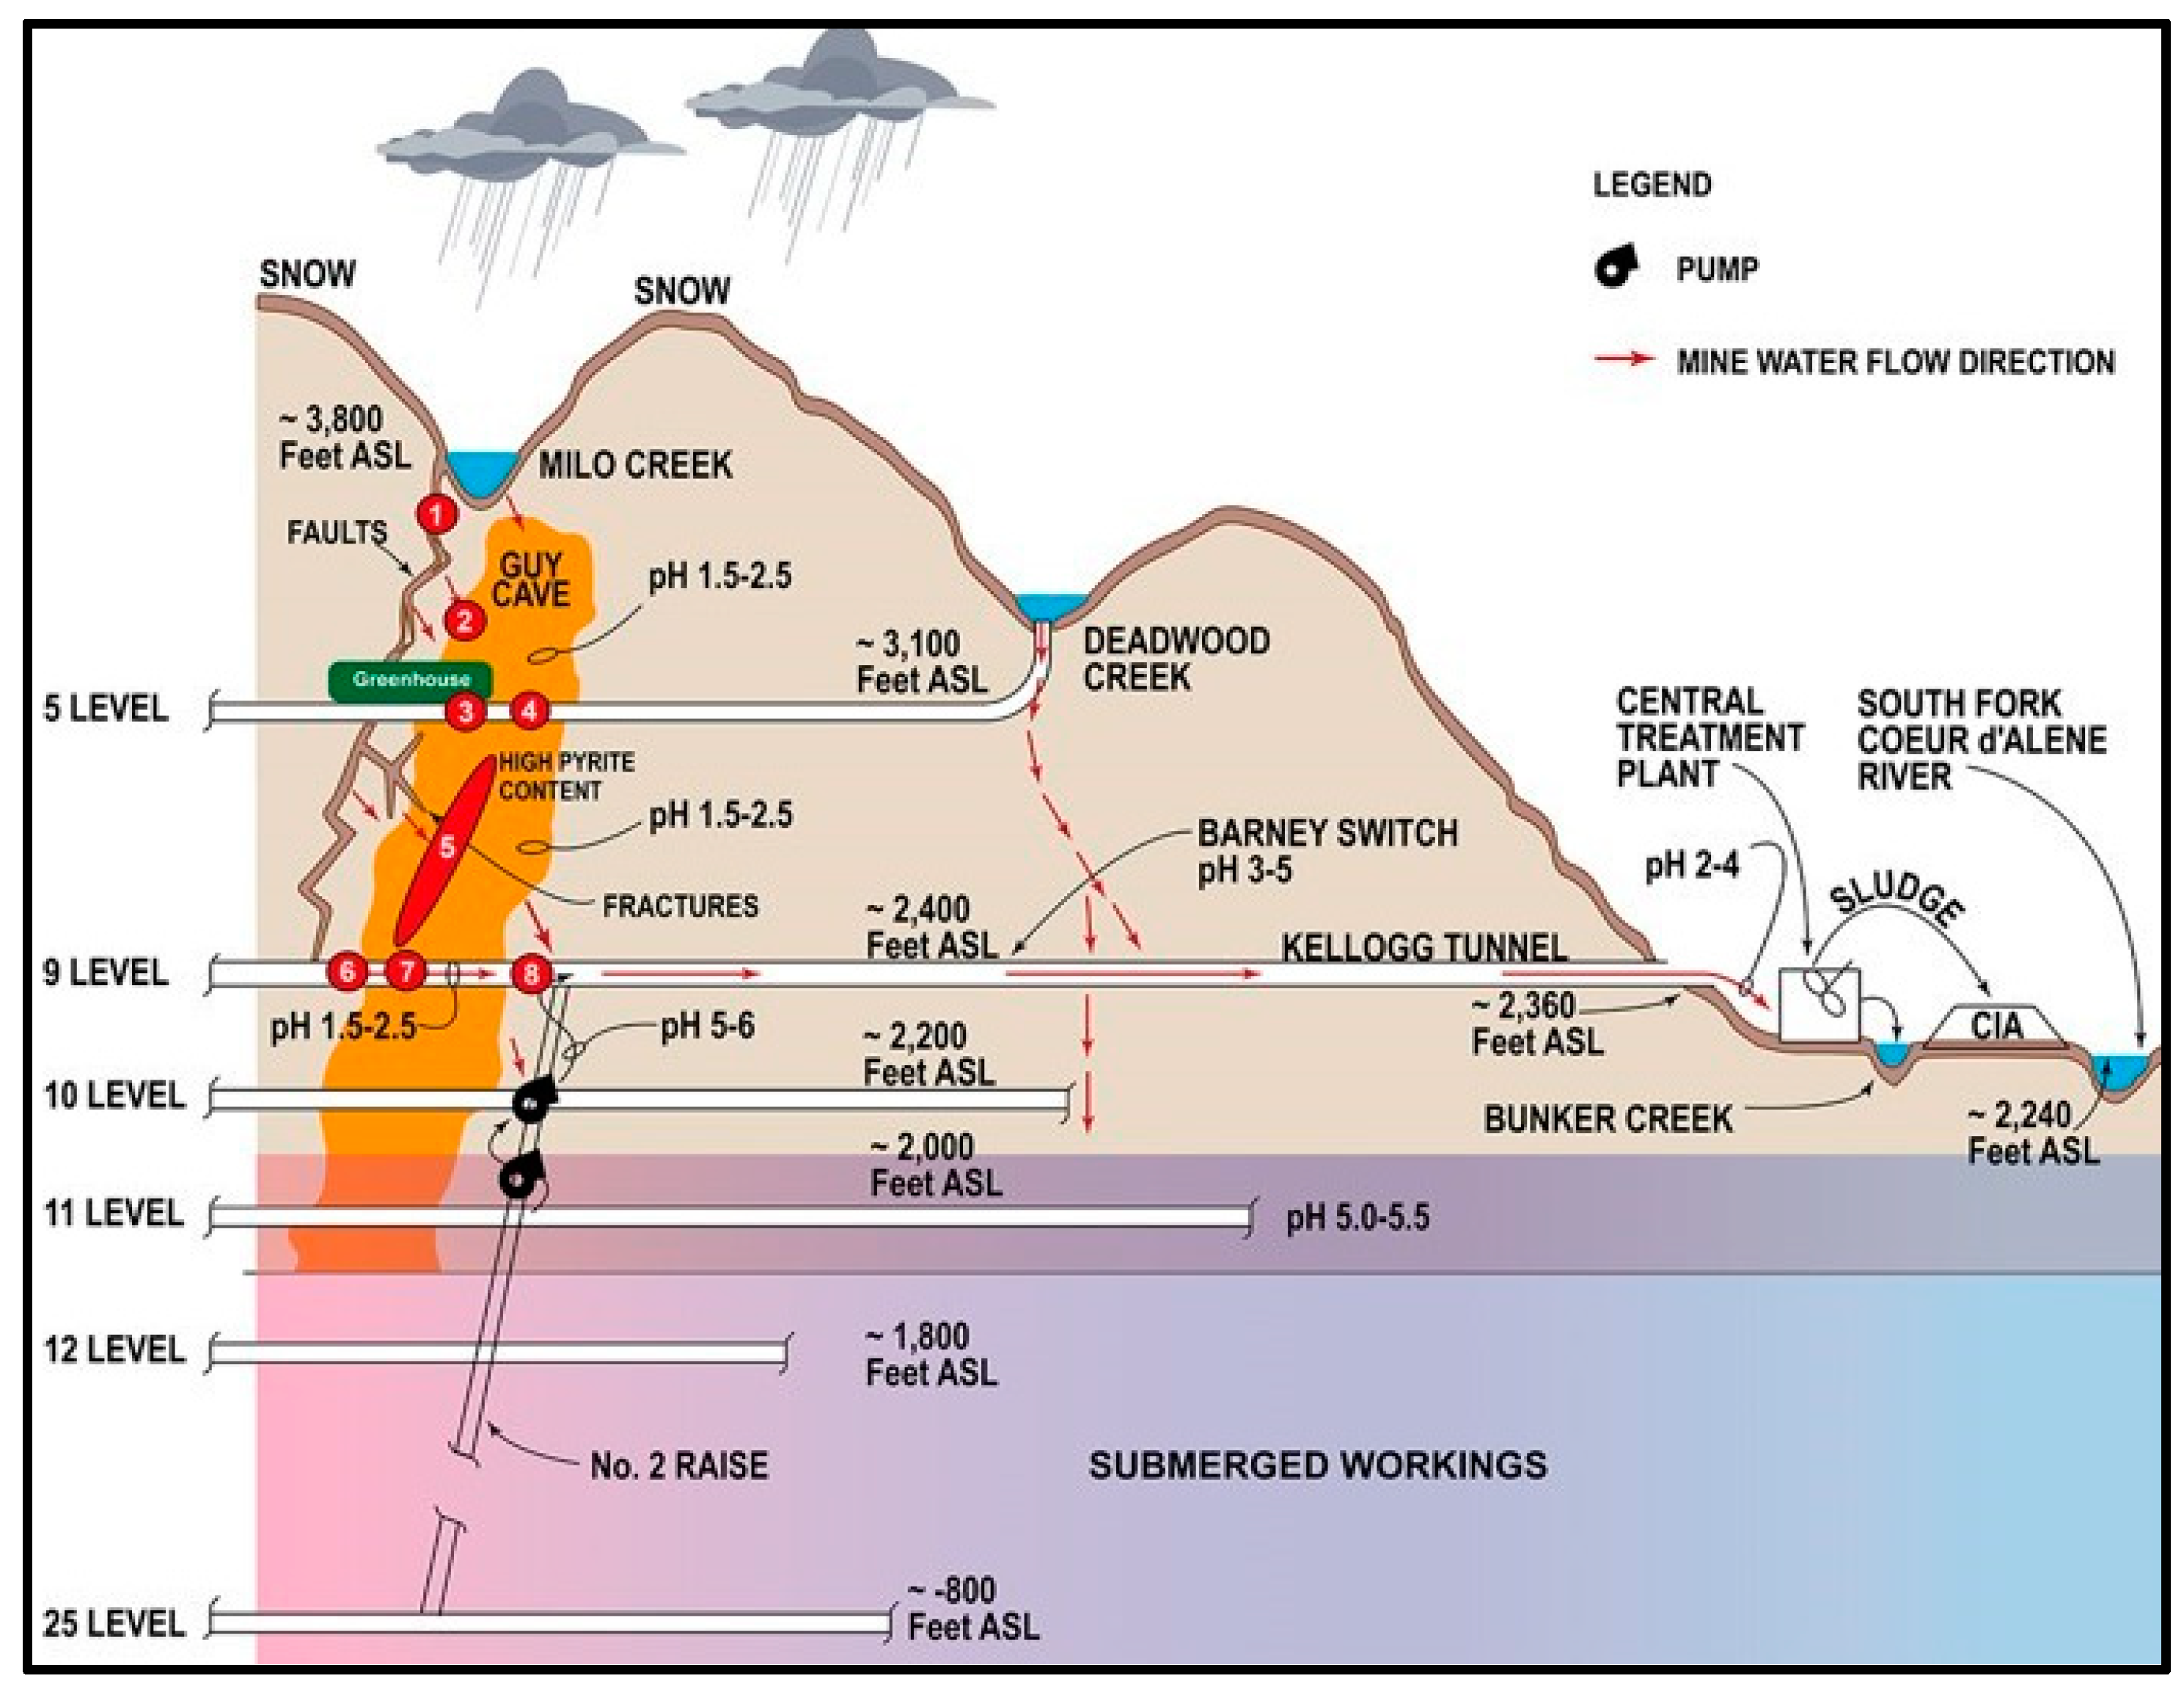
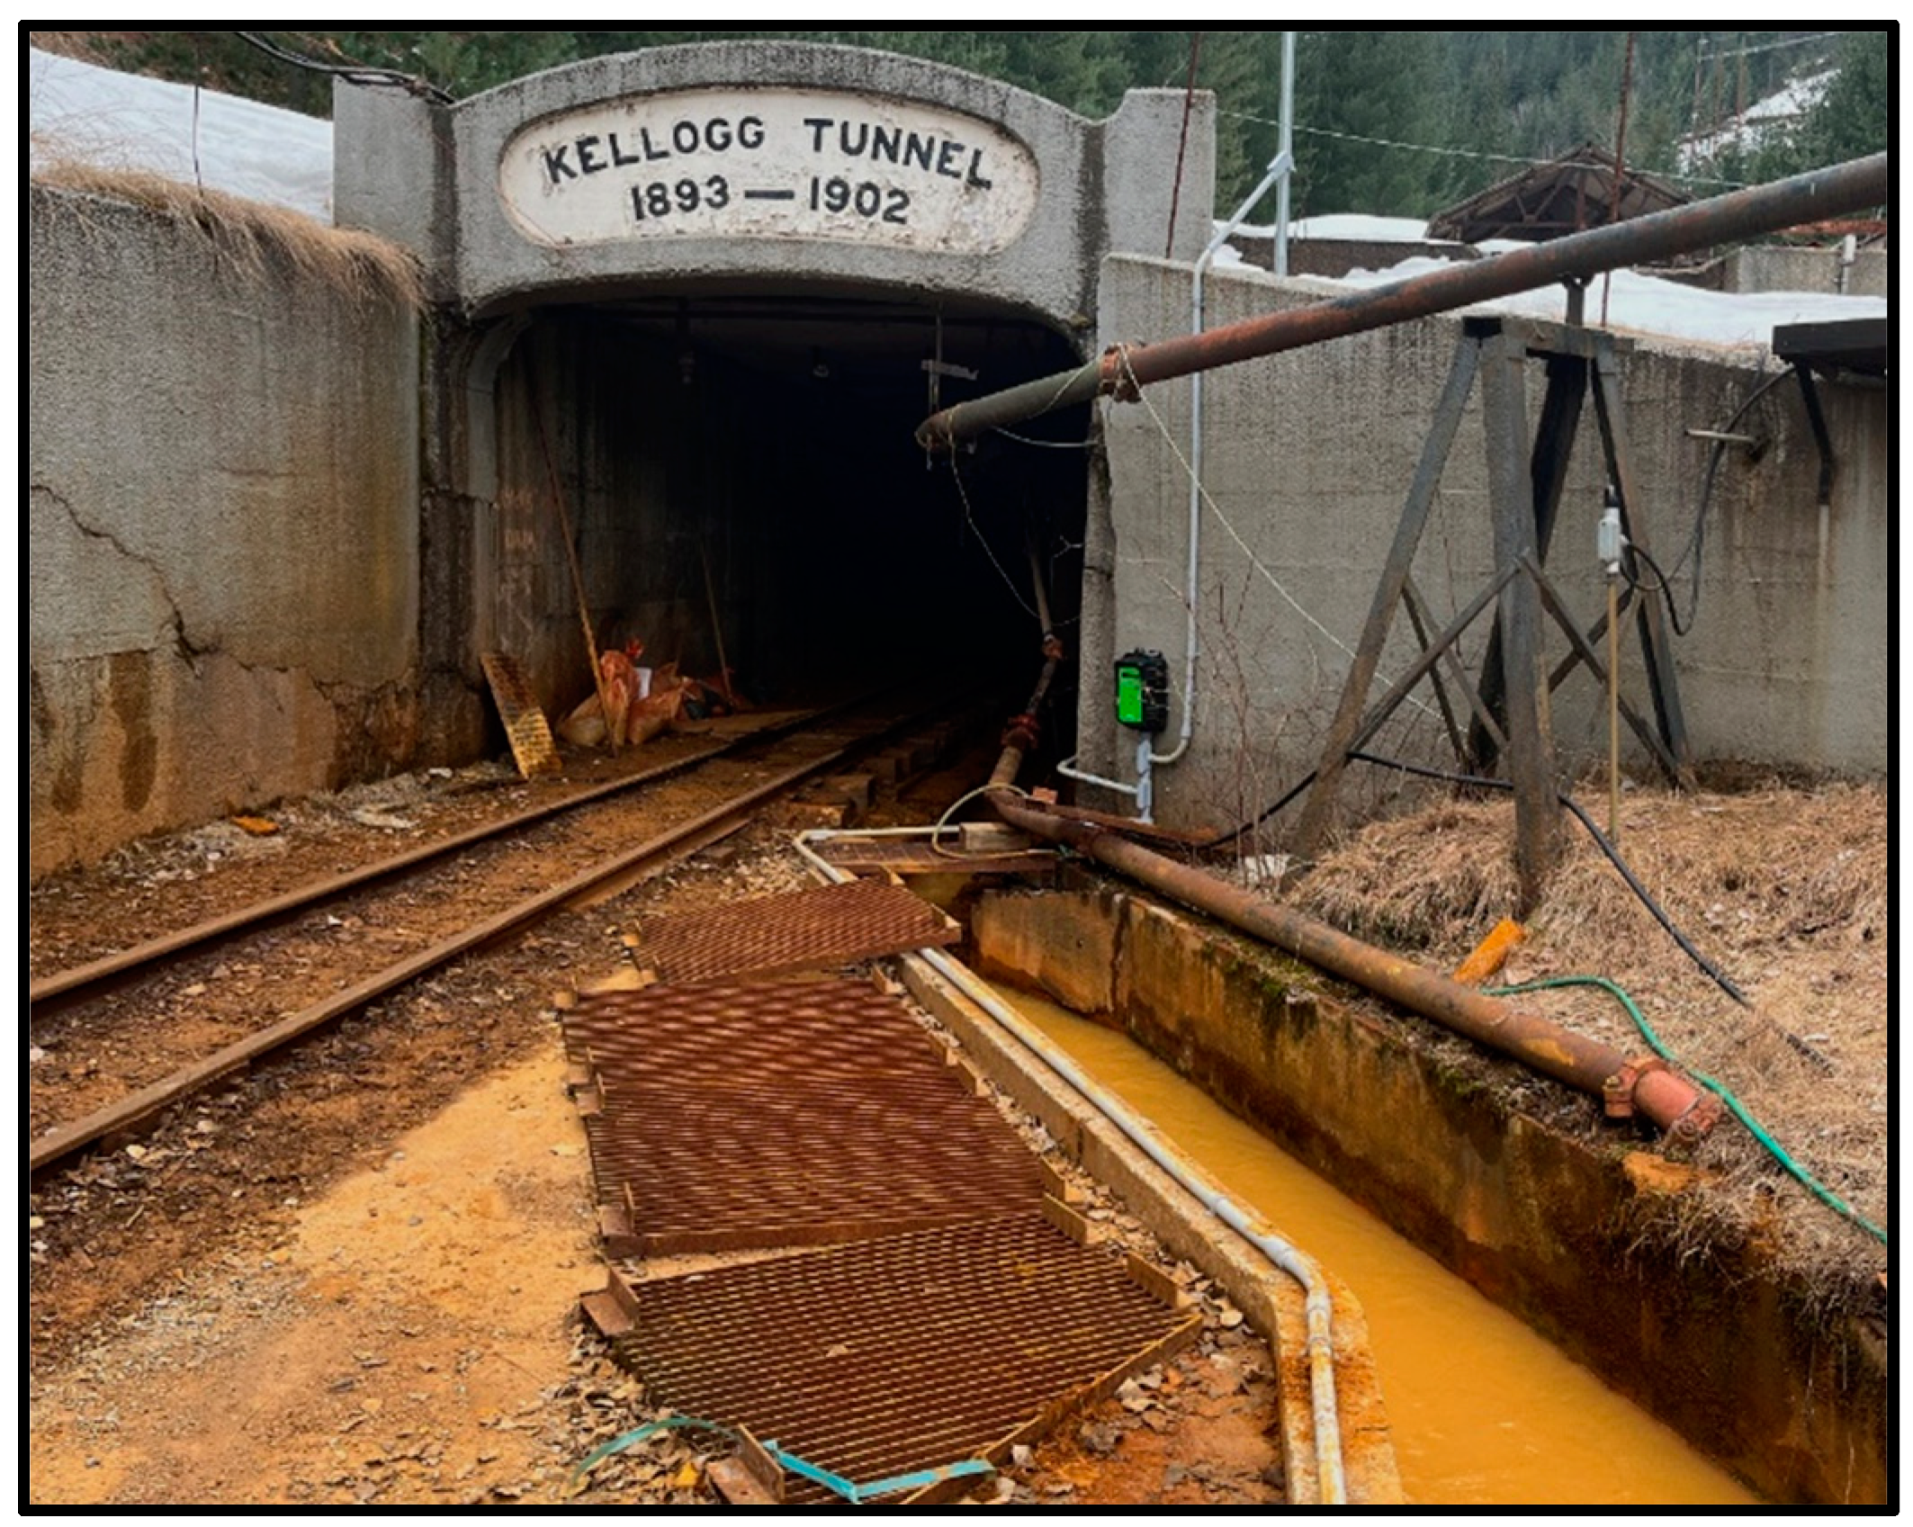
1.2. Mine Water in the Upper Workings
1.3. Water Isotopes and Source Waters
2. Methods
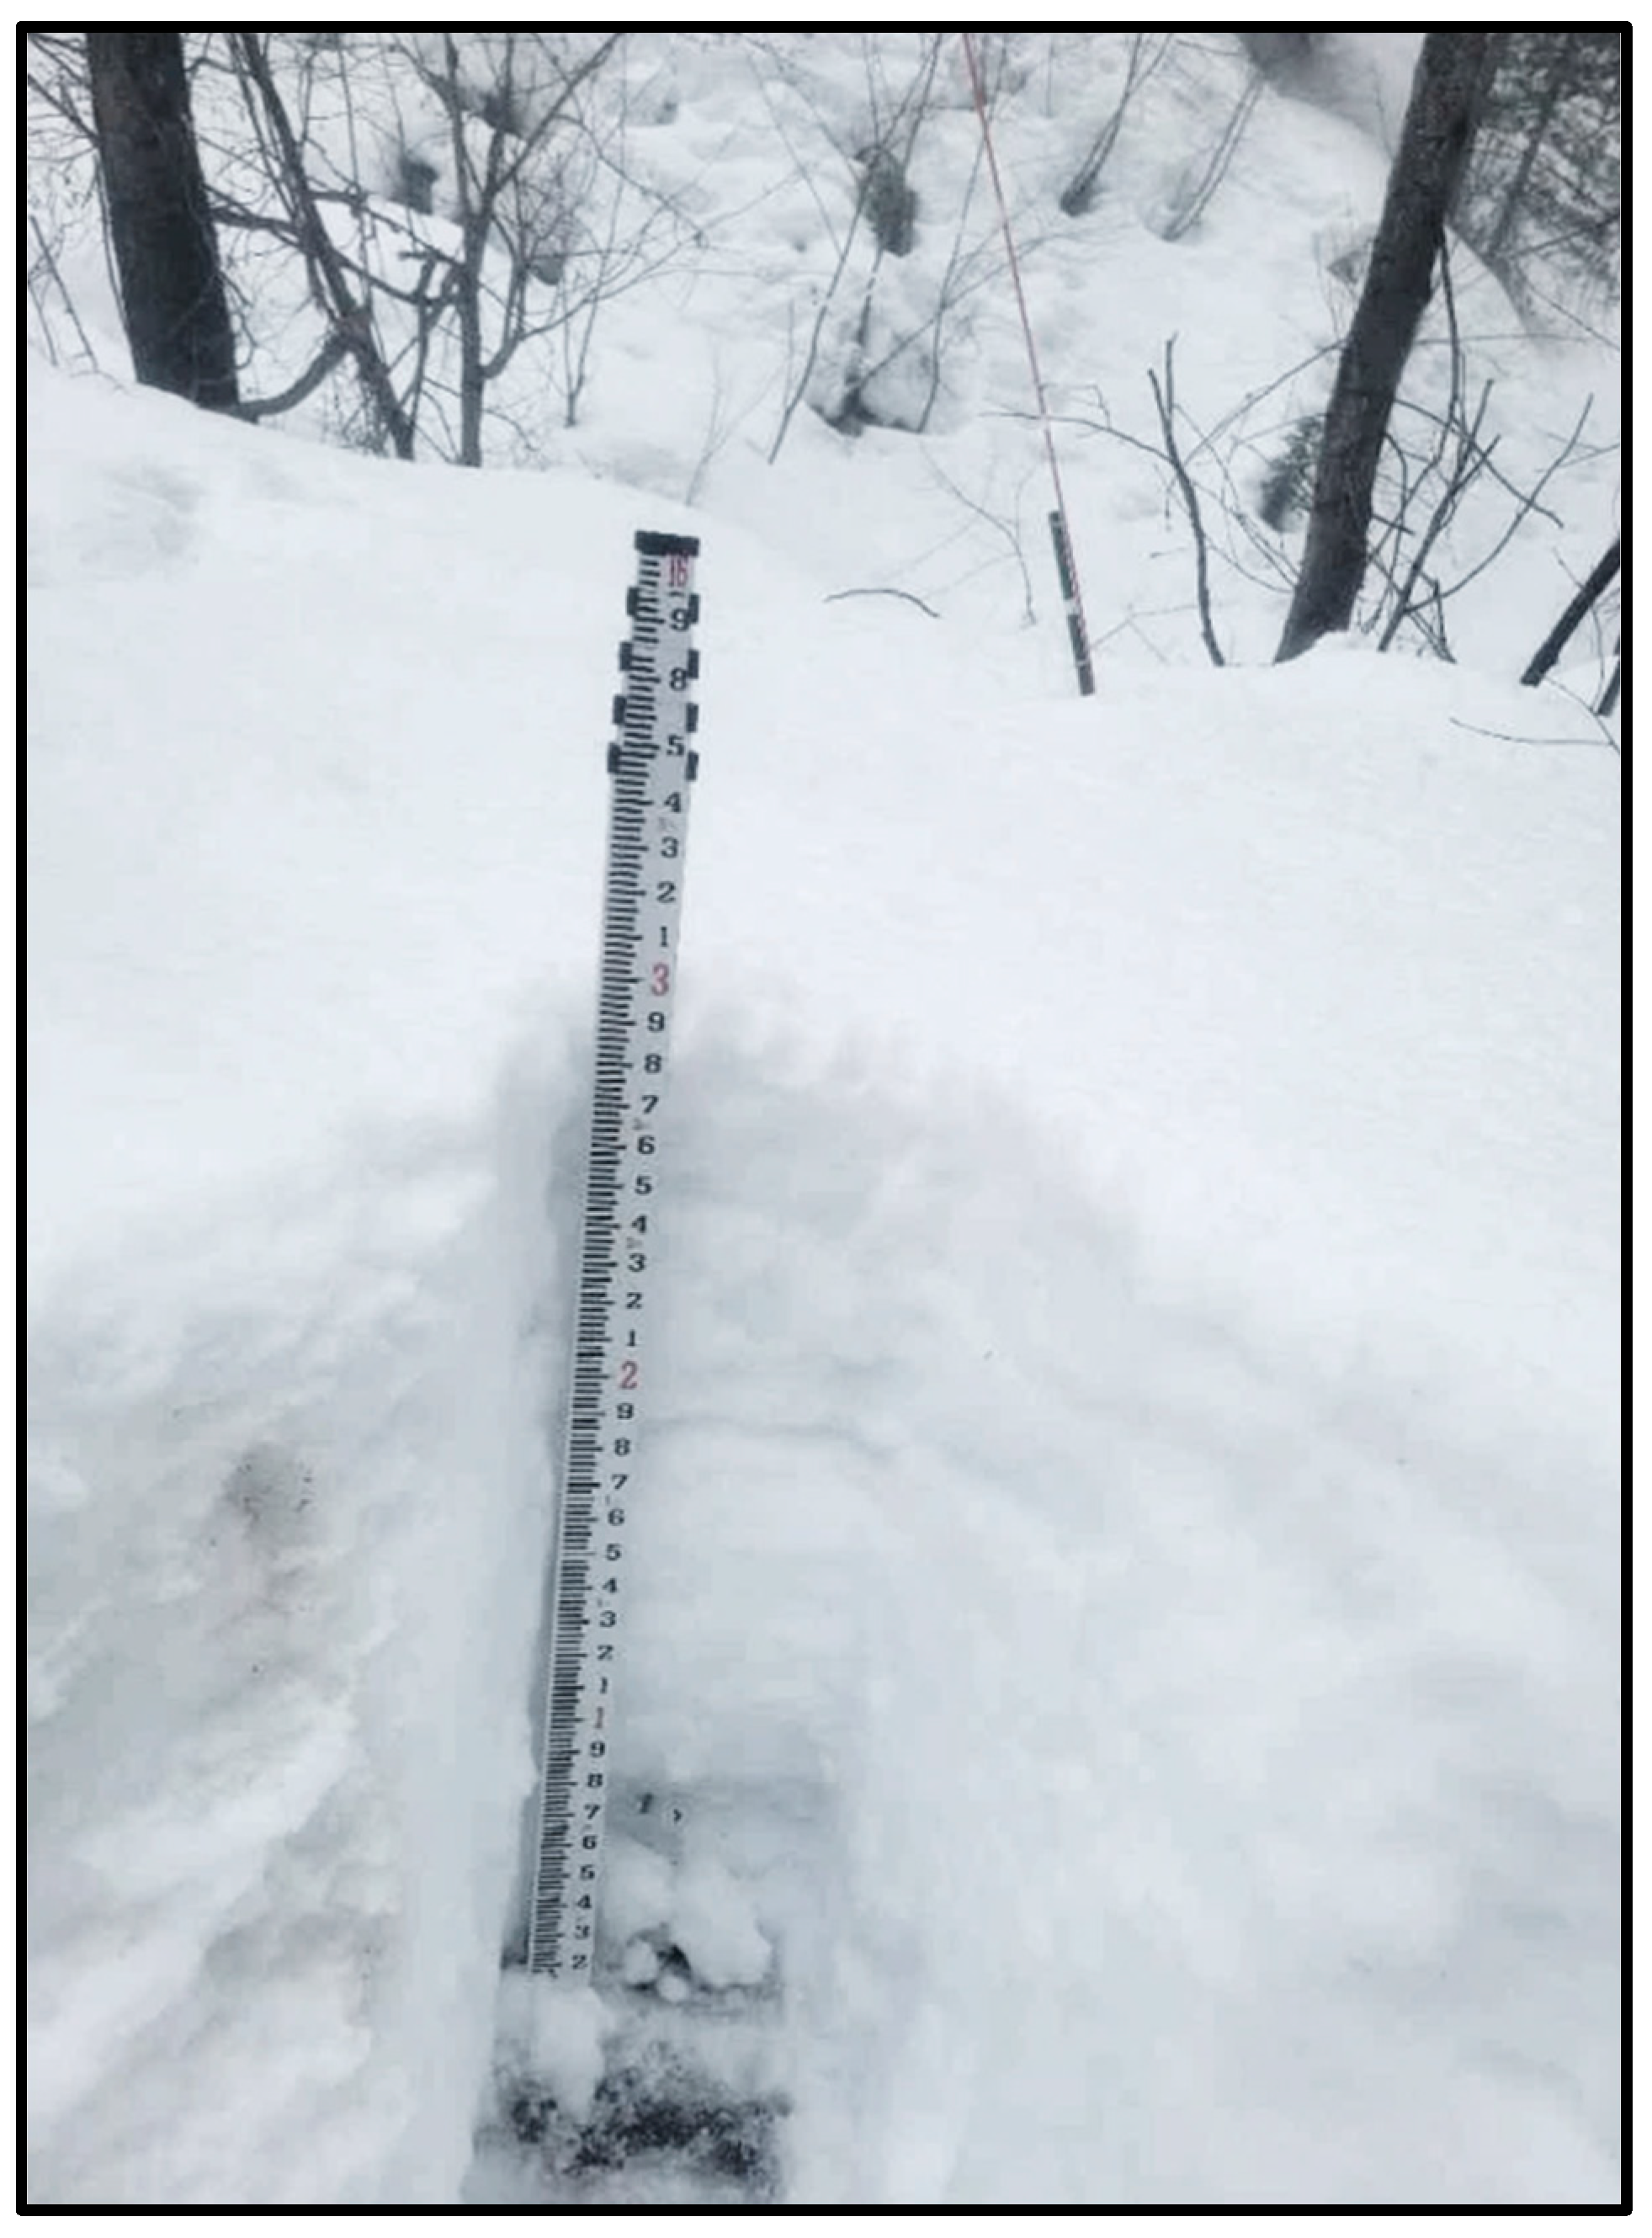
2.1. Snow Sampling
2.2. Creek Sampling
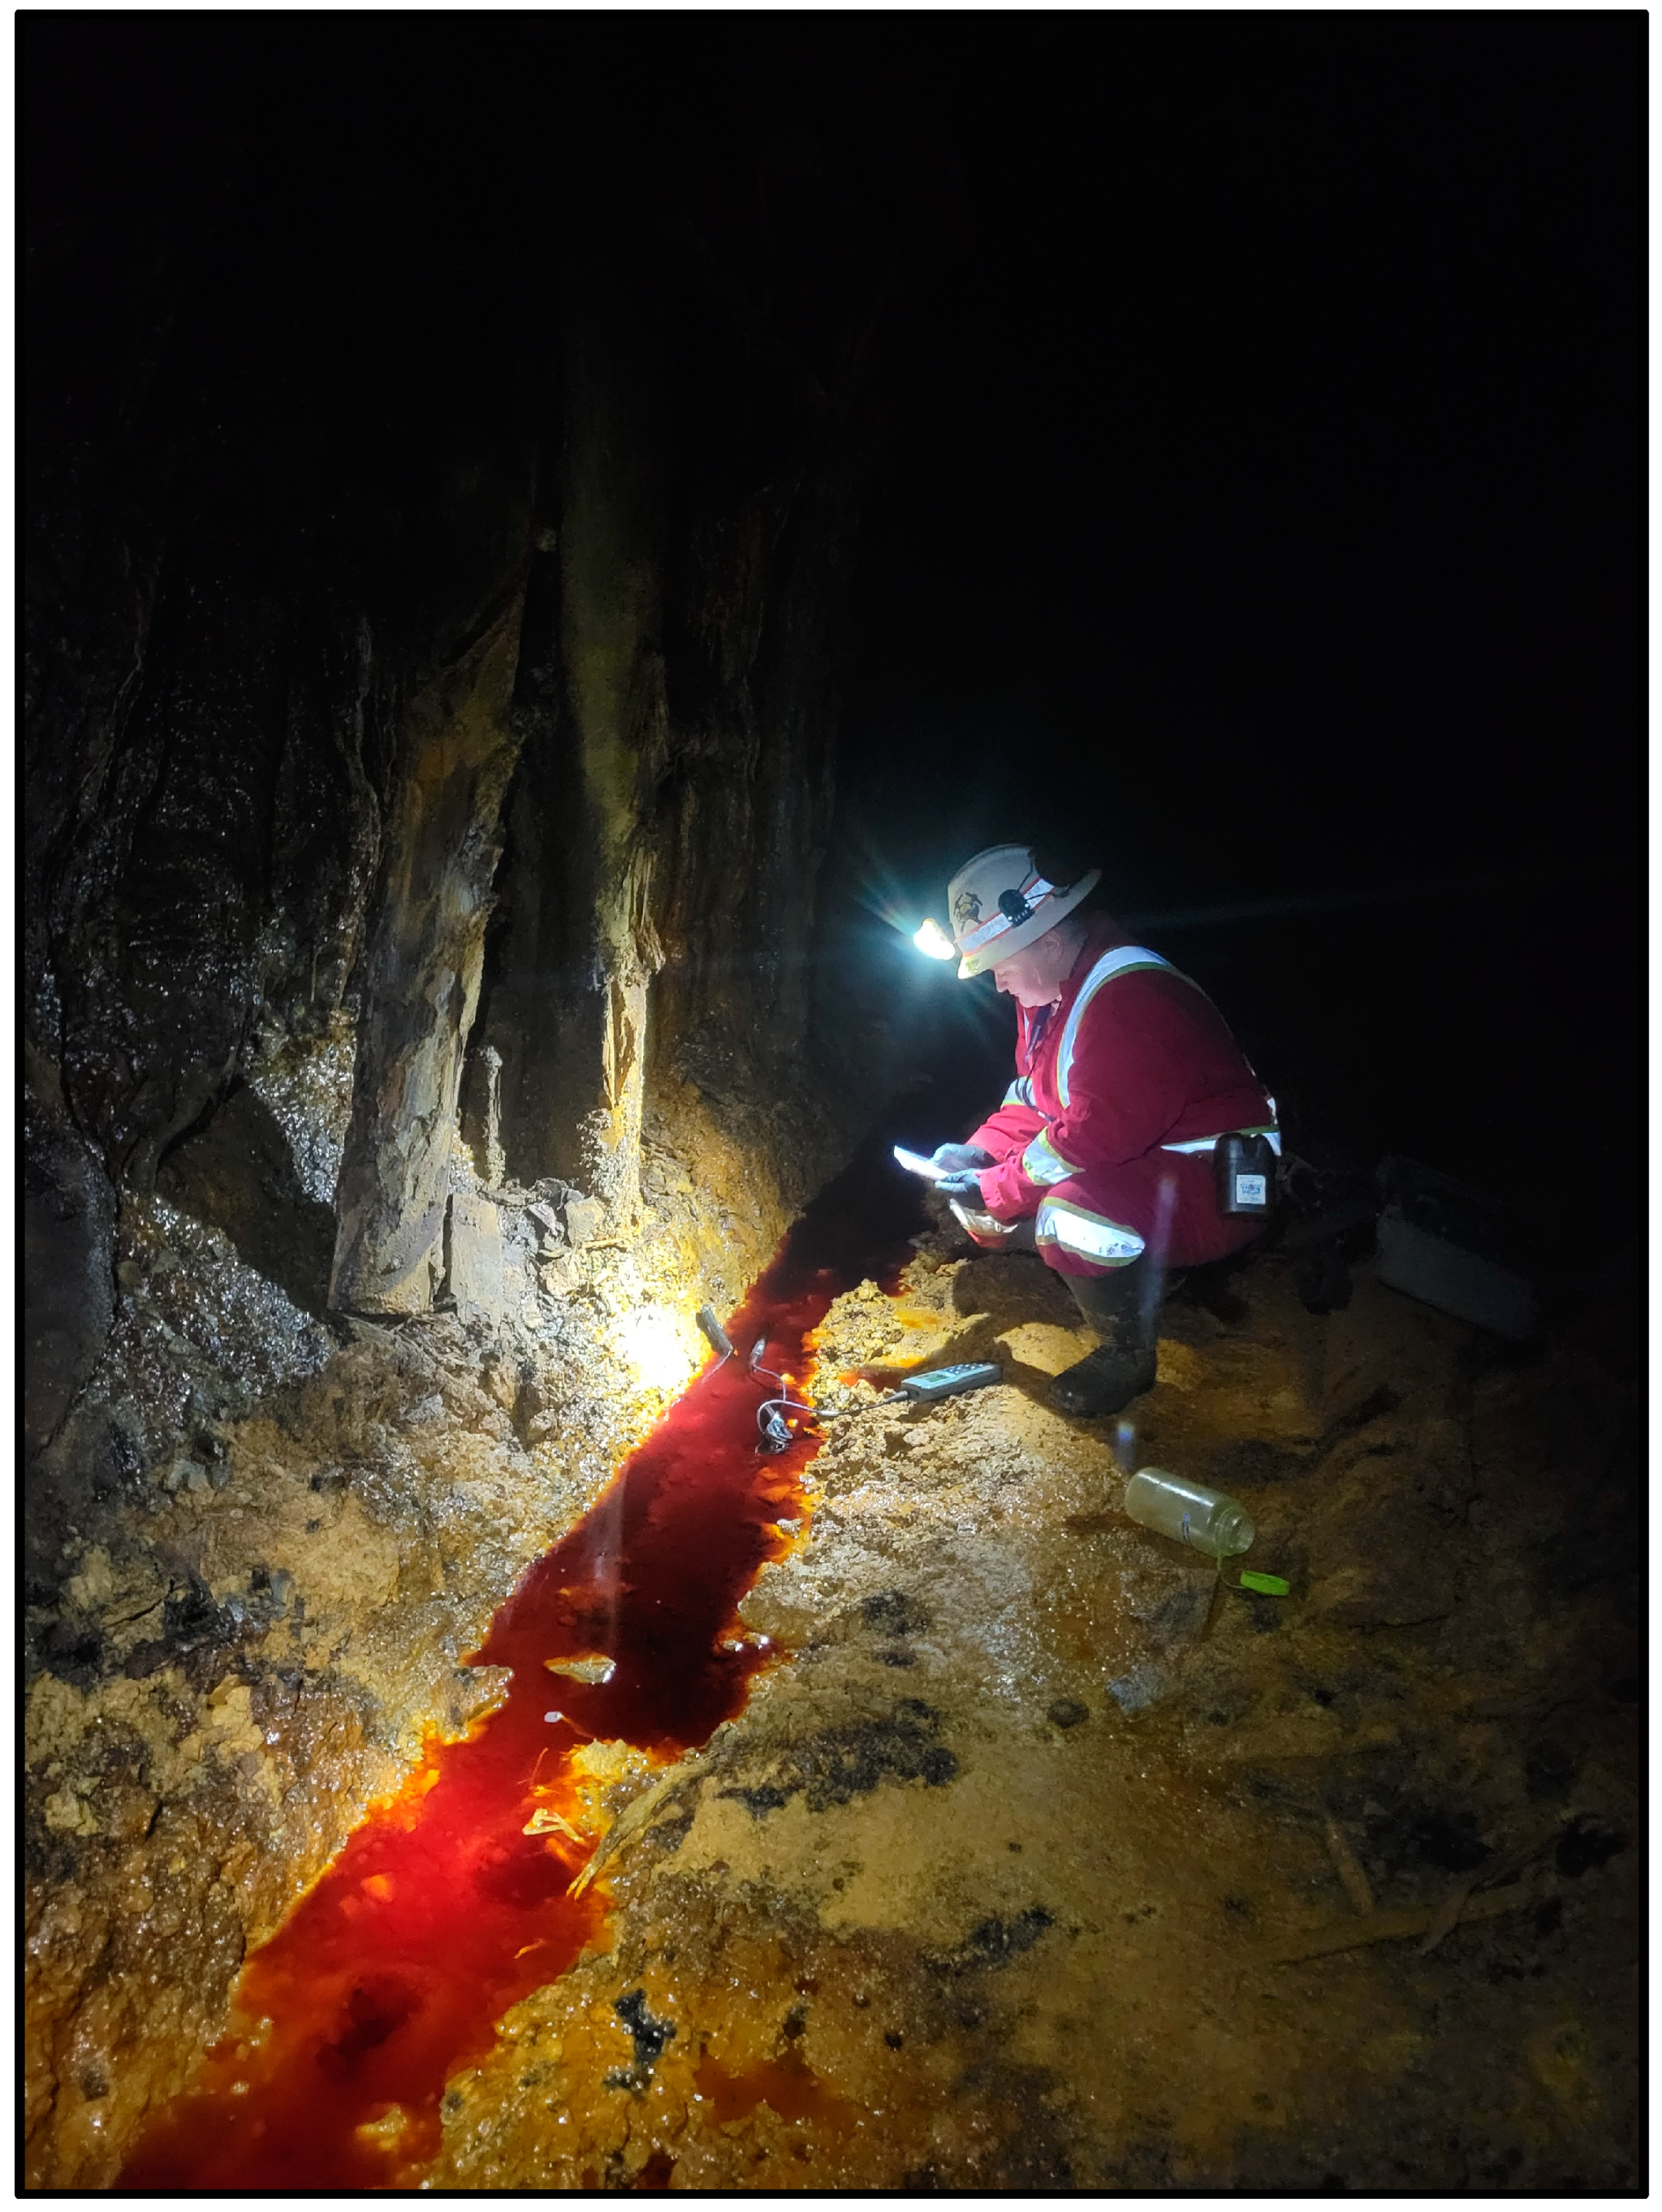
2.3. Mine Water Sampling
2.4. Field Parameter and Laboratory Analyses
2.5. Deuterium Excess, Evaporation, and Vapor Recycling
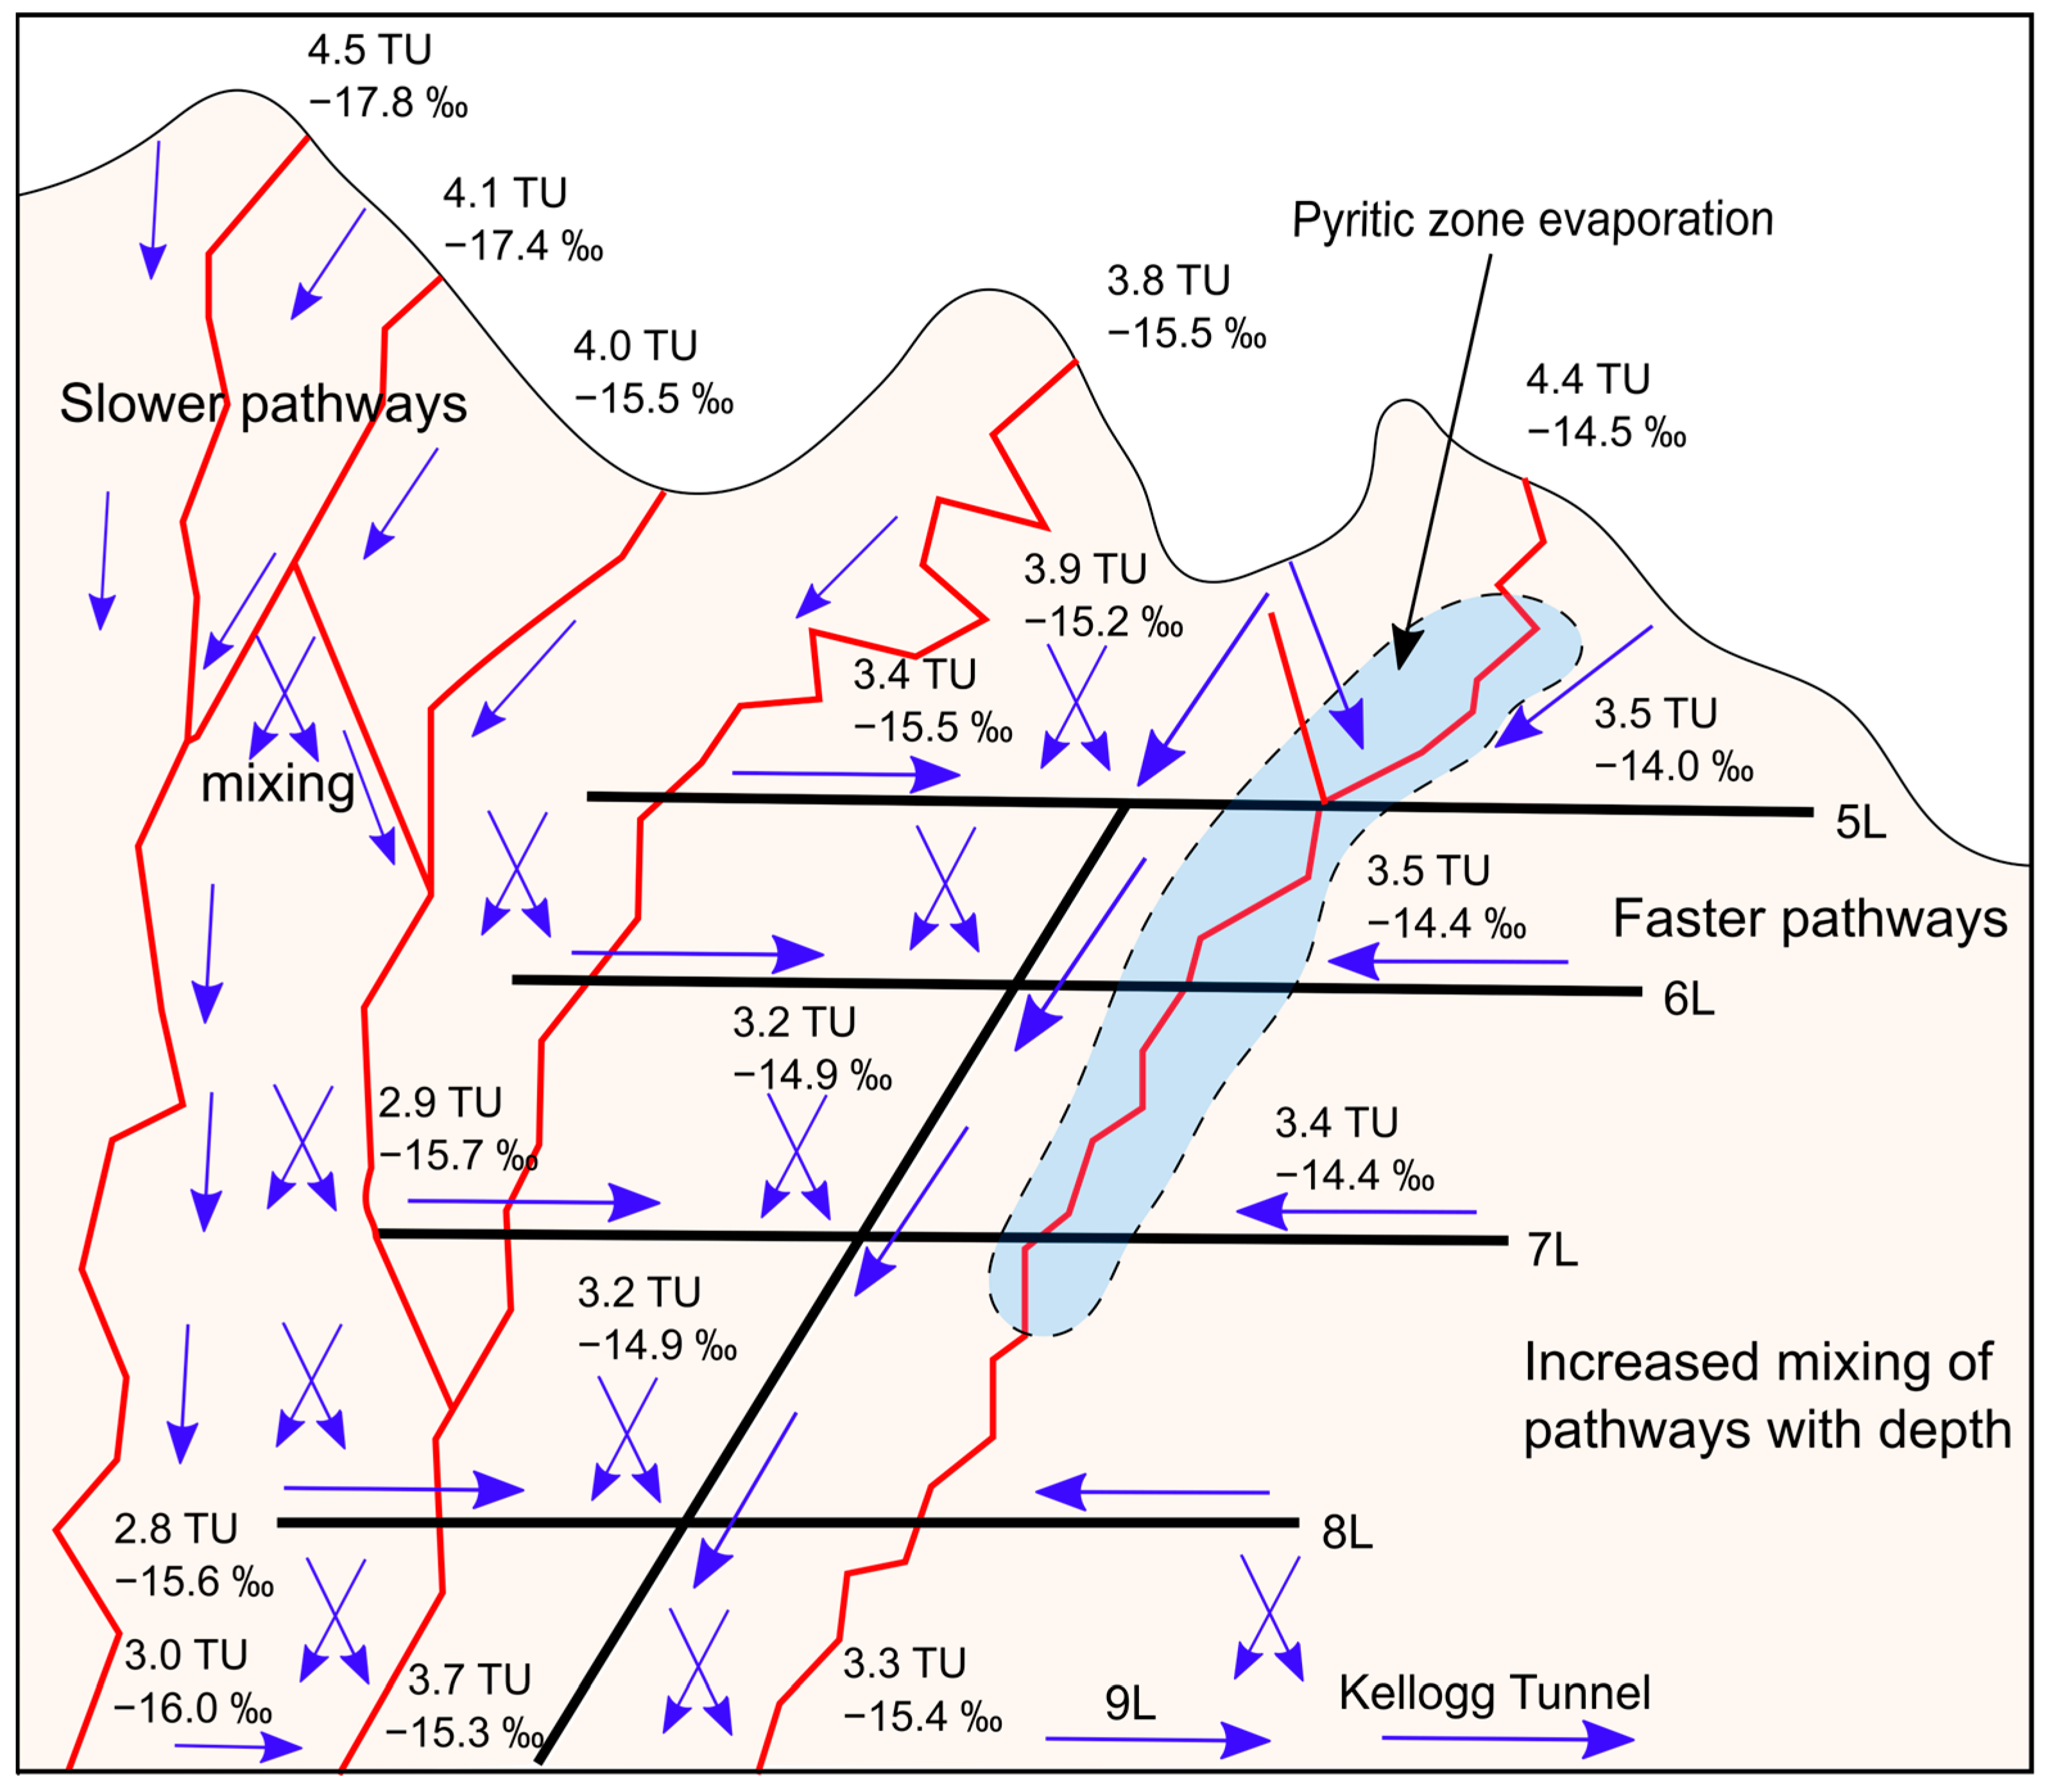
2.6. Conceptual Model and Isotope Unmixing
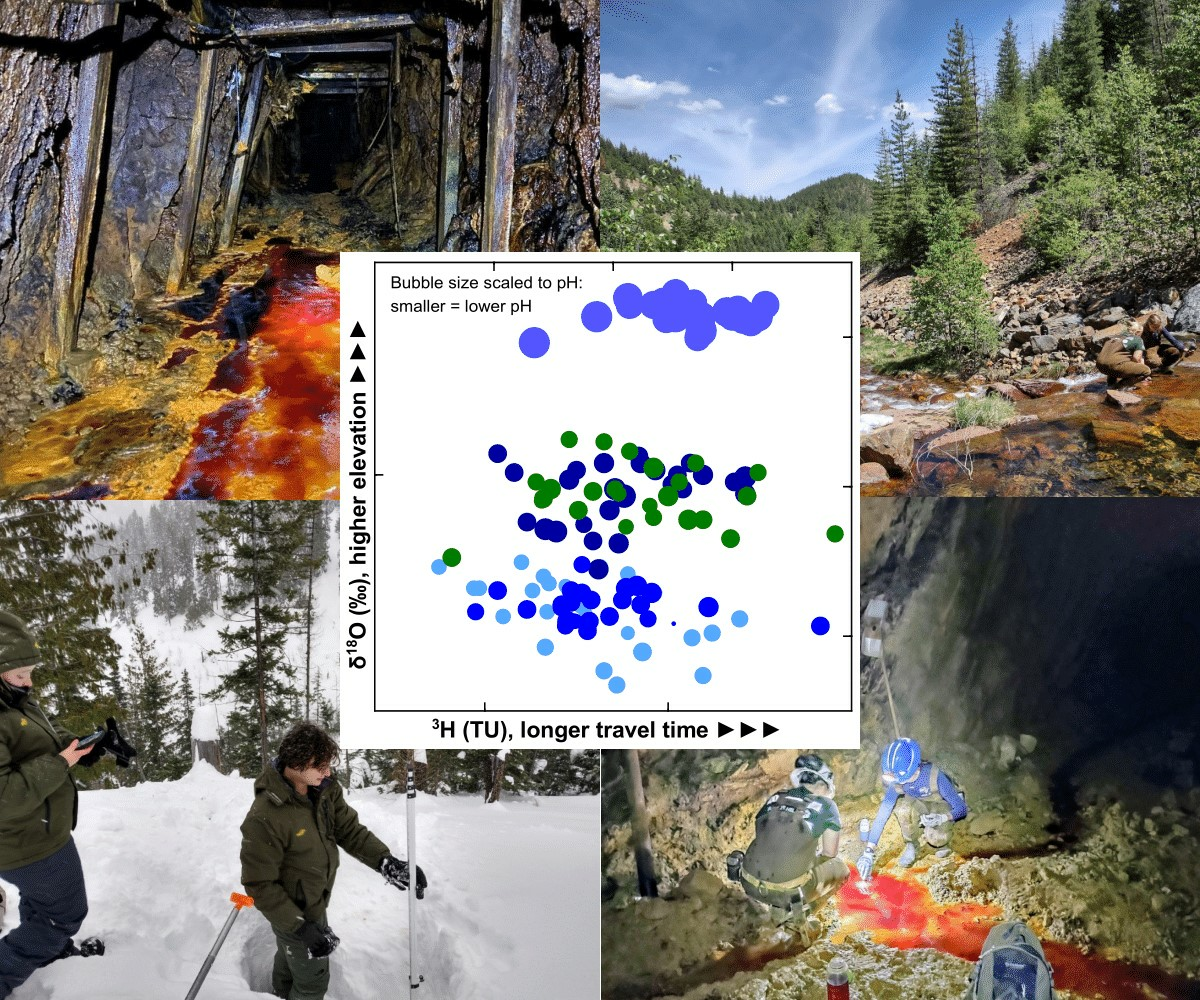
2.7. Tritium and Travel Time
2.8. Trend Lines
3. Results
3.1. Source Waters and Mine Water Characteristics
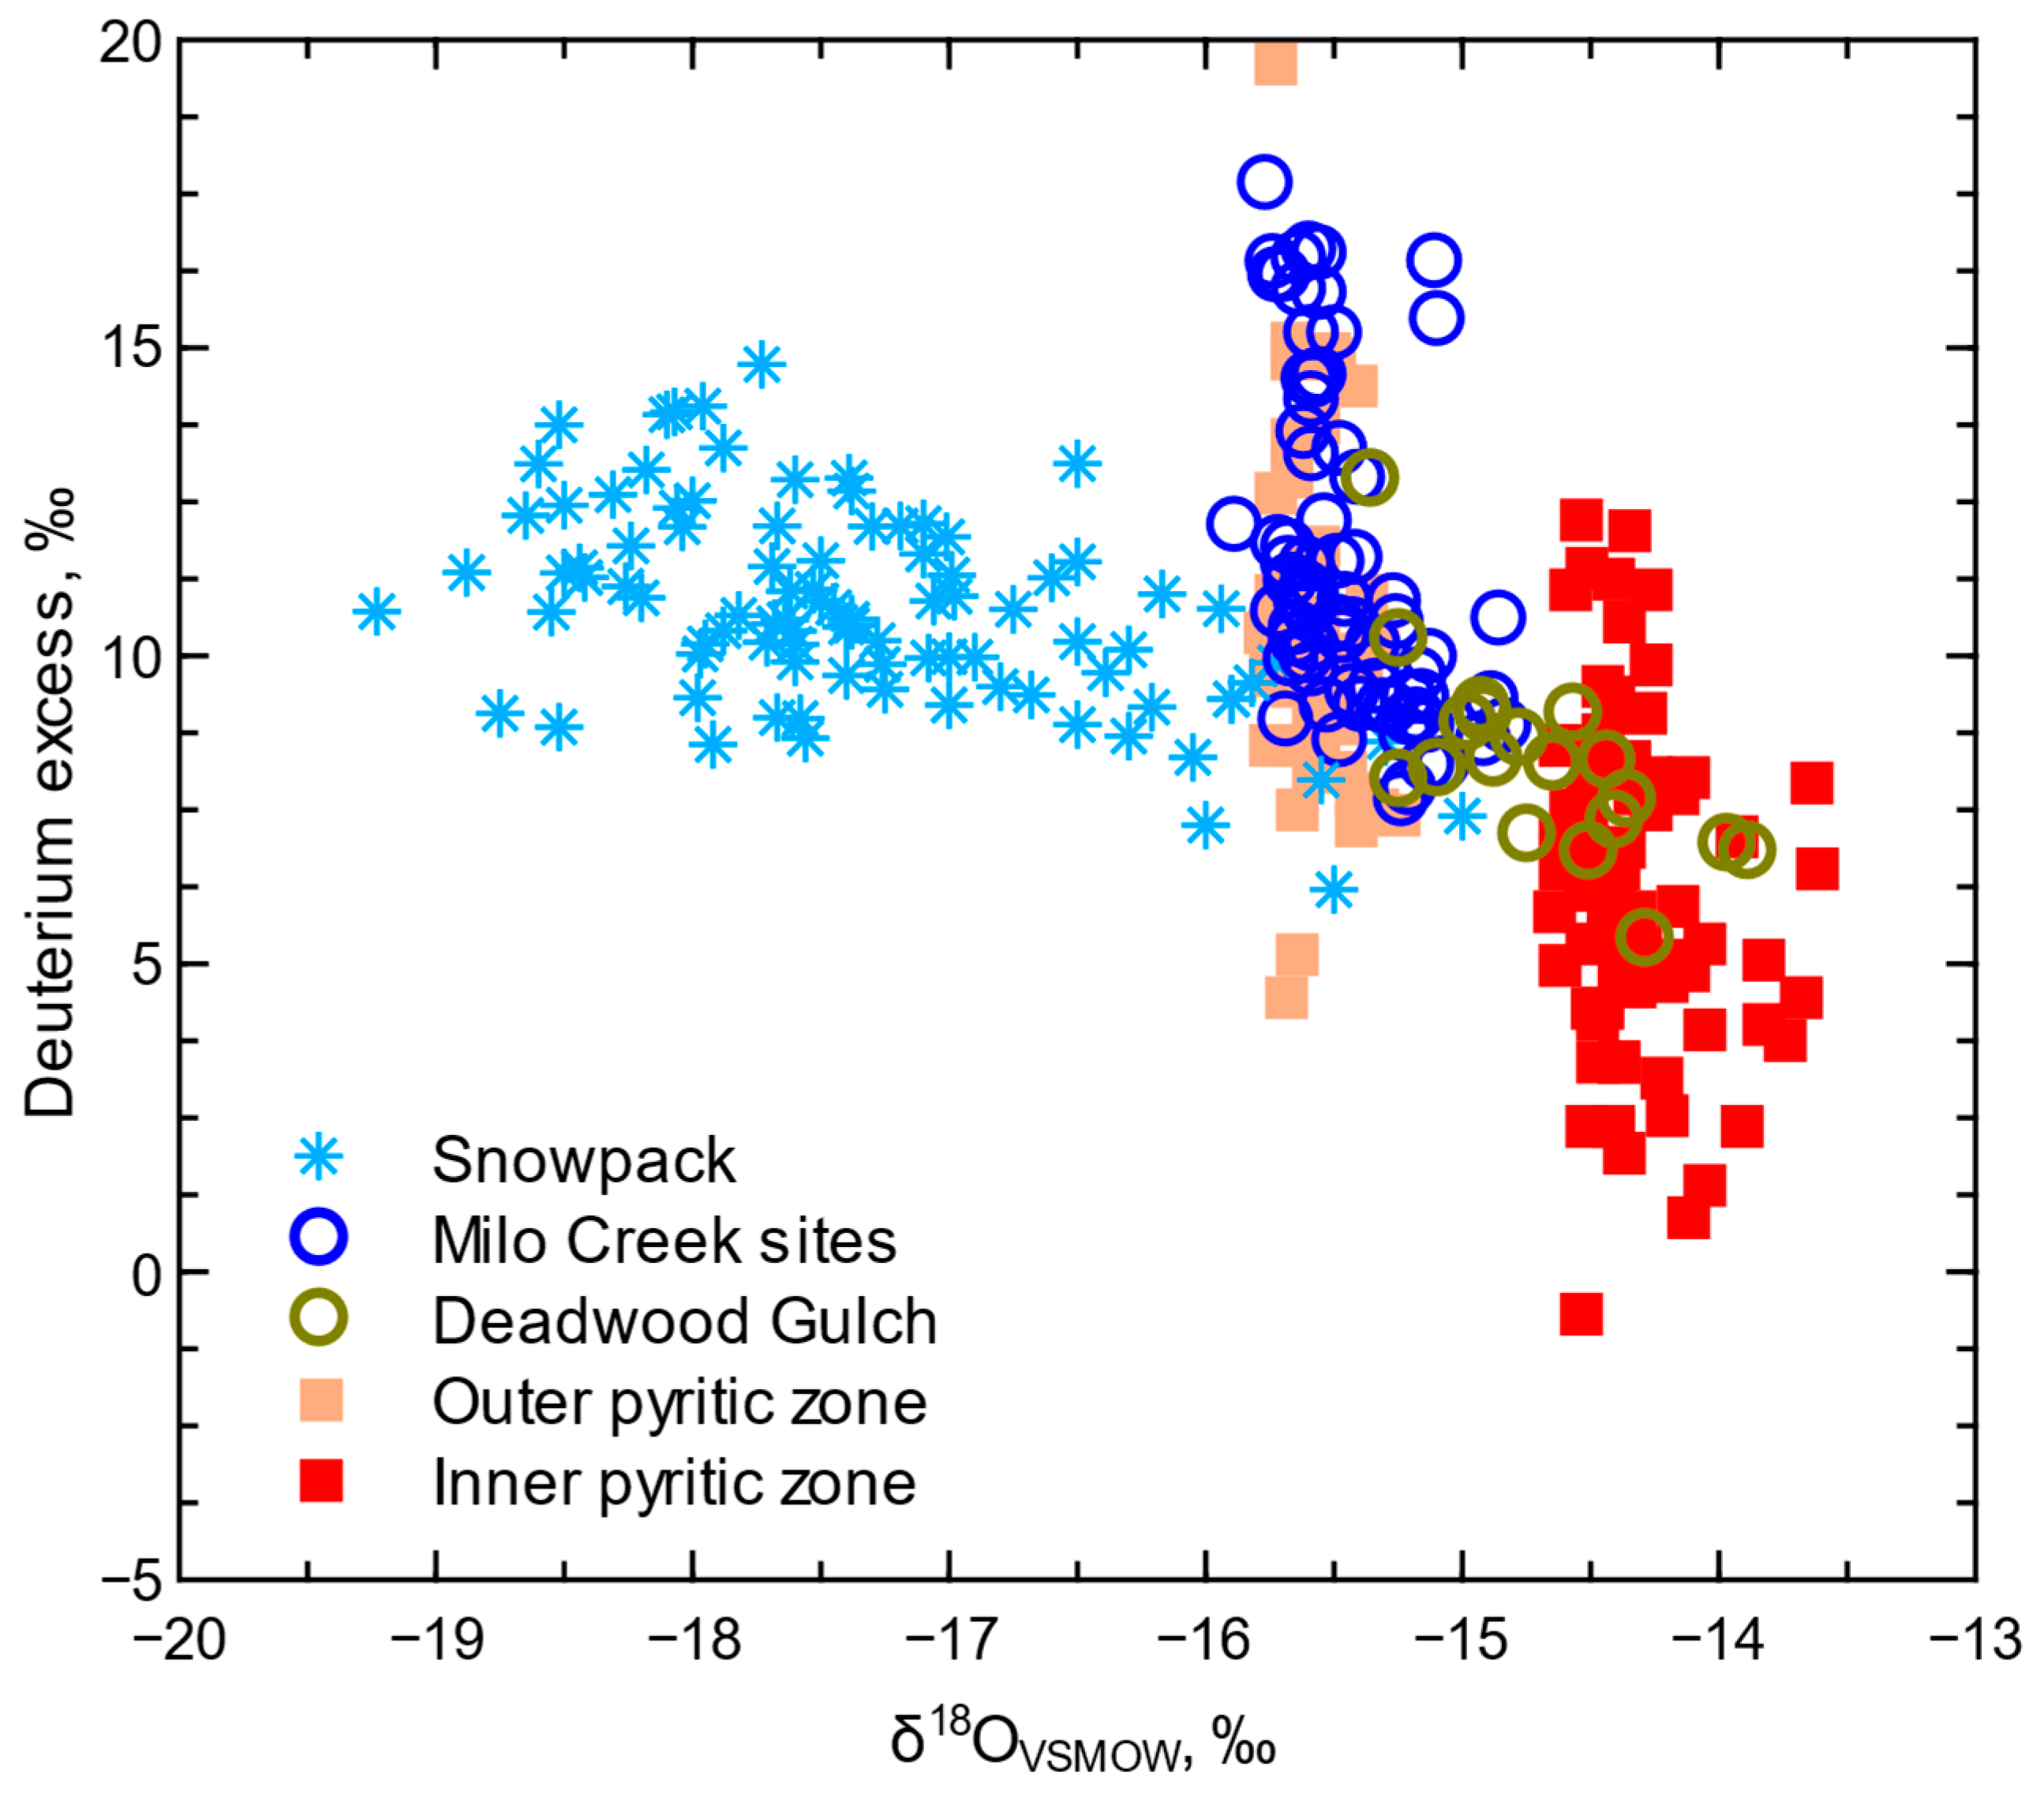
3.2. Isotopes and Source Waters
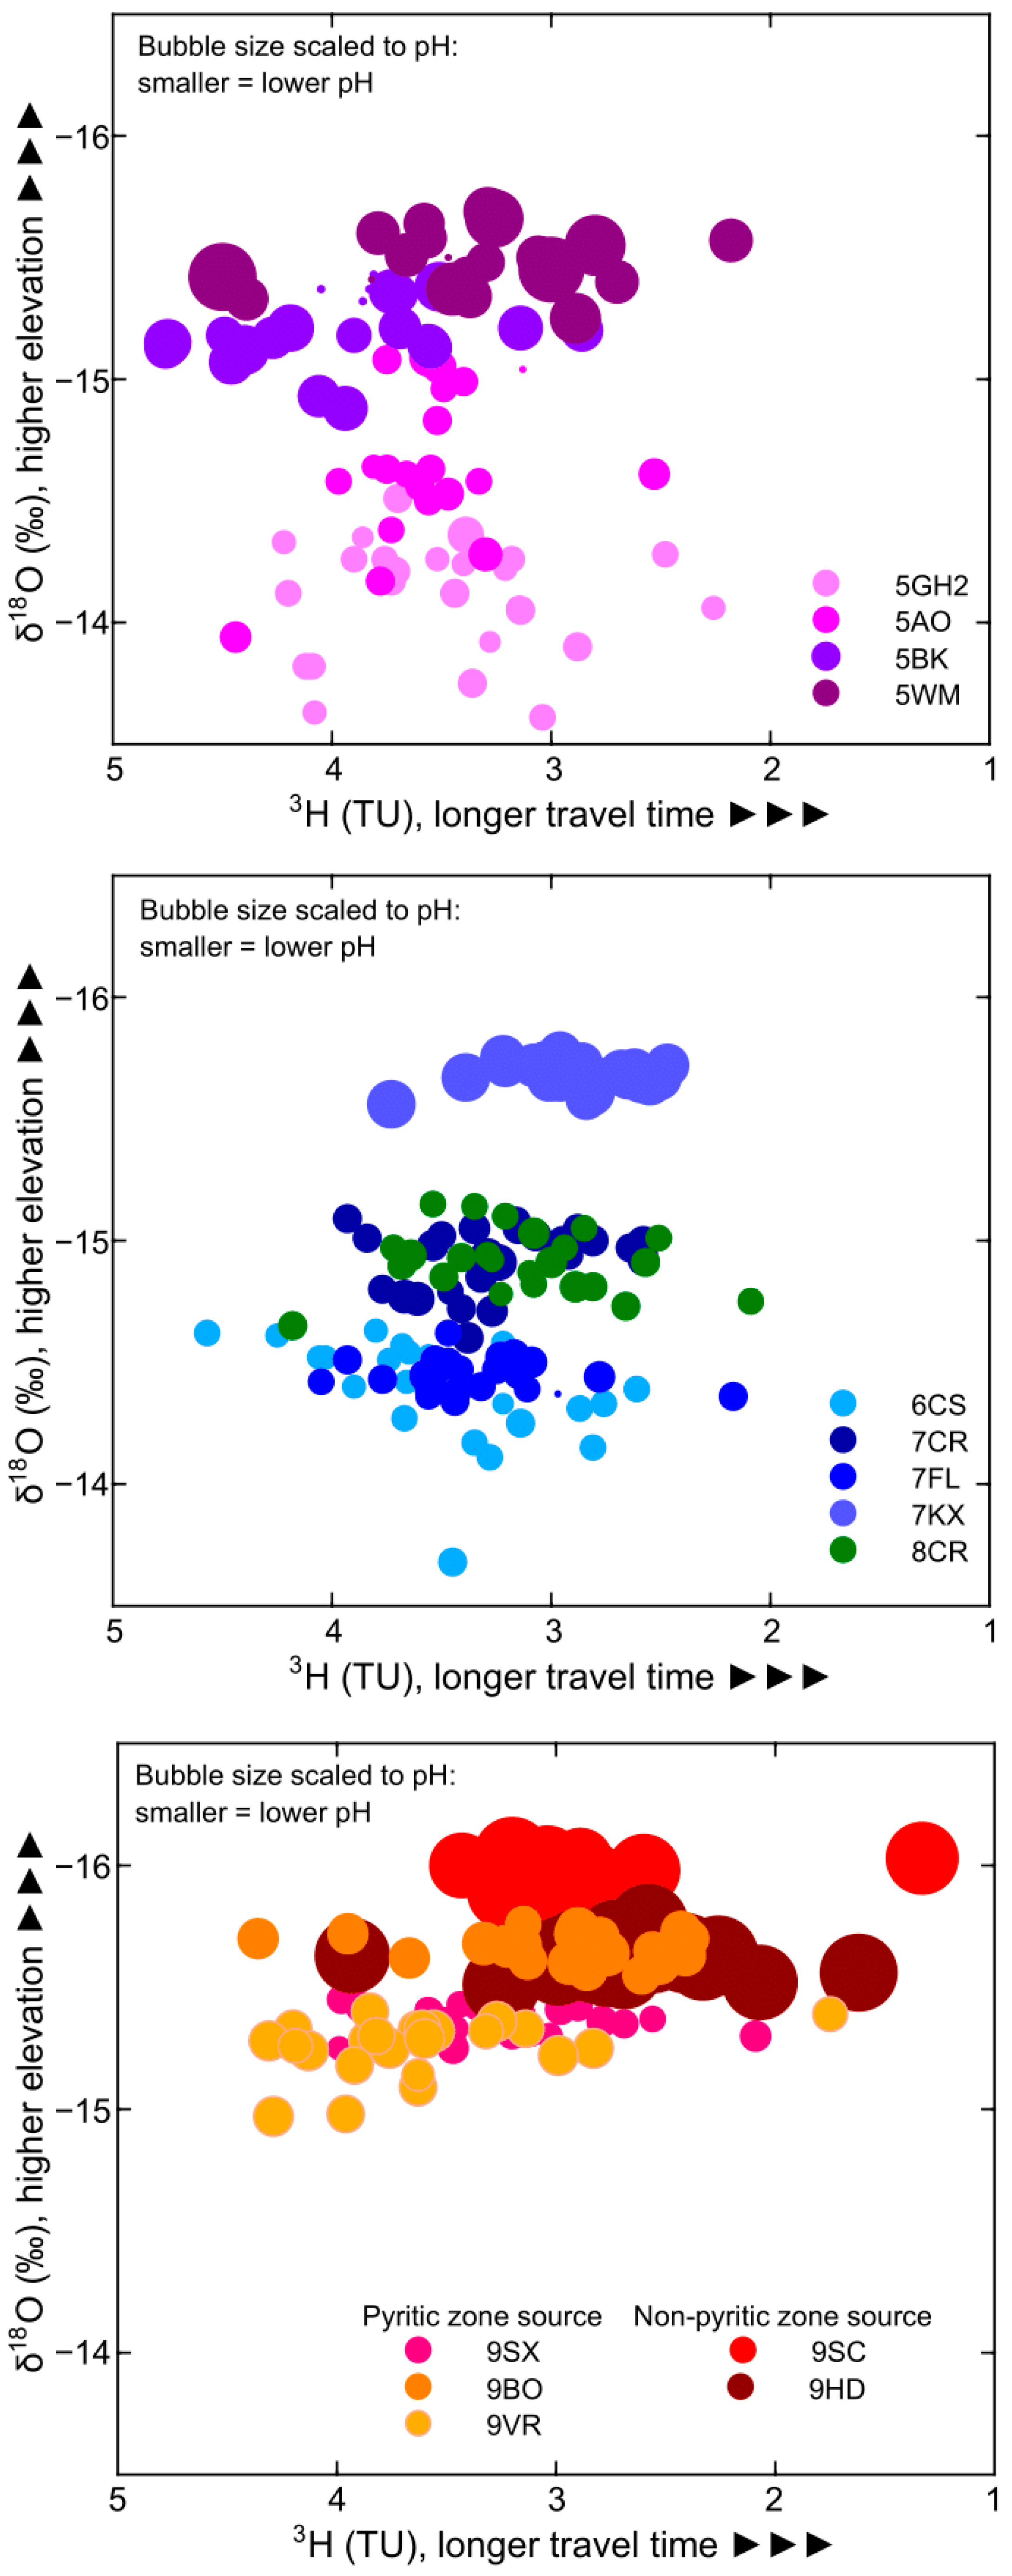
3.3. Pyritic Zone Evaporation and Deuterium Excess
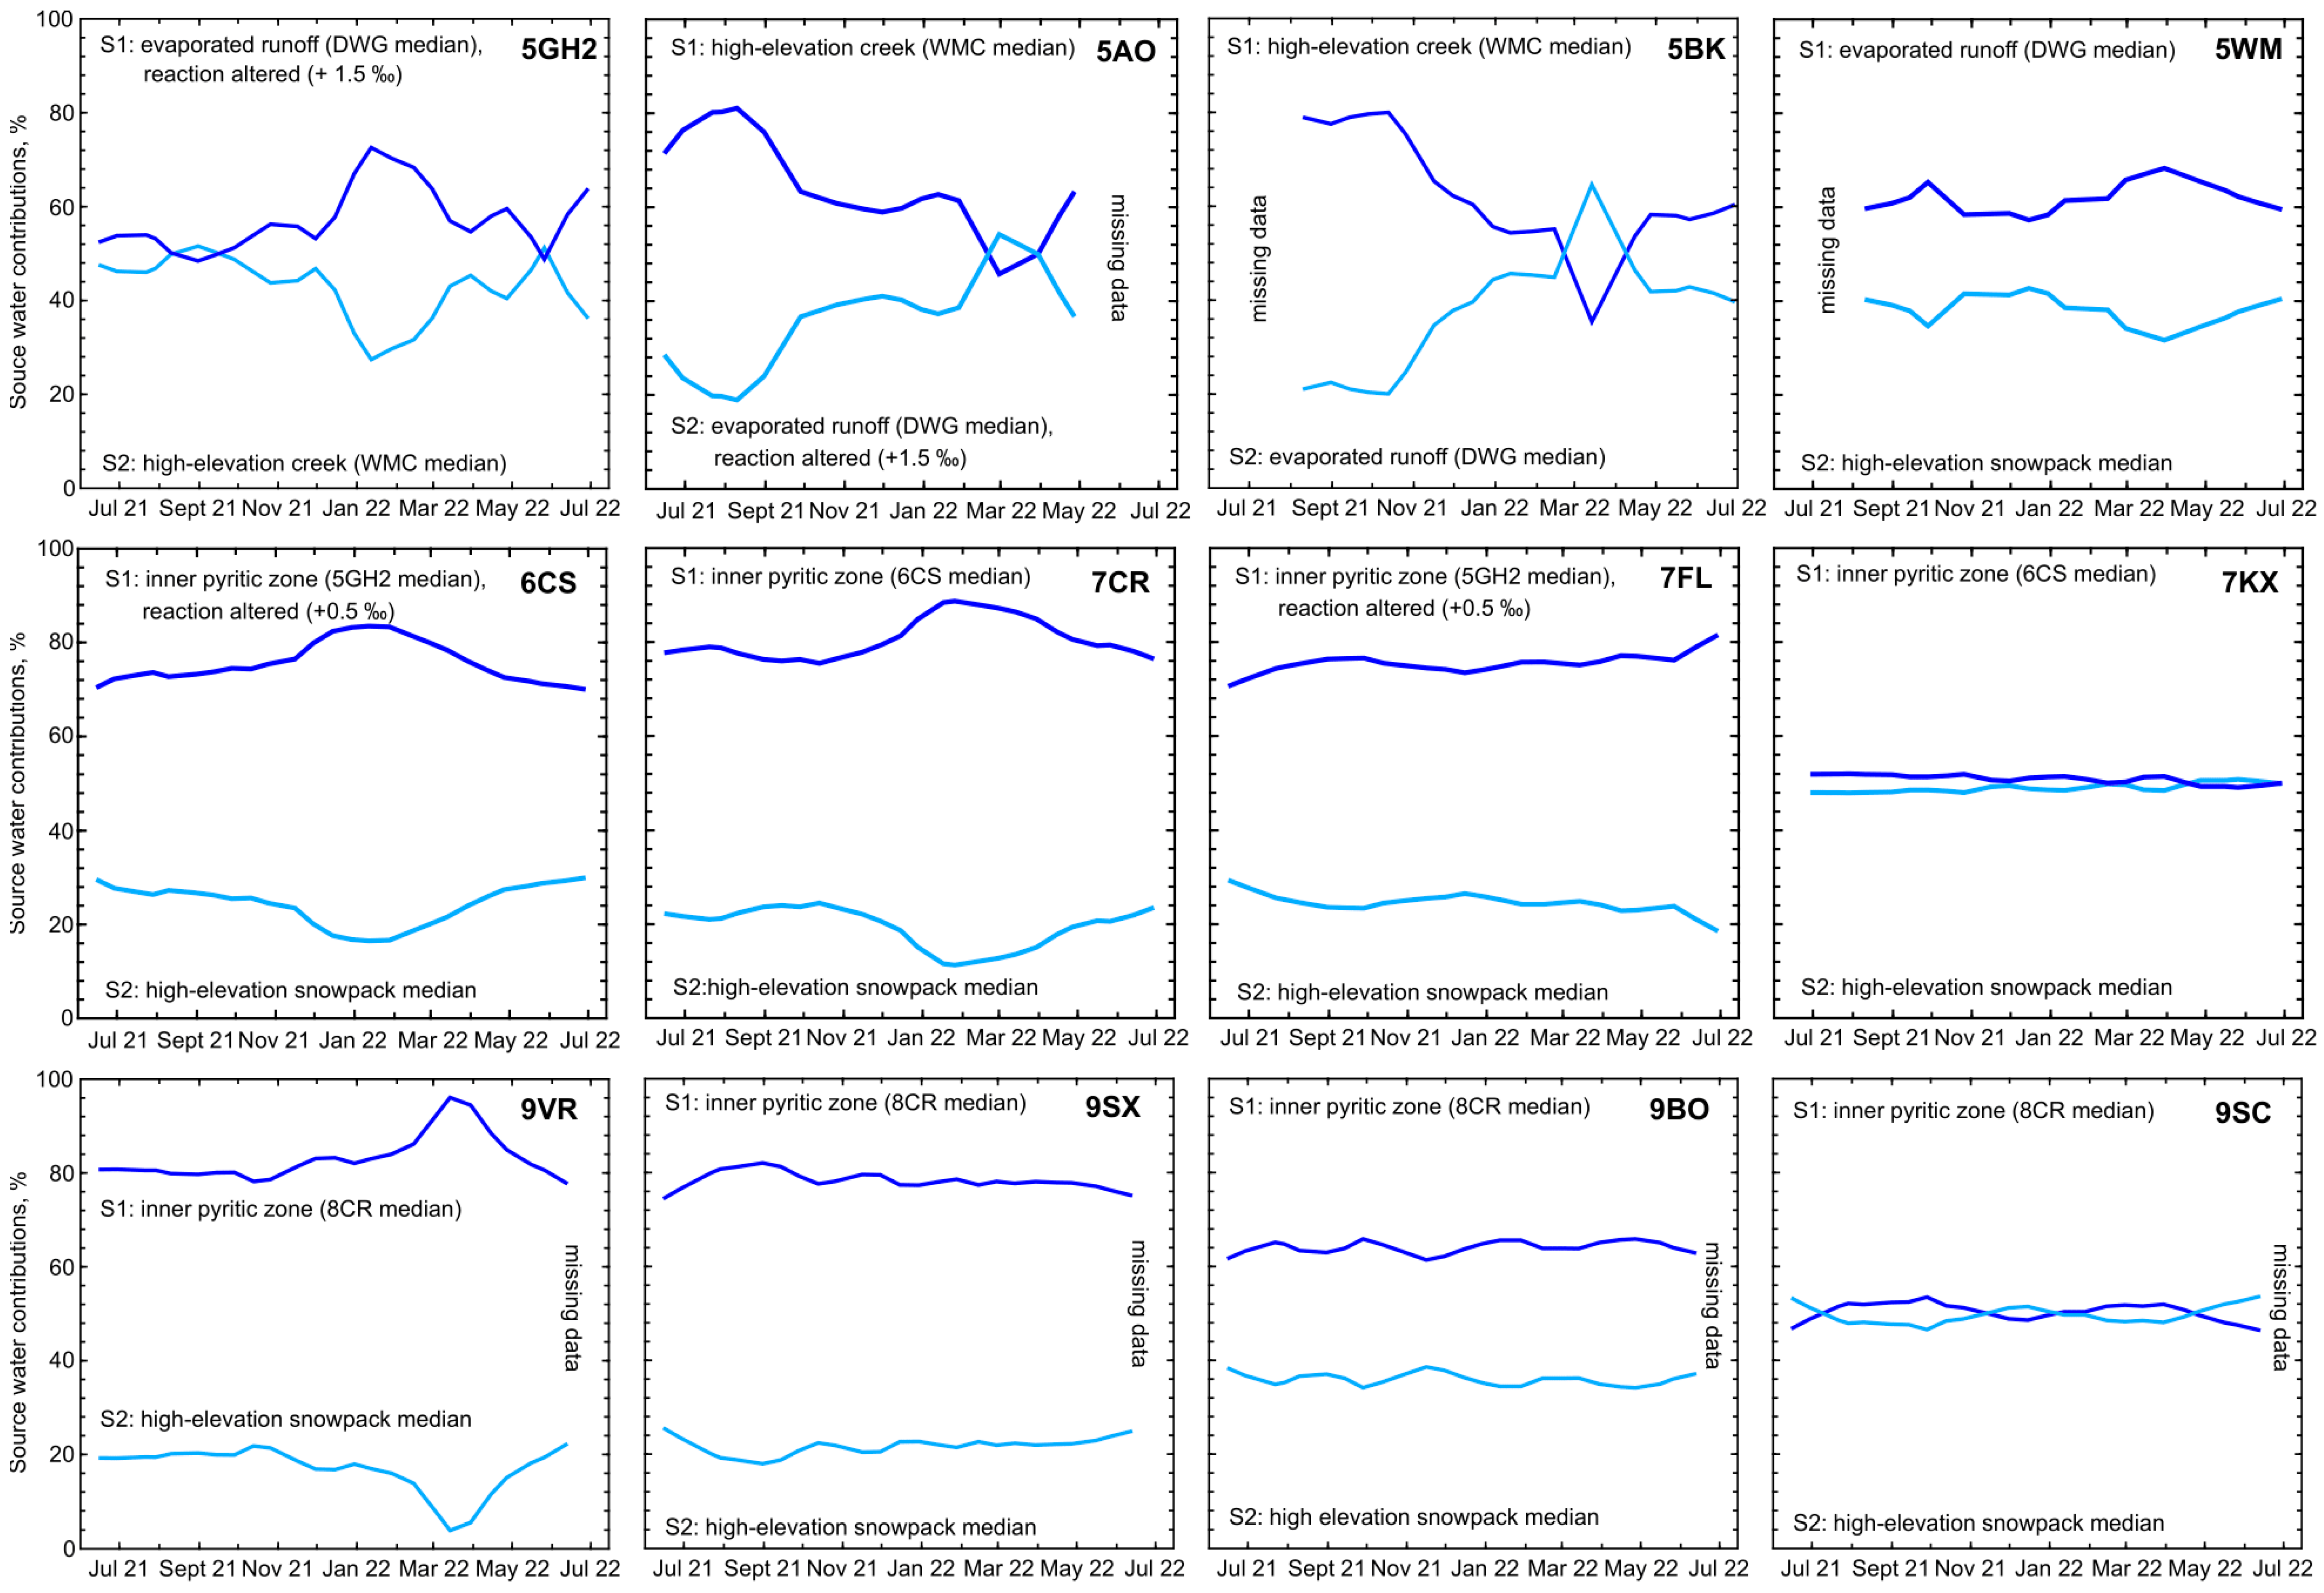
3.4. Source Water Unmixing
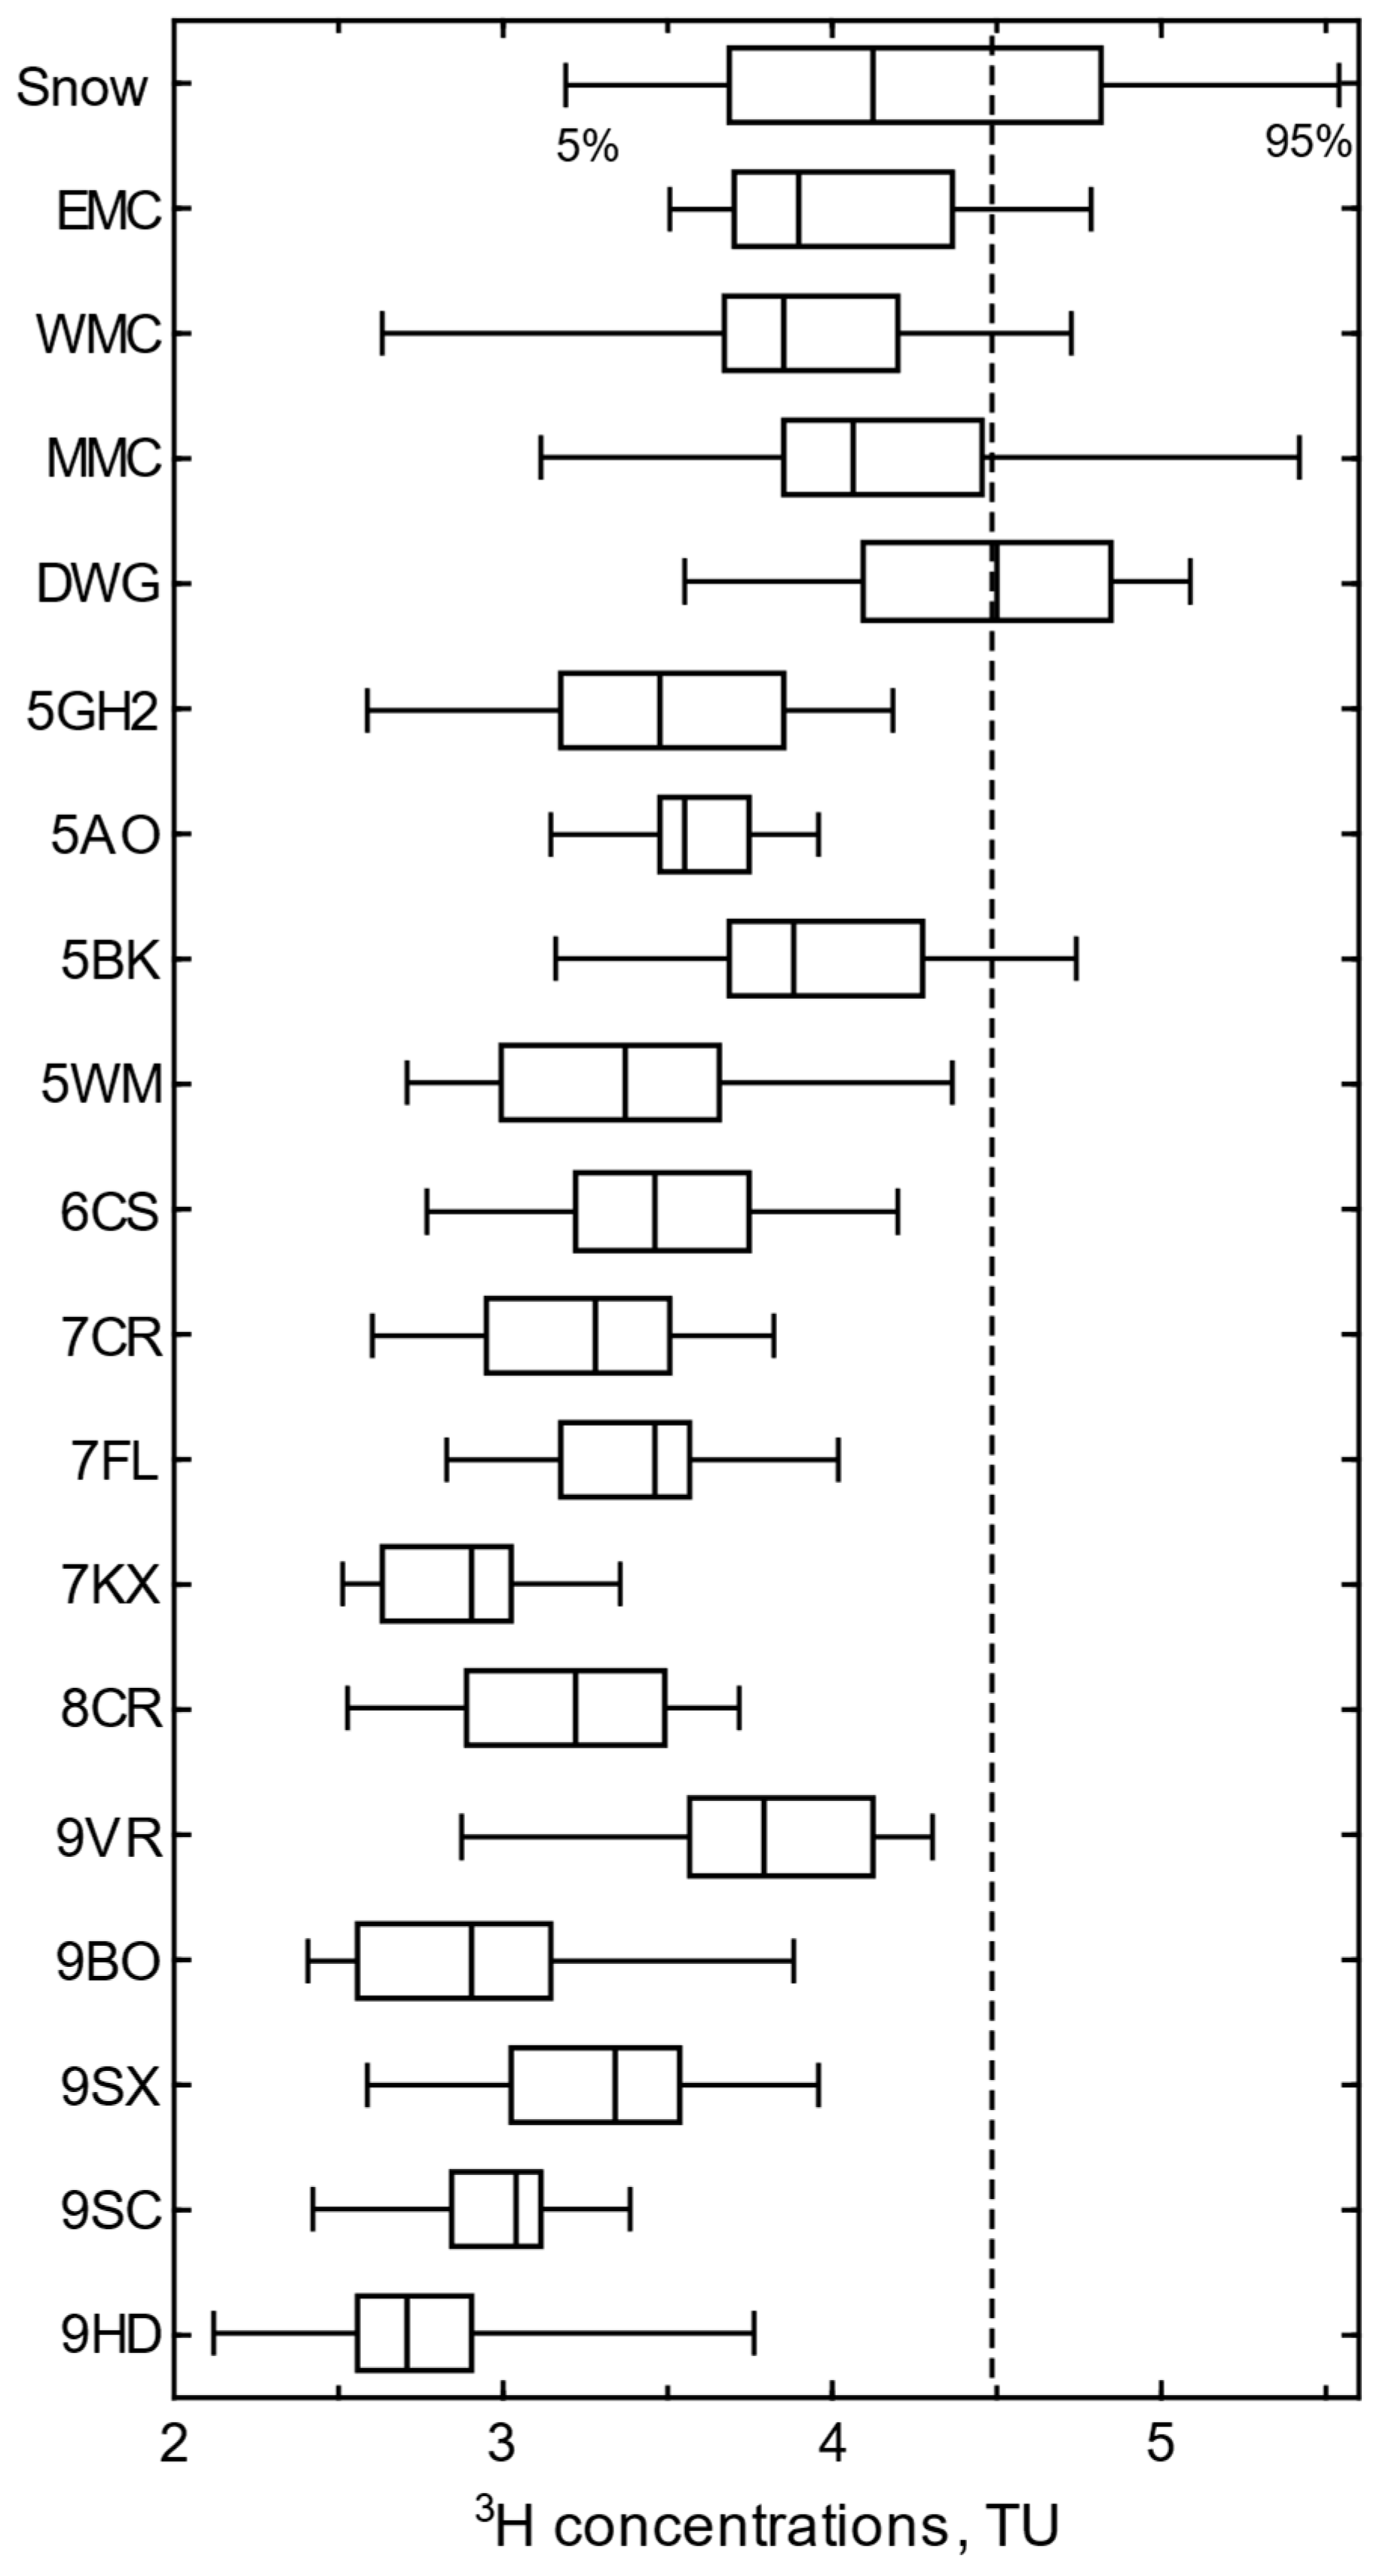
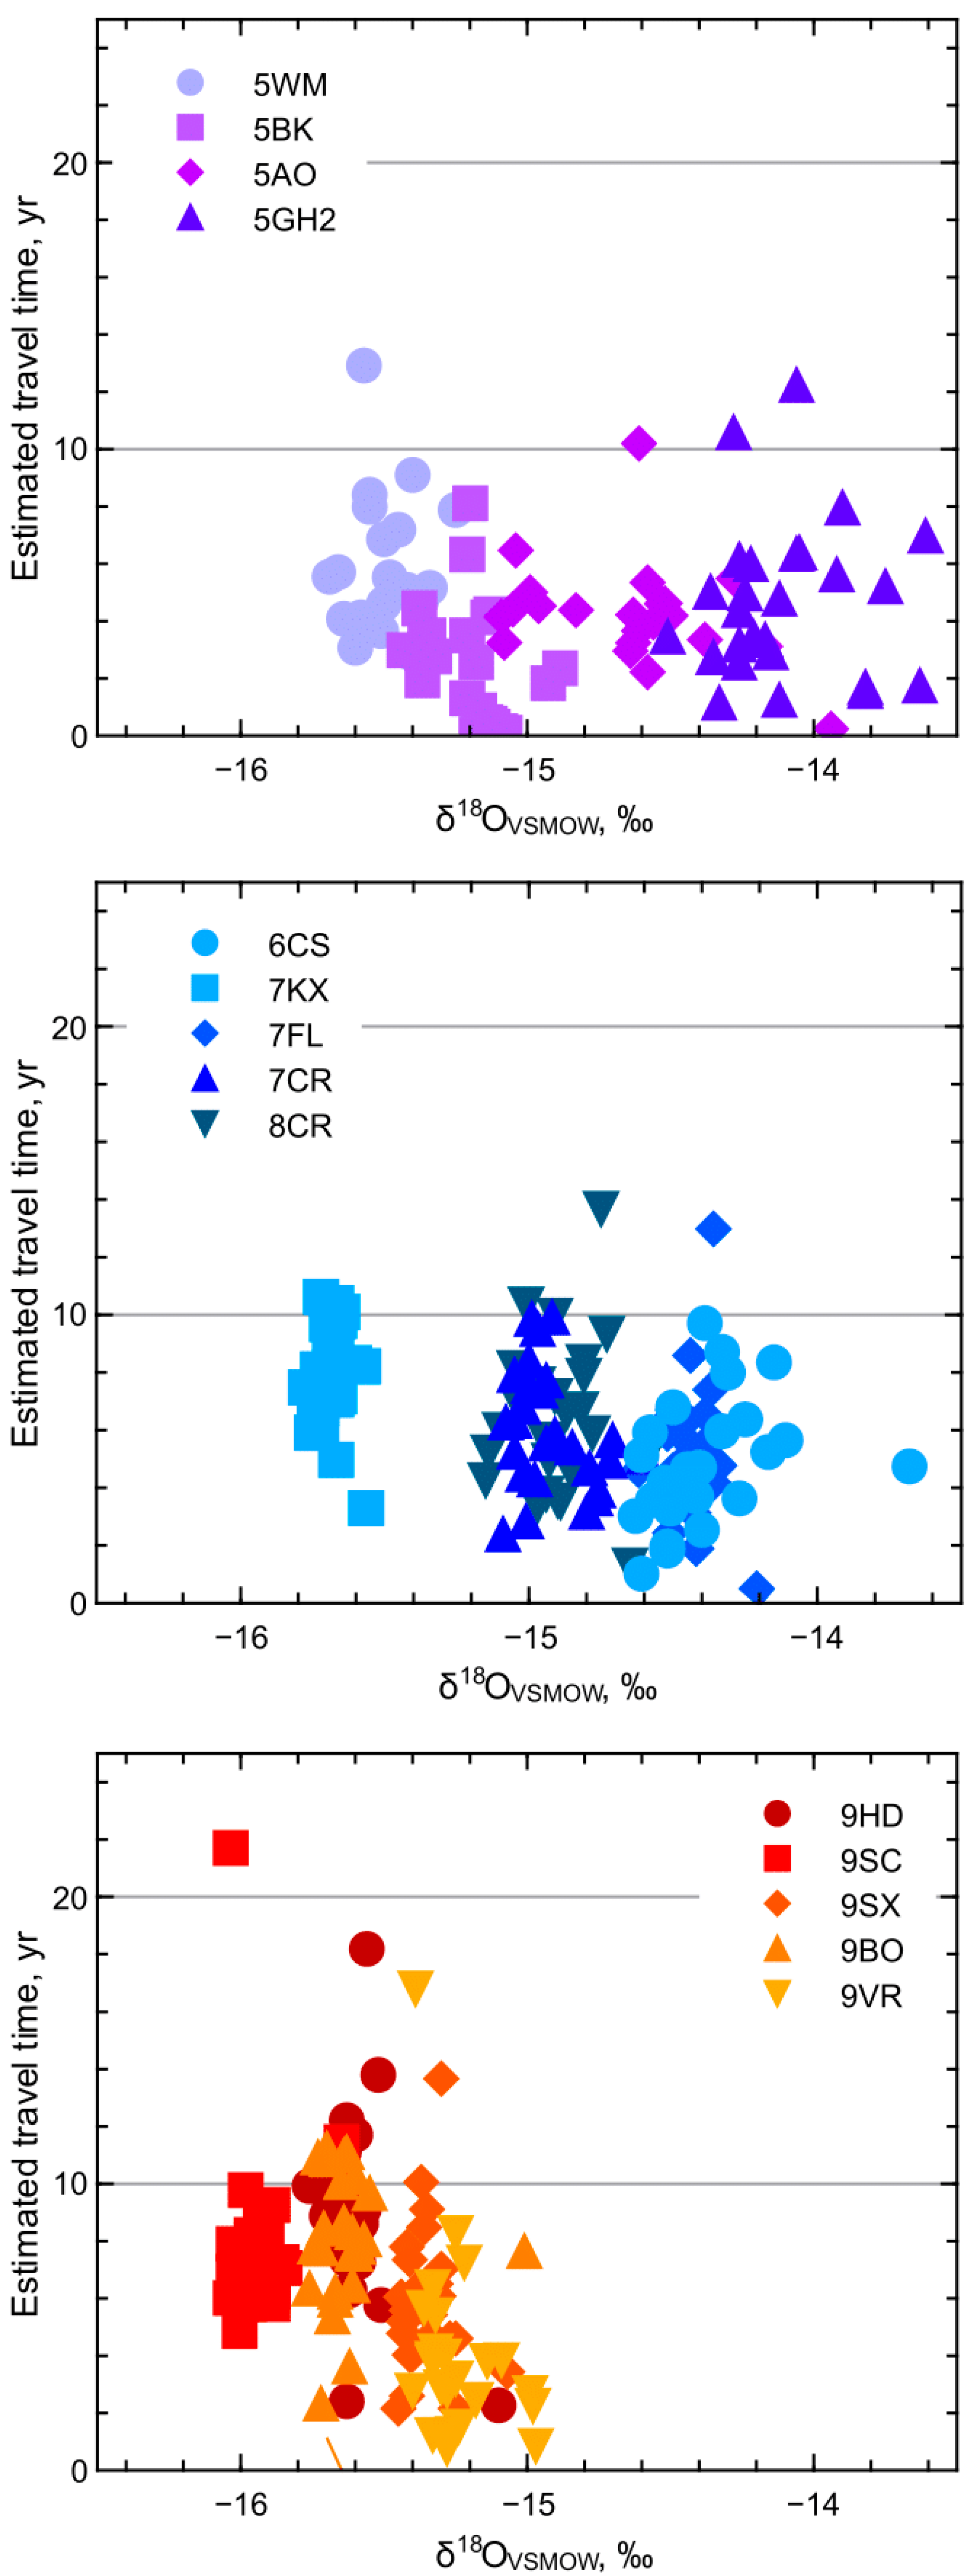
3.5. Mine Water Tritium and Relative Travel Time
4. Discussion
5. Summary and Conclusions
Supplementary Materials
Author Contributions
Funding
Data Availability Statement
Acknowledgments
Conflicts of Interest
References
- Nordstrom, D.K.; Blowes, D.W.; Ptacek, C.J. Hydrogeochemistry and Microbiology of Mine Drainage: An Update. Appl. Geochem. 2015, 57, 3–16. [Google Scholar] [CrossRef]
- Parbhakar-Fox, A.; Lottermoser, B. Principles of Sulfide Oxidation and Acid Rock Drainage. In Environmental Indicators in Metal Mining; Lottermoser, B., Ed.; Springer International Publishing: Cham, Switzerland, 2017; pp. 15–34. ISBN 978-3-319-42731-7. [Google Scholar]
- Akcil, A.; Koldas, S. Acid Mine Drainage (AMD): Causes, Treatment and Case Studies. J. Clean. Prod. 2006, 14, 1139–1145. [Google Scholar] [CrossRef]
- Gammons, C.H.; Metesh, J.J.; Duaime, T.E. An Overview of the Mining History and Geology of Butte, Montana. Mine Water Environ. 2006, 25, 70–75. [Google Scholar] [CrossRef]
- Daniels, W.; Orndorff, Z. Acid Rock Drainage from Highway and Construction Activities in Virginia, USA. In Proceedings of the 6th International Conference on Acid Rock Drainage, Cairns, QLD, Australia, 12–18 July 2003; pp. 479–487. [Google Scholar]
- Egiebor, N.O.; Oni, B. Acid Rock Drainage Formation and Treatment: A Review. Asia-Pac. J. Chem. Eng. 2007, 2, 47–62. [Google Scholar] [CrossRef]
- Lachmar, T.E. Application of Fracture-Flow Hydrogeology to Acid-Mine Drainage at the Bunker Hill Mine, Kellogg, Idaho. J. Hydrol. 1994, 155, 125–149. [Google Scholar] [CrossRef]
- Germon, M.; Stefanoff, J.; Riley, J.; Hudson, B. Acid Mine Drainage—Bunker Hill Mine Water Conceptual Model; CH2M Hill: Englewood, CO, USA, 1999. [Google Scholar]
- Umpleby, J.B.; Jones, E.L. Geology and Ore Deposits of Shoshone County, Idaho; Bulletin 732; U.S Geological Survey 778; U.S Geological Survey: Reston, VA, USA, 1923. [CrossRef]
- Box, S.E.; Bookstrom, A.A.; Anderson, R.G. Origins of Mineral Deposits, Belt-Purcell Basin, United States and Canada: An Introduction. Econ. Geol. 2012, 107, 1081–1088. [Google Scholar] [CrossRef]
- Fleck, R.J.; Criss, R.E.; Eaton, G.F.; Cleland, R.W.; Wavra, C.S.; Bond, W.D. Age and Origin of Base and Precious Metal Veins of the Coeur D’Alene Mining District, Idaho. Econ. Geol. 2002, 97, 23–42. [Google Scholar] [CrossRef]
- Ferraro, J.M. Relationships between Deformation and Mesothermal Veins in the Sunshine Mine Area, Coeur d’Alene District, Idaho. Master’s Thesis, University of Iowa, Iowa City, IA, USA, 2013. [Google Scholar] [CrossRef]
- Mauk, J. Stratigraphy of the Proterozoic Revett Formation, Coeur d’Alene District, Idaho; Open-File Report 01-319; U.S Geological Survey: Reston, VA, USA, 2002. Available online: https://pubs.usgs.gov/of/2001/of01-319/ (accessed on 30 July 2023).
- Hunt, J. Analysis of Recharge to an Underground Lead-Zinc Mine, Coeur D’Alene Mining District, Idaho; Idaho Bureau of Mines and Geology: Moscow, ID, USA, 1984. [Google Scholar]
- Umpleby, J.B. The Osburn Fault, Idaho. J. Geol. 1924, 32, 601–614. [Google Scholar] [CrossRef]
- Lachmar, T.E. The Influence of Fracture Properties on Ground-Water Flow at the Bunker Hill Mine, Kellogg, Idaho. Environ. Eng. Geosci. 1993, 4, 395–407. [Google Scholar] [CrossRef]
- Mauk, J.L.; White, B.G. Stratigraphy of the Proterozoic Revett Formation and Its Control on Ag-Pb-Zn Vein Mineralization in the Coeur d’Alene District, Idaho. Econ. Geol. 2004, 99, 295–312. [Google Scholar] [CrossRef]
- Balistrieri, L.S.; Box, S.E.; Bookstrom, A.A.; Ikramuddin, M. Assessing the Influence of Reacting Pyrite and Carbonate Minerals on the Geochemistry of Drainage in the Coeur d’Alene Mining District. Environ. Sci. Technol. 1999, 33, 3347–3353. [Google Scholar] [CrossRef]
- Riley, J.A.; Erikson, D.L.; Ralston, D.R.; Williams, R.E. The Hydrogeology of an Underground Lead-Zinc Mine: Water Flow and Quality Characteristics. Int. J. Mine Water 1984, 3, 39–53. [Google Scholar] [CrossRef]
- Erikson, D.L. Analysis of Water Movement in an Underground Lead-Zinc Mine, Coeur D’Alene Mining District, Idaho. Master’s Thesis, University of Idaho, Moscow, ID, USA, 1985. [Google Scholar]
- Serreze, M.C.; Clark, M.P.; Armstrong, R.L.; McGinnis, D.A.; Pulwarty, R.S. Characteristics of the Western United States Snowpack from Snowpack Telemetry Data. Water Resour. Res. 1999, 35, 2145–2160. [Google Scholar] [CrossRef]
- Rozanski, K.; Gonfiantini, R.; Araguas-Araguas, L. Tritium in the Global Atmosphere: Distribution Patterns and Recent Trends. J. Phys. G Nucl. Part. Phys. 1991, 17, S523–S536. [Google Scholar] [CrossRef]
- Trexler, B.D., Jr.; Ralston, D.R.; Reecs, D.R.; Williams, R.E. Sources and Causes of Acid Mine Drainage; Idaho Bureau of Mines and Geology: Moscow, ID, USA, 1975. [Google Scholar]
- Wai, C.M.; Reece, D.E.; Trexler, B.D.; Ralston, D.R.; Williams, R.E. Production of Acid Water in a Lead-Zinc Mine, Coeur d’Alene, Idaho. Geo 1980, 3, 159–162. [Google Scholar] [CrossRef]
- Hartman, M. A Study of Groundwater Age in the Bunker Hill Mine. Master’s Thesis, University of Idaho, Moscow, ID, USA, 1986. [Google Scholar]
- Birkel, C.; Soulsby, C. Advancing Tracer-Aided Rainfall–Runoff Modelling: A Review of Progress, Problems and Unrealised Potential. Hydrol. Process. 2015, 29, 5227–5240. [Google Scholar] [CrossRef]
- Cartwright, I.; Morgenstern, U. Using Tritium and Other Geochemical Tracers to Address the “Old Water Paradox” in Headwater Catchments. J. Hydrol. 2018, 563, 13–21. [Google Scholar] [CrossRef]
- Cauquoin, A.; Jean-Baptiste, P.; Risi, C.; Fourré, É.; Stenni, B.; Landais, A. The Global Distribution of Natural Tritium in Precipitation Simulated with an Atmospheric General Circulation Model and Comparison with Observations. Earth Planet. Sci. Lett. 2015, 427, 160–170. [Google Scholar] [CrossRef]
- Faure, G. Principles of Isotope Geology, 2nd ed.; John Wiley & Sons: Hoboken, NJ, USA, 1986; ISBN 0471864129. [Google Scholar]
- Gat, J.R. Oxygen and Hydrogen Isotopes in the Hydrologic Cycle. Annu. Rev. Earth Planet. Sci. 1996, 24, 225–262. [Google Scholar] [CrossRef]
- Beria, H.; Larsen, J.R.; Ceperley, N.C.; Michelon, A.; Vennemann, T.; Schaefli, B. Understanding Snow Hydrological Processes through the Lens of Stable Water Isotopes. WIREs Water 2018, 5, e1311. [Google Scholar] [CrossRef]
- Galewsky, J.; Steen-Larsen, H.C.; Field, R.D.; Worden, J.; Risi, C.; Schneider, M. Stable Isotopes in Atmospheric Water Vapor and Applications to the Hydrologic Cycle. Rev. Geophys. 2016, 54, 809–865. [Google Scholar] [CrossRef] [PubMed]
- Moser, H.; Stichler, W. Deuterium and Oxygen-18 Contents as an Index of the Properties of Snow Covers. Int. Assoc. Hydrol. Sci. 1974, 114, 122–135. [Google Scholar]
- Zongxing, L.; Qi, F.; Wei, L.; Tingting, W.; Xiaoyan, G.; Zongjie, L.; Yan, G.; Yanhui, P.; Rui, G.; Bing, J.; et al. The Stable Isotope Evolution in Shiyi Glacier System during the Ablation Period in the North of Tibetan Plateau, China. Quat. Int. 2015, 380–381, 262–271. [Google Scholar] [CrossRef]
- Earman, S.; Campbell, A.R.; Phillips, F.M.; Newman, B.D. Isotopic Exchange between Snow and Atmospheric Water Vapor: Estimation of the Snowmelt Component of Groundwater Recharge in the Southwestern United States. J. Geophys. Res. Atmos. 2006, 111. [Google Scholar] [CrossRef]
- Jasechko, S.; Perrone, D.; Befus, K.M.; Bayani Cardenas, M.; Ferguson, G.; Gleeson, T.; Luijendijk, E.; McDonnell, J.J.; Taylor, R.G.; Wada, Y.; et al. Global Aquifers Dominated by Fossil Groundwaters but Wells Vulnerable to Modern Contamination. Nat. Geosci. 2017, 10, 425–429. [Google Scholar] [CrossRef]
- Winograd, I.J.; Riggs, A.C.; Coplen, T.B. The Relative Contributions of Summer and Cool-Season Precipitation to Groundwater Recharge, Spring Mountains, Nevada, USA. Hydrogeol. J. 1998, 6, 77–93. [Google Scholar] [CrossRef]
- Xi, X. A Review of Water Isotopes in Atmospheric General Circulation Models: Recent Advances and Future Prospects. Int. J. Atmos. Sci. 2014, 2014, e250920. [Google Scholar] [CrossRef]
- Xu, Q.; Hoke, G.D.; Liu-Zeng, J.; Ding, L.; Wang, W.; Yang, Y. Stable Isotopes of Surface Water across the Longmenshan Margin of the Eastern Tibetan Plateau. Geochem. Geophys. Geosyst. 2014, 15, 3416–3429. [Google Scholar] [CrossRef]
- Sánchez-Murillo, R.; Brooks, E.S.; Elliot, W.J.; Boll, J. Isotope Hydrology and Baseflow Geochemistry in Natural and Human-Altered Watersheds in the Inland Pacific Northwest, USA. Isot. Environ. Health Stud. 2015, 51, 231–254. [Google Scholar] [CrossRef]
- Ansari, M.A.; Mohokar, H.V.; Deodhar, A.; Jacob, N.; Sinha, U.K. Distribution of Environmental Tritium in Rivers, Groundwater, Mine Water and Precipitation in Goa, India. J. Environ. Radioact. 2018, 189, 120–126. [Google Scholar] [CrossRef]
- Geyh, M.A.; Schleicher, H. Absolute Age Determination: Physical and Chemical Dating Methods and Their Application; Springer Science & Business Media: Berlin/Heidelberg, Germany, 2012; ISBN 978-3-642-74826-4. [Google Scholar]
- Craig, H.; Lal, D. The Production Rate of Natural Tritium. Tellus 1961, 13, 85–105. [Google Scholar] [CrossRef]
- Zahn, A.; Barth, V.; Pfeilsticker, K.; Platt, U. Deuterium, Oxygen-18, and Tritium as Tracers for Water Vapour Transport in the Lower Stratosphere and Tropopause Region. J. Atmos. Chem. 1998, 30, 25–47. [Google Scholar] [CrossRef]
- Harms, P.A.; Visser, A.; Moran, J.E.; Esser, B.K. Distribution of Tritium in Precipitation and Surface Water in California. J. Hydrol. 2016, 534, 63–72. [Google Scholar] [CrossRef]
- Michel, R.L.; Jurgens, B.C.; Young, M.B. Tritium Deposition in Precipitation in the United States, 1953–2012; Scientific Investigations Report 2018–5086; U.S. Geological Survey: Reston, VA, USA, 2018; p. 19. [CrossRef]
- Visser, A.; Thaw, M.; Esser, B. Analysis of Air Mass Trajectories to Explain Observed Variability of Tritium in Precipitation at the Southern Sierra Critical Zone Observatory, California, USA. J. Environ. Radioact. 2018, 181, 42–51. [Google Scholar] [CrossRef] [PubMed]
- Lu, F.H. How Long Is Enough: CO2-H2O Equilibration for δ18O Analysis in Saline Formation Waters? Rapid Commun. Mass Spectrom. RCM 2016, 30, 1647–1652. [Google Scholar] [CrossRef]
- Lucas, L.L. Massic Activity Ratios of the NBS/NIST Tritiated-Water Standards Issued Between 1954 and 1999. J. Res. Natl. Inst. Stand. Technol. 2000, 105, 535–539. [Google Scholar] [CrossRef] [PubMed]
- Dansgaard, W. Stable Isotopes in Precipitation. Tellus 1964, 16, 436–468. [Google Scholar] [CrossRef]
- Langman, J.B.; Martin, J.; Gaddy, E.; Boll, J.; Behrens, D. Snowpack Aging, Water Isotope Evolution, and Runoff Isotope Signals, Palouse Range, Idaho, USA. Hydrology 2022, 9, 94. [Google Scholar] [CrossRef]
- Peng, H.; Mayer, B.; Norman, A.L.; Krouse, H.R. Modelling of Hydrogen and Oxygen Isotope Compositions for Local Precipitation. Tellus B Chem. Phys. Meteorol. 2005, 57, 273. [Google Scholar] [CrossRef]
- Kong, Y.; Pang, Z.; Froehlich, K. Quantifying Recycled Moisture Fraction in Precipitation of an Arid Region Using Deuterium Excess. Tellus B Chem. Phys. Meteorol. 2013, 65, 19251. [Google Scholar] [CrossRef]
- Lucas, L.L.; Unterweger, M.P. Comprehensive Review and Critical Evaluation of the Half-Life of Tritium. J. Res. Natl. Inst. Stand. Technol. 2000, 105, 541–549. [Google Scholar] [CrossRef] [PubMed]
- Kalbus, E.; Reinstorf, F.; Schirmer, M. Measuring Methods for Groundwater–Surface Water Interactions: A Review. Hydrol. Earth Syst. Sci. 2006, 10, 873–887. [Google Scholar] [CrossRef]
- Dos Santos, E.C.; de Mendonça Silva, J.C.; Duarte, H.A. Pyrite Oxidation Mechanism by Oxygen in Aqueous Medium. J. Phys. Chem. C 2016, 120, 2760–2768. [Google Scholar] [CrossRef]
- Warren, J.W. Ventilation Report of Bunker Hill and Sullivan Mine Kellogg, Idaho. Master’s Thesis, Montana Tech. The University of Montana, Butte, MT, USA, 1950. [Google Scholar]
- Winterhalder, K. Reclamation of Smelter-Damaged Lands. In Reclamation of Drastically Disturbed Lands; John Wiley & Sons, Ltd.: Hoboken, NJ, USA, 2000; pp. 819–853. ISBN 978-0-89118-233-7. [Google Scholar]
- Siegel, F.R. Heavy Metals Mobility/Immobility in Environmental Media. In Environmental Geochemistry of Potentially Toxic Metals; Siegel, F.R., Ed.; Springer: Berlin/Heidelberg, Germany, 2002; pp. 45–59. ISBN 978-3-662-04739-2. [Google Scholar]
- Bershaw, J.; Hansen, D.D.; Schauer, A.J. Deuterium Excess and 17O-Excess Variability in Meteoric Water across the Pacific Northwest, USA. Tellus B Chem. Phys. Meteorol. 2020, 72, 1773722. [Google Scholar] [CrossRef]
- Craig, H. Isotopic Variations in Meteoric Waters. Science 1961, 133, 1702–1703. [Google Scholar] [CrossRef] [PubMed]


| Site Name | Site Identifier | Mine Level | Elevation (m, NAVD 88) | Relation to Pyritic Zone |
|---|---|---|---|---|
| East Milo Creek | EMC | surface | 1024 | above |
| West Milo Creek | WMC | surface | 1390 | above |
| Milo Creek, main stem | MMC | surface | 866 | adjacent |
| Deadwood Gulch | DWG | surface | 1084 | above |
| Greenhouse 2 Reed Drift | 5GH2 | 5 | 945 | internal |
| Becker Flume | 5BK | 5 | 943 | external |
| Williams Raise | 5WM | 5 | 943 | external |
| Asher Ore Chute | 5AO | 5 | 954 | transition |
| Crusher Station | 6CS | 6 | 892 | internal |
| Cherry Raise 7 | 7CR | 7 | 844 | external |
| Flood Drifts | 7FL | 7 | 857 | internal |
| Kateye Crosscut | 7KX | 7 | 845 | external |
| Cherry Raise 8 | 8CR | 8 | 786 | external |
| Van Raise | 9VR | 9 | 737 | external |
| Bailey Ore Chute | 9BO | 9 | 737 | external |
| Stanly Crosscut | 9SX | 9 | 733 | internal |
| South Chance | 9SC | 9 | 732 | external |
| Hite Drift | 9HD | 9 | 734 | external |
Disclaimer/Publisher’s Note: The statements, opinions and data contained in all publications are solely those of the individual author(s) and contributor(s) and not of MDPI and/or the editor(s). MDPI and/or the editor(s) disclaim responsibility for any injury to people or property resulting from any ideas, methods, instructions or products referred to in the content. |
© 2023 by the authors. Licensee MDPI, Basel, Switzerland. This article is an open access article distributed under the terms and conditions of the Creative Commons Attribution (CC BY) license (https://creativecommons.org/licenses/by/4.0/).
Share and Cite
Langman, J.B.; Gaddy, E.; Link, T.E.; Boll, J.; Barnett, B.; Hill, M. Isotope Discrimination of Source Waters, Flowpaths, and Travel Times at an Acid-Generating, Lead–Zinc–Silver Mine, Silver Valley, Idaho, USA. Water 2023, 15, 3362. https://doi.org/10.3390/w15193362
Langman JB, Gaddy E, Link TE, Boll J, Barnett B, Hill M. Isotope Discrimination of Source Waters, Flowpaths, and Travel Times at an Acid-Generating, Lead–Zinc–Silver Mine, Silver Valley, Idaho, USA. Water. 2023; 15(19):3362. https://doi.org/10.3390/w15193362
Chicago/Turabian StyleLangman, Jeff B., Ethan Gaddy, Timothy E. Link, Jan Boll, Bradley Barnett, and Morgan Hill. 2023. "Isotope Discrimination of Source Waters, Flowpaths, and Travel Times at an Acid-Generating, Lead–Zinc–Silver Mine, Silver Valley, Idaho, USA" Water 15, no. 19: 3362. https://doi.org/10.3390/w15193362