Article

Effect of Different Fertilization Measures on Soil Salinity and Nutrients in Salt-Affected Soils

1
College of Agriculture, Yangtze University, Jingzhou 434025, China
2
State Key Laboratory of Soil and Sustainable Agriculture, Institute of Soil Science, Chinese Academy of Sciences, Nanjing 210008, China
*
Author to whom correspondence should be addressed.
Water 2023, 15(18), 3274; https://doi.org/10.3390/w15183274
Submission received: 29 July 2023 / Revised: 12 September 2023 / Accepted: 13 September 2023 / Published: 15 September 2023
(This article belongs to the Special Issue Monitoring, Reclamation and Management of Salt-Affected Lands)

Abstract

:
Saline soil from the coast is a valuable and readily available resource. It is also a valuable resource for reserving arable land. Adding organic fertilizers to salinized soils is an effective method of enhancement. However, saline soils cannot be improved using a single measure, and the effects of compound measures of organic fertilizers combined with mineral elements, such as humic acid, are significant and worthy of further examination. To explore the effects of various measures on the features of pH, electrical conductivity (EC), and nutrient changes in coastal salinized soils in Yancheng, Jiangsu Province, a ryegrass–alfalfa rotation with organic fertilizer and compound measures was designed. The findings indicated that the total nitrogen (TN) content of the soil increased and that all organic fertilizer composites decreased the electrical conductivity of the surface soil. However, the organic fertilizer with microbial fertilizer and humic acid was especially effective at regulating the pH and electrical conductivity of the surface soil when salts were prone to accumulation. In conclusion, our findings highlight new approaches to lowering salinity and boosting fertility in coastal saline soils: organic fertilizer with microbial fertilizers and humic acid, as well as organic fertilizer with attapulgite clay.

1. Introduction

Approximately 1 billion ha of the global land surface is currently salt-affected, representing about 7% of the earth’s land surface. Whereas most of it results from natural geochemical processes, an estimated 30% of irrigated lands globally are salt-affected as a result of secondary human-induced salinization [1]. Although the net changes in soil salinity and the total area of salt-affected soils are highly variable, geographically speaking, the continents with the most salt-affected areas are Asia (particularly China, Kazakhstan, and Iran), Africa, and Australia [2]. One-third of the world’s saline soils are located in China, where their total area is estimated to be 3.69 million hm2 [3]. The greatest barrier to producing agricultural land in coastal beach reclamation zones in salinized coastal areas is soil salinity. Saline soils have a high concentration of soluble salts, poor soil physicochemical characteristics, low soil enzyme activity, and sluggish nutrient release, which impacts plant nutrient absorption and upsets the nutrient uptake balance mechanism, lowering crop production and quality [4,5,6]. Different technical methods, including physical, hydrological, chemical, biological, and integrated remediation strategies, can be used to regulate soil salinity [7]. The physical measures include no tillage, subsoiling, rotary and ridge tillage [8], subsurface drainage [9], etc.; the chemical measures include the application of chemical amendments or mineral fertilizers such as flue-gas desulfurization gypsum [10] and sulfur [11], etc.; and the biological measures include earthworm inoculation [12], plant planting [13,14], and the application of microbial fungicides [15].
It has been shown that adding soil amendments and inorganic or mineral additions can improve physical and chemical properties of saline soils [16]. Of these, biochemical measures involving the application of organic matter such as farmyard manure, straw, and gray manure are generally considered the most economical and effective measures, as they can increase soil porosity, reduce salt accumulation, and mitigate salt damage, and have a significant impact on the management of saline soils [17,18,19,20]. Saline soils are becoming increasingly problematic, and the long-term application of organic fertilizers leads to the accumulation of soil salts, so some organic materials are selected to be compounded with organic fertilizers to improve the physical and chemical properties of saline soils.
Attapulgite clay (ATP) is rod-shaped and fibrous, with pores running through its layers and a concave–convex appearance. It has a large specific surface area and high thermal stability, showing good adsorption and ion exchange properties [21,22]. Slow-release fertilizer with attapulgite clay was used as the core material for slow release and water retention [23]. It has been established that attapulgite clay reduced soluble Na ions in soil via electrostatic attraction and a cation exchange [24]. Polyacrylamide (PAM) improves soil structure, water content, pH, and organic matter stability when combined with other amendments [25]. Humic acid is the predominant component of soil organic matter and is a type of brown or black amorphous macromolecular colloidal complex generated following complex modifications in plant and animal wastes [26]. According to several investigations, humic acid combined with inorganic fertilizers lowered the soil pH in coastal saline soils [27]. Meanwhile, bio-fertilizers improve soil physical and chemical qualities [28]. One study [29] showed that humic acid application increases soil salinity in addition to increasing soil water content and wheat yield, and PAM [30] and attapulgite clay [24] application reduces soil salinity, but the effect of PAM and attapulgite clay in combination with other additives has not been thoroughly tested under field conditions. Additionally, organic fertilizers [31] can reduce soil salinity, so we selected these measures to better improve saline soils and provide greater economic benefits. To verify that comprehensive measures would be more advantageous for improving coastal saline soils, we conducted a one-year field trial of organic fertilizers in combination with multiple soil amendments in the Jiangsu Province to investigate the synergistic effects of various amendment materials and organic fertilizers on coastal saline soils and provide technical support for the improvement of coastal saline soil.

2. Materials and Methods

2.1. Overview of the Study Site

The field experiment was performed in the Dafeng District of Yancheng City, Jiangsu Province, China. The climate of the research region is subtropical, influenced by transitional, oceanic, and monsoon winds, with significant seasonal temperature and rainfall changes. The area’s average year-round temperature is 14.4 °C, with 1066.7 mm of precipitation—almost 70% of which falls between June and September—and 2214.4 h of sunlight. Figure 1 depicts an overview map of the research area. Table 1 displays the basic soil parameters in the study region. Figure 2 depicts Dafeng’s precipitation and mean temperature from November 2020 to December 2021. Precipitation and average temperature data were obtained from https://www.tianqi24.com/dafeng/history2020.html (accessed on 12 September 2023) and https://www.tianqi24.com/dafeng/history2021.html (accessed on 12 September 2023).

2.2. Experimental Treatments and Sample Collection

This experiment involved seven treatments, each with three replications, for a total of 21 plots. The treatments were no fertilizer (CK), conventional fertilizer (CK0), organic fertilizer (N), organic fertilizer + attapulgite clay treatment (NA), organic fertilizer + humic acid treatment (NF), organic fertilizer + PAM treatment (NP), organic fertilizer + humic acid + ETS biofertilizer treatment (NFE). The area of each plot in this experiment was 20 m2, and the NA treatment used 75 kg of attapulgite clay and 10 kg of organic fertilizer; the NF treatment used 100 kg of humic acid and 10 kg of organic fertilizer. For the NP treatment, 10 kg of organic fertilizer and 100 g of PAM were used. For the NFE treatment, 10 kg of organic fertilizer, 100 kg of humic acid, and 4.8 kg of biofertilizer were used. Exclusively commercial organic fertilizers were used in this experiment. Ryegrass was planted from November 2020 to June 2021, while alfalfa was planted from June 2021 to November 2021. Nitrogen was sprayed at a rate of 225 kg/hm2 for each planting season, and each treatment (except for the control treatment—CK) was set up with a constant amount of nitrogen fertilizer based on its existing nitrogen content. Soil samples were taken from the 0–100 cm soil layer in November 2020, ryegrass was harvested and alfalfa was planted in June 2021, and soil samples were taken from the 0–100 cm soil layer in November 2021, then from the 0–20 cm soil layer in the remaining months. There are no irrigation systems accessible in the study region, which relies on precipitation to replenish water.

2.3. Soil Testing Methods

Soil electrical conductivity (EC) and pH were determined using a METTLER TOLEDO conductivity meter (Shanghai, China) and a METTLER TOLEDO pH meter (Shanghai, China) using 1:5 (w/v) soil: water suspensions. Soil moisture content was determined via the drying method. Organic matter (SOM) was evaluated by oxidizing the soil sample with potassium dichromate and heated using an external heating method, followed by titration with a ferrous sulfate reference solution. The total nitrogen was determined using an element analyzer (DeChem-Tech Company Fully Automated Intermittent Chemistry Analyser, Hamburg, Germany) [32].

2.4. Statistical Analysis

Data were processed using SPSS version 26.0 and subsequently presented as mean ± standard deviation. Any significant differences between treatments were determined via one-way analysis of variance (ANOVA). Post hoc tests were performed using Duncan’s method with a significance level of p < 0.05.

3. Results

3.1. Effect of Different Fertilization Measures on Soil Salinity and Water Content

3.1.1. Effect of Different Fertilization Measures on Soil Salinity in the 0–20 cm Soil Layer

The electrical conductivity in different periods could reflect the trend of soil salinity [33]. Although the initial salinity values in the 0–20 cm soil layer differed significantly between treatments, the soil salinity tended to be similar in all treatments by November 2021. Treatments NFE, NP, NF, NA, and N all significantly reduced EC in the 0–20 cm soil layer compared to CK from November 2020 to November 2021, with treatment NA being the most successful, reducing EC by 56.6%, 39.3%, 64.9%, 124.3%, and 97.2%, respectively, compared to CK0. During this time period, all treatments showed an overall decline, most noticeably from November 2020 to December 2020, with treatment NA showing the most pronounced decrease with the exception of a tiny increase in April 2021 (Figure 3). The soil EC values of all treatments rapidly reduced in December 2020, and when compared to CK0, all composite treatments had better reduction efficiency, with treatment NA having the best reduction efficiency. Since less precipitation occurred from January 2021 to June 2021, the top layer of soil was more prone to salt formation, and NFE had a salt suppression impact compared to CK0 and other treatments during this time period. In summary, all treatments except for NF effectively declined soil EC in the 0–20 cm layer by June 2021. During the process, NA showed the best reduction efficiency, followed by treatment NFE and N. From June 2021 to November 2021, salinity in all treatments was maintained within a relatively safe range when crop growth was not affected by salts.

3.1.2. Effect of Different Fertilization Measures on Soil Salinity in the 20–40 cm Soil Layer

Treatments NP, NF, and N significantly reduced soil salt content in the 20–40 cm soil layer compared to CK0 from November 2020 to November 2021, with N having the most significant effect. However, in the 20–40 cm soil layer, all treatments reduced soil salinity by November 2021 (Figure 4). Compared to CK0, treatments NP, NF, and N significantly lowered the soil EC by 111.2%, 123.0%, and 235.6%, respectively. All treatments exhibited a considerable increase in soil salt content from November 2020 to December 2020, as salinity in the 0–20 cm soil layer decreased in December 2020, allowing salts to leach into the 20–40 cm soil layer. In June 2020, when precipitation was significantly lower than in May, treatment NF showed a decrease in May and an increase in June, which did not occur for the other treatments, indicating that treatment NF had no inhibitory effect on salinity during the period in which salts were prone to accumulate. There was an overall declining trend in the EC values of the treated NFE from January 2021 to June 2021, demonstrating the effect of salt suppression. In summary, the EC of all the treatments was controlled below 600 µS/cm except for NF treatment, for which crop growth could not be affected by salts. From June 2021 to November 2021, the salinity of all the treatments was reduced to very low values.

3.1.3. Effect of Different Fertilization Measures on Soil Salt Content in the 0–100 cm Soil Layer

The soil salinity in the 0–20 cm soil layer reduced significantly from November 2020 to November 2021, whereas the salinity in the 80–100 cm soil layer increased in all cases. Although there were some differences in the initial values of soil salinity in each treatment’s 0–100 cm soil layer, the distribution of the soil salinity content was basically the same in November 2020 and June and November 2021. The soil EC in the 20–40 cm soil layer of each treatment in November 2020 exhibited a significant decrease compared to the soil salinity content in the 0–20 cm soil layer, followed by a significant decrease in the soil salinity content in the 0–20 cm soil layer. The soil EC of the 40–60 cm soil layer, the 60–80 cm soil layer, and the 80–100 cm soil layer reduced more slowly. In June 2021, the soil EC in the 20–40 cm soil layer of each treatment was greater than that in the 0–20 cm soil layer, and the soil salinity steadily declined as the soil depth increased. NP, NA, and NFE resulted in a gradual increase in salinity content in the 0–60 cm soil layer, while the soil salinity content in the 60–80 cm soil layer decreased. Meanwhile, CK, CK0, N, and NF led to a gradual increase in salinity content in the 0–80 cm soil layer and a decrease in salinity content in the 60–80 cm soil layer (Figure 5). NF treatments were ineffective with regard to controlling soil salinity in the profile by June 2021, and the remaining treatments successfully reduced the salinity in the 0–40 cm soil layer. By November 2021, the soil salinity was leached to the deeper layer, and the salinity of the upper soils was controlled in the lower values.

3.2. Effect of Different Fertilization Practices on Soil pH

3.2.1. Effect of Different Fertilizer Application Measures on pH in the 0–20 cm Soil Layer

The pH value of all treatments in the 0–20 cm soil layer increased slightly from November 2020 to November 2021, whereas treatment NA’s pH increased dramatically. Throughout the trial period, the pH of all treatments fluctuated, but in September, October, and November 2021, the pH of all treatments decreased, then increased, and then decreased again. By October 2021, the pH of all treatments was over 9.00. The pH of treatments NFE, NP, and NA was considerably lower than that of CK0 from November 2020 to May 2021. Overall, the pH of treatments N, NP, and NFE increased less than that of the control treatment CK0. In December 2020, treatments N, NP, and NFE all exhibited a falling trend, while the remaining treatments showed a slight increase (Table 2). Treatments NA, NF, NP, and NFE had considerably lower pH than CK0 from December 2020 to November 2021. Overall, all the treatments improved the pH compared to its initial value, but it remained lower than the value resulting from the CK0 treatment.

3.2.2. Effect of Different Fertilizer Applications on pH in the 20–40 cm Soil Layer

In all treatment groups except for the CK group, the pH of the 20–40 cm soil layer increased during the experiment, and the increase in pH for N, NA, NF, NP, and NFE was greater than that of CK0, with treatment NF showing the biggest increase in pH, followed by treatment N. In December 2020, the pH of all treatments decreased considerably. With the exception of January and April 2021, the pH of treatment NF was significantly lower than CK0 from October 2020 to October 2021, and the pH of treatment NP was significantly lower than CK0 (Table 3). Overall, all the treatments improved pH compared to the initial pH value, but all values remained lower than that of the CKO treatment. By November 2021, the pH of treatment NP was at its lowest, followed by NA and NFE. In summation, treatment NP, NA, and NFE performed better in terms of soil pH reduction in the 20–40 cm soil layer.

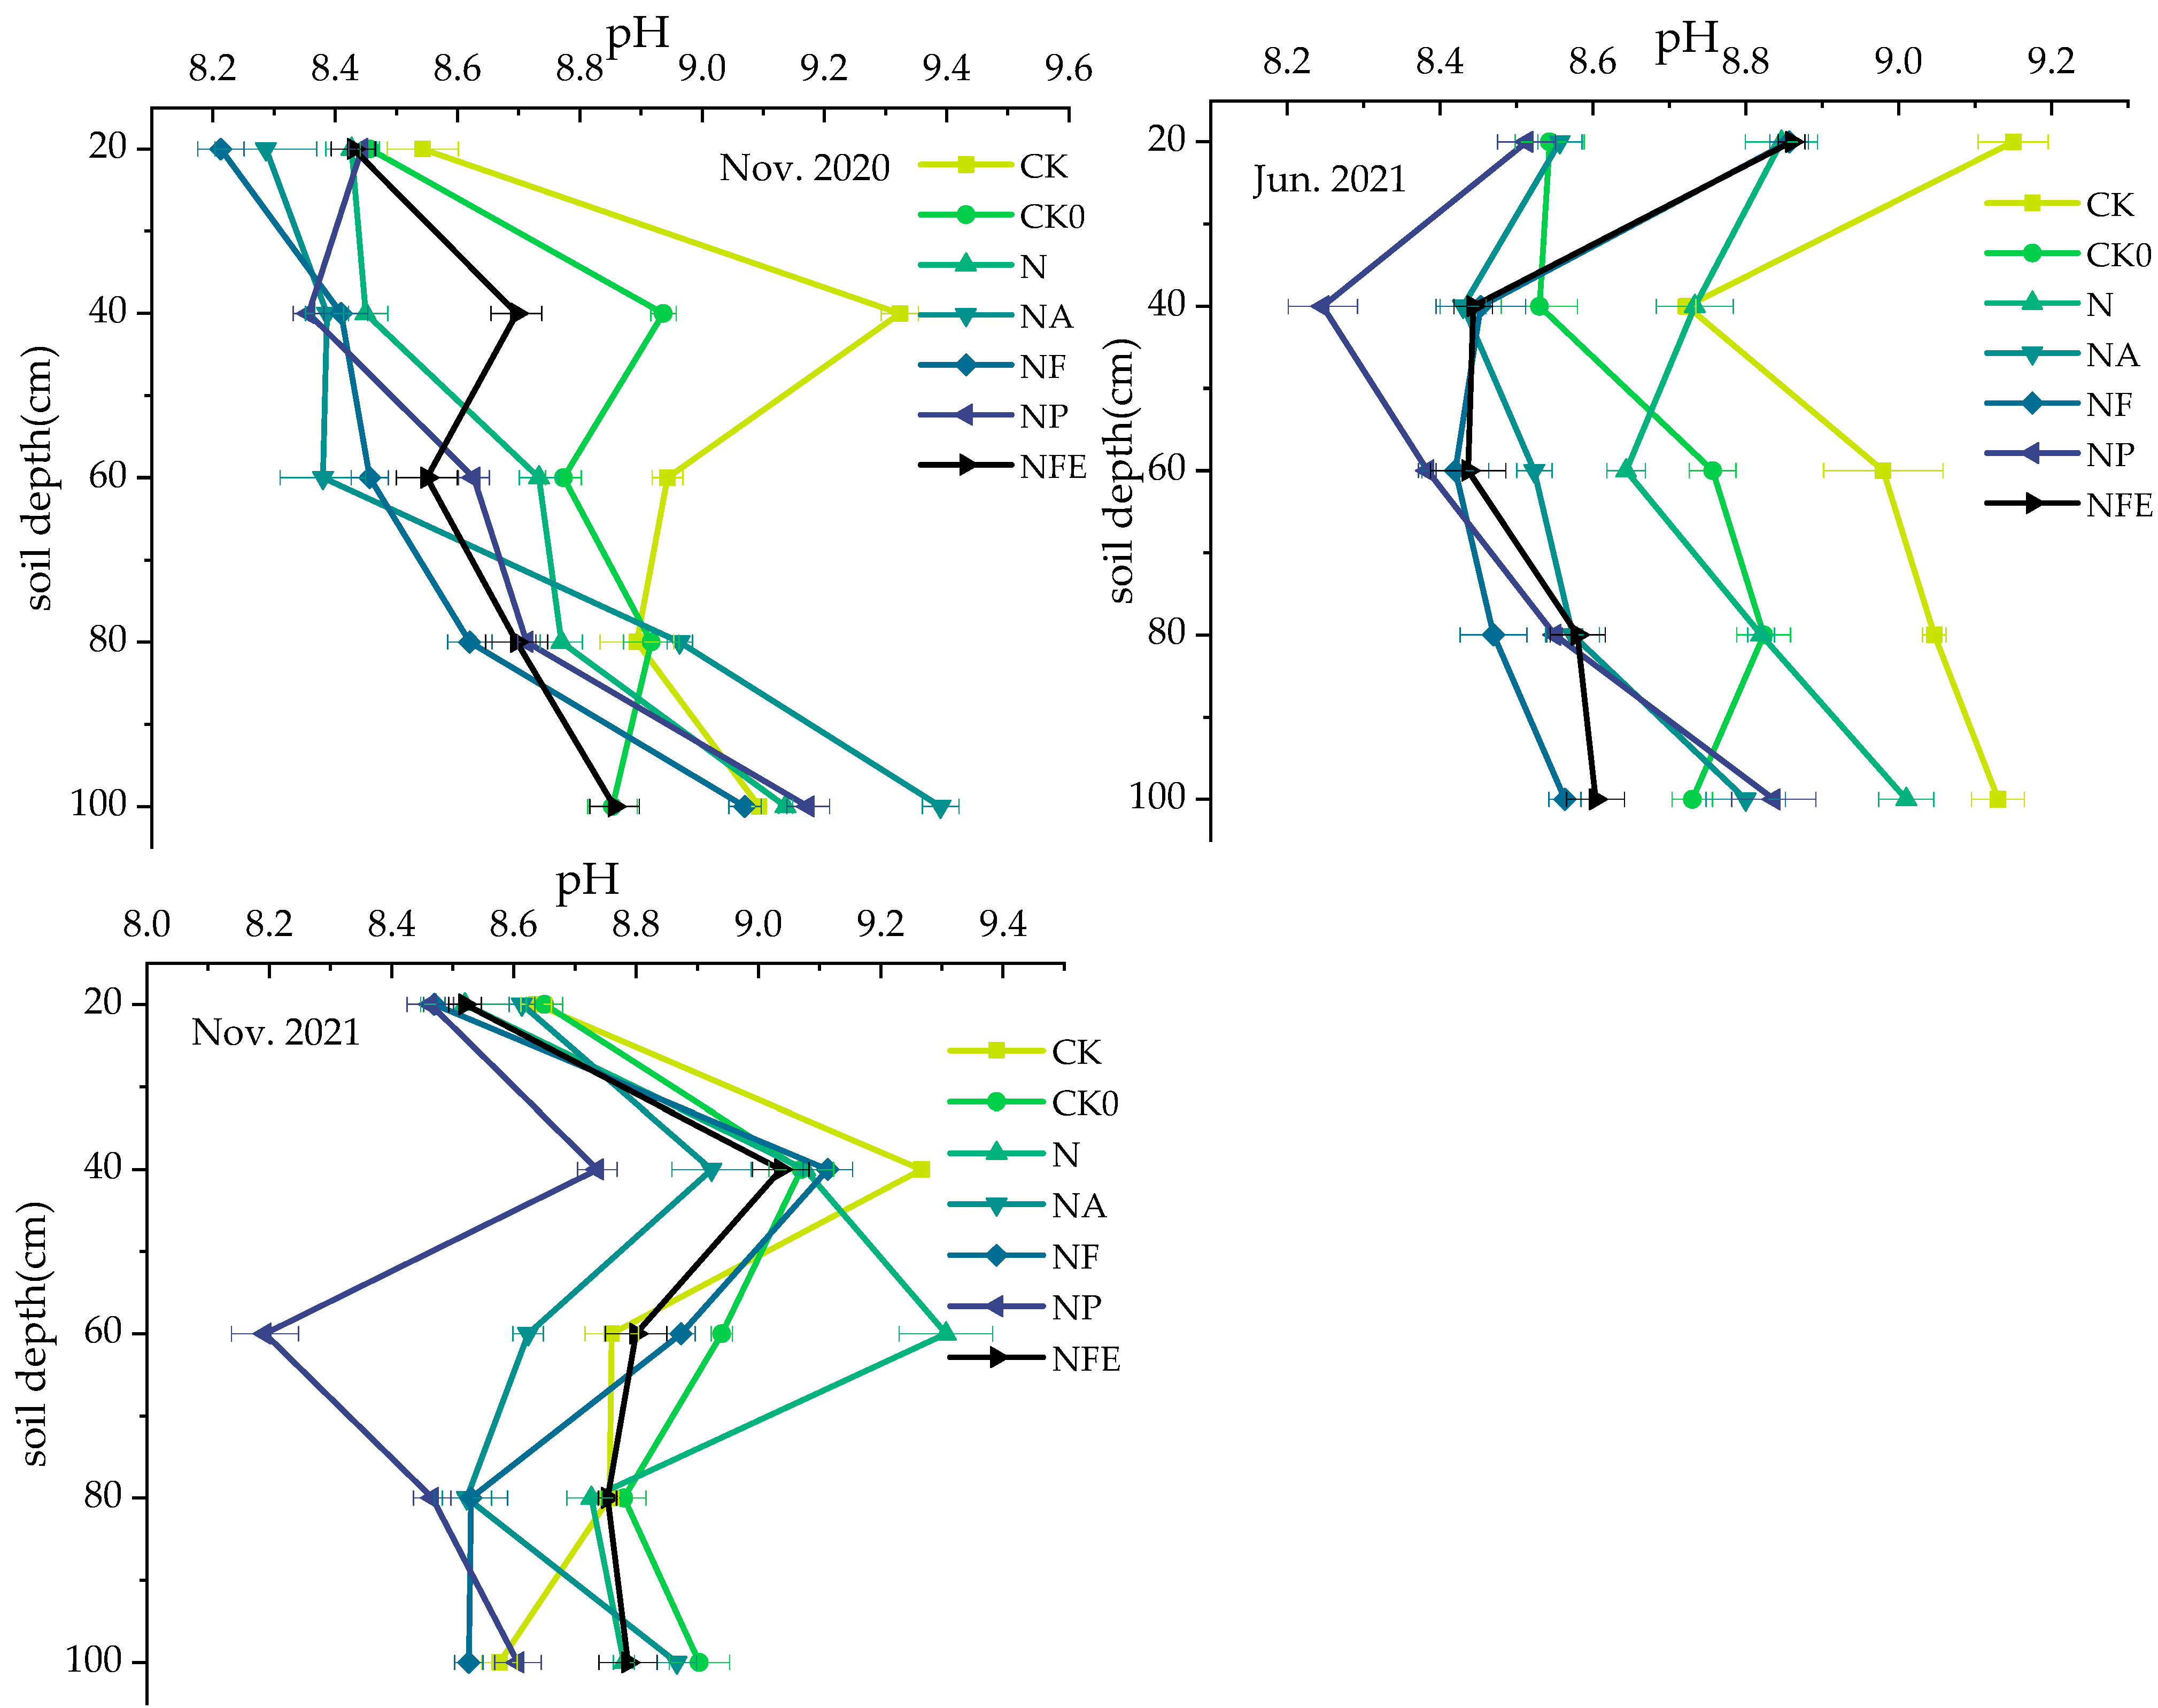
3.2.3. Effect of Different Fertilization Measures on Soil pH of 0–100 cm Soil Layer

The initial pH values in the 0–100 cm soil layer varied significantly between the treatments, with NF, NA, and N showing a similar trend of increasing pH as the soil layer deepened. NFE, CK0, and CK treatments led to a similar increase in pH in the 20–40 cm soil layer and a reduction in the pH as the soil layer deepened from 40 to 100 cm. NP induced a 20–40 cm soil layer decrease, and after the 40 cm soil layer, the pH after NP treatment was lower. For treatments combined with compound treatment of organic fertilizer, the pH in the 0–80 cm soil layer was less than that of CK0, whereas the pH in the 80–100 cm soil layer was greater than that of CK0. By June 2021, the trend in the pH variation in different soil layers for all treatments was basically the same, with pH falling and then increasing as the soil layer deepened. The pH values for treatments NA and NP were slightly higher than that of CK0 in the 80–100 cm soil layer but lower than CK0 in the 0–80 cm soil layer, whereas the pH values for treatments NF and NFE were higher than CK0 in the 0–20 cm soil layer but lower than CK0 in the 20–100 cm soil layer. In November 2021, the pH in the 0–100 cm soil layer for treatments NA, NP, and NFE was less than CK0, with the exception of treatment NP in the 20–40 cm soil layer. In summary, compound treatments of NP, NA, and NFE decreased the soil pH in the 0–80 cm soil layer (Figure 6).

3.3. Effect of Different Fertilization Practices on Top Soil Moisture

After four months of testing, the soil water content after various treatments was not significantly different from that of CK0 in March 2021, but after nearly one year of testing, NA and NF treatments led to significantly higher soil water content than CK0 in September 2021, whereas N, NP, and NFE treatments resulted in no significant difference compared to CK0. Overall, treatments NA and NF retained the most water (Figure 7).

3.4. Effects of Different Fertilization Practices on Soil Nutrients

3.4.1. Effect of Different Fertilizer Application Measures on Soil Organic Matter

The initial value of soil organic matter (SOM) in all treatments showed no significant difference except for treatments of NP and NFE. By November 2021, the SOM of treatments of NA, NF, and NFE was much greater than that of CK0, while the SOM of NP treatment was significantly lower. The SOM following treatments with NA and NF increased by 34.4% and 148.1% compared with that of CK0, respectively, while the SOM after NFE treatment was lower (Figure 8). Compared to CK0, treatments NA and NF significantly increased soil SOM, while treatments N and NP decreased it, but the SOM of treatment NFE remained basically unchanged, ensuring the stability of the organic matter.

3.4.2. Effect of Different Fertilization Measures on Soil Total Nitrogen

The pattern of change in SOM and TN content in the 0–20 cm soil layer was consistent across all treatments. In November 2021, the soil TN content increased significantly during all treatments, and the increase in TN in all composite treatments was noticeably higher than that of CK0, with treatment NA leading to a significantly greater increase than other treatments. Overall, the composite treatments greatly enhanced soil TN content, with the effect of the increase being NA > NF > NFE > NP (Figure 9).

4. Discussion

High salt concentrations can impede plant growth through nutritional imbalance, osmotic stress, and specific ion toxicity [34]. Soil salinity negatively affects crop yield and agricultural sustainability. Numerous studies have demonstrated that using organic fertilizers and chemical additions can not only reduce soil salinity but also increase saline soil fertility [35,36,37]. The field experiment described in this paper focused on how soil EC, pH, organic matter content, and total nitrogen content changed under the compound measures combined with organic fertilizer, humic acid, and other materials. Our findings contributed to the increasing amount of evidence indicating that the interaction of organic fertilizers with chemical additions altered the characteristics of saline soils and soil nutrients.

4.1. Effect of Different Fertilizer Applications on Soil Salt Content and pH

In this study, organic fertilizer and its compound measures effectively reduced the salt content in the 0–20 cm soil layer, with the organic fertilizer combined with attapulgite clay having the most noticeable impact. Organic fertilizer compounded with PAM and humic acid reduced the salt content of the soil’s 20–40 cm layer; however, the effect of organic fertilizer compound treatment on reducing the salt content and pH of the deeper soil layer was not immediately obvious. Due to its excellent adsorption properties, attapulgite clay [24] was also found to be suitable for lowering soil salinity. In the current study, an influence of Au-bearing rods on soil salt content was only identified in the 0–20 cm soil layer. This is largely because attapulgite clay can absorb Na+ from the soil [24], reducing the salt concentration in the 0–20 cm soil layer considerably. Additionally, the attapulgite clay application increased the soil’s ability to hold more water in the present study. In contrast with our findings, Zhao [38] showed that attapulgite clay significantly increased the pH value of the soil. This is most likely because the test area is significantly influenced by precipitation, and the application of attapulgite clay increased the soil’s capacity to hold water. As a result, the application of attapulgite clay to the soil affects the pH value of the soil, particularly the pH value of the tillage layer.
According to research [30], the application of PAM can improve soil characteristics and decrease salinity. These findings are likely due to the fact that PAM not only improves soil surface particle cohesion, increases the content of soil aggregates >0.25 mm, improves soil stomatal structure and permeability, and inhibits the formation of soil crust [39], but also allows salts to percolate downwards and improves the water-holding capacity of the soil, reducing the salinity of the 0–40 cm soil layer. Liu [40] and Huang [29] discovered that humic acid can increase soil macroaggregates and reduce salinity in the soil tillage layer, which is consistent with the results of our experiment.
Humic acid lowered soil pH while increasing soil salinity [41,42,43], and the soil EC of organic fertilizer with humic acid slightly increased. Meanwhile, the pH of the treatment declined in the present study; a similar effect was observed in the previous study. However, when implemented together with biological fertilizer, the effect on EC and pH was affected, reducing the conductivity while regulating pH.

4.2. Effect of Different Fertilizer Application Measures on Soil Organic Matter

Soil organic matter is an important component and indicator of soil fertility [44]. Studies have shown that adding humic acid to salt-affected soils can significantly reduce salt stress and improve plant growth by improving nutrient availability and water retention, enhancing soil structure, and increasing microbial bioactivity [45,46]. Additionally, because humic acid is an important component of soil organic matter, the addition of humic acid in this study significantly increased the organic matter content of the soil. The use of attapulgite clay and organic fertilizer, on the other hand, can help to manage and improve the level of nutrients in the soil. Although attapulgite clay has not been proven to increase soil organic matter, organic fertilizer compounded with attapulgite clay increased soil organic matter significantly in this study, and I believe that attapulgite clay can accelerate the release of nutrients from organic fertilizer and fix nutrients in the soil, enhancing organic matter in the soil after ryegrass harvesting and alfalfa planting. Biofertilizer has also been shown to improve soil nutrients and increase soil organic matter [47,48], but the effect was less pronounced in this study—likely due to an antagonistic effect between biofertilizer and humic acid—and the two could not increase the soil organic matter when used together.

4.3. Effect of Different Fertilization Measures on Soil Total Nitrogen Content

Total soil nitrogen is another significant nutritional indicator. It has been demonstrated that humic acid increases total soil nitrogen [42], which is in agreement with our findings. Attapulgite clay treatment enhanced total soil N, and its application with organic material boosted total soil N considerably. The use of attapulgite clay increased soil agglomeration and created a protective coating, reducing the contact between the soil surface and air and, subsequently, reducing N loss [49]. I believe this to be the main contributor to the increase in total N content of the soil caused by the application of organic fertilizer that includes attapulgite clay. Organic fertilizer combined with microbial fertilizer and humic acid boosted total soil N in this experiment. Ma [50] found that biofertilizers had no discernible effect on total soil N, whereas some studies [44,45] found that biofertilizers could boost soil nutrients. I believe that biofertilizer with humic acid hastened the breakdown of organic matter, which increased soil nutrients and the overall soil N content; this concurs with the results of this study.

5. Conclusions

This experiment demonstrated that organic fertilizer and other techniques may reduce the salinity of coastal saline soils, but they were still dependent on precipitation. Thus, composite measures effectively improved coastal saline soil due to the abundant precipitation in the coastal region of the Jiangsu Province. The study has shown that organic fertilizer containing attapulgite clay can reduce the salinity of coastal saline soil, increase soil nutrients, and control soil pH. Humic acid and microbial fertilizer implementation, together with organic fertilizer, can enhance soil total nitrogen and organic matter while lowering soil salinity and controlling the pH of the soil surface layer. In conclusion, the suggested compound measures of NA and NFE can regulate the salinity and pH of coastal saline soil while also improving soil fertility in the coastal saline soil. To deepen our understanding of the interaction between microbial fertilizers and humic acids, the processes by which humic acids affect the microorganisms in the fertilizers and the microorganisms in the soil are in need of further investigation. The current experiment was conducted over a one-year period, which is insufficient time to fully determine the influence of different organic fertilizer blending procedures on soil salinity and nutrients in land areas, and there are some limitations. This study was technical, lacked research on mechanisms, and did not consider nitrogen loss from saline soils. Future research will focus on nitrogen leaching and effective nitrogen use from saline soils, as well as on the mechanisms of the effects of fertilization measures on salinity and nutrients in saline soils.

Author Contributions

Conceptualization, W.X.; Methodology, J.Y., R.Y. and X.W.; Investigation, W.X., J.Y., R.Y. and W.L.; Writing—original draft, J.L.; Writing—review & editing, W.X. All authors have read and agreed to the published version of the manuscript.

Funding

This work was financially supported by the National Key Research and Development Program of China [2022YFD1900103].

Data Availability Statement

The data presented in this study are available on request from the corresponding author. The data are not publicly available due to management requirements for data management of project sponsors.

Acknowledgments

The authors would like to acknowledge the financial support of the National Key Research and Development Program of China [2022YFD1900103]. Thanks to the website: https://www.tianqi24.com/dafeng/history2020.html (accessed on 12 September 2023) and https://www.tianqi24.com/dafeng/history2021.html (accessed on 12 September 2023) for the precipitation and temperature data.

Conflicts of Interest

The authors declare no conflict of interest.

References

  1. Hopmans, J.W.; Qureshi, A.S.; Kisekka, I.; Munns, R.; Taleisnik, E. Critical knowledge gaps and research priorities in global soil salinity. Adv. Agron. 2021, 169, 1–191. [Google Scholar]
  2. Hassani, A.; Azapagic, A.; Shokri, N. Predicting long-term dynamics of soil salinity and sodicity on a global scale. Proc. Natl. Acad. Sci. USA 2020, 117, 33017–33027. [Google Scholar] [CrossRef] [PubMed]
  3. Zhang, Z.Y.; Jilili, A.; Hamid, Y. The Occurrence, Sources and Spatial Characteristics of Soil Salt and Assessment of Soil Salinization Risk in Yanqi Basin, Northwest China. PLoS ONE 2014, 9, e106079. [Google Scholar] [CrossRef] [PubMed]
  4. Hasegawa, P.M.; Bressan, R.A.; Zhu, J.K.; Bohnert, H.J. Plant cellular and molecular responses to high salinity. ann rev plant physiol plant mol biol. Annu. Rev. Plant Biol. 2020, 51, 463–499. [Google Scholar]
  5. Karimi, G.; Ghorbanli, M.; Heidari, H.; Nejad, R.A.K.; Assareh, M.H. The effects of nacl on growth, water relations, osmolytes and ion content in Kochia prostrata. Biol. Plantarum. 2005, 49, 301–304. [Google Scholar] [CrossRef]
  6. Murat, A.H.A.; Hassan, A.; Elkarim, A.; Taban, S. Effect of salt stress on growth and ion distribution and accumulation in shoot and root of maize plant. Afr. J. Agric. Res. 2010, 5, 584–588. [Google Scholar]
  7. Yang, J.S.; Yao, R.J.; Wang, X.P.; Xie, W.P.; Zhang, X.; Zhu, W.; Zhang, L.; Sun, R.J. Research on Salt-affected Soils in China: History, Status Quo and Prospect. Acta Pedol. Sin. 2022, 59, 10–27. [Google Scholar]
  8. Chen, T.; Zhang, Y.; Fu, J.; Yang, L.; Chi, Y.X.; Yang, K.J.; Wang, Y.F. Effects of tillage methods on soil physical properties and maize growth in a saline–alkali soil. Crop Sci. 2021, 5, 3702–3718. [Google Scholar] [CrossRef]
  9. Chen, G.; Wei, Z.M.; Liu, H. Study on Soil Desalination Process of Saline-Alkaline Grassland along the Yellow River in Western Inner Mongolia under Subsurface Drainage. Sustainability 2022, 21, 14494. [Google Scholar] [CrossRef]
  10. Mao, Y.M.; Li, X.P. Desalting effect of flue gas desulfurization gypsum (FGDG) on coastal saline-sodic soil with different textures. J. Soils Sediments 2022, 2, 765–776. [Google Scholar] [CrossRef]
  11. Day, S.J.; Norton, J.B.; Strom, C.F.; Kelleners, T.J.; Aboukila, E.F. Gypsum, langbeinite, sulfur, and compost for reclamation of drastically disturbed calcareous saline–sodic soils. Int. J. Environ. Sci. Technol. 2019, 16, 295–304. [Google Scholar] [CrossRef]
  12. Singh, Y.P.; Arora, S.; Mishra, V.K.; Singh, A. Composting of Municipal Solid Waste Using Earthworms and Ligno-Cellulolytic Microbial Consortia for Reclamation of the Degraded Sodic Soils and Harnessing Their Productivity Potential. Sustainability 2023, 3, 2317. [Google Scholar] [CrossRef]
  13. Ravindran, K.C.; Venkatesan, K.; Balakrishnan, V.; Chellappan, K.P.; Balasubramanian, T. Restoration of saline land by halophytes for Indian soils. Soil Biol. Biochem. 2007, 39, 2661–2664. [Google Scholar] [CrossRef]
  14. Munns, R.; James, R.A.; Xu, B.; Athman, A.; Conn, S.J.; Jordans, C.; Byrt, C.S.; Hare, R.A.; Tyerman, S.D.; Tester, M.; et al. Wheat grain yield on saline soils is improved by an ancestral Na⁺ transporter gene. Nat. Biotechnol. 2012, 4, 360–364. [Google Scholar] [CrossRef] [PubMed]
  15. Liu, F.J.; Hu, W.Y.; Li, Q.Y. Phytosynthetic bacteria (PSB) as awater quality improvement mechanism in sa line-alkali wetland ponds. J. Environ. Sci. 2002, 14, 339–344. [Google Scholar]
  16. Mohanavelu, A.; Naganna, S.R.; Al-Ansari, N. Irrigation Induced Salinity and Sodicity Hazards on Soil and Groundwater: An Overview of Its Causes, Impacts and Mitigation Strategies. Agriculture 2021, 11, 983. [Google Scholar] [CrossRef]
  17. Wu, Y.; Li, Y.; Zheng, C.; Zhang, Y.; Sun, Z. Organic amendment application influence soil organism abundance in saline alkali soil. Eur. J. Soil Biol. 2013, 54, 32–40. [Google Scholar] [CrossRef]
  18. Xiao, M.; Liu, G.; Jiang, S.; Guan, X.; Chen, J.; Yao, R.; Wang, X. Bio-Organic Fertilizer Combined with Different Amendments Improves Nutrient Enhancement and Salt Leaching in Saline Soil: A Soil Column Experiment. Water 2022, 14, 4084. [Google Scholar] [CrossRef]
  19. Miranda, M.F.A.; Freire, M.B.G.D.; De Almeida, B.G.; Freire, F.J.; Pessoa, L.G.M.; Freire, A.G. Phyto-desalination and chemical and organic conditioners to recover the chemical properties of saline-sodic soil. Soil Sci. Soc. Am. J. 2020, 85, 132–145. [Google Scholar] [CrossRef]
  20. Githinji, L.J.M. Effect of biochar application rate on soil physical and hydraulic properties of a sandy loam. Arch. Agron. Soil Sci. 2014, 60, 457–470. [Google Scholar] [CrossRef]
  21. Li, Y.; Wang, Z.; Xie, X.; Zhu, J.; Li, R.; Qin, T. Removal of Norfloxacin from aqueous solution by clay-biochar composite prepared from potato stem and natural attapulgite. Colloids Surf. A Physicochem. Eng. Asp. 2017, 514, 126–136. [Google Scholar] [CrossRef]
  22. Xu, C.; Qi, J.; Yang, W.; Chen, Y.; Yang, C.; He, Y.; Wang, J.; Lin, A. Immobilization of heavy metals in vegetable-growing soils using nano zero-valent iron modified attapulgite clay. Sci. Total Environ. 2019, 686, 476–483. [Google Scholar] [CrossRef] [PubMed]
  23. Xie, L.; Liu, M.; Ni, B.; Zhang, X.; Wang, Y. Slow-release nitrogen and boron fertilizer from a functional superabsorbent formulation based on wheat straw and attapulgite. Chem. Eng. J. 2011, 167, 342–348. [Google Scholar] [CrossRef]
  24. Sun, Z.; Ge, J.; Li, C.; Wang, Y.; Zhang, F.; Lei, X. Enhanced improvement of soda saline-alkali soil by in-situ formation of super-stable mineralization structure based on cafe layered double hydroxide and its large-scale application. Chemosphere. 2022, 300, 134543. [Google Scholar] [CrossRef]
  25. Kebede, B.; Tsunekawa, A.; Haregeweyn, N.; Tsubo, M.; Mulualem, T.; Mamedov, A.I.; Meshesha, D.T.; Adgo, E.; Fenta, A.A.; Ebabu, K.; et al. Effect of polyacrylamide integrated with other soil amendments on runoff and soil loss: Case study from northwest ethiopia. Int. Soil Water Conserv. Res. 2022, 10, 487–496. [Google Scholar] [CrossRef]
  26. Pavlovich, L.B.; Strakhov, V.M. Effect of humic fertilizers from brown coal on the mineral composition of vegetable crops. Solid Fuel Chem. 2018, 52, 206–210. [Google Scholar] [CrossRef]
  27. Liu, X.Y.; Yang, J.S.; Tao, J.Y.; Yao, R.J. Integrated application of inorganic fertilizer with fulvic acid for improving soil nutrient supply and nutrient use efficiency of winter wheat in a salt-affected soil. Appl. Soil Ecol. 2022, 170, 104255. [Google Scholar] [CrossRef]
  28. Pulatov, A.; Amanturdiev, S.; Nazarov, K.; Adilov, M.; Khaitov, B. Effect of biofertilizers on growth and yield of cotton in different soil conditions. Cotton Genom. Genet. 2016, 7, 1925–1947. [Google Scholar] [CrossRef]
  29. Huang, R. The effect of humic acid on the desalinization of coastal clayey saline soil. Water Supply 2022, 22, 7242–7255. [Google Scholar] [CrossRef]
  30. Abulaiti, A.; She, D.L.; Liu, Z.P.; Sun, X.Q.; Wang, H.D. Application of biochar and polyacrylamide to revitalize coastal saline soil quality to improve rice growth. Environ. Sci. Pollut. Res. Int. 2022, 30, 18731–18747. [Google Scholar] [CrossRef]
  31. Xie, X.; Pu, L.; Shen, H.; Wang, X.; Zhu, M.; Ge, Y.; Sun, L. Effects of soil reclamation on the oat cultivation in the newly reclaimed coastal land, eastern China. Ecol. Eng. 2019, 129, 115–122. [Google Scholar] [CrossRef]
  32. McLeod, S. Determination of total soil and plant nitrogen using a micro-distillation unit in a continuous flow analyzer. Anal. Chim. Acta 1992, 266, 113–117. [Google Scholar] [CrossRef]
  33. Sun, Y.; Chen, X.; Yang, J.; Luo, Y.; Yao, R.; Wang, X.; Zhang, X. Coastal Soil Salinity Amelioration and Crop Yield Improvement by Biomaterial Addition in East China. Water 2022, 20, 3266. [Google Scholar] [CrossRef]
  34. Chen, W.P.; Hou, Z.A.; Wu, L.S.; Liang, Y.C.; Wei, C.Z. Effects of salinity and nitrogen on cotton growth in arid environment. Plant Soil. 2010, 326, 61–73. [Google Scholar] [CrossRef]
  35. Bello, S.K.; Alayafi, A.H.; AL-Solaimani, S.G.; Abo-Elyousr, K.A.M. Mitigating Soil Salinity Stress with Gypsum and Bio-Organic Amendments: A Review. Agronomy 2021, 11, 1735. [Google Scholar] [CrossRef]
  36. Zhou, M.; Liu, X.; Meng, Q. Additional application of aluminum sulfate with different fertilizers ameliorates saline-sodic soil of Songnen Plain in Northeast China. J. Soils Sediments 2019, 19, 3521–3533. [Google Scholar] [CrossRef]
  37. Li, J.; Xu, Y.; Liu, H. Variations of soil quality from continuously planting greenhouses in North China. Int. J. Agric. Biol. Eng. 2019, 12, 139–145. [Google Scholar] [CrossRef]
  38. Zhao, T.W.; Li, H.D.; Zhou, W.; Dai, Y.C.; Lu, J.L. Effects of attapulgite application on soil nutrients in Cd-contaminated farmland. J. Agro-Environ. Sci. 2019, 38, 2313–2318. [Google Scholar]
  39. Santos, F.L.; Serralheiro, R.P. Improving infiltration of irrigated mediterranean soils with polyacrylamide. J. Agric. Eng. Res. 2000, 76, 83–90. [Google Scholar] [CrossRef]
  40. Liu, M.; Wang, C.; Wang, F.; Xie, Y. Maize (Zea mays) growth and nutrient uptake following integrated improvement of vermicompost and humic acid fertilizer on coastal saline soil. Appl. Soil Ecol. 2019, 142, 147–154. [Google Scholar] [CrossRef]
  41. Rekaby, S.A.; Al-Huqail, A.A.; Gebreel, M.; Alotaibi, S.S.; Ghoneim, A.M. Compost and humic acid mitigate the salinity stress on quinoa (Chenopodium quinoa Willd L.) and improve some sandy soil properties. J. Soil Sci. Plant Nutr. 2023, 23, 2651–2661. [Google Scholar] [CrossRef]
  42. Wandansari, R.N.; Kurniawan, S.; Suntari, R.; Soemarno. Improving Soil Fertility and Maize Growth in Suboptimal Land Through Application of Humic Acid. Int. J. Des. Nat. Ecodynamics 2022, 17, 679–690. [Google Scholar] [CrossRef]
  43. Li, Z.F.; Huang, B.Z.; Ma, Y.; Sun, Z.J. Improvement Effects of Different Environmental Materials on Coastal Saline-Alkali Soil in Yellow River Delta. Mater. Sci. Forum 2018, 4740, 879–886. [Google Scholar] [CrossRef]
  44. Zhang, Y.; Pang, X.Y.; Bao, W.K.; You, C.; Tang, H.R.; Hu, T.X. A review of soil organic matter and its research methods. World Sci-Tech R D 2005, 27, 72–78. [Google Scholar]
  45. Liu, X.; Zhang, L. The effectiveness of composted green waste amended with vermiculite and humic acid powders as an alternative cultivation substrate for cornflower cultivation. Commun. Soil Sci. Plant Anal. 2021, 52, 2945–2957. [Google Scholar] [CrossRef]
  46. Feng, X.; Zhang, L. Vermiculite and humic acid improve the quality of green waste compost as a growth medium for Centaurea cyanus L. Environ. Technol. Innov. 2021, 24, 101945. [Google Scholar] [CrossRef]
  47. Dębska, B.; Długosz, J.; Piotrowska-Długosz, A.; Banach-Szott, M. The impact of a bio-fertilizer on the soil organic matter status and carbon sequestration—Results from a field-scale study. J. Soils Sediments 2016, 16, 2335–2343. [Google Scholar] [CrossRef]
  48. Aseri, G.K.; Jain, N.; Rao, A.V.; Meghwal, P.R. Biofertilizers improve plant growth, fruit yield, nutrition, metabolism and rhizosphere enzyme activities of pomegranate (Punica granatum L.) in indian thar desert. Sci. Hortic. 2008, 117, 130–135. [Google Scholar] [CrossRef]
  49. Yang, S.; Li, C.; Xu, C.; Wu, D.; Wang, J.; Zhang, Y.; Ai, Y.; Li, H. Effects of Adding Straw and Attapulgite on Soil Structure and Carbon and Nitrogen Contents of Old Yellow River Course. Bull. Soil Water Conserv. 2020, 40, 199–204. [Google Scholar]
  50. Ma, H.; Chen, B.; Yang, T.; Cheng, Z.; Niu, X.; Ma, X. Effects of Different Fertilization on the Growth and Soil Nutrient of Fritillaria pallidiflora Schrek. Xinjiang Agric. Sci. 2017, 54, 281–288. [Google Scholar]
Figure 1. Overview map of the study area.
Water 15 03274 g001
Figure 2. Monthly precipitation and average temperature in Dafeng.
Water 15 03274 g002
Figure 3. Effect of organic fertilizer compound treatments on EC in the 0–20 cm soil layer. Error bars indicate one standard deviation from the mean.
Water 15 03274 g003
Figure 4. Effect of organic fertilizer complex treatments on EC in the 20–40 cm soil layer. Error bars indicate one standard deviation from the mean.
Water 15 03274 g004
Figure 5. Effect of organic fertilizer compound treatment on EC in the 0–100 cm soil layer. Error bars indicate one standard deviation from the mean.
Water 15 03274 g005
Figure 6. Effect of organic fertilizer compound treatment on pH in the 0–100 cm soil layer. Error lines indicate one standard deviation from the mean.
Water 15 03274 g006
Figure 7. Effect of organic fertilizer compound treatments on soil water content of the 0–20 cm soil layer. Error bars indicate one standard deviation from the mean. Notes: The different colors represent various groups. Different letters of the same color indicate significant differences between treatments (p < 0.05).
Water 15 03274 g007
Figure 8. Effect of organic fertilizer compound treatments on the organic matter content of the 0–20 cm soil layer. Error bars indicate one standard deviation from the mean. Notes: The different colors represent various groups. Different letters of the same color indicate significant differences between treatments (p < 0.05).
Water 15 03274 g008
Figure 9. Effect of organic fertilizer complex treatments on the total nitrogen content of the 0–20 cm soil layer. Error bars indicate one standard deviation from the mean. Notes: the different colors represent various groups. Different letters of the same color indicate significant differences between treatments (p < 0.05).
Water 15 03274 g009
Table 1. Basic properties of the original topsoil (0–20 cm) used for the experiment.
pHEC (µS/cm)SOM (%)TN (g/kg)
CK8.54844.400.630.50
CK08.46567.030.590.37
N8.431037.330.640.38
NA8.291166.000.680.57
NF8.21898.770.730.52
NP8.44774.531.050.58
NFE8.43861.630.790.64
Notes: EC—electrical conductivity; SOM—organic matter content; TN—total nitrogen. CK, CK0, N, NA, NF, NP, NFE are the different treatment labels, representing the no fertilizer treatments, conventional fertilizer, organic fertilizer, organic fertilizer + attapulgite clay treatment, organic fertilizer + humic acid treatment, organic fertilizer + PAM treatment, organic fertilizer + humic acid + ETS biofertilizer treatment.
Table 2. Effect of different organic fertilizer compound treatments on soil pH in the 0–20 cm soil layer.
Sampling Date
TreatmentNovember 2020December 2020January 2021April 2021May 2021June 2021August 2021September 2021October 2021November 2021
CK8.54 ± 0.06 a8.85 ± 0.08 a8.95 ± 0.02 a9.42 ± 0.04 a8.83 ± 0.02 a9.15 ± 0.05 a9.28 ± 0.03 b8.96 ± 0.01 b9.39 ± 0.02 a8.64 ± 0.03 a
CK08.46 ± 002 b8.68 ± 0.08 b8.39 ± 0.05 c8.6 ± 0.04 c8.66 ± 0.04 bc8.54 ± 0.05 c9.37 ± 0.02 a8.85 ± 0.04 c9.38 ± 0.04 a8.65 ± 0.03 a
N8.43 ± 0.04 b8.37 ± 0.05 d8.73 ± 0.02 b8.83 ± 0.03 b8.57 ± 0.11 cd8.85 ± 0.05 b9.05 ± 0.05 d8.72 ± 0.03 d9.42 ± 0.04 a8.52 ± 0.07 b
NA8.29 ± 0.08 c8.15 ± 0.03 e8.32 ± 0.04 d8.52 ± 0.02 c8.40 ± 0.02 e8.56 ± 0.03 c9.10 ± 0.02 c8.98 ± 0.03 b9.15 ± 0.03 b8.61 ± 0.02 a
NF8.21 ± 0.04 c8.55 ± 0.01 c8.25 ± 0.02 e8.28 ± 0.02 d8.71 ± 0.03 b8.86 ± 0.03 b8.67 ± 0.01 e8.65 ± 0.02 e9.38 ± 0.05 a8.47 ± 0.02 b
NP8.44 ± 0.02 b8.06 ± 0.03 e8.16 ± 0.02 f8.29 ± 0.02 d8.55 ± 0.04 d8.51 ± 0.04 c9.38 ± 0.01 a9.05 ± 0.02 a9.21 ± 0.04 b8.46 ± 0.04 b
NFE8.43 ± 0.04 b8.14 ± 0.05 e8.27 ± 0.04 de8.57 ± 0.11 c7.99 ± 0.07 f8.86 ± 0.02 b9.07 ± 0.02 cd8.83 ± 0.02 c9.00 ± 0.04 c8.52 ± 0.03 b
Note: Different letters in the same column indicate significant differences between the two groups (p < 0.05).
Table 3. Effect of different organic fertilizer compound treatments on soil pH in the 20–40 cm soil layer.
Sampling Date
TreatmentNovember 2020December 2020January 2021April 2021May 2021June 2021August 2021September 2021October 2021November 2021
CK9.32 ± 0.03 a8.37 ± 0.03 b8.64 ± 0.05 a9.17 ± 0.04 a8.88 ± 0.02 a8.72 ± 0.01 a9.26 ± 0.02 a9.57 ± 0.06 a9.14 ± 0.03 bc9.27 ± 0.01 a
CK08.94 ± 0.02 b8.50 ± 0.04 a8.29 ± 0.01 cd8.23 ± 0.04 e8.68 ± 0.03 b8.53 ± 0.05 b9.29 ± 0.04 a9.28 ± 0.03 b9.18 ± 0.02 b9.07 ± 0.05 b
N8.45 ± 0.04 d8.23 ± 0.01 c8.25 ± 0.02 de8.74 ± 0.03 b8.33 ± 0.06 f8.73 ± 0.05 a8.21 ± 0.04 c8.74 ± 0.03 e8.94 ± 0.02 d9.08 ± 0.01 b
NA8.39 ± 0.04 e7.96 ± 0.03 e8.47 ± 0.03 b8.54 ± 0.03 c8.56 ± 0.01 c8.43 ± 0.03 c9.16 ± 0.02 b9.23 ± 0.04 b9.36 ± 0.07 a8.92 ± 0.07 c
NF8.41 ± 0.04 de8.16 ± 0.02 d8.21 ± 0.04 e8.05 ± 0.01 f8.41 ± 0.03 de8.45 ± 0.06 c9.17 ± 0.05 b8.75 ± 0.04 e9.09 ± 0.05 c9.11 ± 0.0 b
NP8.36 ± 0.03 e8.16 ± 0.03 d8.35 ± 0.04 c8.43 ± 0.03 d8.35 ± 0.02 ef8.25 ± 0.05 d9.11 ± 0.01 b8.95 ± 0.02 d8.74 ± 0.02 e8.74 ± 0.03 d
NFE8.70 ± 0.04 c8.13 ± 0.03 d8.32 ± 0.02 c8.45 ± 0.05 d8.44 ± 0.04 d8.44 ± 0.03 c9.15 ± 0.04 b9.15 ± 0.03 c9.09 ± 0.04 c9.04 ± 0.05 b
Note: Different letters in the same column indicate significant differences between the two groups (p < 0.05).
Disclaimer/Publisher’s Note: The statements, opinions and data contained in all publications are solely those of the individual author(s) and contributor(s) and not of MDPI and/or the editor(s). MDPI and/or the editor(s) disclaim responsibility for any injury to people or property resulting from any ideas, methods, instructions or products referred to in the content.

