

Prediction of the Soil–Water Retention Curve of Loess Using the Pore Data from the Mercury Intrusion Technique

1
Key Laboratory of Shale Gas and Geoengineering, Institute of Geology and Geophysics, Chinese Academy of Sciences, Beijing 100029, China
2
Innovation Academy for Earth Science, Chinese Academy of Sciences, Beijing 100029, China
3
College of Earth and Planetary Sciences, University of Chinese Academy of Sciences, Beijing 100029, China
Water 2023, 15(18), 3273; https://doi.org/10.3390/w15183273
Submission received: 31 July 2023
/
Revised: 9 September 2023
/
Accepted: 12 September 2023
/
Published: 15 September 2023
(This article belongs to the Special Issue Research on Soil Moisture and Irrigation)
Abstract
:The soil–water characteristic curve (SWCC) is a crucial input parameter for describing the distribution of soil moisture and water movement in various environmental and geotechnical challenges. It is widely recognized that the SWCC is controlled by the soil’s pore structure. Attempts to estimate the SWCC using pore data obtained through the mercury intrusion porosity (MIP) technique have been conducted. However, the performance of MIP estimation remains uncertain and requires further validation with experimental data. In this study, the accuracy of MIP estimation is validated using intact and compacted loess samples prepared at different water contents, specifically dry of optimum (8%), optimum (17%), and wet of optimum (19%). The results reveal that intact and dry of optimum specimens exhibit relatively good pore connectivity, with more point-to-point contacts between particles. Conversely, specimens compacted under optimum and wet of optimum conditions exhibit poor pore connectivity, with more isolated pores, particularly in the wet-of-optimum specimen. The SWCC predictions based on MIP data are accurate for intact and dry-of-optimum compacted specimens, but significant errors occur for the optimum and wet-of-optimum specimens. Prediction accuracy using MIP data is closely linked to the soil’s pore connectivity. Despite a tenuous theoretical basis in the high suction range where adsorption forces dominate, a strong consistency between predictions and measured data across a wide suction range (e.g., 10–104 kPa) instills a high level of confidence in using MIP data to predict the wetting SWCC. The contact angle required for the prediction is suggested as a fitting parameter.
1. Introduction
The soil–water characteristic curve (SWCC), which illustrates the relationship between water content (or degree of saturation) and matric suction in partially saturated soils, fundamentally represents the hydraulic properties of unsaturated soil. It serves as a critical input parameter for describing the distribution of soil moisture and water movement in diverse environmental and geotechnical applications [1,2], including resource assessment [3], engineering construction [4], waste containment systems [5], capillary barriers [6,7], and nuclear waste treatment [8].
Numerous studies have been conducted to investigate the SWCC using various techniques and instruments [9,10,11]. These techniques encompass the axis translation method (0–1500 kPa), tensiometer (0–500 kPa), filter paper (0–106 kPa), psychrometers (100–8000 kPa), and vapor equilibrium technique (104–106 kPa). Several factors influence the SWCC, including soil type [12], density [2,13], stress state [14], soil structure [15,16], and the drying or wetting path [17]. Notably, soil structure, especially the pore size distribution curve (PSD), governs the water retention behavior of soil [4,16]. Widely used SWCC functions, such as the van Genuchten function [18] and the Fredlund and Xing function [19], are derived based on this premise. Over the past two decades, numerous researchers have focused on predicting hydraulic properties [2,18,19] and unsaturated strength [20,21,22] using the SWCC as a tool. These studies leverage the assumption that the SWCC provides valuable information about soil structure. Recently, some studies have proposed predicting the SWCC using pore data obtained from the MIP method [10,11,16,23,24,25,26]. In this context, the mercury intrusion process is assumed to resemble the air intrusion process of saturated soil during drying. Therefore, the void ratio occupied by water equals the difference between the total void ratio and the mercury-intruded void ratio [10,16]. Most predictions are compared with the drying SWCC [10,16,24]. Theoretically, the PSD performs better for the drying SWCC curve compared to the wetting SWCC. However, data from Romero et al. [23] demonstrate that the predicted values are much closer to the wetting SWCC than to the drying curve. Additionally, Zhang and Li [25] noted that mercury intrusion porosity is only suitable for a limited range of pore sizes and performs better for fine-grained soils than coarse-grained ones. It is worth mentioning that these predictions assume that the soil is a completely hydrophilic material and do not account for the influence of the contact angle (CA) on the SWCC. Experimental data indicates that even for hydrophilic soils, the CA is greater than zero [27], and it significantly affects the SWCC [28]. Li et al. [29] considered the CA as a fitting parameter and found consistency between the measured data and the MIP prediction when the wetting CA was 70° and the drying CA was 60°. However, this study was only conducted on intact loess from two specific locations. Furthermore, it is acknowledged that the SWCC is primarily influenced by the adsorption force rather than the capillarity. Nevertheless, since the MIP is based on the Yong–Laplace equation derived from capillary theory, predictions in the high suction range may be inaccurate. The performance of predicting the SWCC using the pore size distribution curve obtained from the MIP requires extensive validation with a substantial amount of data.
This paper investigates the performance of MIP pore data in predicting the SWCC of intact and compacted loess. It is widely recognized that the compaction water content has a significant impact on soil microstructure and soil–water retention behavior [14,30]. In this study, three representative compaction water contents (i.e., 8%, 17%, and 19%), corresponding to dry of optimum, optimum, and wet of optimum conditions, respectively, were selected. Additionally, intact loess and specimens compacted at the dry of optimum water content to achieve the same dry density as intact loess were also prepared. The soil–water characteristics of these specimens were determined using the filter paper method. Pore size distribution data were obtained through the mercury intrusion porosity method. Scanning electron microscopy was also employed to investigate microstructural characteristics.
2. Prediction Method
The MIP method relies on mercury’s non-wetting property due to its high surface tension. To infiltrate the pores, external pressure must be applied, and this pressure is inversely proportional to the size of the pores, as shown in Equation (1).
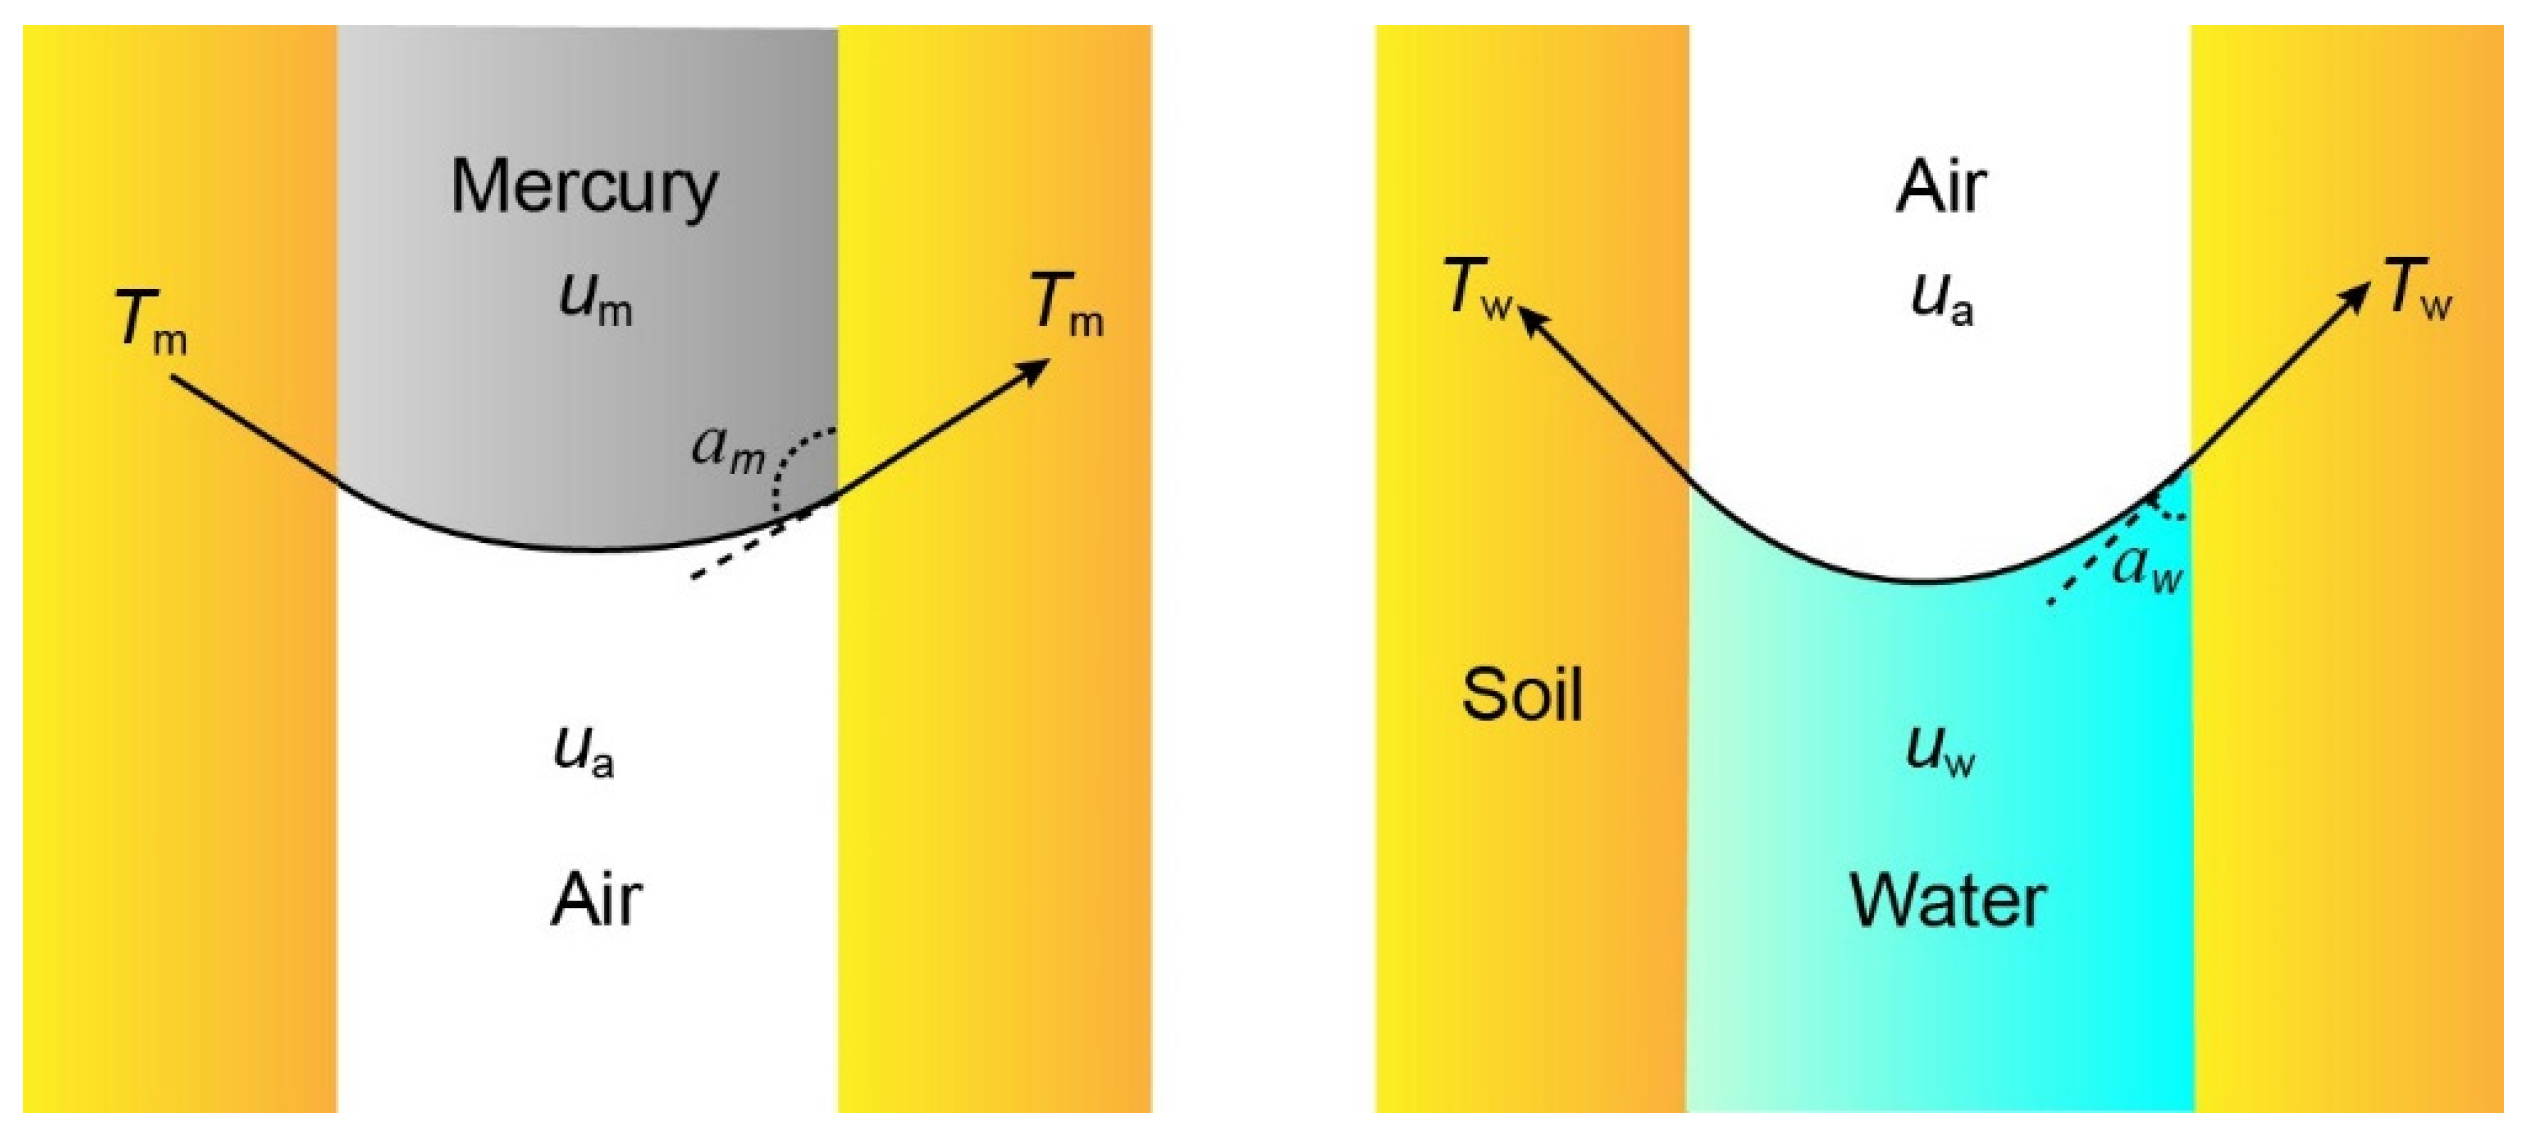
where P is the intrusion pressure in the mercury intrusion experiment; Tm is the surface tension of mercury, with a value of 485 × 10−3 N/m at a temperature of 20 °C; am is the contact angle at the air–mercury–soil interface and is 130°; and d is the equivalent pore diameter at a specific intrusion pressure P.
According to the Yong–Laplace equation, the relationship between suction and water–air interfacial tension is established as Equation (2)
where ua is the air pressure; uw is the pore water pressure; ψ is the matric suction; and Tw is the water–air interfacial tension with a value of 72.72 × 10⁻³ N/m at 20 °C; aw is the contact angle at the air–water–soil interface, ranging from 0 to 90°; and d is the equivalent pore diameter corresponding to a certain matric suction.
Figure 1 illustrates a schematic representation of the mercury and water in the soil. Mercury and water intrude into the pores in opposite manners. Under the influence of external pressure, mercury is more likely to infiltrate large pores, whereas during the wetting process, water predominantly occupies small pores. The spaces occupied by water and mercury complement each other. The volume of water intrusion, denoted as Vw and associated with a specific pore size, can be calculated by subtracting the volume of mercury intrusion (Vm) from the total pore volume (V). Therefore, the soil’s mass moisture content can be determined using Equation (3).
θw represents the volumetric water content; Vw is the volume of water; Vm is the volume of mercury intrusion at a certain pore size; V is the total pore volume; n is the porosity; which can be calculated from the soil bulk density; and Vt is the sum of the volume of soil particles and pore volume.
Vm and Vt can be obtained through the MIP test. The SWCC can be derived by combining Equations (1)–(3).
It is important to mention that the contact angle CA (aw) is treated as a fitting parameter in this study to achieve the best-fitting results. The CA at the air–water–soil interface is closely related to factors such as the mineral composition of the soil, properties of the liquid and gas phases, and temperature [31]. Existing measurement methods for CA have demonstrated significant discrepancies [32].
Additionally, it is worth noting that Equation (3) is suitable for predicting the wetting SWCC. Since the mercury intrusion process is assumed to be similar to the air intrusion process of saturated soil during drying, the cumulative mercury intrusion curve can be easily transformed into the drying SWCC using the Laplace equation, as various researchers have previously demonstrated [10,24].
3. Experiments
3.1. Soil Type and Sample Preparation
A well was excavated to obtain intact samples in the Heifangtai loess highland, Gansu Province, China. To preserve the in situ water content, and avoid disrupting the soil structure during transportation, the samples were carefully wrapped in plastic film and placed in wooden containers filled with sawdust. Additionally, approximately 40 kg of disturbed loess soil was collected and transported to the laboratory for the measurement of basic properties and the preparation of compacted samples used in the SWCC, MIP, and SEM tests.
The basic properties of the loess are as follows: (i) the silt fraction (0.002–0.05 mm) accounts for 75% of the total material (as shown in Figure 2); (ii) the clay particles (<0.002 mm) make up only 5.6%; (iii) the plastic index (Ip) is 10, with a liquid limit of 17% and a plastic limit of 27%. Furthermore, a standard compaction test was conducted following ASTM protocols, and the results are presented in Figure 3. The optimum water content and maximum dry density are 17.1% and 1.71 g/cm3, respectively.
Since the pore structure of compacted soil samples varies with changes in compaction water content, we have identified three distinct water content levels to characterize the dry, optimum, and wet conditions. Specifically, 8% was chosen to represent the dry condition of optimum compaction, aligning with the natural soil–water content of 8%. In contrast, 19% was selected to depict the wet condition of optimum compaction, considering the greater difficulty encountered when compacting samples with higher water content.
In total, we meticulously prepared five distinct sample types for conducting the SWCC, MIP, and SEM tests, as outlined in Table 1. These samples are denoted as I135, D135, D157, O171, and W167. They have the same composition but different dry densities. I135 represents the intact sample obtained directly from the field. D135 and D157 are compacted at the same water content of 8%, but to different dry densities of 1.35 g/cm3 and 1.57 g/cm3, respectively, in the laboratory. O171 is compacted at the optimum water content of 17% to a dry density of 1.71 g/cm3. W167 is compacted at the wet of optimum water content, 19%, to a dry density of 1.67 g/cm3.
3.2. Soil–Water Retention Curve Measurement
The cost-effective, simple, and reasonably accurate filter paper method, initially developed by Gardner [33], has been employed for SWCC measurement. This method can quantify both matric suction and total suction [34]. When the filter paper contacts the soil, water migrates from the soil to the filter paper until it reaches equilibrium. Under such conditions, the suction of the filter paper equals the suction of the soil specimen. Although the accuracy of the filter paper method has been debated [35], several studies have demonstrated its reliability by increasing the dataset [36,37]. Furthermore, this technique has proven suitable for measuring both high suction values [34] and low suction values, such as those falling within the range of 20–300 kPa [38].
In the present study, the wetting SWCC of compacted loess was investigated using Whatman No. 42 filter paper, which was placed in contact with the soil. To establish the necessary protocols, preliminary tests were conducted to determine the equilibration time and to adopt procedures following ASTM Standard D5298-10 [39]. The compacted soil specimens were initially oven-dried for 48 h to remove moisture. Subsequently, carefully spraying water onto the specimens achieved the targeted water content values ranging from 2% to 19%, resulting in a range of saturation degrees from approximately 7% to 90%.
To determine the soil–water characteristics (SWCC), a precise experimental setup was utilized as follows: Three circular pieces of filter paper were employed, with the suction measuring filter paper (Whatman No. 42) placed between two identical soil specimens. The diameter of the suction-measuring filter paper was intentionally slightly smaller than that of the other filter papers, ensuring it remained uncontaminated by the specimens. Prior to use, all filter papers, including the Whatman No. 42, were thoroughly dried in an oven for 12 h after being soaked in a Formalin solution for 2 h. This step ensured that the filter papers were free from any residual moisture.
To create a moisture-sealed environment, the two identical soil specimens were securely bound together using waterproof tape and then wrapped with tin foil paper. Finally, a thin layer of wax was applied to seal the specimens effectively. The entire assembly was then placed in a thermotank set at a constant temperature of 20 °C to minimize the influence of evaporation and temperature variations on the experimental results.
After precisely 14 days, the mass of the Whatman No. 42 filter paper was swiftly measured using a high-precision balance (0.0001 g). Additionally, the volume of the soil specimens was remeasured using a micrometer caliper. Subsequently, the water content of the tested specimens was reevaluated using the oven-dried method, which may differ from the initially specified water content. It is this newly measured soil–water content that will be employed in determining the SWCC for the given specimens.
The soil’s matric suction is the same as the Whatman No. 42 filter paper, which can be calculated based on this filter paper’s water content and the calibration curve suggested by ASTM Standard D5298-10 [39].
3.3. Mercury Intrusion Porosity Test
The mercury intrusion porosity (MIP) technique was used to investigate the pore characteristics of both intact and compacted loess specimens. Before conducting the MIP test, it was necessary to dry the specimens. These specimens, measuring 20 mm in height and 10 mm in diameter, were carefully trimmed and then submerged in liquid nitrogen for freezing. Subsequently, the frozen specimens were transferred to a freeze-dryer chamber. After the drying process, the specimens were placed in the AutoPore IV 9500 fully automatic mercury porosimeter to analyze their pore characteristics. This apparatus can apply pressures in the range of 0–414 MPa and measure pore diameters ranging from 0.003 μm to 1000 μm.
3.4. Scanning Electron Microscope
The soil sample to be observed was cut into approximately 20 mm × 7 mm × 7 mm cubes. These cubes were initially air-dried. Next, a scratch was carefully made in the middle of each cube, and the sample was gently cracked along the scratch, revealing a relatively smooth and fresh natural surface suitable for observation. The freshly exposed surface of the soil sample was then placed face up on a sample holder and securely affixed to the holder using white latex glue. The sample holder, now carrying the soil sample, was positioned on the target stage, and subjected to vacuum pumping for approximately 4 h. Subsequently, a thin, uniform layer of gold powder was applied to the sample. Finally, the prepared sample was introduced into the sample chamber for observation.
4. Results and Discussion
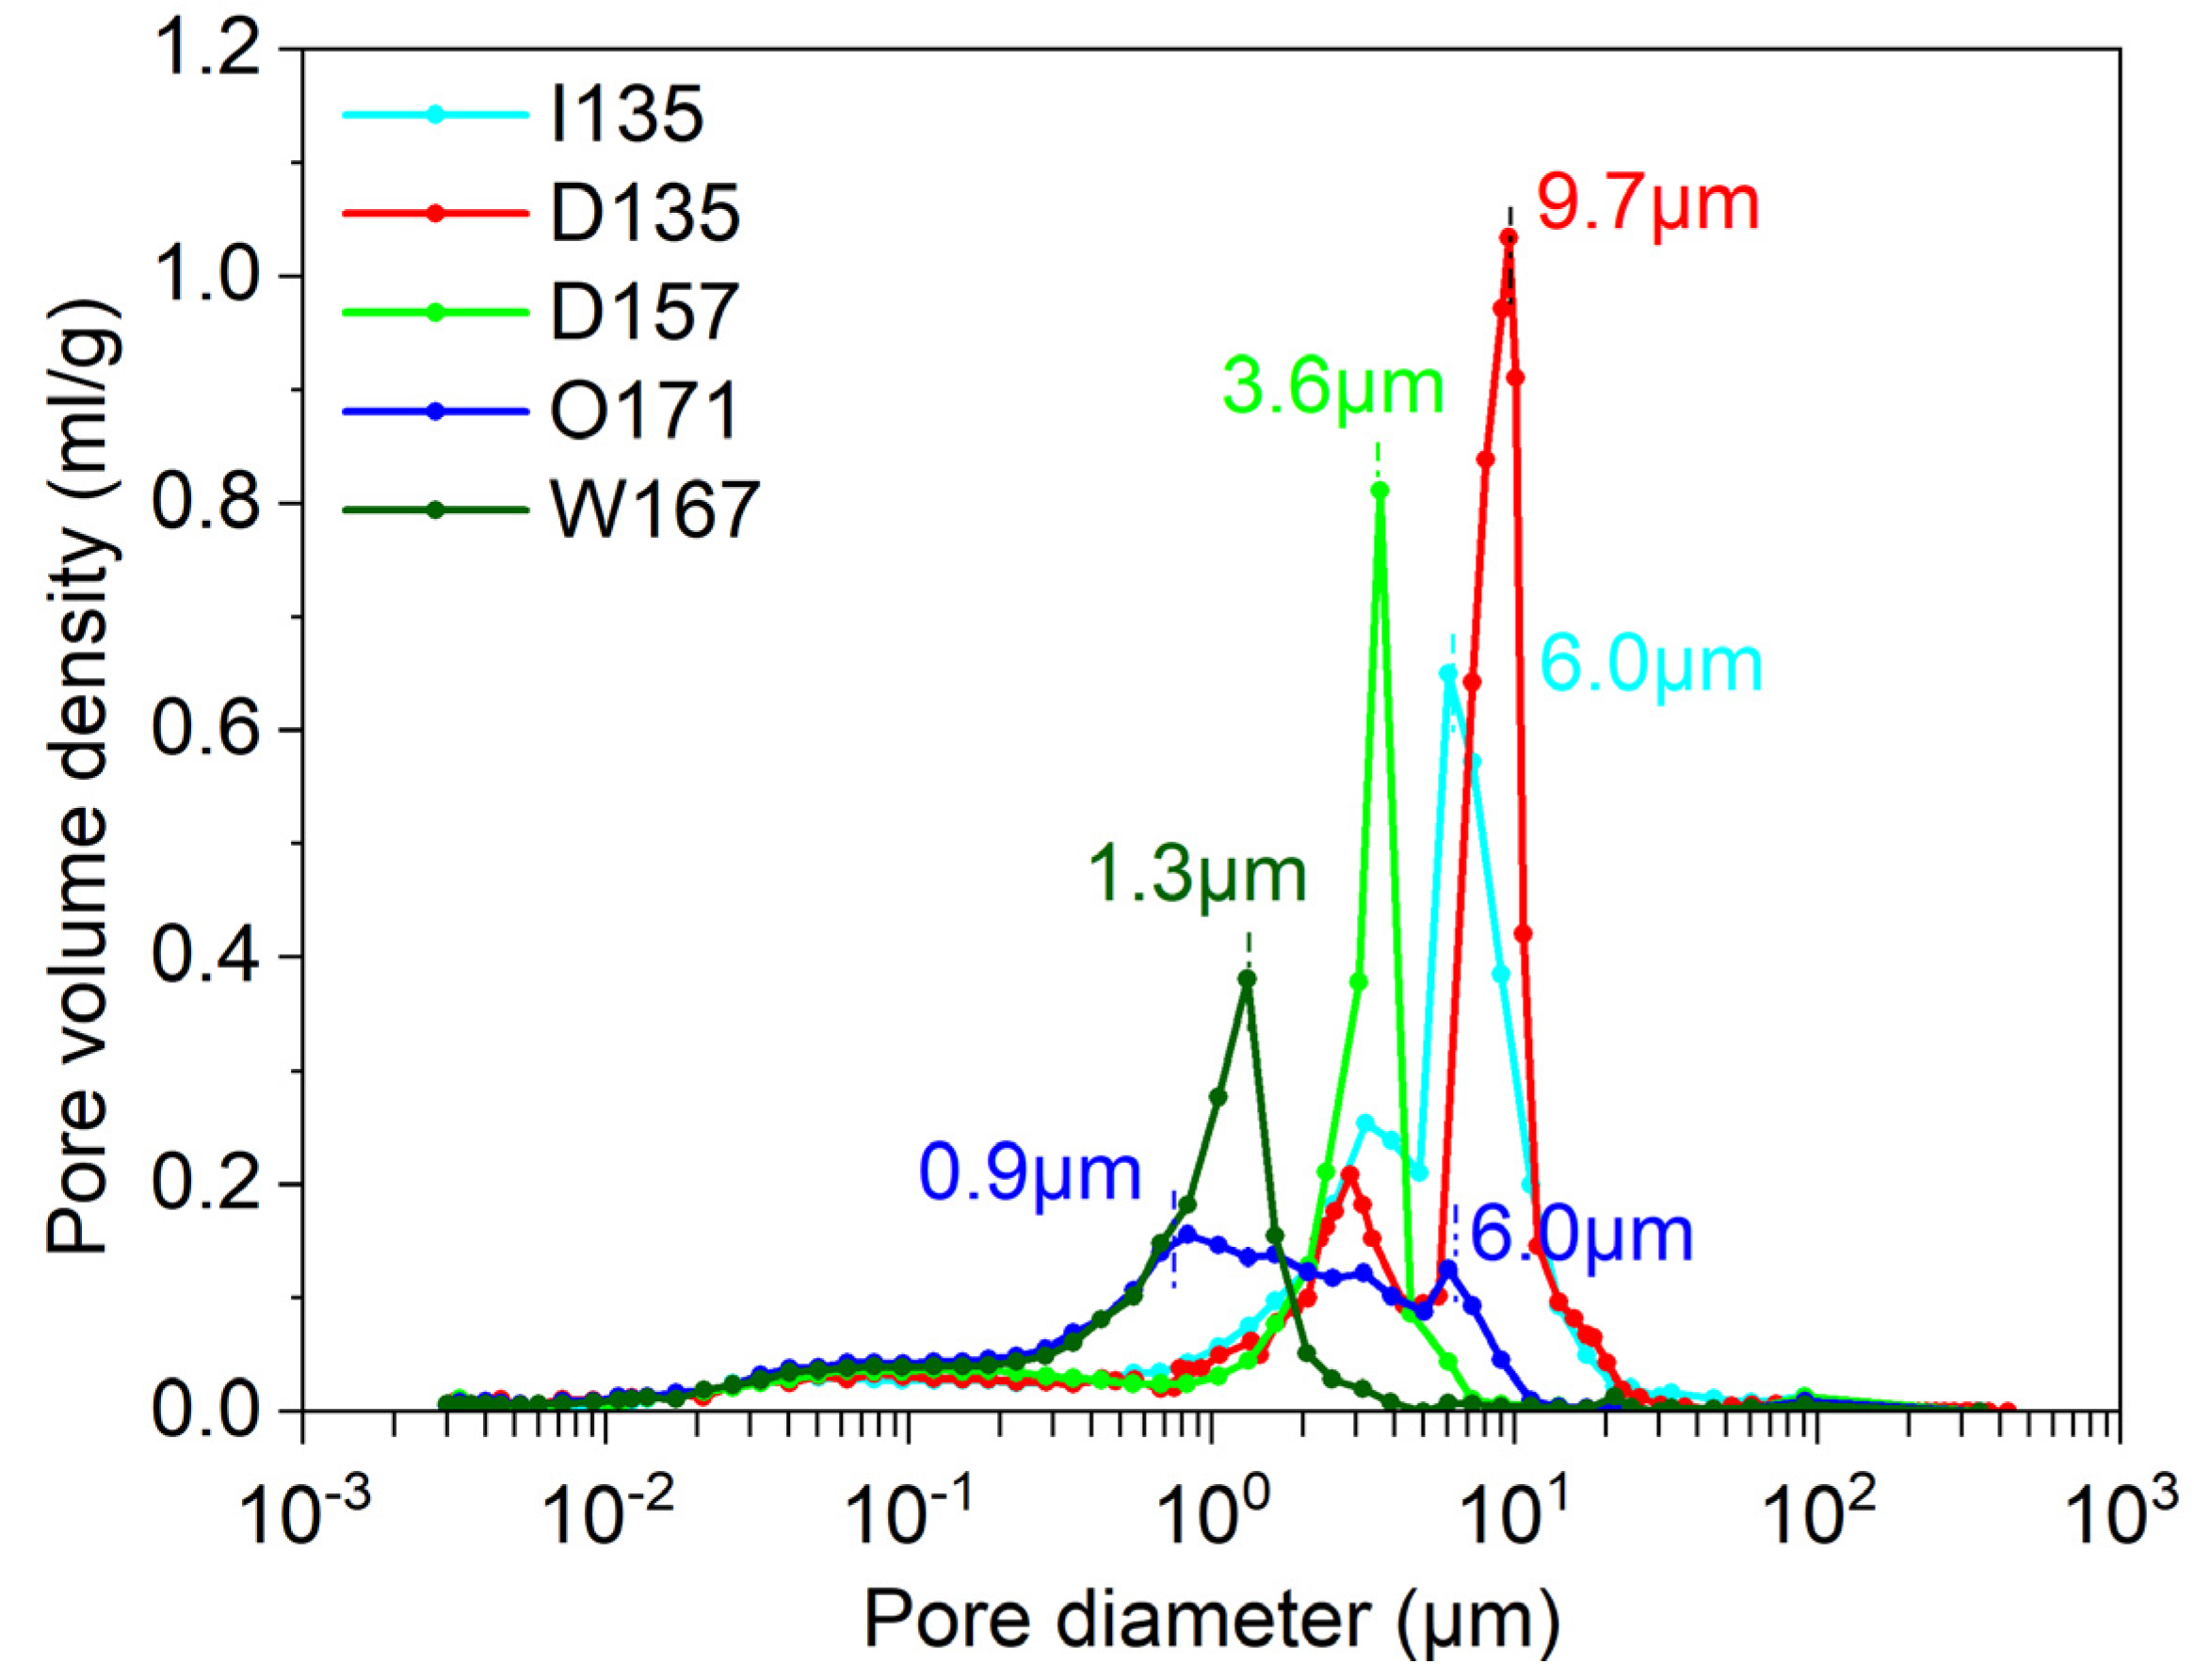
Figure 4 displays the experimentally obtained pore size distribution curve, illustrating the significant influence of compacted moisture content on the soil’s pore size distribution characteristics. Specimens D157, O171, and W167 were compacted under dry of optimum, optimum, and wet of optimum moisture conditions, all with the same compaction energy. The O171 specimen exhibits a more uniform pore structure, with the dominant pore size covering a broad range from 0.9 μm to 6.0 μm and a distribution density of about 0.14 mL/g. In contrast, the pore size distribution curves of D157 and W167 show a prominent group of dominant pores. For D157, the peak pore size is at 3.6 μm, with a corresponding distribution density at the peak of 0.81 mL/g. For W167, the peak pore size is at 1.3 μm, with a corresponding distribution density of 0.38 mL/g. Compared to D157, W167 exhibits a decrease in dominant pore size and density.
The D135 and D157 specimens were prepared under the same compaction water content. It is evident that the dry density primarily affects the dominant pore size and pore density. In the D135 specimen, the dominant pore size measures 9.7 μm, with a corresponding distribution density of 1.03 mL/g. The D157 sample has a dominant pore size of 6.0 μm, with a corresponding distribution density of 0.81 mL/g. The pore size distribution of the intact specimen resembles that of the D135 specimen.
For all specimens, the differences in the pore size distribution curves primarily occur in the range of pore sizes larger than 0.2 μm. When the pore size is smaller than 0.2 μm, the pore size distribution curves nearly overlap. The compaction process primarily alters the pores with diameters larger than 0.2 μm, while it has a limited impact on the smaller pores.
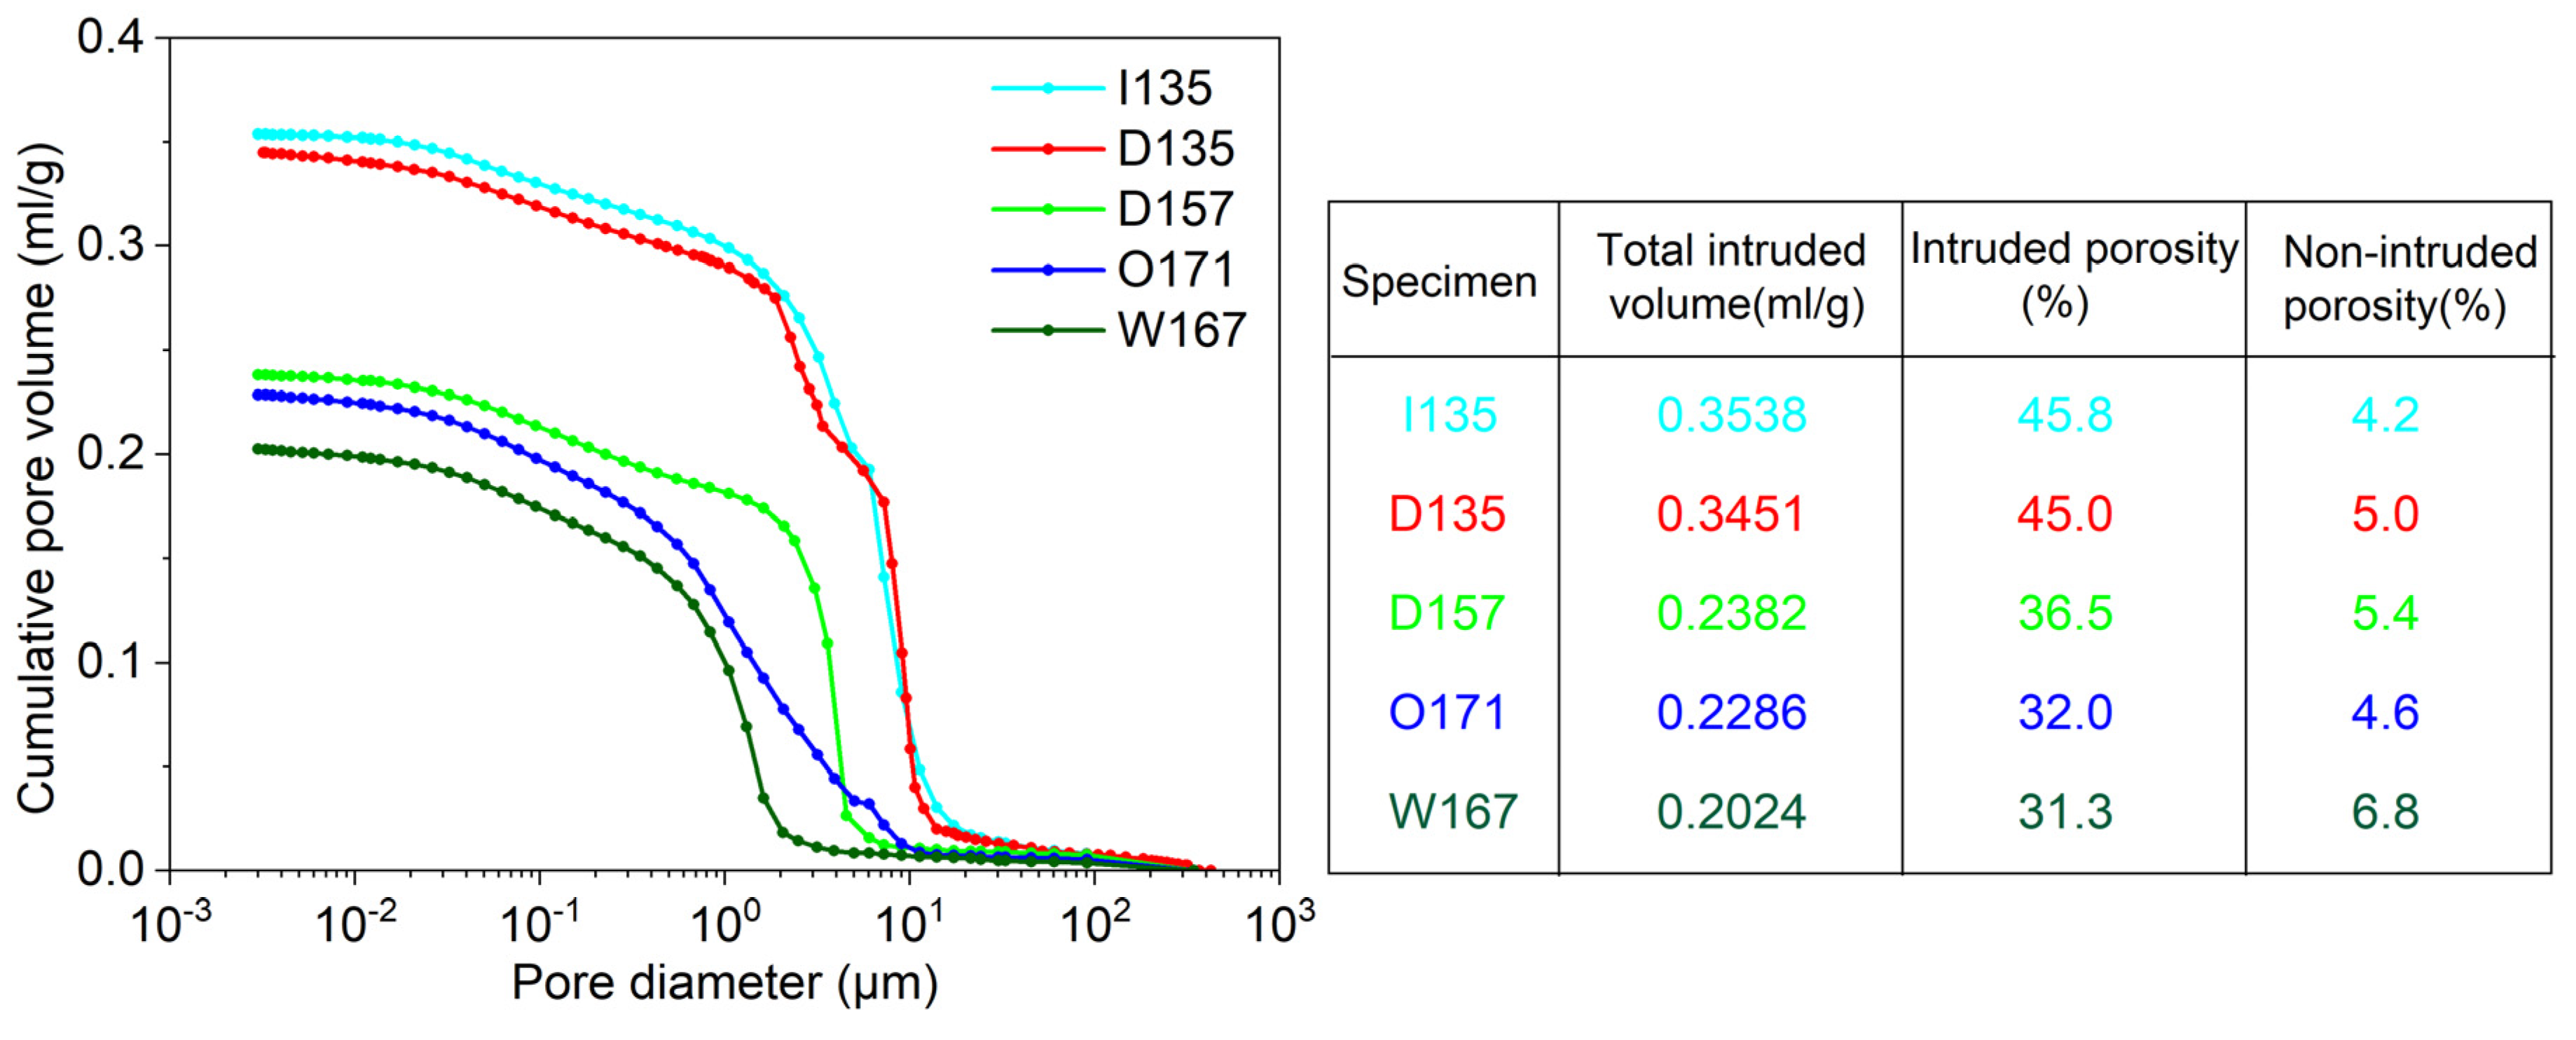
Figure 5 displays the cumulative mercury intrusion curves for five distinct samples. These curves reveal a noteworthy variation in the amount of mercury intrusion as the pore size decreases within the range of 1 to 20 μm for I135 and D135, indicating that the predominant pores fall within this size range. For the other specimens (i.e., D157, O171, and W167), the maximum slopes of their cumulative mercury intrusion curves occur at 0.4 to 2 μm, 0.4 to 10 μm, and 2 to 6 μm, respectively. Notably, the curve for O171 exhibits a relatively gentle slope, signifying a more uniform distribution of pores.
In Figure 5, when arranging the five soil specimens in ascending order of dry density—I135 = D135 < D157 < W167 < O171—a similar sequence should theoretically emerge when arranging the specimens based on total intrusion volume. However, according to the MIP results, the intact sample (I135) boasts the highest total intrusion volume, measuring 0.3528 mL/g, followed closely by the D135 sample with a total intrusion volume of 0.3451 mL/g. The total intrusion volumes for the D157, W167, and O171 samples are 0.2382 mL/g, 0.2024 mL/g, and 0.2286 mL/g, respectively. Surprisingly, the O171 sample exhibits a greater total intrusion volume compared to W167. Given that mercury can only infiltrate connected pores within the sample and pores with sizes ranging from 0.003 to 1000 μm, with no pores larger than 1000 μm observed in the SEM images, this implies that the W167 soil sample may contain more closed pores or a larger number of extremely small pores (d < 0.003 μm), resulting in a lower mercury intrusion compared to the O171 soil sample.
Additionally, the measured porosities of I135, D135, D157, W167, and O171 are 45.8%, 45.0%, 36.5%, 32.0%, and 31.3%, respectively. The remaining non-intruded porosity (porosity measured by mercury intrusion porosity) is distributed as 4.2%, 5.0%, 5.4%, 4.6%, and 6.8% for these samples, respectively.
The scanning electron microscope (SEM) images of I135 and D135 are depicted in Figure 6. In the lower magnification images (100–200 times) in Figure 6a,c, one can observe that the structures of these two specimens appear to be relatively loose, with distinct particles and predominant point-to-point contacts between them. The pores exhibit well-developed connectivity. Notably, the intact sample I135 contains numerous large space pores (d > 100 μm), as illustrated in Figure 6a. One pore stands out, with its major axis radius measuring approximately 360 μm, which is significantly larger than the particle diameters surrounding the pore.
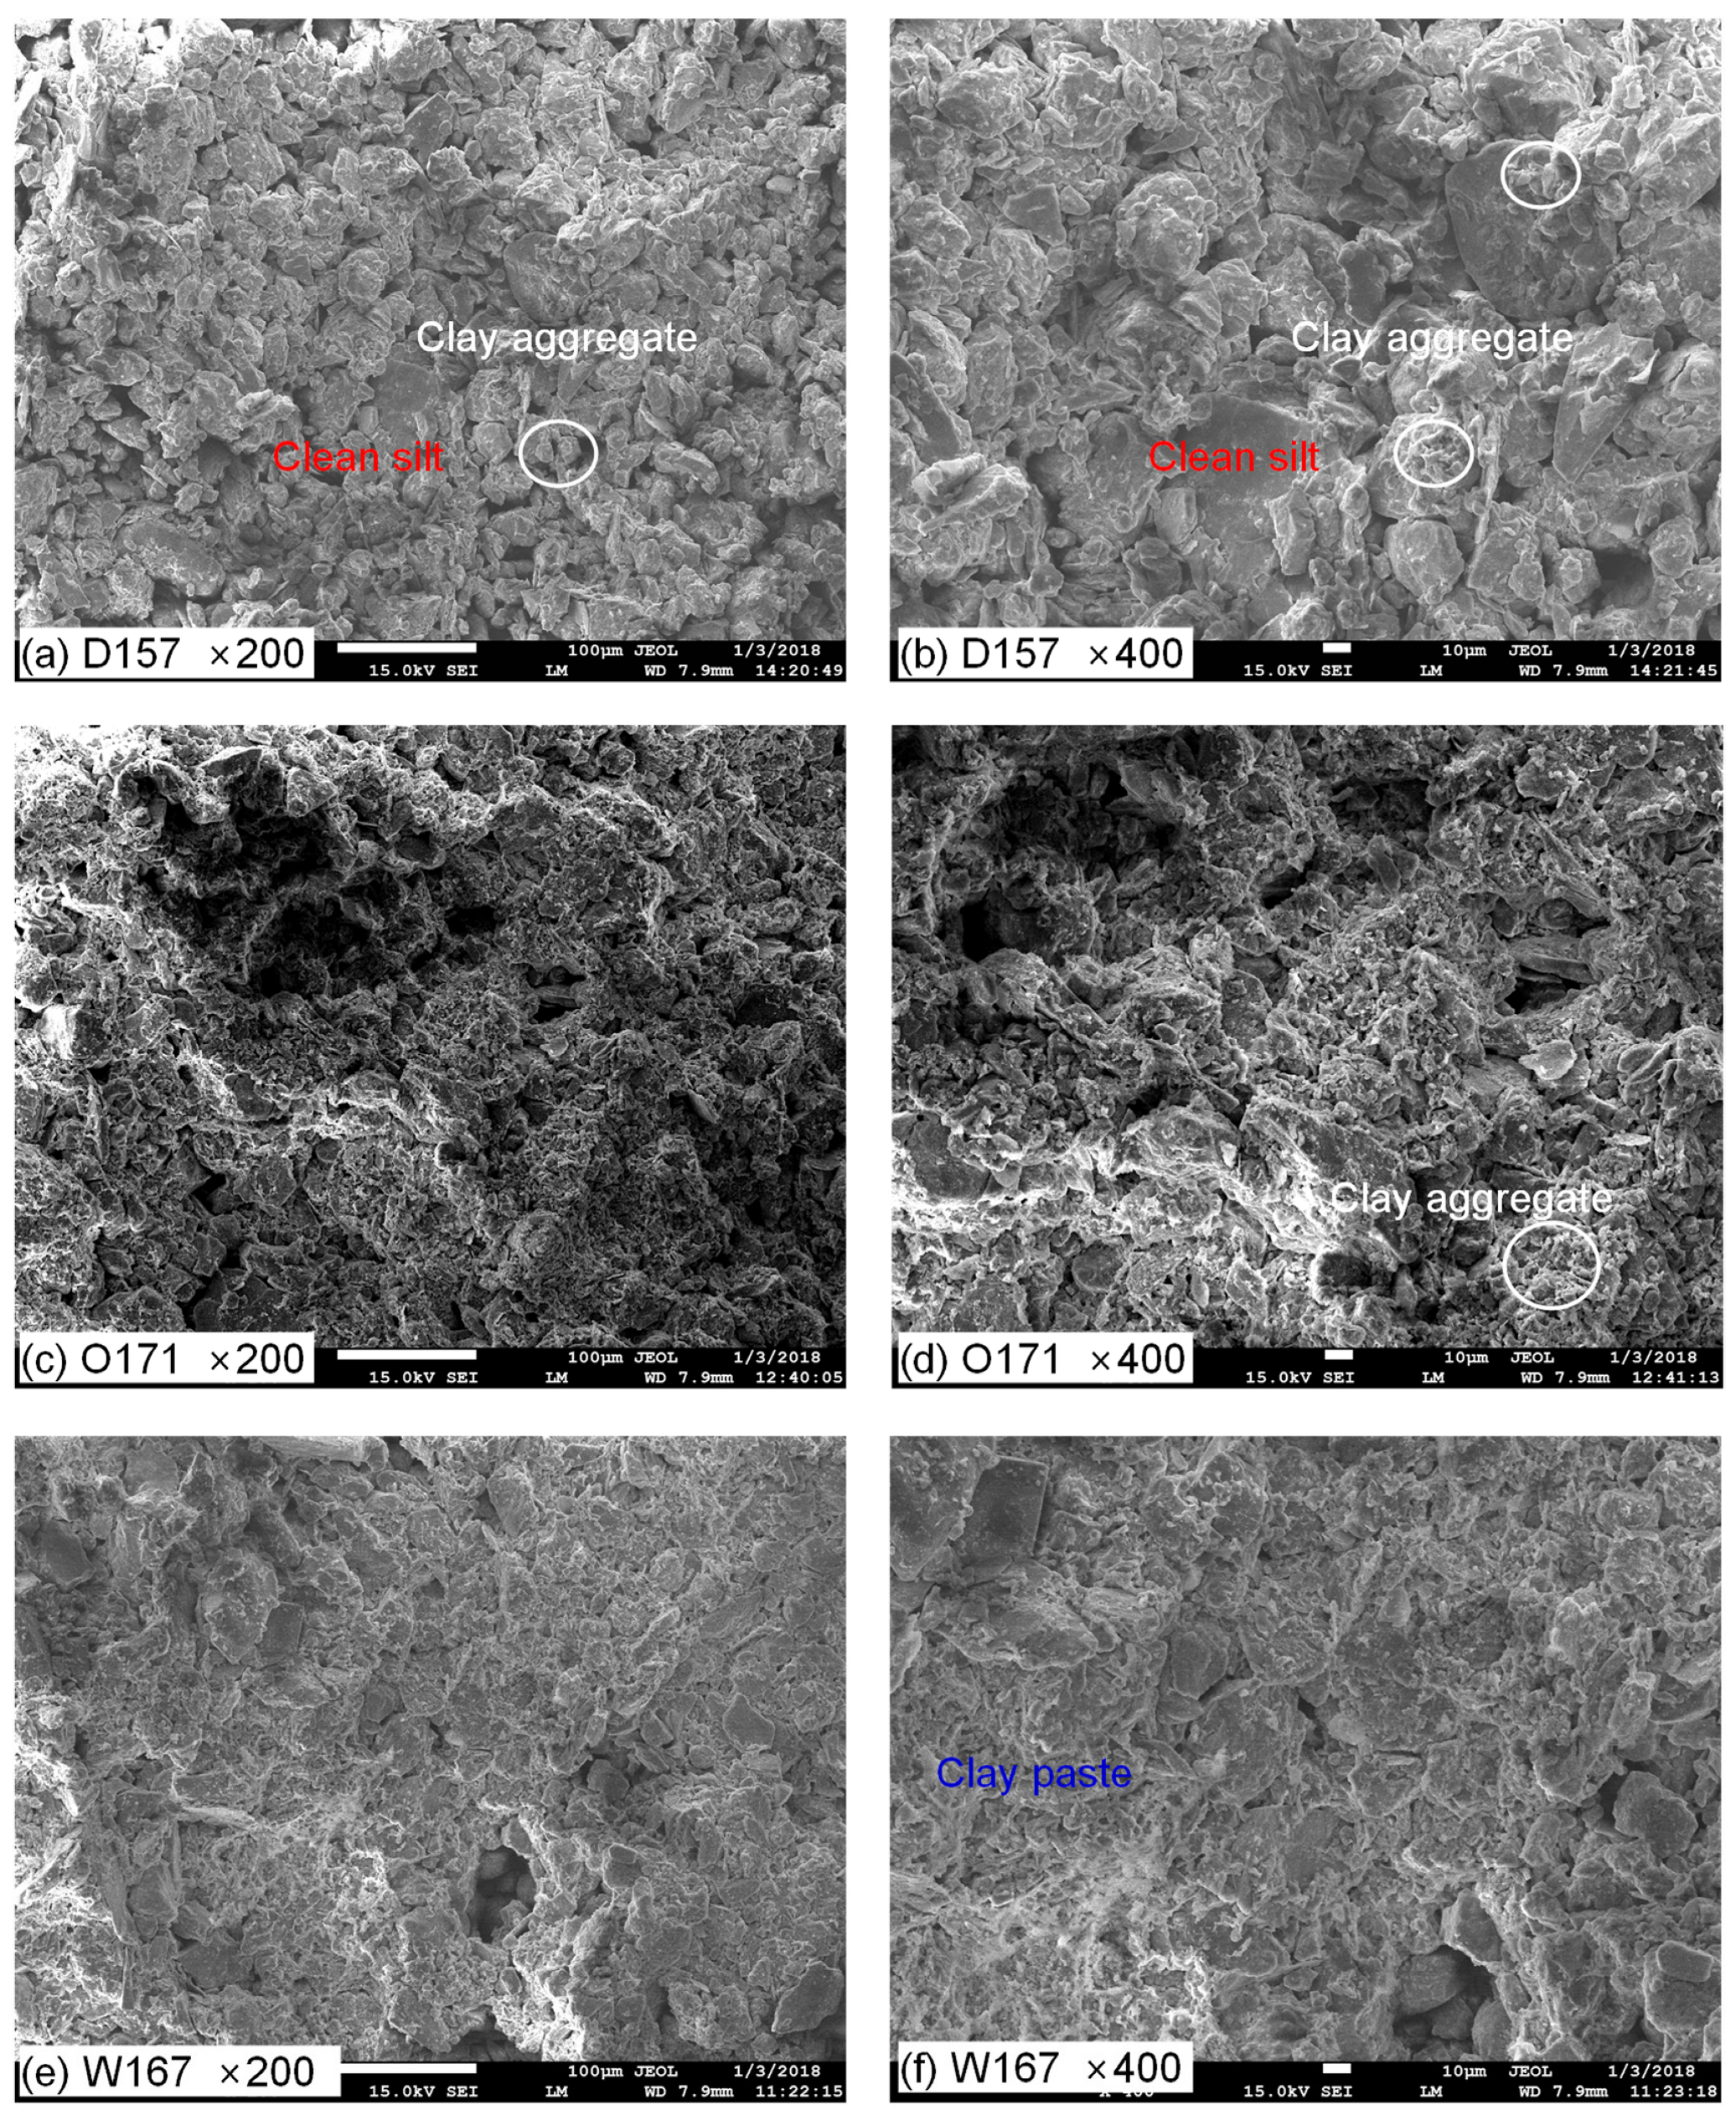
The SEM images of D157, O171, and W167 are presented in Figure 7. It is evident that compared to I135 and D135, the D157 specimens are more densely compacted, with nearly no pores larger than 10 μm. The particles within the D157 specimen are tightly packed, and the contours of individual particles are relatively well-defined. There are fewer poorly stable space pores with sizes exceeding those of the surrounding soil grains. Clay particles are primarily aggregated between the silt particles, indicating good pore connectivity. As for the O171 and W167 specimens (Figure 7c–f), their compactness increases significantly. The SEM images of these specimens exhibit noticeable differences compared to the intact, D135, and D157 specimens. The particles in O171 and W167 are arranged in proximity, and the contours of the skeleton particles are unclear, making it challenging to discern the contact boundaries between particles. Additionally, there are a few space pores visible in the W167 specimen (Figure 7e), while almost no space pores are observed in the O171 sample. Furthermore, in the O171 specimen, clay particles are not only adhered to the skeleton particles but also fill the gaps between them, resulting in higher soil compactness. In contrast, the clay particles in W167 primarily adhere to the silt grains, forming a dispersed structure.
From the SEM images above, it is evident that the compaction water content plays a substantial role in shaping the structure of compacted loess. When the compaction water content is low and matric suction is high, resistance during compaction increases, making it challenging to achieve a high dry density. At the near-optimum water content state, close to the plastic limit, soil particles encounter less resistance during compaction, facilitating the attainment of a more compact state. When the compaction water content surpasses the optimum level, pore water pressure may become locally positive during compaction.
Figure 8 presents the measured data and prediction curves of the SWCC using the MIP data, with the contact angle (CA) being treated as a fitting parameter during the prediction process. Figure 8a shows the influence of CA. As the contact angle increases, the predicted SWCC curve shifts to the left along the matric suction axis. Figure 8b–f shows the comparison between the predicted SWCC and the measured SWCC for different specimens. The predicted values for the I135, D135, and D157 specimens closely match the measured values when using a contact angle (CA) of 65°. For the O171 specimen, the prediction performance is less accurate at high suction levels, and a contact angle value of 75° provides a closer fit in the low suction range (10–70 kPa). The prediction performance for the W167 specimen is the least accurate, with a notable overestimation of the water content in the low suction range (10–70 kPa).
From Figure 8, the obtained optimal CA values are different for the specimens though they have the same grain particles and mineral composition. The CA values for samples I135, D135, and D157 are all 68°, while for samples O171 and W167, the CA values are 75° and 72°, respectively. The reason for this discrepancy may be related to the ink bottle effect, meaning that pores accessible only through smaller pores are not detected until the smaller pores are penetrated. Due to this ink bottle effect, the pore sizes measured by the MIP apparatus may be smaller than the actual pore sizes of the soil, leading to the calculated matrix suction being overestimated. Therefore, when the predicted curve closely matches the measured curve, the CA value needs to be adjusted to a larger value.
The less accurate prediction for the O171 and W167 specimens may be attributed to the poor connectivity of the pores in the soil. Scanning electron microscope (SEM) results show that the intact loess I135 and the compacted loess at dry of optimum condition D135 and D157 have a relatively loose particle distribution and good pore connectivity (Figure 5, Figure 6 and Figure 7). On the other hand, the O171 and W167 specimens exhibit mostly dispersed pores, with smaller aggregates formed by cohesive particles filling small voids or adhering to the surface of fine particles. The presence of these smaller aggregates and dispersed pores results in poor pore connectivity, making it difficult for mercury to penetrate the pores during the mercury intrusion test. A poorer pore connectivity contributes to a more pronounced ink bottle effect, leading to a distorted pore size distribution curve.
It is essential to emphasize that the water retention behavior, particularly within the residual suction range (e.g., >100 kPa in this study, as determined based on the methodology outlined by Vanapalli et al. [20]), is predominantly influenced by adsorption, a phenomenon controlled by the mineral composition of particles rather than capillarity [40]. Therefore, the suction derived from pore size using the Young–Laplace equation in the high suction range may not be the accurate suction. However, the predicted curves exhibit a remarkable agreement with the measured data over a wide suction range (e.g., 10–104 kPa) for the intact and D157 and D135 specimens (Figure 8). In addition, excellent consistency for several intact loess specimens is also reported by Li et al. [29]. One plausible explanation for this phenomenon could be linked to the inclusion of non-intruded pore volume as bonded water in the computation of the wetting SWCC using MIP data. Conversely, these non-intruded pores are typically disregarded when utilizing MIP data to forecast the drying SWCC, leading to substantial discrepancies, particularly in the high suction ranges [10,24]
The process of mercury intrusion is like the intrusion of air into saturated soil during drying when employing the axis translation technique to measure the drying SWCC. In such instances, when utilizing MIP data for SWCC prediction, it is most accurate within the low suction range, where capillary forces predominantly govern the soil–water interaction. Nevertheless, the adsorption phenomenon indirectly comes into play when MIP data is employed to forecast the wetting SWCC, as delineated in Equation (3). Consequently, the predictive performance remains acceptable over a wide suction range (e.g., 10–104 kPa). However, as suction approaches zero (e.g., 104–106 kPa), substantial errors emerge, attributed to a theoretical foundation that may not fully align with reality (see Figure 8). Li et al. [29] have utilized distinct CA to distinguish between wetting and drying SWCC, resulting in commendable consistency. However, it is worth acknowledging that their prediction procedures are primarily geared toward forecasting the wetting process, akin to the approach employed in this study. It is important to concede that the theoretical basis for predicting the wetting SWCC using MIP data in the high suction range is somewhat tenuous. Nonetheless, the substantial agreement observed between the predictive model and measured data over a wide suction range (e.g., 10–104 kPa) instills a high degree of confidence in the reliability of the approach.
5. Summary and Conclusions
This paper explores the performance of the pore size data obtained from the mercury intrusion technique in predicting the wetting SWCC of intact and compacted loess. During the SWCC prediction, the contact angle is assumed to be a fitting parameter. The influence of compaction water content on the soil microstructure and pore size distribution characteristics is highlighted. Results show that the intact and dry of optimum specimens exhibit relatively good pore connectivity, with more point-to-point contacts between particles. The specimens compacted under optimum and wet of optimum conditions have poor pore connectivity, with more isolated pores in the wet of optimum specimen. The SWCC predictions using the MIP data perform well for the intact and dry of optimum compacted specimens over a suction range of 10–104 kPa. However, for the specimens compacted at the optimum and wet of optimum moisture conditions, the prediction performance is poor due to poor connectivity. The prediction performance of the PSD obtained from the MIP technique is closely related to the connectivity of the soil pores. The contact angle required in predicting the wetting varies for different specimens even though they possess the same compositions. It is suggested to be taken as a fitting parameter.
It is important to highlight that MIP predictions hinge on the conversion of pore size into suction via the Young–Laplace equation, which is rooted in capillary theory. This approach is applicable in the low suction range, where capillary forces primarily govern water behavior in porous media. However, it encounters limitations in the high suction range, where adsorption forces take precedence over capillary effects. When the MIP data is used to forecast the wetting SWCC, it indirectly accounts for adsorption water. Despite the somewhat tenuous theoretical basis, the good consistency between predictions and measured data over a wide suction range instills a substantial level of confidence in the efficacy of employing MIP data to predict the wetting SWCC.
Funding
This research was supported by the National Natural Science Foundation of China under Grant No. 42107188, the Strategic Priority Research Program of the Chinese Academy of Sciences, Grant No. XDA23090402.
Data Availability Statement
All relevant data are available from the corresponding author by request.
Acknowledgments
Thanks are given to Xiao Xie for assisting in the experiment.
Conflicts of Interest
The author declares no conflict of interest.
References
- Lu, N.; Kaya, M. A drying cake method for measuring suction-stress characteristic curve, soil–water-retention curve, and hydraulic conductivity function. Geotech. Test. J. 2013, 36, 20120097. [Google Scholar] [CrossRef]
- Hu, H.J.; Cui, Y.J.; Li, C.H.; Su, W.; Wang, Z.Z. Improvement of three common methods for determining hydraulic conductivity curve of unsaturated soil upon wetting. J. Hydrol. 2021, 594, 125947. [Google Scholar] [CrossRef]
- Ramos, T.B.; Simunek, J.; Gonçalves, M.C.; Martins, J.C.; Prazeres, A.; Castanheira, N.L.; Pereira, L.S. Field evaluation of a multicomponent solute transport model in soils irrigated with saline waters. J. Hydrol. 2011, 407, 129–144. [Google Scholar] [CrossRef]
- Hou, X.K.; Qi, S.W.; Li, T.L.; Guo, S.F.; Wang, Y.; Li, Y.; Zhang, L.X. Microstructure and soil-water retention behavior of compacted and intact silt loess. Eng. Geol. 2020, 277, 105814. [Google Scholar] [CrossRef]
- Khire, M.V.; Benson, C.H.; Bosscher, P.J. Water balance modeling of earthen final covers. J. Geotech. Geoenviron. Eng. 1997, 123, 744–754. [Google Scholar] [CrossRef]
- Li, J.H.; Du, L.; Chen, R.; Zhang, L.M. Numerical investigation of the performance of covers with capillary barrier effects in South China. Comput. Geotech. 2013, 48, 304–315. [Google Scholar] [CrossRef]
- Scarfone, R.; Wheeler, S.J.; Lloret-Cabot, M. Conceptual hydraulic conductivity model for unsaturated soils at low degree of saturation and its application to the study of capillary barrier systems. J. Geotech. Geoenviron. Eng. 2020, 146, 04020106. [Google Scholar] [CrossRef]
- Yoon, S.; Kim, M.S.; Kim, G.Y.; Lee, S.R. Contemplation of relative hydraulic conductivity for compacted bentonite in a high-level radioactive waste repository. Ann. Nucl. Energy. 2021, 161, 108439. [Google Scholar] [CrossRef]
- Fredlund, D.G.; Rahardjo, H. Soil Mechanics for Unsaturated Soils; John Wiley & Sons: New York, NY, USA, 1993. [Google Scholar]
- Muñoz-Castelblanco, J.A.; Pereira, J.M.; Delage, P.; Cui, Y.J. The water retention properties of natural unsaturated loess from northern France. Géotechnique 2012, 62, 95. [Google Scholar] [CrossRef]
- Ng, C.W.W.; Sadeghi, H.; Belal Hossen, S.B.; Chiu, C.F.; Alonso, E.E.; Baghbanrezvan, S. Water retention and volumetric characteristics of intact and re-compacted loess. Can. Geotech. J. 2016, 53, 1258–1269. [Google Scholar] [CrossRef]
- Yang, H.; Rahardjo, H.; Leong, E.C.; Fredlund, D.G. Factors affecting drying and wetting soil-water characteristic curves of sandy soils. Can. Geotech. J. 2004, 41, 908–920. [Google Scholar] [CrossRef]
- Wang, Y.; Li, T.L.; Zhao, C.; Hou, X.K.; Li, P.; Zhang, Y.G. A study on the effect of pore and particle distributions on the soil water characteristic curve of compacted loess soil. Environ. Earth. Sci. 2021, 80, 764. [Google Scholar] [CrossRef]
- Vanapalli, S.K.; Fredlund, D.G.; Pufahl, D.E. The influence of soil structure and stress history on the soil-water characteristics of a compacted till. Géotechnique 1999, 49, 143–159. [Google Scholar] [CrossRef]
- Casini, F.; Vaunat, J.; Romero, E.; Desideri, A. Consequences on water retention properties of double-porosity features in compacted silt. Acta. Geotech. 2012, 7, 139–150. [Google Scholar] [CrossRef]
- Simms, P.H.; Yanful, E.K. Predicting soil-water characteristic curves of compacted plastic soils from measured pore-size distributions. Géotechnique 2002, 52, 269–278. [Google Scholar] [CrossRef]
- Romero, E.; Della Vecchia, G.; Jommi, C. An insight into the water retention properties of compacted clayey soils. Géotechnique 2011, 61, 313. [Google Scholar] [CrossRef]
- van Genuchten, M.T. A closed-form equation for predicting the hydraulic conductivity of unsaturated soils. Soil Sci. Soc. AM. J. 1980, 44, 892–898. [Google Scholar] [CrossRef]
- Fredlund, D.G.; Xing, A. Equations for the soil-water characteristic curve. Can. Geotech. J. 1994, 31, 521–532. [Google Scholar] [CrossRef]
- Vanapalli, S.K.; Fredlund, D.G.; Pufahl, D.E.; Clifton, A.W. Model for the prediction of shear strength with respect to soil suction. Can. Geotech. J. 1996, 33, 379–392. [Google Scholar] [CrossRef]
- Sheng, D.; Zhou, A.; Fredlund, D.G. Shear strength criteria for unsaturated soils. Geotech. Geol. Eng. 2011, 29, 145–159. [Google Scholar] [CrossRef]
- Han, Z.; Vanapalli, S.K. Stiffness and shear strength of unsaturated soils in relation to soil-water characteristic curve. Géotechnique 2016, 66, 627–647. [Google Scholar] [CrossRef]
- Romero, E.; Gens, A.; Lloret, A. Water permeability, water retention and microstructure of unsaturated compacted Boom clay. Eng. Geo. 1999, 54, 117–127. [Google Scholar] [CrossRef]
- Otalvaro, I.F.; Neto, M.P.C.; Delage, P.; Caicedo, B. Relationship between soil structure and water retention properties in a residual compacted soil. Eng. Geo. 2016, 205, 73–80. [Google Scholar] [CrossRef]
- Zhang, L.M.; Li, X. Micro Porosity Structure of Coarse Granular Soils. J. Geotech. Geoenviron. 2010, 136, 1425–1436. [Google Scholar] [CrossRef]
- Romero, E.; Simms, P.H. Microstructure investigation in unsaturated soils: A review with special attention to contribution of mercury intrusion porosimetry and environmental scanning electron microscopy. Geotech. Geol. Eng. 2008, 26, 705–727. [Google Scholar] [CrossRef]
- Hajnos, M.; Calka, A.; Jozefaciuk, G. Wettability of mineral soils. Geoderma 2013, 206, 63–69. [Google Scholar] [CrossRef]
- Liu, Z.; Yu, X.; Wan, L. Influence of contact angle on soil water characteristic curve with modified capillary rise method. Transport. Res. Rec. 2013, 2349, 32–40. [Google Scholar] [CrossRef]
- Li, H.; Li, T.L.; Li, P.; Zhang, Y.G. Prediction of loess soil-water characteristic curve by mercury intrusion porosimetry. J. M. T. Sci.-Engl. 2020, 17, 2203–2213. [Google Scholar] [CrossRef]
- Delage, P.; Audiguier, M.; Cui, Y.J.; Howat, M.D. Microstructure of a compacted silt. Can. Geotech. J. 1996, 33, 150–158. [Google Scholar] [CrossRef]
- Bachmann, J.; Woche, S.K.; Goebel, M.O. Extended methodology for determining wetting properties of porous media. Water Resour. Res. 2003, 39, 11-1–11-14. [Google Scholar] [CrossRef]
- Shang, J.; Flury, M.; Harsh, J.B.; Zollars, R.L. Comparison of different methods to measure contact angles of soil colloids. J. Colloid Interf. Sci. 2008, 328, 299–307. [Google Scholar] [CrossRef] [PubMed]
- Gardner, R. A method of measuring the capillary tension of soil moisture over a wide moisture range. Soil Sci. 1937, 43, 277–284. Available online: https://journals.lww.com/soilsci/Citation/1937/04000/A_Method_of_Measuring_the_Capillary_Tension_of.4.aspx (accessed on 10 July 2023). [CrossRef]
- Leong, E.C.; He, L.; Rahardjo, H. Factors affecting the filter paper method for total and matric suction measurements. Geotech. Test. J. 2002, 25, 322–333. [Google Scholar] [CrossRef]
- Chandler, R.J.; Harwood, A.H.; Skinner, P.J. Sample disturbance in London clay. Géotechnique 1992, 42, 577–585. [Google Scholar] [CrossRef]
- Houston, S.L.; Houston, W.N.; Wagner, A.M. Laboratory filter paper suction measurements. Geotech. Test. J. 1994, 17, 185–194. [Google Scholar]
- Tsai, C.U.; Petry, T.M. Suction study on compacted clay using three measurement methods. Transport. Res. Rec. 1995, 1481, 28–34. [Google Scholar]
- Power, K.C.; Vanapalli, S.K.; Garga, V.K. A revised contact filter paper method. Geotech. Test. J. 2008, 31, 461–469. Available online: https://www.astm.org (accessed on 11 July 2023).
- ASTM Standard D5298-10; Standard Test Method for Measurement of Soil Potential (Suction) Using Filter Paper. ASTM International: West Conshohocken, PA, USA, 2006.
- Lu, N.; Likos, W.J. Unsaturated Soil Mechanics; John Wiley and Sons: New York, NY, USA, 2004. [Google Scholar]
Figure 1.
Schematic diagram of water retention characteristics and mercury retention in soil.

Figure 2.
Particle size distribution curves.

Figure 3.
Compaction curve for the loess (The red line is the compression curve of the soil; the blue line is the saturation curve).
Figure 3.
Compaction curve for the loess (The red line is the compression curve of the soil; the blue line is the saturation curve).

Figure 4.
Pore size distribution curves.

Figure 5.
Cumulative intruded mercury volume.

Figure 6.
SEM images of I135 and D135 at different magnifications (a) I135, 100 times; (b) I135, 400 times; (c) D135, 200 times; (d) D135, 400 times.
Figure 6.
SEM images of I135 and D135 at different magnifications (a) I135, 100 times; (b) I135, 400 times; (c) D135, 200 times; (d) D135, 400 times.

Figure 7.
SEM images of D157, O171, and W167 at different magnifications (a) D157, 200 times, (b) D157, 400 times (c) O171, 200 times (d) O171, 400 times (e) W167, 200 times (f) W167, 400 times.
Figure 7.
SEM images of D157, O171, and W167 at different magnifications (a) D157, 200 times, (b) D157, 400 times (c) O171, 200 times (d) O171, 400 times (e) W167, 200 times (f) W167, 400 times.

Figure 8.
Predicted and measured soil–water retention curves (a) schematic diagram illustrating the influence of contact angle; (b) the intact specimen; (c) the compacted specimen of D135; (d) the compacted specimen of D157;(e) the compacted specimen of O171; (f)the compacted specimen ofW167.
Figure 8.
Predicted and measured soil–water retention curves (a) schematic diagram illustrating the influence of contact angle; (b) the intact specimen; (c) the compacted specimen of D135; (d) the compacted specimen of D157;(e) the compacted specimen of O171; (f)the compacted specimen ofW167.


Table 1.
Volumetric properties of compacted samples.
| Sample | Compaction Water Content | Dry Density(g/cm3) | Void Ratio | Saturated Water Content (%) | Porosity (%) |
|---|---|---|---|---|---|
| D157 | Dry of optimum (8%) | 1.57 | 0.72 | 26.7 | 41.9 |
| O171 | Optimum (17%) | 1.72 | 0.58 | 21.4 | 36.7 |
| W167 | Wet of optimum (19%) | 1.67 | 0.62 | 22.8 | 38.1 |
| D135 | Dry of optimum (19%) | 1.35 | 1.00 | 37.0 | 50.0 |
| I135 | - | 1.35 | 1.00 | 37.0 | 50.0 |
Disclaimer/Publisher’s Note: The statements, opinions and data contained in all publications are solely those of the individual author(s) and contributor(s) and not of MDPI and/or the editor(s). MDPI and/or the editor(s) disclaim responsibility for any injury to people or property resulting from any ideas, methods, instructions or products referred to in the content. |
© 2023 by the author. Licensee MDPI, Basel, Switzerland. This article is an open access article distributed under the terms and conditions of the Creative Commons Attribution (CC BY) license (https://creativecommons.org/licenses/by/4.0/).
Share and Cite
MDPI and ACS Style
Hou, X. Prediction of the Soil–Water Retention Curve of Loess Using the Pore Data from the Mercury Intrusion Technique. Water 2023, 15, 3273. https://doi.org/10.3390/w15183273
AMA Style
Hou X. Prediction of the Soil–Water Retention Curve of Loess Using the Pore Data from the Mercury Intrusion Technique. Water. 2023; 15(18):3273. https://doi.org/10.3390/w15183273
Chicago/Turabian StyleHou, Xiaokun. 2023. "Prediction of the Soil–Water Retention Curve of Loess Using the Pore Data from the Mercury Intrusion Technique" Water 15, no. 18: 3273. https://doi.org/10.3390/w15183273
Note that from the first issue of 2016, this journal uses article numbers instead of page numbers. See further details here.