Article

Effect of Straw Mulching and Deep Burial Mode on Water and Salt Transport Regularity in Saline Soils

1
College of Resources and Environment, Shandong Agricultural University, Tai’an 271018, China
2
Water Resources Research Institute of Shandong Province, Jinan 250014, China
3
Shandong Provincial Land Space and Ecological Restoration Center, Jinan 250014, China
4
Yanwo Town Government of Lijin County, Dongying 257400, China
5
School of Civil Engineering, Shandong University, Jinan 250014, China
*
Authors to whom correspondence should be addressed.
These authors contributed equally to this work.
Water 2023, 15(18), 3227; https://doi.org/10.3390/w15183227
Submission received: 27 July 2023 / Revised: 6 September 2023 / Accepted: 7 September 2023 / Published: 11 September 2023
(This article belongs to the Special Issue Monitoring, Reclamation and Management of Salt-Affected Lands)

Abstract

:
To examine the impacts of various straw mulching techniques, this study used the indoor soil column test as the primary research method and the field test as the validation test on the salinity dynamics of saline and alkaline soils. The experiment in this study was designed with five treatments: SC means for straw covered on the soil surface; DB means for straw buried 40 cm below the soil surface; S1D1, S2D1, and S1D2 represent the ratio of soil surface cover to the amount of straw buried 40 cm below the soil surface as 1:1, 2:1, and 1:2, respectively. The results of the indoor soil column test showed that all kinds of straw mulching techniques could effectively reduce soil moisture evaporation, and the straw mulching and deep burial mode was more effective: after 45 days of evaporation, compared with that of CK, the cumulative evaporation of soil moisture were reduced by 29.61%, 27.49%, 37.87%, 65.85%, and 54.58% for SC, DB, S1D1, S2D1, and S1D2, respectively; the straw mulching and deep burial mode could reduce the soil evaporation intensity more effectively than the single-layer straw mulching mode: the mean soil evaporation rates of CK, SC, DB, S1D1, S2D1 and S1D2 after 45 days of evaporation were 1.27 mm/day, 0.90 mm/day, 0.92 mm/day, 0.80 mm/day, 0.43 mm/day, and 0.58 mm/day; various straw mulching techniques could inhibit the accumulation of salts in the surface soil and effectively regulate the distribution of salts in the soil profile, among which the straw mulching and deep burial mode had the best effect of salinity suppression: after 30 days of evaporation, the re-salinization levels of the 0–40 cm soil layer of SC, DB, S1D1, S2D1, and S1D2 were reduced by 66.78%, 43.08%, 33.95%, 92.04% and 45.94% compared with that in the CK, respectively; there was a significant positive correlation between cumulative evaporation of soil moisture and cumulative soil salinity, which implied that cumulative soil salinity increased with the increase in cumulative evaporation of soil moisture. The results of the field experiment justified the results of the indoor soil column test: after four months of evaporation, the field moisture contents of CK, SC, DB, S1D1, S2D1, and S1D2 in the 0–20 cm soil layer were 14.77%, 3.51%, 15.10%, 15.26%, 18.73%, and 2.94%, respectively; during the experimental period, the salt inhibition rate of SC, DB, S1D1, S2D1 and S1D2 in 0–20 cm soil layer were 35.46%, 44.76%, 50.98%, 54.80% and 37.30%, respectively. Therefore, in a comprehensive view, S2D1 treatment had the best effect of salt and vapor suppression on saline soil. This study is of great significance for the resource utilization of straw waste, the improvement of water utilization and efficiency, and the management of soil salinization.

1. Introduction

Soil salinity is a major challenge to land resource utilization and agricultural productivity worldwide [1]. It is estimated that approximately 1.1 × 10⁹ hectares (ha) of land globally suffer from soil salinity [2], posing a significant threat to agricultural output, soil health, and food security [3]. Particularly in China, there are over 3.6 × 10⁷ ha of salty soils that, with the right amelioration, have a substantial potential for use in agriculture. China has up to 1.01 × 10⁶ ha of coastal saline soils, with the Yellow River Delta serving as a representative area. This region constitutes a relatively concentrated zone of saline soils in the country, encompassing 254,200 ha and accounting for about 42.3% of the total available area within the delta [4,5]. In this area, coastal saline land comprises more than 70% of the total landmass [6]. As soil salinization advances, it poses a growing threat to ecological balance and hampers sustainable development. The detrimental effects of soil salinization include diminished fertility, decreased microbial activity, and compromised soil structure, all of which significantly impede food production and agricultural progress [7]. According to the basic tenet that “salt follows water and water follows salt”, water-salt transfer in soil generally follows these two directions; therefore, a variety of factors, such as precipitation, soil texture, groundwater, and temperature, can affect how salty a soil is [8]. Therefore, it is crucial to properly manage soil water evaporation, reduce salt accumulation, and improve the soil’s physical and chemical qualities in order to increase soil water usage in the salty soils of the Yellow River Delta.
Artificial capillary barriers are natural barriers to soil water movement under unsaturated conditions and, when properly designed and installed, can improve crop water use efficiency [9]. It has been demonstrated that mulching with various materials can decrease soil water evaporation, increase the amount of stored soil water that is available for plants, and reduce salt buildup in the soil [10]. According to Yin et al. [11], ground cover can effectively reduce soil water evaporation while concurrently impeding salt accumulation on the surface. Straw is the most common organic mulch material in almost all climatic zones [12] and, when applied in the field, can improve soil water utilization by reducing soil evaporation and keeping soil temperatures in the right range for crop growth [13]. Carson et al. [14] discovered that mulching with crop residues resulted in a 10–20% increase in water use efficiency. A study conducted by Zhou et al. [15] revealed that straw mulching not only improved soil moisture retention and soil structure but also suppressed weed growth. According to a study written by Yang et al. [16] the utilization of 4–6 t/ha of straw mulch has been found to significantly improve soil physical conditions in tropical regions. This includes the protection of the topsoil. Based on field experiments, Huang et al. [17] found that straw mulch placed on the soil surface provides shade, reduces nonproductive water evaporation, and increases available water capacity. This efficiently prevents soil water evaporation and salt surface aggregation, which enhances the physical and chemical characteristics of the soil and increases the efficiency of soil water usage [18].
Deep incorporation of straw into the soil can enhance soil organic matter content, water holding capacity, and agroecological water use efficiency, thus ensuring stable crop yield while optimizing water and salt distribution in the tillage layer and promoting salt leaching [19]. Zhong et al. [20] demonstrated that the cumulative evaporation from the straw-amended treatment was only 36.9% to 49.79% of that from the homogeneous soils during soil evaporation. The distribution of soil moisture and salinity is substantially impacted by the way straw is incorporated. According to Wanfeng Zhan et al. [21], placing the straw layer at a depth of 35–40 cm increased soil water retention capacity by 17.1% and salt leaching rate by 7.6% on average. Based on field study results, Zhao et al. [22] added a straw layer improved salt leaching and reduced salt buildup around crop roots. Additional advantages of using deep straw include lowering soil pH, reducing particle density, and im-proving plant emergence, according to other researchers [23]. Furthermore, the thorough integration of straw into the soil can enhance the content of soil organic matter, thereby ensuring consistent crop yields [24]. This practice also facilitates the deceleration of water infiltration, as well as the optimization of water and salt distribution and soil structure within the tillage layer [25]. The integration of straw mulching and deep incorporation of soil strata substantially enhanced soil moisture at a depth of 0–40 cm and markedly diminished salinity in the surface layer (0–20 cm). This amalgamation could potentially exemplify the optimal field management approach for crop cultivation on saline soils.
Although the effects of surface straw mulching and deep burial of straw layers on soil water content and salinity have been widely studied, there is little information on the interactive effects of these factors. Based on previous studies, this study proposed the straw mulching and deep burial model as a method for saline soils improvement, aiming to make the effect of evapotranspiration and salinity suppression on saline soils better, in order to improve the efficiency of saline soils improvement by returning straw to the field. The impacts of various straw mulching techniques on water and salt dynamics in saline soils were examined through laboratory soil column simulation experiments. Additionally, this study analyzed soil water and salt transport patterns under different treatments during the soil leaching and evaporation phases. The research further aimed to identify the most effective straw mulching methods for reducing evapotranspiration and suppressing salinity, ultimately enhancing water use efficiency and promoting the implementation of straw mulching technology for the improvement of saline lands.

2. Materials and Methods

2.1. The Soil Column Test

2.1.1. Test Materials

The soils for this experiment came from the Bohai Farm (37°79′ N, 118°63′ E) in Dongying Province, China. According to Kottek et al. [26], the region has a warm-temperate continental monsoon climate with mean annual evapotranspiration, precipitation, and air temperature readings of approximately 1982 mm, 552 mm, and 12 °C, respectively. Table 1 lists the major physicochemical characteristics of the soil before the experiment.

2.1.2. Test Setup

The experiment was conducted at the experimental station of the College of Resources and Environment, Shandong Agricultural University. This study utilized polyvinyl chloride (PVC) pipes to establish a 100 cm soil column with a 30 cm diameter for analyzing soil ecological processes. In order to ensure smooth infiltration of the soil water flow, a 10 cm layer of fine sand was first positioned at the bottom of the column. Subsequently, the bottom of the soil column was sealed with gauze and positioned in a plastic basin containing a 10 g/L saline solution to simulate the groundwater environment. Finally, based on the soil density of the test soil of about 1400 kg/m3, fill the soil layer by layer and tamp it down, each time filling about 5 kg, tamping about 5 cm thickness, the previous tamping and then filling the next layer until the top. The detailed experimental setup is illustrated in Figure 1.

2.1.3. Treatments

The maize straw used in this study was gathered from cornfields, dried by air, and then chopped into 2–3 cm lengths. The collected straw was then mixed with saline-alkali soil and loaded into soil columns for analysis as illustrated in Figure 1. The experimental design consisted of six treatments: surface-covered straw (SC), straw buried at 40 cm below soil surface (DB), a 1:1 ratio of soil surface cover to the amount of straw buried 40 cm below the soil surface (S1D1), a 2:1 ratio of soil surface cover to the amount of straw buried 40 cm below the soil surface (S2D1), a 1:2 ratio of soil surface cover to the amount of straw buried 40 cm below the soil surface (S1D2), and a control group without straw mulching (CK). The amount of straw mulched was 1800 g/m², and each treatment was replicated three times.
To minimize the impact of external factors such as rainfall on the experiment, the soil columns were placed inside a greenhouse. To ensure a stable brackish groundwater environment at the bottom of the soil column, a solution containing 10 g/L of brackish was introduced into the plastic basin placed at the base of the column during the entire duration of the experiment.

2.1.4. Sample Collection and Determination

At the commencement of the experiment, a total of 200 mm of distilled water was employed to leach the salt at a constant rate. Subsequently, once all the water had infiltrated, soil samples were collected auger from the soil column’s surface at four distinct depths: 0–20 cm, 20–40 cm, 40–60 cm, and 60–80 cm. These were then analyzed to determine the soil’s salt content. After the beginning of the test, the empty PVC pipe was set as a control to synchronize the determination of the evaporation intensity of the water surface during the test, and the soil column was weighed every 5 days, and the difference between the two times before and after was used to calculate the evaporation of soil moisture; at the same time, samples were taken from the soil column every 10 days, and the sampling positions were 0–20 cm; 20–40 cm, 40–60 cm, and 60–80 cm from the soil surface for the determination of the soil Salinity. During the experiment, a saline solution with a concentration of 10 g/L was periodically introduced into the plastic basin placed at the base of the soil column. This was done to ensure a consistently stable saline environment at the lower section of the soil column.

Determination of Soil Moisture Content (Drying Method)

Fresh soil samples were placed in aluminum boxes and weighed using an analytical balance with a precision of 0.01 g. The boxes were then opened and placed in an ovens to 105 °C for 12 h. After removal from the oven, the boxes were covered and allowed to cool to room temperature in aiccator, which took approximately 30 min. The samples were then weighed immediately.
The moisture content of the soil samples was calculated using the following formula: Please change the word to
Moisture   content   % = ( mass   of   aluminum   box   and   soil   sample   before   drying mass   of   aluminum   box   and   soil   sample   after   drying ) ( mass   of   aluminum   box   and   soil   sample   after   drying mass   of   drying   empty   aluminum   box ) × 100

Determination of Soil Salinity (Residue Drying-Mass Method)

The soil samples were air-dried, ground, and sieved through a 2 mm sieve. The soil solution was then leached using a soil-water ratio of 1:5. A certain amount of the soil leachate was drawn into a porcelain evaporating dish and evaporated on a water bath. The organic matter was oxidized using hydrogen peroxide and then dried in an oven at a temperature of 105–110 °C. The dried residue was weighed to determine its mass.
The soil salt content was calculated using the following formula:

2.2. The Microzone Test

2.2.1. Study Area and Site Characterization

From February 2023 to June 2023, the field experiment was carried out at the Bohai Farm in Dongying Province, China (37°79′ N, 118°63′ E). Warm-temperate continental monsoon is the classification for the climate in the region. The four seasons in a year are also distinguished clearly in the area. Approximately 1982 mm, 552 mm, and 12 °C, respectively, are its mean annual evapotranspiration, precipitation, and temperature. The three main crops are cotton (Gossypium hirsutum), wheat (Triticum aestivum), and maize (Zea mays L.). Tidal soil that had been salted served as the experimental soil, and Table 2 displays typical soil characteristics.
Soil   salt   content   ( g kg ) = drying   residue   mass drying   soil   sample   mass     ×   1000

2.2.2. Treatments

The experiment was designed with six treatments: surface-covered straw (SC), straw buried at 40 cm below soil surface (DB), a 1:1 ratio of soil surface cover to the amount of straw buried 40 cm below the soil surface (S1D1), a 2:1 ratio of soil surface cover to the amount of straw buried 40 cm below the soil surface (S2D1), a 1:2 ratio of soil surface cover to the amount of straw buried 40 cm below the soil surface (S1D2), and the control (CK) was covered with straw, the amount of straw returned to the field was 18 t/hm2, and each treatment was replicated three times. The micro-areas were constructed in February 2023, with each plot measuring 2 m × 2 m = 4 m2, for a total of 18 plots. The plots were firstly trenching and deep excavation around the plots to 1 m from the ground surface, and then blocked with a double-layer plastic sheet to ensure the independence between the micro-areas, and the intermediate gaps were filled with soil. Before burying the straw, the soil in the micro-area was first taken out with a shovel according to the soil layers of 0–20 cm and 20–40 cm in turn, and placed separately, and then the threshed and broken rice straw was evenly laid at a depth of 40 cm from the soil surface, and finally the excavated soil was backfilled layer by layer according to the original level and compacted. The straw compartment treatment was completed in one go and no further operations were carried out thereafter. In order to ensure the consistency of the test base, the soil layer 0–40 cm of the CK treatment was also dug out and backfilled.

2.2.3. Sample Collection and Determination

To initiate the soil samples were collected during the months of March, April, May, and June 2023 at depths ranging 20 cm, 20 to 40 cm, 40 to 60 cm, and 60 to 80 cm. The soil moisture content was promptly determined upon the samples’ retrieval to the laboratory, followed by the subsequent drying of the soil to evaluate its salinity. The calculation procedure remains consistent with that outlined in Section 2.1.4.

2.3. Data Analysis

In this study, data were systematically organized and compiled using Microsoft Excel for further analysis. Subsequently, the data were processed and evaluated using the statistical software, SPSS version 22.0 (SPSS Inc., Chicago, IL, USA), to investigate the relationship between soil water evaporation and soil salinity. Furthermore, Origin 2019b (Origin Lab, Northampton, MA, USA) was employed for graphical representation of the correlation and to examine the fitting parameters of cumulative soil evaporation as a function of time. The comprehensive analysis of the data allowed for a deeper understanding of the soil evaporation processes and their connection with soil salinity, contributing to the field of soil ecology.

3. Results

3.1. Effect of Different Treatments on Soil Water and Salt Transport in Soil Columns

3.1.1. Soil Water Evaporation Analysis

Figure 2 illustrates the temporal variation in mean daily soil evaporation under distinct straw mulching treatments. The daily evaporation rates of soil moisture for the five different straw mulching techniques (SC, DB, S1D1, S2D1, and S1D2) and the control treatment (CK) exhibited a decreasing trend over time, with varying magnitudes. Within 5 days after the initiation of the experiment, evaporation from the soil surface was primarily facilitated by the lower layer of water through capillary conductive water. The control treatment exhibited a larger and significantly higher average daily evaporation compared to the other treatments. be attributed to the exposed soil surface in the control treatment, which led to a faster exchange between the soil surface and atmosphere, resulting in increased daily evaporation. However, this larger daily evaporation also caused a significant issue of salinity epimetry, leading to the formation of a salt crust on the soil surface. Consequently, the evaporation of water was inhibited, causing a decrease in the average daily evaporation of the control treatment over time. Nevertheless, it remained significantly higher than that of the other treatments. Among these treatments, all five demonstrated varying levels of reduction in evaporation compared to CK. The suppressive effect of each treatment on soil moisture evaporation became apparent on the fifth day post-application, with the mean daily soil evaporation rates of SC, DB, S1D1, S2D1, and S1D2 decreasing by 27.82%, 56.39%, 60.53%, 70.68%, and 63.91% relative to CK, respectively. The average daily evaporation of SC treatment was less than that of CK treatment in the first 5 days of the experiment, probably because the soil capillary of SC treatment was continuous, and the water could rise to the soil surface with the help of the capillary force, but the capillary barrier formed by covering the soil surface with straw was effective in attenuating the vertical evaporation of the soil water. The average daily evapotranspiration of the DB treatment was 56.39% lower than that of the CK treatment because the buried straw layer under the soil surface cut off the continuity of soil capillaries, formed an upward obstacle to soil capillary water, and weakened evapotranspiration capacity. The S1D1, S2D1, and S1D2 treatments had the most obvious effect of inhibiting soil moisture evaporation due to the dual effect of straw surface mulching and burying the straw layer. The minimum average daily evaporation rate (0.31 mm) was observed in the S2D1 treatment on the 45th day of the experiment, representing a 67.02% reduction compared to the CK treatment at the same timepoint.
Figure 3 illustrates the effect of various straw mulching strategies on the cumulative evaporation of soil moisture based on experimental results. According to the investigation, the cumulative soil moisture evaporation under several straw mulching techniques (SC, DB, S1D1, S2D1, and S1D2) showed a trend toward rising over time. When compared to the cumulative evaporation measured using the five mulching techniques, the cumulative evaporation of the control (CK) was much higher. After 45 days of continuous evaporation, the cumulative evaporation from the soil columns of SC, DB, S1D1, S2D1, and S1D2 were 40.28 mm, 41.48 mm, 35.55 mm, 19.54 mm, and 25.99 mm, respectively. These values correspond to a reduction in cumulative evaporation by 29.61%, 27.49%, 37.87%, 65.85%, and 54.58% compared to the control treatment. This implies that the straw mulching and deep burial treatments (S1D1, S2D1, and S1D2) were more effective in inhibiting soil water evaporation than the single-layer straw mulching treatments (SC, DB), with S2D1 exhibiting the strongest inhibition. Nonetheless, during the initial phase of the experiment, the cumulative evapotranspiration observed in the DB soil column was found to be lower than in SC soil column. As time progressed, the cumulative evapotranspiration in the DB soil column gradually exceeded that of the SC soil column. This may be due to the fact that during the evaporation process, water gradually starts to be stored inside the straw, and some of the water in it diffuses upward in the form of water vapor, while the water available for recharge to the evaporated soil surface from the subsoil layer of the SC soil column is relatively low.
Figure 4 presents the evapotranspiration (ET) inhibition rates of various straw mulching patterns after 45 days. The single-layer straw mulching treatments (SC and DB) exhibited soil moisture evaporation inhibition rates of 29.61% and 27.49%, respectively, indicating that the depth of straw placement had a minimal effect on soil moisture evaporation inhibition rate. In contrast, the straw mulching and deep burial model showed varying results: S2D1 had the highest evaporation inhibition effect (65.85%), followed by S1D2 (54.58%), while S1D1 had a relatively weak effect (37.87%). The lowest inhibition effect observed in S1D1 was still 27.89% higher than that of SC, demonstrating that straw mulching and deep burial model is more effective in reducing soil evaporation compared to single-layer mulching. The data also suggest that when the amount of surface straw mulch remains constant, a greater amount of deep straw mulch leads to a higher evaporation inhibition rate and improved inhibition effect. Conversely, when the amount of deep straw mulch is kept the same, increasing the quantity of surface straw mulch results in a higher evaporation inhibition rate and enhanced inhibition effect.
Figure 5 presents the mean soil evaporation rates of various straw mulching treatments after a 45-day evaporation period. Based on the data in Figure 5, the soil evaporation rates for CK, SC, DB, S1D1, S2D1, and S1D2 treatments were 1.27 mm/day, 0.90 mm/day, 0.92 mm/day, 0.80 mm/day, 0.43 mm/day, and 0.58 mm/day, respectively, throughout the evaporation process. All straw mulching treatments had lower soil evaporation rates than the control (CK). Notably, the S2D1 treatment exhibited the lowest soil evaporation rate, which was 66.14% lower than that of the CK treatment. According to this finding, the S2D1 treatment appeared to have the most inhibitory impact on soil water evaporation, making it more suited to improving soil water utilization.

3.1.2. Changes in Salt Dynamics

Figure 6 illustrates the impact of various straw mulching techniques on the salinity levels within the soil profile at distinct time intervals. As depicted in Figure 6, an initial application of 200 mm of fresh water was introduced to the soil column at the commencement of the experiment. Consequently, the salts present in the surface layer of the soil were leached into the sublayer following the irrigation process. Before and after the drenching, the soil salinity content of different treatments changed significantly, especially on the soil salinity in the 0–40 cm soil layer of each treatment. As demonstrated in Figure 6, the salts in the soil transitioned from the upper stratum to the lower stratum post-leaching across all experimental treatments. However, discrepancies were observed in both the transport rates and content between the treatments. To gain insight into the specific alterations in salt concentrations before and after leaching for each soil treatment, the leaching efficiency within the 0–40 cm soil layer was computed for each treatment. The leaching efficiency values were found to be 68.45%, 70.22%, 55.98%, 83.31%, 68.46%, and 76.30% for the CK, SC, DB, S1D1, S2D1, and S1D2 treatments, respectively. The leaching efficiency of the SC and S2D1 soil columns were nearly identical to that of the CK, while the leaching efficiency of the DB soil column exhibited a 18.21% reduction relative to the CK. Conversely, the leaching efficiency of the S1D1 and S1D2 soil columns increased by 21.71% and 11.47% compared to the CK, respectively. The S1D1 treatment exhibited highest desalination rate, indicating its superiority in improving water utilization. Additionally, Figure 6 illustrates ability of various treatments to suppress salt accumulation on the soil surface. As time elapses, the distinct impacts of different straw mul techniques on soil salt accumulation become increasingly apparent. After 30 days of evaporation, the re-salinization levels of each 0–40 cm soil column were 225.67%, 74.98%, 128.45%, 149.06%, 17.96%, and 121.99%, respectively. The salt reversion rates of single-layer straw mulch treatment (SC, DB) and straw mulching and deep burial treatments (S1D1, S2D1, and S1D2) were lower than that of the CK, indicating that straw mulching is advantageous for promoting soil salt management, salt suppression, and enhancing water utilization in the soil. The salt reversion rate of the S2D1 soil column was the lowest, at 92.04% less than that of CK, signifying that it is the most effective treatment for inhibiting soil salt reversion. This is because the soil in the straw compartment retains more water during evaporation, resulting a lower concentration of dissolved salts. The evaporation of water within the compartment increases the water potential difference between compartment and the soil layer, thereby inhibiting the upward movement of water and salts. This mechanism helps reduce salt accumulation on the soil surface. Additionally, the straw covering the soil surface effectively suppresses vertical evaporation of soil moisture, leading to better inhibition of soil moisture evaporation and salt accumulation.

3.1.3. Correlation Analysis

The movement of water and salt in soil exhibits distinct patterns and characteristics, with water movement exerting a predominant and determining influence. In this study, an analysis was conducted to examine the correlation between the cumulative evapotranspiration of soil moisture and soil salinity during the experimental period. The results of this analysis are presented in Table 3. As indicated in Table 3, the correlation coefficient between cumulative evaporation of soil moisture and cumulative soil salinity is 0.848, signifying a strong positive correlation. This suggests that an increase in the evaporation of soil moisture is associated with a corresponding increase in cumulative soil salinity.

3.2. Effects of Different Treatments on Water-Salt Distribution in Agricultural Soils

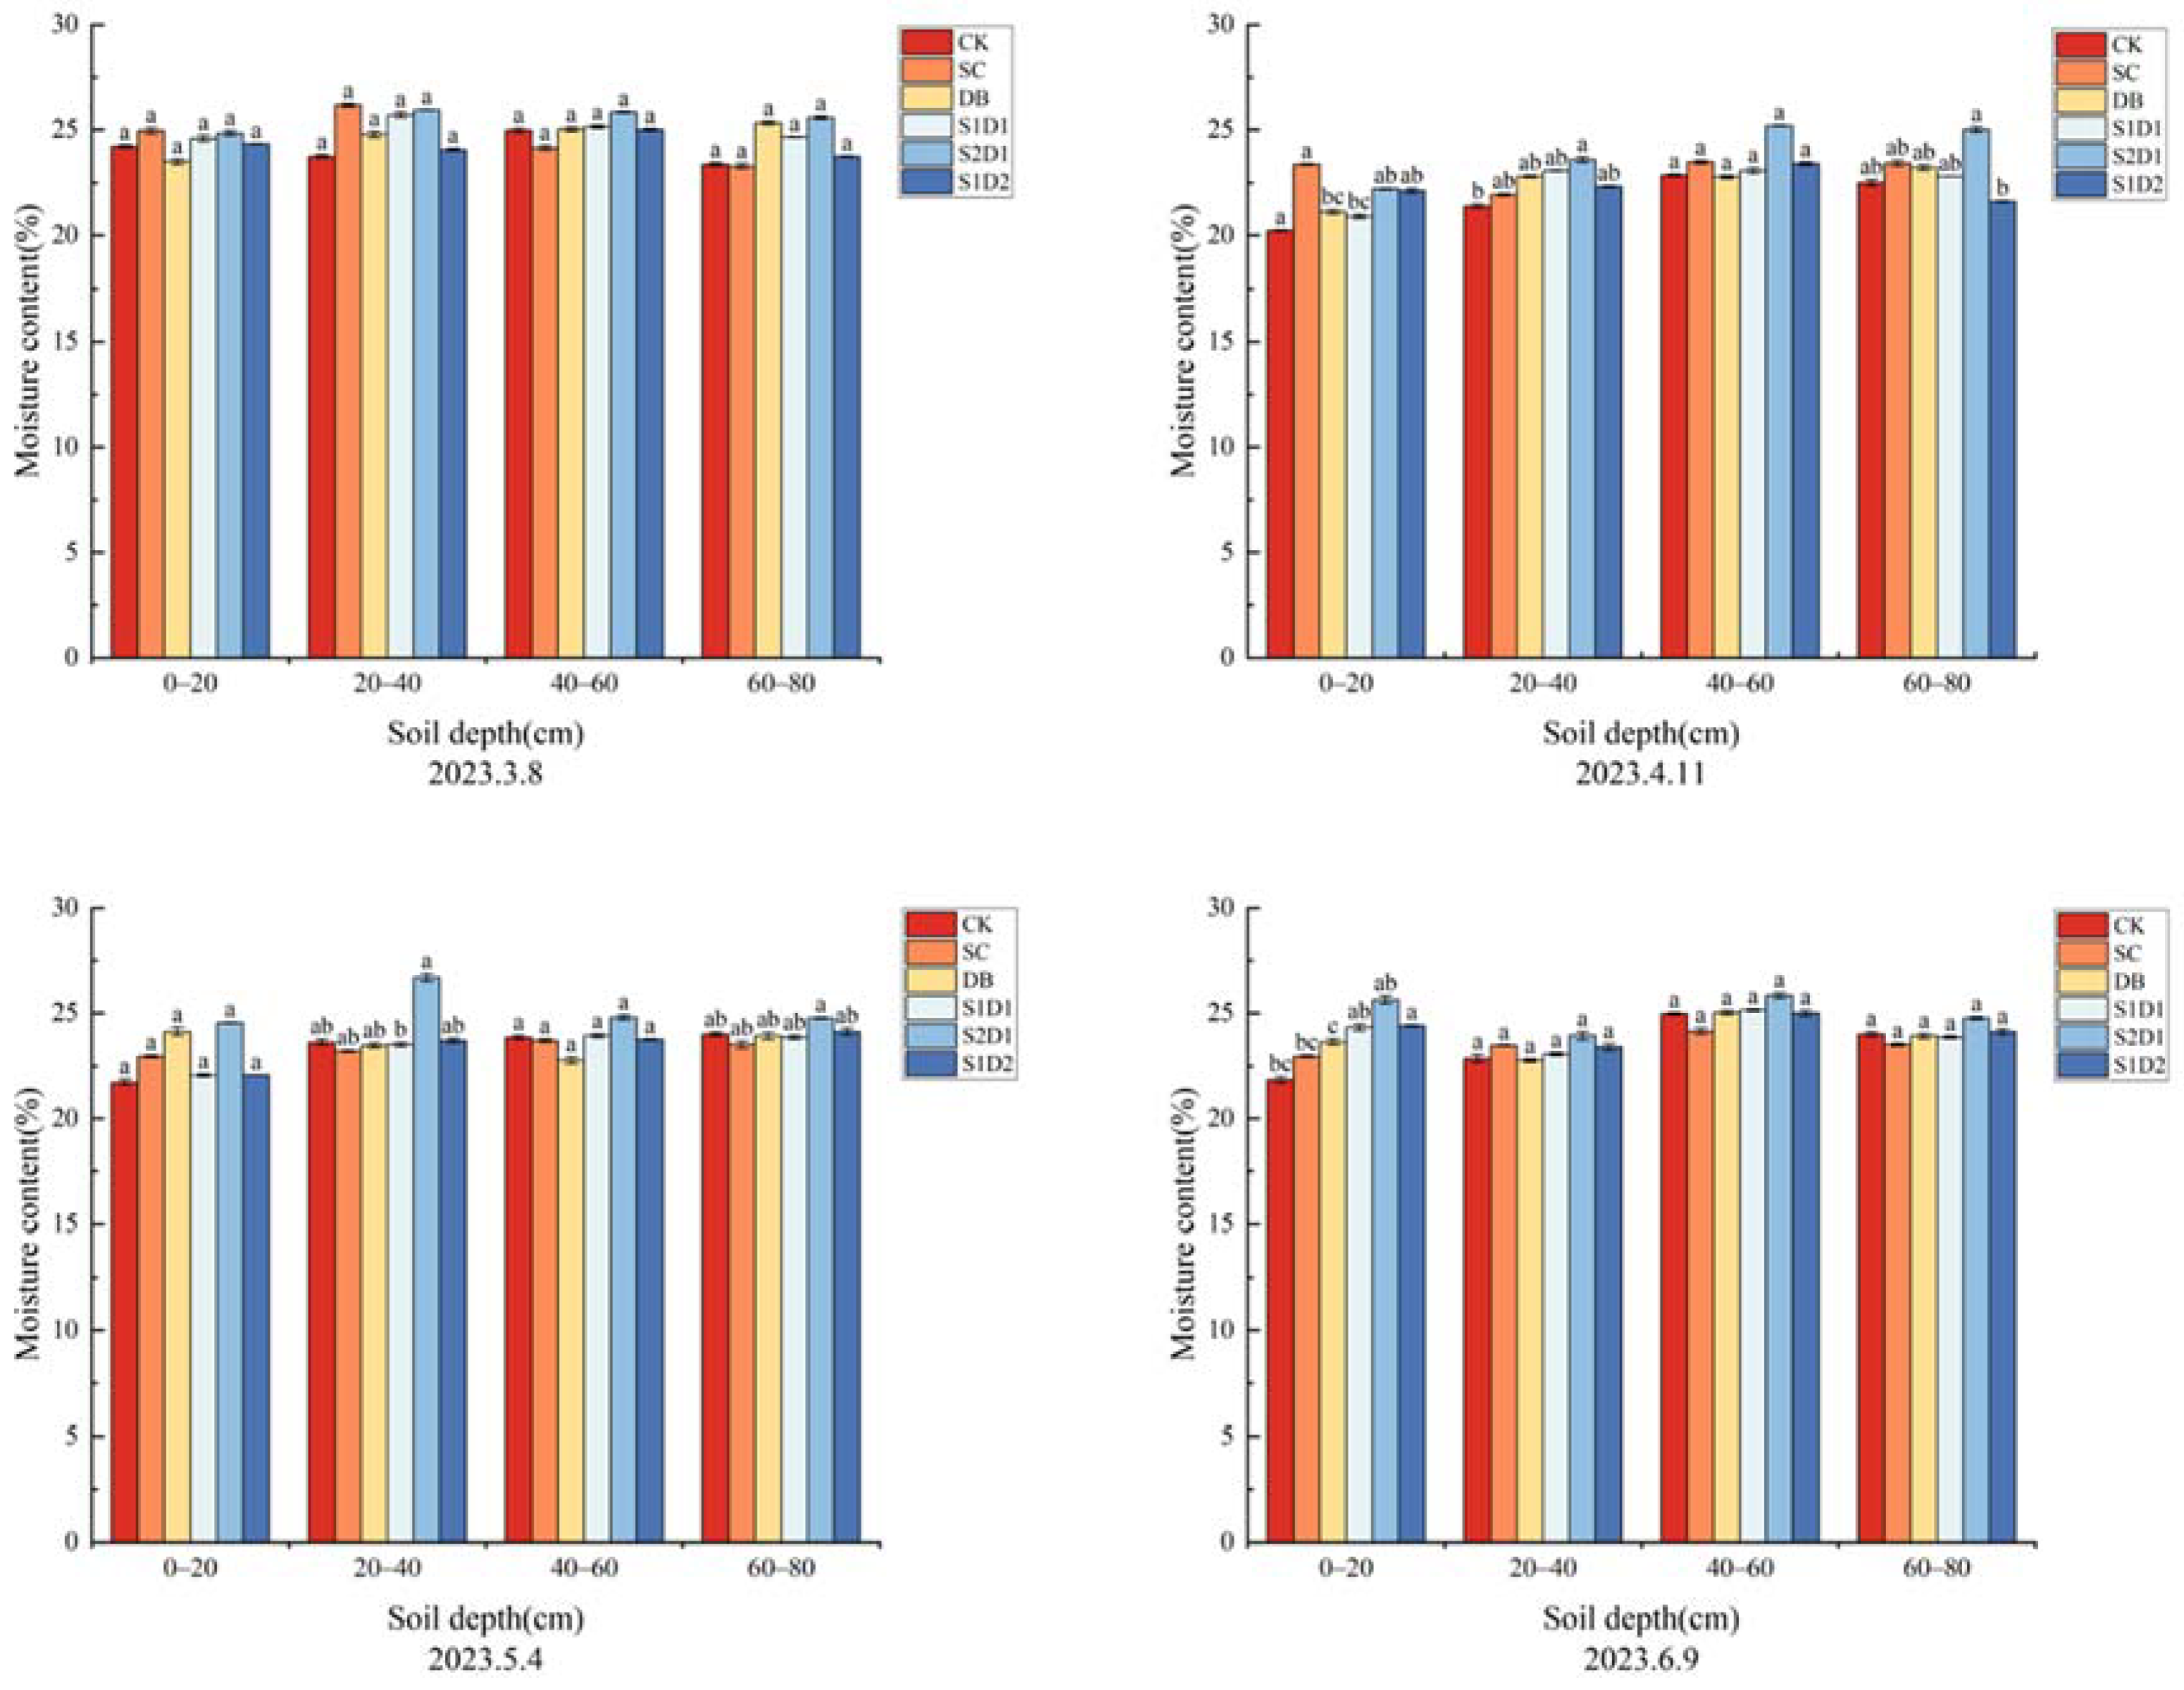
3.2.1. Moisture Distribution Characteristics

During the experimental period, soil moisture content was mainly affected by straw treatment, rainfall, evaporation and temperature, and the distribution of soil moisture in the farmland was complicated. Figure 7 shows the changes in soil profile moisture content in different periods of each treatment. The graphic illustrates the stark changes in soil profile moisture content between various treatments as a result of various moisture retention effects. On 8 March 2023, the soil layers of different treatments exhibited no significant differences, which can be attributed to the influence of rainfall factors. The DB treatment potentially enhanced soil moisture content within the 20–80 cm soil layer, while the SC treatment demonstrated a relatively higher soil moisture content in the 0–40 cm soil layer in comparison to CK. Both S1D1 and S2D1 treatments contributed to an increase in soil moisture content across all soil horizons, with the S2D1 treatment displaying a higher moisture content in all soil horizons. In contrast, the soil moisture content in all soil horizons of the S1D2 treatment did not exhibit a significant deviation from that of CK. On 11 April 2023, the soil surface moisture content demonstrated considerable variation among treatments due to a decrease in rainfall. The SC treatment raised soil moisture content in the 0–20 cm soil layer by 16% as compared to CK, and all other soil layers had greater moisture contents than CK but no appreciable difference. The DB and S1D1 treatments increased soil moisture content in all soil layers, but none of them had significant differences. The S2D1 treatment also increased soil moisture content in all soil layers, especially in the 40–80 cm layer, which had significant differences compared to CK. The S1D2 treatment exhibited no significant deviation from the control (CK) concerning soil moisture content across all soil horizons. On 4 May 2023, the SC treatment led to an increase soil moisture content within the 0–20 cm soil layer, albeit without a significant difference. In com-parison to CK, the DB treatment demonstrated a relatively higher soil moisture content in the 0–20 cm soil layer, while the moisture content in the 20–80 cm layer was lower than that of CK. Both the S1D1 and S1D2 treatments showed no significant disparities in soil moisture content across all layers when compared to CK. The S2D1 treatment exhibited the most effective water retention, displaying higher water content in all soil layers. On 9 June 2023, a significant difference was observed in the soil moisture content of each treatment within the 0–20 cm soil layer. The S2D1 treatment possessed the highest moisture content, which was 17.4% greater than that of CK. No other displayed a significant difference from CK in the remaining soil layers.
It is clear that the various treatments can each have a certain effect on water retention. The S2D1 treatment has the best effect on water and moisture retention and can significantly inhibit the evaporation and dissipation of soil moisture, which is consistent with the findings of the indoor soil column test.

3.2.2. Salt Distribution Characteristics

Figure 8 depicts the average soil salinity distribution across the various experimental treatments. since can be seen in the image, there was a clear salt epimerization phenomenon since all treatments exhibited greater salinity in the 0–20 cm soil layer. The S1D2 had the lowest salinity, indicating that it had the best impact of blocking the return of salts to the soil top layer. Among them, the soil salinity of CK was the most noticeable, and the average soil salinity reached 12.82 g/kg. The soil salinity in the 20–40 cm soil layer was found to be the lowest among all treatments, with the average soil salinity of S2D1 being the lowest at 4.07 g/kg. This suggests that S2D1 effectively mitigated soil salinity in the till layer. Subsequently, the average soil salinity of each treatment increased in the 40–80 cm soil layer, although it remained lower than the salinity observed in the 0–20 cm soil layer. The lowest soil salinity was found in DB, although there was no discernible difference between it and S2D1, showing that both of them could successfully prevent salt from returning to the deep soil.
Table 4 shows the salt inhibition rate of different treatments compared with CK during the experimental period. According to the table, there are notable differences between the salt suppression effects of various treatments in various soil layers, and the overall pattern is that as soil layers deepen, the salt inhibition rates of the treatments gradually drop and the salt suppression effects weaken. In the 0–20 cm soil layer, the salt suppression effect of each treatment was the best, and the salt inhibition rate of SC, DB, S1D1, S2D1, and S1D2 were 35.46%, 44.76%, 50.98%, 54.80%, and 37.30%, respectively, of which the salt inhibition rate of S2D1 was the highest, which indicated that the S2D1 could effectively inhibit the return of salt to the surface layer of the soil. In the soil layer of 20–40 cm, the salt inhibition rate of S2D1 remained the highest at 49.47%, suggesting that S2D1 can substantially decrease the salt content in the soil tillage layer and mitigate the detrimental impact of saline soil on crops. In the 40–80 cm soil layer, the salt inhibition rate of DB was the highest, followed by the salt suppression effect of straw mulching combined with deep burial treatments (S1D1, S2D1, and S1D2). However, there was no significant difference in the salt suppression effect of SC when compared with CK. This indicates that deep buried straw can significantly inhibit the salt return to the deep soil layer, and surface mulched straw can only inhibit the salt return to the surface layer of the soil, and the inhibition effect on the deep soil salinity is poor.
In conclusion, the different treatments had the effect of salt control and salt suppression on all soil layers, among which the salt suppression effect of S2D1 treatment on 0–40 cm soil layer was particularly significant, which was consistent with the results of the soil column test. In the 40–80 cm soil layer, the salt inhibition rate of each treatment decreased, among which DB treatment had the best salt suppression effect on deep soil, and the salt inhibition rate of S2D1 treatment was lower than that of DB but there was no significant difference.

4. Discussion

4.1. Effect on Soil Water Evaporation

Soil moisture evaporation is the main pathway for water vapor to enter the atmosphere from the soil surface and an important cause of inefficient soil moisture loss. In soil, the capillary barrier effect refers to the retardation of water flow within soil pores, which can be attributed to intermolecular forces between liquid and solid particles. This phenomenon can be observed when the ground surface is covered with straw or when straw is deeply, resulting in the formation of a capillary barrier that slows the rate of water evaporation from the soil. Straw mulching has been recognized as an effective soil moisture conservation technique. Studies conducted by Yusefi et al. [27,28] have demonstrated that straw mulching can increase the water content of the topsoil layer (0–5 cm) regardless of soil type, and that the rate of evapotranspiration from straw mulched treated soil was reduced by 26% as compared to bare soil. Straw as a surface mulch blocked the direct communication between soil moisture and the atmosphere, which acted as a capillary barrier to the upward movement of soil surface water, and also increased light reflectance and heat transfer, which lowered the temperature of the soil surface layer, and consequently reduced the evaporation of soil water [29]. The cumulative evapotranspiration of SC in this study was reduced by 29.61% compared with CK after 45 days of evapotranspiration, which was consistent with the experimental results of Liu et al. [30] and Chen et al. [31]. Considering the restricted impact of surface straw mulch on the transport of water in deep soil, several scholars have suggested suppressing soil water evaporation by incorporating the straw layer at a greater depth, thereby enhancing the overall utilization of soil water. Rasool et al. [32] demonstrated that by positioning a straw layer at a depth of 25 cm beneath the soil surface, the water storage efficiency within the 0–25 cm soil stratum could reach 89–91% after a period of six days. of water into the soil is predominantly associated with the configuration of soil pores. Notably, the pore structure within the straw layer exhibits non-homogeneity, which contrasts with the characteristics of homogeneous soil [33]. The discontinuity between straw and soil causes it to become more difficult for soil moisture to reach the heat required for evaporation, and the rate of evaporative loss of soil moisture is consequently slowed down. In this experiment, it was discovered that burying a layer of straw 40 cm below the surface might considerably improve the soil’s ability to store water, and similar results were confirmed by Lu et al. [34]. Different straw mulching or deep burial techniques can inhibit soil water evaporation to different degrees. The implementation of the straw mulching and deep burial method, which entails deep burying and surface straw mulching, has been proposed by several studies as a way to considerably improve the soil water content and water storage at the conclusion of infiltration. Zhou et al. [35] showed that the effect of straw mulching and deep burial mode was better than that of single-layer straw mulching, and there was a certain correlation between straw mulching and deep burial treatment and soil water evaporation, and the most advantageous method to inhibit the evaporation of soil water was to bury the upper layer at a depth of 80 mm, and to bury the lower layer at a depth of 300 mm. This technique not only prevents the evaporation of water from the deeper soil layers, but also decreases the loss of water from the surface layers, increasing the amount of water present in all soil levels. The technique not only mitigates water evaporation from deeper soil layers but also reduces water loss from surface layers, thereby enhancing the water content across all soil strata. The soil column experiments conducted in this study revealed that after 45 days of evapotranspiration, the soil moisture evapotranspiration inhibition rates for SC, DB, S1D1, S2D1, and S1D2 treatments were 29.3%, 27.82%, 37.46%, 65.89%, and 54.54%, respectively. These findings suggest that the straw mulching and deep burial treatment is more effective in curbing soil water evaporation compared to single-layer straw mulching. Among the treatments, the S2D1 treatment (a 2:1 ratio of soil surface cover to the amount of straw buried 40 cm below the soil surface) exhibited the most efficient suppression of evapotranspiration, which corroborated the results of the field experiment. Consequently, it can be inferred that the straw mulching and deep burial model significantly enhances soil water retention and evaporation inhibition, thereby contributing to improved soil water use efficiency within the soil ecology framework.

4.2. Effect Soil Salinity Dynamics

Soil moisture movement is the main driver of soil salt movement, soil moisture is at the same time an important carrier in the process of salt migration, soil salts move with soil moisture movement [36]. The experimental findings of Yang et al. [37] emonstrated that incorporating straw, biochar, and peat as salt-blocking materials could influence the distribution of water salts in coastal saline soils. Among these materials, the straw layer exhibited the most effective control of salt accumulation. Guo et al. [38] revealed that soil tillage salinity was higher when the straw layer was buried 25 cm below the surface compared to when the soil tillage was covered with surface straw. This suggests that the deep straw burial treatment’s capacity to inhibit salinity was less efficient than that of the surface straw mulching treatment. This was also confirmed in the present study where after 30 days of evapotranspiration, the soil salinity in SC tillage decreased by 60.17% compared to CK, whereas the soil salinity in DB tillage increased by 5.57% compared to CK. Based on this phenomenon, Li [39] pointed out that while deep straw mulching attenuated the upward movement of soil salts below the compartment, it did not inhibit the aggregation of soil salts above the straw layer to the soil surface, and that the accumulation of soil salts in the surface layer was probably due to the surface aggregation of salts in the soil above the compartment and not to the supply of water from the capillary support at the bottom. Zhang et al. [40] found that deep straw compartments with a mulch cover were more effective in reducing soil salinity and had a long-lasting effect. However, surface mulching is prone to pollute the soil, so double-layer mulching with straw may be a better way to improve saline soil. Based on the aforementioned observations, a novel approach involving straw mulching combined with deep burial was proposed. By placing straw beneath the soil surface and incorporating surface mulching, this method can effectively mitigate salt accumulation. Specifically, it can impede the upward movement of salts from deeper soil layers and prevent the concentration of salts in the upper soil strata, thereby significantly reducing the overall salt content within the tillage layer.
In the present research, a combination of surface mulching and deep burial methodologies was utilized to alleviate the transportation of salts from the deeper soil strata to the upper layers, as well as to diminish the accumulation of salts on the soil surface. Our experimental results revealed that during the leaching and infiltration stage, the leaching rates in the 0–40 cm soil layer for CK, SC, DB, S1D1, S2D1, and S1D2 treatments were 68.45%, 70.22%, 55.98%, 83.31%, 68.46%, and 76.30%, respectively. Compared to the CK, the SC treatment (surface-covered straw) did not show significant changes, while the straw mulching and deep burial treatments (S1D1, S2D1, and S1D2) were more effective in enhancing soil dewatering and desalination rates. Among these treatments, S1D1 treatment (a 1:1 ratio of soil surface cover to the amount of straw buried 40 cm below the soil surface) exhibited the highest desalinization rate, with a 14.83% increase in soil desalinization compared to the CK. During the water evaporation phase, the soil resalinization rate at 0–40 cm depth in the S2D1 treatment (a 2:1 ratio of soil surface cover to the amount of straw buried 40 cm below the soil surface) was 207.71% lower than that in the CK. In the field experiment, the S2D1 treatment had the best effect on controlling salinity in the soil surface layer and soil tillage layer, with salt suppression rates of 54.80% and 49.47% in the 0–20 cm and 20–40 cm soil layers. This result indicates that S2D1 treatment is more effective at inhibiting soil resalinization and promoting soil salinity control and salt suppression. Consequently, employing straw mulching and deep burial model may prove to be a superior method for improving saline soils.

4.3. Soil Water and Salt Transport Patterns

In accordance with the principle of “Salt comes with water, salt goes with water”, the migration of soil salinity is closely associated with water movement. As soil water evaporates, the salts within the soil progressively migrate to the surface, leading to a continuous build-up of salinity in each soil layer, a phenomenon referred to as salt return. Throughout the evaporation process, salts originating from deeper soil strata migrate towards the surface in conjunction with soil moisture. Subsequently, upon evaporation, these salts accumulate on the soil surface. Conversely, during precipitation or irrigation events, water infiltration facilitates the downward transportation of salts to the deeper soil layers [41]. In the present research, the association between soil moisture and salinity under straw mulch treatments was investigated by establishing a correlation between the cumulative evaporation of soil moisture and the cumulative salinity of the soil. The findings demonstrated a strong correlation between the migration of soil salinity and moisture movement. Both water and salt transport exhibit distinct characteristics and follow specific patterns, with the accumulation of soil salts increasing as soil water evaporation escalates. Given that water serves as a natural solvent for soil salts, dissolving and carrying various mineral salts during transport, water movement plays a pivotal role in the soil water-salt transport process. These results suggest that implementing straw mulching as a means to suppress soil water evaporation is a viable strategy for reducing salt accumulation in the soil.

5. Conclusions

The effects of different straw mulching methods on soil evapotranspiration properties and salt distribution were preliminarily investigated through indoor soil column simulation tests. The primary findings of these investigations are summarized below.
(1)
Straw mulching has been demonstrated to be efficient in mitigating soil water evaporation, with varying degrees of effectiveness observed in different treatment methods. The hierarchy of evaporation suppression, in descending order of efficacy, is as follows: S2D1 > S1D2 > S1D1 > SC > DB. Straw mulching and deep burial model exhibits superior performance in reducing soil water evaporation compared to single-layer straw mulching. Specifically, S2D1 treatment (a 2:1 ratio of soil surface cover to the amount of straw buried 40 cm below the soil surface) had the most obvious effect and the cumulative evaporation of soil moisture was 65.85% lower than that of CK (the control treatment), which had the best effect of inhibiting evaporation.
(2)
In the drenching and infiltration stage, S1D1 treatment (a 1:1 ratio of soil surface cover to the amount of straw buried 40 cm below the soil surface) had the best drenching effect and the highest desalination rate. In the evaporation phase, S2D1 treatment had much lower salt levels than CK, indicating that the S2D1 treatment had the best inhibition effect on soil salinity reversal.
(3)
There was a significant positive correlation between the cumulative evaporation of soil water and cumulative soil salinity, which meant that the cumulative soil salinity increased with the cumulative evaporation of soil water.
The effects of different straw mulching methods on soil water and salt transport in agricultural soils were investigated through a microzone test as a validation test, and the results were consistent with the soil column test, with specific conclusions as follows.
(1)
Different treatments could reduce the evaporation of soil moisture, but the moisture retention effect and duration were different. Among them, the S2D1 treatment maintained high soil water content in all soil layers during all periods of the experiment, which could obviously inhibit the evaporation and dissipation of soil moisture.
(2)
Different treatments can inhibit soil salinity return to a certain extent in all soil layers. All treatments could keep the soil salinity in the 0–40 cm soil layer at a lower level, among which the S2D1 treatment had the best effect on salt suppression in the surface soil. In the 40–80 cm soil layer, the best soil salinity suppression was DB treatment (straw buried at 40 cm below soil surface).

Author Contributions

M.L. and W.W. curated the data, analyzed the results, and wrote the original draft; W.C. and E.C. conceived the experiment, administrated the project, and carried out supervision; M.L., C.Y., W.C., Y.W., Z.W., X.W. and W.Z. conducted the experiment. All authors reviewed the final manuscript. All authors have read and agreed to the published version of the manuscript.

Funding

This research was funded by Key Projects of the National Natural Science Foundation of China and Shandong Joint Fund (Grant No. U1906221); the Shandong Provincial Natural Science Foundation of China (ZR2022MC114); Shandong Province’s Major Science and Technology Innovation Project (Grant No. 2021CXGC010704, 2022CXGC20707); Key Research and Development Program of Shandong Province (Techniques for Construction of Multi-scale Water Network and River-lake System Ecological Restoration in the Yellow River Basin).

Institutional Review Board Statement

Not applicable.

Informed Consent Statement

Not applicable.

Data Availability Statement

All data generated or analyzed during this study are included in this article.

Conflicts of Interest

The authors declare no conflict of interest.

References

  1. Fei, Y.; She, D.; Gao, L.; Xin, P. Micro-CT Assessment on the Soil Structure and Hydraulic Characteristics of Saline/Sodic Soils Subjected to Short-Term Amendment. Soil Tillage Res. 2019, 193, 59–70. [Google Scholar] [CrossRef]
  2. Hopmans, J.W.; Qureshi, A.; Kisekka, I.; Munns, R.; Grattan, S.; Rengasamy, P.; Ben-Gal, A.; Assouline, S.; Javaux, M.; Minhas, P.; et al. Critical Knowledge Gaps and Research Priorities in Global Soil Salinity. Adv. Agron. 2021, 169, 1–191. [Google Scholar]
  3. Sahab, S.; Suhani, I.; Srivastava, V.; Chauhan, P.S.; Singh, R.P.; Prasad, V. Potential Risk Assessment of Soil Salinity to Agroecosystem Sustainability: Current Status and Management Strategies. Sci. Total Environ. 2021, 764, 144164. [Google Scholar] [CrossRef] [PubMed]
  4. Yang, H.; Xia, J.; Cui, Q.; Liu, J.; Wei, S.; Feng, L.; Dong, K. Effects of Different Tamarix Chinensis-Grass Patterns on the Soil Quality of Coastal Saline Soil in the Yellow River Delta, China. Sci. Total Environ. 2021, 772, 145501. [Google Scholar] [CrossRef]
  5. Cui, Q.; Xia, J.; Yang, H.; Liu, J.; Shao, P. Biochar and Effective Microorganisms Promote Sesbania Cannabina Growth and Soil Quality in the Coastal Saline-Alkali Soil of the Yellow River Delta, China. Sci. Total Environ. 2021, 756, 143801. [Google Scholar] [CrossRef]
  6. Li, K.; Li, Q.; Geng, Y.; Liu, C. An Evaluation of the Effects of Microstructural Characteristics and Frost Heave on the Remediation of Saline-alkali Soils in the Yellow River Delta, China. Land Degrad. Dev. 2021, 32, 1325–1337. [Google Scholar] [CrossRef]
  7. Jiang, S.-Q.; Yu, Y.-N.; Gao, R.-W.; Wang, H.; Zhang, J.; Li, R.; Long, X.-H.; Shen, Q.-R.; Chen, W.; Cai, F. High-Throughput Absolute Quantification Sequencing Reveals the Effect of Different Fertilizer Applications on Bacterial Community in a Tomato Cultivated Coastal Saline Soil. Sci. Total Environ. 2019, 687, 601–609. [Google Scholar] [CrossRef]
  8. Du, X.J.; Yan, B.W.; Xu, K.; Wang, S.Y.; Gao, Z.D.; Ren, X.Q.; Hu, S.W.; Yun, W.J. Advances in the Theory and Modeling of Water and Salt Transport in Saline Lands. Chin. J. Soil Sci. 2021, 52, 713–721. [Google Scholar]
  9. Sao, D.; Saito, H.; Kato, T.; Šimunek, J. Numerical Analysis of Soil Water Dynamics during Spinach Cultivation in a Soil Column with an Artificial Capillary Barrier under Different Irrigation Managements. Water 2021, 13, 2176. [Google Scholar] [CrossRef]
  10. Deng, Y.P.; Sun, C.T.; Sun, Y.S.; Zhang, J.P.; Mi, Z.R.; Mao, W.B.; Sun, Y.X. Water and Salt Distribution and Evaporation Characteristics of Coastal Saline Soils under Straw Mulching Conditions. China Rural Water Hydropower 2021, 2021, 128–133. [Google Scholar]
  11. Yin, Z.R.; Ke, Y.; Gui, L.G.; Zhang, Y.H.; Wang, P. Effect of Sand Cover on Water and Salt Transport and Growth and Yield of Lycium Barbarum in Saline Soils. Acta Agric. Boreali-Occident. Sin. 2021, 30, 1382–1393. [Google Scholar]
  12. Yang, R.; Zhou, C.; Zhu, J.; Pan, Y.; Sun, J.; Zhang, Z. Effects of Biochar Application on Phreatic Water Evaporation and Water-Salt Distribution in Coastal Saline Soil. J. Plant Nutr. 2019, 42, 1243–1253. [Google Scholar] [CrossRef]
  13. Fan, L.L.; Shi, H.B.; Li, R.P.; Miao, Q.F.; Wang, S.N.; Pei, W.W. Effect of straw mulch on salt migration and water use efficiency of maize by furrow irrigation. Trans. Chin. Soc. Agric. Mach. 2021, 52, 283–293+319. [Google Scholar]
  14. Dann, C.E.; Cabrera, M.; Thapa, R.; Mirsky, S.; Tully, K.; Reberg-Horton, C.; Hitchcock, R.; Morari, F. Modeling Water Potential of Cover Crop Residues on the Soil Surface. Ecol. Model. 2021, 459, 109708. [Google Scholar] [CrossRef]
  15. Zhou, Y.L.; Wu, H.M.; Zhou, Y.D. Effects of different methods of short-term straw return on soil structure and water content. Arid Zone Stud. 2022, 39, 502–509. [Google Scholar]
  16. Yang, Y.; Liu, H.; Wu, J.; Zhang, S.; Gao, C.; Zhang, S.; Tang, D.W.S. Soil Enzyme Activities, Soil Physical Properties, Photosynthetic Physical Characteristics and Water Use of Winter Wheat after Long-Term Straw Mulch and Organic Fertilizer Application. Front. Plant Sci. 2023, 14, 1186376. [Google Scholar] [CrossRef]
  17. Huang, X.; Wang, H.; Zhang, M.; Horn, R.; Ren, T. Soil Water Retention Dynamics in a Mollisol during a Maize Growing Season under Contrasting Tillage Systems. Soil Tillage Res. 2021, 209, 104953. [Google Scholar] [CrossRef]
  18. Fu, Q.; Yan, P.; Li, T.; Cui, S.; Peng, L. Effects of Straw Mulching on Soil Evaporation during the Soil Thawing Period in a Cold Region in Northeastern China. J. Earth Syst. Sci. 2018, 127, 33. [Google Scholar] [CrossRef]
  19. Alkharabsheh, H.M.; Seleiman, M.F.; Hewedy, O.A.; Battaglia, M.L.; Jalal, R.S.; Alhammad, B.A.; Schillaci, C.; Ali, N.; Al-Doss, A. Field Crop Responses and Management Strategies to Mitigate Soil Salinity in Modern Agriculture: A Review. Agronomy 2021, 11, 2299. [Google Scholar] [CrossRef]
  20. Zhong, Z.Y.; Zhang, Y.; Feng, Z.Y.; Huang, C.Z.; Wang, J. Experimental Study on Simulation of Soil Water and Salt Transport by Combining Deep Burial of Straw with Mulching. J. Irrig. Drain. 2019, 38, 25–30. [Google Scholar]
  21. Zhang, W.F.; Yang, S.Q.; Jin, Y.H.; Lou, S.; Liu, P. Effect of Irrigation Water under Deep Straw Burial on Soil Water and Salt Distribution and Summer Corn Yield. Trans. Chin. Soc. Agric. Mach. 2021, 52, 228–237. [Google Scholar]
  22. Zhao, Y.; Pang, H.; Wang, J.; Huo, L.; Li, Y. Effects of Straw Mulch and Buried Straw on Soil Moisture and Salinity in Relation to Sunflower Growth and Yield. Field Crops Res. 2014, 161, 16–25. [Google Scholar] [CrossRef]
  23. Zhu, D.Y.; Xu, Z.Q.; Han, M.; Zhu, W.S.; Li, Z.C.; Hu, Y.H.; Wang, J.L. Effect of Different Material Covers on the Physicochemical Properties of Saline Soils in the Yellow River Delta. J. Qingdao Agric.Univ. 2022, 39, 79–84. [Google Scholar]
  24. Chang, F.-D.; Wang, X.-Q.; Song, J.-S.; Zhang, H.-Y.; Yu, R.; Wang, J.; Liu, J.; Wang, S.; Ji, H.-J.; Li, Y.-Y. Maize Straw Application as an Interlayer Improves Organic Carbon and Total Nitrogen Concentrations in the Soil Profile: A Four-Year Experiment in a Saline Soil. J. Integr. Agric. 2023, 22, 1870–1882. [Google Scholar] [CrossRef]
  25. Li, S.; Yao, Y.; Yang, M.; Zhang, Y.; Zhang, S.; Shen, T.; Ding, F.; Li, Z.; Liu, W.; Cui, J.; et al. Effects of Different Amendments on Aggregate Stability and Microbial Communities of Coastal Saline–Alkali Soil in the Yellow River Delta. Land Degrad. Dev. 2023, 34, 1694–1707. [Google Scholar] [CrossRef]
  26. Kottek, M.; Grieser, J.; Beck, C.; Rudolf, B.; Rubel, F. World Map of the Köppen-Geiger climate classification updated. Meteorol. Z. 2006, 15, 259–263. [Google Scholar] [CrossRef] [PubMed]
  27. Yusefi, A.; Firouzi, A.F.; Aminzadeh, M. The Effects of Shallow Saline Groundwater on Evaporation, Soil Moisture, and Temperature Distribution in the Presence of Straw Mulch. Hydrol. Res. 2020, 51, 720–738. [Google Scholar] [CrossRef]
  28. Zhu, H.H.; Wang, J.C.; Reddy, N.G.; Garg, A.; Cao, D.F.; Liu, X.F.; Shi, B. Monitoring infiltration of capillary barrier with actively heated fibre Bragg gratings. Environ. Geotech. 2022, 40, 2100130. [Google Scholar] [CrossRef]
  29. Zhang, L.; Xu, C.; Yan, W.; Tan, G.; Sun, N.; Zhao, H.; Li, F.; Yu, J.; Meng, X.; Bian, S. Effects of Surface Mulching on Soil Water Temperature, Physiological Characteristics and Yield of Maize. Int. J. Plant Prod. 2023, 17, 283–296. [Google Scholar] [CrossRef]
  30. Liu, Y.Q.; Wang, J.L.; Li, Z.Z. Progress of Research on the Effect of Straw Mulch on Soil Moisture and Erosion. Res. Soil Water Conserv. 2021, 28, 429–436. [Google Scholar]
  31. Chen, J.; Wei, Y.; Zhao, X.; Xue, J.; Xu, S.; Du, Q. Simulation of Soil Water Evaporation during Freeze–Thaw Periods under Different Straw Mulch Thickness Conditions. Water 2020, 12, 2003. [Google Scholar] [CrossRef]
  32. Rasool, G.; Zhang, S.; Wu, F.; Guo, X. Effects of the Buried Straw Layer on Soil Water and Nitrogen Distribution under Different Irrigation Limits. Int. J. Agric. Biol. Eng. 2022, 15, 141–145. [Google Scholar] [CrossRef]
  33. Wang, X.; Yang, K.; Zheng, J. Effect of straw addition on soil infiltration characteristics and model-fitting analysis. Arab. J. Geosci. 2019, 12, 395. [Google Scholar] [CrossRef]
  34. Lu, X.; Li, R.; Shi, H.; Liang, J.; Miao, Q.; Fan, L. Successive simulations of soil water-heat-salt transport in one whole year of agriculture after different mulching treatments and autumn irrigation. Geoderma 2019, 344, 99–107. [Google Scholar] [CrossRef]
  35. Zhou, C.Q.; Zhao, W.J.; Wang, Z.Z.; Xu, J.T. Effect of Double Straw Mulching in Different Layers on Soil Water Evaporation. Water Sav. Irrig. 2019, 3, 30–33. [Google Scholar] [CrossRef]
  36. Sun, B.; Xie, J.C.; Wang, N.; Zhu, J.W.; Zhang, J.L.; Li, C.J. Experimental Study on the Effect of Straw Mulch on Water and Salt in Salinized Soil. Bull. Soil Water Conserv. 2011, 31, 48–51. [Google Scholar]
  37. Yang, M.; Yang, R.; Li, Y.; Pan, Y.; Sun, J.; Zhang, Z. Effects of Different Biomass Materials as a Salt-Isolation Layer on Water and Salt Migration in Coastal Saline Soil. PeerJ 2021, 9, e11766. [Google Scholar] [CrossRef] [PubMed]
  38. Guo, X.P.; Yang, B.; Wang, Z.C.; Chen, S.; Liu, M.H.; Chen, R. Effect of Straw Compartments on Water and Salt Transport in Coastal Saline Soils. J. Irrig. Drain. 2016, 35, 22–27. [Google Scholar]
  39. Li, X.N. Effects of Double Ammoniated Straw Returning on Water and Salt Transport and Maize Growth in Saline Alkali Soil. Water-Sav. Irrig. 2021, 7, 80–83. [Google Scholar] [CrossRef]
  40. Zhang, H.; Pang, H.; Zhao, Y.; Lu, C.; Liu, N.; Zhang, X.; Li, Y. Water and Salt Exchange Flux and Mechanism in a Dry Saline Soil Amended with Buried Straw of Varying Thicknesses. Geoderma 2020, 365, 114213. [Google Scholar] [CrossRef]
  41. Zhou, L.; Su, T.; Zhao, L. Simulation of Water and Salt Transport in Shallow Soil with Different Soil Quality:A Case Study of Jiefangzha Irrigation Area of Inner Mongolia. Water Sav. Irrig. 2019, 2, 91–95. [Google Scholar] [CrossRef]
Figure 1. Testing device for different straw mulching treatments.
Water 15 03227 g001
Figure 2. Diurnal variation in daily evapotranspiration of different straw mulching methods.
Water 15 03227 g002
Figure 3. Variation in cumulative evaporation with time in different straw mulching.
Water 15 03227 g003
Figure 4. The rate of water evaporation inhibition under different straw covering modes. Note: Different lowercase letters indicate that values are significantly different from each other at p ≤ 0.05.
Water 15 03227 g004
Figure 5. The average evaporation intensity under different straw covering modes. Note: Different lowercase letters indicate that values are significantly different from each other at p ≤ 0.05.
Water 15 03227 g005
Figure 6. Different straw mulching on soil salt content in the section effects.
Water 15 03227 g006
Figure 7. Soil water content for different treatments in different periods. Notes: Different lowercase letters indicate that values are significantly different from each other at p ≤ 0.05.
Water 15 03227 g007
Figure 8. Distribution of soil salinity in different treatments. Notes: Different lowercase letters indicate that values are significantly different from each other at p ≤ 0.05.
Water 15 03227 g008
Table 1. Basic properties of soils used in the experiment.
Soil TypeTN
(g/kg)
AP
(mg/kg)
AK
(mg/kg)
SOM
(g/kg)
pHEC
(μs/cm)
SAR
(mmolc L−1)0.5
Total Salt
(g/kg)
Bulk Densit (g/cm3)
salted tidal soil0.9334.14110.879.678.141735.513.16.41.39
Note: TN, total nitrogen; AP, available phosphorus; AK, available potassium; SOM, soil organic matter; EC, electrical conductivity; SAR, sodium adsorption ratio.
Table 2. Basic properties of the field soil at the beginning of the experiment.
Soil DepthTN
(g/kg)
AP
(mg/kg)
AK
(mg/kg)
SOM
(g/kg)
pHEC
(μs/cm)
SAR
(mmolc L−1)0.5
Total Salt
(g/kg)
Bulk Densit (g/cm3)
0–20 cm0.6737.4118.310.418.391764.313.56.131.31
20–40 cm0.5330.283.477.188.361699.512.86.571.41
40–60 cm0.4121.251.156.178.371652.312.16.111.46
60–80 cm0.4922.852.556.778.391667.712.36.291.43
Note: TN, total nitrogen; AP, available phosphorus; AK, available potassium; SOM, soil organic matter; EC, electrical conductivity; SAR, sodium adsorption ratio.
Table 3. Water and salt related analysis.
Cumulative Evaporation (mm)Cumulative Salt Content (g/kg)
Cumulative evaporationPearson correlation10.848 *
Significance (bilateral) 0.033
The sum of square and fork product481.1120.8
Covariance96.2224.16
N66
Cumulative salt contentPearson correlation0.848 *1
Significance (bilateral)0.033
The sum of square and fork product120.842.18
Covariance24.168.436
N66
Note: Significant correlation at the 0.05 level. * represents a sig value of less than 0.05
Table 4. Salt rate of different treatment inhibition during the test period.
Soil DepthSalt Inhibition Rate (%)
SCDBS1D1S2D1S1D2
0–20 cm35.4644.7650.9854.8037.30
20–40 cm17.1443.7941.0349.4733.11
40–60 cm5.06434.5227.0431.2319.85
60–80 cm3.04738.5327.5134.7322.97
Disclaimer/Publisher’s Note: The statements, opinions and data contained in all publications are solely those of the individual author(s) and contributor(s) and not of MDPI and/or the editor(s). MDPI and/or the editor(s) disclaim responsibility for any injury to people or property resulting from any ideas, methods, instructions or products referred to in the content.

