Article

Hydrocarbon Potential and Reservoir Characteristics of Lacustrine Shale: A Case of Lower Jurassic in the Western Qaidam Basin, NW China

1
College of Architecture Engineering, Weifang University, Weifang 261061, China
2
School of Teacher Education, Weifang University, Weifang 261061, China
*
Author to whom correspondence should be addressed.
Water 2023, 15(17), 3104; https://doi.org/10.3390/w15173104
Submission received: 31 July 2023 / Revised: 27 August 2023 / Accepted: 29 August 2023 / Published: 30 August 2023
(This article belongs to the Special Issue Effects of Groundwater and Surface Water on the Natural Geo-Hazards)

Abstract

:
The Lower Jurassic lacustrine shale is well developed in the western Qaidam Basin and characterized by significant thickness and continuous distribution. Previous investigations have indicated its substantial potential as a shale gas resource. Based on experiments of organic carbon content, vitrinite reflectance, rock-eval pyrolysis, X-ray diffraction, and low-temperature nitrogen adsorption, the hydrocarbon potential and reservoir characteristics of Lower Jurassic lacustrine shale in the western Qaidam Basin were systematically analyzed. The results show that the total organic carbon (TOC) content ranges from 1.71% to 4.49%, with an average of 2.98%. The kerogen belongs to type II–III. The vitrinite reflectance (Ro) ranges from 1.05% to 1.95%, with an average of 1.62%, indicating that the kerogen has reached the high thermal maturity stage (gas window). The maximum pyrolysis peak temperature (Tmax) ranges from 408 °C to 580 °C, with an average of 498.38 °C, further supporting the high thermal maturity of the kerogen. The content of brittle minerals, including quartz, feldspar, pyrite, and carbonate, ranges from 21% to 44% (averaging 32.54%), which is comparable to shale minerals found in American Ohio shale. The pore structure of the shale is predominantly characterized by open parallel plate slit pores and inclined slit pores. The pore diameter distribution curve can be divided into two types, including unimodal distribution and bimodal distribution. Micropores and mesopores contribute significantly to the specific surface area, and mesopores account for the highest proportion of pore volume. The thermal evolution degree has a direct impact on pore development of shale reservoirs. The micropore, mesopore, macropore, and total pore volumes of lacustrine shale in the study area show a negative correlation with TOC content, indicating that the organic matter within the shale is probably still in the first pyrolysis stage. However, no significant correlation is observed between pore volume and clay mineral content or between pore volume and brittle mineral content due to the complex interplay of several geological factors. These findings contribute to a better understanding of the lacustrine shale gas resource potential and can guide future exploration and exploitation efforts. In addition, the systematic analysis of reservoir characteristics serves as a foundation for the introduction and exploration of new shale fracturing technologies, which is of great significance for reducing the consumption of water resources and mitigating potential geo-disasters.

1. Introduction

Shale gas, as one unconventional gas resource with self-generation and self-storage, is characterized by vast resources, long gas production periods, and wide distribution. In recent years, shale gas has gained significant attention in the field of energy exploration [1,2,3]. Multi-stage hydraulic fracturing of horizontal wells is an effective technology for shale gas exploitation. The shale gas revolution has transformed the United States from a major natural gas importer to an exporter, profoundly changing the world’s natural gas supply pattern [3]. China and Argentina have also achieved effective development of shale gas resources, resulting in a rapid increase in their shale gas production [3]. Extensive research has been conducted on various aspects of shale oil and gas, including their definition, reservoir characteristics, formation conditions, enrichment mechanisms, and evaluation criteria for sweet spots [4]. China, in particular, possesses abundant shale gas resources, with the geological resources in its major petroliferous basins estimated to be 80.45 × 10¹² m3 and the technically recoverable resources estimated to be 12.85 × 10¹² m3 [4].
Significant progress has been made in the exploration and exploitation of the marine shale gas fields in the Wufeng Formation and Longmaxi Formation in the Sichuan Basin in China. The thermal evolution of these marine shales, from the Wufeng Formation to the Longmaxi Formation, has generally reached a highly mature stage due to the influence of multiple tectonic transformations [5]. Additionally, continental shale has attracted researchers due to its substantial cumulative thickness, diverse organic matter types, and favorable preservation conditions [6]. Continental shales are mainly distributed in Mesozoic and Cenozoic basins, exhibiting bedding fractures and intergranular pores. The matching of multiple types of organic matter with their thermal evolution often results in the coexistence of shale gas and shale oil [7]. Preliminary achievements have been made in the study of continental shale gas in the Ordos Basin, Qaidam Basin, Junggar Basin, and Bohai Bay Basin, but the exploration and exploitation progress of continental shale gas lags behind that of marine shale gas [8,9,10,11]. Continental organic-rich shales are characterized by high clay mineral content, low permeability, and obvious variations in clastic content. Consequently, the exploration and exploitation process encounters major challenges such as uncertain resource scale, an unclear enrichment mechanism, and difficulty in predicting resource distribution [12].
Hydraulic fracturing of shale gas horizontal wells is a complex project that presents various challenges in terms of safety and environmental protection. These challenges include equipment operation, water resource consumption and pollution, air pollution, and potential geo-disasters [13]. Hydraulic fracturing refers to injecting high-pressure water mixed with sand and chemicals into horizontal wells to fracture shales and release shale gas. Each hydraulic fracturing operation requires millions of tons of water, which may trigger geo-disasters such as earthquakes and debris flows when shales are fractured [14]. Extensive seismic monitoring data and scientific analyses have shown that the sharp increase of earthquakes in Oklahoma, USA, is primarily related to wastewater reinjection from shale oil and gas exploitation [15]. Similarly, the sharp increase in earthquakes in Alberta, Canada, is mainly linked to hydraulic fracturing for shale oil and gas exploitation [16]. In the shale oil and gas production area of the Sichuan Basin in China, seismic activity has also increased significantly in recent years [14]. Shale gas exploitation is characterized by large-scale fracturing, interconnected fissures, and industrialized operation, which covers a wide area and has a large impact depth. The exploration and exploitation of shale gas requires numerous boreholes, and in areas with dense boreholes, human activity can easily trigger geo-disasters such as mountain collapse and landslide. Hydraulic fracturing technology induces the formation of multiple fissures, reduces the compressive strength of the shale, and may cause land subsidence.
The Jurassic continental shale is well developed in the Qaidam Basin, which is considered to have good shale gas resource potential [9,17,18,19]. The Jurassic continental shale in the northern Qaidam Basin is primarily developed in lacustrine environments, with individual layers exceeding 100 m in thickness. The total organic carbon (TOC) content is relatively high, typically ranging from 1.24% to 8.6%. The main types of organic matter belong to type II and type II–III, with a moderate degree of thermal evolution in the immature to low maturity stage [9]. In contrast, research on the hydrocarbon potential of lacustrine shale in the western Qaidam Basin remains insufficient. In this study, based on experiments of organic carbon content, vitrinite reflectance, rock-eval pyrolysis, X-ray diffraction, and low temperature nitrogen adsorption, the hydrocarbon potential and reservoir characteristics of Lower Jurassic lacustrine shale in the western Qaidam Basin were systematically analyzed, aiming to provide guidance for further exploration and development of lacustrine shale gas. In addition, the systematic analysis of reservoir characteristics serves as a foundation for the introduction and exploration of new shale fracturing technologies, which is of great significance for reducing the consumption of water resources and mitigating potential geo-disasters.

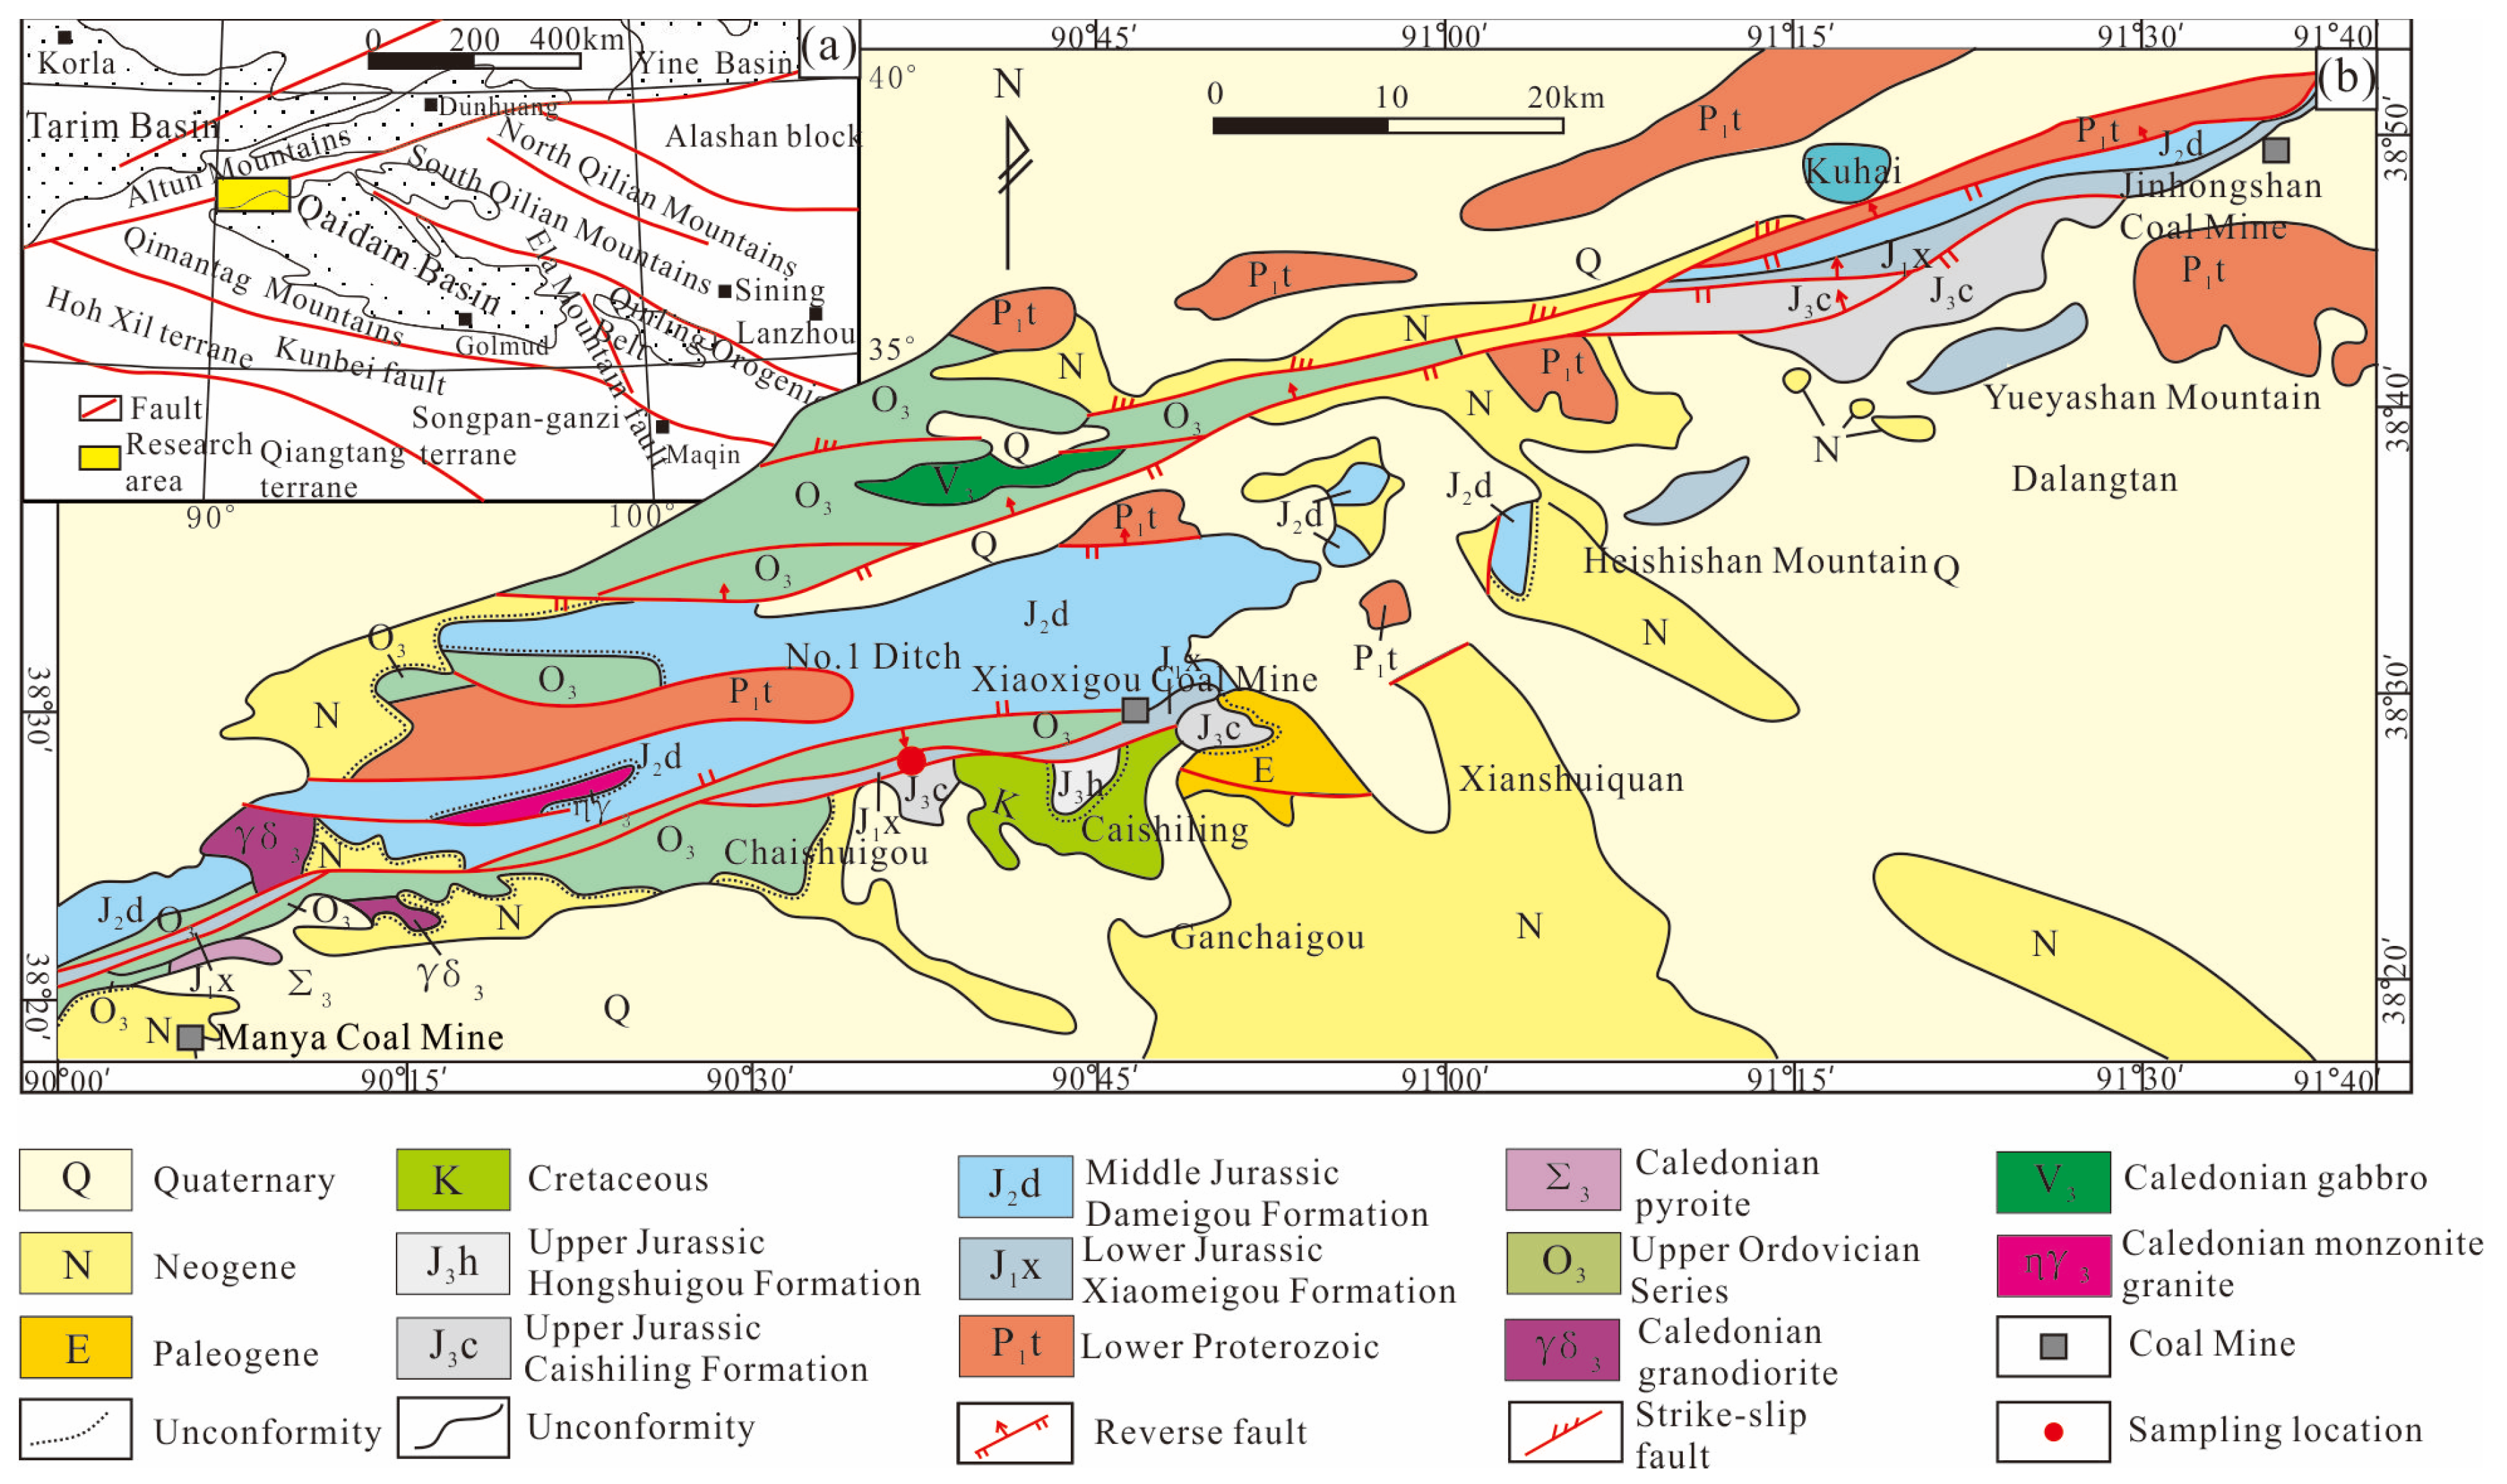
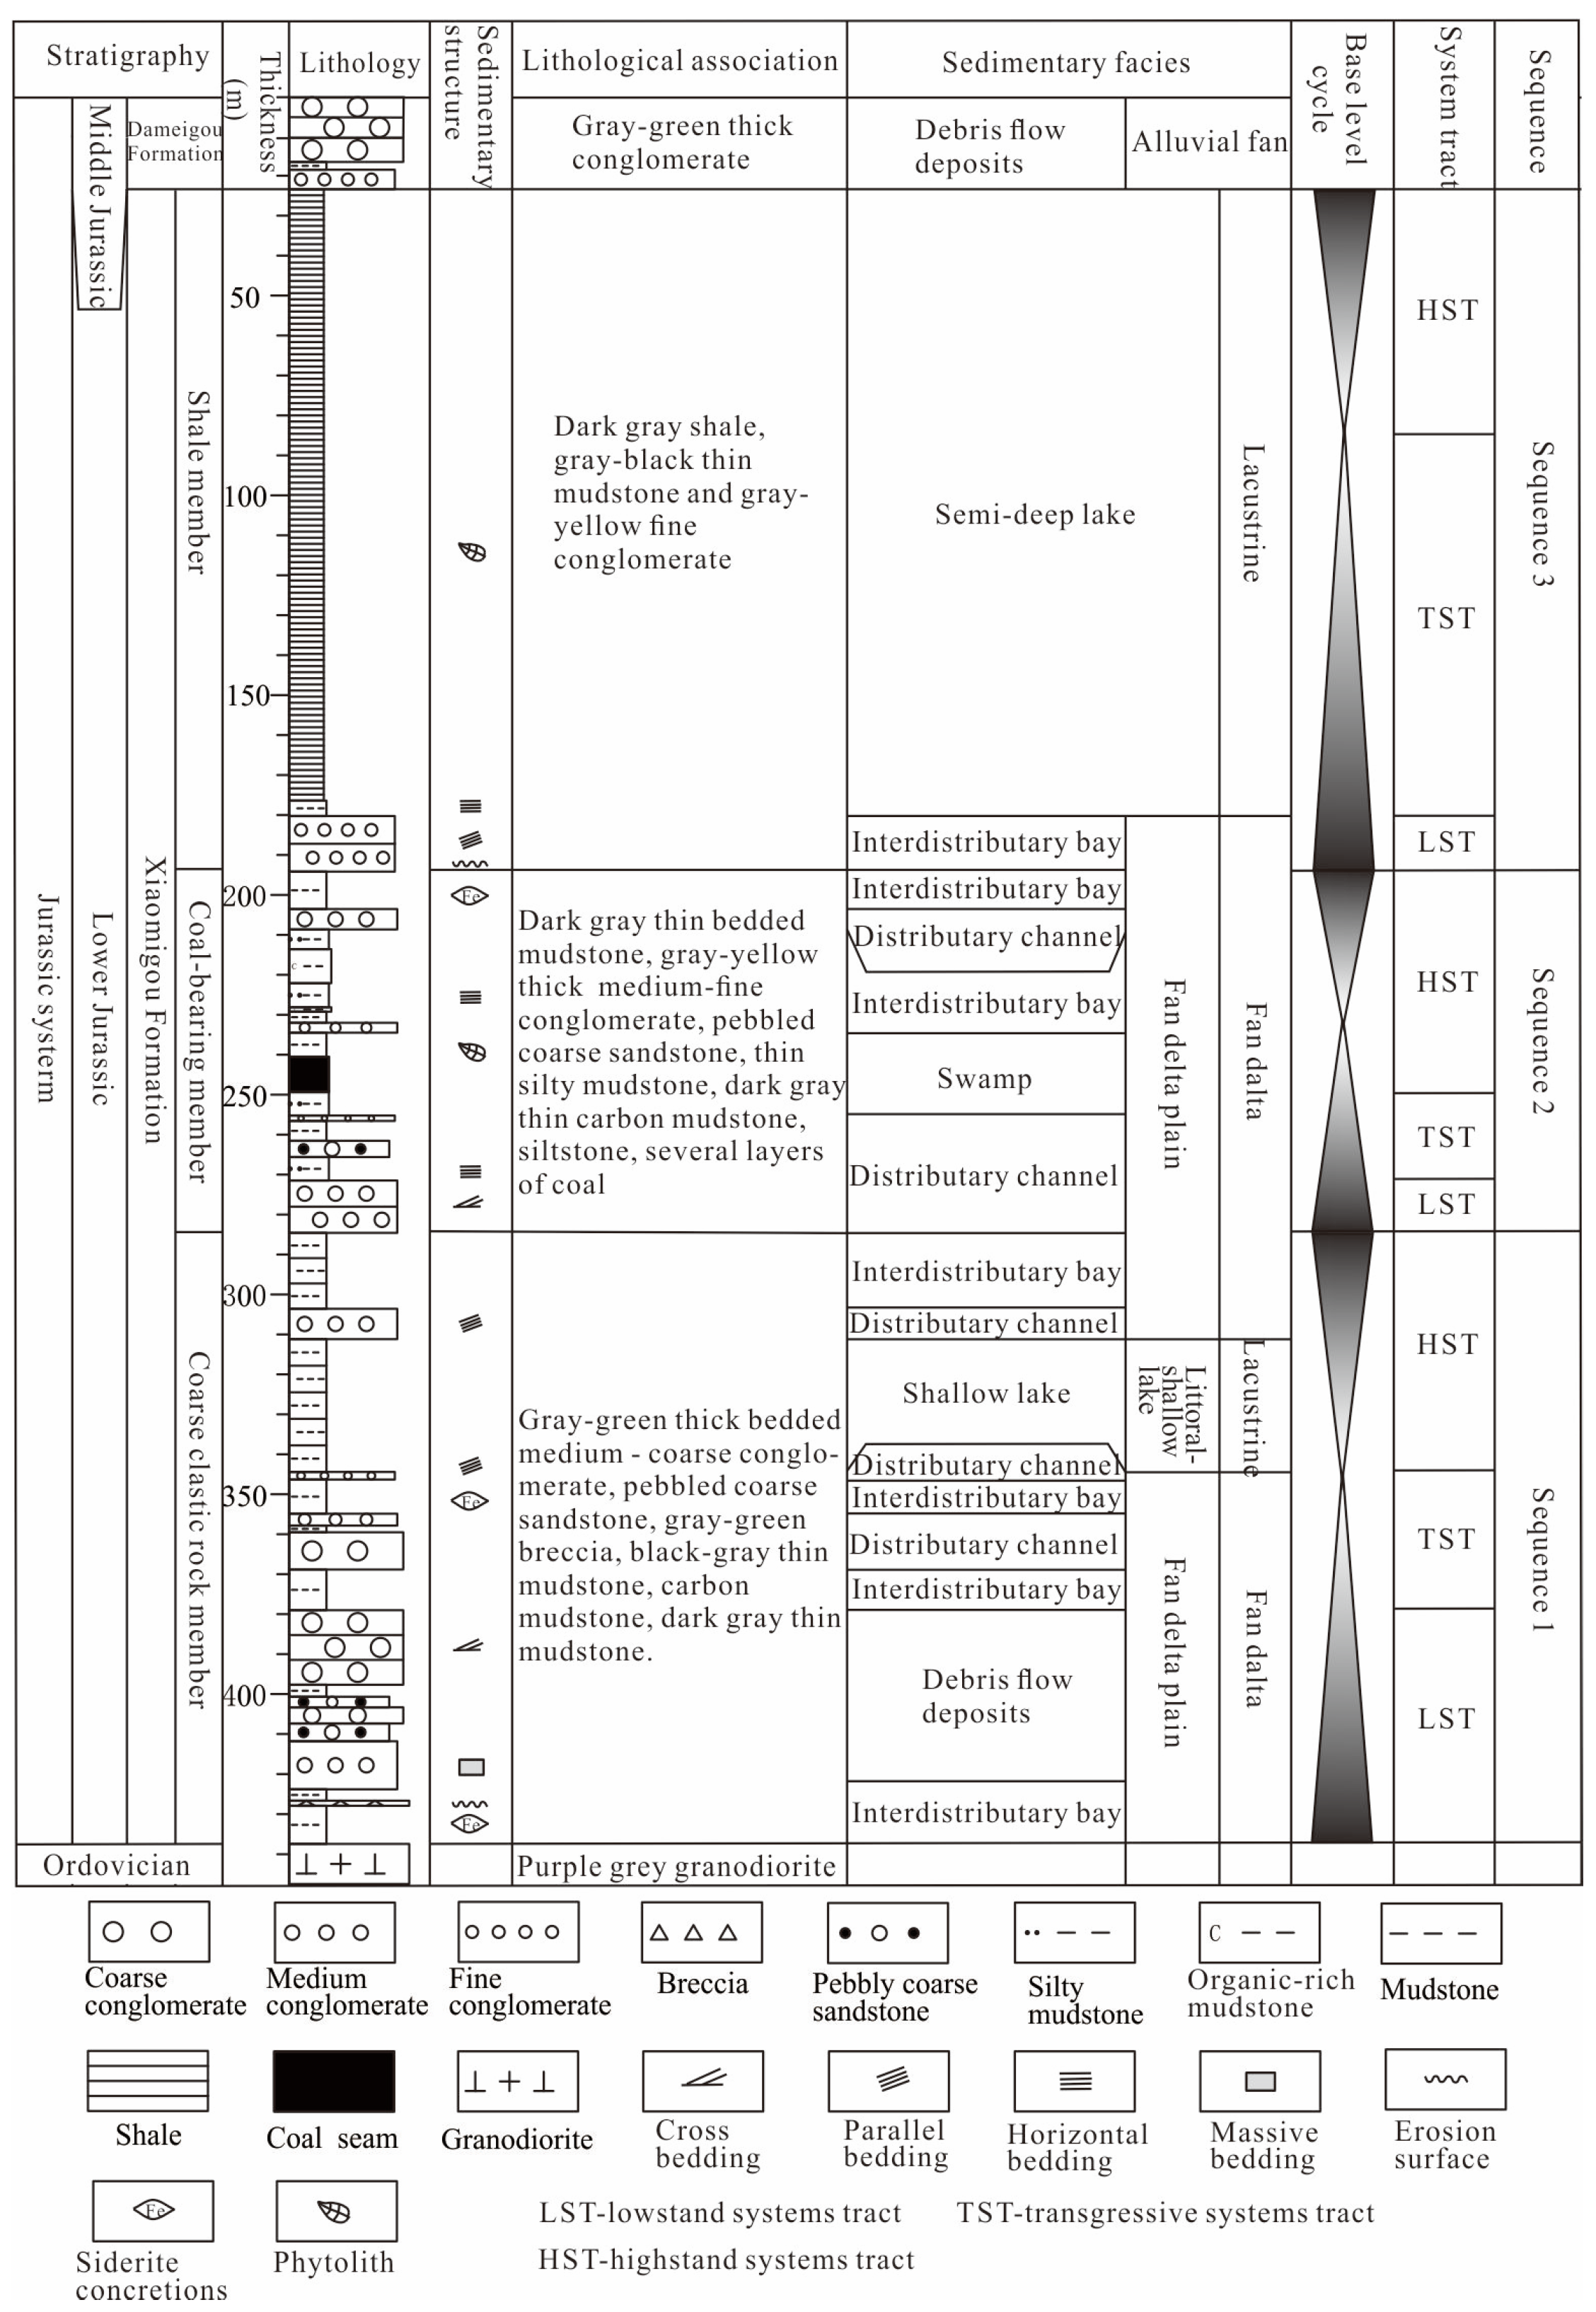
2. Geological Setting

The Qaidam Basin is located at the intersection of the Tethys-Himalayan and the Paleo-Asian tectonic domains [20]. It is geologically isolated from the surrounding tectonic units by a series of faults, and the western Qaidam Basin is adjacent to the Tarim Basin by the Altyn Tagh fault. The Qaidam Basin is a multi-stage tectonic superimposed basin that has evolved into an intracontinental basin since the Triassic. Previous research suggests that the Qaidam Basin was an extensional fault basin from the Early Jurassic to the early Middle Jurassic and later transformed into a compressional depression basin from the late Middle Jurassic to the Cretaceous [21,22]. The Qaidam Basin exhibits a wide range of stratigraphic age, spanning from the Archeozoic to the Cenozoic. However, the continuity of strata is poor, with numerous discontinuities observed. The distribution of strata of different ages is also uneven. The upper part of the basin is dominated by thick Mesozoic and Cenozoic continental deposits, and the Jurassic deposits are mainly developed in the northern and western Qaidam Basin [9,23]. The Qaidam Basin has gained significant importance as a major energy base in northwest China due to its abundant coal and oil–gas resources in continental deposits.
The Jurassic deposits in the western Qaidam Basin are extensively distributed and well exposed, exhibiting a NE-SW extension direction (Figure 1), which is generally consistent with the sedimentary characteristics of the Jurassic in the northern Qaidam Basin [24,25]. The Lower and Middle Jurassic mainly consist of dark coal-bearing series with a thickness of up to 1000 m, commonly referred to as the “Black Jurassic”. The sediment color and depositional environment of the Upper Jurassic have undergone changes. The Upper Jurassic is mainly composed of argillaceous rocks alternating with reddish-brown and grayish-green, commonly known as the “Red Jurassic”. During the Early Jurassic, the Altun Mountains had not yet experienced uplift, and the study area began to accept sediments. The distribution of sedimentary systems was influenced by contemporaneous faults trending nearly east–west [19]. In this period, semi-deep lake and littoral–shallow lake deposits mainly developed in the northern part of the study area, whereas the southern and northeastern parts of the study area were characterized by fan delta and fluvial deposits. The relief was higher in the southeast and lower in the northwest, and sediments were mainly provided by the Qaidam Paleouplift in the south [19]. An unconformable contact exists between the Lower Jurassic Xiaomeigou Formation and the underlying Upper Ordovician. The Xiaomeigou Formation can be subdivided into coarse clastic rock member (J1xa), coal-bearing clastic rock member (J1xb), and shale member (J1xc) [25]. The shale member is situated in the upper part of the Xiaomeigou Formation, which was deposited in a semi-deep lake environment with the lithology dominated by grey-black shale (Figure 2). The shales exhibit a thickening trend from southeast to northwest, with an average thickness of 65.3 m.

3. Samples and Experimental Methods

A total of 26 shale samples were collected from the shale member of the Xiaomeigou Formation in the QS-1 exploratory trench of the western Qaidam Basin. The samples were carefully packaged before laboratory analysis and were assigned consecutive numbers (CX-1 to CX-26) based on their depth.
The total organic carbon (TOC) content of the shales was determined using a LECO CS230 carbon/sulfur analyzer. The shale samples were subjected to treatment with hydrochloric acid solution. Subsequently, the samples were crushed to grains smaller than 100 mesh size. Pyrolysis of 0.1–1 g samples was conducted at a temperature of 540 °C for a duration of 2 h. The peak temperature of S2 obtained from rock-eval pyrolysis analysis, known as the maximum pyrolysis peak temperature (Tmax), was determined. The measurement of vitrinite reflectance (Ro) was performed using a Leitz MPV-3 micro-photometer, employing oil immersion reflected optical light. In total, 40 random vitrinite observation points were selected for each sample, and the averaged data were utilized. The microscopic identification of kerogen was performed under the transmission light and fluorescence.
X-ray diffraction (XRD) analysis was carried out on shale powders with a particle size of approximately 100 mesh. A Rigaku D/max-2500PC diffractometer was employed, operating at 40 kV and 30 mA with Cu radiation. The stepwise scanning rate and sampling frequency were set at 4°/min and 0.04° (2θ), respectively. The semi-quantitative determination of mineral composition for each sample was performed by evaluating the curve area of the major peak.
The low-temperature nitrogen adsorption experiment was conducted using a Micromeritic TriStar II 3020 surface area and pore size analyzer, following Petroleum and Natural Gas Industry Standard SY/T 6154-1995. The BET (Brunauer–Emmett–Teller) equation [26] and the BJH (Barrett–Joyner–Halenda) method [27] were used to obtain the specific surface area, pore volume, and pore structure distribution of shale samples.

4. Results and Discussion

4.1. Characteristics of Organic Geochemistry

4.1.1. TOC Content

As an important material basis of shale gas, TOC content has a significant impact on the hydrocarbon generation capacity of shale. The experimental results of shale samples in the study area show that TOC contents range from 1.71% to 4.49% (Table 1), with an average value of 2.98%. TOC contents of most samples exceed 2%, indicating that shales from the Xiaomeigou Formation in the Lower Jurassic contain abundant organic matter. In terms of larger regions, TOC contents of shales in the Mangya Coal Mine range from 0.93% to 4.86%, with an average value of 1.76%. TOC contents of shales in the No.1 Ditch range from 0.49% to 4.71%, with an average value of 2.54%. TOC contents of shales in the Yueyashan Mountain range from 0.14% to 10% (averaging 3%). TOC contents of shales in the Heishishan Mountain range from 0.13% to 2.25% (averaging 1.27%) [17,28]. Overall, shales in the western Qaidam Basin are generally rich in organic matter, indicating a favorable hydrocarbon generation potential.

4.1.2. Organic Matter Type

The maceral microscopic identification revealed that the liptinite content is dominated in shale samples with an average of 75.81%, ranging from 72% to 80%. The vitrinite and inertinite of shale samples account for 10–17% (averaging 14.19%) and 8–13% (averaging 10%), respectively (Table 1). The type index (TI) [29] was used to classify the kerogen types of lacustrine shales in the western Qaidam Basin. Type I kerogen primarily consists of lipid compounds characterized by a high hydrogen content and low oxygen content. It can originate from algal sediments or organic matter that has undergone bacterial modification, exhibiting significant potential for oil generation. Type II kerogen, on the other hand, possesses a high hydrogen content, albeit slightly lower than that of type I kerogen. It is formed through the decomposition of marine plankton and microorganisms, displaying a moderate potential for oil generation. Type III kerogen, characterized by a low hydrogen content and high oxygen content, is derived from terrestrial higher plants and represents a favorable source for gas generation. The TI value ranges from 11 to 22.5, with an average of 16.24 (Table 1), suggesting that Type II–III is the predominant kerogen type for shales in the Xiaomeigou Formation. Therefore, the shale kerogens were identified as mainly oil prone. The characteristics of maceral compositions indicate that kerogen has a favorable hydrocarbon generation potential, with amorphous organic matter being the main hydrocarbon generation material.

4.1.3. Organic Matter Maturity

The organic matter maturity of lacustrine shales in the study area was assessed using vitrinite reflectance (Ro) and pyrolysis peak temperature (Tmax). The Ro value ranges from 1.05% to 1.95%, with an average of 1.62%. The maximum pyrolysis peak temperature ranges from 408 °C to 580 °C, with an average value of 498.38 °C (Table 1). These values indicate that the organic matter has reached the high thermal maturity stage (gas window). In the regional context, Ro values of shales in Mangya Coal Mine, No.1 Ditch, Heishishan Mountain, and Yueyashan Mountain range from 1.38% to 2.5%, from 1.48% to 4.4%, from 1.01% to 1.66%, and from 1.02% to 2.01%, respectively [17,28]. Previous studies have suggested that the Ro value in the major gas generation stage of organic matter in coal-bearing series is between 0.8% and 2.5% [30]. The thermal gas generation can be produced in humic-type kerogen when the Ro values exceed 0.5%. Therefore, the shale gas in the western Qaidam Basin is primarily composed of thermally generated gas. On the whole, the maturity of the shale samples belongs to the high thermal maturity stage (gas window) with relatively high Ro values.

4.2. Reservoir Characteristics

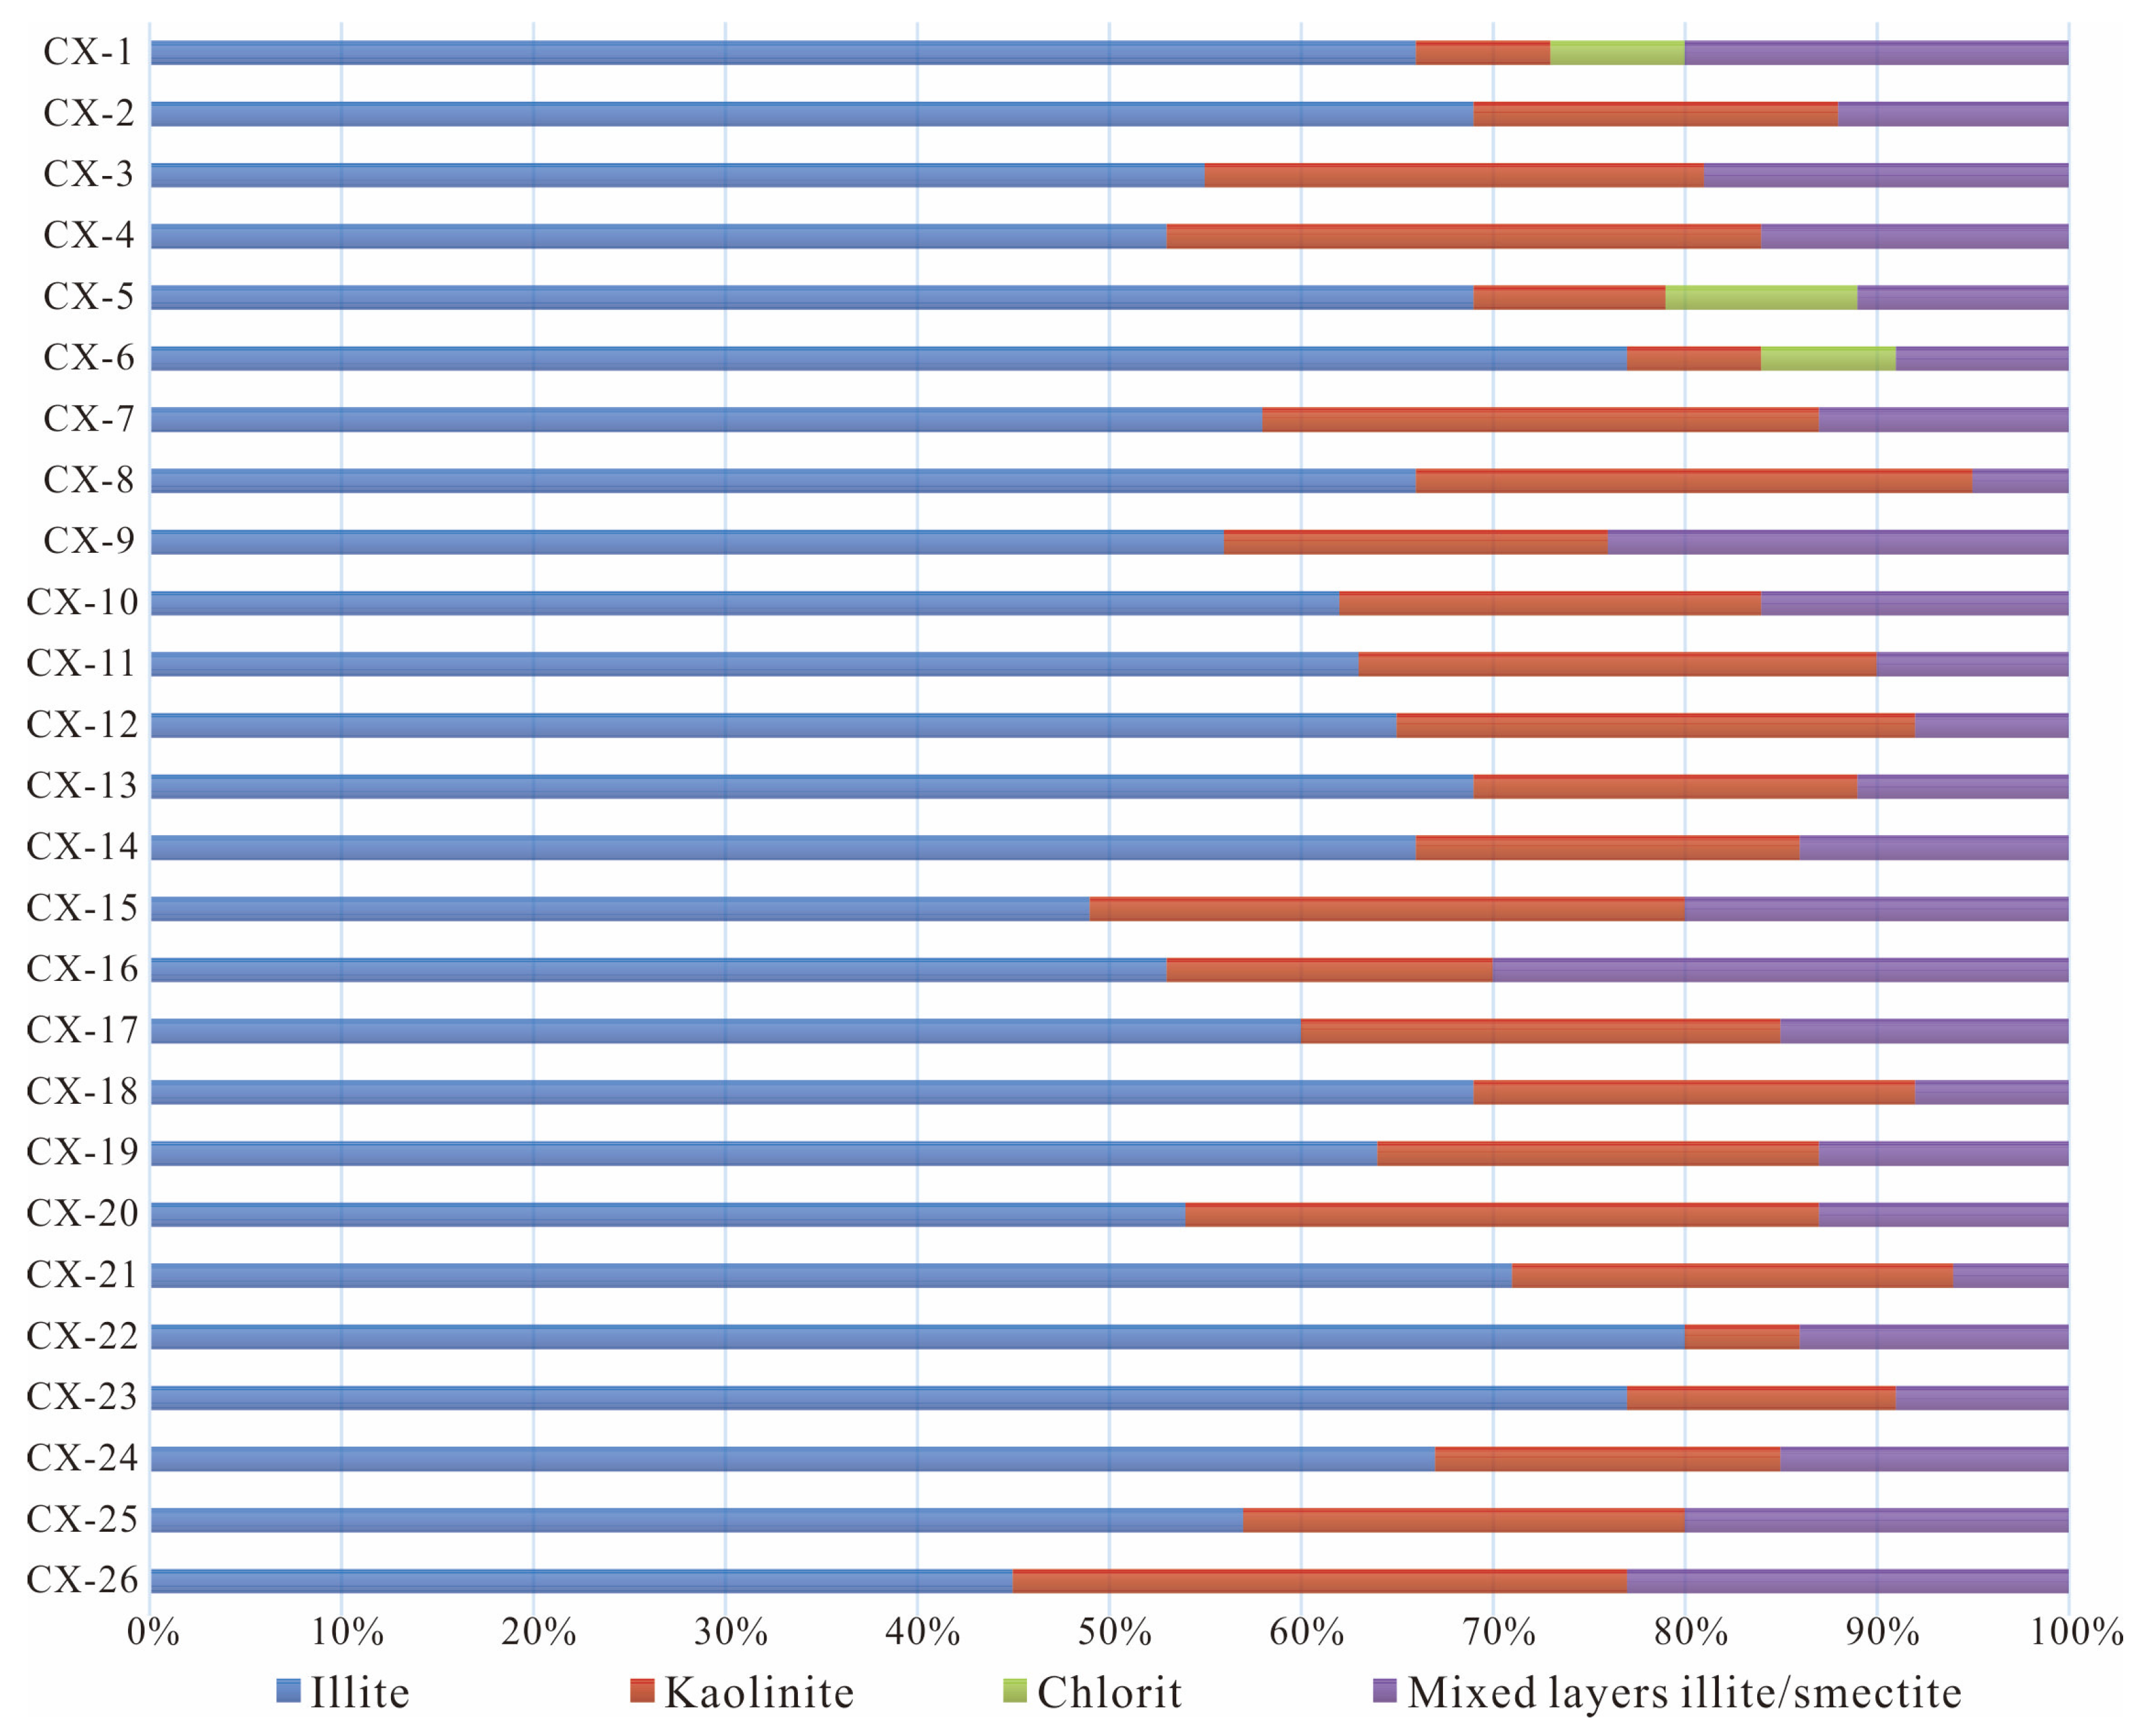
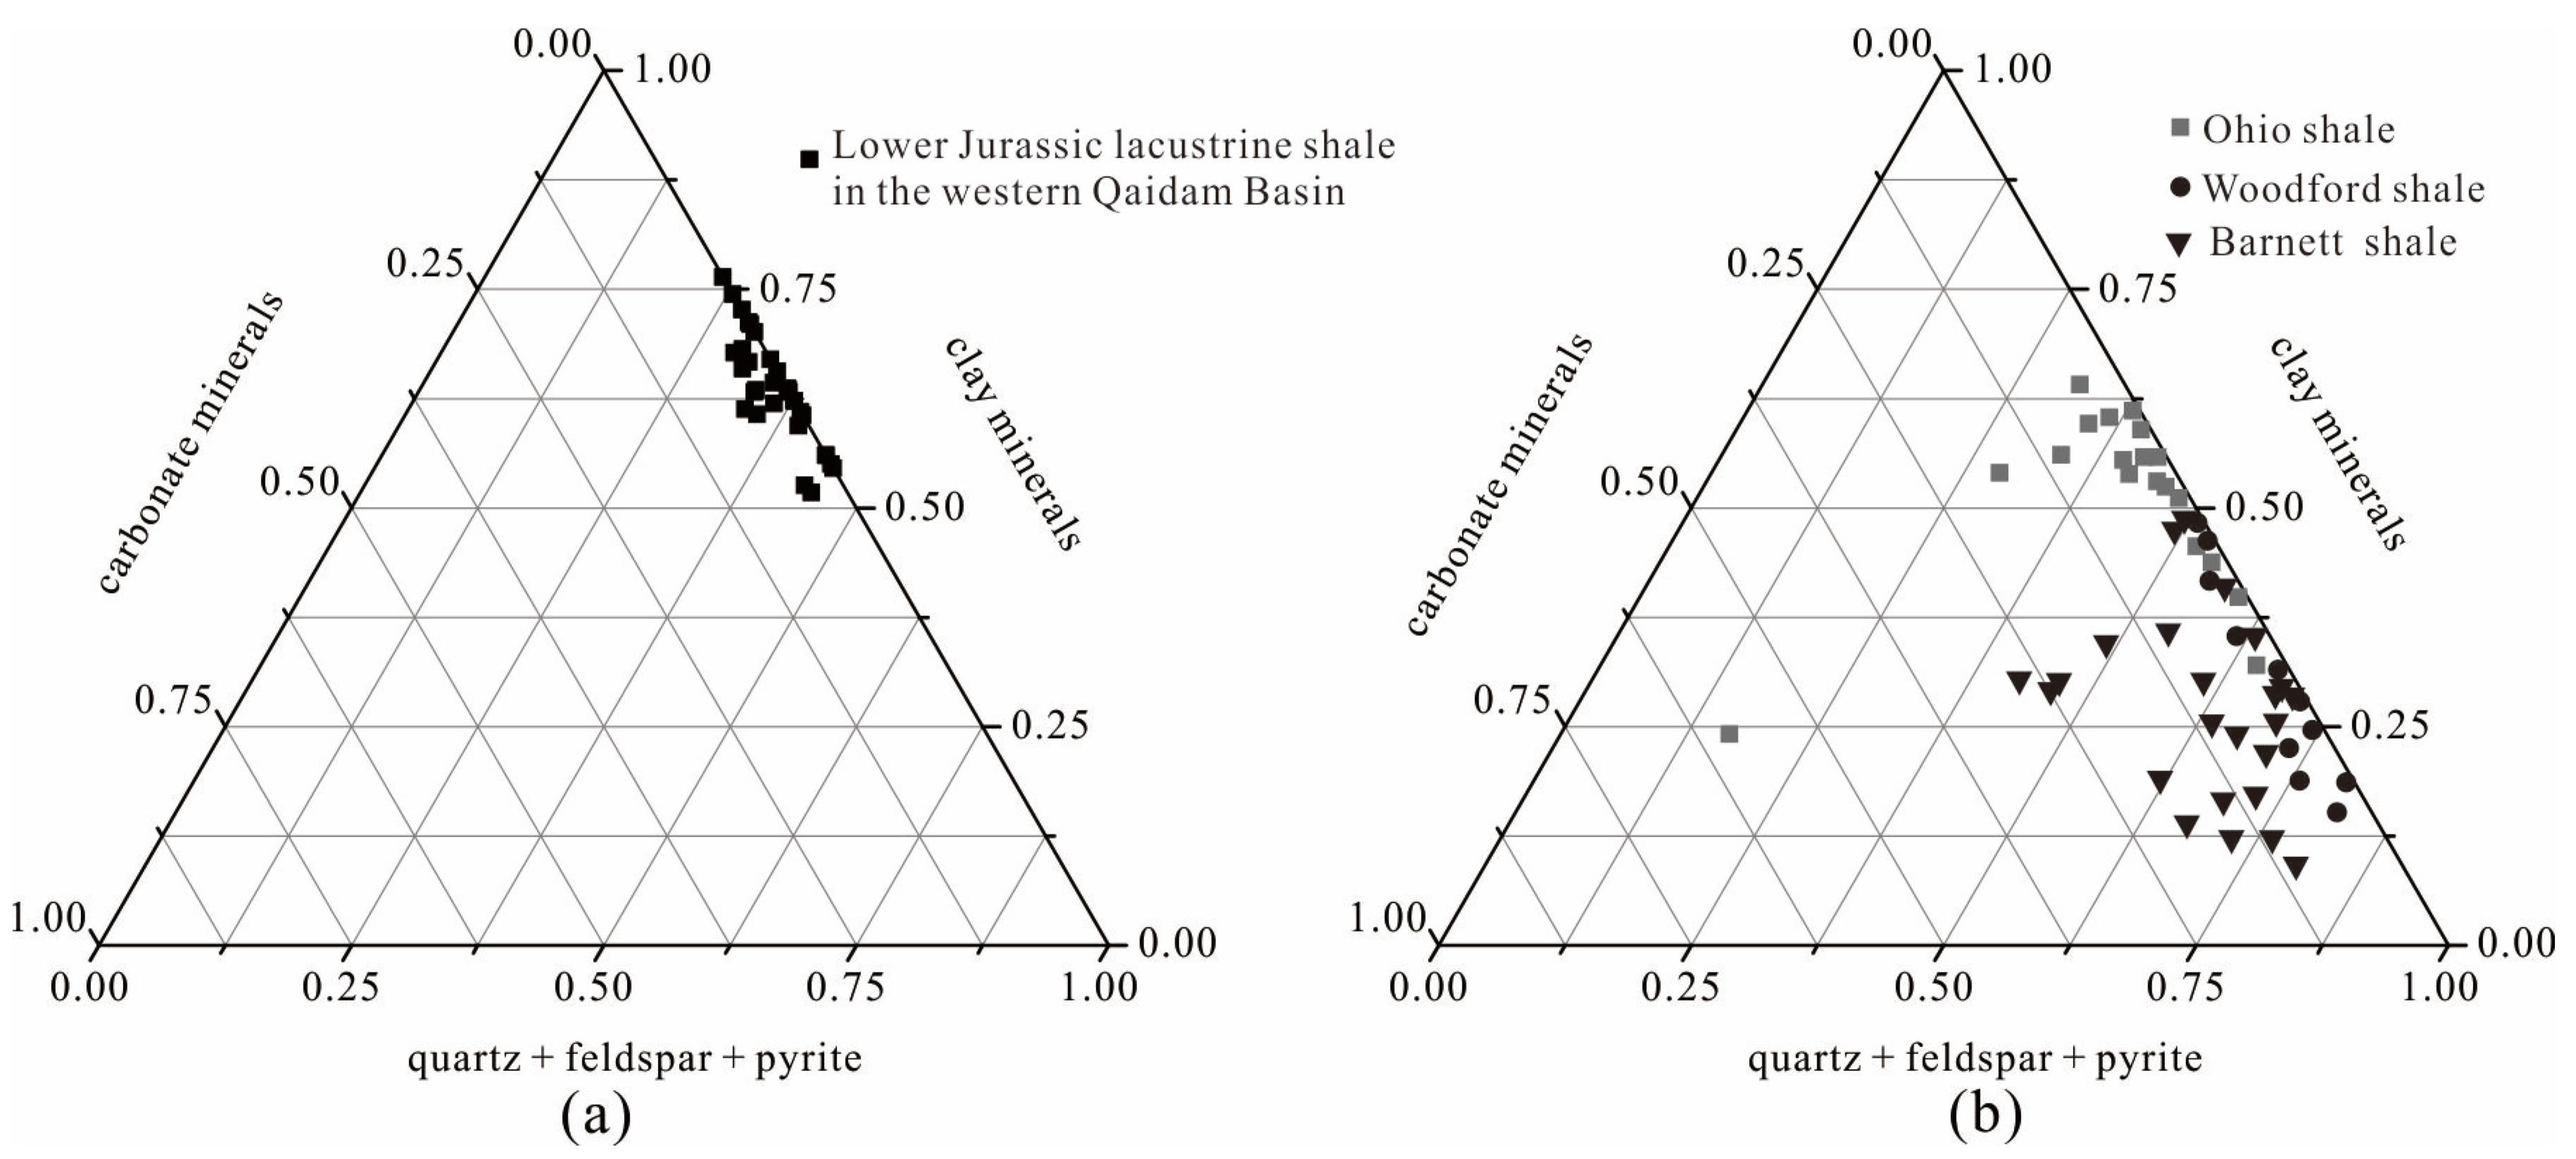
4.2.1. Mineral Composition

The mineral composition has been proven to be one of the most important factors affecting the reservoir property. The X-ray diffraction of shale samples in the Xiaomeigou Formation revealed that the mineral composition primarily consists of clay minerals, quartz, and feldspar. Clay minerals exhibit the highest content, ranging from 40% to 71% (averaging 58.58%), followed by quartz, with a range of 17% to 37% (averaging 26.04%), and feldspar, with values ranging from 2% to 9% (averaging 5%). Clay minerals in shale samples are dominated by illite and kaolinite, followed by mixed layers of illite/smectite (Figure 3). In the mixed layers of illite/smectite, illite content accounts for 90%, whereas smectite content only accounts for 10%. Feldspar is mainly composed of plagioclase, whereas K-feldspar is rare. The carbonate minerals, including calcite and dolomite, range from 1% to 5% (averaging 1.31%). From a vertical perspective, carbonate minerals are mainly present in the lower part of the shale member in the QS-1 exploratory trench. The average contents of secondary anhydrite and halite are 5.77% and 3.12%, respectively. The pyrite content is generally low, with only a few samples with a content of 1–3% (Table 2).
The shale gas reservoirs are typically characterized by low permeability and dense lithology, necessitating the use of hydraulic fracturing to enhance gas seepage capacity. The brittleness of rock is of positive significance for fracturing. The mineral composition of the Barnett, Woodford, and Ohio shale reservoirs in America generally contains a quartz content ranging from 28% to 52%, and the content of brittle minerals can exceed 40% [31]. A comparison of mineral composition between lacustrine shales in the western Qaidam Basin and Ohio shale in America (Figure 4) shows similar mineral content distributions. The combined content of quartz, feldspar, and pyrite of lacustrine shales in the western Qaidam Basin is slightly lower than that of marine shales in America, and the content of clay minerals is slightly higher. In general, the contents of brittle minerals such as quartz, feldspar, pyrite, and carbonate in the study area range from 21% to 44%, with an average of 32.54% (Table 2). Moreover, the presence of swelling minerals, such as smectite in mixed layers of illite/smectite, constitutes less than 2% of clay minerals. Thus, the mineral composition is conducive to the fracturing and reconstruction of shale reservoirs.

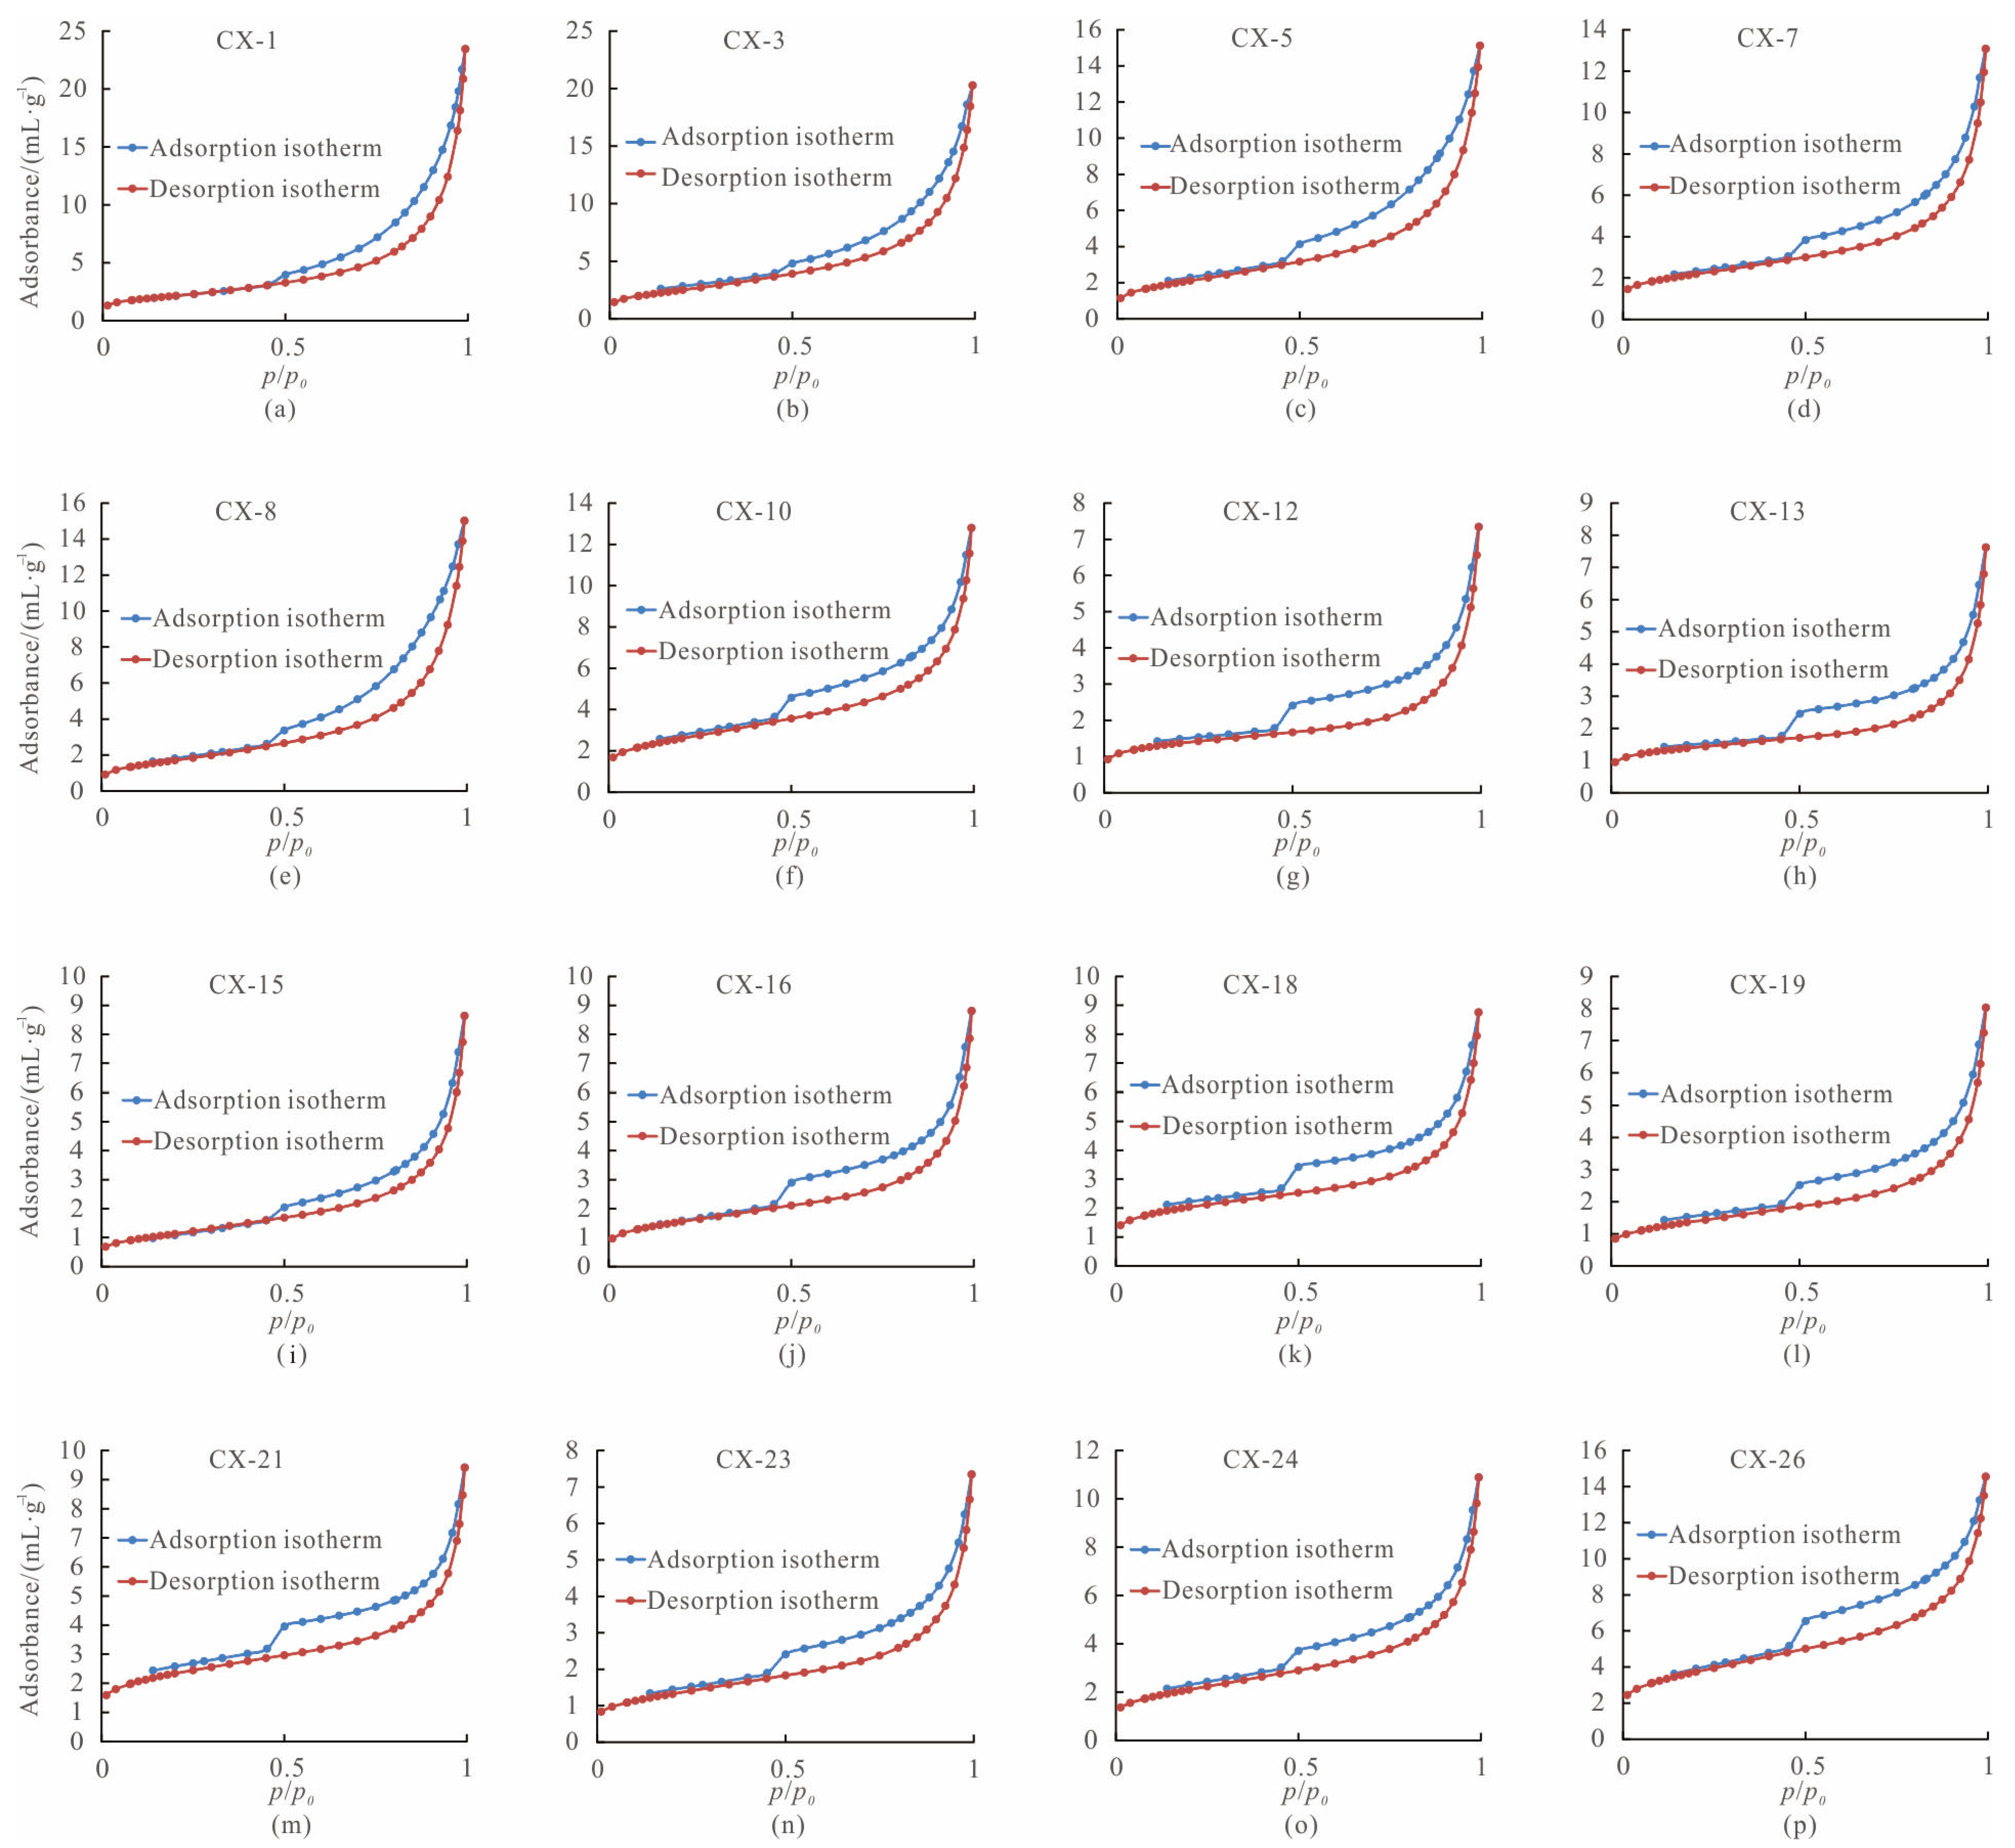
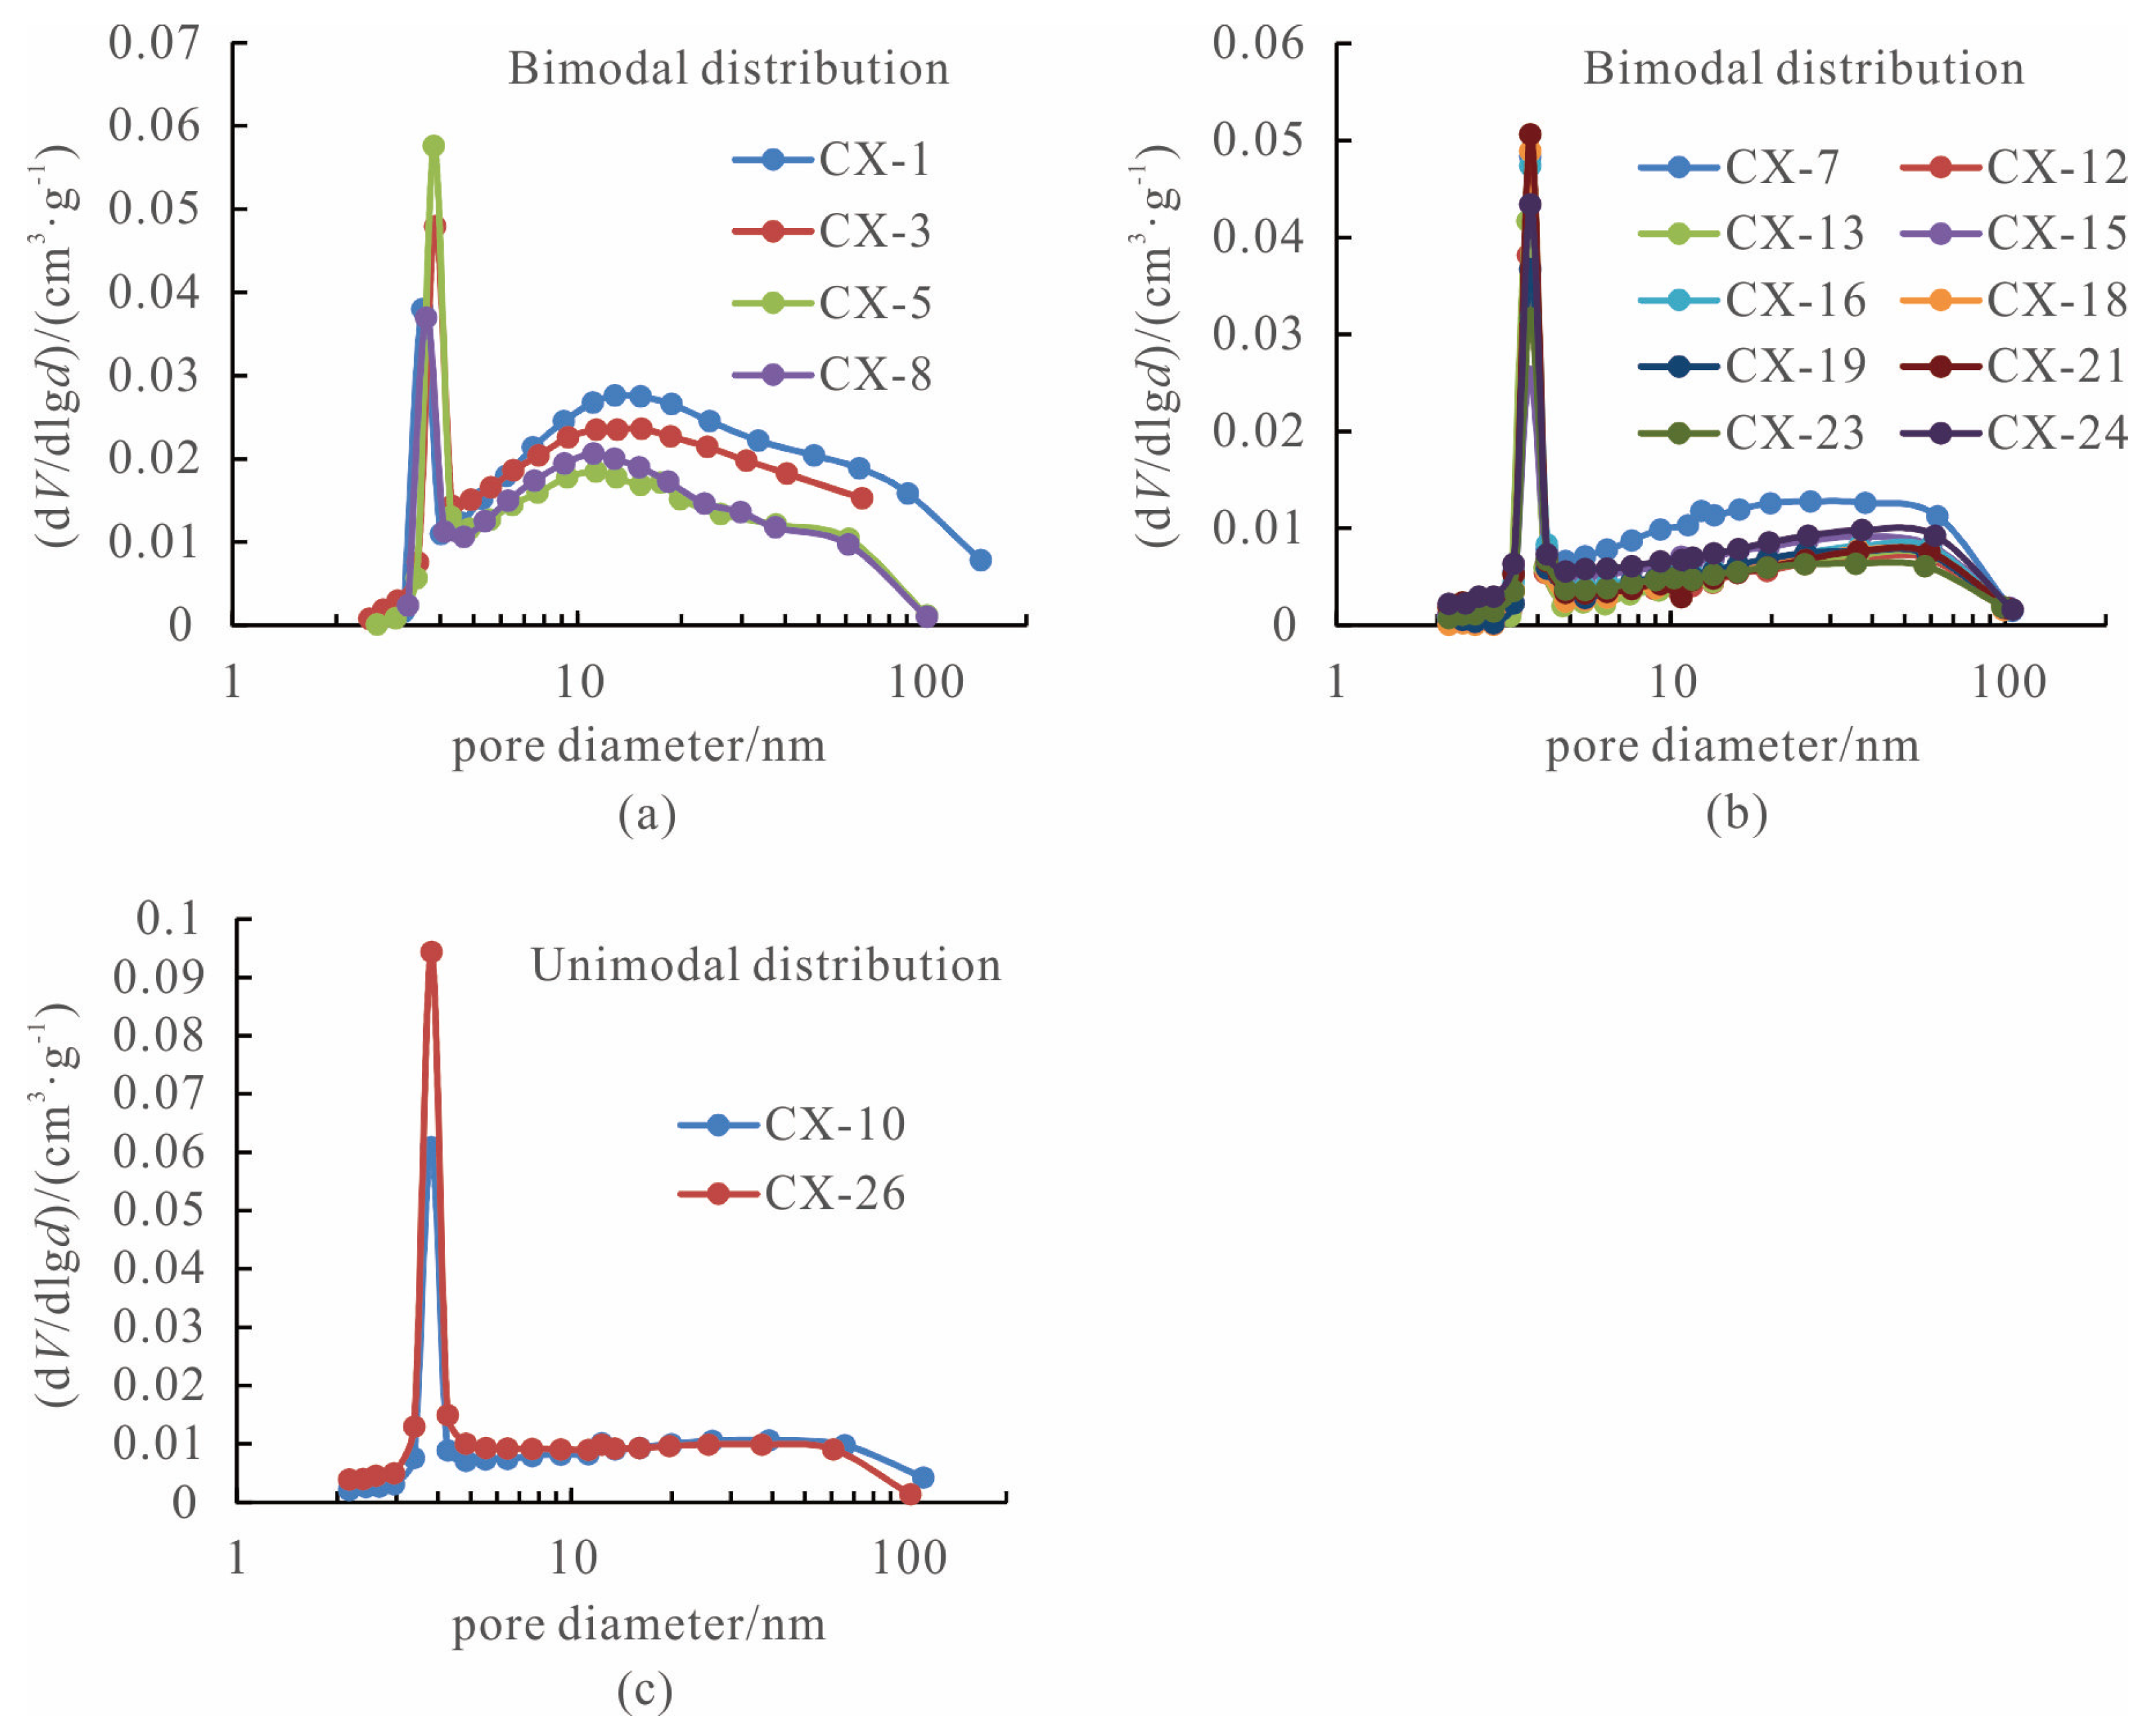
4.2.2. Pore Structure

Shale samples in the study area can generate hysteresis loops by low-temperature nitrogen adsorption experiments, and their morphology can reflect the pore structure characteristics of the shale. Based on pore characteristics and whether hysteresis loops can be generated, three types of pores were divided by researchers [33,34,35]. Type I pores, which include tubular pores with two open ends and plate slit pores with four open sides, are considered open pores and can generate hysteresis loops. Type II pores, including tubular pores, plate slit pores, and wedge-shaped pores, are closed at one end and do not generate hysteresis loops. Type III pores, including flask- or inkpot-shaped pores, can generate hysteresis loops despite having one closed end [33,34,35].
The morphology of hysteresis loops of shale samples can be divided into two types. The first type (Figure 5a,b,e,i) shows that the adsorption isotherm basically coincides with the desorption isotherm when the relative pressure (p/p0) is below 0.45, indicating that Type II pores with one closed end are predominant in this range. However, when p/p0 exceeds 0.45, the adsorption isotherm deviates from the desorption isotherm. The adsorption isotherm exhibits a gradual and nearly linear increase within the range of 0.45 < p/p0 < 0.9, followed by a sharp rise in the high-pressure range (0.9 < p/p0 < 1). These morphological characteristics resemble the Type D hysteresis loop as defined by Broekhoff and Boer [36], indicating that open inclined slit pores (Type I) dominate the shale samples.
The second type (Figure 5c,d,f–h,j–p) exhibits minimal differences compared to the first type in terms of overall hysteresis loops. However, in the medium-pressure range, the desorption isotherm experiences a significant drop when p/p0 approaches 0.5, indicating the presence of open parallel plate slit pores (Type I) and inkpot-shaped pores (Type III).
Overall, the shale samples from the Lower Jurassic Xiaomeigou Formation in the western Qaidam Basin are primarily characterized by open Type I pores. This pore structure is conducive to the migration of shale gas.

4.2.3. Pore Size, Specific Surface Area, and Pore Volume

The pore diameter of shale samples in the Xiaomeigou Formation ranges from 6.77711 nm to 18.90282 nm, with an average of 10.59569 nm. The pore size distribution curve reflects the pore size distribution peak of nanoscale pores. Based on morphological characteristics of the pore size distribution curve, it can be divided into unimodal distribution and bimodal distribution (Figure 6).
The bimodal pore size distribution curve exhibits one main peak and one secondary peak, which can be further divided into two types (Figure 6a,b). In the first type, the main peak pore size is concentrated at 3–4 nm, and the secondary peak pore size is concentrated at 10–20 nm. In the second type, two pore size distribution peaks mainly appear in the range of 3–4 nm and 40–60 nm. The presence of mesopores and macropores caused a trailing phenomenon in the pore size distribution curve. The unimodal pore size distribution curve exhibits only one main peak (Figure 6c), with the peak appearing near 4 nm. The pore size is primarily concentrated in the range of 3–5 nm, indicating a high probability of pore occurrence within this range. Similar to the bimodal distribution, the unimodal distribution curve also exhibits a trailing phenomenon.
The specific surface area of lacustrine shale samples ranges from 4.1176 to 13.1326 m2/g, with an average of 6.9973 m2/g. The total pore volume ranges from 0.01109 to 0.036222 cm3/g, with an average of 0.018228 cm3/g. Following the classification scheme of previous studies [37,38,39], the pores of the shale samples were categorized into micropores (pore size lower than 5 nm), mesopores (pore size between 5 nm and 50 nm), and macropores (pore size greater than 50 nm). Pores of various sizes contributed differently to the pore volume and specific surface area. Micropores, mesopores, and macropores account for 23.61%, 58.14%, and 18.25% of the total pore volume and 58.83%, 38.62%, and 2.55% of the specific surface area, respectively. Micropores and mesopores with a pore size lower than 50 nm contribute significantly to the specific surface area, and mesopores account for the highest proportion of pore volume, providing primary sites for the storage of adsorbed and free gases.

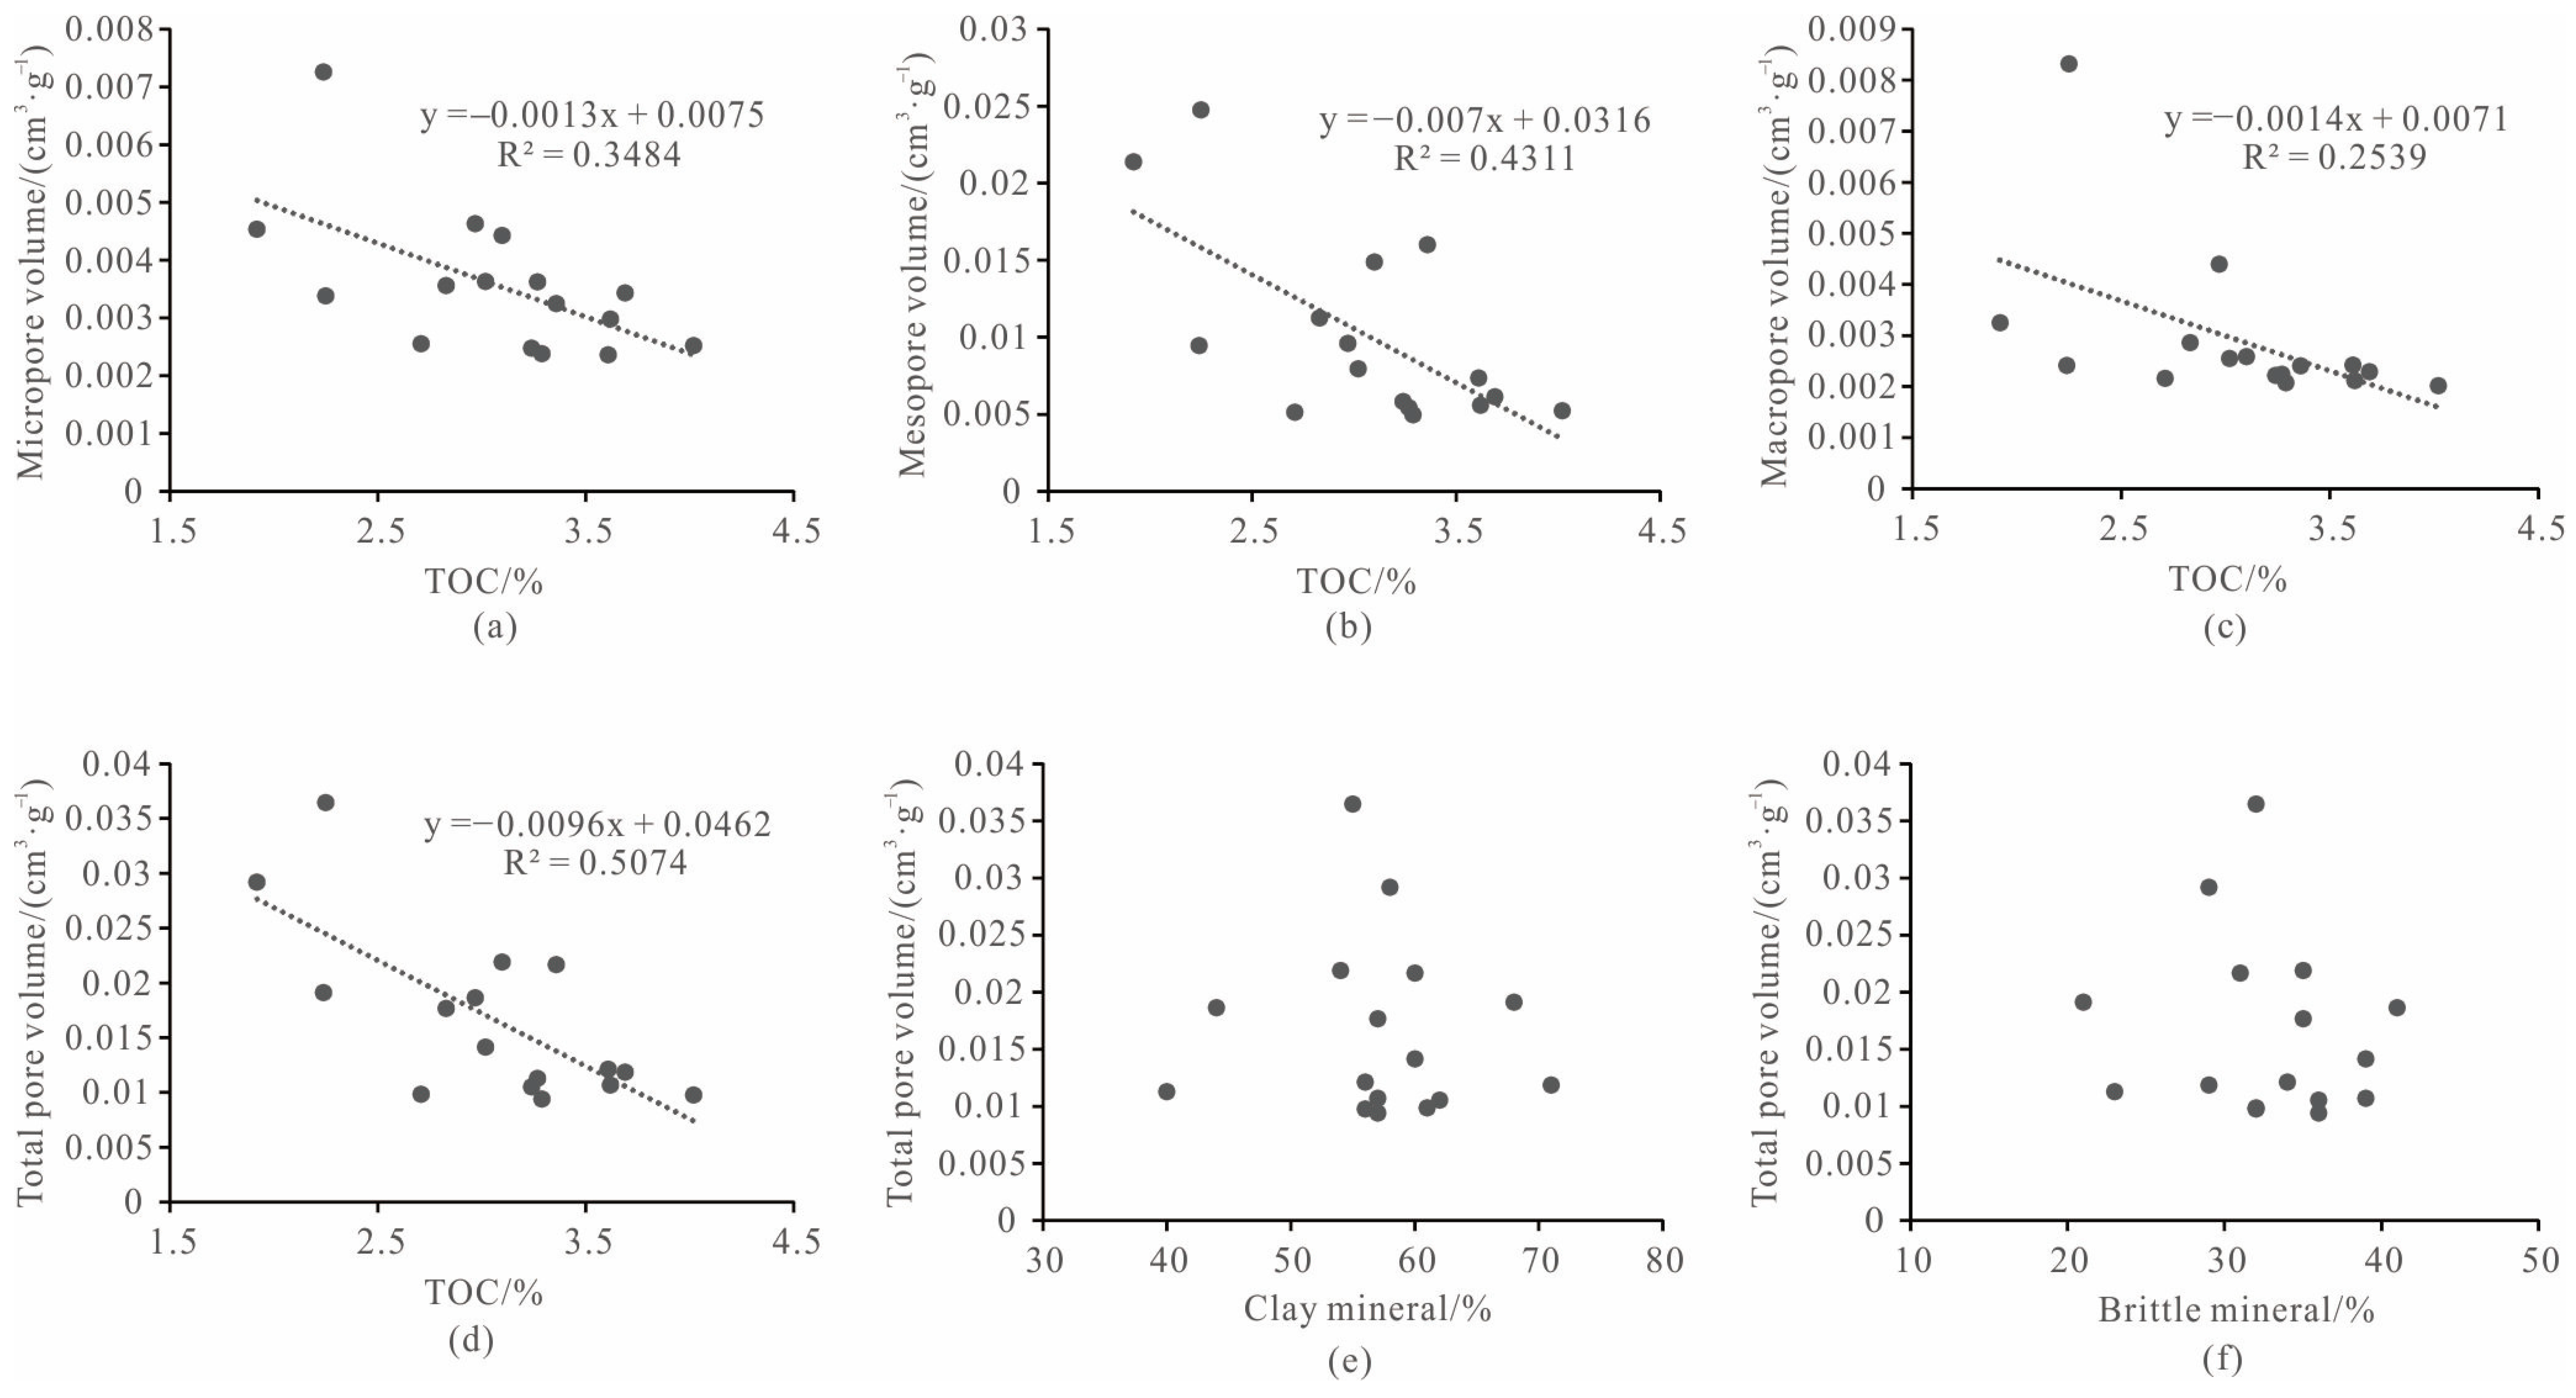
4.3. Factors Affecting Reservoir Porosity

Previous studies have shown that shale organic matter undergoes two pyrolyses with increasing maturity [40,41]. The hydrocarbon fluid and solid bitumen formed during the first pyrolysis fill the original pores, resulting in a decrease in pore volume. The second pyrolysis occurs after the high-maturity stage, during which the shale pore volume is increased. Therefore, maturity has a certain influence on the porosity of shale reservoirs.
Curtis et al. investigated the Woodford shale and found no nanopores in kerogen with Ro < 0.9%, whereas nanopores were observed in kerogen with Ro > 1.23% [42]. Based on the study of Jurassic shale in the western Canada Basin, Ross et al. found that the correlation between pore volume and TOC content is not obvious, with Ro ranging from 0.8% to 1.3%, which is believed to be caused by undeveloped organic pores in the shale reservoir [43]. Shao Longyi et al. conducted research on the Middle Jurassic shale in the northern Qaidam Basin and found a negative correlation between pore volume and the TOC content when Ro is between 0.36% and 0.66% [44]. Chen Shangbin et al., Zhao Pei et al., and Zhang Liehui et al. found a positive correlation between pore volume and TOC content in the Longmaxi Formation shale, with Ro ranging from 2.34% to 3.02% [45,46,47]. These studies indicate that the correlation between shale pore volume and TOC content may change with increasing maturity.
This study shows that Ro of Lower Jurassic lacustrine shales in the western Qaidam Basin ranges from 1.05% to 1.95% and that the kerogen type belongs to Type II–III. The micropore, mesopore, macropore, and total pore volumes are all negatively correlated with TOC content (Figure 7a–d), indicating that organic matter is likely still in the first stage of pyrolysis and that organic pores are not well developed. Because of the significantly lower density of organic matter compared to minerals, organic matter of the same mass occupies more space than minerals, which easily fills pre-existing pores and has an adverse effect on pore volume enhancement.
Generally, clay minerals exhibit a fine grain size (<2 microns) and possess interlayer micropores within their crystal layers. However, clay minerals are prone to being compacted to reduce pore space due to their high plasticity. The predominant types of pores in clay minerals are interlayer linear micropores, with a smaller number of intergranular pores. During the first pyrolysis, these pores are susceptible to being filled by hydrocarbon fluids [48]. Nevertheless, a portion of the compacted residual pores can be retained due to the presence of a rigid support framework composed of brittle minerals (such as quartz, feldspar, pyrite, and carbonate), which can withstand a certain amount of formation pressure. In cases where the abundance of organic matter is low, some pores may remain unfilled [49]. Carbonate minerals are easily dissolved by acidic fluids, leading to the formation of secondary erosion pores. However, the average content of carbonate minerals in the study area is only 1.31%, suggesting that erosion pores are likely to be scarce and mostly confined to isolated locations. The development of pores in shale samples is influenced by both favorable and unfavorable factors, resulting in no significant correlation between pore volume and clay mineral content or between pore volume and brittle mineral content (Figure 7e,f). The specific processes and influencing factors are complex and require further analysis based on more comprehensive evidence.

5. Conclusions

(1)
The Lower Jurassic lacustrine shale in the western Qaidam Basin exhibits significant hydrocarbon generation potential. The TOC content ranges from 1.71% to 4.49%, with an average of 2.98%. The kerogen belongs to type II–III. The Ro value ranges from 1.05% to 1.95%, with an average of 1.62%. The organic matter in the shale samples has reached the high thermal maturity stage (gas window).
(2)
The mineral composition of shales in the study area primarily consists of clay minerals, quartz, feldspar, and carbonate minerals, which is similar to the shale mineral composition found in American Ohio shale. The pore structure is characterized by open parallel plate slit pores and inclined slit pores, which is favorable for the migration of shale gas. The pore size distribution curve exhibits unimodal and bimodal distributions, with the bimodal distribution further divided into two types. Micropores and mesopores with pore sizes lower than 50 nm contribute to the majority of the specific surface area, and mesopores account for the highest proportion of pore volume.
(3)
The micropore, mesopore, macropore, and total pore volumes of lacustrine shale in the study area show a negative correlation with TOC content, indicating that the organic matter of shale is likely still in the first pyrolysis stage. No significant correlation is observed between pore volume and clay mineral content or between pore volume and brittle mineral content due to the complex interplay of several geological factors.

Author Contributions

Conceptualization, B.L. and M.W.; methodology, B.L.; software, Y.C.; formal analysis, Z.Y.; data curation, B.L.; writing—original draft preparation, B.L.; writing—review and editing, Y.C. and M.W. All authors have read and agreed to the published version of the manuscript.

Funding

This research was funded by the Natural Science Foundation of Shandong Province (grant No. ZR2022QD071), the Research Project on Education and Teaching of Shandong Province (grant No. 2023JXQ022), the Doctoral Research Initial Foundation of Weifang University (grant No. 2021BS29), the National Natural Science Foundation of China (grant No. 52178347), and the Shandong Provincial Natural Science Foundation (grant No. ZR2021ME068).

Data Availability Statement

Not applicable.

Conflicts of Interest

The authors declare no conflict of interest.

References

  1. Curtis, J.B. Fractured shale-gas systems. AAPG Bull. 2002, 86, 1921–1938. [Google Scholar]
  2. Martineau, D.F. History of the Newark East field and the Barnett Shale as a gas reservoir. AAPG Bull. 2007, 91, 399–403. [Google Scholar] [CrossRef]
  3. Zou, C.N.; Zhao, Q.; Cong, L.Z.; Wang, H.Y.; Shi, Z.S.; Wu, J.; Pan, S.Q. Development progress, potential and prospect of shale gas in China. Nat. Gas Ind. 2021, 41, 1–14. [Google Scholar]
  4. Zou, C.N.; Zhu, R.K.; Dong, D.Z.; Wu, S.T. Scientific and technological progress, development strategy and policy suggestion regarding shale oil and gas. Acta Pet. Sin. 2022, 43, 1675–1686. [Google Scholar]
  5. Zou, C.N.; Zhao, Q.; Wang, H.Y.; Xiong, W.; Dong, D.Z.; Yu, R.Z. The main characteristics of marine shale gas and the theory & technology of exploration and development in China. Nat. Gas Ind. 2022, 42, 1–13. [Google Scholar]
  6. Lin, L.M.; Zhang, J.C.; Tang, X.; Jing, T.Y.; Zhu, L.L. Conditions of continental shale gas accumulation in China. Nat. Gas Ind. 2013, 33, 35–40. [Google Scholar]
  7. Zhang, J.C.; Shi, M.; Wang, D.S.; Tong, Z.Z.; Hou, X.D.; Niu, J.L.; Li, X.Q.; Li, Z.M.; Zhang, P.; Huang, Y.Q. Fields and directions for shale gas exploration in China. Nat. Gas Ind. 2021, 41, 69–80. [Google Scholar] [CrossRef]
  8. Wang, X.Z.; Zhang, J.C.; Cao, J.Z.; Zhang, L.X.; Tang, X.; Lin, L.M.; Jiang, C.F.; Yang, Y.T.; Wang, L.; Wu, Y. A preliminary discussion on evaluation of continental shale gas resources: A case study of Chang 7 of Mesozoic Yanchang Formation in Zhiluo-Xiasiwan area of Yanchang. Earth Sci. Front. 2012, 19, 192–197. [Google Scholar]
  9. Shao, L.Y.; Li, M.; Li, Y.H.; Zhang, Y.P.; Lu, J.; Zhang, W.L.; Tian, Z.; Wen, H.J. Geological characteristics and controlling factors of shale gas in the Jurassic of the northern Qaidam Basin. Earth Sci. Front. 2014, 21, 311–322. [Google Scholar]
  10. Du, Y.; Liu, C.; Gao, C.; Guo, C.; Liu, G.; Xu, J.; Xue, P. Progress, challenges and prospects of the continental shale gas exploration and development in the Yanchang exploration area of the Ordos Basin. China Pet. Explor. 2020, 25, 33–42. [Google Scholar]
  11. Kang, Z.H.; Zhou, L.; Ren, S.M.; Kong, J.S.; Chen, Y. Characteristics of shale of the 7th member of the Middle Jurassic Dameigou Formation in Northern Qaidam Basin. Earth Sci. Front. 2015, 22, 265–276. [Google Scholar]
  12. Jin, Z.J.; Zhu, R.K.; Liang, X.P.; Shen, Y.Q. Several issues worthy of attention in current lacustrine shale oil exploration and development. Pet. Explor. Dev. 2021, 48, 1276–1287. [Google Scholar] [CrossRef]
  13. Chen, P.; Wu, Z.H.; Ma, L.C.; Zhou, C.J. Underground resource exploiting and induced earthquake: State and progress. Geol. Rev. 2023, 69, 691–700. [Google Scholar]
  14. Zhang, J.; Kuang, W.H.; Zhang, X.; Mo, C.K.; Zhang, D.X. Global review of induced earthquakes in oil and gas production fields. Rev. Geophys. Planet. Phys. 2021, 52, 239–265. [Google Scholar]
  15. Foulger, G.R.; Wilson, M.P.; Gluyas, J.G.; Julian, B.R.; Davies, R.J. Global review of human-induced earthquakes. Earth-Sci. Rev. 2018, 178, 438–514. [Google Scholar] [CrossRef]
  16. Bao, X.; Eaton, D.W. Fault activation by hydraulic fracturing in western Canada. Science 2016, 354, 1406–1409. [Google Scholar] [CrossRef] [PubMed]
  17. Guo, T.X.; Bao, S.J.; Kang, Z.H.; Zhang, Y.; Xu, Q.F.; Zhang, C. Shale-gas hydrocarbon generation and accumulation conditions of the Jurassic strata in southern Altun Mountains. Geol. Bull. China 2016, 35, 221–230. [Google Scholar]
  18. Zhou, L.; Kang, Z.H.; Tong, X.F.; Wang, C.; Yang, Y.D. The geological conditions for shale gas accumulation in the Lower-Middle Jurassic, the Frontal Areas of the Altun Mountains. Earth Sci. Front. 2016, 23, 54–63. [Google Scholar]
  19. Liu, B.Q.; Zhu, K.J.; Huang, X.H.; Chen, L.; Liu, D.C.; Shao, L.Y. Sequence stratigraphy and lithofacies paleogeography of the Lower Jurassic in southern Altyn Tagh, western Qaidam Basin. Acta Sedimentol. Sin. 2019, 37, 356–370. [Google Scholar]
  20. Lv, B.F.; Zhang, Y.Q.; Yang, S.Y. Characteristics of structural system and its implication for formation dynamics in Qaidam Basin. Geol. Rev. 2011, 57, 167–174. [Google Scholar]
  21. Feng, Q.; Fu, S.T.; Zhang, X.L.; Chen, Y.; Wang, L.Q.; Zhou, F.; Ni, J.L. Jurassic prototype basin restoration and hydrocarbon exploration prospect in the Qaidam Basin and its adjacent area. Earth Sci. Front. 2019, 26, 44–58. [Google Scholar]
  22. Li, J.L.; Xiao, Y.J.; Wang, D.H.; Lin, W.; Chai, X.P.; Zhang, J.F.; Tian, L.Y. Jurassic prototype basin reconstruction in east part of Qaidam Basin. Earth Sci. Front. 2016, 23, 11–22. [Google Scholar]
  23. Liu, B.Q.; Wang, W.C.; Zhang, W.L.; Huang, M.; Sun, Y.Q.; Shao, L.Y. Source-to-sink system budget analysis of continental fluvial-lacustrine sedimentary association: A case study from the Middle Jurassic in the northern Qaidam Basin. Acta Sedimentol. Sin. 2022, 40, 1494–1512. [Google Scholar]
  24. Liu, B.Q.; Shao, L.Y.; Wang, X.T.; Li, Y.N.; Xu, J. Application of channel-belt scaling relationship to Middle Jurassic source-to-sink system in the Saishiteng area of the northern Qaidam Basin, NW China. J. Palaeogeogr. 2019, 8, 75–91. [Google Scholar] [CrossRef]
  25. Zhang, F.D.; Tong, H.K. Discussion of plants fossils and its geological ages of the Lower-Middle Jurassic in Mangya Area, Qinghai Province. Northwestern Geol. 2012, 45, 86–93. [Google Scholar]
  26. Brunauer, S.; Emmet, P.H.; Teller, E. Adsorption of gases in multimolecular layers. J. Am. Chem. Soc. 1938, 60, 309–319. [Google Scholar] [CrossRef]
  27. Barrett, E.P.; Joyner, G.; Halenda, P.P. The determination of pore volume and area distribution in porous substances. I. Computations from nitrogen isotherms. J. Am. Chem. Soc. 1951, 73, 373–380. [Google Scholar] [CrossRef]
  28. Li, W.Q.; Kang, Z.H.; Zhou, L.; Tong, X.F.; Huangpu, J.J. Geological characteristics of the Jurassic shale gas play in the frontal area of the southern Altun Tagh. Pet. Geol. Exp. 2016, 38, 178–182. [Google Scholar]
  29. Cao, Q.Y. Identification of microcomponents and types of kerogen under transmitted light. Pet. Explor. Dev. 1985, 12, 14–23. [Google Scholar]
  30. Dai, J.X.; Ni, Y.Y.; Zhou, Q.H.; Yang, C.; Hu, A.P. Significances of studies on natural gas geology and geochemistry for natural gas industry in China. Pet. Explor. Dev. 2008, 35, 513–525. [Google Scholar] [CrossRef]
  31. Zou, C.N.; Dong, D.Z.; Wang, S.J.; Li, J.Z.; Li, X.J.; Wang, Y.M.; Li, D.H.; Cheng, K.M. Geological characteristics, formation mechanism and resource potential of shale gas in China. Pet. Explor. Dev. 2010, 37, 641–653. [Google Scholar] [CrossRef]
  32. Shao, L.Y.; Zhang, L.; Zhang, J.K.; Wang, D.W.; Shi, B.; Fu, Y.F.; Xu, L.L.; Song, J.J. Accumulation conditions of shale gas in transitional marine-continental coal measures of the Carboniferous-Permian in Henan Province. J. Min. Sci. Technol. 2016, 1, 209–221. [Google Scholar]
  33. Chen, P.; Tang, X.Y. The research on the adsorption of nitrogen in low temperature and micro-pore properties in coal. J. China Coal Soc. 2001, 26, 552–556. [Google Scholar]
  34. Han, S.B.; Zhang, J.C.; Yang, C.; Lin, L.M.; Zhu, L.L.; Chen, Y.C.; Xue, B. The characteristics of nanoscale pore and its gas storage capability in the Lower Cambrian shale of southeast Chongqing. J. China Coal Soc. 2013, 38, 1038–1043. [Google Scholar]
  35. Tang, S.H.; Zhang, J.P.; Wu, M.J. The pore structure characteristic about the sapropelic coal. Nat. Gas Geosci. 2013, 24, 247–251. [Google Scholar]
  36. Broekhoff, J.C.P.; Boer, J.H.D. Studies on pore systems in catalysts: XIII. Pore distributions from the desorption branch of a nitrogen sorption isotherm in the case of cylindrical pores B. Applications. J. Catal. 1968, 10, 377–390. [Google Scholar] [CrossRef]
  37. Sing, K.S.W. Reporting physisorption data for gas/solid systems with special reference to the determination of surface area and porosity. Pure Appl. Chem. 1982, 54, 2201–2218. [Google Scholar] [CrossRef]
  38. Luo, C.; Liu, S.G.; Sun, W.; Ran, B.; Wang, S.Y.; Yang, D.; Bai, Z.Q.; Ye, Y.H.; Zhang, X.; Deng, B. Pore structure characterization of black shale in the lower Cambrian Niutitang formation in western Hubei and eastern Chongqing area. J. Northeast Pet. Univ. 2014, 38, 8–17. [Google Scholar]
  39. Yang, N.; Tang, S.H.; Zhang, S.H.; Wang, S.B.; Yi, J.J. Structure Characteristics and accumulation significance of pores in Longtan Shale, central and south Hunan. Sci. Technol. Eng. 2015, 15, 66–73. [Google Scholar]
  40. Bustin, R.M. Shale gas and shale oil petrology and petrophysics. Int. J. Coal Geol. 2012, 103, 1–2. [Google Scholar] [CrossRef]
  41. Philip, H.N. Pore-throat sizes in sandstones, tight sandstones, and shales. AAPG Bull. 2009, 93, 329–340. [Google Scholar]
  42. Curtis, M.E.; Cardott, B.J.; Sondergeld, C.H. Development of organic porosity in the Woodford Shale with increasing thermal maturity. Int. J. Coal Geol. 2012, 103, 26–31. [Google Scholar] [CrossRef]
  43. Ross, D.J.K.; Bustin, R.M. Characterizing the shale gas resource potential of Devonian–Mississippian strata in the Western Canada sedimentary basin: Application of an integrated formation evaluation. AAPG Bull. 2008, 92, 87–125. [Google Scholar] [CrossRef]
  44. Shao, L.Y.; Liu, L.; Wen, H.J.; Li, Y.H.; Zhang, W.L.; Li, M. Characteristics and influencing factors of nanopores in the Middle Jurassic Shimengou shale in well YQ-1 of the northern Qaidam Basin. Earth Sci. Front. 2016, 23, 164–173. [Google Scholar]
  45. Chen, S.B.; Zhu, Y.M.; Wang, H.Y.; Liu, H.L.; Wei, W.; Fang, J.H. Structure characteristics and accumulation significance of nanopores in Longmaxi shale gas reservoir in the southern Sichuan Basin. J. China Coal Soc. 2012, 37, 438–444. [Google Scholar]
  46. Zhang, L.H.; Guo, J.J.; Tang, H.M.; Liu, J.; Li, Q.R.; He, J.Y. Pore structure characteristics of Longmaxi shale in the southern Sichuan Basin. Nat. Gas Ind. 2015, 35, 22–29. [Google Scholar]
  47. Zhao, P.; Li, X.Q.; Tian, X.W.; Su, G.P.; Zhang, M.Y.; Guo, M.; Dong, Z.L.; Sun, M.M.; Wang, F.Y. Study on micropore structure characteristics of Longmaxi Formation shale gas reservoirs in the southern Sichuan Basin. Nat. Gas Geosci. 2014, 25, 947–956. [Google Scholar]
  48. Liu, Z.B.; Hu, Z.Q.; Liu, G.X.; Liu, Z.J.; Liu, H.T.; Hao, J.Y.; Wang, P.W.; Li, P. Pore characteristics and controlling factors of continental shale reservoirs in the Lower Jurassic Ziliujing Formation, northeastern Sichuan Basin. Oil Gas Geol. 2021, 42, 136–145. [Google Scholar]
  49. Jiang, Z.X.; Li, X.; Wang, X.M.; Wang, G.Z.; Qiu, H.Y.; Zhu, D.Y.; Jiang, H.Y. Characteristic differences and controlling factors of pores in typical South China shale. Oil Gas Geol. 2021, 42, 41–53. [Google Scholar]
Figure 1. Schematic geological map of the western Qaidam Basin. (a) Geotectonic map; (b) geological map.
Water 15 03104 g001
Figure 2. Stratigraphic column of Lower Jurassic in the western Qaidam Basin.
Water 15 03104 g002
Figure 3. Composition of clay minerals of shales in the western Qaidam Basin.
Water 15 03104 g003
Figure 4. Comparison of mineral composition between lacustrine shale in the western Qaidam Basin and representative shale in America. (a) Mineral composition of lacustrine shale in the western Qaidam Basin; (b) mineral composition of representative shale in America [32].
Water 15 03104 g004
Figure 5. Nitrogen adsorption–desorption isotherms of shales in the western Qaidam Basin. (ap) are nitrogen adsorption–desorption isotherms of samples CX-1, CX-3, CX-5, CX-7, CX-8, CX-10, CX-12, CX-13, CX-15, CX-16, CX-18, CX-19, CX-21, CX-23, CX-24, and CX-26.
Water 15 03104 g005
Figure 6. Pore diameter distribution of shales in the western Qaidam Basin. (a) Bimodal distribution; (b) Bimodal distribution; (c) Unimodal distribution.
Water 15 03104 g006
Figure 7. Correlation between pore volume with TOC, clay minerals, and brittle minerals of shales in the western Qaidam Basin. (a) Correlation between micropores and pore volume with TOC; (b) Correlation between mesopore volume with TOC; (c) Correlation between macropore volume with TOC; (d) Correlation between total pore volume with TOC; (e) Correlation between total pore volume with clay mineral; (f) Correlation between total pore volume with brittle mineral.
Water 15 03104 g007
Table 1. Organic geochemical parameters of shales in the western Qaidam Basin.
Sample No.Depth/mTOC/%Ro/%Tmax/°CLiptinite/%Vitrinite/%Inertinite/%TI
CX-15.50–6.502.251.7543775121315.5
CX-26.50–7.503.29------
CX-37.50–8.501.92-4427581714.5
CX-48.50–9.502.44------
CX-59.50–10.503.101.895167791417.8
CX-610.50–11.502.62------
CX-711.50–12.502.83-49976101416.5
CX-812.50–13.503.361.5440874111513.8
CX-913.50–14.502.85------
CX-1014.50–15.502.971.2648576101416.5
CX-1115.50–16.502.89------
CX-1216.50–17.503.29-4737781517.5
CX-1317.50–18.502.711.804797781517.5
CX-1418.50–19.502.59------
CX-1519.50–20.503.61-52872121611.0
CX-1620.50–21.503.691.9558075111415.3
CX-1721.50–22.503.74------
CX-1822.50–23.503.62-57076101416.5
CX-1923.50–24.503.241.7551675131215.8
CX-2024.50–25.501.71------
CX-2125.50–26.503.27-56080101022.5
CX-2226.50–27.504.49------
CX-2327.50–28.504.021.625067891319.3
CX-2428.50–29.503.02-5047781517.5
CX-2529.50–30.501.75------
CX-2630.50–31.502.241.0547173111612.3
Table 2. Mineral composition of shales in the western Qaidam Basin.
Sample No.Depth/mQuartz/%K-Feldspar/%Plagio-Clase/%Calcite/%Dolomite/%Pyrite
/%
Clay
Mineral/%
Halite/%Anhydrite/%
CX-15.50–6.50270230055103
CX-26.50–7.5017260006276
CX-37.50–8.5022052005858
CX-48.50–9.5022052106343
CX-59.50–10.5028032205447
CX-610.50–11.50300403041139
CX-711.50–12.5030121105744
CX-812.50–13.5024042106063
CX-913.50–14.5021050006914
CX-1014.50–15.5029182104469
CX-1115.50–16.5022051106245
CX-1216.50–17.5024074105752
CX-1317.50–18.5025070006134
CX-1418.50–19.5029051006302
CX-1519.50–20.5030040005637
CX-1620.50–21.5023050017100
CX-1721.50–22.5037060015600
CX-1822.50–23.5032150105704
CX-1923.50–24.5028080006211
CX-2024.50–25.5023060006812
CX-2125.50–26.50170411040037
CX-2226.50–27.5034250035600
CX-2327.50–28.50280400056111
CX-2428.50–29.5035040006010
CX-2529.50–30.5021020006719
CX-2630.50–31.50190200068110
Disclaimer/Publisher’s Note: The statements, opinions and data contained in all publications are solely those of the individual author(s) and contributor(s) and not of MDPI and/or the editor(s). MDPI and/or the editor(s) disclaim responsibility for any injury to people or property resulting from any ideas, methods, instructions or products referred to in the content.

