
Comprehensive Analysis of the Failure Potential of a Motorway Landslide in Dabu County, China


Abstract
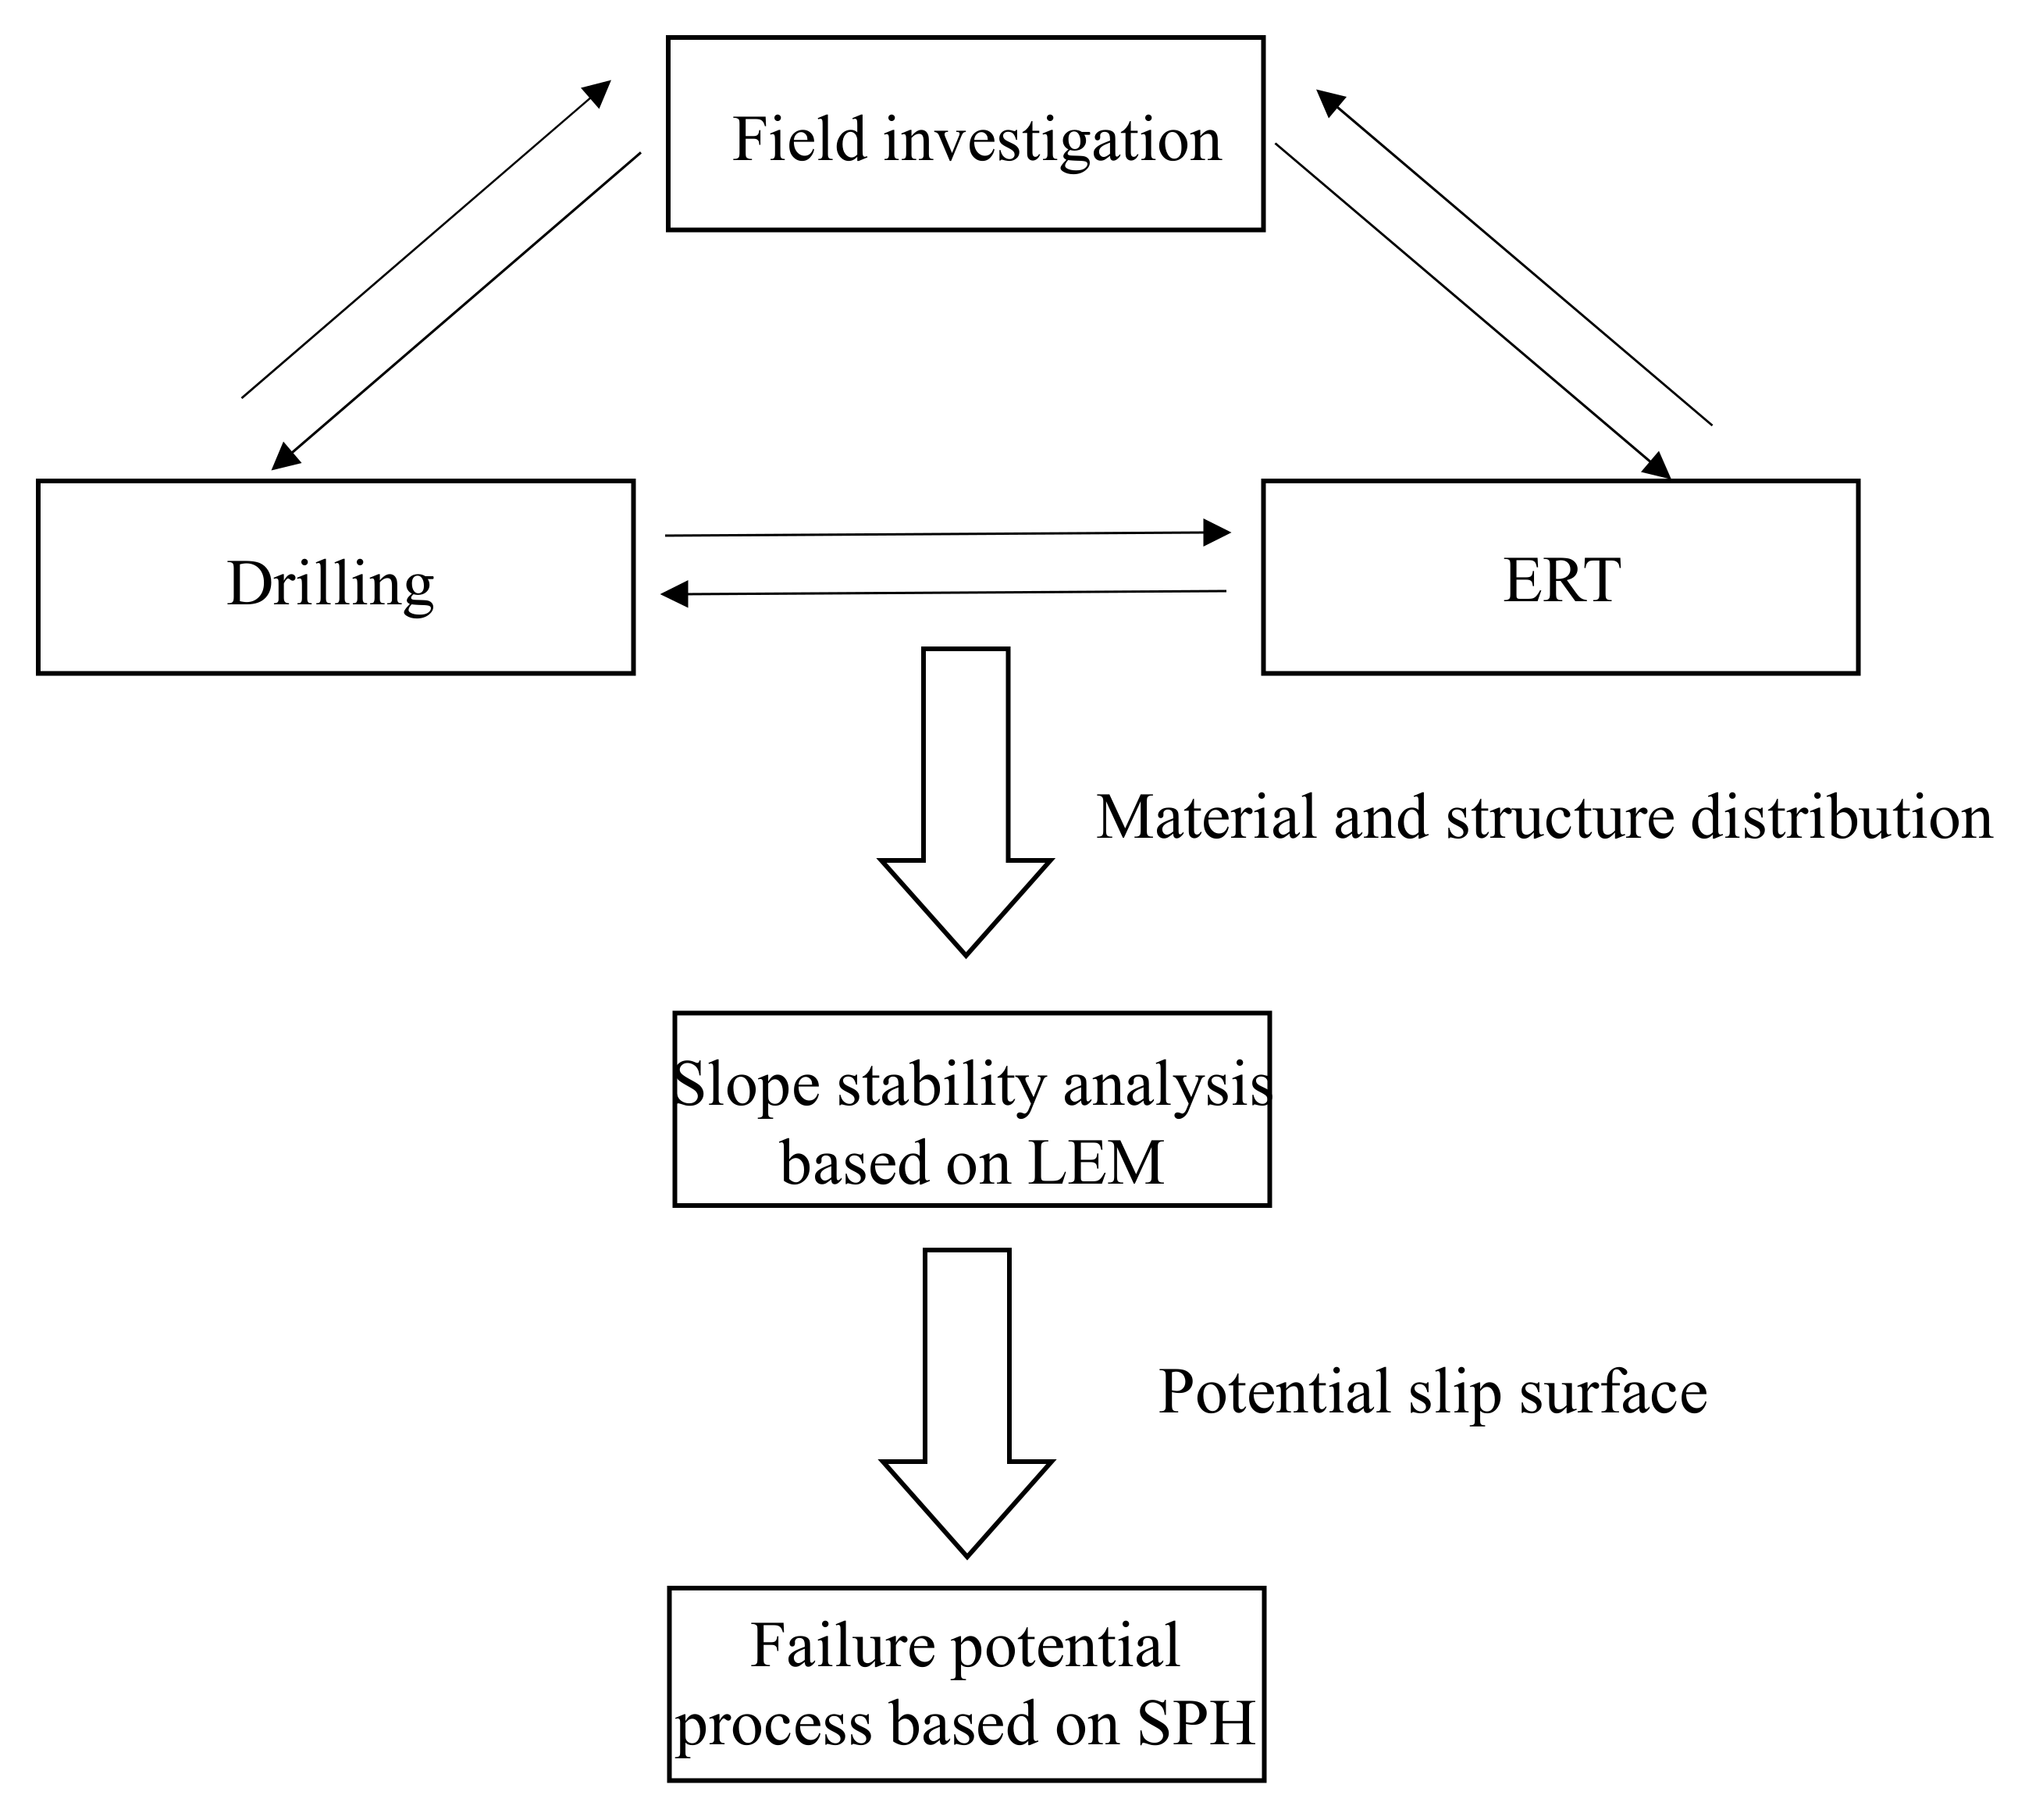
:1. Introduction
2. Background
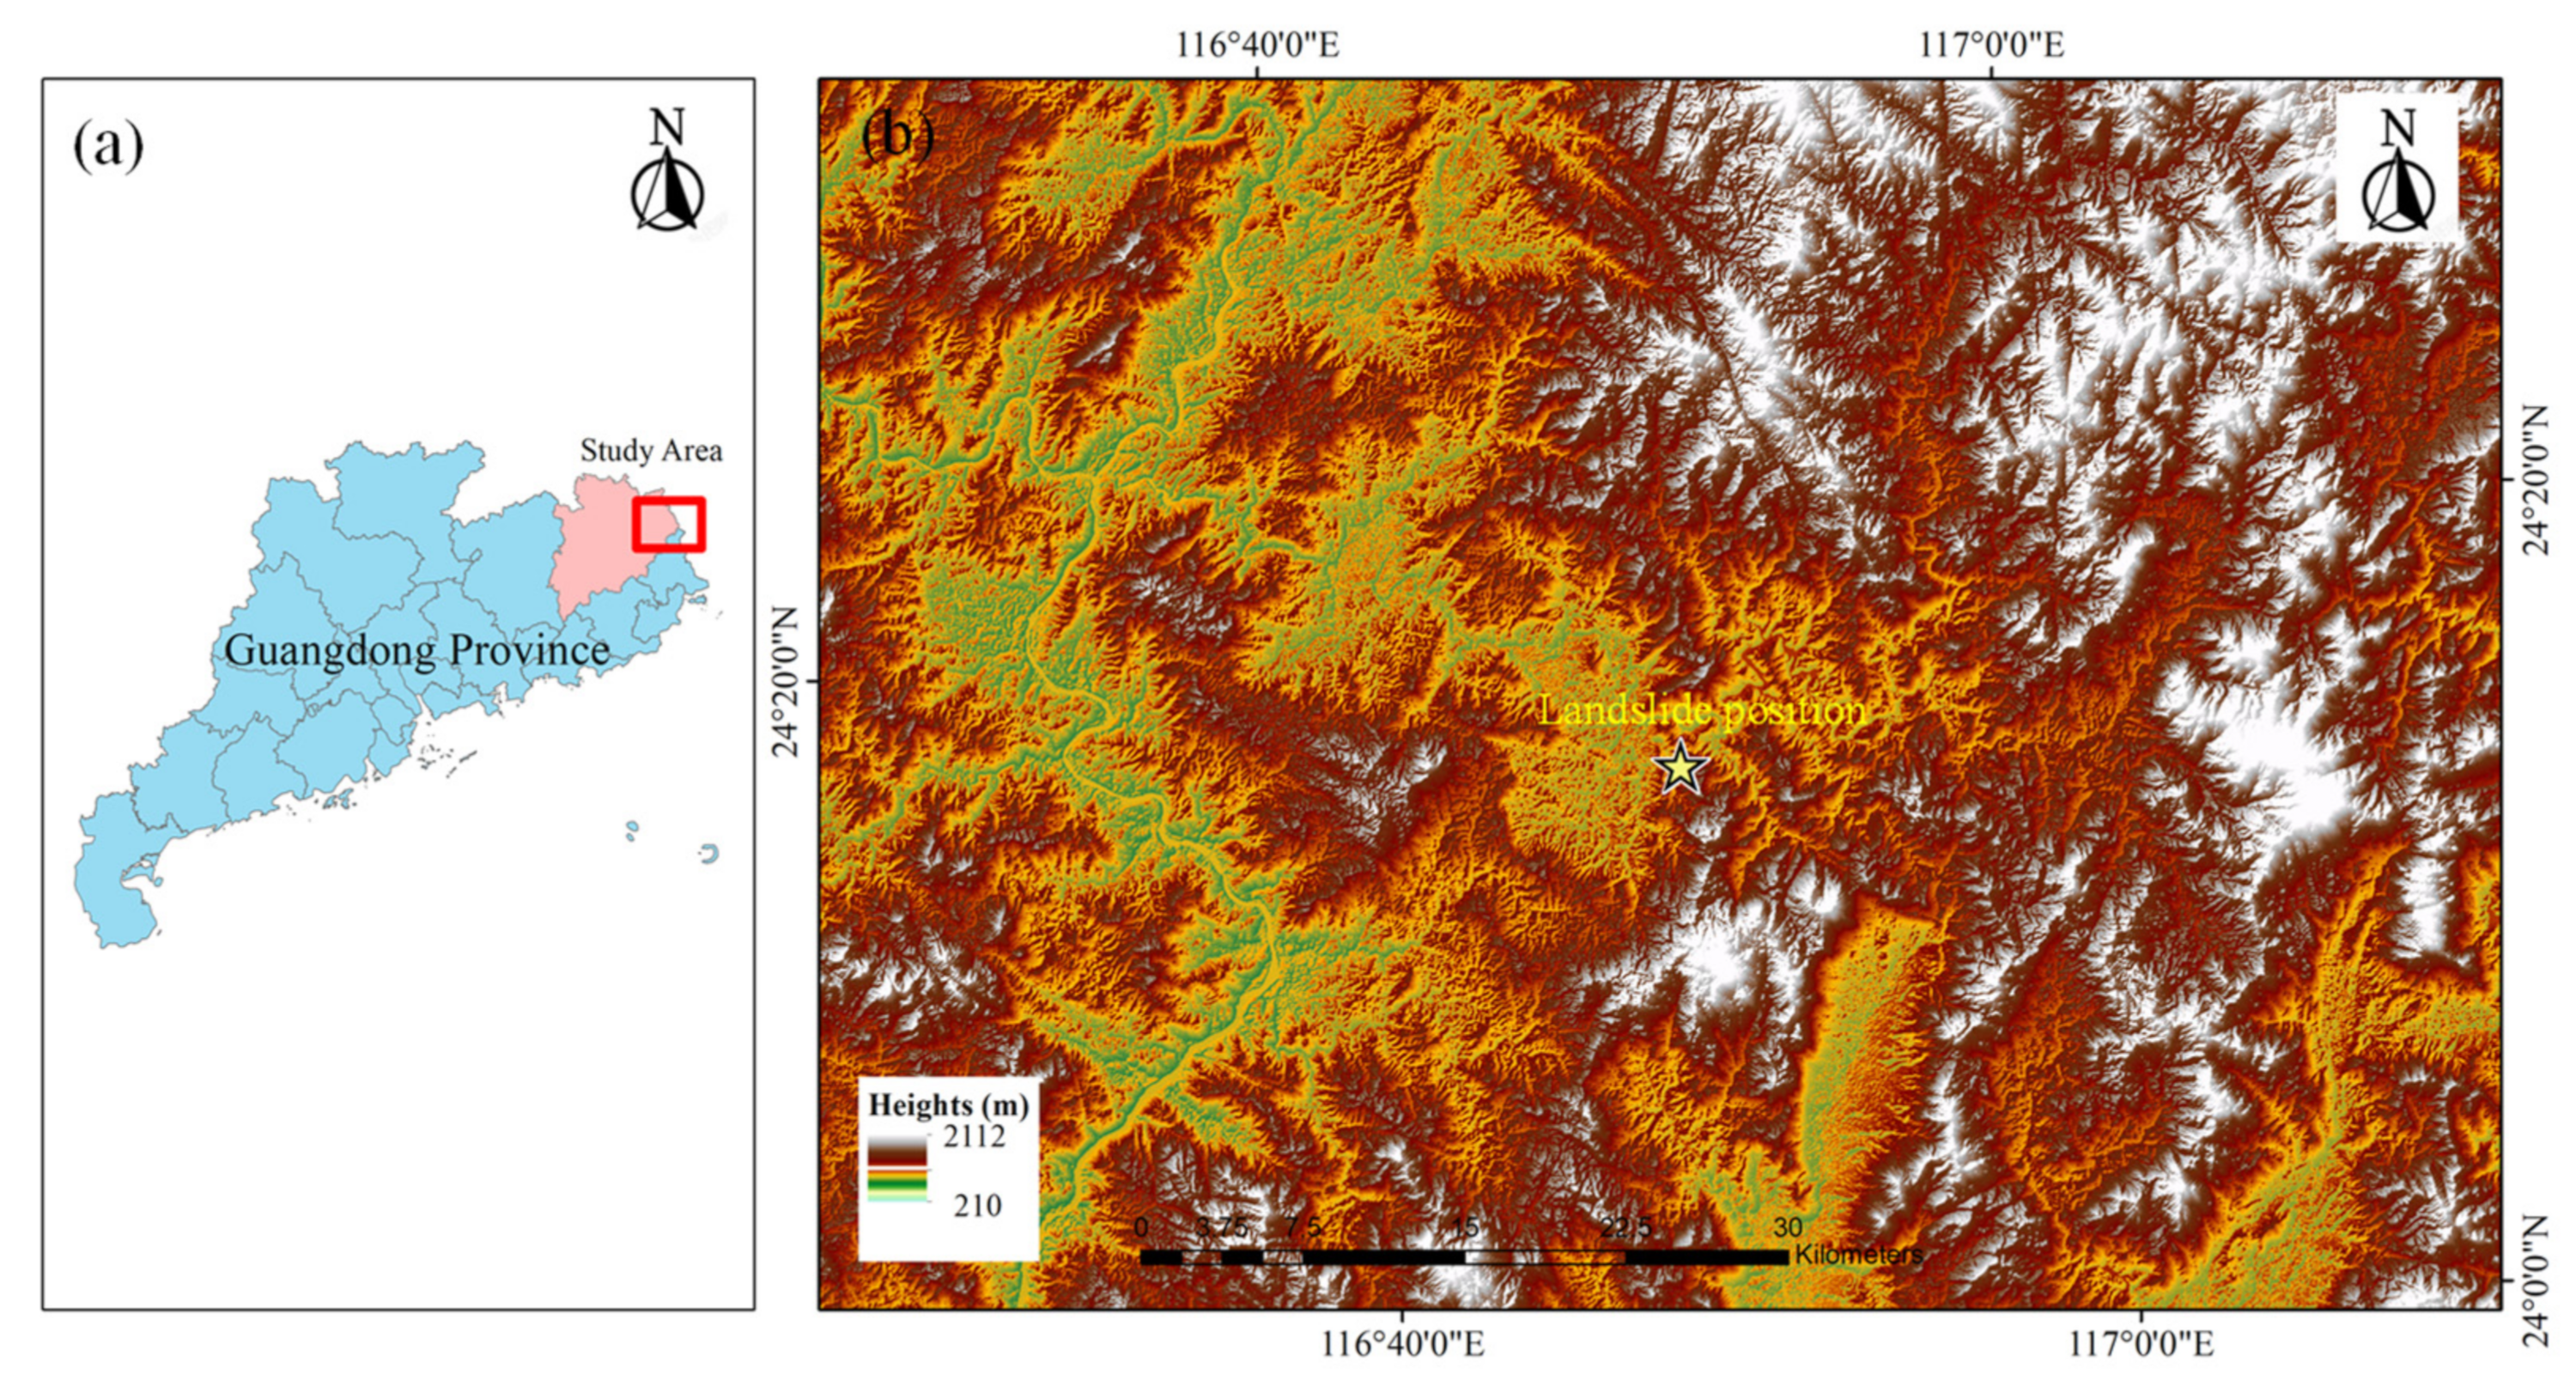
2.1. Study Area
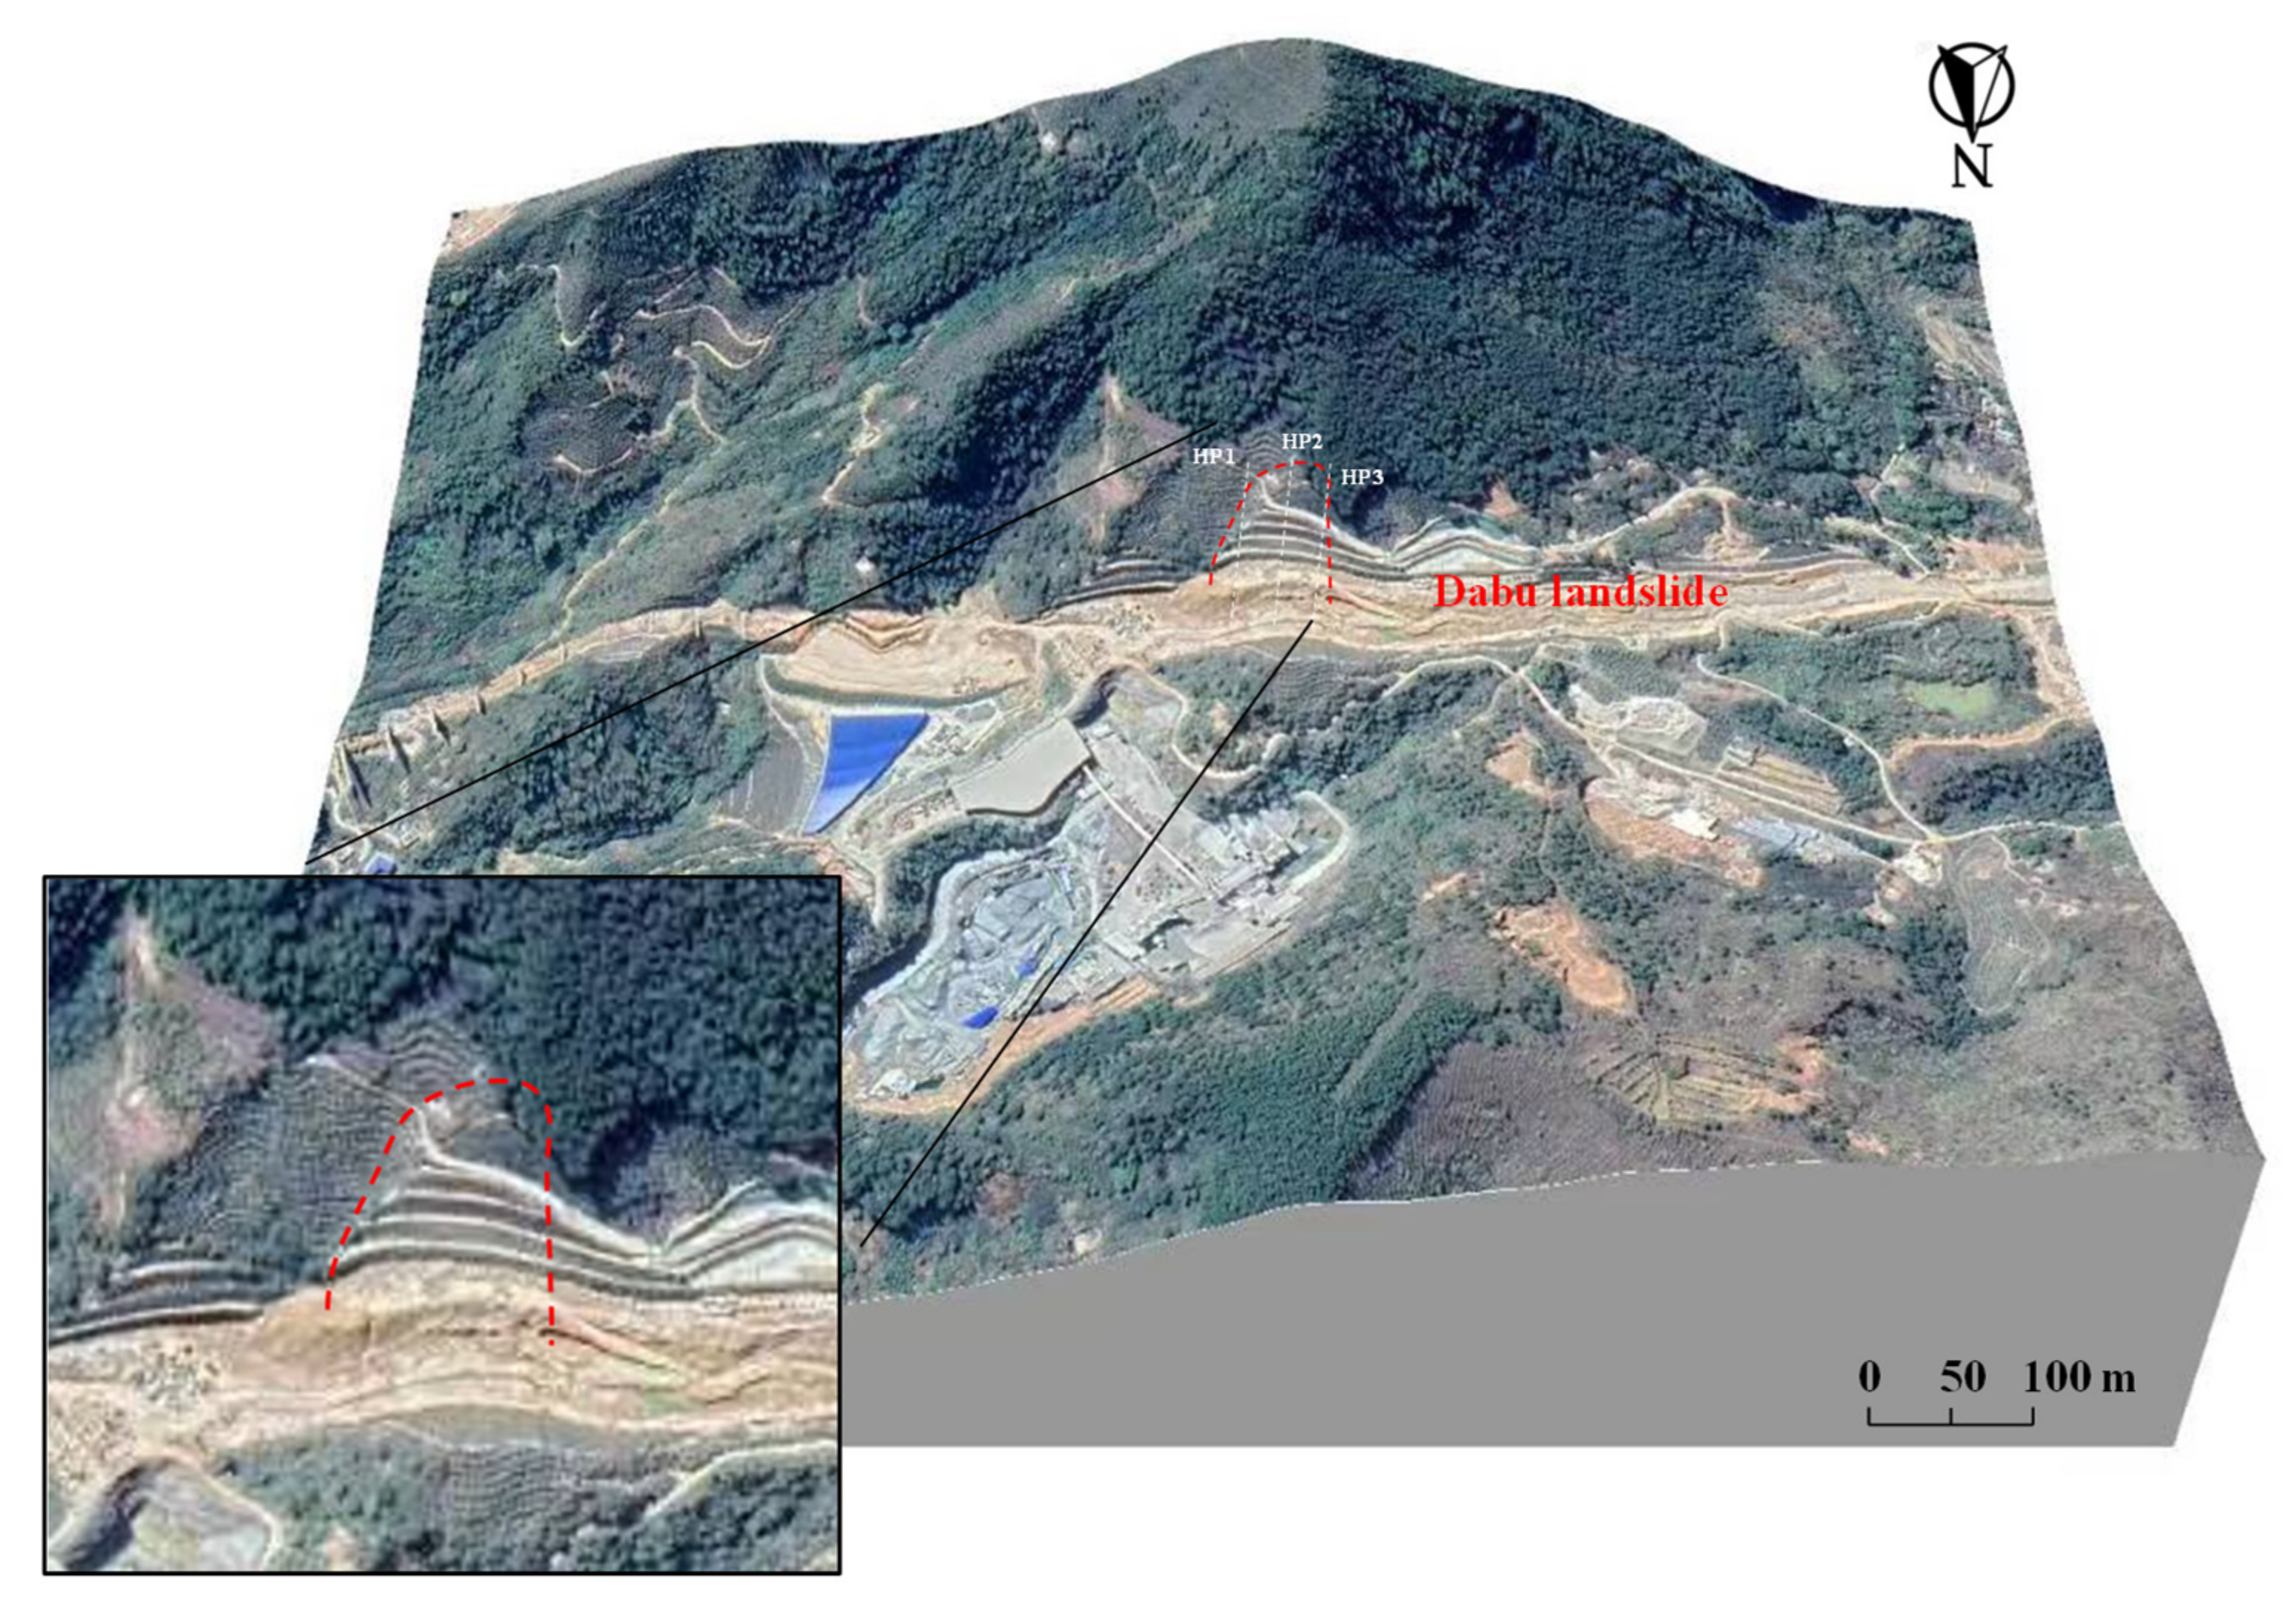
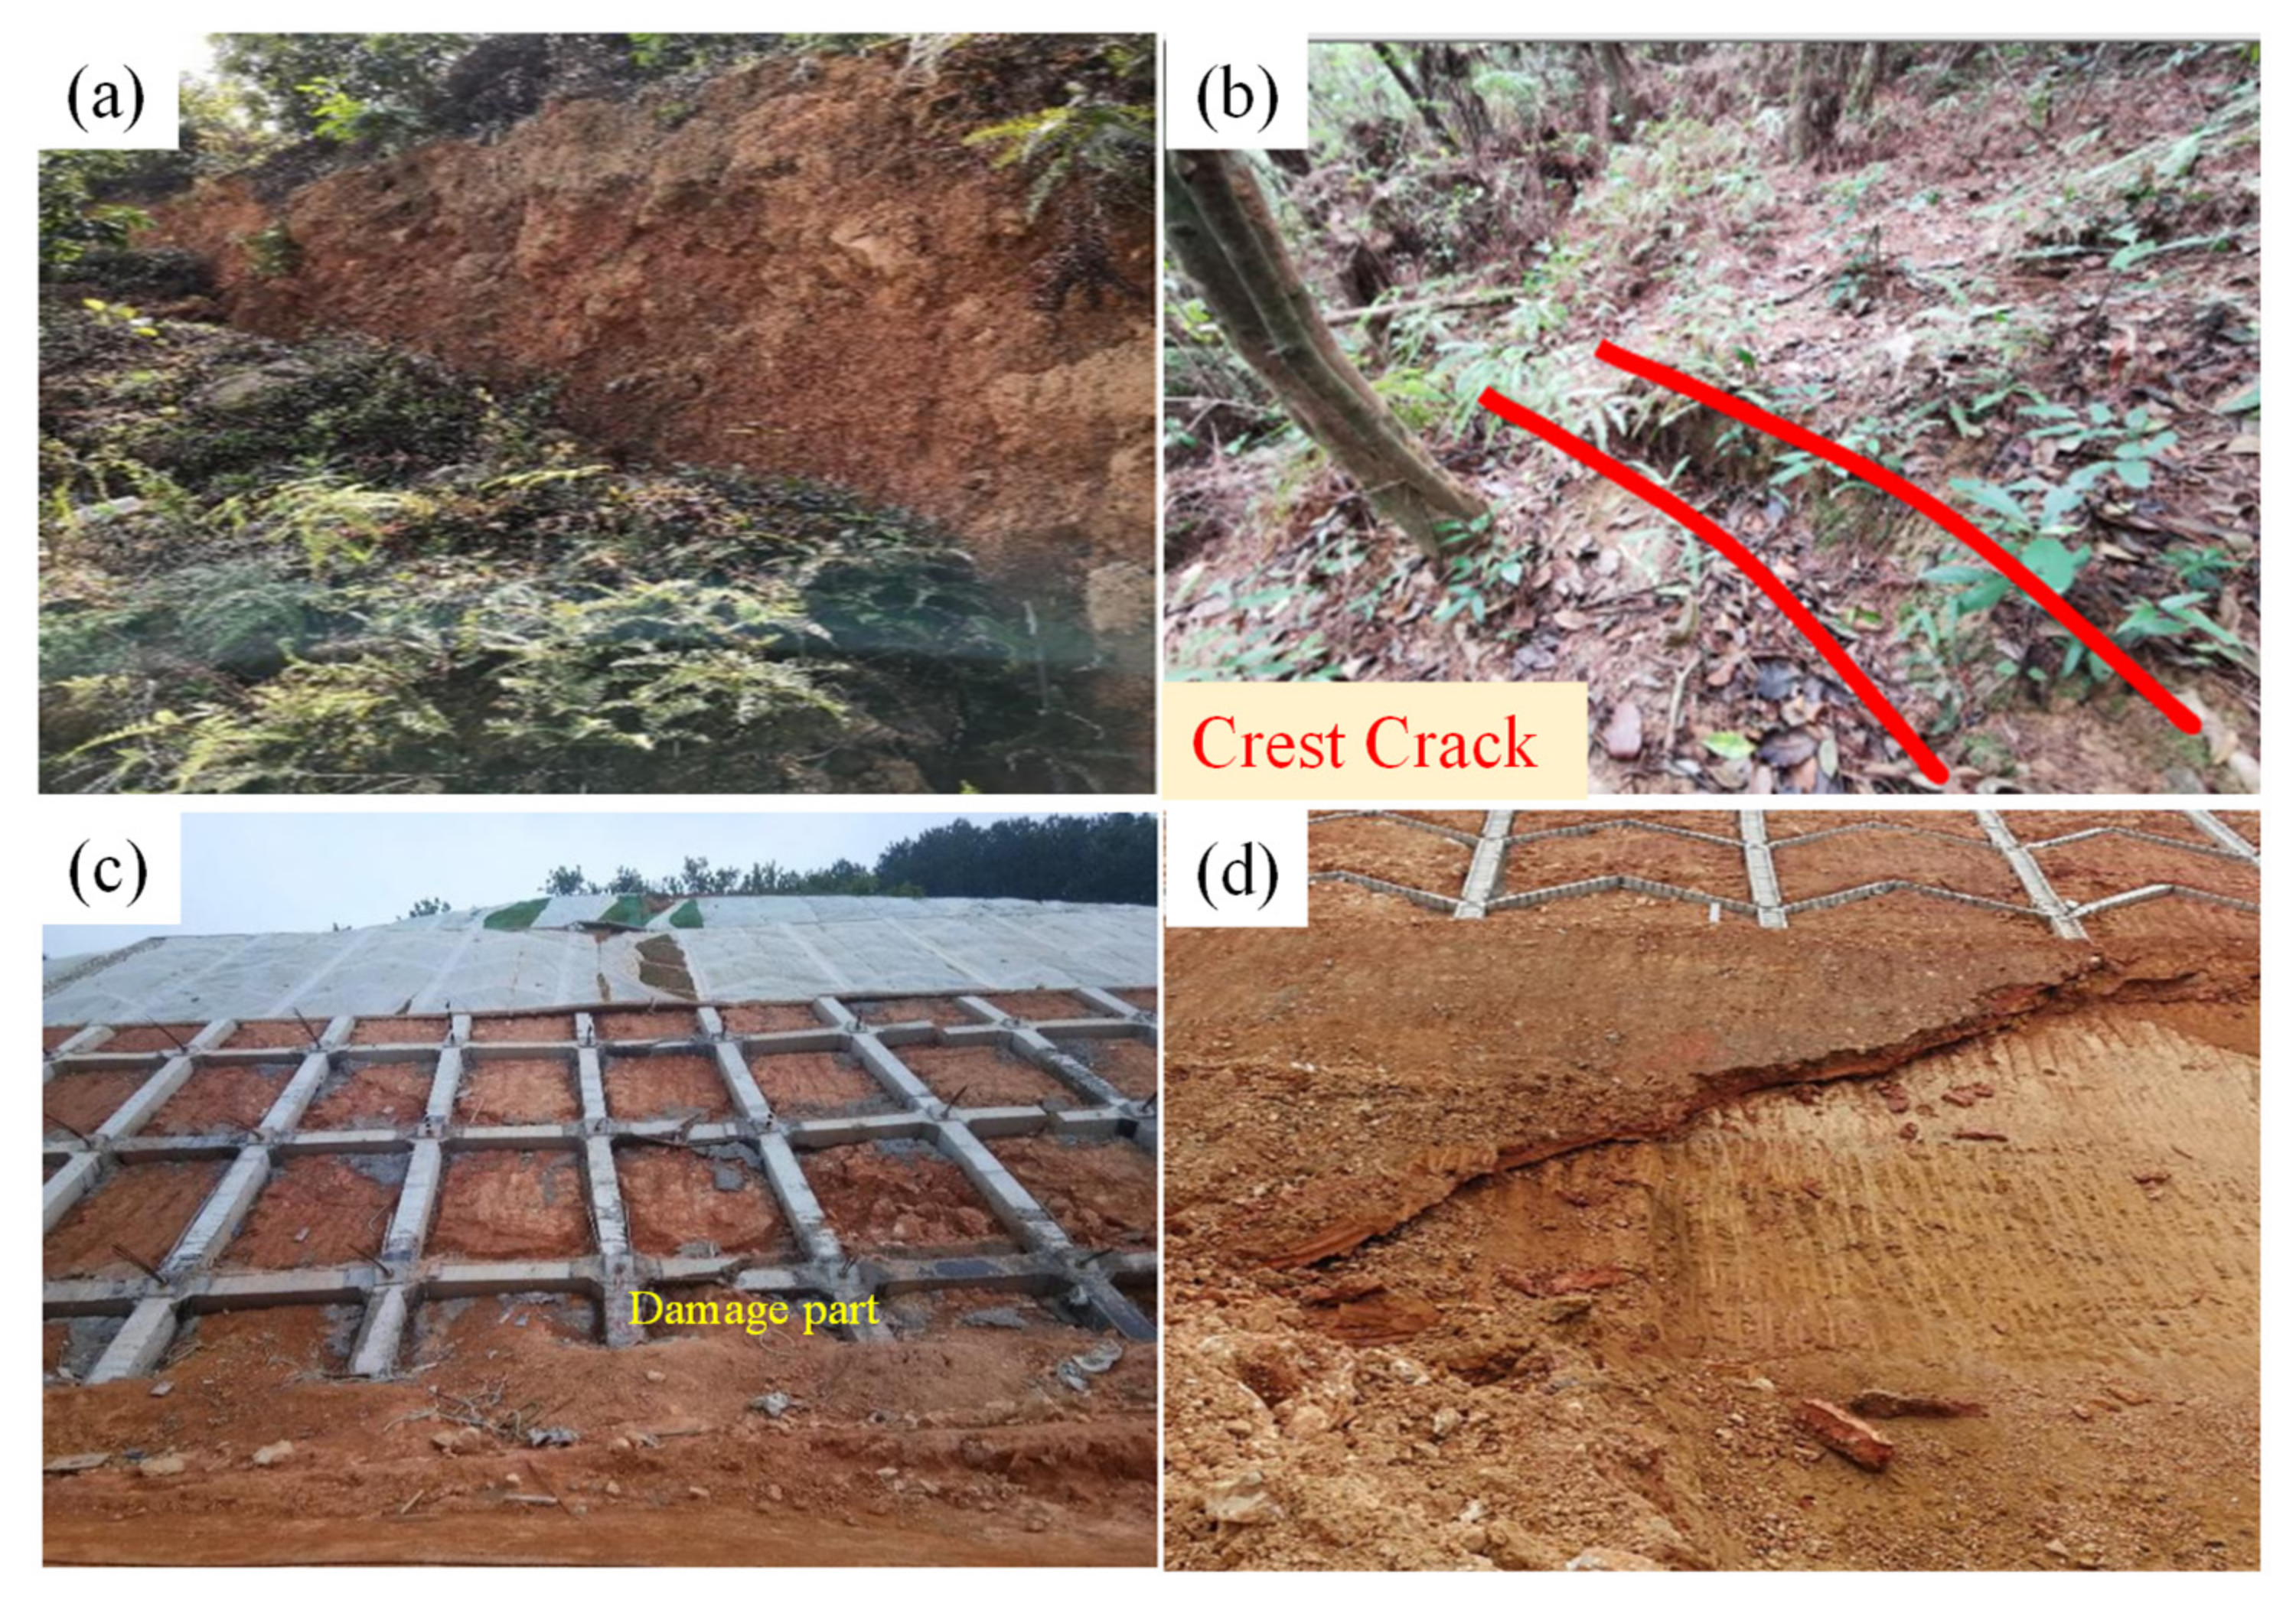
2.2. Dabu Landslide
3. Failure Potential of Dabu Landslide
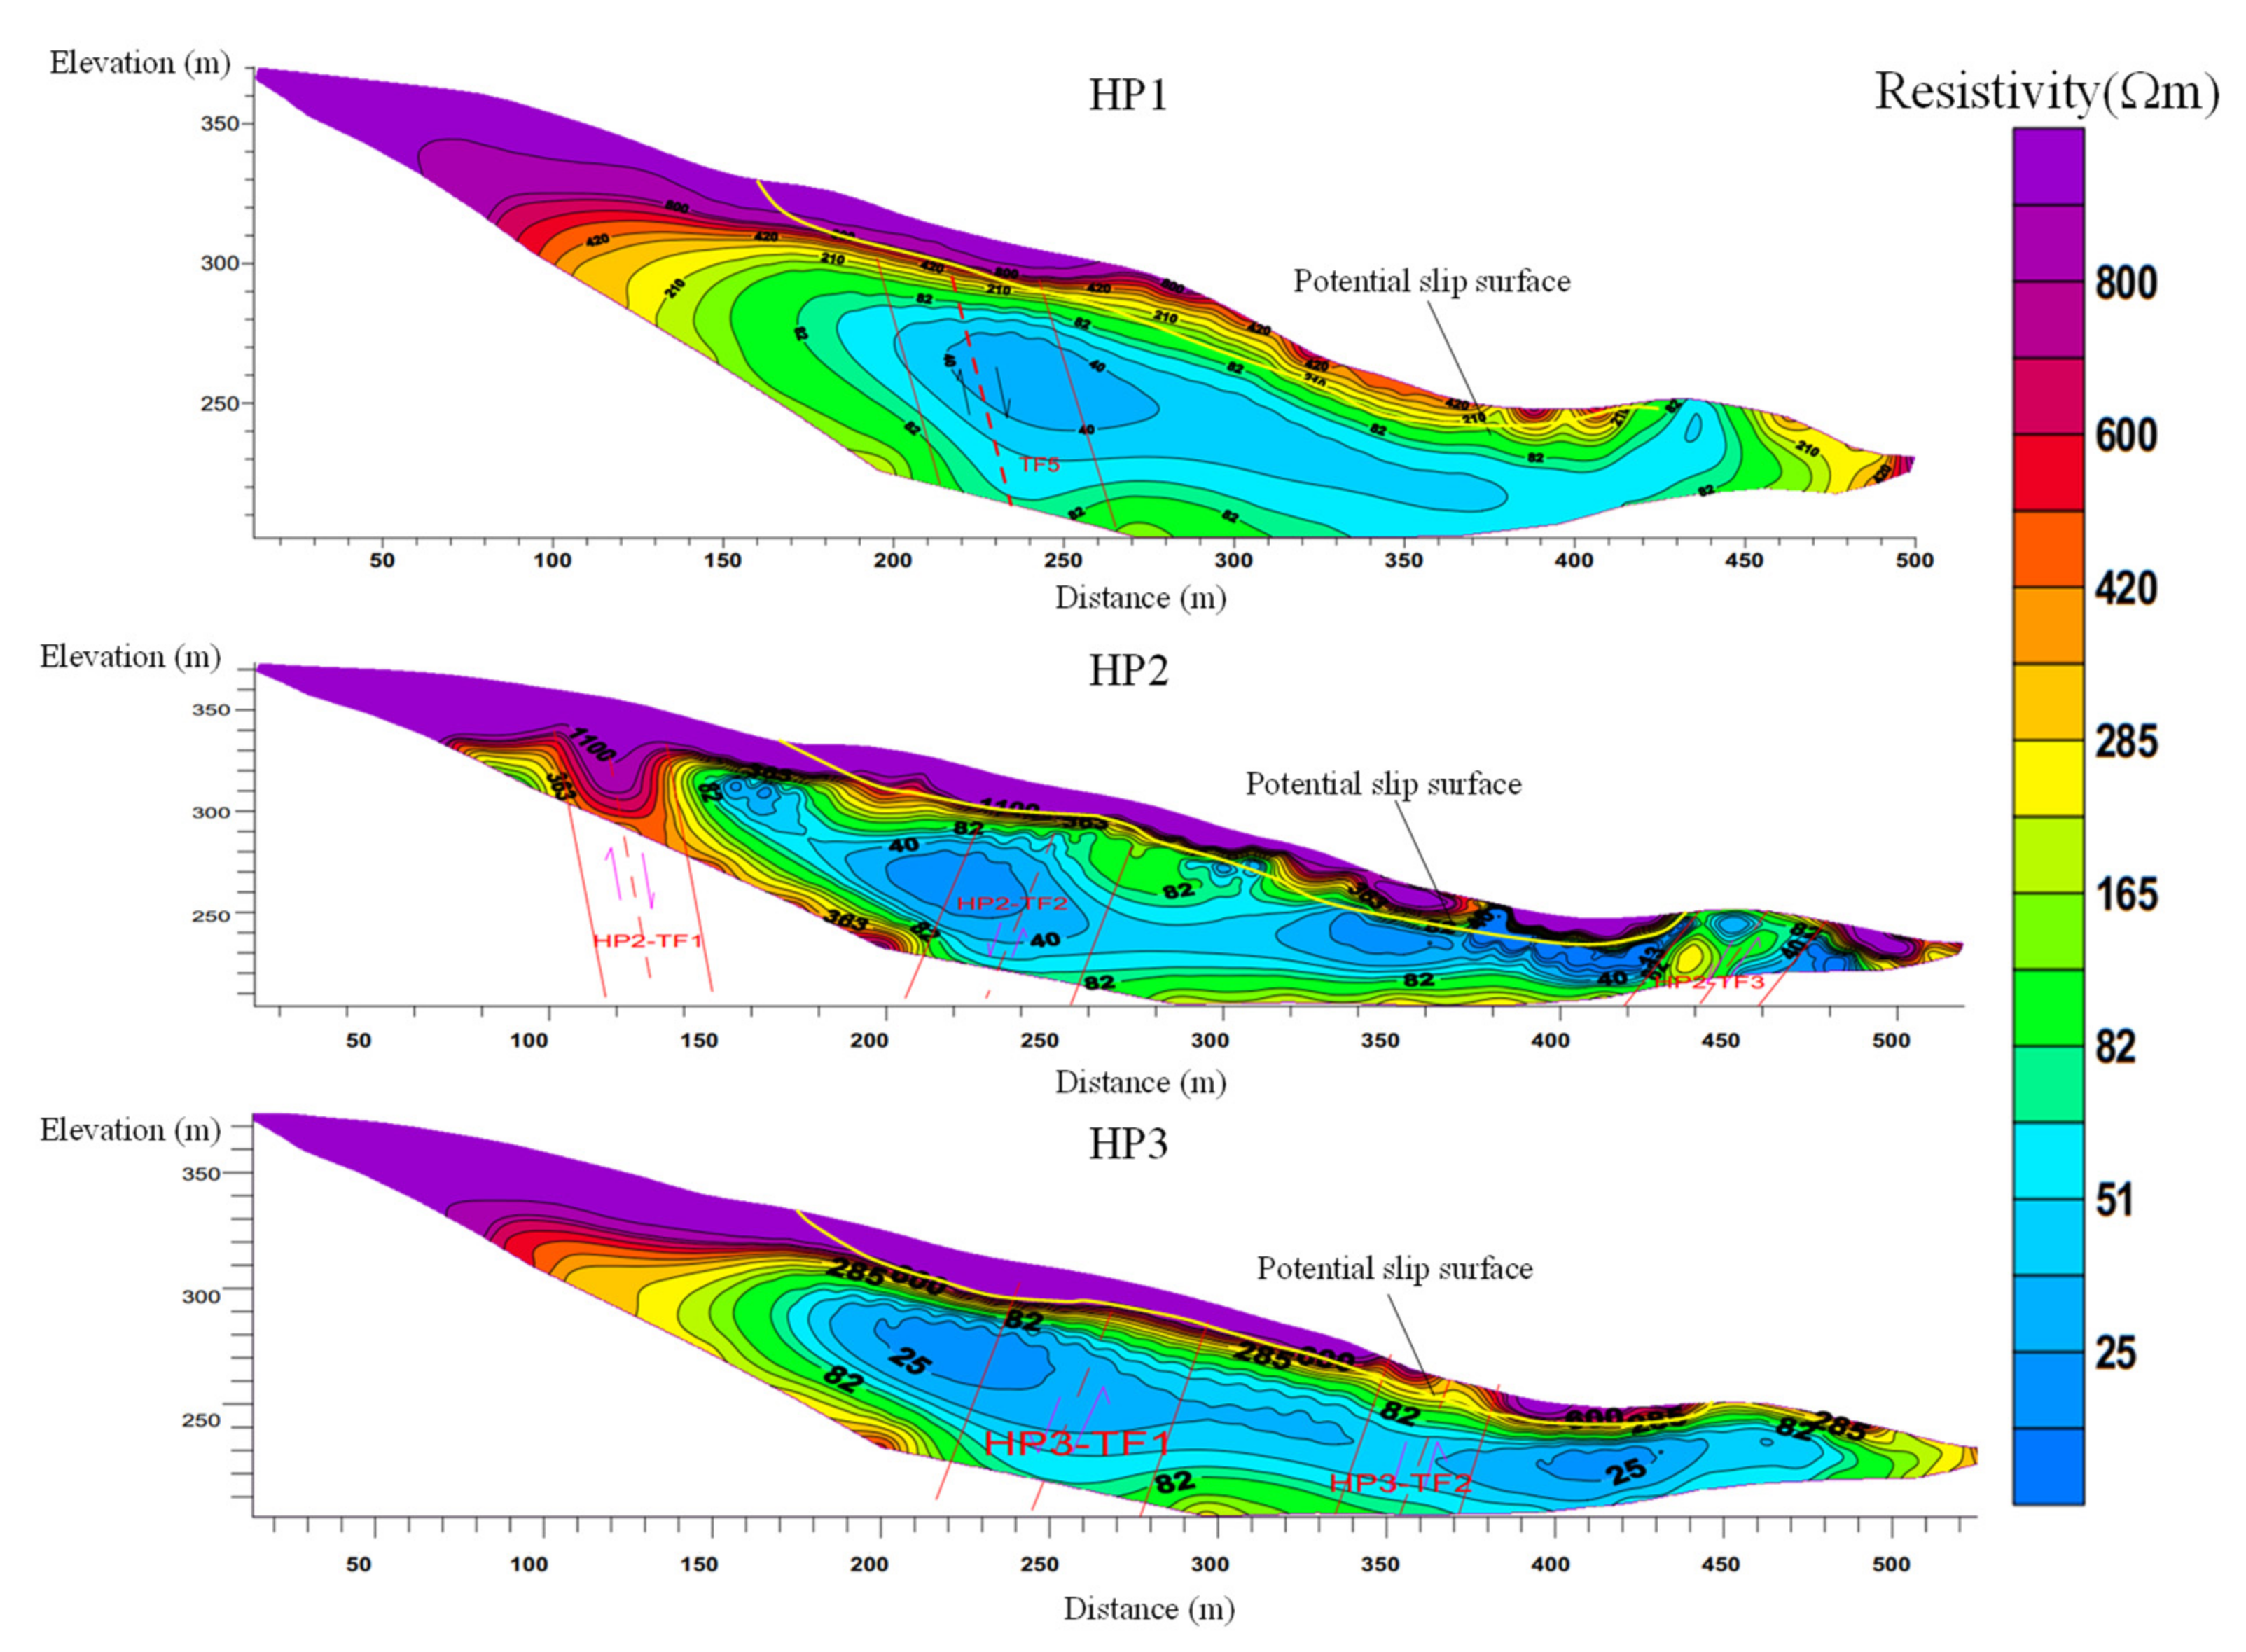
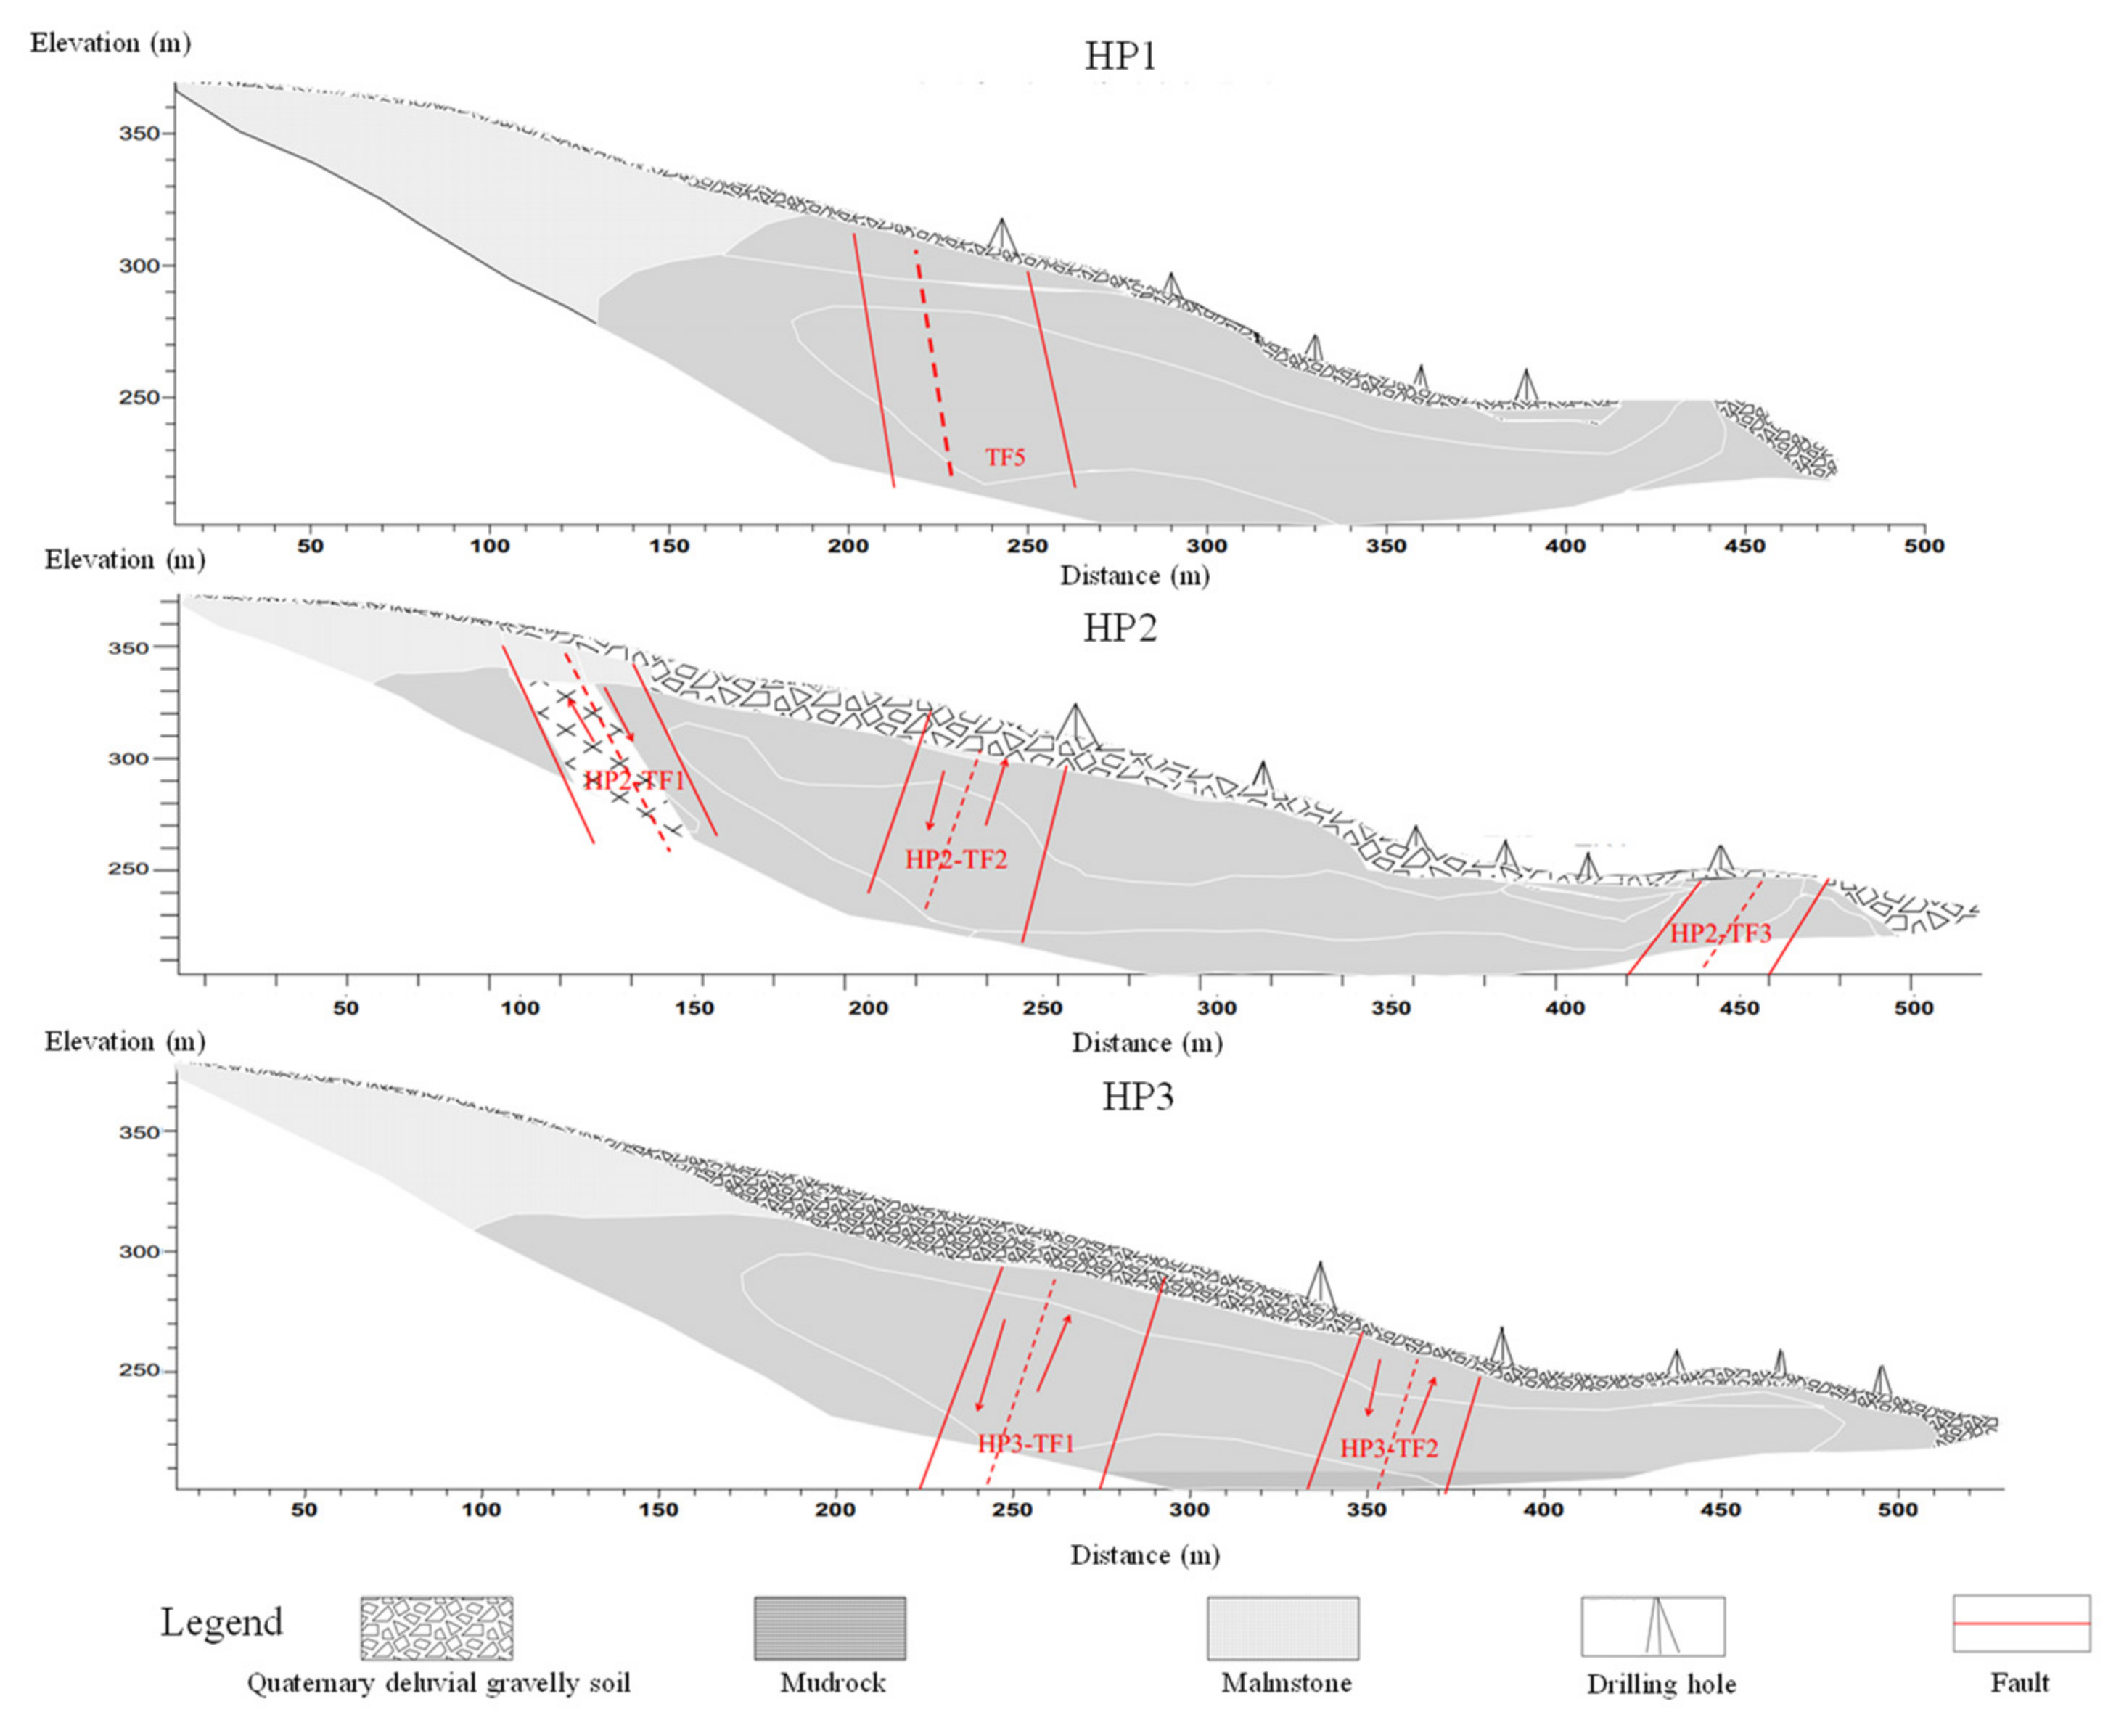
3.1. Electrical Resistivity Tomography Analysis
3.2. Stability Analysis
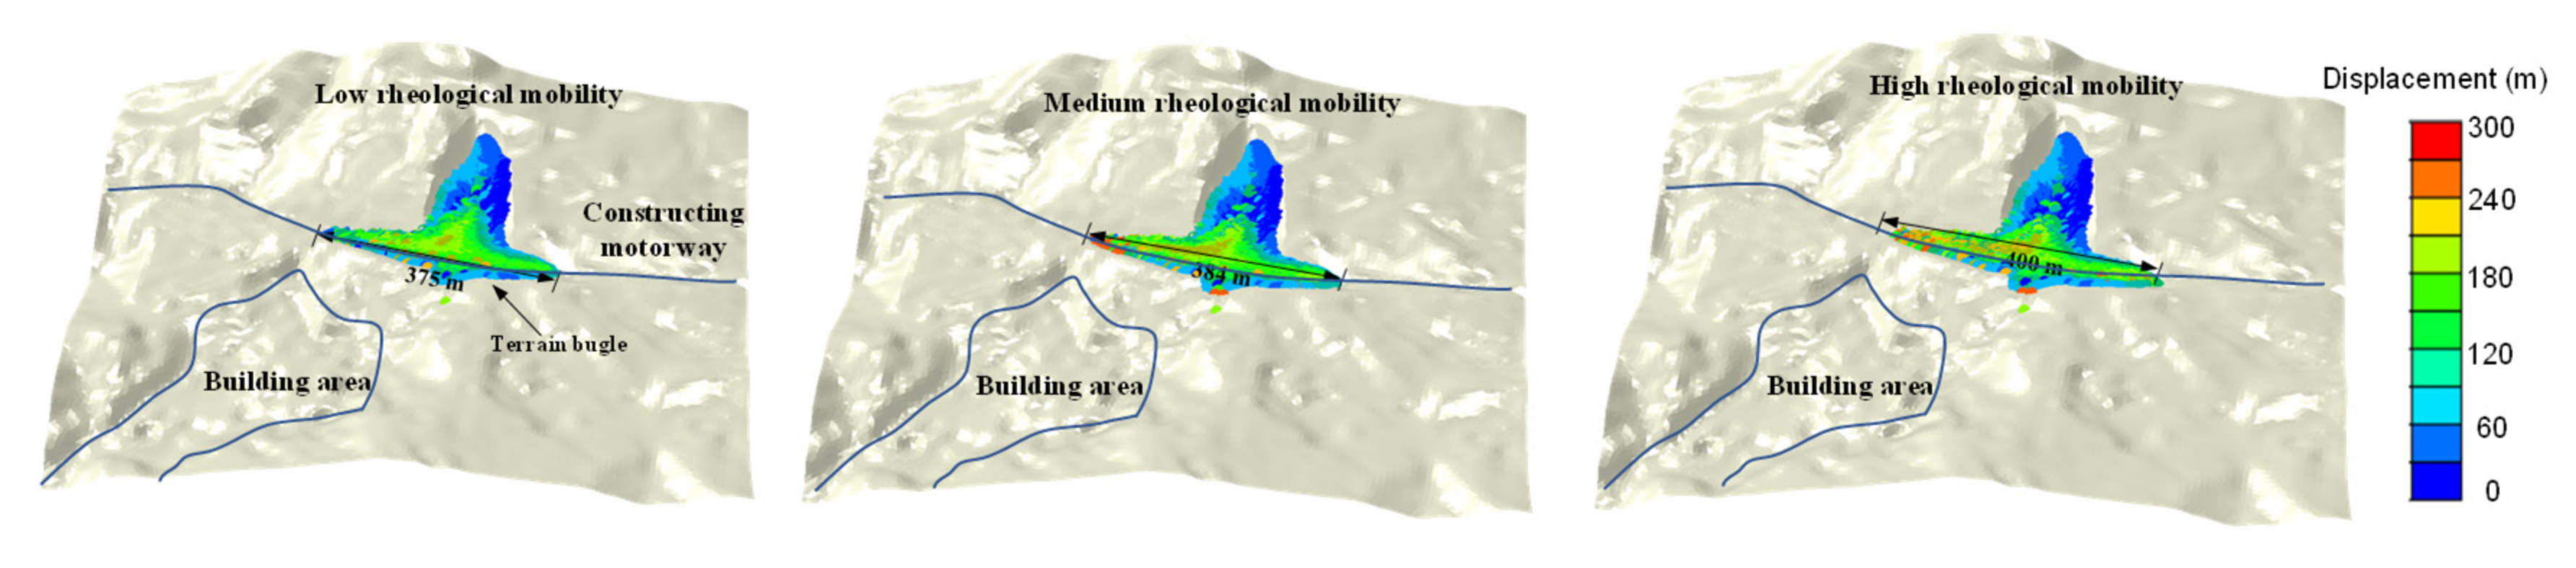
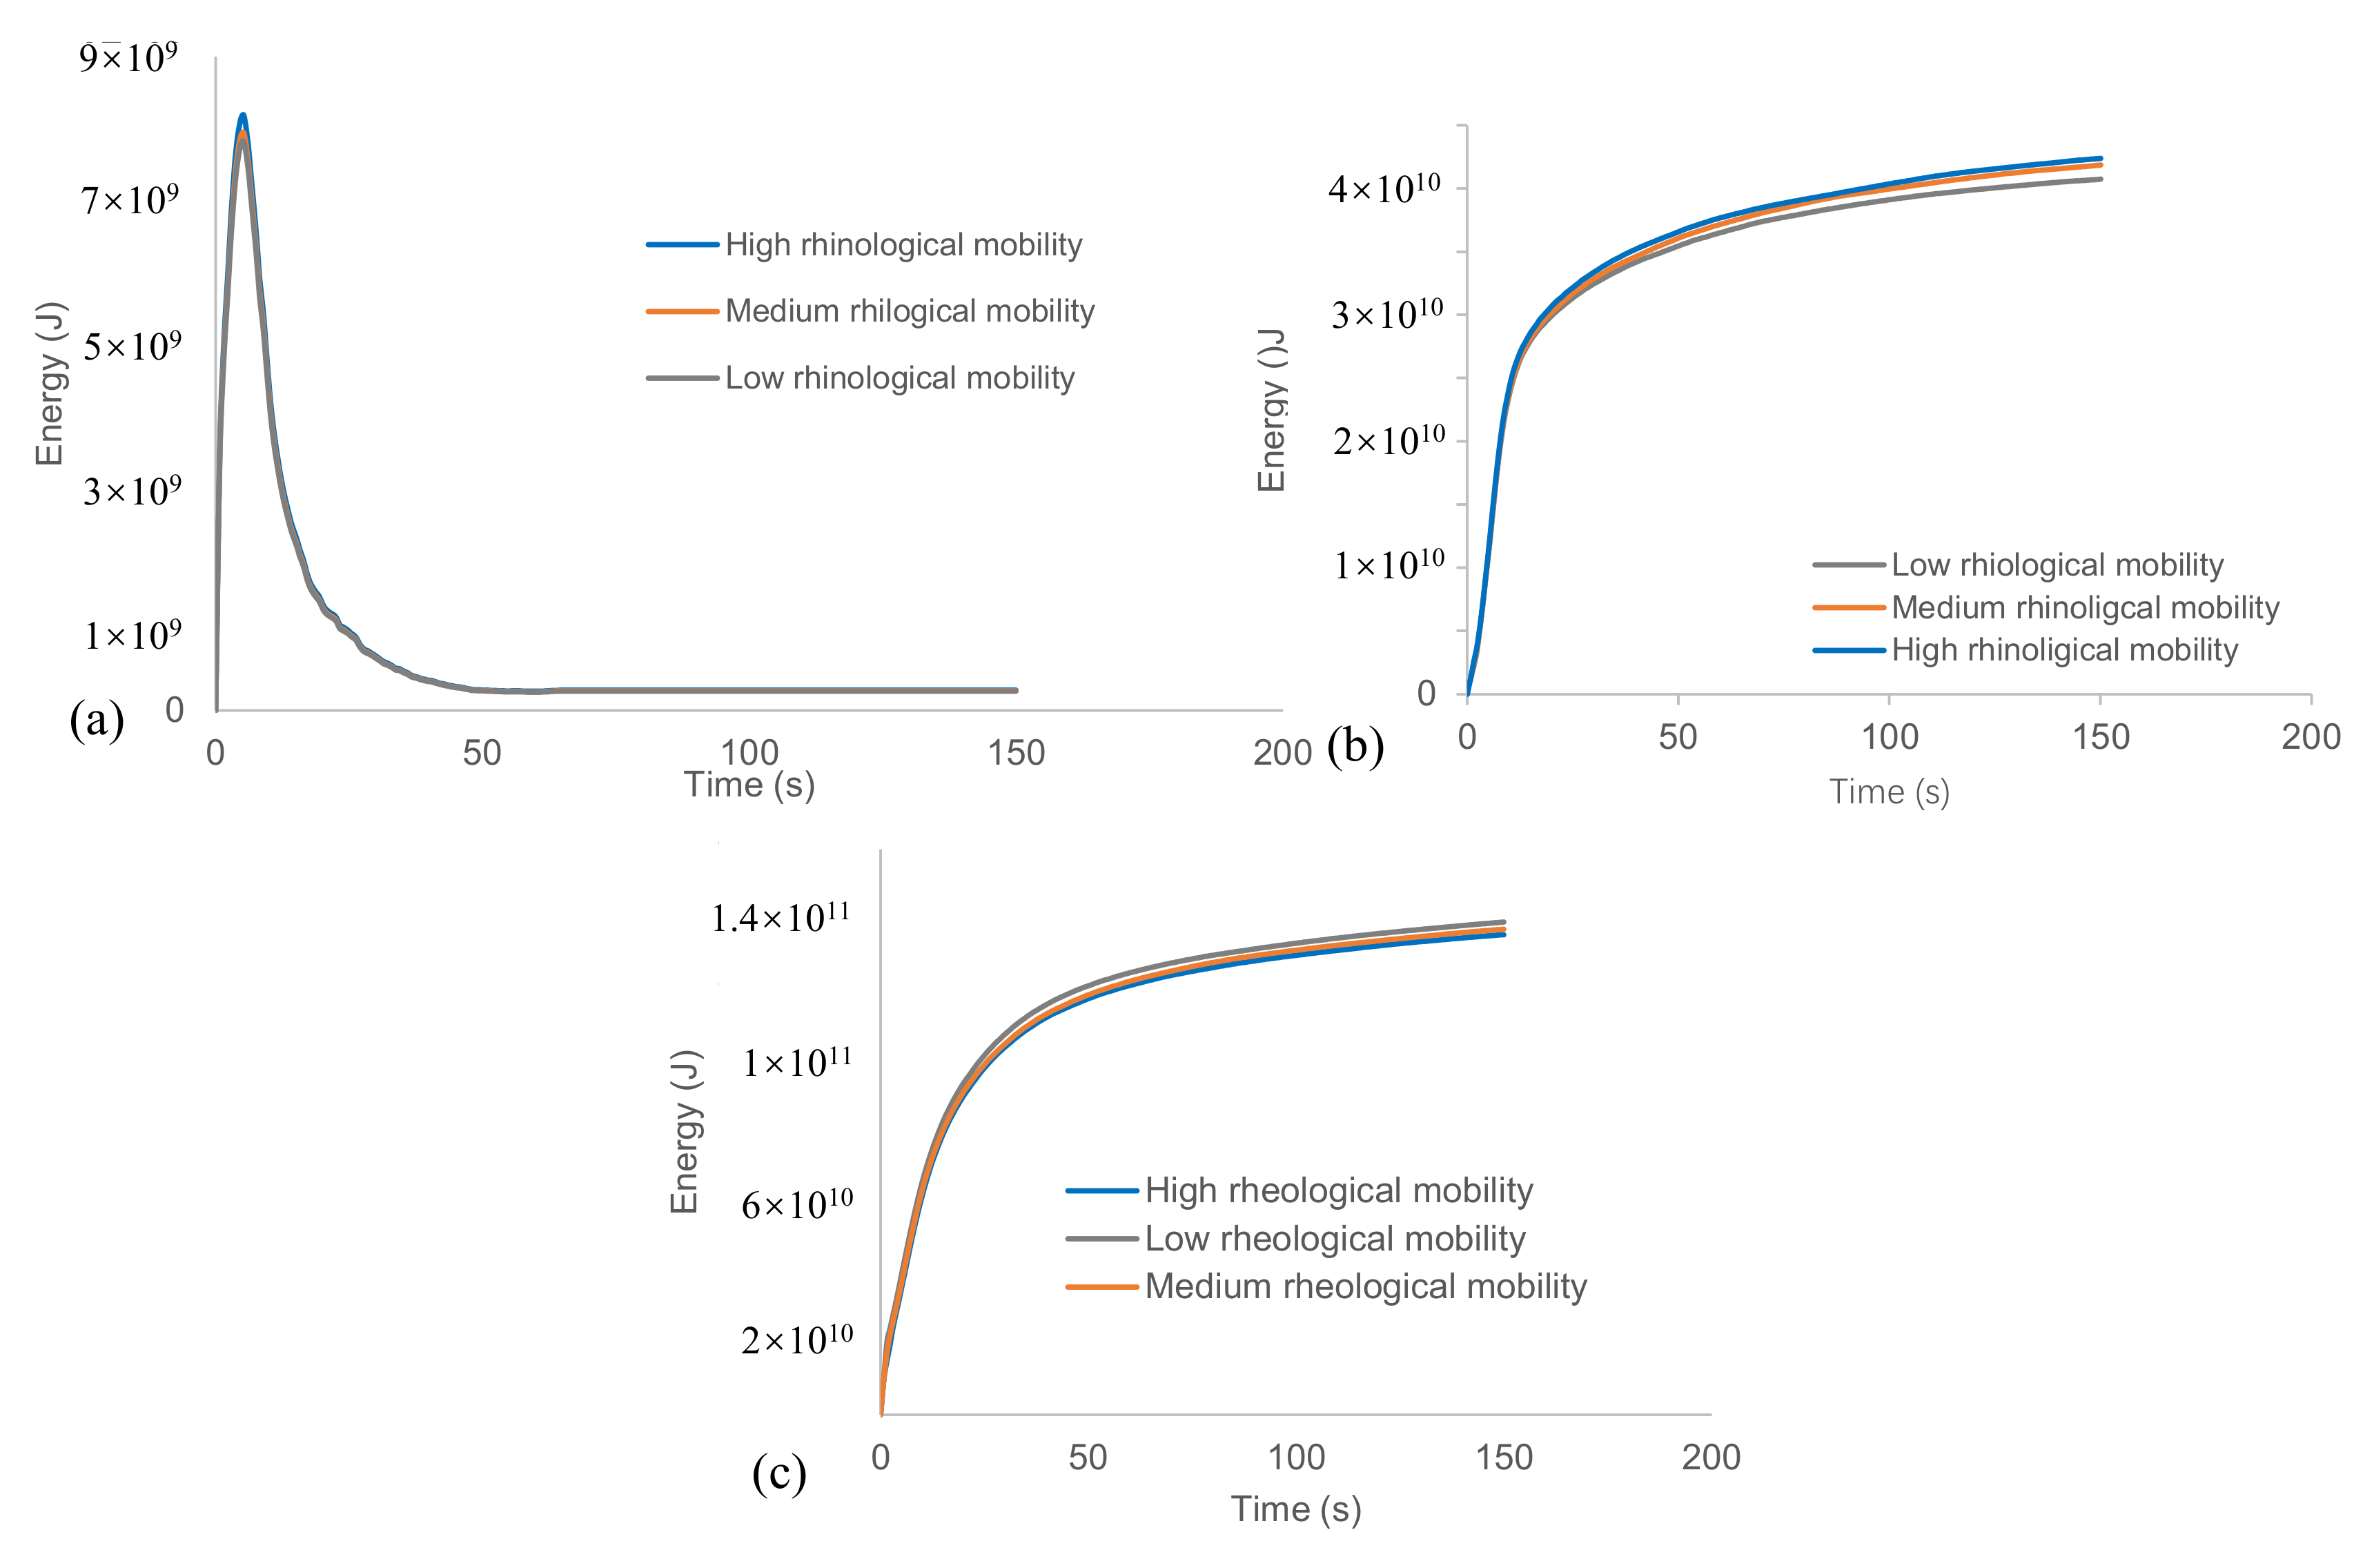
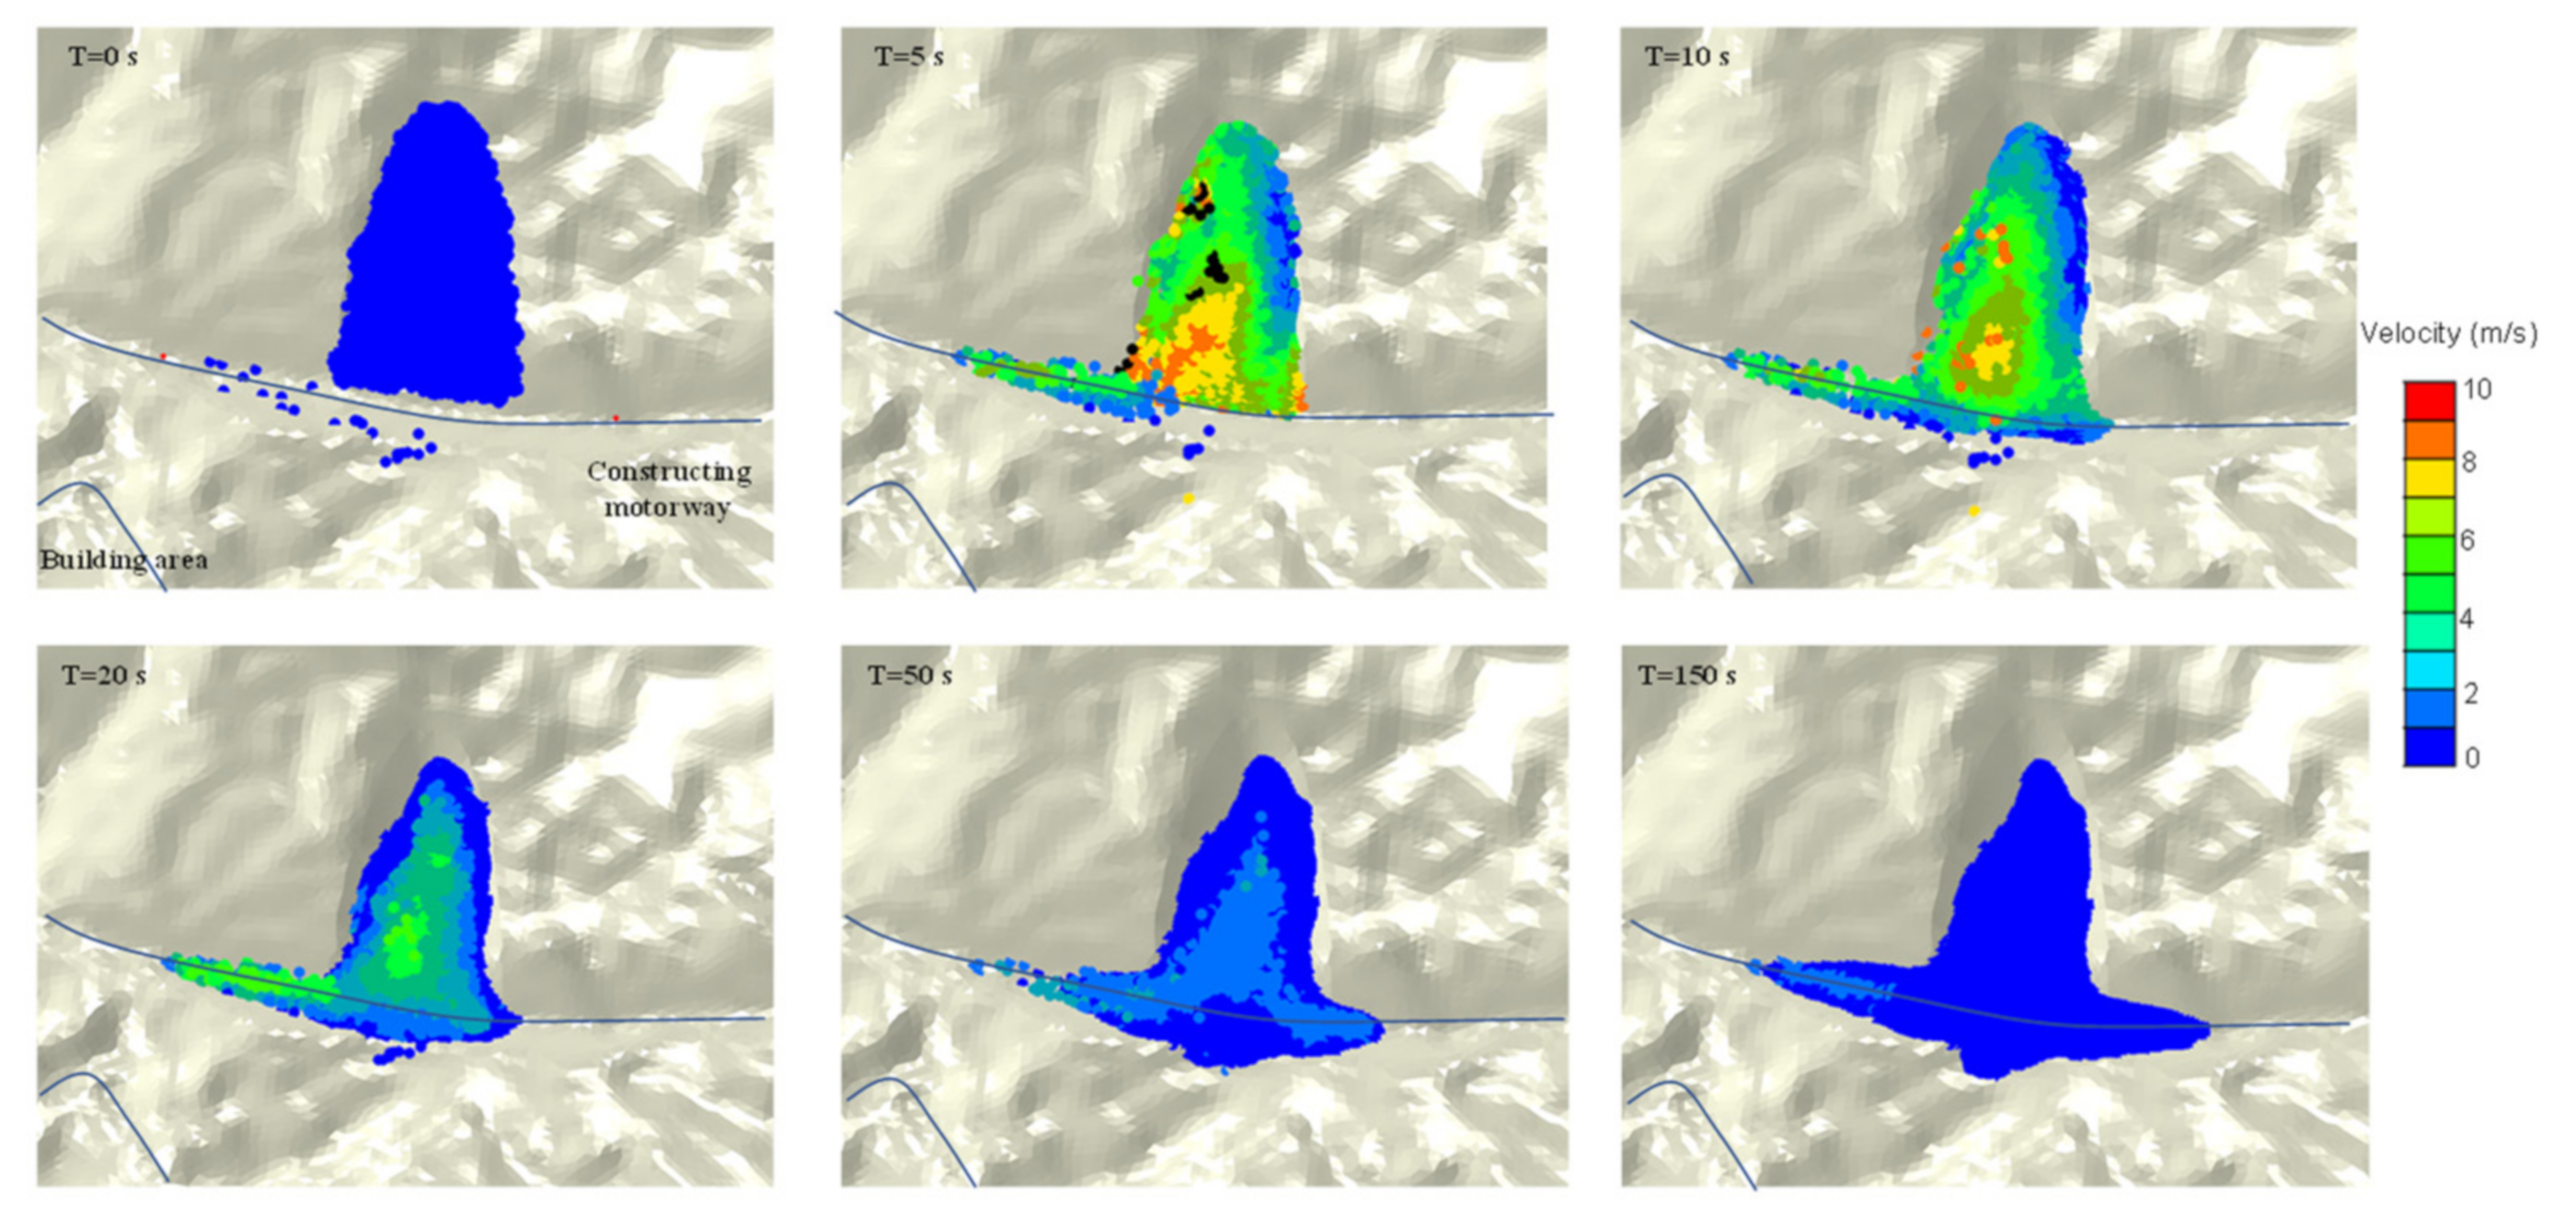
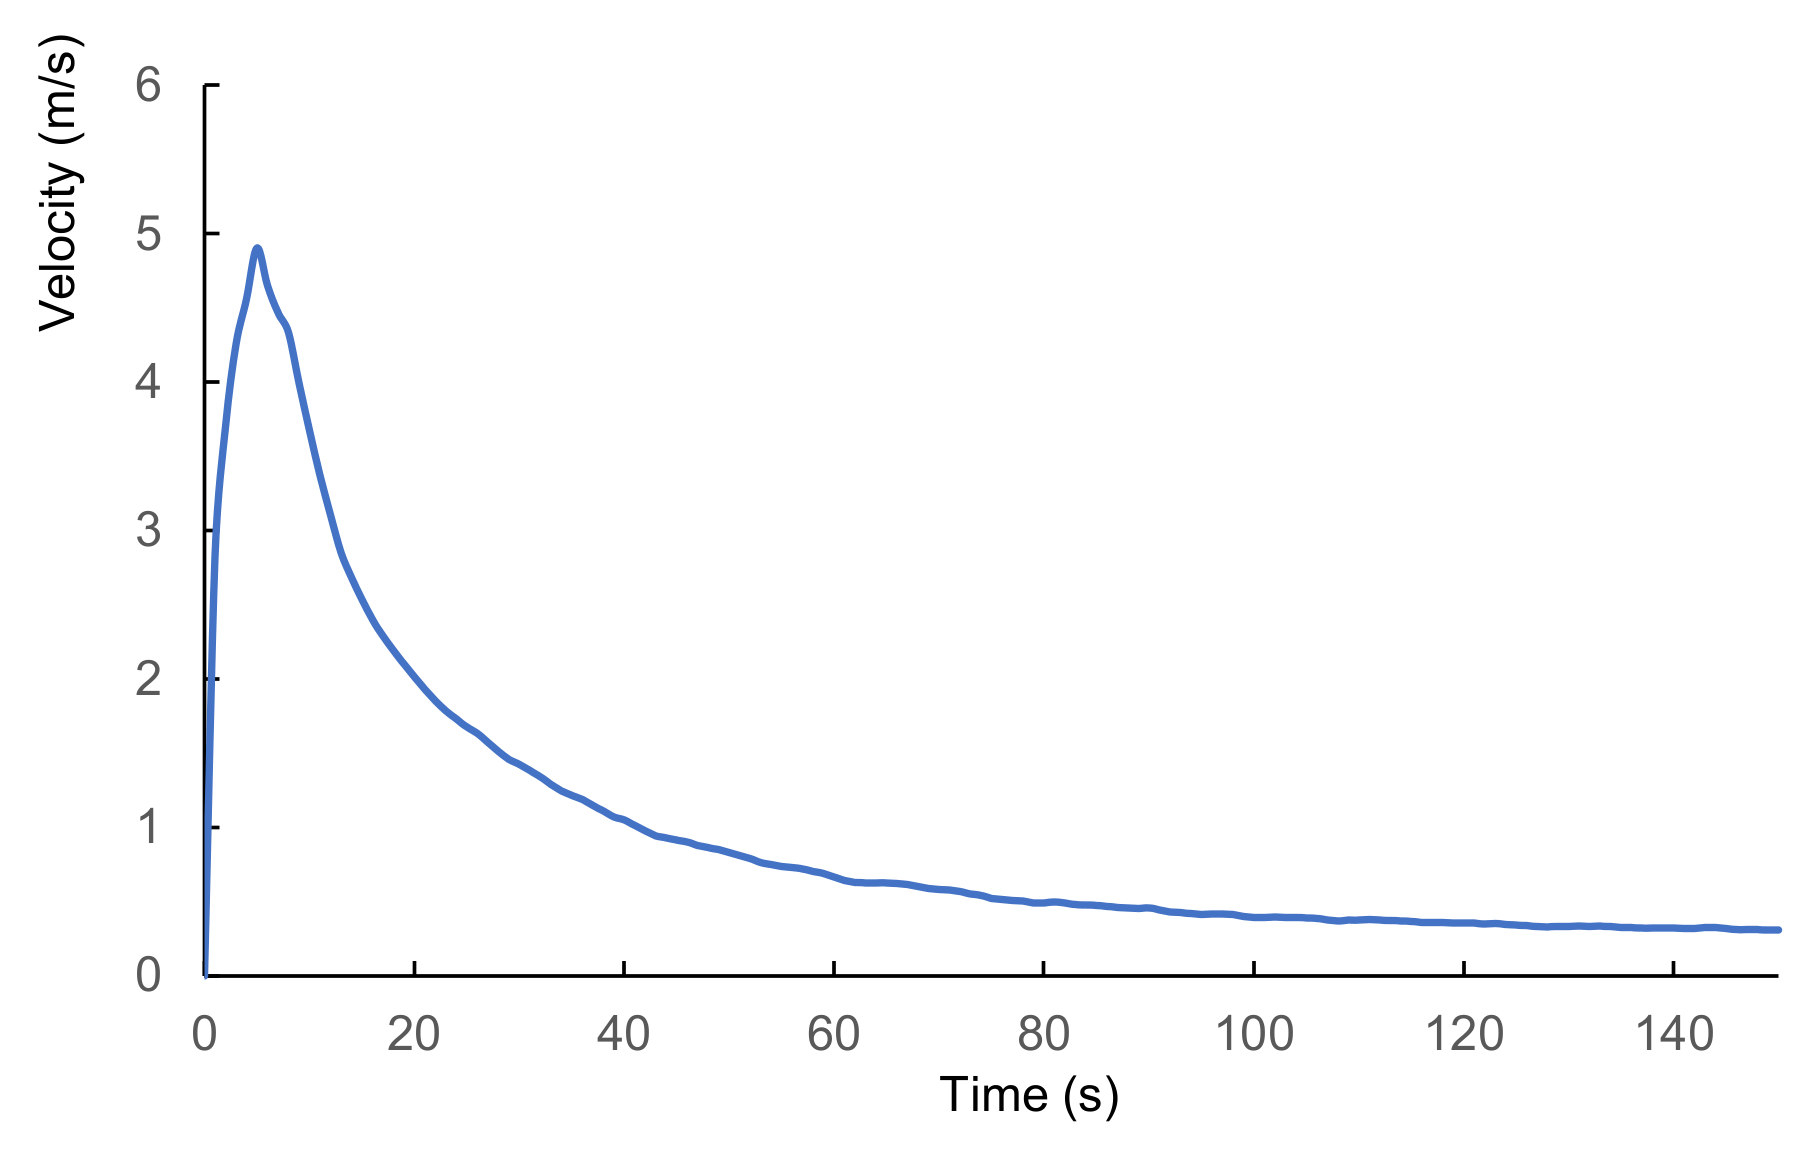
3.3. Landslide Potential Post-Failure Analysis
4. Discussion
5. Conclusions
Author Contributions
Funding
Data Availability Statement
Acknowledgments
Conflicts of Interest
References
- Bao, Y.; Su, L.; Chen, J.; Ouyang, C.; Yang, T.; Lei, Z.; Li, Z. Dynamic process of a high-level landslide blocking river event in a deep valley area based on FDEM-SPH coupling approach. Eng. Geol. 2023, 319, 107108. [Google Scholar] [CrossRef]
- Ibañez, J.P.; Hatzor, Y.H. Rapid sliding and friction degradation: Lessons from the catastrophic Vajont landslide. Eng. Geol. 2018, 244, 96–106. [Google Scholar] [CrossRef]
- Tsuguti, H.; Seino, N.; Kawase, H.; Imada, Y.; Nakaegawa, T.; Takayabu, I. Meteorological overview and mesoscale characteristics of the Heavy Rain Event of July 2018 in Japan. Landslides 2019, 16, 363–371. [Google Scholar] [CrossRef]
- Song, D.; Shi, W.; Wang, C.; Dong, L.; He, X.; Wu, E.; Zhao, J.; Lu, R. Numerical Investigation of a Local Precise Reinforcement Method for Dynamic Stability of Rock Slope under Earthquakes Using Continuum–Discontinuum Element Method. Sustainability 2023, 15, 2490. [Google Scholar] [CrossRef]
- Bao, Y.; Chen, J.; Su, L.; Zhang, W.; Zhan, J. A novel numerical approach for rock slide blocking river based on the CEFDEM model: A case study from the Samaoding paleolandslide blocking river event. Eng. Geol. 2023, 312, 106949. [Google Scholar] [CrossRef]
- Zhao, B.; Wang, Y.-S.; Li, J.; Wang, J.-L.; Tang, C.-X. Insights into a giant landslide-prone area on the eastern margin of the Tibetan Plateau, China. J. Mt. Sci. 2021, 18, 21–37. [Google Scholar] [CrossRef]
- Bao, Y.; Li, Y.; Zhang, Y.; Yan, J.; Zhou, X.; Zhang, X. Investigation of the role of crown crack in cohesive soil slope and its effect on slope stability based on the extended finite element method. Nat. Hazards 2022, 110, 295–314. [Google Scholar] [CrossRef]
- Tang, L.; Zhao, Z.; Luo, Z.; Sun, Y. What is the role of tensile cracks in cohesive slopes? J. Rock Mech. Geotech. Eng. 2019, 11, 314–324. [Google Scholar] [CrossRef]
- Cao, S.; Xiang, W.; Wang, J.; Cui, D.; Liu, Q. Identifying the Groundwater Sources of Huangtupo Landslide in the Three Gorges Reservoir Area of China. Water 2023, 15, 1741. [Google Scholar] [CrossRef]
- Wang, R.; Zhao, K.; Wei, C.; Li, X.; Li, M.; Zhang, J. Study on the Soil Deterioration Mechanism in the Subsidence Zone of the Wildcat Landslide in the Three Gorges Reservoir Area. Water 2023, 15, 886. [Google Scholar] [CrossRef]
- Wang, Y.; Liu, D.; Dong, J.; Zhang, L.; Guo, J.; Liao, M.; Gong, J. On the applicability of satellite SAR interferometry to landslide hazards detection in hilly areas: A case study of Shuicheng, Guizhou in Southwest China. Landslides 2021, 18, 2609–2619. [Google Scholar] [CrossRef]
- Xu, Q.; Zheng, G.; Li, W.; He, C.; Dong, X.; Guo, X.; Feng, W. Study on successive landslide damming events of Jinsha River in Baige Village on Octorber 11 and November 3. J. Eng. Geol. 2018, 26, 1534–1551. [Google Scholar]
- Peng, W.; Song, S.; Yu, C.; Bao, Y.; Sui, J.; Hu, Y. Forecasting Landslides via Three-Dimensional Discrete Element Modeling: Helong Landslide Case Study. Appl. Sci. 2019, 9, 5242. [Google Scholar] [CrossRef] [Green Version]
- Zhan, J.; Wang, Q.; Zhang, W.; Shangguan, Y.; Song, S.; Chen, J. Soil-engineering properties and failure mechanisms of shallow landslides in soft-rock materials. Catena 2019, 181, 104093. [Google Scholar] [CrossRef]
- Imani, P.; Tian, G.; Hadiloo, S.; Abd El-Raouf, A. Application of combined electrical resistivity tomography (ERT) and seismic refraction tomography (SRT) methods to investigate Xiaoshan District landslide site: Hangzhou, China. J. Appl. Geophys. 2021, 184, 104236. [Google Scholar] [CrossRef]
- Imani, P.; Tian, G.; EL-Raouf, A.A. Assessment of spatiotemporal changes in water contents of landslide zone by geophysical methods: A case study. Arab. J. Geosci. 2021, 14, 1380. [Google Scholar] [CrossRef]
- El-Raouf, A.A.; Iqbal, I.; Meister, J.; Abdelrahman, K.; Alzahrani, H.; Badran, O.M. Earthflow reactivation assessment by multichannel analysis of surface waves and electrical resistivity tomography: A case study. Open Geosci. 2021, 13, 1328–1344. [Google Scholar] [CrossRef]
- Bao, Y.; Zhai, S.; Chen, J.; Xu, P.; Sun, X.; Zhan, J.; Zhang, W.; Zhou, X. The evolution of the Samaoding paleolandslide river blocking event at the upstream reaches of the Jinsha River, Tibetan Plateau. Geomorphology 2020, 351, 106970. [Google Scholar] [CrossRef]
- Li, Y.; Chen, J.; Yan, J.; Zhou, F.; Wang, Q.; Li, Z.; Zhang, Y. Formation and evolution of a giant old deposit in the First Bend of the Yangtze River on the southeastern margin of the Qinghai-Tibet Plateau. Catena 2022, 213, 106138. [Google Scholar] [CrossRef]
- Li, Y.; Chen, J.; Zhou, F.; Bao, Y.; Li, Z.; Song, S.; Cao, C. Stability evaluation of rock slope based on discrete fracture network and discrete element model: A case study for the right bank of Yigong Zangbu Bridge. Acta Geotech. 2022, 17, 1423–1441. [Google Scholar] [CrossRef]
- Lo, C.-M.; Lin, M.-L.; Tang, C.-L.; Hu, J.-C. A kinematic model of the Hsiaolin landslide calibrated to the morphology of the landslide deposit. Eng. Geol. 2011, 123, 22–39. [Google Scholar] [CrossRef]
- Dai, Z.; Huang, Y. A three-dimensional model for flow slides in municipal solid waste landfills using smoothed particle hydrodynamics. Environ. Earth Sci. 2016, 75, 132. [Google Scholar] [CrossRef]
- Pastor, M.; Blanc, T.; Haddad, B.; Petrone, S.; Sanchez Morles, M.; Drempetic, V.; Issler, D.; Crosta, G.B.; Cascini, L.; Sorbino, G.; et al. Application of a SPH depth-integrated model to landslide run-out analysis. Landslides 2014, 11, 793–812. [Google Scholar] [CrossRef] [Green Version]
- Li, X.; Yan, Q.; Zhao, S.; Luo, Y.; Wu, Y.; Wang, D. Investigation of influence of baffles on landslide debris mobility by 3D material point method. Landslides 2020, 17, 1129–1143. [Google Scholar] [CrossRef]
- Llano-Serna, M.A.; Farias, M.M.; Pedroso, D.M. An assessment of the material point method for modelling large scale run-out processes in landslides. Landslides 2016, 13, 1057–1066. [Google Scholar] [CrossRef]
- Han, X.; Chen, J.; Xu, P.; Zhan, J. A well-balanced numerical scheme for debris flow run-out prediction in Xiaojia Gully considering different hydrological designs. Landslides 2017, 14, 2105–2114. [Google Scholar] [CrossRef]
- Bao, Y.; Sun, X.; Chen, J.; Zhang, W.; Han, X.; Zhan, J. Stability assessment and dynamic analysis of a large iron mine waste dump in Panzhihua, Sichuan, China. Environ. Earth Sci. 2019, 78, 48. [Google Scholar] [CrossRef]
- Wang, L.; Wu, C.; Gu, X.; Liu, H.; Mei, G.; Zhang, W. Probabilistic stability analysis of earth dam slope under transient seepage using multivariate adaptive regression splines. Bull. Eng. Geol. Environ. 2020, 79, 2763–2775. [Google Scholar] [CrossRef]
- Zhang, W.; Wu, C.; Tang, L.; Gu, X.; Wang, L. Efficient time-variant reliability analysis of Bazimen landslide in the Three Gorges Reservoir Area using XGBoost and LightGBM algorithms. Gondwana Res. 2022. [Google Scholar] [CrossRef]
- Zhang, W.; Gu, X.; Hong, L.; Han, L.; Wang, L. Comprehensive review of machine learning in geotechnical reliability analysis: Algorithms, applications and further challenges. Appl. Soft Comput. 2023, 136, 110066. [Google Scholar] [CrossRef]
- Pellegrino, A.M.; Anna, S.D.S.; Schippa, L. An integrated procedure to evaluate rheological parameters to model debris flows. Eng. Geol. 2015, 196, 88–98. [Google Scholar] [CrossRef]
- Zhang, X.; Shu, C.; Fujii, M.; Wu, Y.; Sun, D.; Ye, P.; Bao, Y. Numerical and Experimental Study on Water-Heat-Salt Transport Patterns in Shallow Bare Soil with Varying Salt Contents under Evaporative Conditions: A Comparative Investigation. J. Hydrol. 2023, 621, 129564. [Google Scholar] [CrossRef]
- Zhang, X.D.; Shu, C.J.; Wu, Y.J.; Ye, P.; Du, D.W. Advances of coupled water-heat-salt theory and test techniques for soils in cold and arid regions: A review. Geoderma 2023, 432, 116378. [Google Scholar] [CrossRef]
- Zhang, X.D.; Wu, Y.; Zhai, E.; Ye, P. Coupling analysis of the heat-water dynamics and frozen depth in a seasonally frozen zone. J. Hydrol. 2021, 593, 125603. [Google Scholar] [CrossRef]
- Shi, W.; Zhang, J.; Song, D.; Guo, Z.; Tang, G.; Han, D. The September 16, 2013, Numerical investigation of the seismic dynamic response characteristics of high-steep layered granite slopes via time–frequency analysis. Environ. Earth Sci. 2023, 82, 153. [Google Scholar] [CrossRef]
- Bao, Y.; Han, X.; Chen, J.; Zhang, W.; Zhan, J.; Sun, X.; Chen, M. Numerical assessment of failure potential of a large mine waste dump in Panzhihua City, China. Eng. Geol. 2019, 253, 171–183. [Google Scholar] [CrossRef]


| Material Type | Saturated State | Natural State | ||||
|---|---|---|---|---|---|---|
| Weight (kN/m3) | Cohesion C (kPa) | Friction φ (°) | Weight (kN/m3) | Cohesion C (kPa) | Friction φ (°) | |
| Quaternary deluvial gravelly soil | 20 | 5 | 32 | 21 | 4 | 30 |
| Mud rock | 19.5 | 14 | 15 | 20 | 13. | 14.1 |
| Malmstone | 22 | 14 | 28.5 | 22.5 | 13 | 27 |
Disclaimer/Publisher’s Note: The statements, opinions and data contained in all publications are solely those of the individual author(s) and contributor(s) and not of MDPI and/or the editor(s). MDPI and/or the editor(s) disclaim responsibility for any injury to people or property resulting from any ideas, methods, instructions or products referred to in the content. |
© 2023 by the authors. Licensee MDPI, Basel, Switzerland. This article is an open access article distributed under the terms and conditions of the Creative Commons Attribution (CC BY) license (https://creativecommons.org/licenses/by/4.0/).
Share and Cite
Chen, S.; Hao, Y.; Zhang, W.; Sun, Y.; Liu, X. Comprehensive Analysis of the Failure Potential of a Motorway Landslide in Dabu County, China. Water 2023, 15, 2675. https://doi.org/10.3390/w15142675
Chen S, Hao Y, Zhang W, Sun Y, Liu X. Comprehensive Analysis of the Failure Potential of a Motorway Landslide in Dabu County, China. Water. 2023; 15(14):2675. https://doi.org/10.3390/w15142675
Chicago/Turabian StyleChen, Sheng, Yang Hao, Wencai Zhang, Ying Sun, and Xue Liu. 2023. "Comprehensive Analysis of the Failure Potential of a Motorway Landslide in Dabu County, China" Water 15, no. 14: 2675. https://doi.org/10.3390/w15142675