
Impact of Riparian Buffer Zone Design on Surface Water Quality at the Watershed Scale, a Case Study in the Jinghe Watershed in China

Abstract
:1. Introduction
2. Materials and Methods
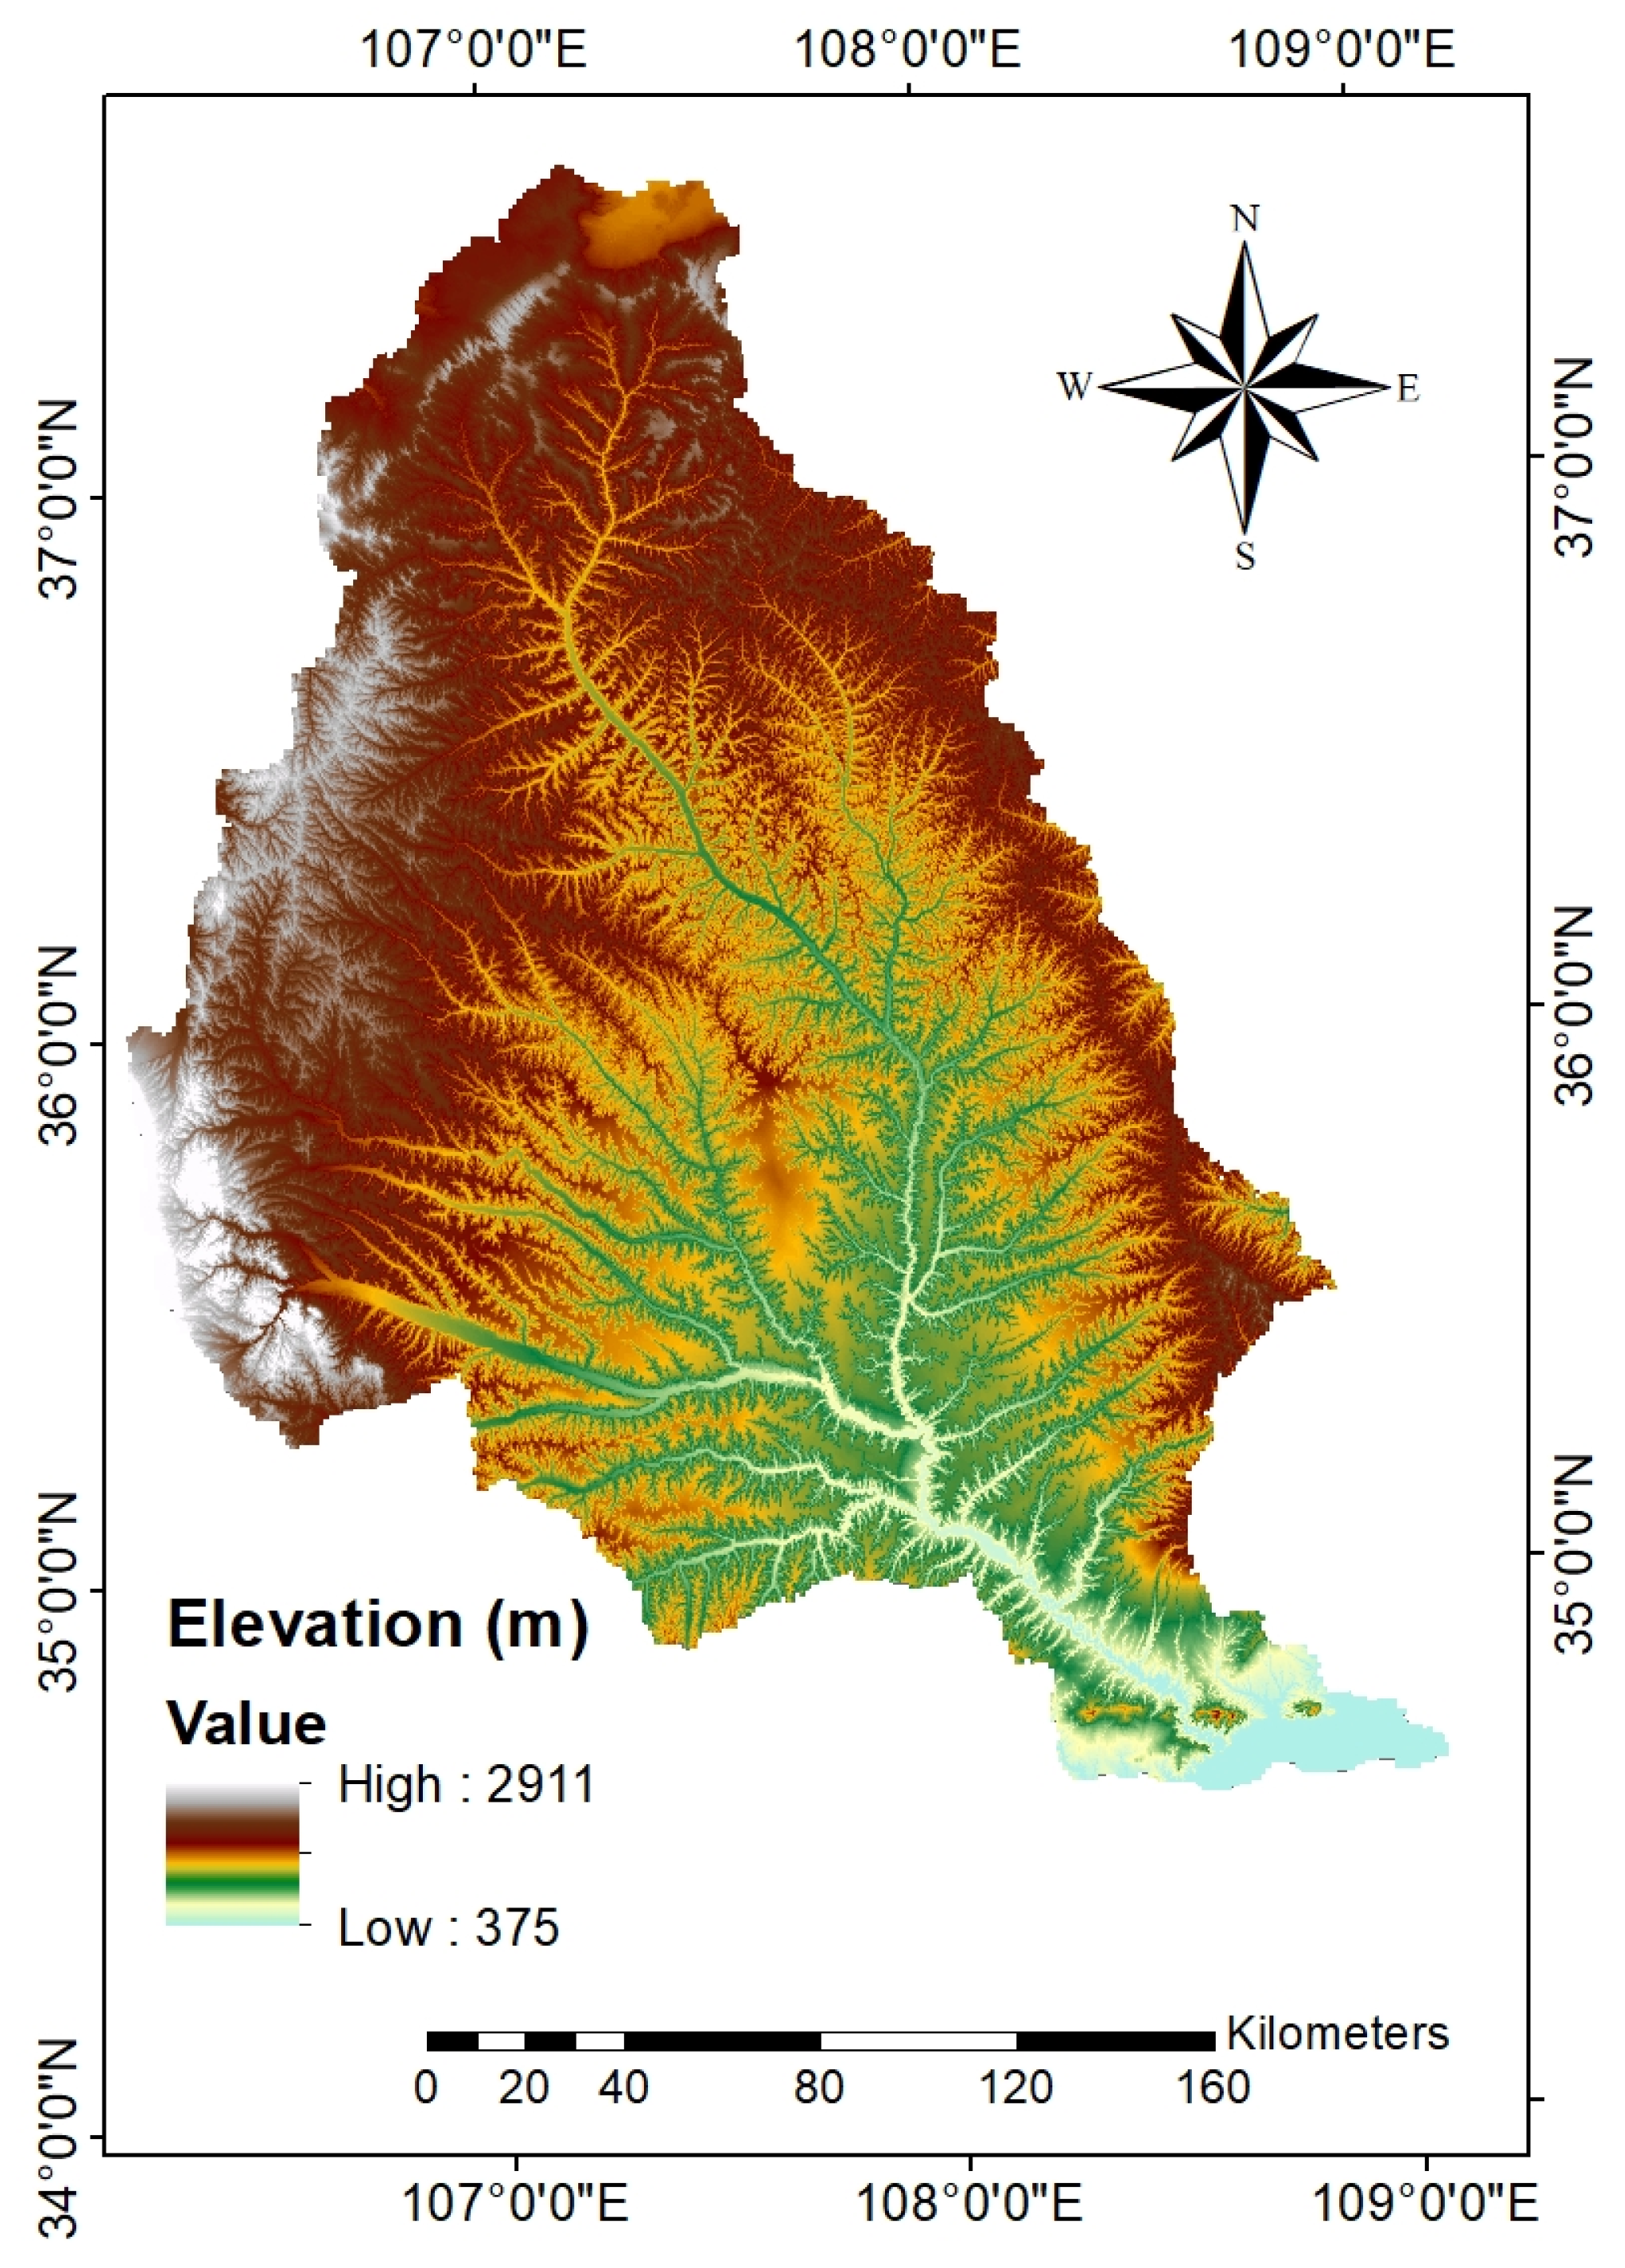
2.1. Study Area
2.2. AnnAGNPS Model Description
2.2.1. Topography Data
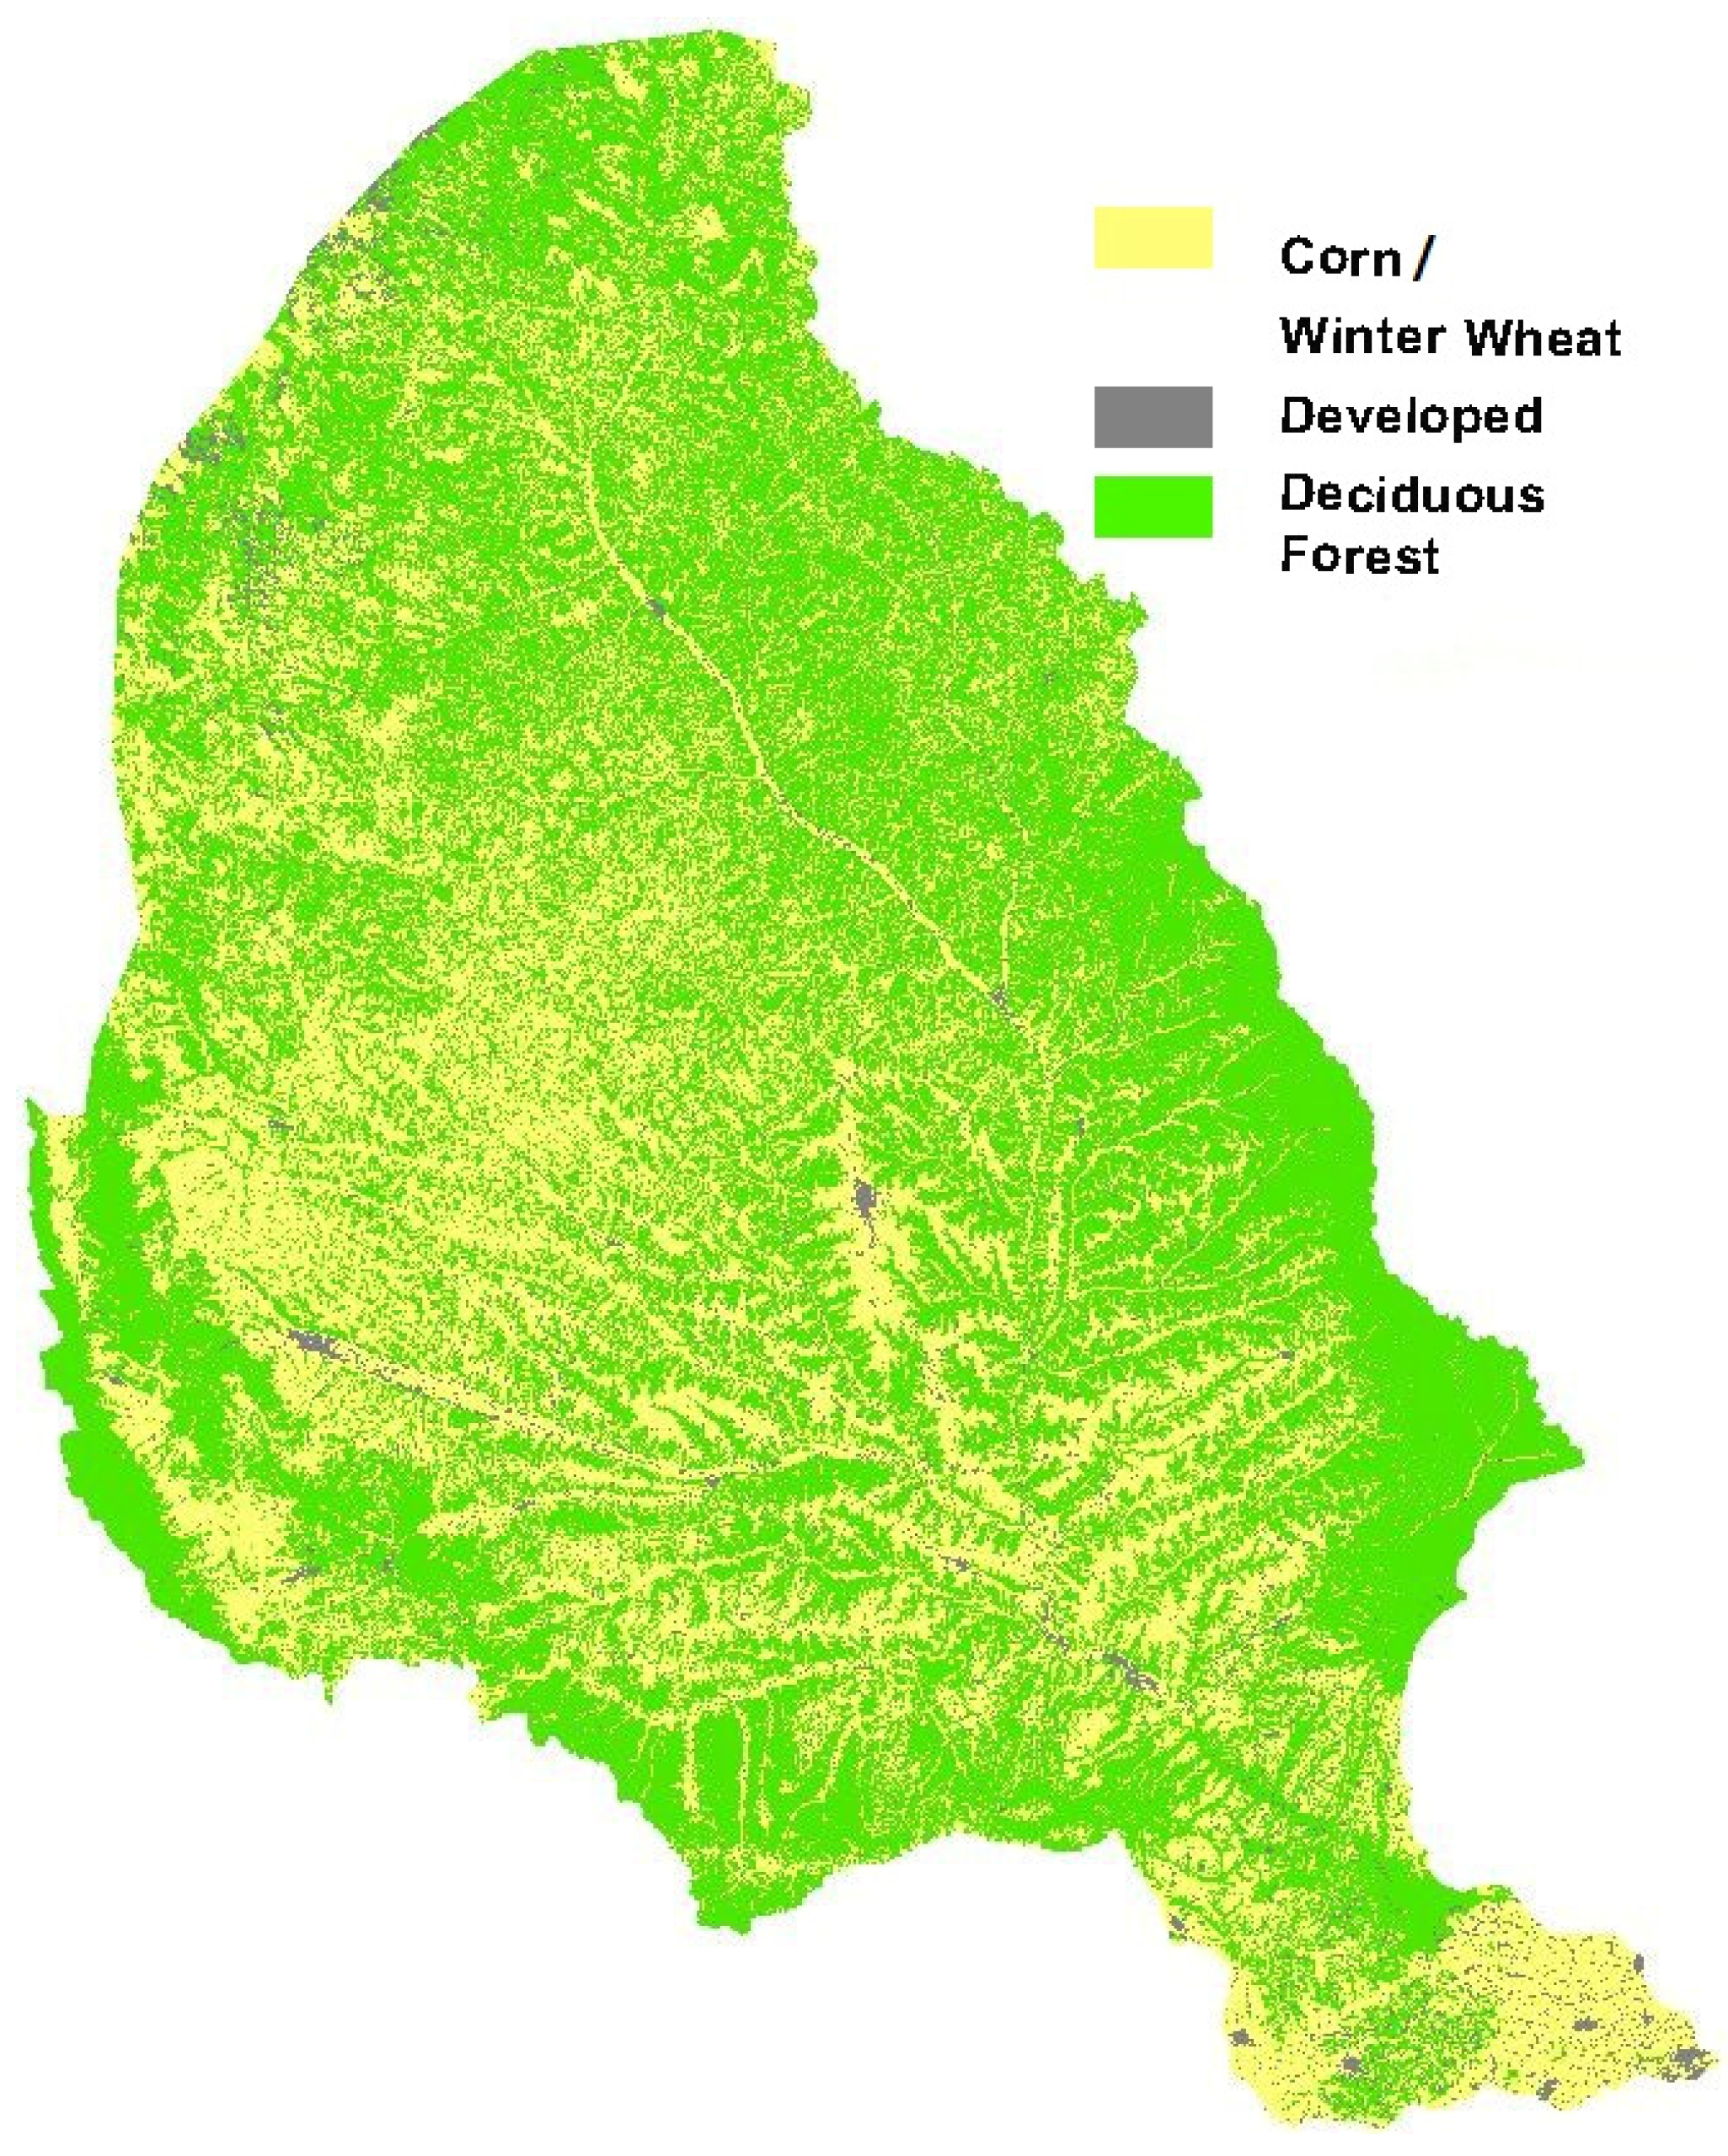
2.2.2. Land Use and Management Data
2.2.3. Soil Date
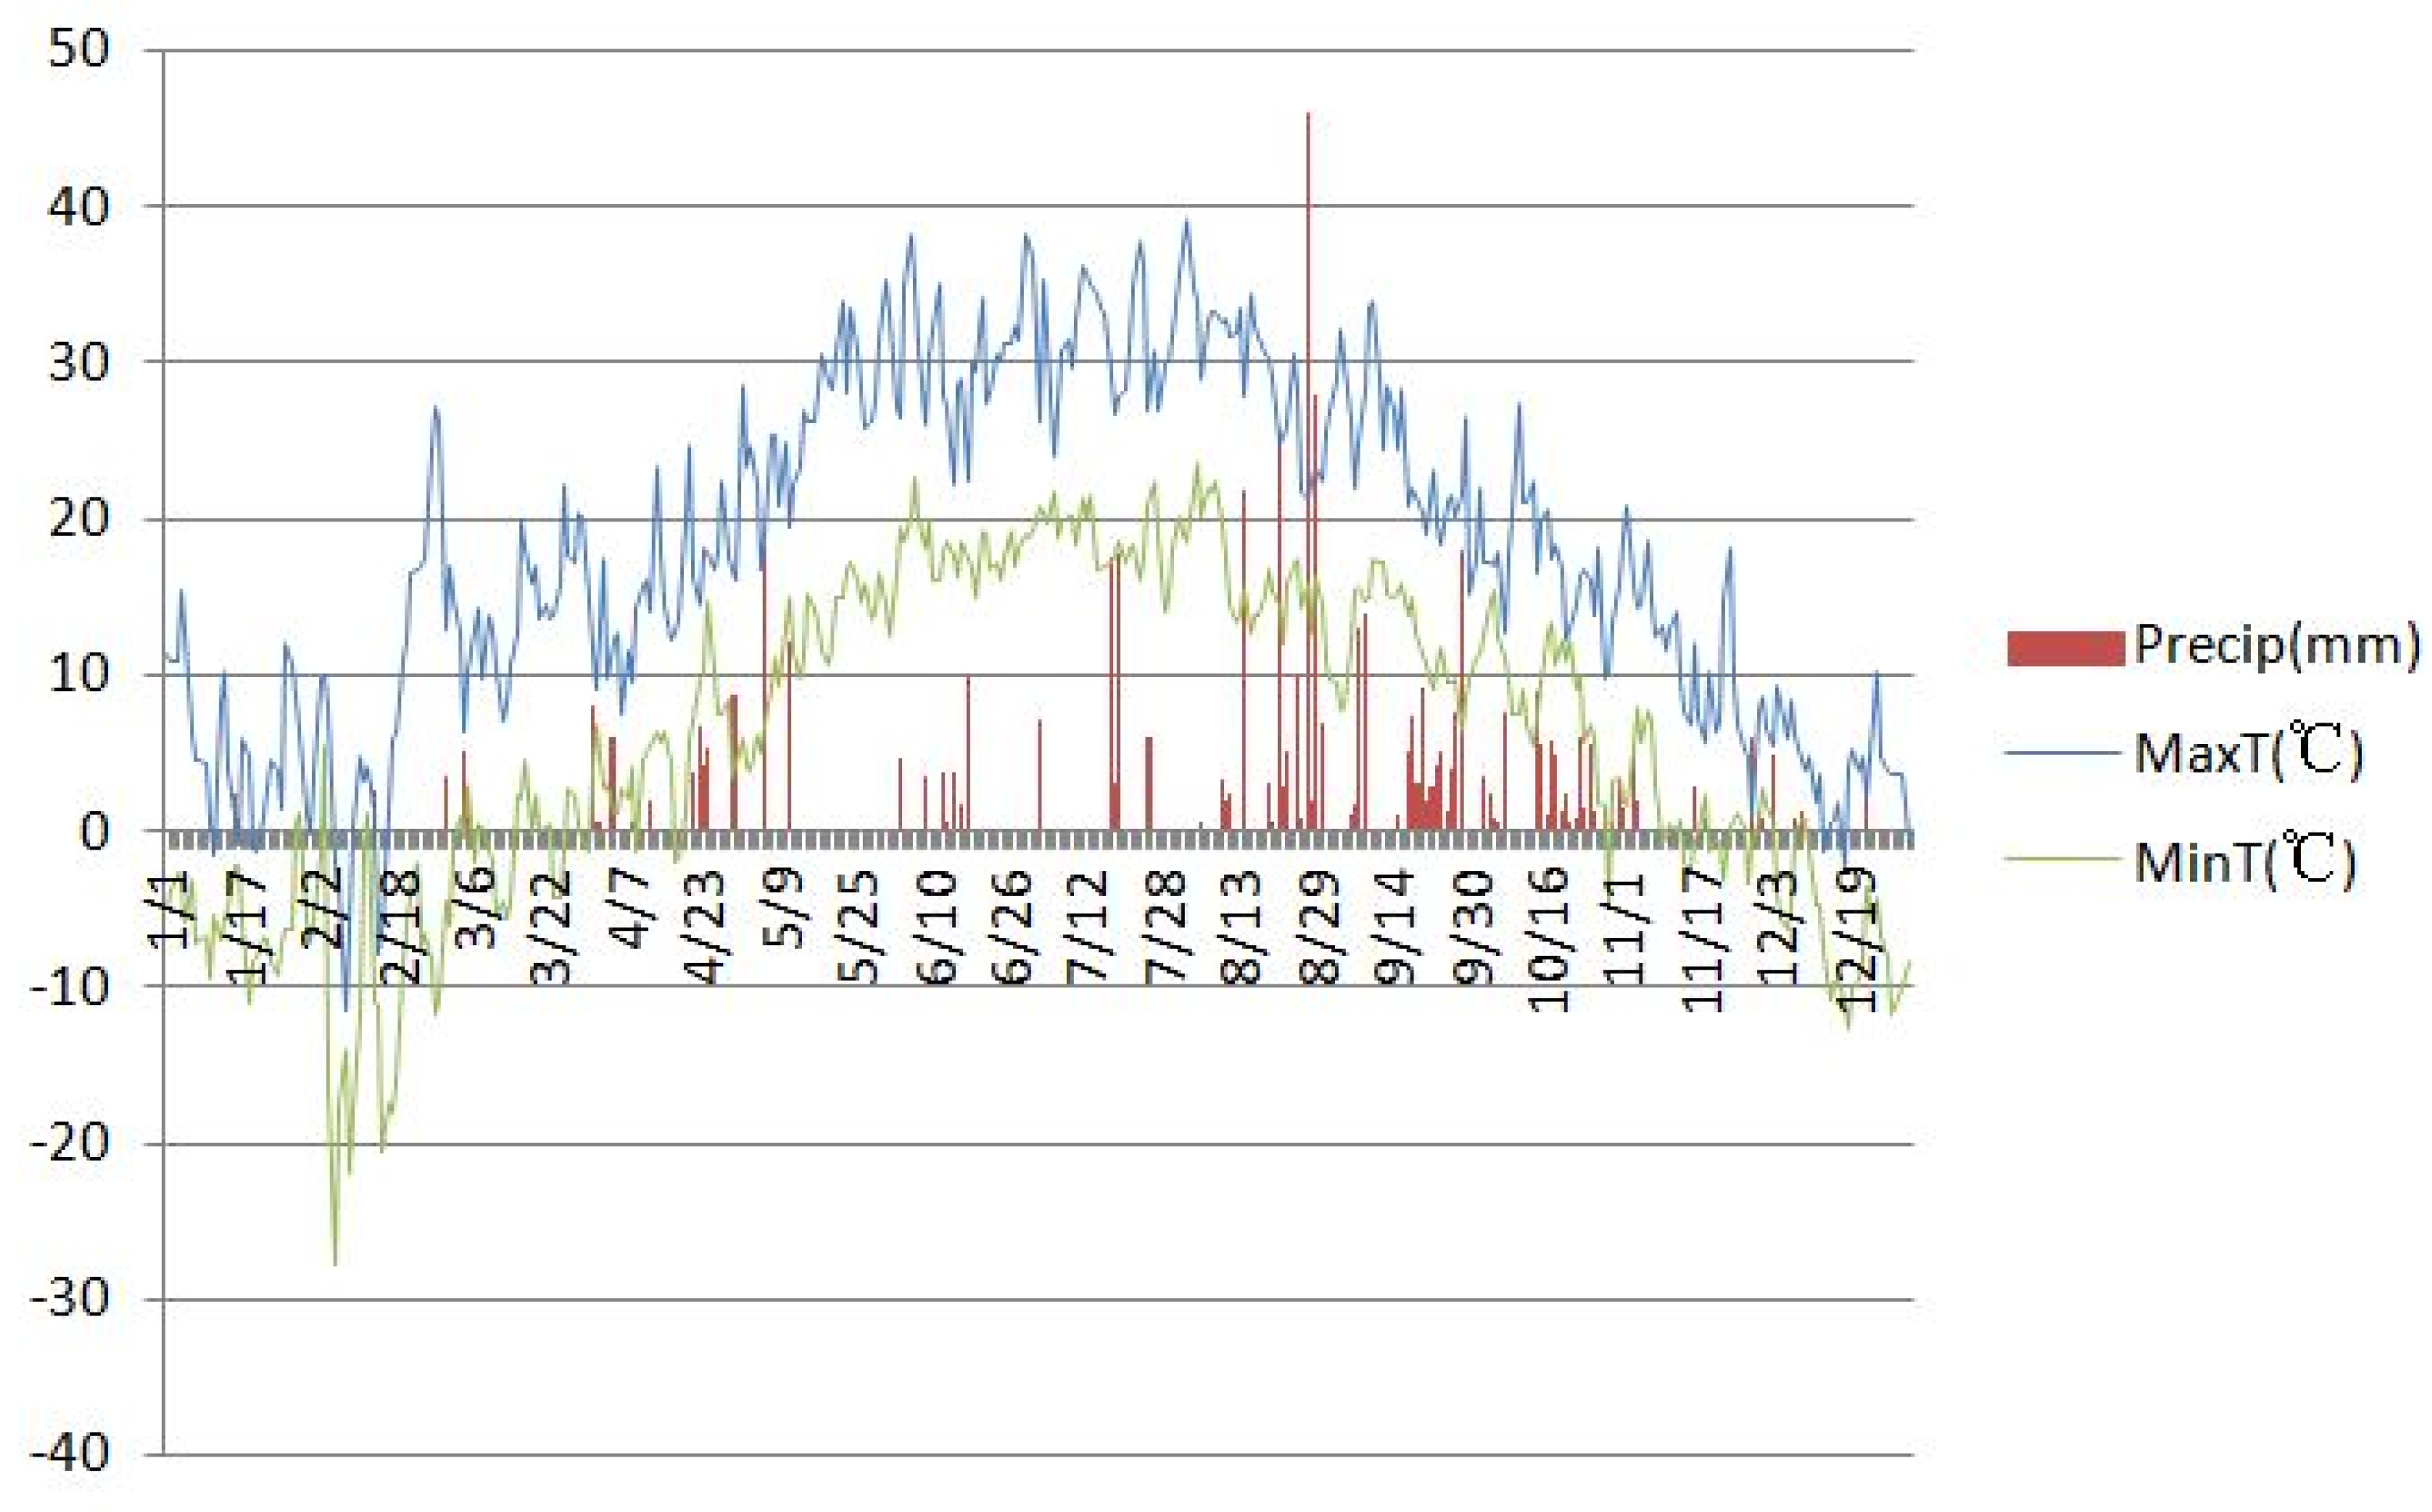
2.2.4. Climate Date
2.2.5. AnnAGNPS Output
2.3. REMM Model Description
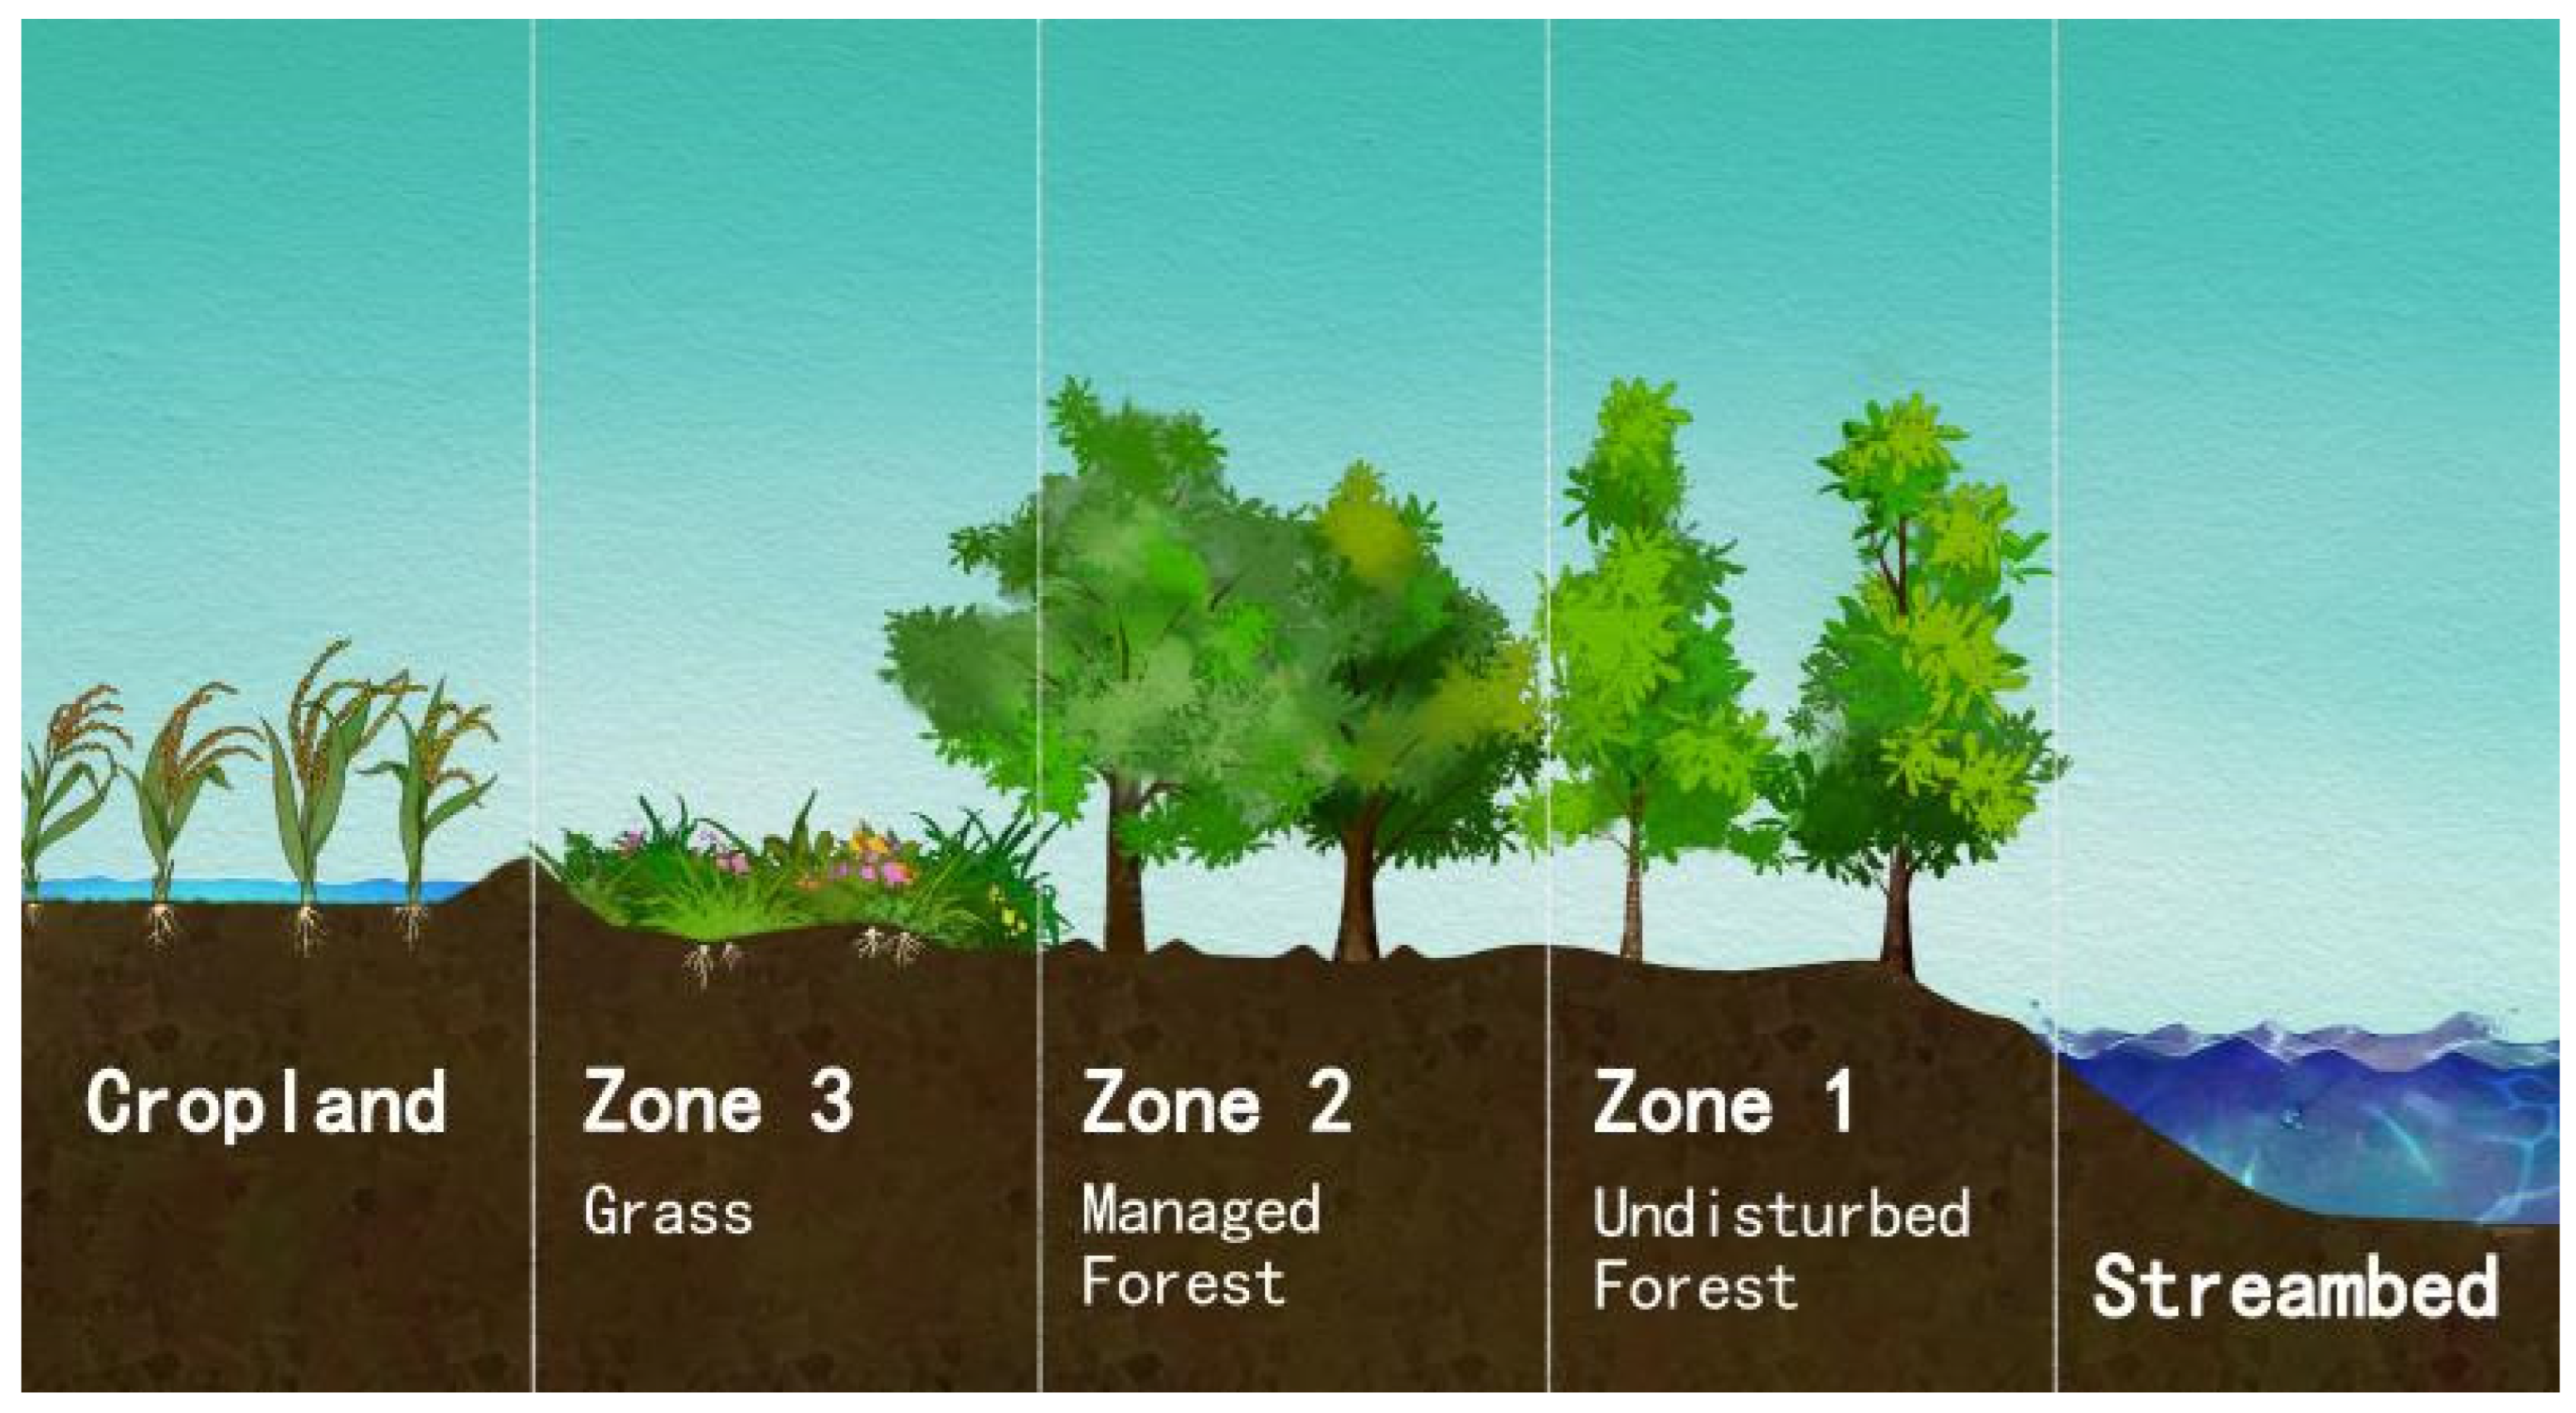
2.3.1. Buffer Widths and Vegetation Types
2.3.2. Process of Running REMM
2.4. Test of the Model
3. Results
3.1. Evaluation of Model Performance
3.2. Reduction in Water, Sediments, and Nitrogen for the Standard Design
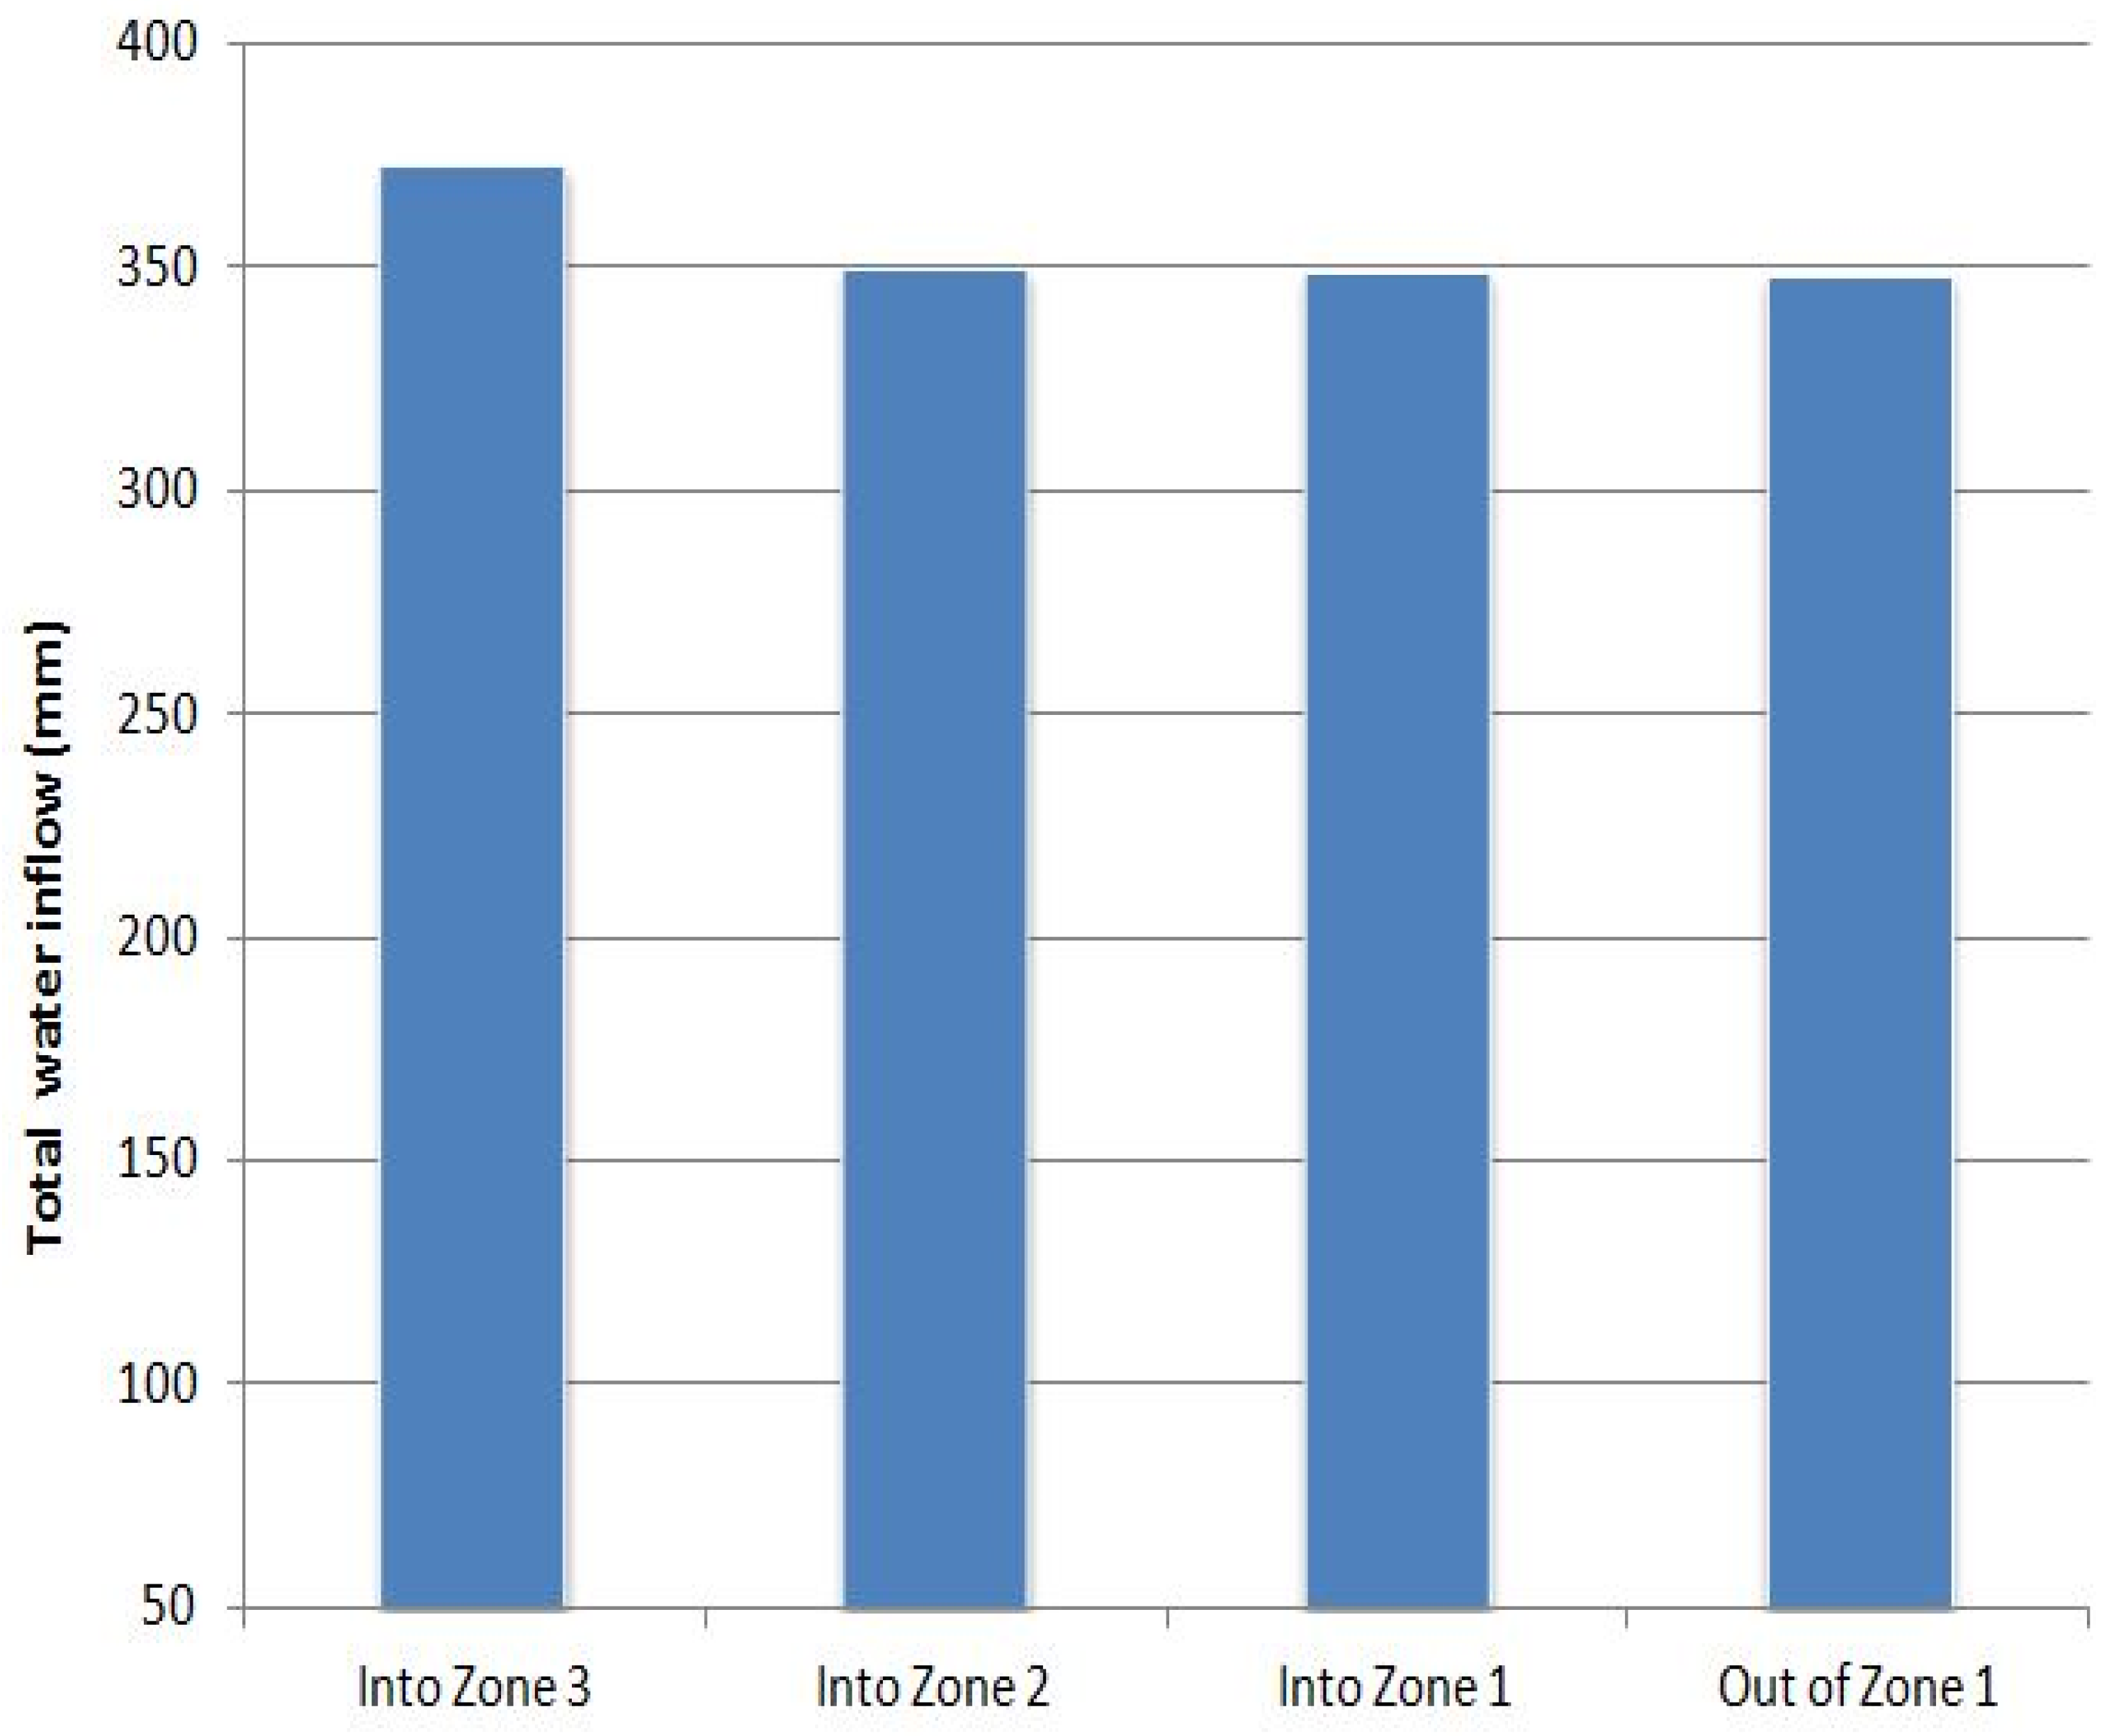
3.2.1. Total Water Inflow
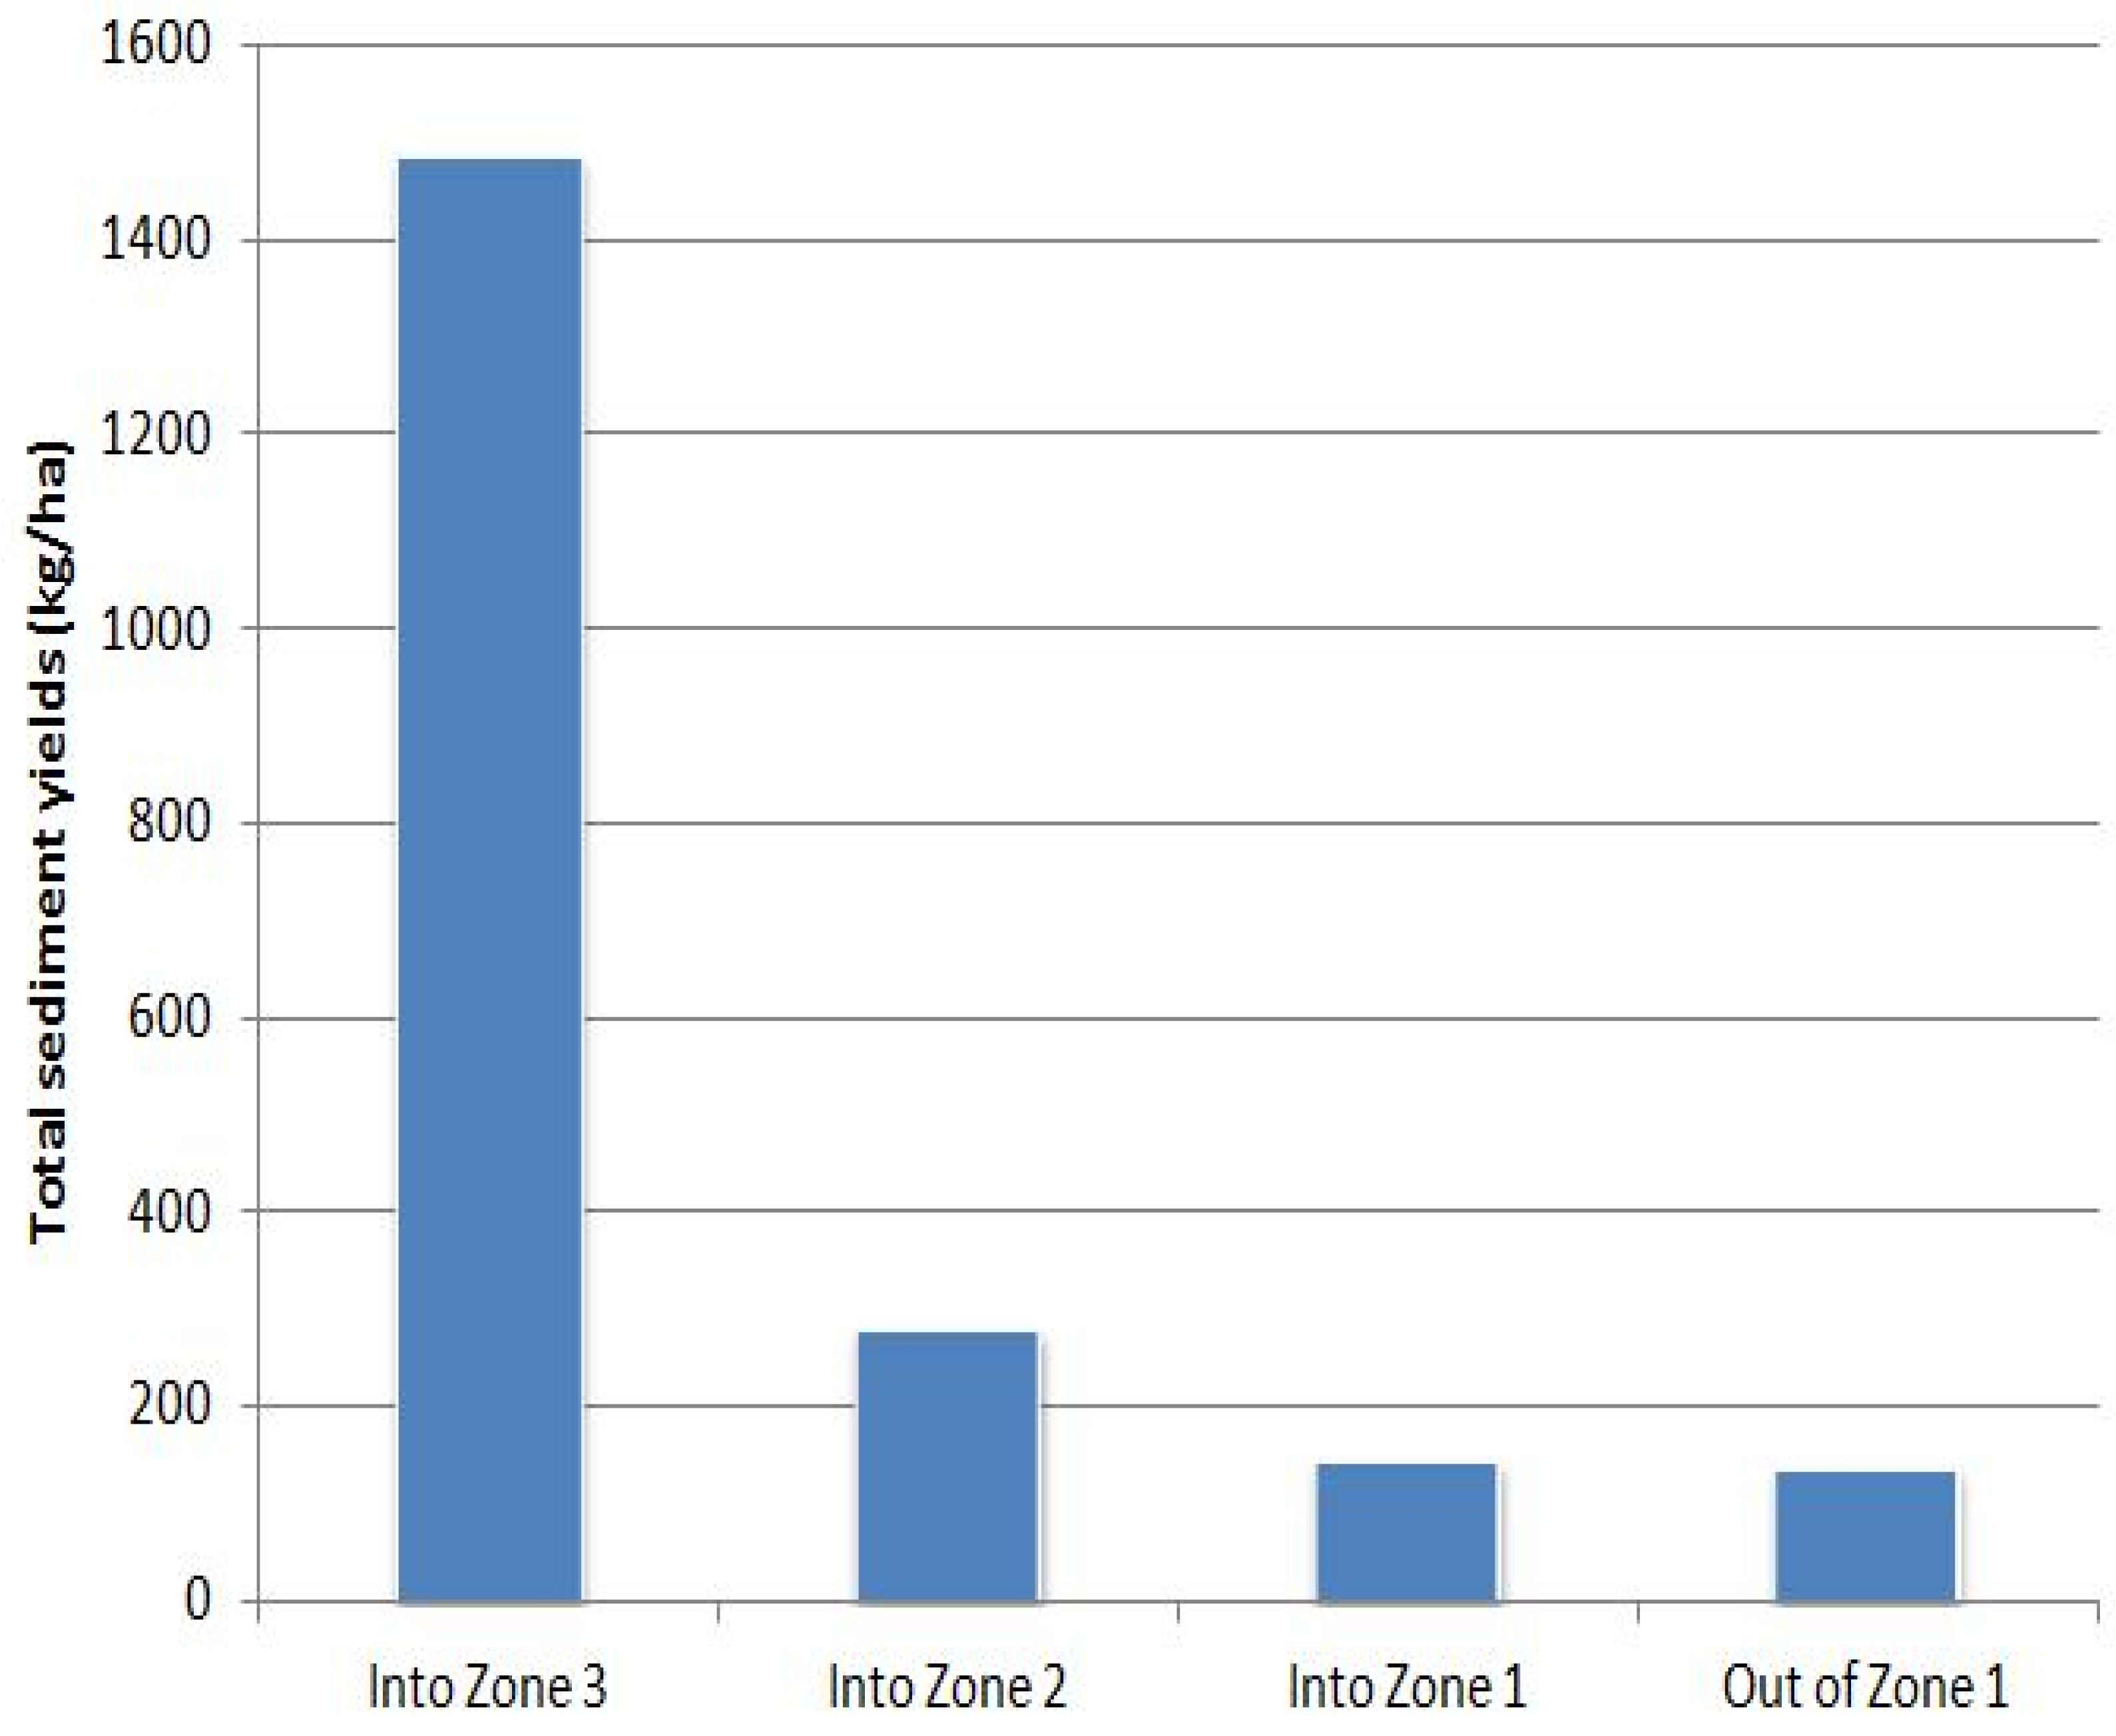
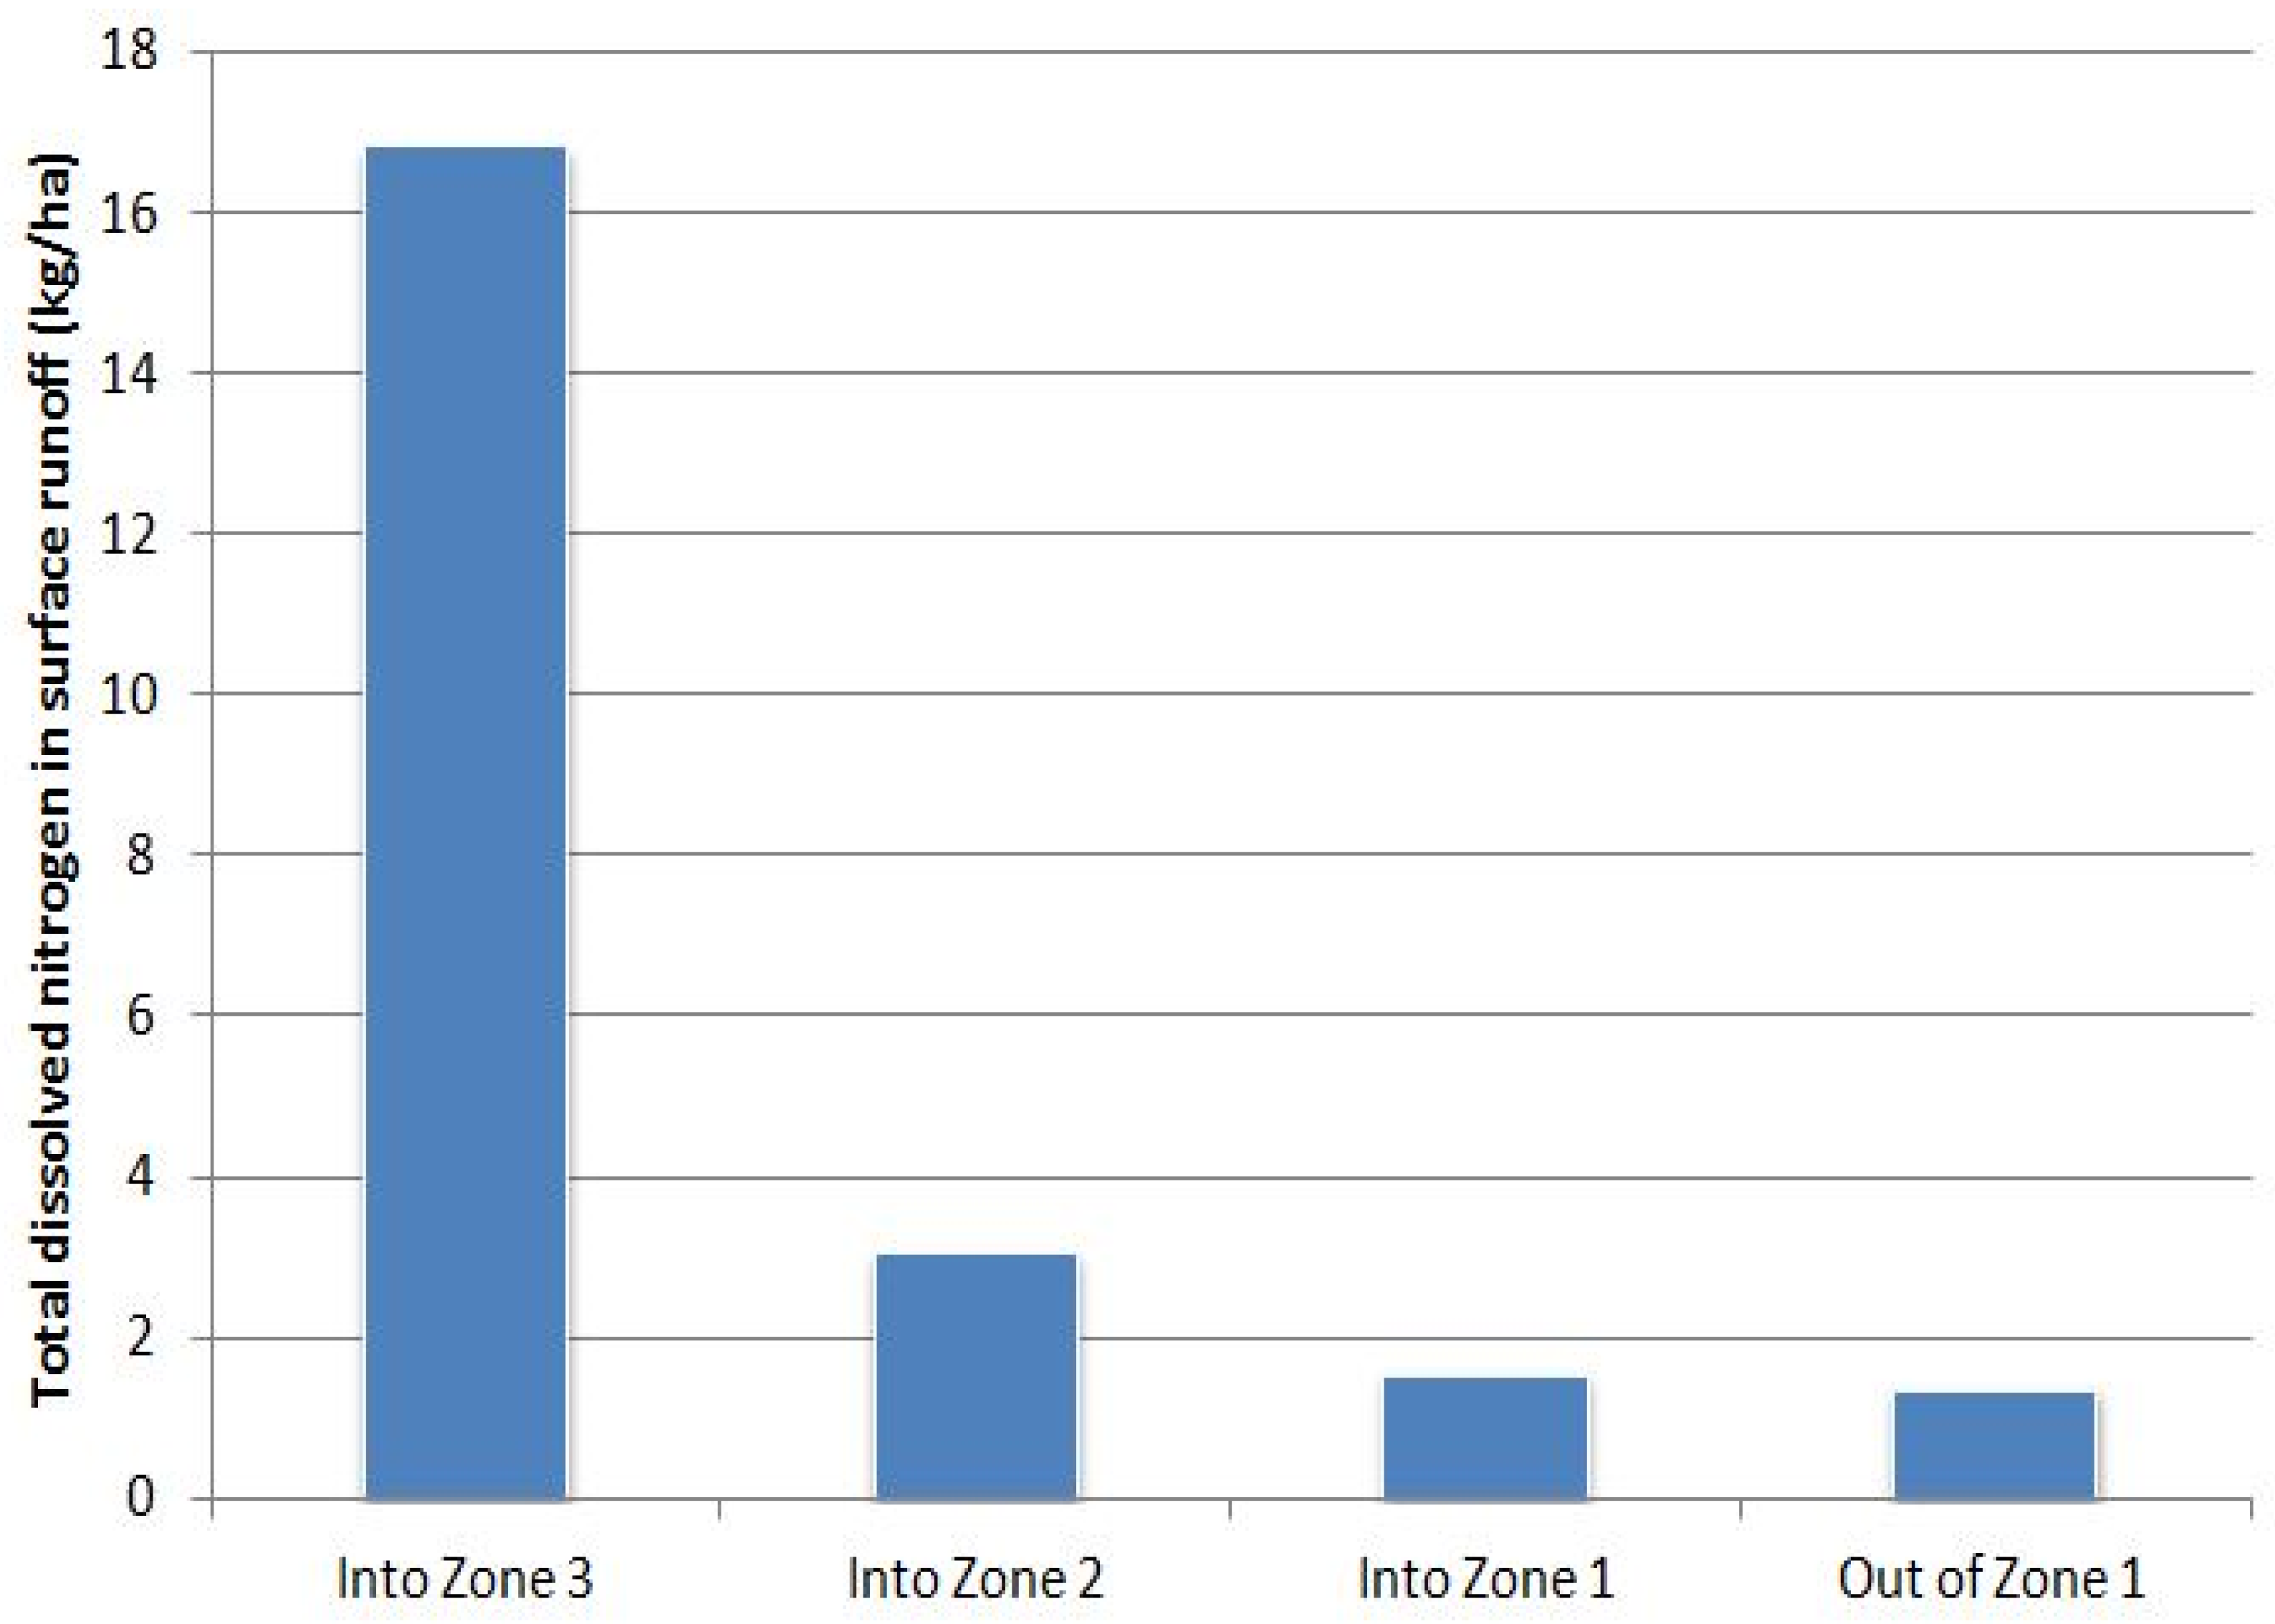
3.2.2. Sediments and Dissolved Nitrogen in Surface Runoff
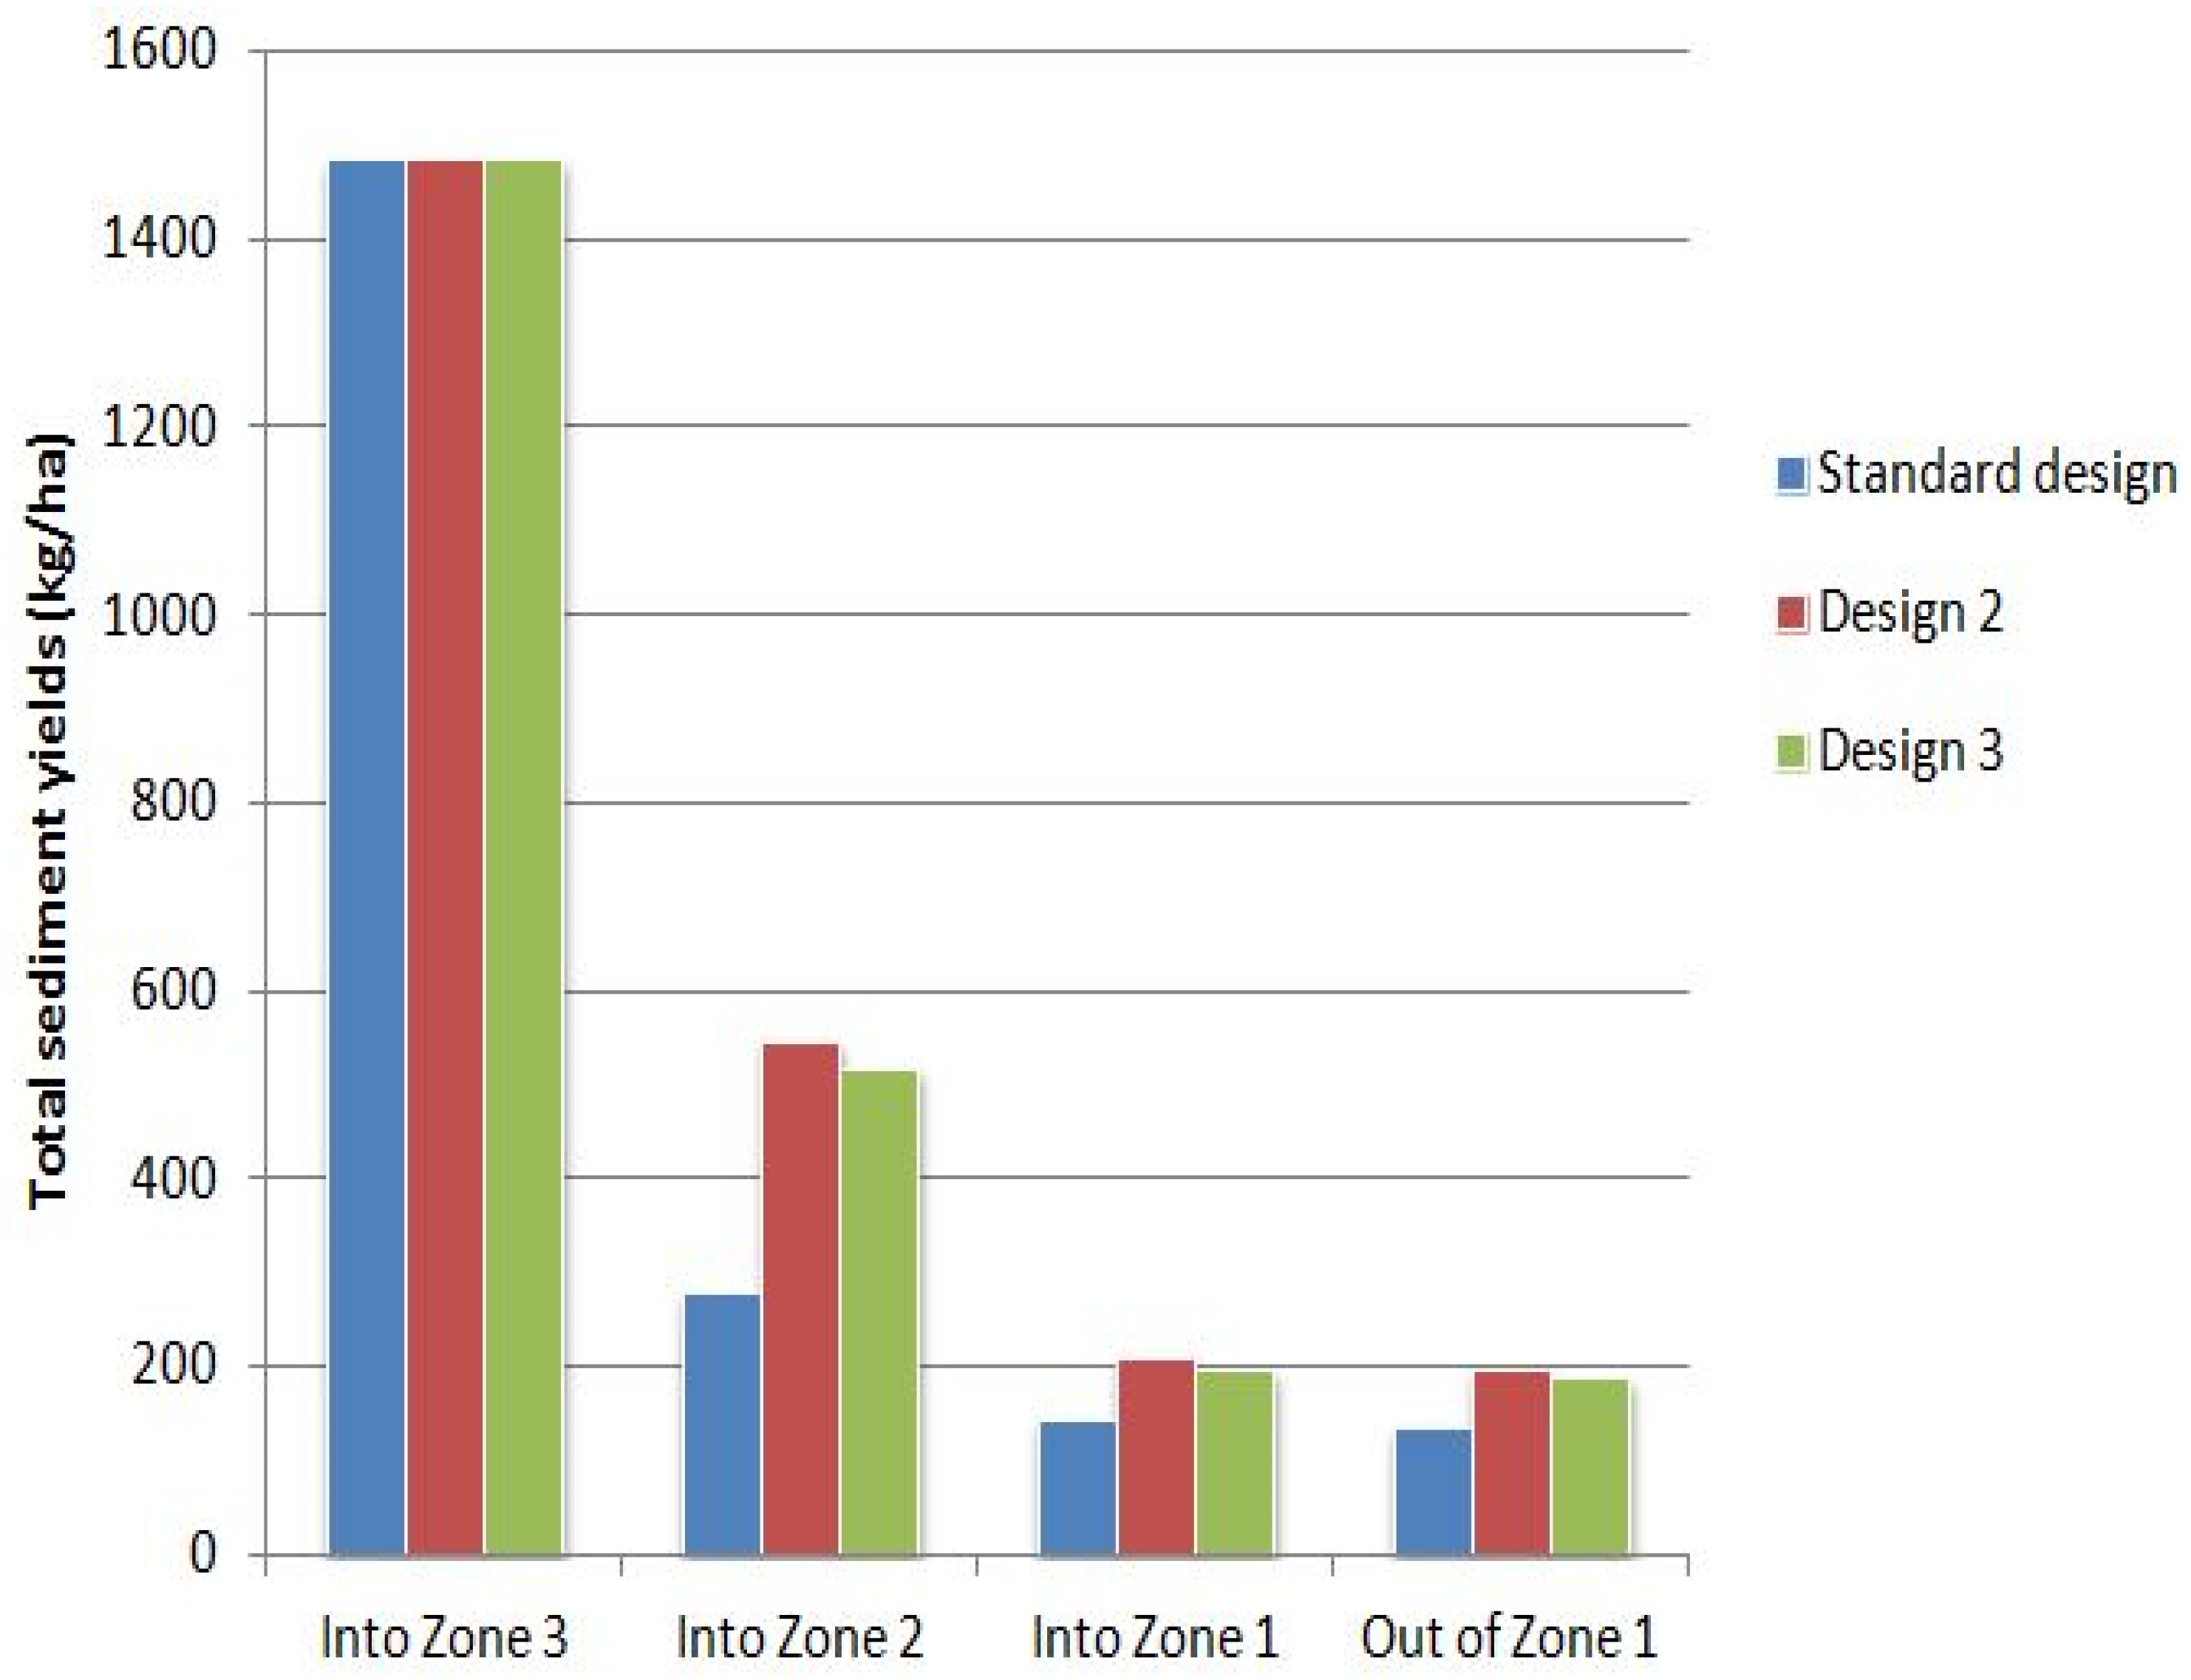
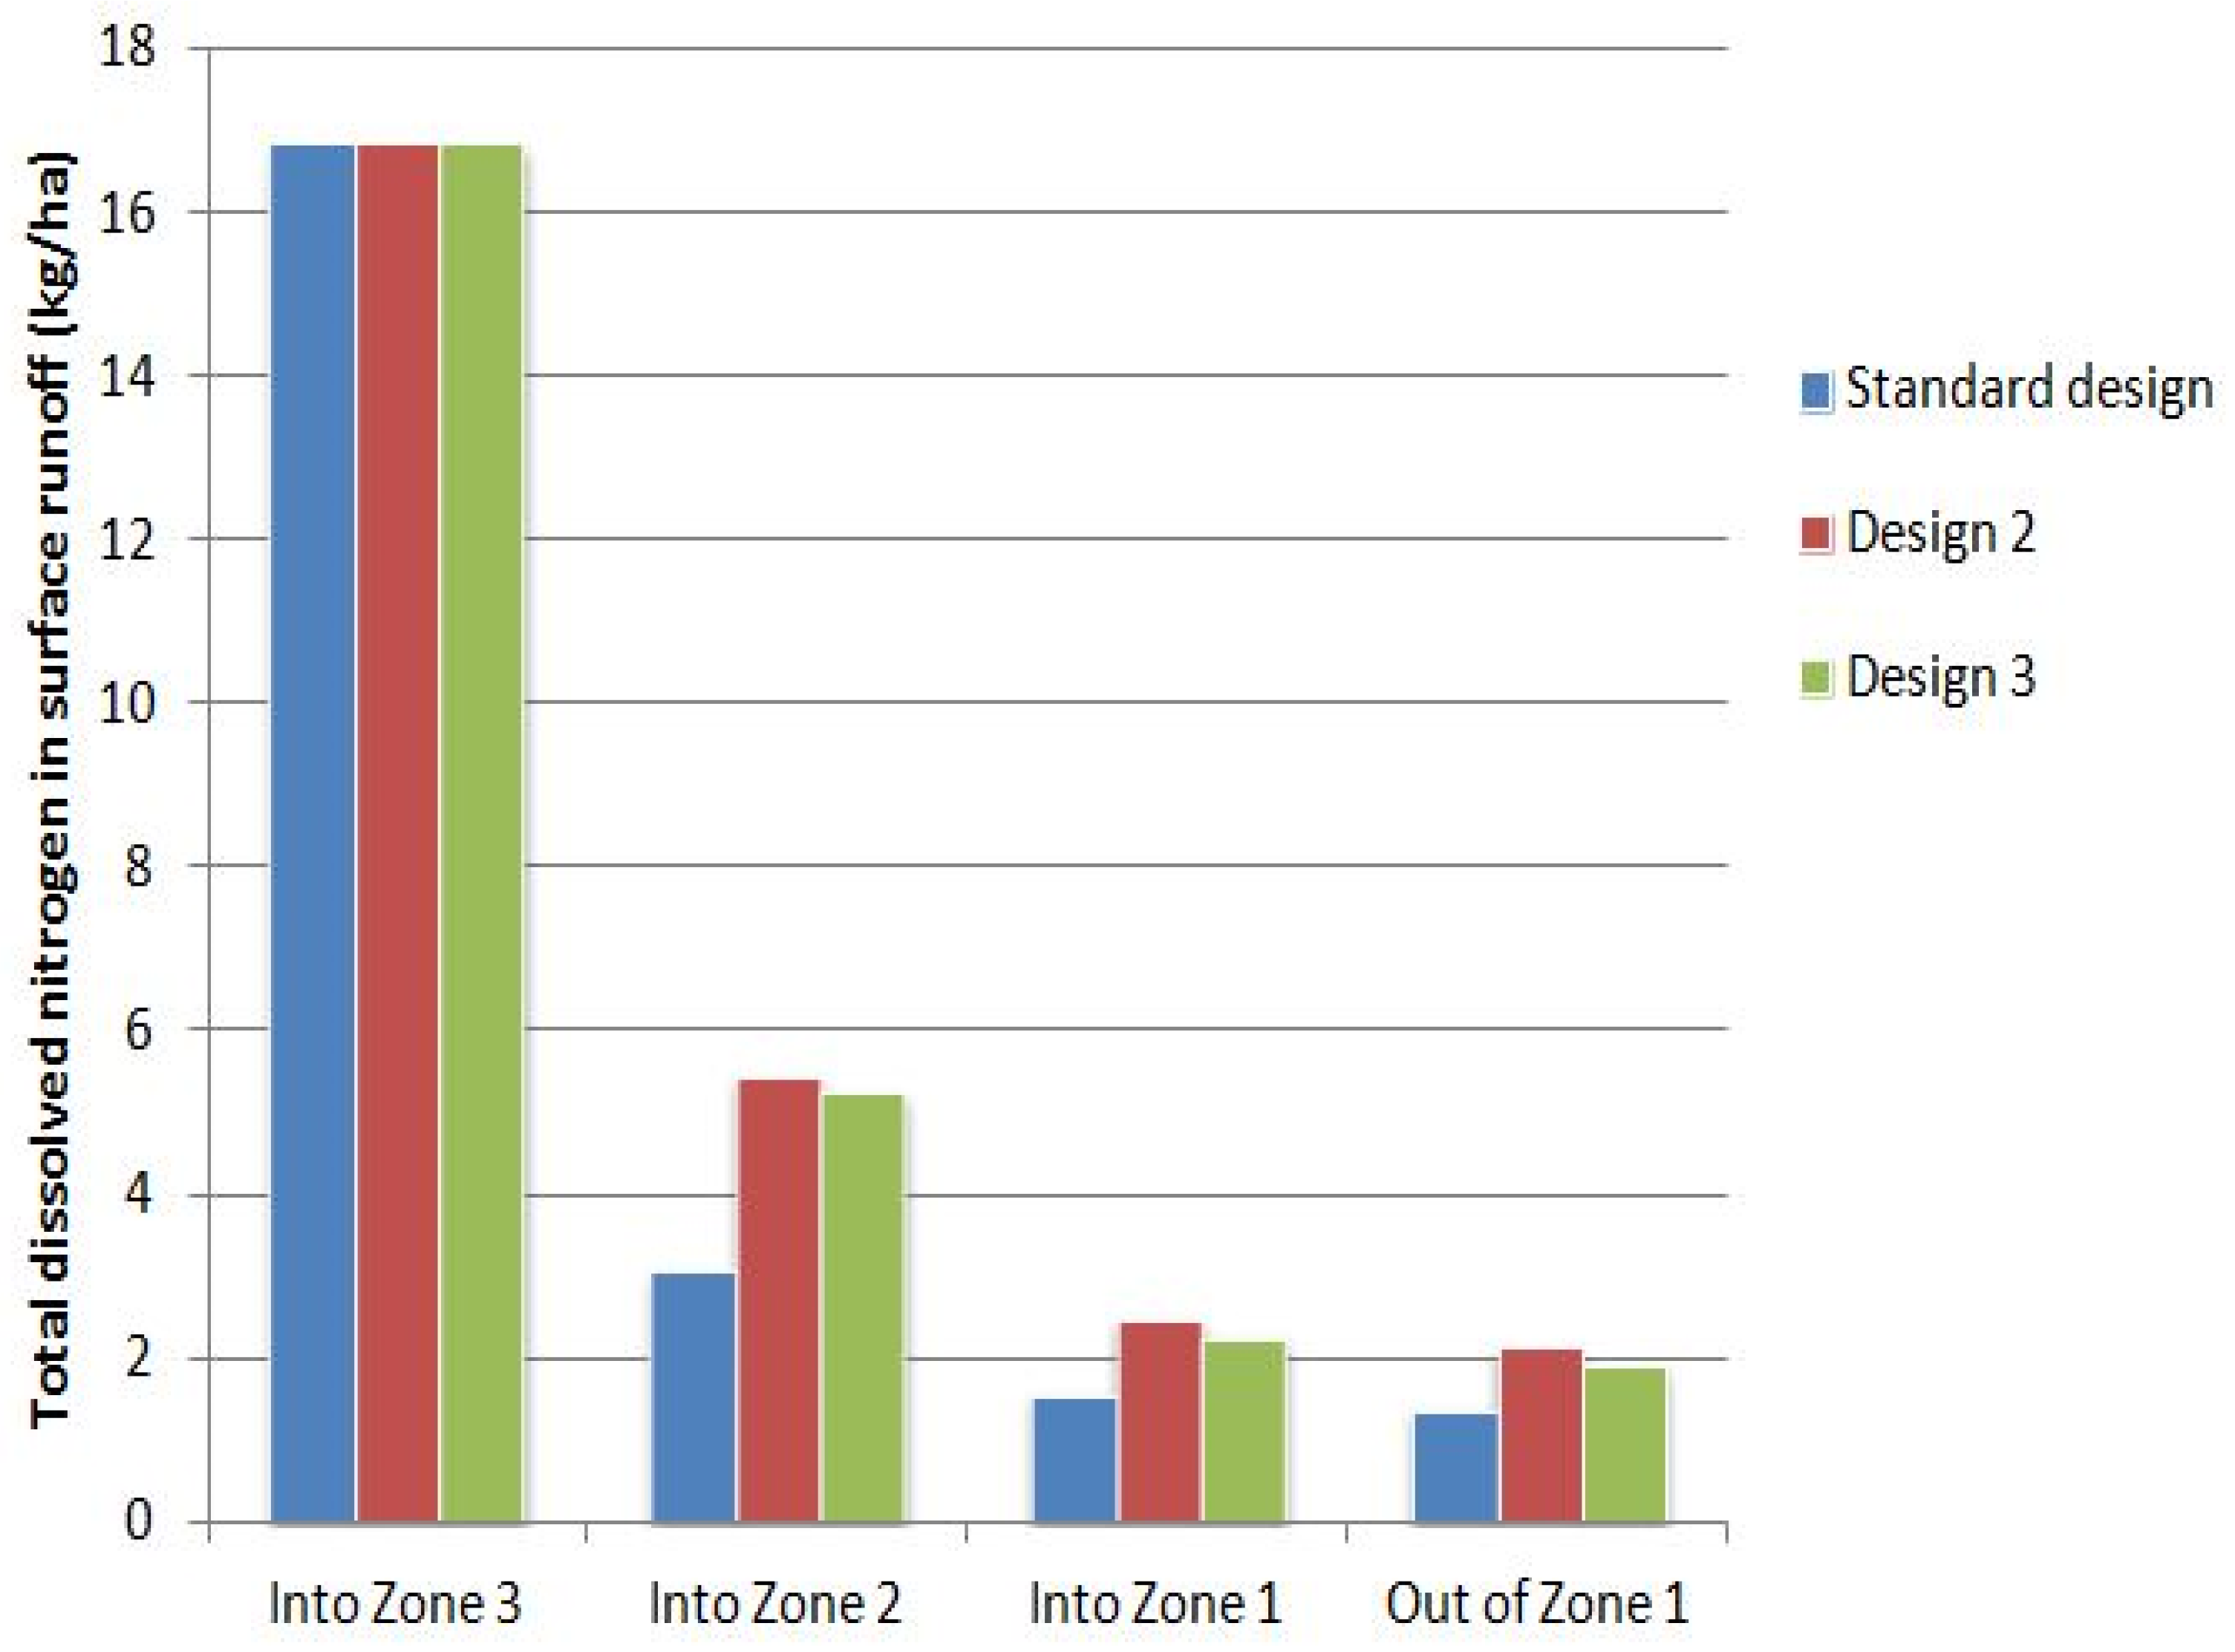
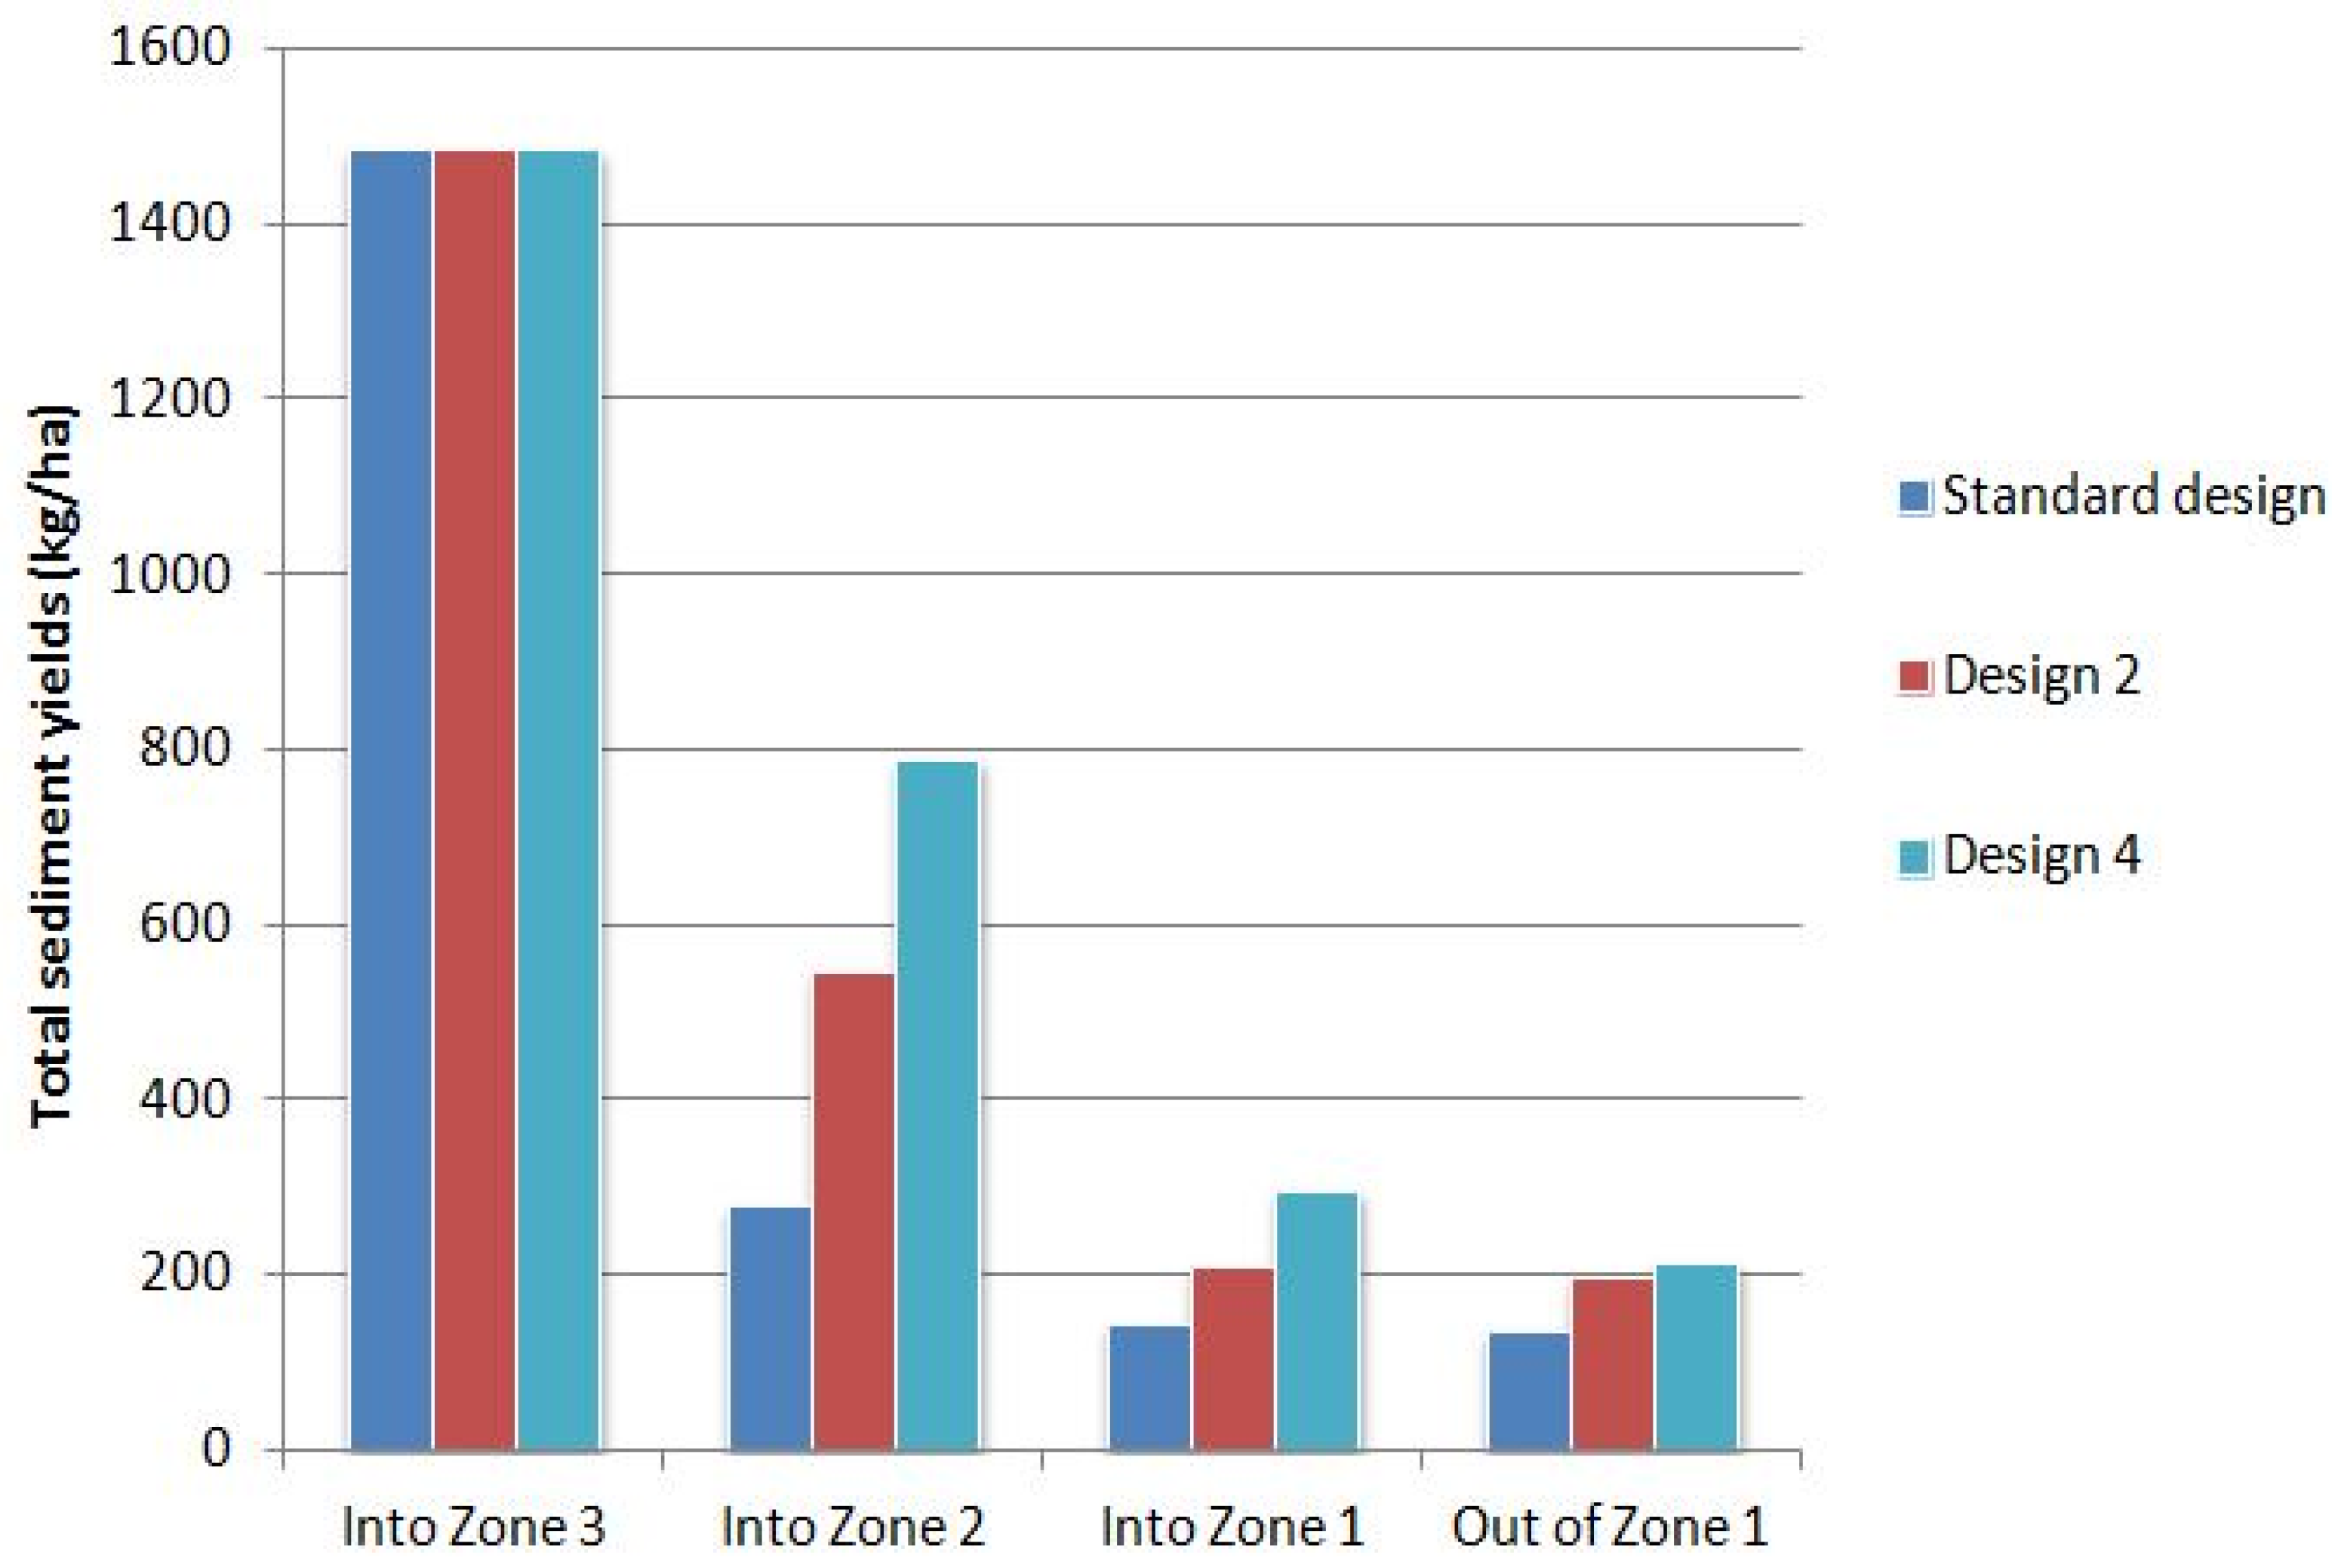
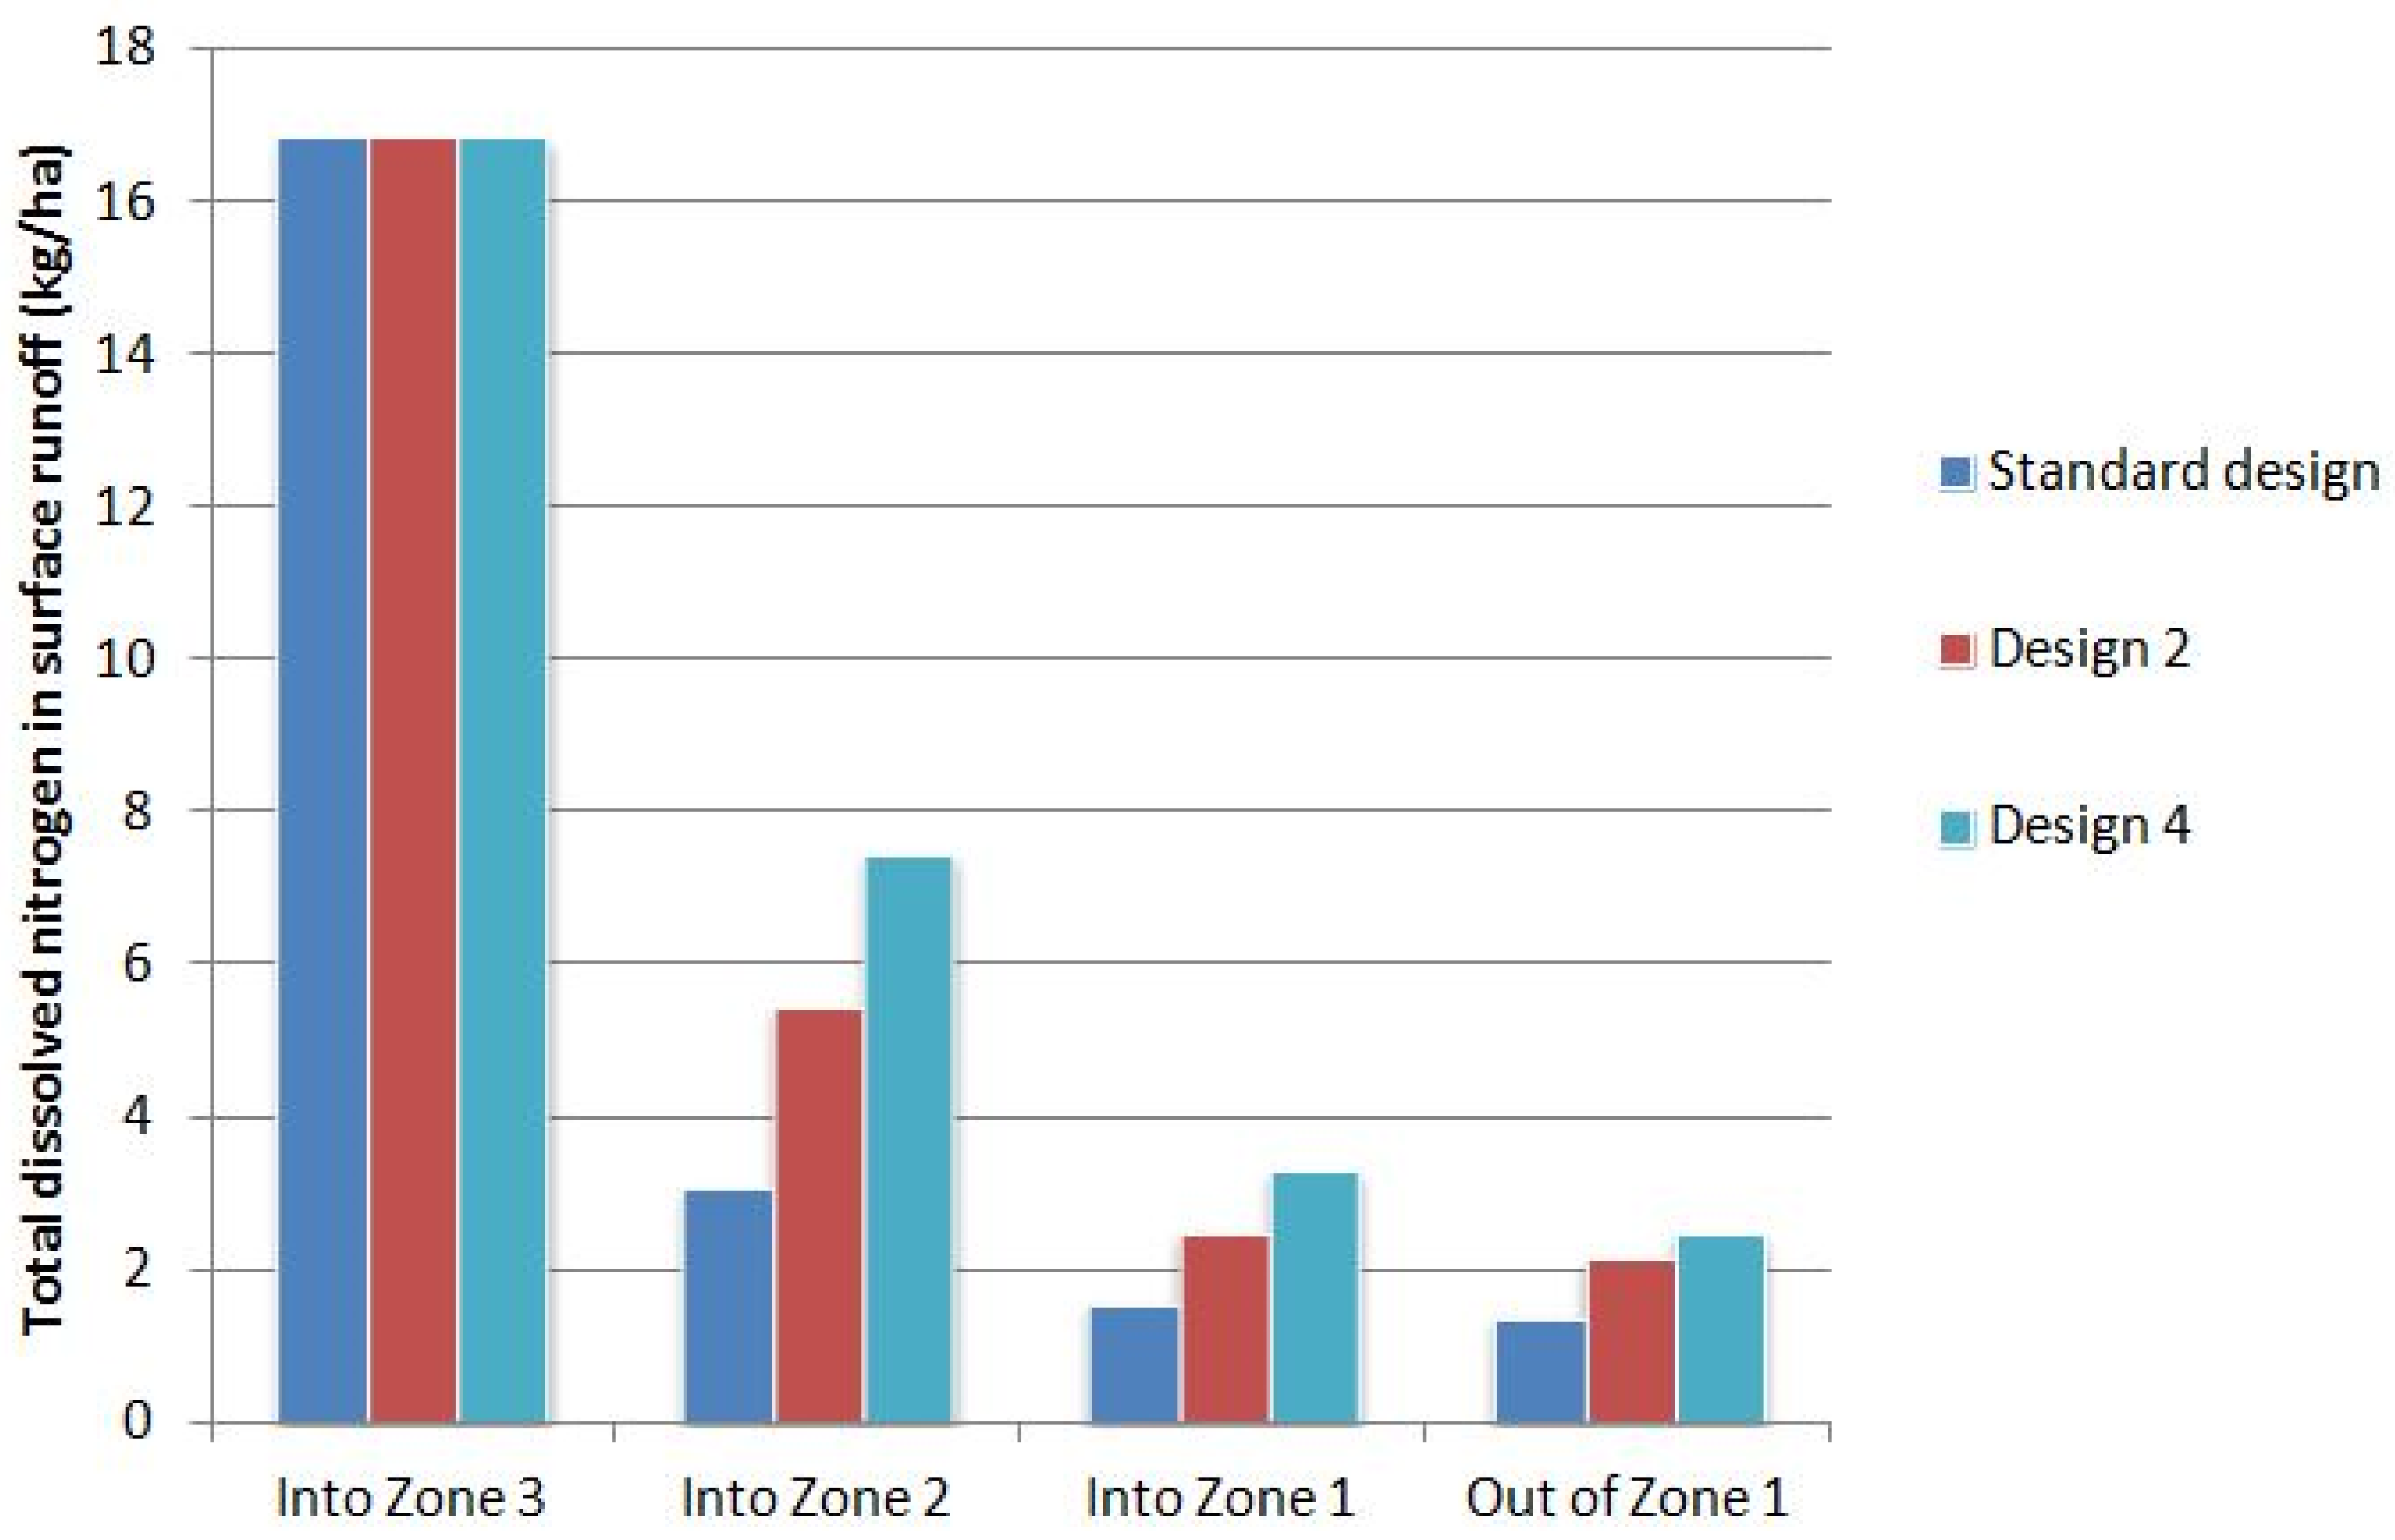
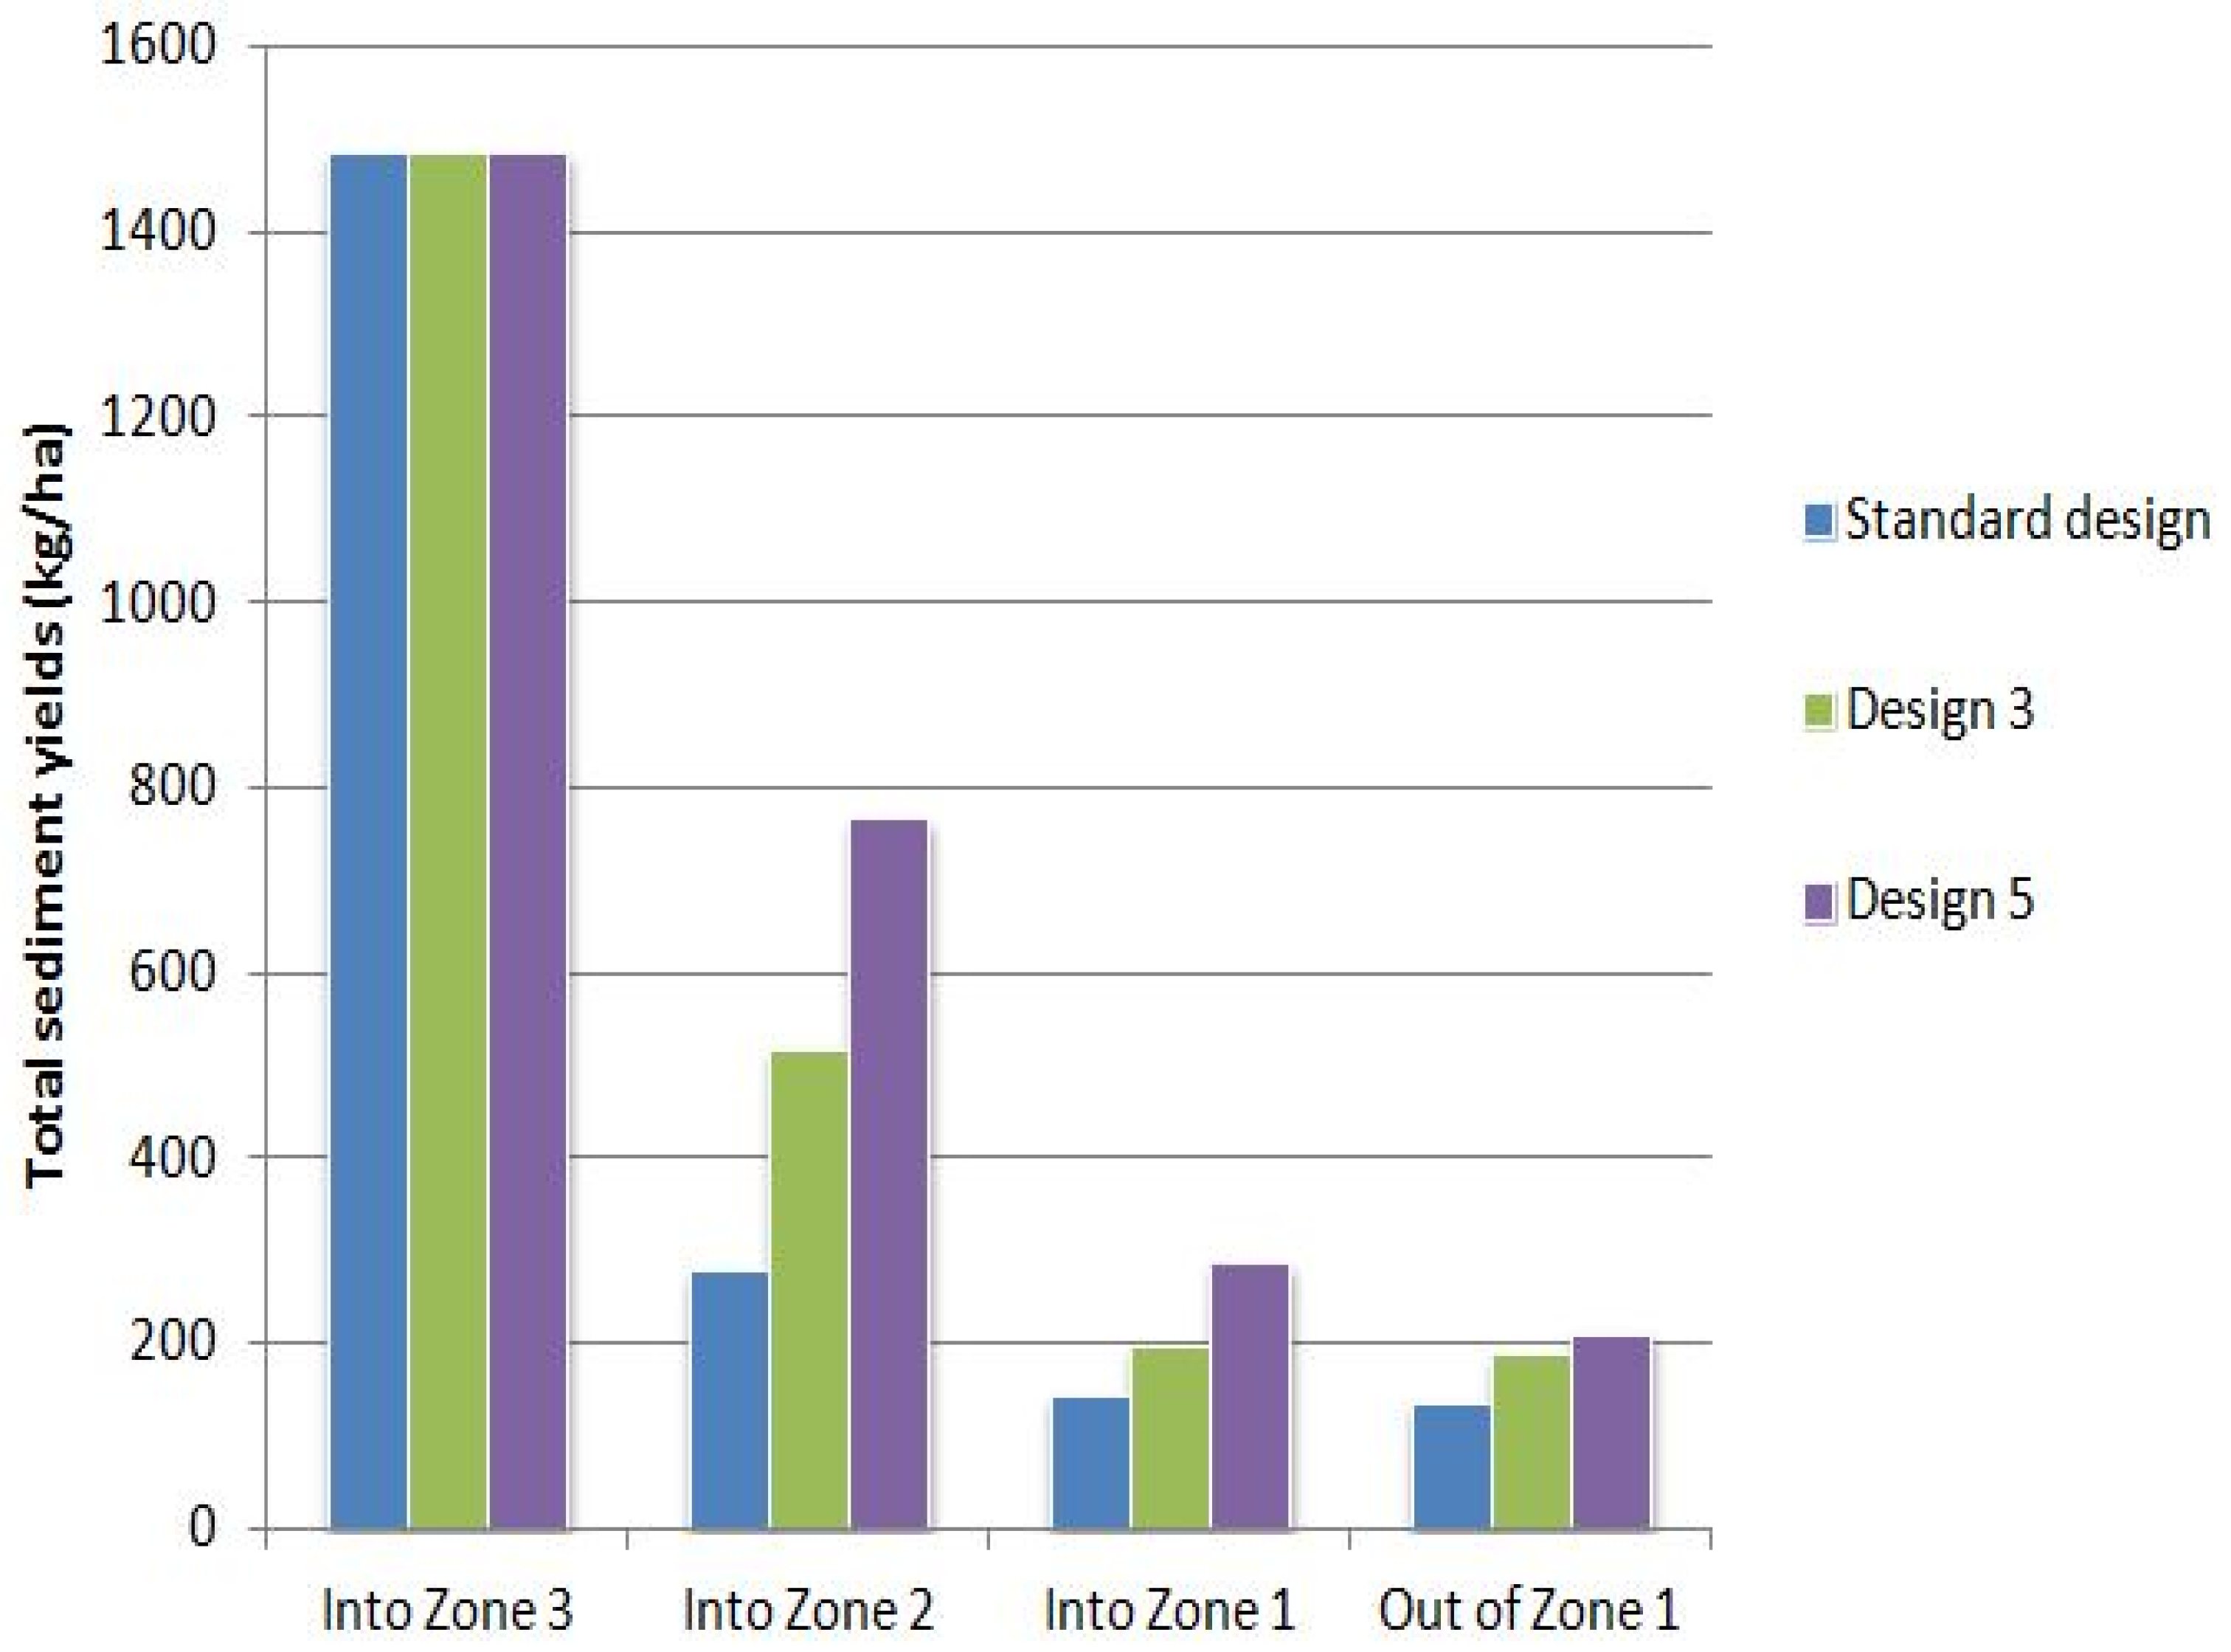
3.3. Effect of Riparian Buffer Zone Designs
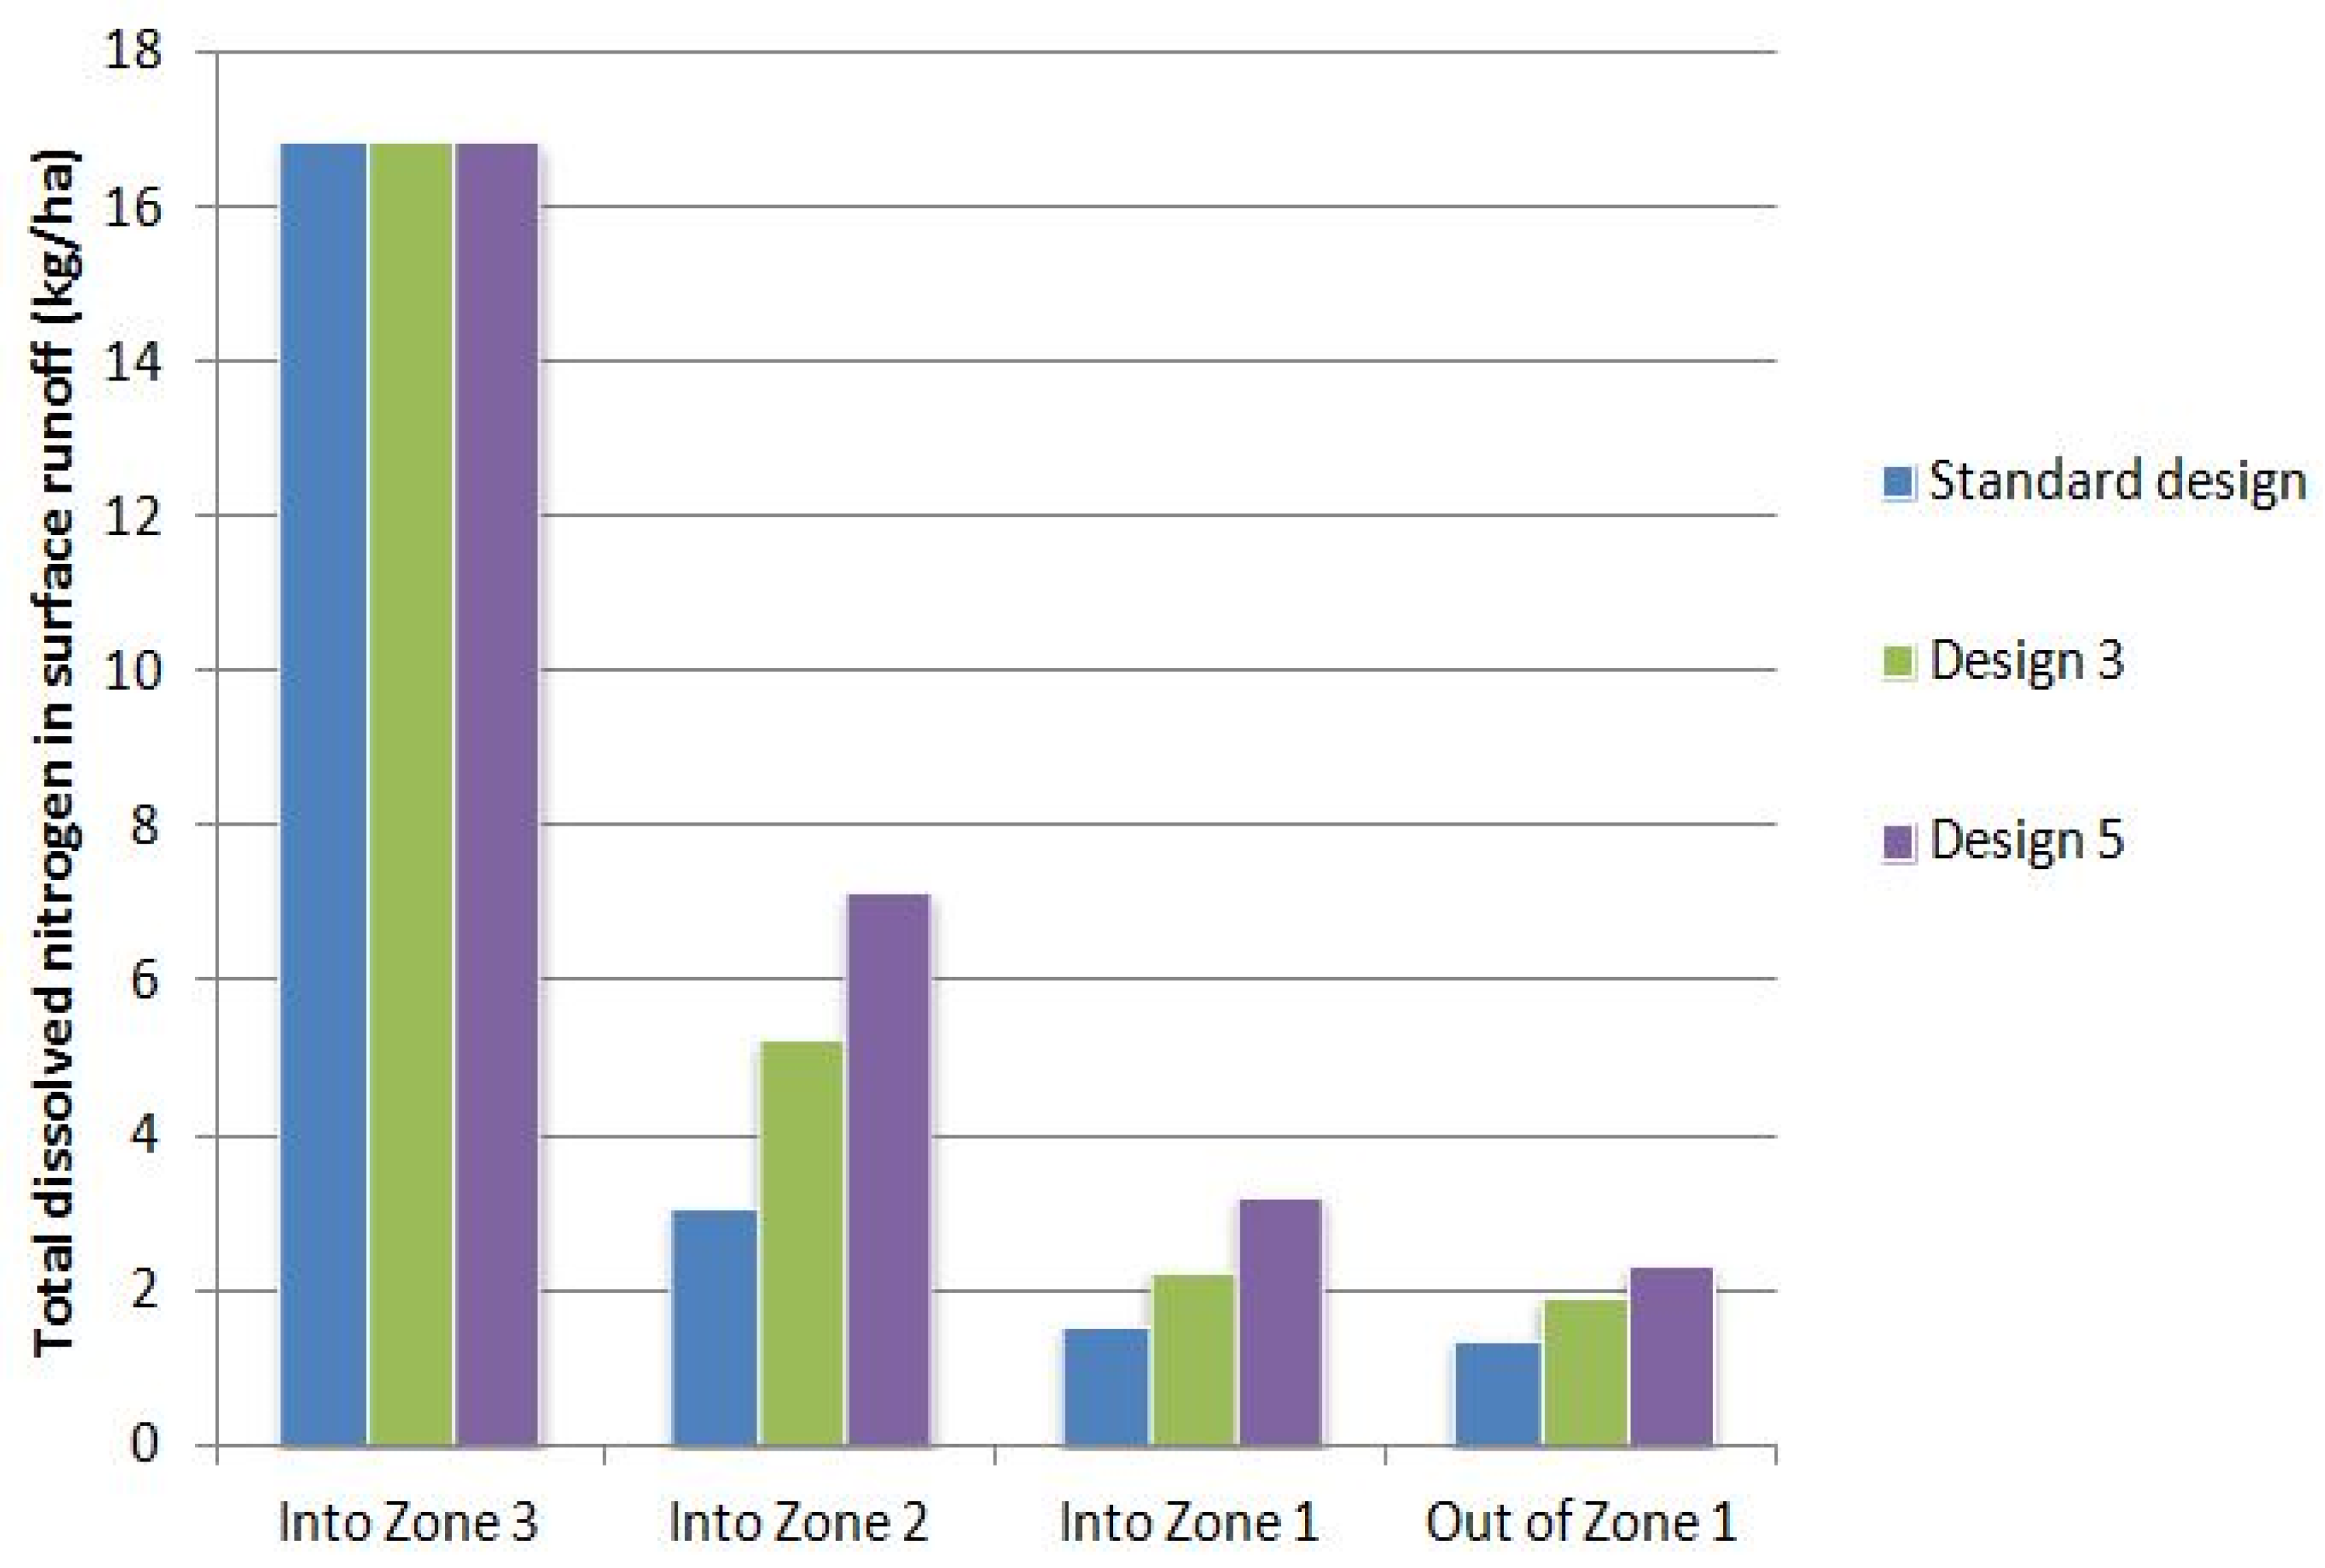
3.3.1. Effect of Reducing Numbers of Zones
3.3.2. Effect of Zone Width
3.3.3. Effect of Vegetation Types
4. Discussion
4.1. Comparison with Other Studies on the Buffer Zone Design
4.2. The Role of Riparian Buffer for Soil and Water Conservation
4.3. Limitations and Suggestions for Future Study
5. Conclusions
Author Contributions
Funding
Data Availability Statement
Conflicts of Interest
References
- Godfray, H.C.; Garnett, T. Food security and sustainable intensification. Philos. Trans. R. Soc. Ser. B 2014, 369, 20120273. [Google Scholar] [CrossRef] [PubMed]
- Khan, S.; Hanjra, M.A.; Mu, J. Water management and crop production for food security in China: A review. Agric. Water Manag. 2009, 96, 349–360. [Google Scholar] [CrossRef]
- Van Bavel, J. The world population explosion: Causes, backgrounds and -projections for the future. Facts Views Vis. ObGyn 2013, 5, 281–291. [Google Scholar] [PubMed]
- Zhou, X.; Helmers, M.J.; Asbjornsen, H.; Kolka, R.; Tomer, M.D. Perennial filter strips reduce nitrate levels in soil and shallow groundwater after grassland-to-cropland conversion. J. Environ. Qual. 2010, 39, 2006–2015. [Google Scholar] [CrossRef]
- Balcerzak, A.M.; Smiley, P.C.; Kalcic, M.M. Evaluating the Effects of Riparian Habitat Type on Nutrient Concentrations in Agricultural Headwater Streams. J. Am. Water Resour. Assoc. 2022, 58, 1497–1809. [Google Scholar] [CrossRef]
- Zheng, T.; Zhou, Z.; Zou, Y.; Pulatov, B.; Biswas, A. Analysis of Spatial and Temporal Characteristics and Spatial Flow Process of Soil Conservation Service in Jinghe Basin of China. Sustainability 2021, 13, 1794. [Google Scholar] [CrossRef]
- Sliva, L.; Williams, D.D. Buffer zone versus whole catchment approaches to studying land use impact on river water quality. Water Resour. 2001, 35, 3462–3472. [Google Scholar] [CrossRef]
- Shen, Z.; Liao, Q.; Hong, Q.; Gong, Y. An overview of research onagricultural non-point source pollution modelling in China. Sep. Purif. Technol. 2012, 84, 104–111. [Google Scholar] [CrossRef]
- Stang, C.; Gharabaghi, B.; Rudra, R.; Golmohammadi, G.; Mahboubi, A.A.; Ahmed S, I. Conservation management practices: Success story of the Hog Creek and Sturgeon River watersheds, Ontario, Canada. J. Soil Water Conserv. 2016, 71, 237–248. [Google Scholar] [CrossRef]
- Anbumozhi, V.; Radhakrishnan, J.; Yamaji, E. Impact of riparian buffer zones on water quality and associated management considerations. Ecol. Eng. 2005, 24, 517–523. [Google Scholar] [CrossRef]
- Jaja, N.; Mbila, M.; Codling, E.; Tsegaye, T.; Odutola, J. Landscape Variability of Riparian Buffers and Its Impact on Soil and Water Chemistry of an Urbanized Watershed. Ecol. Indic. 2022, 137, 108777. [Google Scholar] [CrossRef]
- Momm, H.G.; Bingner, R.L.; Yuan, Y.; Locke, M.A.; Wells, R.R. Spatial characterization of riparian buffer effects on sediment loads from watershed systems. J. Environ. Qual. 2014, 43, 1736–1753. [Google Scholar] [CrossRef]
- Lee, P.; Smyth, C.; Boutin, S. Quantitative Review of Riparian Buffer Width Guidelines from Canada and the United States. J. Environ. Manag. 2004, 70, 165–180. [Google Scholar] [CrossRef]
- Liu, X.; Zhang, X.; Zhang, M. Major factors influencing the efficacy of vegetated buffers on sediment trapping: A review and analysis. J. Environ. Qual. 2008, 37, 1667–1674. [Google Scholar] [CrossRef]
- Zhang, X.; Liu, Y.; Zhou, L. Correlation Analysis between Landscape Metrics and Water Quality under Multiple Scales. Int. J. Environ. Res. Public Health 2018, 15, 1606. [Google Scholar] [CrossRef]
- Fischer, R.A.; Fischenich, J.C. Design Recommendations for Riparian Corridors and Vegetated Buffer Strips; Technical Note (Ecosystem Management and Restoration Research Program (U.S.)). 2000. no. ERDC TN-EMRRP-SR-24. Available online: http://www.elkhornsloughctp.org/uploads/files/1381443282Fischer%20and%20Fischenich%202000%20buffer%20design.pdf (accessed on 20 March 2017).
- Mayer, P.M.; Reynolds, S.K., Jr.; McCutchen, M.D.; Canfield, T.J. Riparian Buffer Width, Vegetative Cover, and Nitrogen Removal Effectiveness: A Review of Current Science and Regulations; EPA/600/R-05/118; United States Environmental Protection Agency: Washington, DC, USA, 2005. [Google Scholar]
- Jiang, K.; Li, Z.; Luo, C.; Wu, M.; Chao, L.; Zhou, Q.; Zhao, H. The reduction effects of riparian reforestation on runoff and nutrient export based on AnnAGNPS model in a small typical watershed, China. Environ. Sci. Pollut. Res. 2019, 26, 5934–5943. [Google Scholar] [CrossRef]
- Sweeney, B.W.; Newbold, J.D. Stream side forest buffer width needed to protect stream water quality, habitat, and organisms: A literature review. J. Am. Water Resour. Assoc. 2014, 50, 560–584. [Google Scholar] [CrossRef]
- Liu, Z.; Tong, S.T.Y. Using HSPF to model the hydrologic and water quality impacts of riparian land-use change in a small watershed. J. Environ. Inform. 2011, 17, 1–14. [Google Scholar] [CrossRef]
- Richardson, J.S.; Naiman, R.J.; Bisson, P.A. How did fixed-width buffers become standard practice for protecting freshwaters and theirriparian areas from forest harvest practices? Fresh Water Sci. 2012, 31, 232–238. [Google Scholar] [CrossRef]
- Sharma, A.; Tiwari, K.N.; Bhadoria, P.B.S. Effect of Land Use Land Cover Change on Soil Erosion Potential in an Agricultural Watershed. Environ. Monit. Assess. 2011, 173, 789–801. [Google Scholar] [CrossRef]
- Tilahun, A.; Asmare, T.; Nega, W.; Gashaw, T. The Nexus between Land Use, Land Cover Dynamics, and Soil Erosion: A Case Study of the Temecha Watershed, Upper Blue Nile Basin, Ethiopia. Environ. Sci. Pollut. Res. 2023, 30, 1023–1038. [Google Scholar] [CrossRef] [PubMed]
- Gassman, P.W.; Sadeghi, A.M.; Srinivasan, R. Applications of the SWAT Model Special Section: Overview and Insights. J. Environ. Qual. 2014, 43, 1–8. [Google Scholar] [CrossRef] [PubMed]
- Roostaee, M.; Deng, Z. HSPF-Based Watershed-Scale Water Quality Modeling and Uncertainty Analysis. Environ. Sci. Pollut. Res. 2019, 26, 8971–8991. [Google Scholar] [CrossRef] [PubMed]
- Ma, L.; He, C.; Bian, H.; Sheng, L. MIKE SHE Modeling of Ecohydrological Processes: Merits, Applications, and Challenges. Ecol. Eng. 2016, 96, 137–149. [Google Scholar] [CrossRef]
- Qi, H.; Altinakar, M.S.; Vieira, D.A.N.; Alidaee, B. Application of Tabu Search Algorithm with a Coupled AnnAGNPS-CCHE1D Model to Optimize Agricultural Land Use1. J. Am. Water Resour. Assoc. 2008, 44, 866–878. [Google Scholar] [CrossRef]
- Guo, Y.; Peng, C.; Zhu, Q.; Wang, M.; Wang, H.; Peng, S.; He, H. Modelling the Impacts of Climate and Land Use Changes on Soil Water Erosion: Model Applications, Limitations and Future Challenges. J. Environ. Manag. 2019, 250, 109403. [Google Scholar] [CrossRef]
- Zhang, J.; Li, S.; Dong, R.; Jiang, C.; Ni, M. Influences of Land Use Metrics at Multi-Spatial Scales on Seasonal Water Quality: A Case Study of River Systems in the Three Gorges Reservoir Area, China. J. Clean. Prod. 2019, 206, 76–85. [Google Scholar] [CrossRef]
- Xue, J.; Wang, Q.; Zhang, M. A Review of Non-Point Source Water Pollution Modeling for the Urban–Rural Transitional Areas of China: Research Status and Prospect. Sci. Total Environ. 2022, 826, 154146. [Google Scholar] [CrossRef]
- Zhang, C.; Li, S.; Qi, J.; Xing, Z.; Meng, F. Assessing Impacts of Riparian Buffer Zones on Sediment and Nutrient Loadings into Streams at Watershed Scale Using an Integrated REMM-SWAT Model. Hydrol. Process. 2017, 31, 916–924. [Google Scholar] [CrossRef]
- Vidon, P.; Allan, C.; Burns, D.; Duval, T.P.; Gurwick, N.; Inamdar, S.; Lowrance, R.; Okay, J.; Scott, D.; Sebestyen, S. Hot Spots and Hot Moments in Riparian Zones: Potential for Improved Water Quality Management1. JAWRA J. Am. Water Resour. Assoc. 2010, 46, 278–298. [Google Scholar] [CrossRef]
- Qi, Q.; Wang, T.; Kou, X.; Ge, J. Temporal and spatial changes of vegetation cover and the relationship with precipitation in Jinghe watershed of China. Chin. J. Plant Ecol. 2009, 33, 246–253. [Google Scholar]
- Bingner, R.L.; Theurer, F.D. AnnAGNPS: Estimating sediment yield by particle size for sheet and rill erosion. In Proceedings of the Seventh Interagency Sedimentation Conference, Reno, NV, USA, 25–29 March 2001; Volume 1, pp. 1–7. [Google Scholar]
- LPDC (Loess Plateau Data Center). Data of 90 meter resolution digital elevation model (DEM) in Weihe River Basin. Available online: http://loess.geodata.cn (accessed on 3 March 2017).
- Dixon, B.; Earls, J. Resample or Not?! Effects of Resolution of DEMs in Watershed Modeling. Hydrol. Process. 2009, 23, 1714–1724. [Google Scholar] [CrossRef]
- Bosch, D.D.; Sheridan, J.M.; Batten, H.L.; Arnold, J.G. Evaluation of the swat model on a coastal plain agricultural watershed. Trans. ASAE 2004, 47, 1493–1506. [Google Scholar] [CrossRef]
- Nazari-Sharabian, M.; Taheriyoun, M.; Karakouzian, M. Sensitivity Analysis of the DEM Resolution and Effective Parameters of Runoff Yield in the SWAT Model: A Case Study. J. Water Supply Res. Technol.-AQUA 2019, 69, 39–54. [Google Scholar] [CrossRef]
- Theurer, F.D.; Cronshey, R.G. AnnAGNPS-reach routing processes. In Proceedings of the First Federal Interagency Hydrologic Modeling Conference, Las Vegas, NV, USA, 19–23 April 1998; pp. 19–23. [Google Scholar]
- CSD (China Soil Database). Soil Science Database. Available online: http://vdb3.soil.csdb.cn/ (accessed on 20 March 2017).
- NOAA (National Oceanic and Atmospheric Administration). Global Summary of the Month. Available online: https://www.ncdc.noaa.gov/cdo-web/datasets (accessed on 20 March 2017).
- OpenEI Datasets. Summary World Solar Energy Data (Updated 29 July 2014). Available online: https://en.openei.org/datasets/dataset?tags=China (accessed on 17 April 2017).
- Richardson, C.W.; Wright, D.A. WGEN: A Model for Generating Daily Weather Variables; US Department of Agriculture, Agricultural Research Service: Washington, DC, USA, 1984; 83p. [Google Scholar]
- Bingner, R.L.; Theurer, F.D.; Yuan, Y. AnnAGNPS Technical Processes. 2003. Available online: http://www.sedlab.olemiss.edu/AGNPS (accessed on 20 March 2017).
- Lowrance, R.; Altier, R.S.; Williams, R.G.; Inamdar, S.P.; Sheridan, J.M.; Bosch, D.D.; Hubbard, R.K.; Thomas, D.L. REMM: The Riparian Ecosystem Management Model. J. Soil Water Conserv. 2000, 55, 27–34. [Google Scholar]
- Altier, L.S.; Lowrance, R.R.; Williams, R.G.; Inamdar, S.P.; Bosch, D.D.; Sheridan, J.M.; Hubbard, R.K.; Thomas, D.L. Riparian Ecosystem Management Model (REMM): Documentation; USDA Conservation Research Report; USDA: Washington, DC, USA, 2000.
- Welsch, D.J. Riparian Forest Buffers: Function and Design for Protection and Enhancement of Water Resources; NA-PR-07-91; U.S. Department of Agriculture, Forest Service, Northern Area State & Private Forestry: Broomall, PA, USA, 1991.
- Yuan, Y.; Bingner, R.; Williams, R.; Lowrance, R.; Bosch, D.; Sheridan, J. Integration of the models of AnnAGNPS and REMM to assess riparian buffer system for sediment reduction. Int. J. Sediment Res. 2007, 22, 60–69. [Google Scholar]
- United States Geological Survey (USGS). National Hydrography Dataset (NHD). Available online: https://www.usgs.gov/national-hydrography/national-hydrography-dataset (accessed on 3 March 2017).
- USDA. Cropland Data Layer (CDL). Available online: https://www.nass.usda.gov/Research_and_Science/Cropland/SARS1a.php (accessed on 3 March 2017).
- Soil Survey Staff, Natural Resources Conservation Service, United States Department of Agriculture, Web Soil Survey. Available online: https://websoilsurvey.nrcs.usda.gov/ (accessed on 3 March 2017).
- Inamdar, S.P.; Sheridan, J.M.; Williams, R.G.; Bosch, D.D.; Lowrance, R.R.; Altier, L.S.; Thomas, D.L. Riparian Ecosystem Management Model (REMM): I. Testing of the hydrologic component for a coastal plain riparian system. Trans. ASAE 1999, 42, 1679–1689. [Google Scholar] [CrossRef]
- Inamdar, S.P.; Lowrance, R.R.; Altier, L.S.; Williams, R.G.; Hubbard, R.K. Riparian Ecosystem Management Model (REMM): II. Testing of the water quality and nutrient cycling component for a coastal plain riparian system. Trans. ASAE 1999, 42, 1691–1707. [Google Scholar] [CrossRef]
- Noori, R.; Maghrebi, M.; Jessen, S.; Bateni, S.M.; Heggy, E.; Javadi, S.; Nouri, M.; Pistre, S.; Abolfathi, S.; AghaKouchak, A. Decline in Iran’s Groundwater Recharge. Res. Sq. 2023. Preprint. [Google Scholar] [CrossRef]
- Malekmohammadi, B.; Uvo, C.B.; Moghadam, N.T.; Noori, R.; Abolfathi, S. Environmental Risk Assessment of Wetland Ecosystems Using Bayesian Belief Networks. Hydrology 2023, 10, 16. [Google Scholar] [CrossRef]
- Mayer, P.M.; Reynolds, S.K.; McCutchen, M.D.; Canfield, T.J. Meta-Analysis of Nitrogen Removal in Riparian Buffers. J. Environ. Qual. 2007, 36, 1172–1180. [Google Scholar] [CrossRef]
- Dunn, A.M.; Julien, G.; Ernst, W.R.; Cook, A.; Doe, K.G.; Jackman, P.M. Evaluation of Buffer Zone Effectiveness in Mitigating the Risks Associated with Agricultural Runoff in Prince Edward Island. Sci. Total Environ. 2011, 409, 868–882. [Google Scholar] [CrossRef] [PubMed]
- Meador, M.R.; Goldstein, R.M. 2003. Assessing Water Quality at Large Geographic Scales: Relations among Land Use, Water Physicochemistry, Riparian Condition, and Fish Community Structure. Environ. Manag. 2003, 31, 504–517. [Google Scholar] [CrossRef] [PubMed]
- Clausen, J.C.; Guillard, K.; Sigmund, C.M.; Martin Dors, K. Water Quality Changes from Riparian Buffer Restoration in Connecticut. J. Environ. Qual. 2000, 29, 1751–1761. [Google Scholar] [CrossRef]
- Ziegler, A.D.; Negishi, J.; Sidle, R.C.; Preechapanya, P.; Sutherland, R.A.; Giambelluca, T.W.; Jaiaree, S. Reduction of Stream Sediment Concentration by a Riparian Buffer: Filtering of Road Runoff in Disturbed Headwater Basins of MontaneMainland Southeast Asia. J. Environ. Qual. 2006, 35, 151–162. [Google Scholar] [CrossRef]
- Mekonnen, M.; Keesstra, S.D.; Stroosnijder, L.; Baartman, J.E.M.; Maroulis, J. Soil Conservation Through Sediment Trapping: A Review. Land Degrad. Dev. 2015, 26, 544–556. [Google Scholar] [CrossRef]
- Aparício, B.A.; Nunes, J.P.; Bernard-Jannin, L.; Dias, L.F.; Fonseca, A.; Ferreira, T. Modelling the Role of Ground-True Riparian Vegetation for Providing Regulating Services in a Mediterranean Watershed. Int. Soil Water Conserv. Res. 2023, 11, 159–168. [Google Scholar] [CrossRef]
- Lakel, W.A.; Aust, W.M.; Holding, M.C.; Dolloff, C.A.; Keyser, P.; Feldt, R. Sediment trapping by streamside management zones of various widths after forest harvest and site preparation. For. Sci. 2010, 56, 541–551. [Google Scholar]
- McKergow, L.A.; Weaver, D.M.; Prosser, I.P.; Grayson, R.B.; Reed, A.E.G. Before and after riparian management: Sediment and nutrient exports from a small agricultural catchment, Western Australia. J. Hydrol. 2003, 270, 253–272. [Google Scholar] [CrossRef]
- Tomer, M.D.; Moorman, T.B.; Kovar, J.L.; James, D.E.; Burkart, M.R. Spatial patterns of sediment and phosphorus in a riparian buffer in western Iowa. J. Soil Water Conserv. 2007, 62, 329–338. [Google Scholar]
- Sparovek, G.; Beatriz Lima Ranieri, S.; Gassner, A.; Clerice De Maria, I.; Schnug, E.; Ferreira Dos Santos, R.; Joubert, A. A conceptual framework for the definition of the optimal width of riparian forests. Agric. Ecosyst. Environ. 2002, 90, 169–175. [Google Scholar] [CrossRef]


| Date (Day/Month) | Operations of Corn | Operations of Winter Wheat |
|---|---|---|
| 1/11 | Tillage | |
| 10/4 | Fertilizer | |
| 1/5 | Tillage | |
| 10/5 | Seeding | |
| 10/6 | Fertilizer | |
| 20/10 | Harvesting | |
| 11/10 | Tillage | |
| 13/10 | Seeding | |
| 10/3 | Fertilizer | |
| 1/7 | Harvesting |
| Zones | Designs | Design 1 | Design 2 | Design 3 | Design 4 | Design 5 |
|---|---|---|---|---|---|---|
| Zone 3 | Zone Width (cm) | 20 | 0 | 20 | 0 | 10 |
| Vegetation Type | A | none | A | none | A | |
| Zone 2 | Zone Width (cm) | 20 | 20 | 0 | 10 | 0 |
| Vegetation Type | B | B | none | B | none | |
| Zone 1 | Zone Width (cm) | 10 | 10 | 10 | 10 | 10 |
| Vegetation Type | C | C | C | C | C |
| Date (Month/Day) | AnnAGNPS Simulated | REMM Simulated | Published [48] |
|---|---|---|---|
| Surface runoff (mm) | 229.7 | 216.9 | |
| Sediment Loading (kg/ha) | 990.6 | 1236.8 | |
| N in surface runoff (kg/ha) | 7.8 | 8.5 | |
| Into Zone 3 (mm) | 235.6 | 216.9 | |
| Into Zone 2 (mm) | 142.1 | 141.3 | |
| Into Zone 1 (mm) | 85.4 | 88.0 |
Disclaimer/Publisher’s Note: The statements, opinions and data contained in all publications are solely those of the individual author(s) and contributor(s) and not of MDPI and/or the editor(s). MDPI and/or the editor(s) disclaim responsibility for any injury to people or property resulting from any ideas, methods, instructions or products referred to in the content. |
© 2023 by the authors. Licensee MDPI, Basel, Switzerland. This article is an open access article distributed under the terms and conditions of the Creative Commons Attribution (CC BY) license (https://creativecommons.org/licenses/by/4.0/).
Share and Cite
Liu, C.; Qu, L.; Clausen, J.; Lei, T.; Yang, X. Impact of Riparian Buffer Zone Design on Surface Water Quality at the Watershed Scale, a Case Study in the Jinghe Watershed in China. Water 2023, 15, 2696. https://doi.org/10.3390/w15152696
Liu C, Qu L, Clausen J, Lei T, Yang X. Impact of Riparian Buffer Zone Design on Surface Water Quality at the Watershed Scale, a Case Study in the Jinghe Watershed in China. Water. 2023; 15(15):2696. https://doi.org/10.3390/w15152696
Chicago/Turabian StyleLiu, Cong, Liqin Qu, John Clausen, Tingwu Lei, and Xiusheng Yang. 2023. "Impact of Riparian Buffer Zone Design on Surface Water Quality at the Watershed Scale, a Case Study in the Jinghe Watershed in China" Water 15, no. 15: 2696. https://doi.org/10.3390/w15152696