Article

Predictive Simulation Study on the Effect of Small and Medium River Basin Outfall Treatment Measures on Water Quality Improvement

1
College of Hydraulic & Environmental Engineering, China Three Gorges University, Yichang 443002, China
2
Housing and Construction Bureau of Dapeng New District, Shenzhen 518119, China
*
Author to whom correspondence should be addressed.
Water 2023, 15(13), 2359; https://doi.org/10.3390/w15132359
Submission received: 1 June 2023 / Revised: 18 June 2023 / Accepted: 24 June 2023 / Published: 26 June 2023
(This article belongs to the Special Issue Water Quality Assessment and Modelling)

Abstract

:
In recent years, the problem of water pollution in middle and small river basins has become increasingly serious. In order to control the water pollution of small- and medium-sized rivers, based upon the hydrodynamic module and the water quality module in MIKE21, this paper established a numerical computing model for middle and small river basins by taking the Xiyong River Basin as a typical representative. The excessive levels of nitrogen in the Xiyong River have significantly impaired the quality of the water in terms of the river status, so seven different scenario hypotheses of treatment measures are proposed, based on which the hydrodynamic simulation on the total nitrogen (TN) concentration’s movement was implemented and the time of the nitrogen concentration to reach the standard was predicted. The results showed that the water quality of the Xiyong River improved significantly after the treatment measure, and the annual mean of the TN concentration will decrease by 0.496 mg/L. The results will help the government to control the pollution sources of small and medium river basins. The research of Xiyong River based on the MIKE21 model can be used as the basis for pollution reduction and water quality improvement, which provides an example for the ecological restoration of small and medium rivers.

1. Introduction

In the process of water environment pollution treatment, the water quality of big rivers and lakes is always mainly of concern and is effectively controlled [1]. However, the water quality of middle and small rivers is continuously becoming worse because of the following reasons: the middle and small river basins, especially the small river basins, generally pass through villages and towns where local people have a relatively low perception on environment protection and the sewage treatment facilities along the small rivers need to be improved. Furthermore, the hydrological characteristics of these rivers are not collected and the technological analyses of pollution mechanism are lacking, which result in the sewage measures for these small rivers being relatively simple and the treatment standards are relatively low. Finally, the water ecosystem is destroyed, while the water stays black and odorous [2]. Therefore, it is of important realistic significance and industrial economic benefit to develop a water environment remediation mechanism and propose an optimal treatment scheme for these middle and small river basins.
Due to the complex shapes and boundaries of the rivers and lakes under natural conditions, the traditional experimental methods consume a lot of labor costs, and the data for water environment treatment are difficult to obtain due to many constraints. Supported by the computing power of modern computers, numerical simulation models of the water environment can accurately simulate the changes in the water flow field and water quality as well as the migration and dispersion of pollutants in fluid movement. As a result, numerical simulation has become a mainstream research tool [3,4].
The software used in hydrological numerical simulation includes the MIKE software model developed by the Danish Hydraulic Institute (DHI), the WASP and EFDC model presented by the U.S. Environment Protection Agency (EPA), the SWAT model established by the U.S. Department of Agriculture (USDA), and some other models such as the SELECT, CE-QUAL-R1, and CE-QUAL-W2 models, and so on. All of these models are hydrodynamic in nature, but each one assumes its specific “vocation” with specific conditions for application. For example, SWAT is a model that is specialized in soil water dynamics, while MIKE21 has a wide ability to describe the entire process of flow and hydrodynamic interaction with the environment. In this work, the MIKE21 model was used because it has powerful function in the numerical simulation of two-dimensional free surface flow [5,6,7,8]. This powerful function comes from the core algorithm, which is based upon the solution to the two-dimensional free surface flow equation, where the stratification is neglected. Using MIKE software, Liu et al. (2020) [9] established a two-dimensional hydrodynamic model for the Jingzhou part of the Yangtze River Basin where some wastewater treatment plants are located. In this model, the diffusion conditions of typical pollutants in the Yangtze River such as the chemical oxygen demand (COD), biochemical oxygen demand (BOD), ammonia nitrogen (NH3-N), aniline and hexavalent chromium discharged by the sewage outfall were simulated. The impact area and degree of the influence of pollutant emissions on the water quality of the corresponding part of Yangtze River was also analyzed. A hydrodynamic model for the Bahe River Basin was described by Guo et al. (2019) [10], where the flow field characteristics in different hydrologic years were analyzed, the influence on the water body’s disturbance area by the principal confluence water flow parameter was evaluated, and the corresponding ecological treatment measure was proposed. Similarly, Shu et al. (2019) [11] constructed a hydrodynamic and pollutant movement model for the Ganjiang River Basin. This mainly analyzed the influence of pollution accidents on the water quality of water intakes in a downstream drinking water source under various typical hydrological regimes. On the other hand, MIKE software can also be used to study the hydrodynamic situation for large reservoirs and lakes. For instance, Li et al. (2018) [12] established a hydrodynamic and water quality model for large reservoirs, where the process of pollutants flowing in and out of the reservoir with water was considered, and the movement and dispersion as well as the concentrations of pollutants such as total nitrogen (TN), total phosphorus (TP), ammonia nitrogen (NH3-N) varying with time under a hydrodynamic force function were also analyzed. Similarly, a two-dimensional hydrodynamic and water quality model for a large reservoir was constructed by Hu et al. (2021) [13], where the concentration and distribution of the general water quality index such as dissolved oxygen, ammonia nitrogen, five-day biochemical oxygen demand, TN, TP, and so on during the flood season were compared with that during the non-flood season. Ma developed a hydrodynamic and water quality coupling model to obtain the variation characteristics of a reservoir water quality field [14]. Gong et al. (2019) [15] proposed a hydrodynamic and water quality model for large lakes, where two pollutants, COD and TP, were mainly concerned. Under the assumption that the amount of adjusted water was fixed, the authors simulated the variation of pollutant concentration at a water regulation section from the upper reaches during a special drought period. Finally, the relationship between the pollutant concentration in the lake and the inflow amount, the topographic factor, and the amount of adjusted water was also attained. From these studies, it is easy to see that the MIKE software has extensive applications in analyzing the hydrodynamic process and simulating the water quality as well as moving water pollutants and improving water quality.
Since big rivers and large lakes or reservoirs have relatively good ecosystems, the predictable flow direction as well as stable water flow field, and clear water potential field, the corresponding water quality simulations are comprehensive and thorough, which results in a relatively overall theory of river regulation. However, small- and medium-sized valley rivers are usually small-scale, closed, and irregular, which means that the corresponding hydrological data are not collected completely and a high engineering plasticity with relatively stagnant hydrodynamic conditions is finally formed [16,17,18,19]. Therefore, it is necessary to investigate the factors that influence hydrodynamic processes and solute transport as well as the degradation mechanisms in these kinds of rivers.
Recently, water quality simulations and water environment improvements for small-scaled lakes and small-sized river basins have gradually become of concern and some effective treatment measures have also been obtained. For example, Li et al. (2022) [20] simulated the process of the water environment improvement of 10 typical village lakes in Jianghan Plain and demonstrated the possibility of recharging village lakes from the main streams. The authors also claimed that the key point of controlling the TP is to implement sewage interception, while a more effective treatment to improve the water quality of village lakes is to improve the hydrodynamic condition in the summer time. More recently, Yang constructed a hydrodynamic model for small-scale city artificial lakes, with which the influence of water diversion measures to the water quality of a typical city artificial lake was studied, and several methods to improve the corresponding water quality were proposed [21]. At the same time, Yu proposed a water quality model for some branches with steam order 3 of the Yangtze River, where the water quality was evaluated, the pollution load was analyzed, and the water environmental capacity was computed [22]. Based upon these works, the author of [22] presented four treatment measures including the sewage of point pollution sources, control of non-point source pollution, ecological water supplement, and the up-to-standard reconstruction of wastewater treatment plants. Although the frontiers have conducted the fantastic works above-mentioned, the water ecosystem remediation mechanism of small river basins is not clear yet, and the theoretical evidence of treatment has not been sufficient up until now.
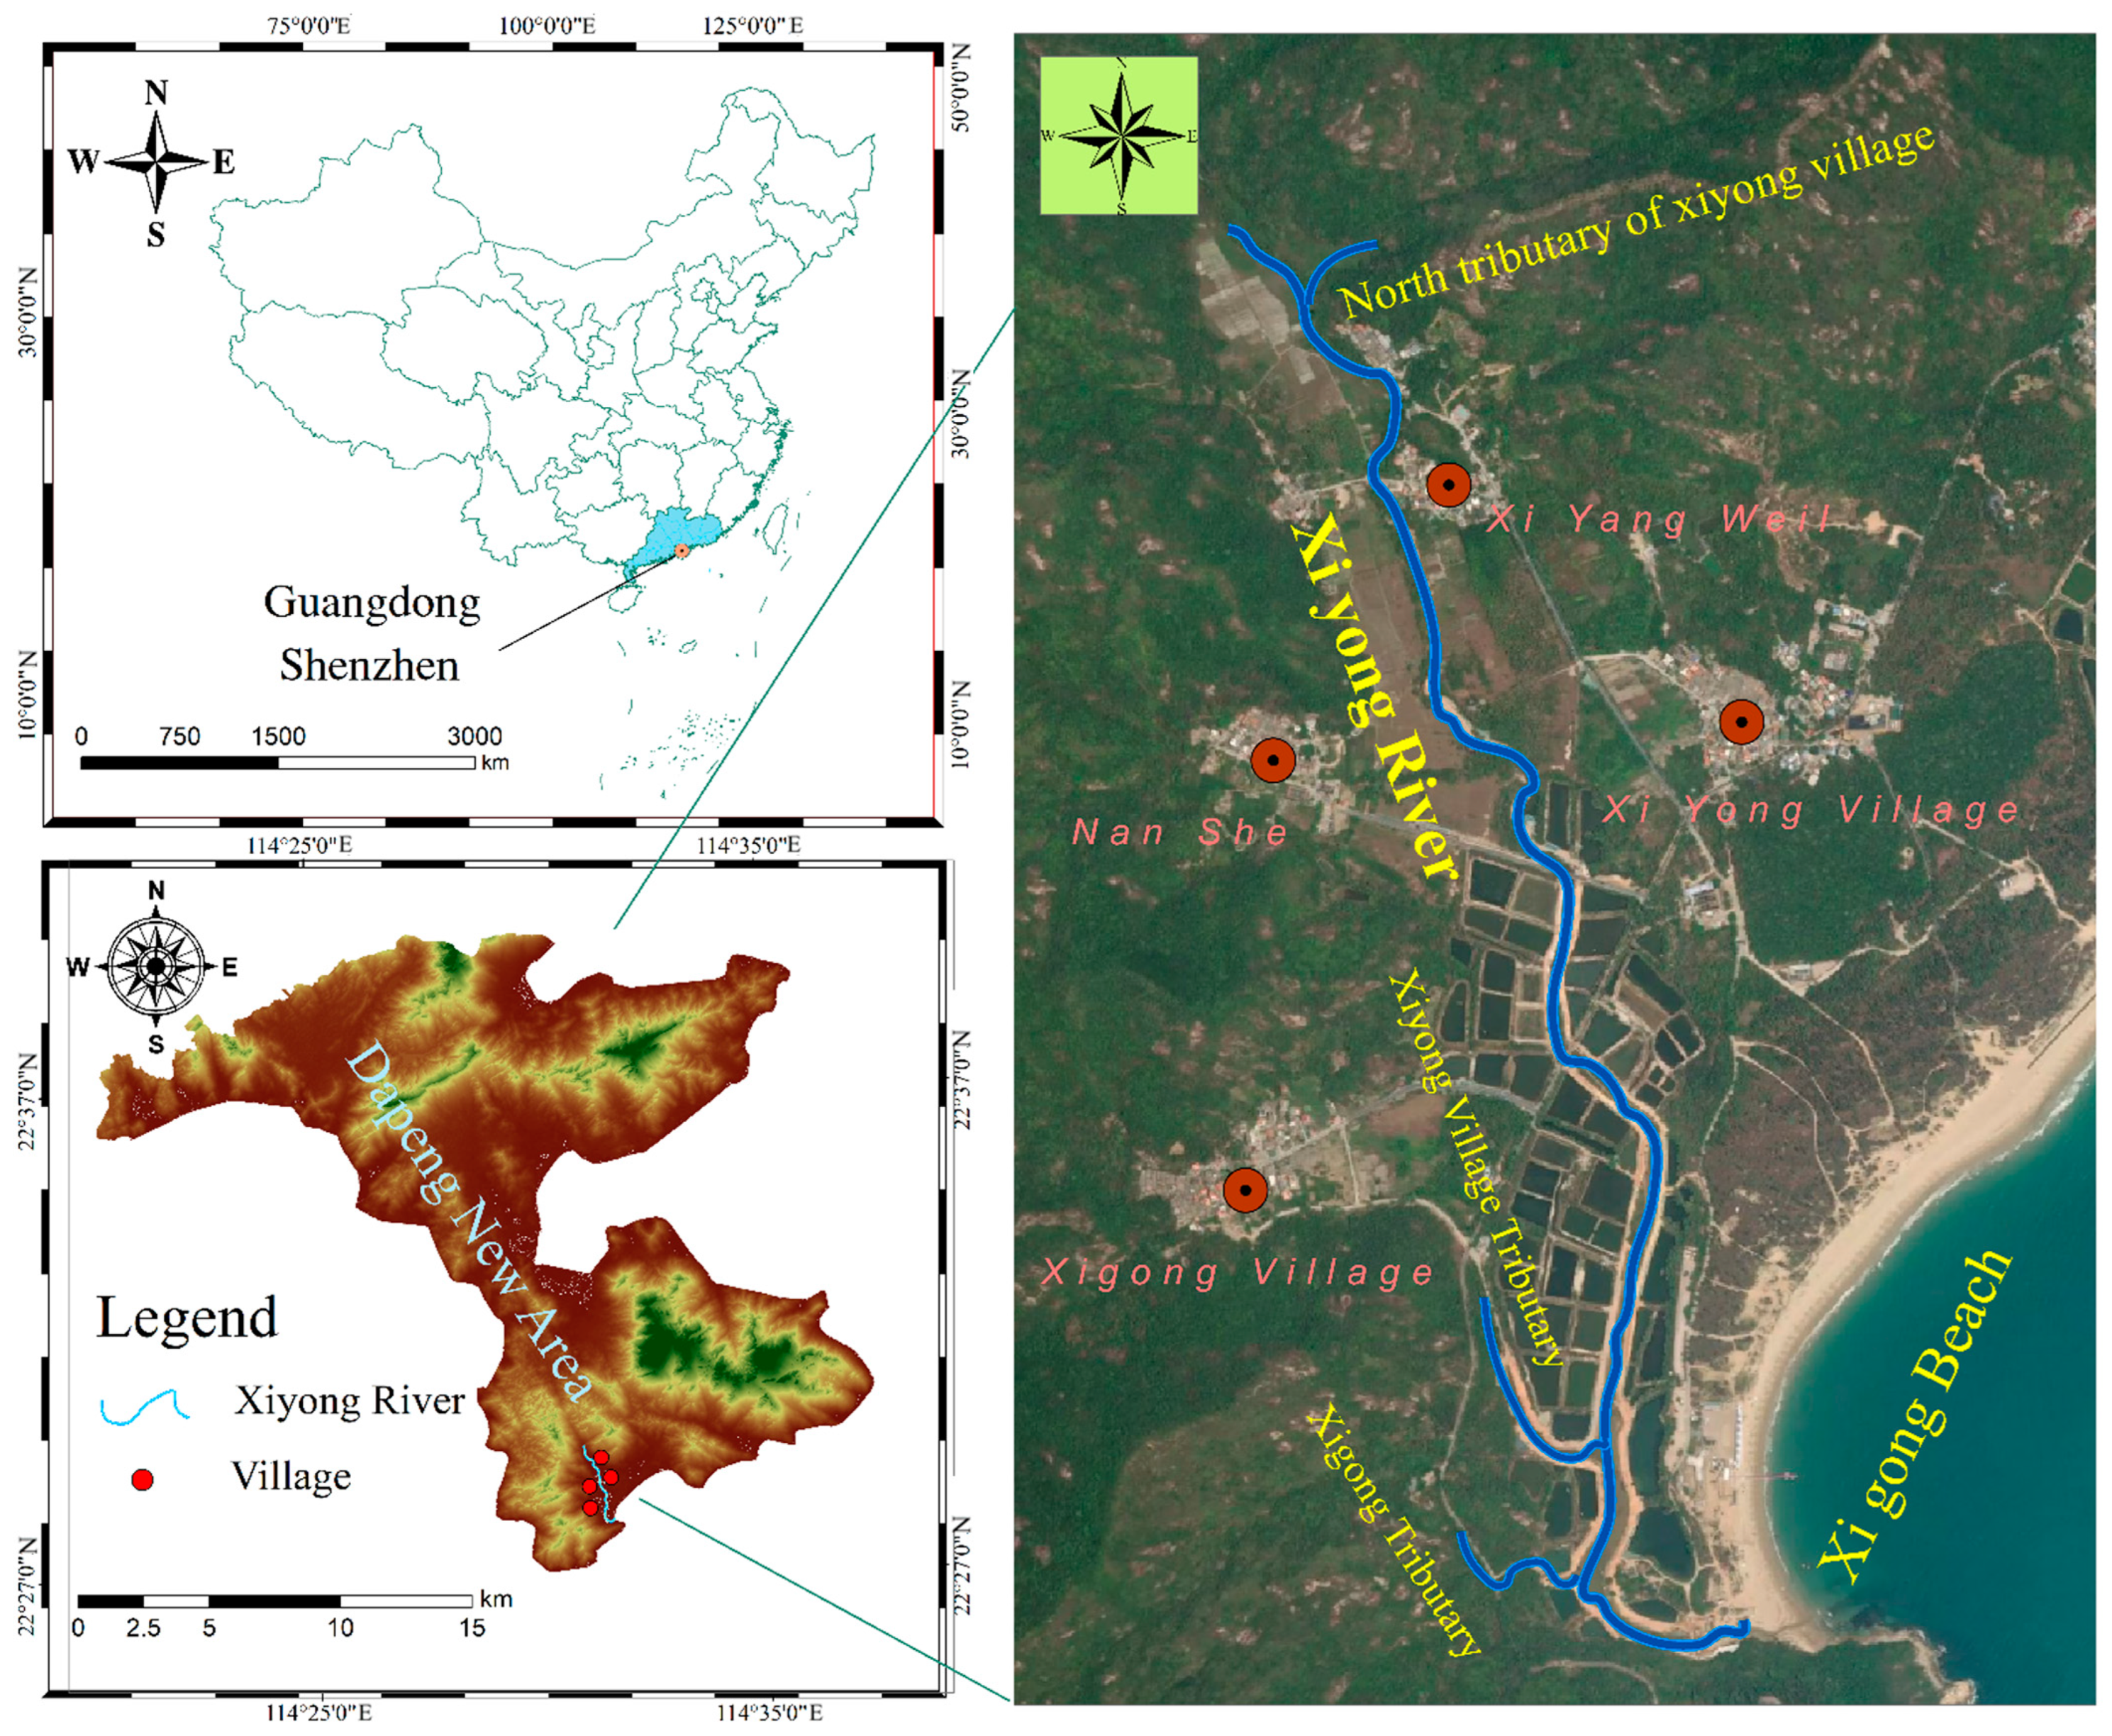
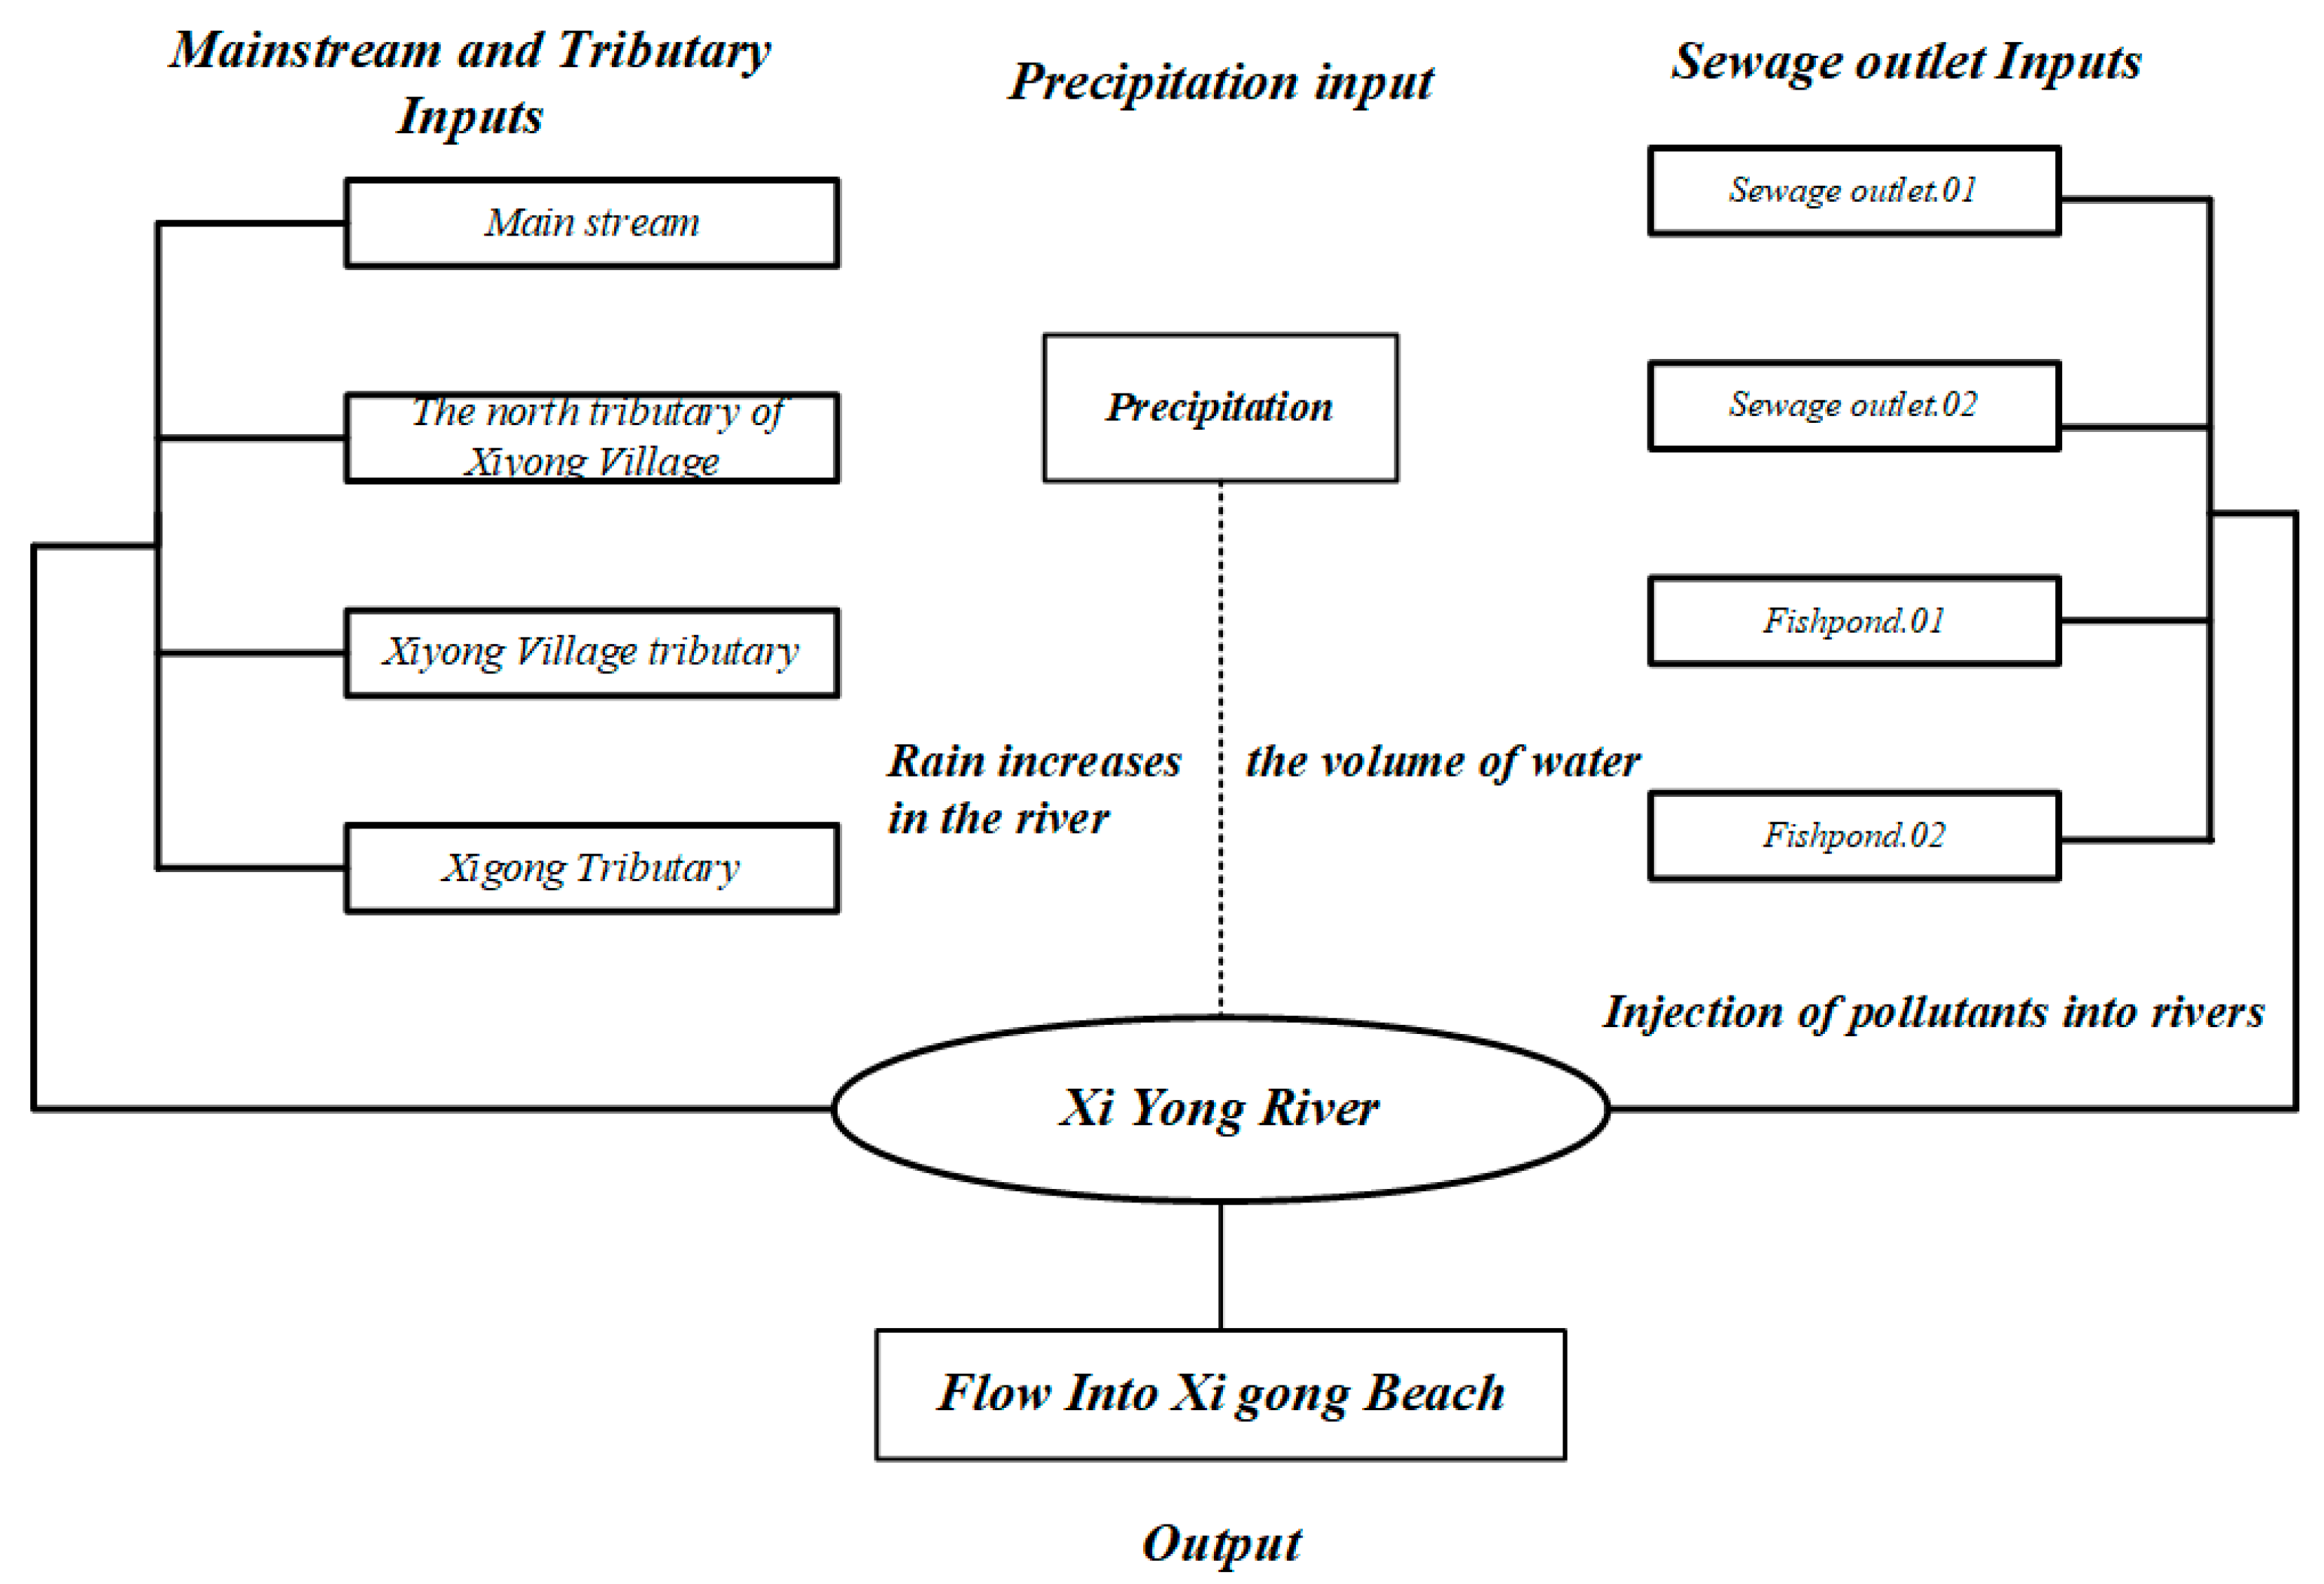
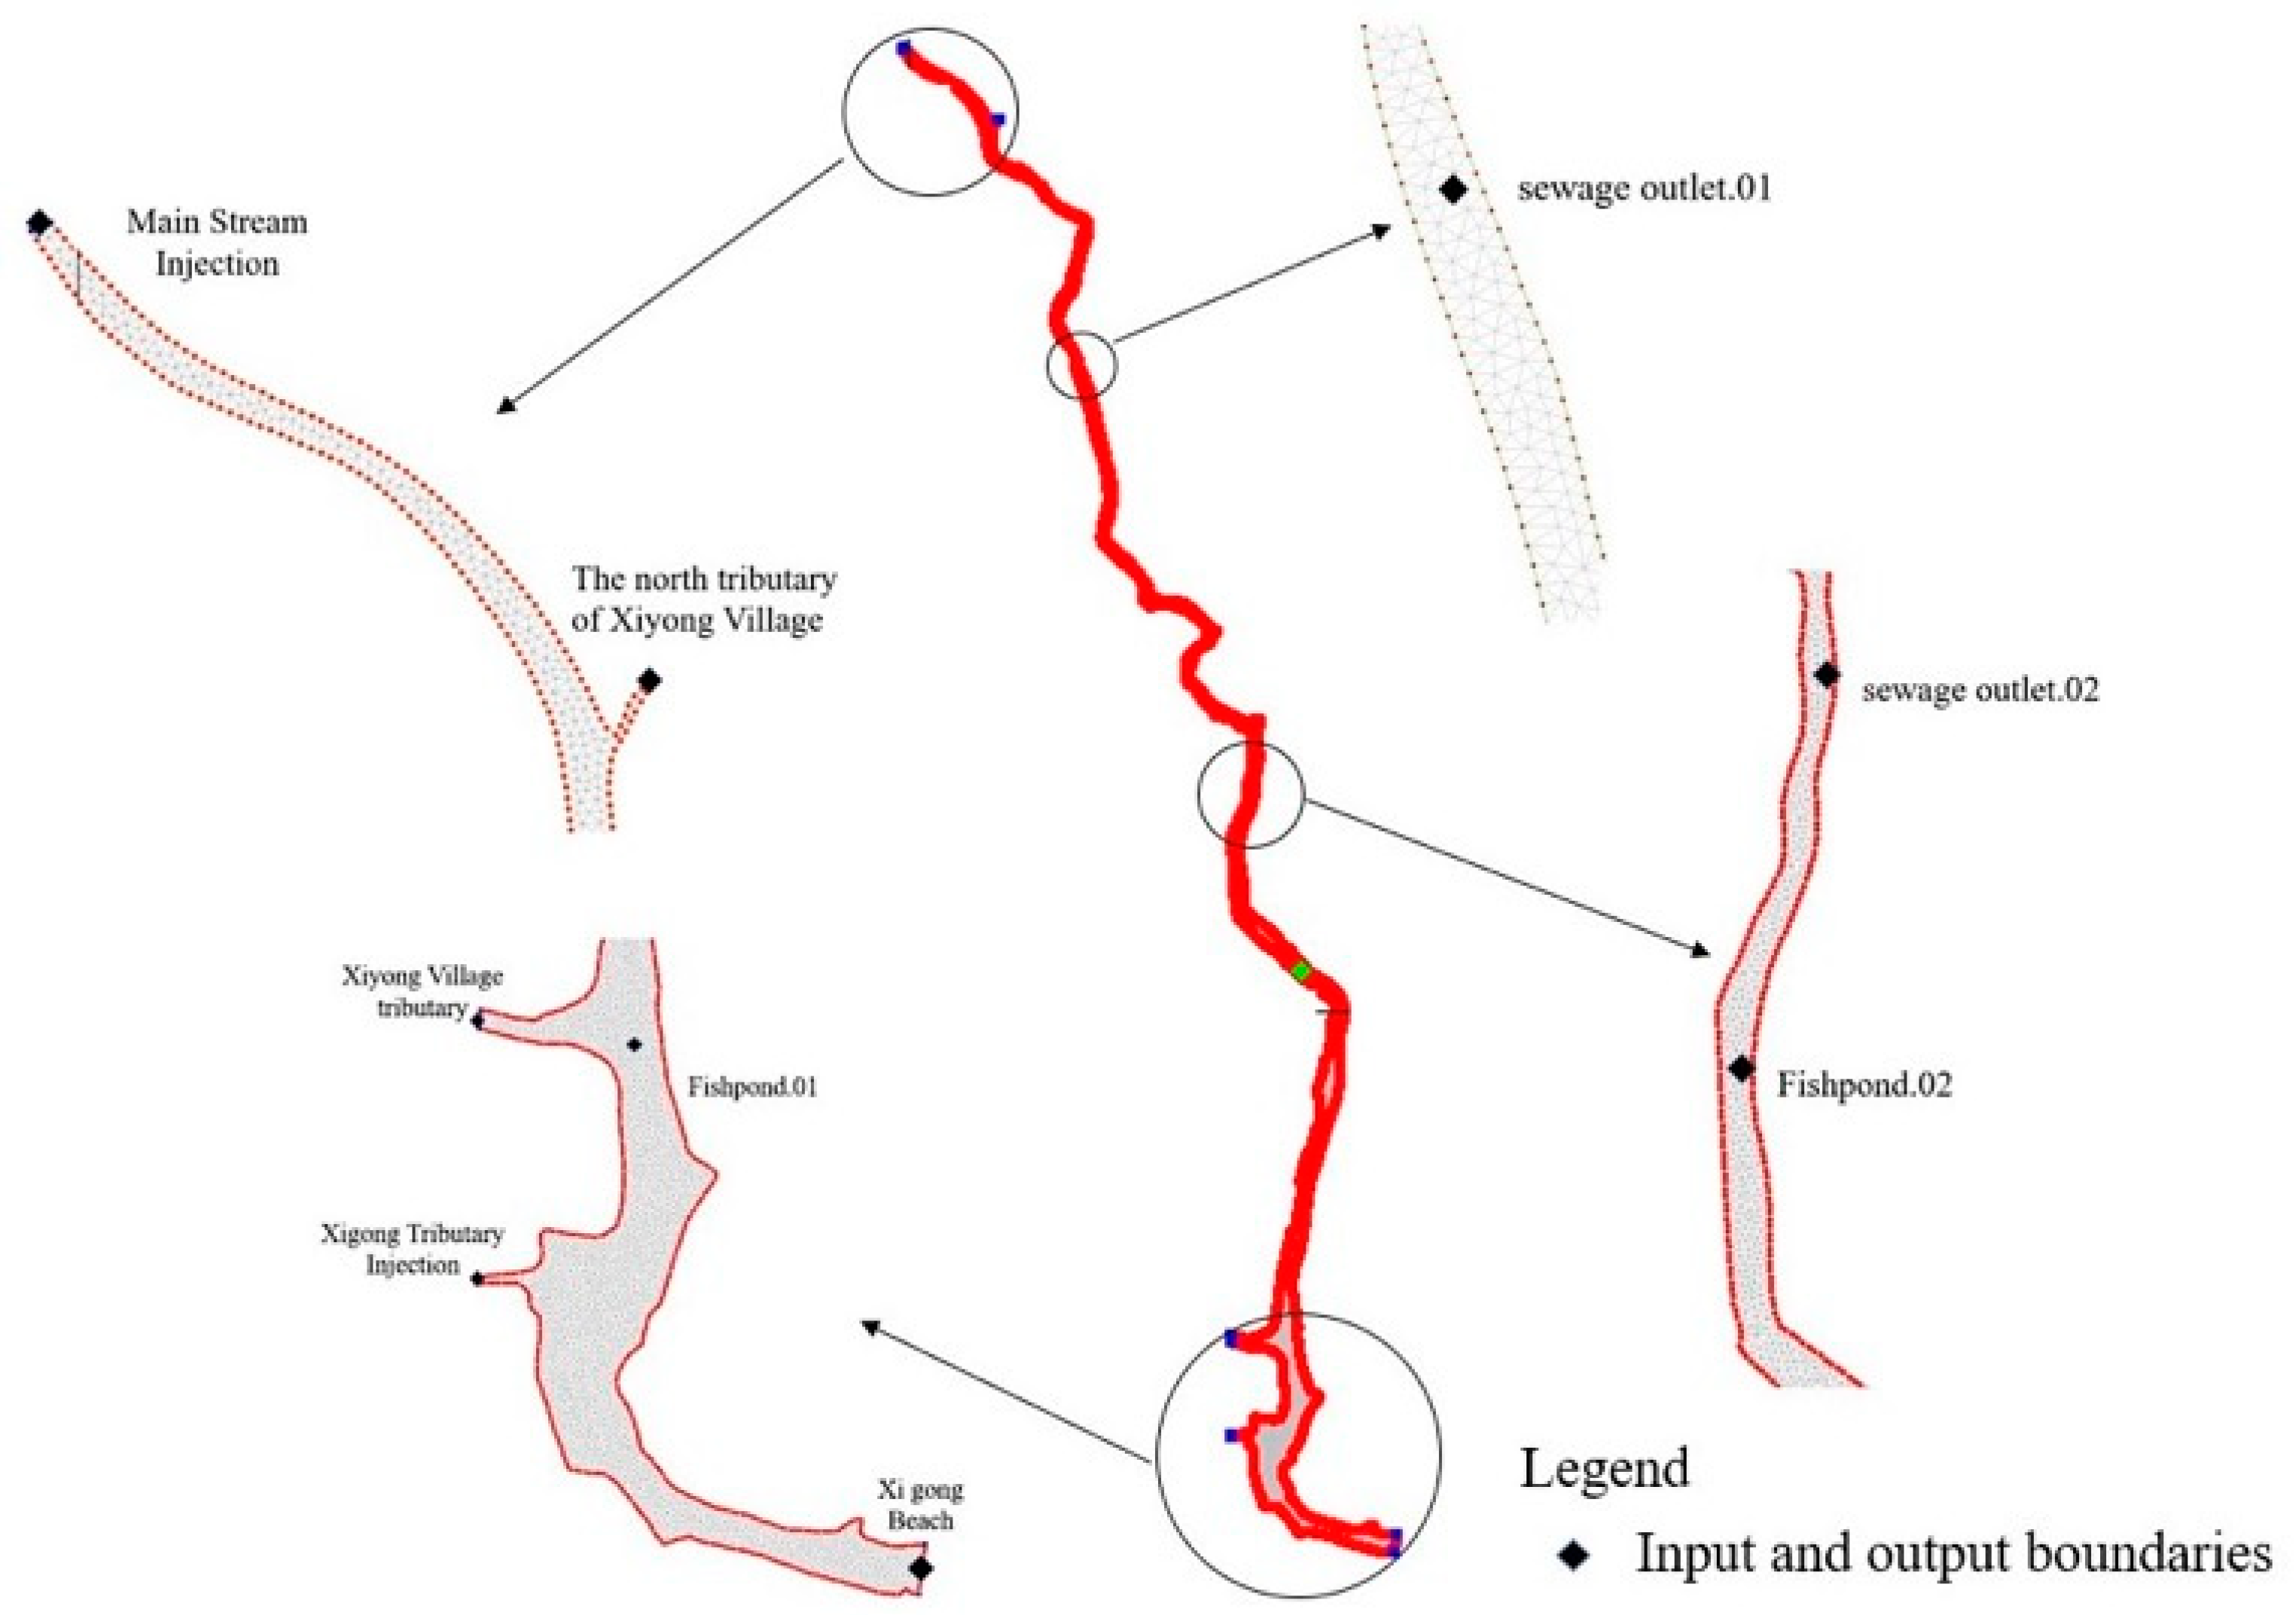
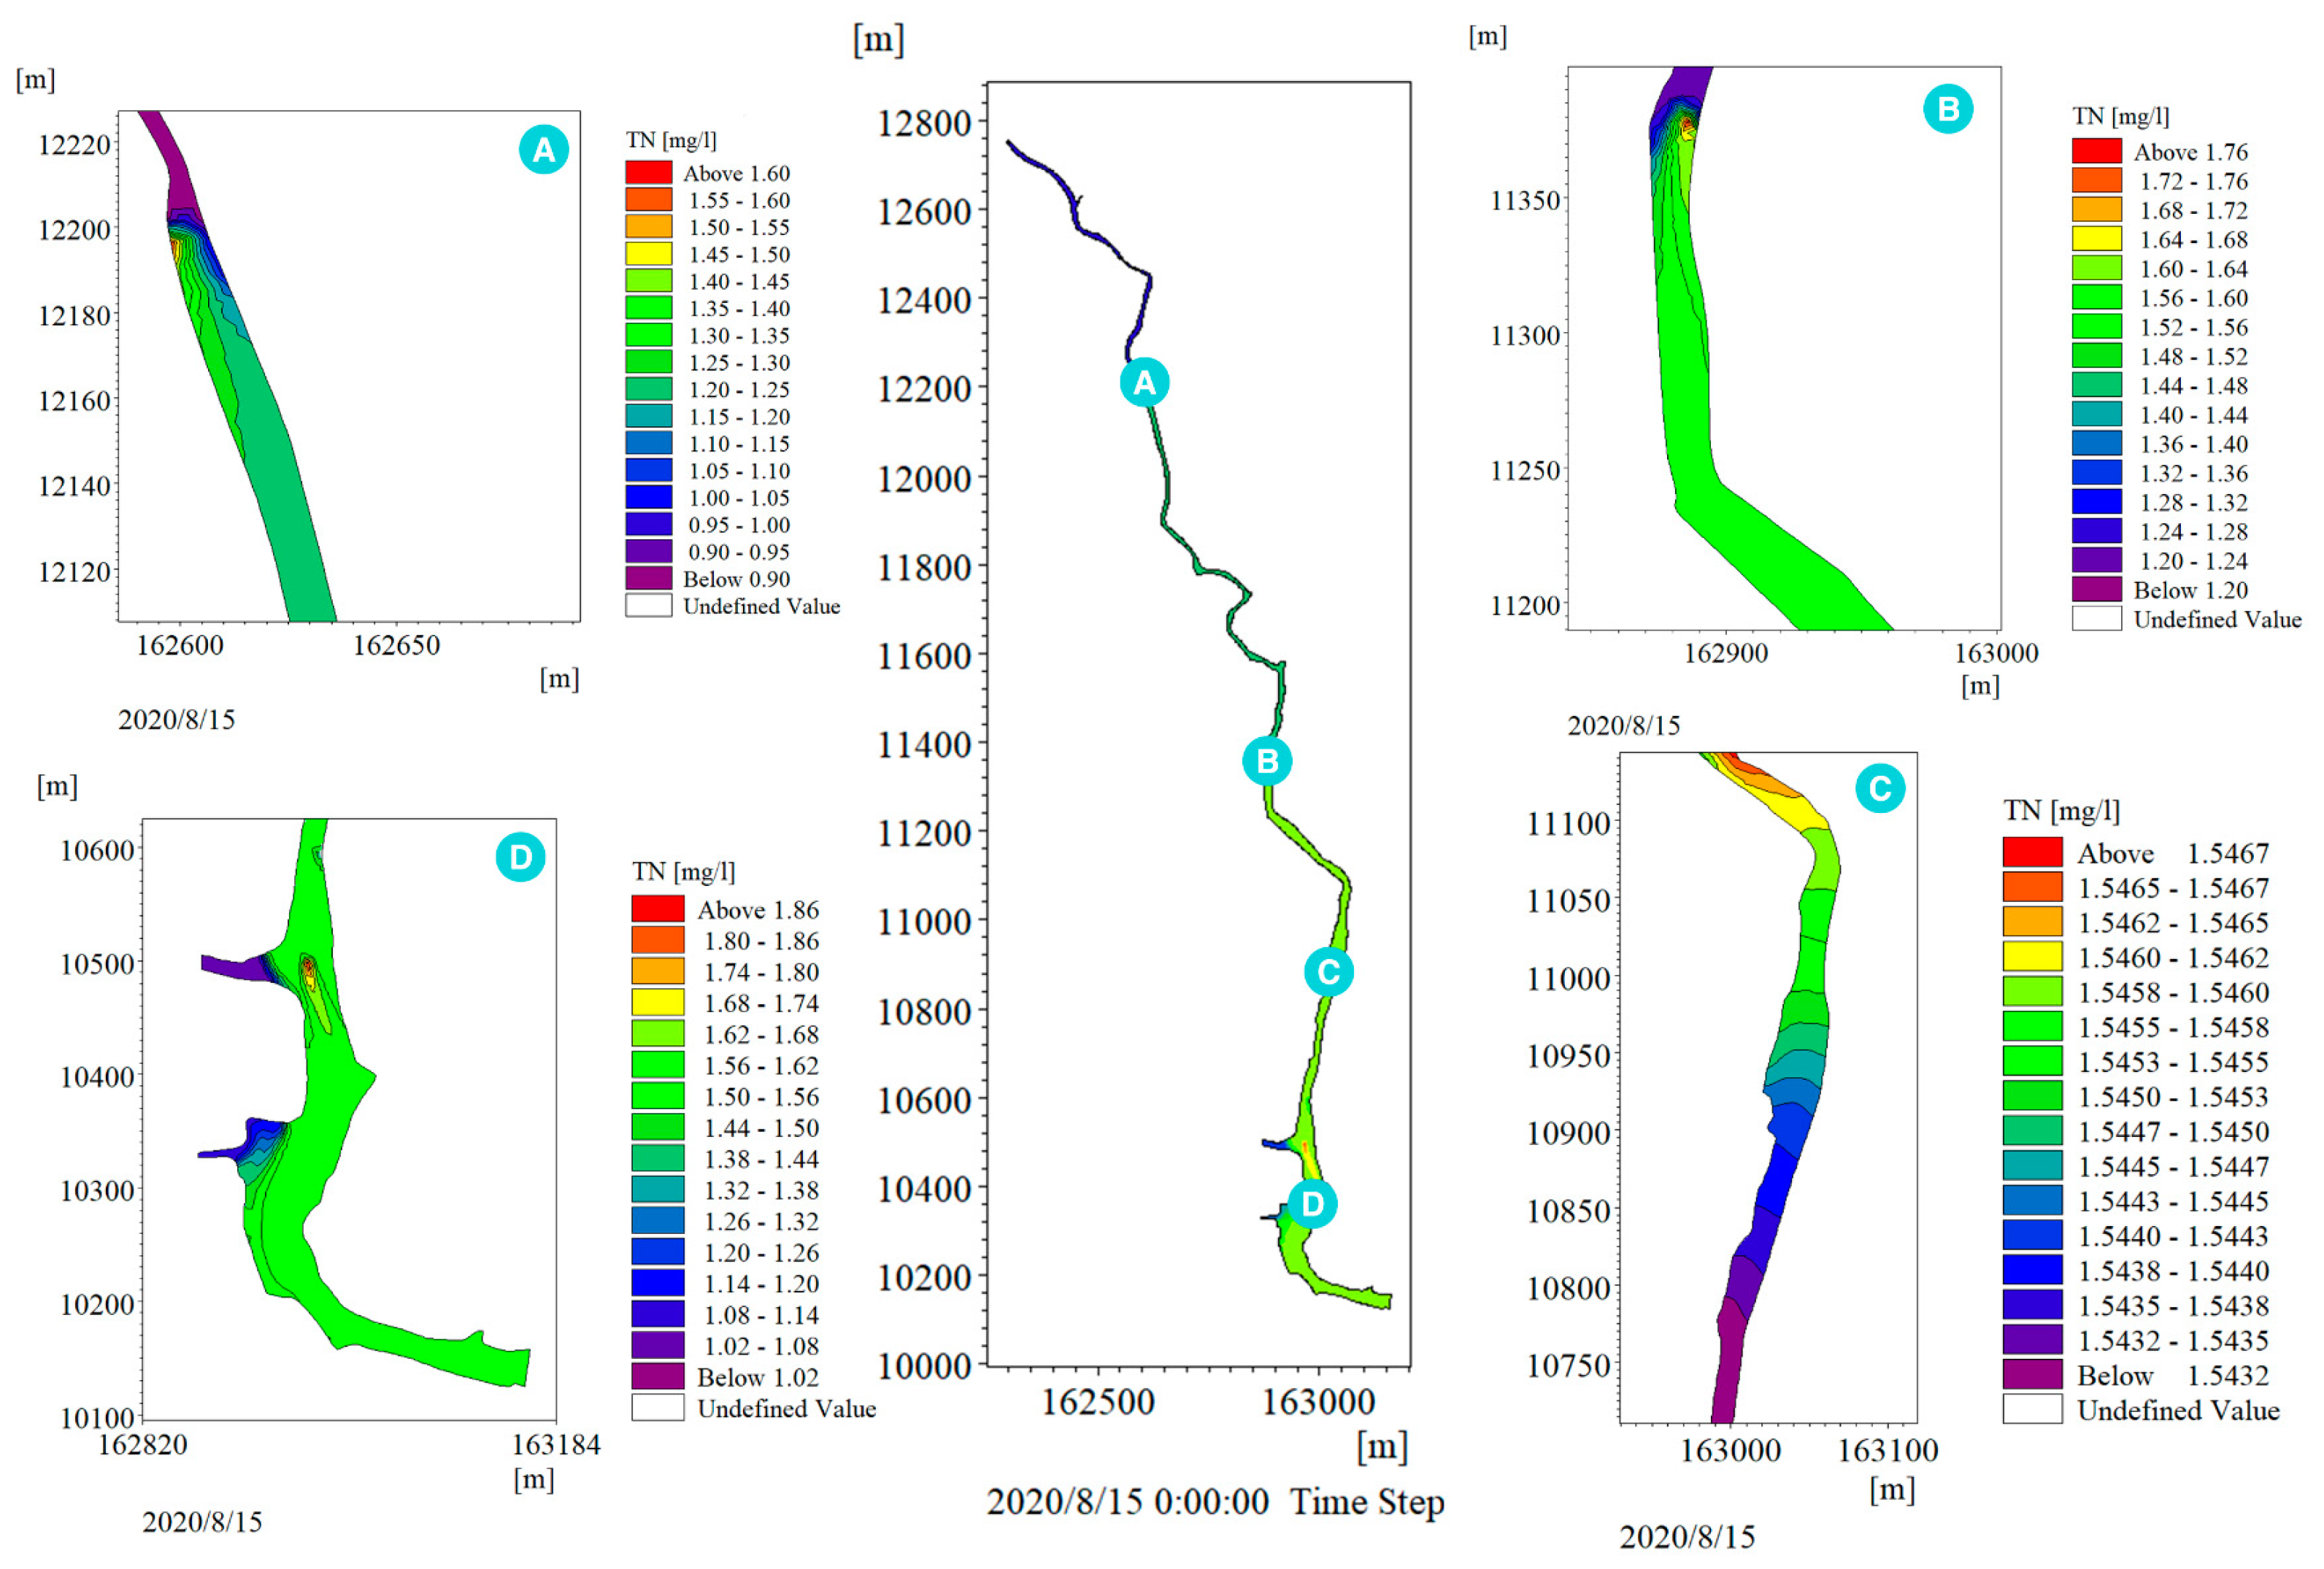
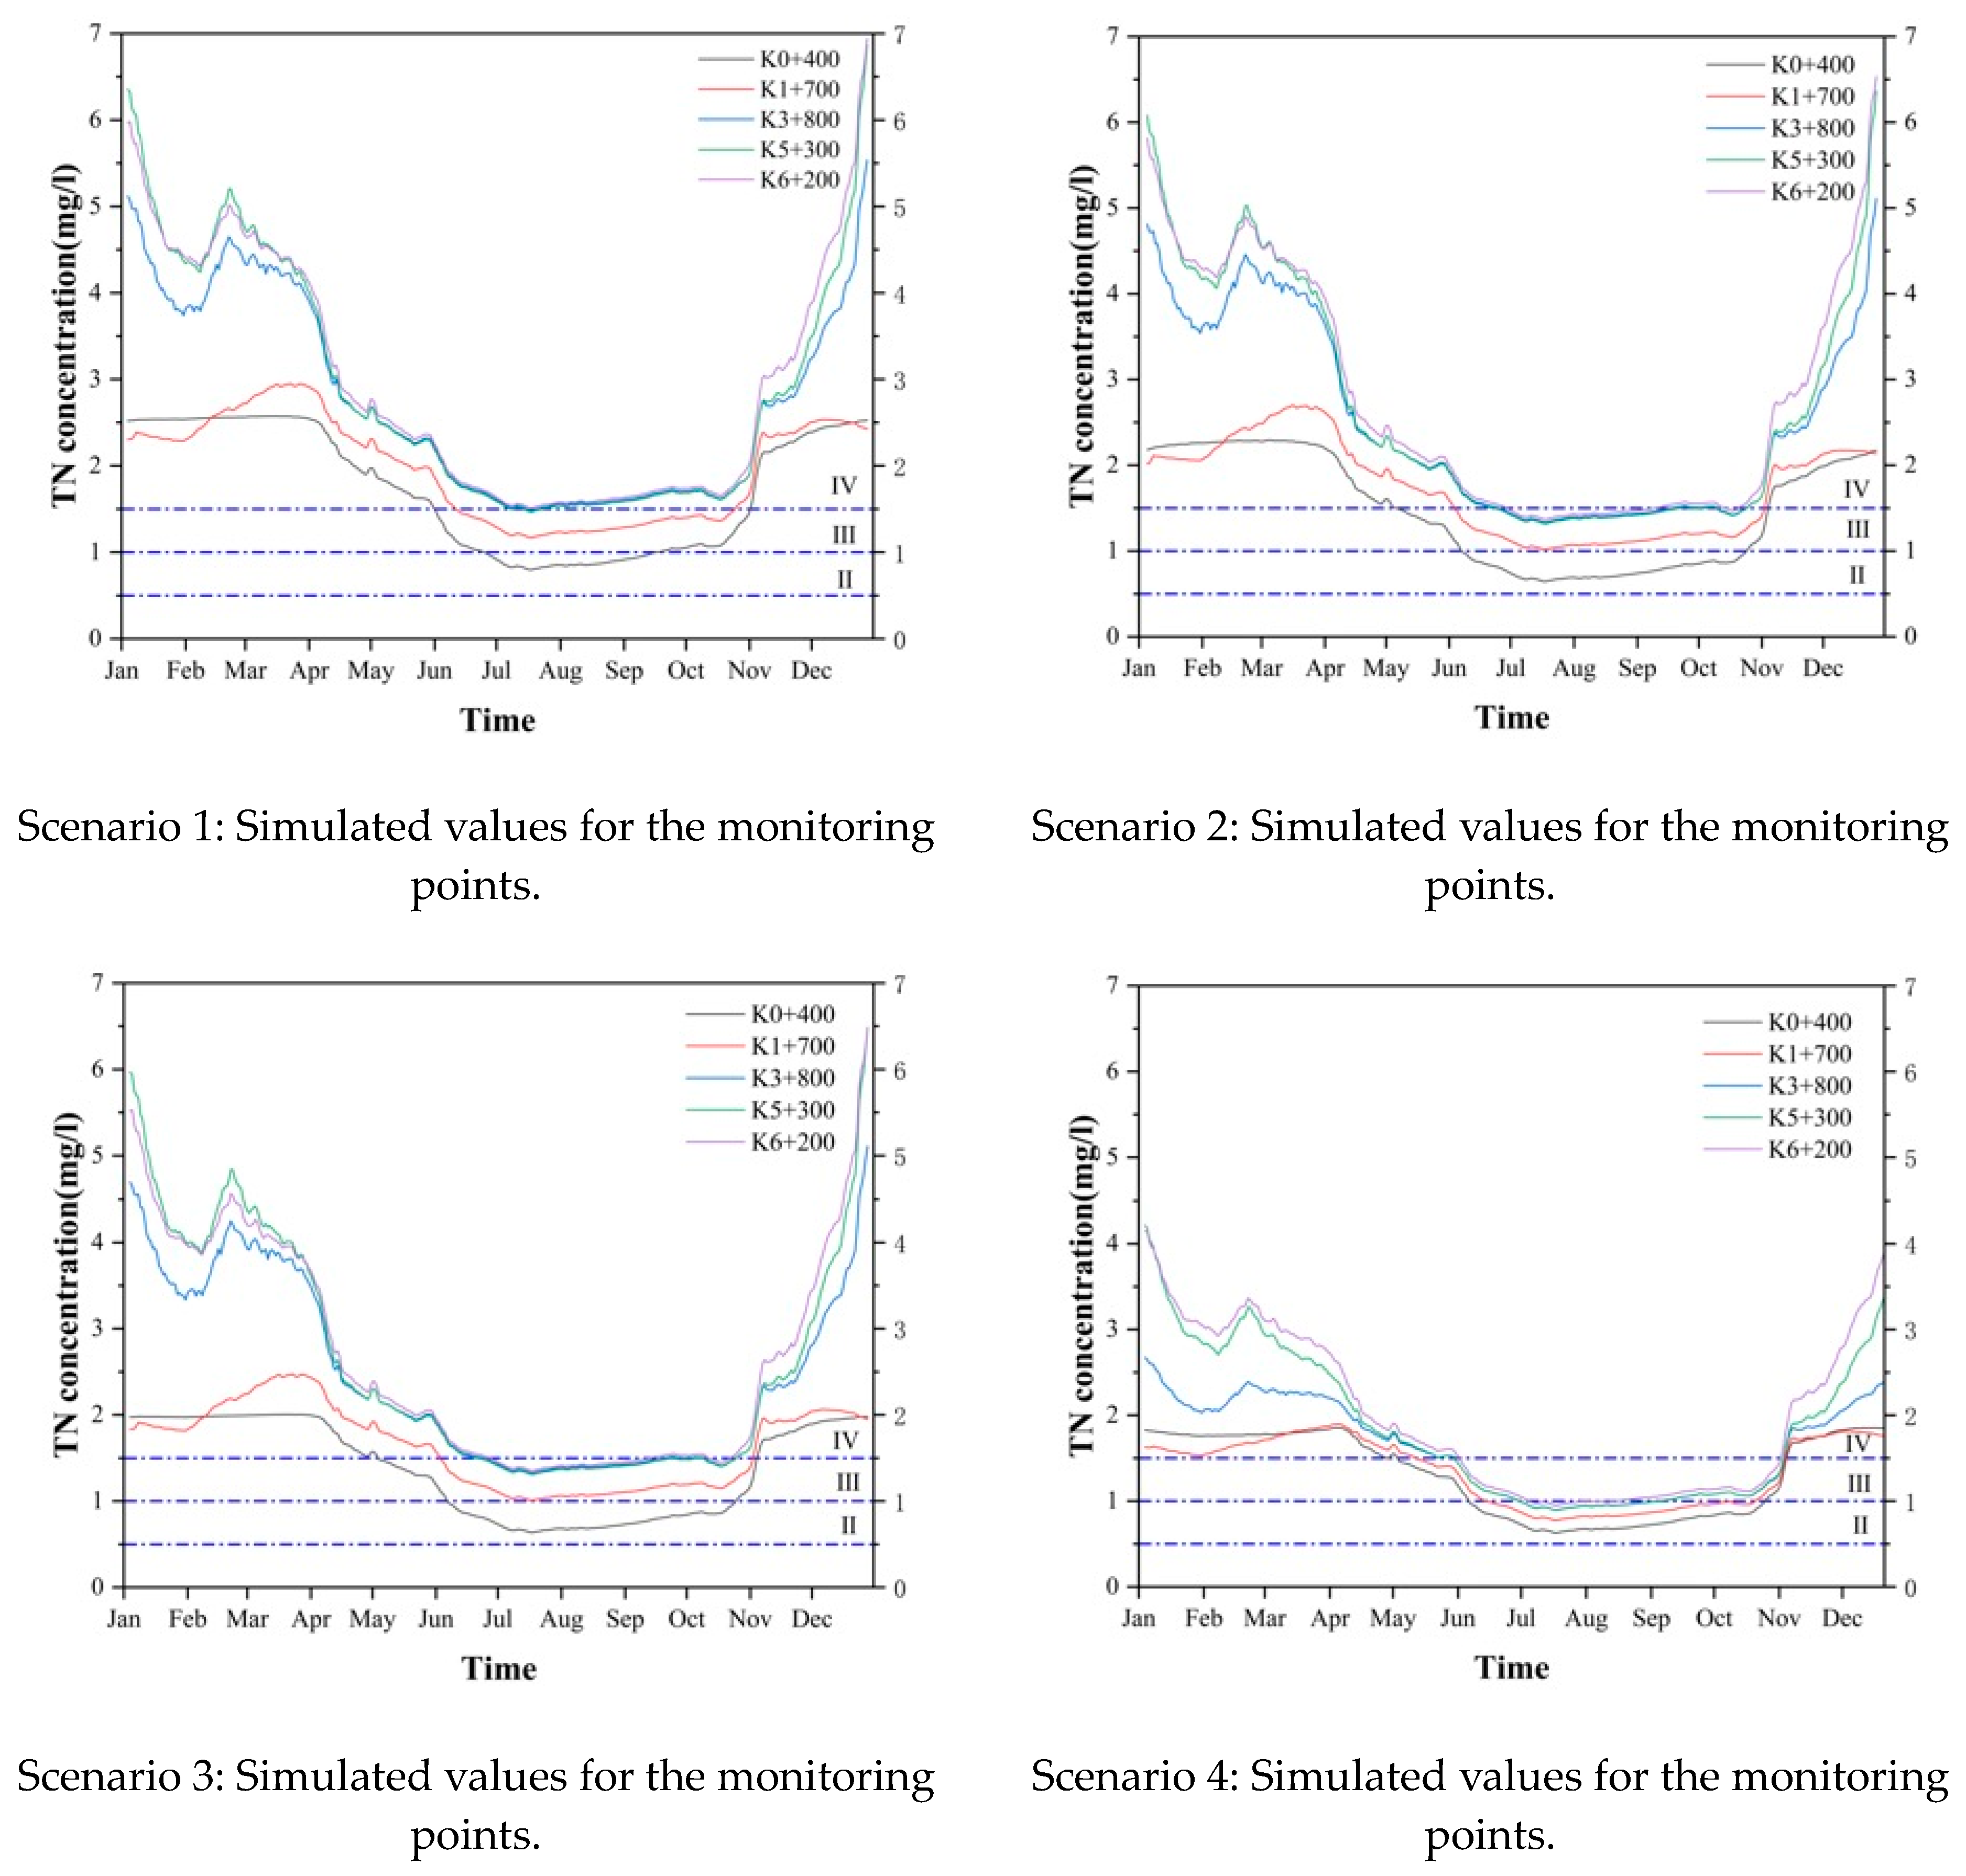
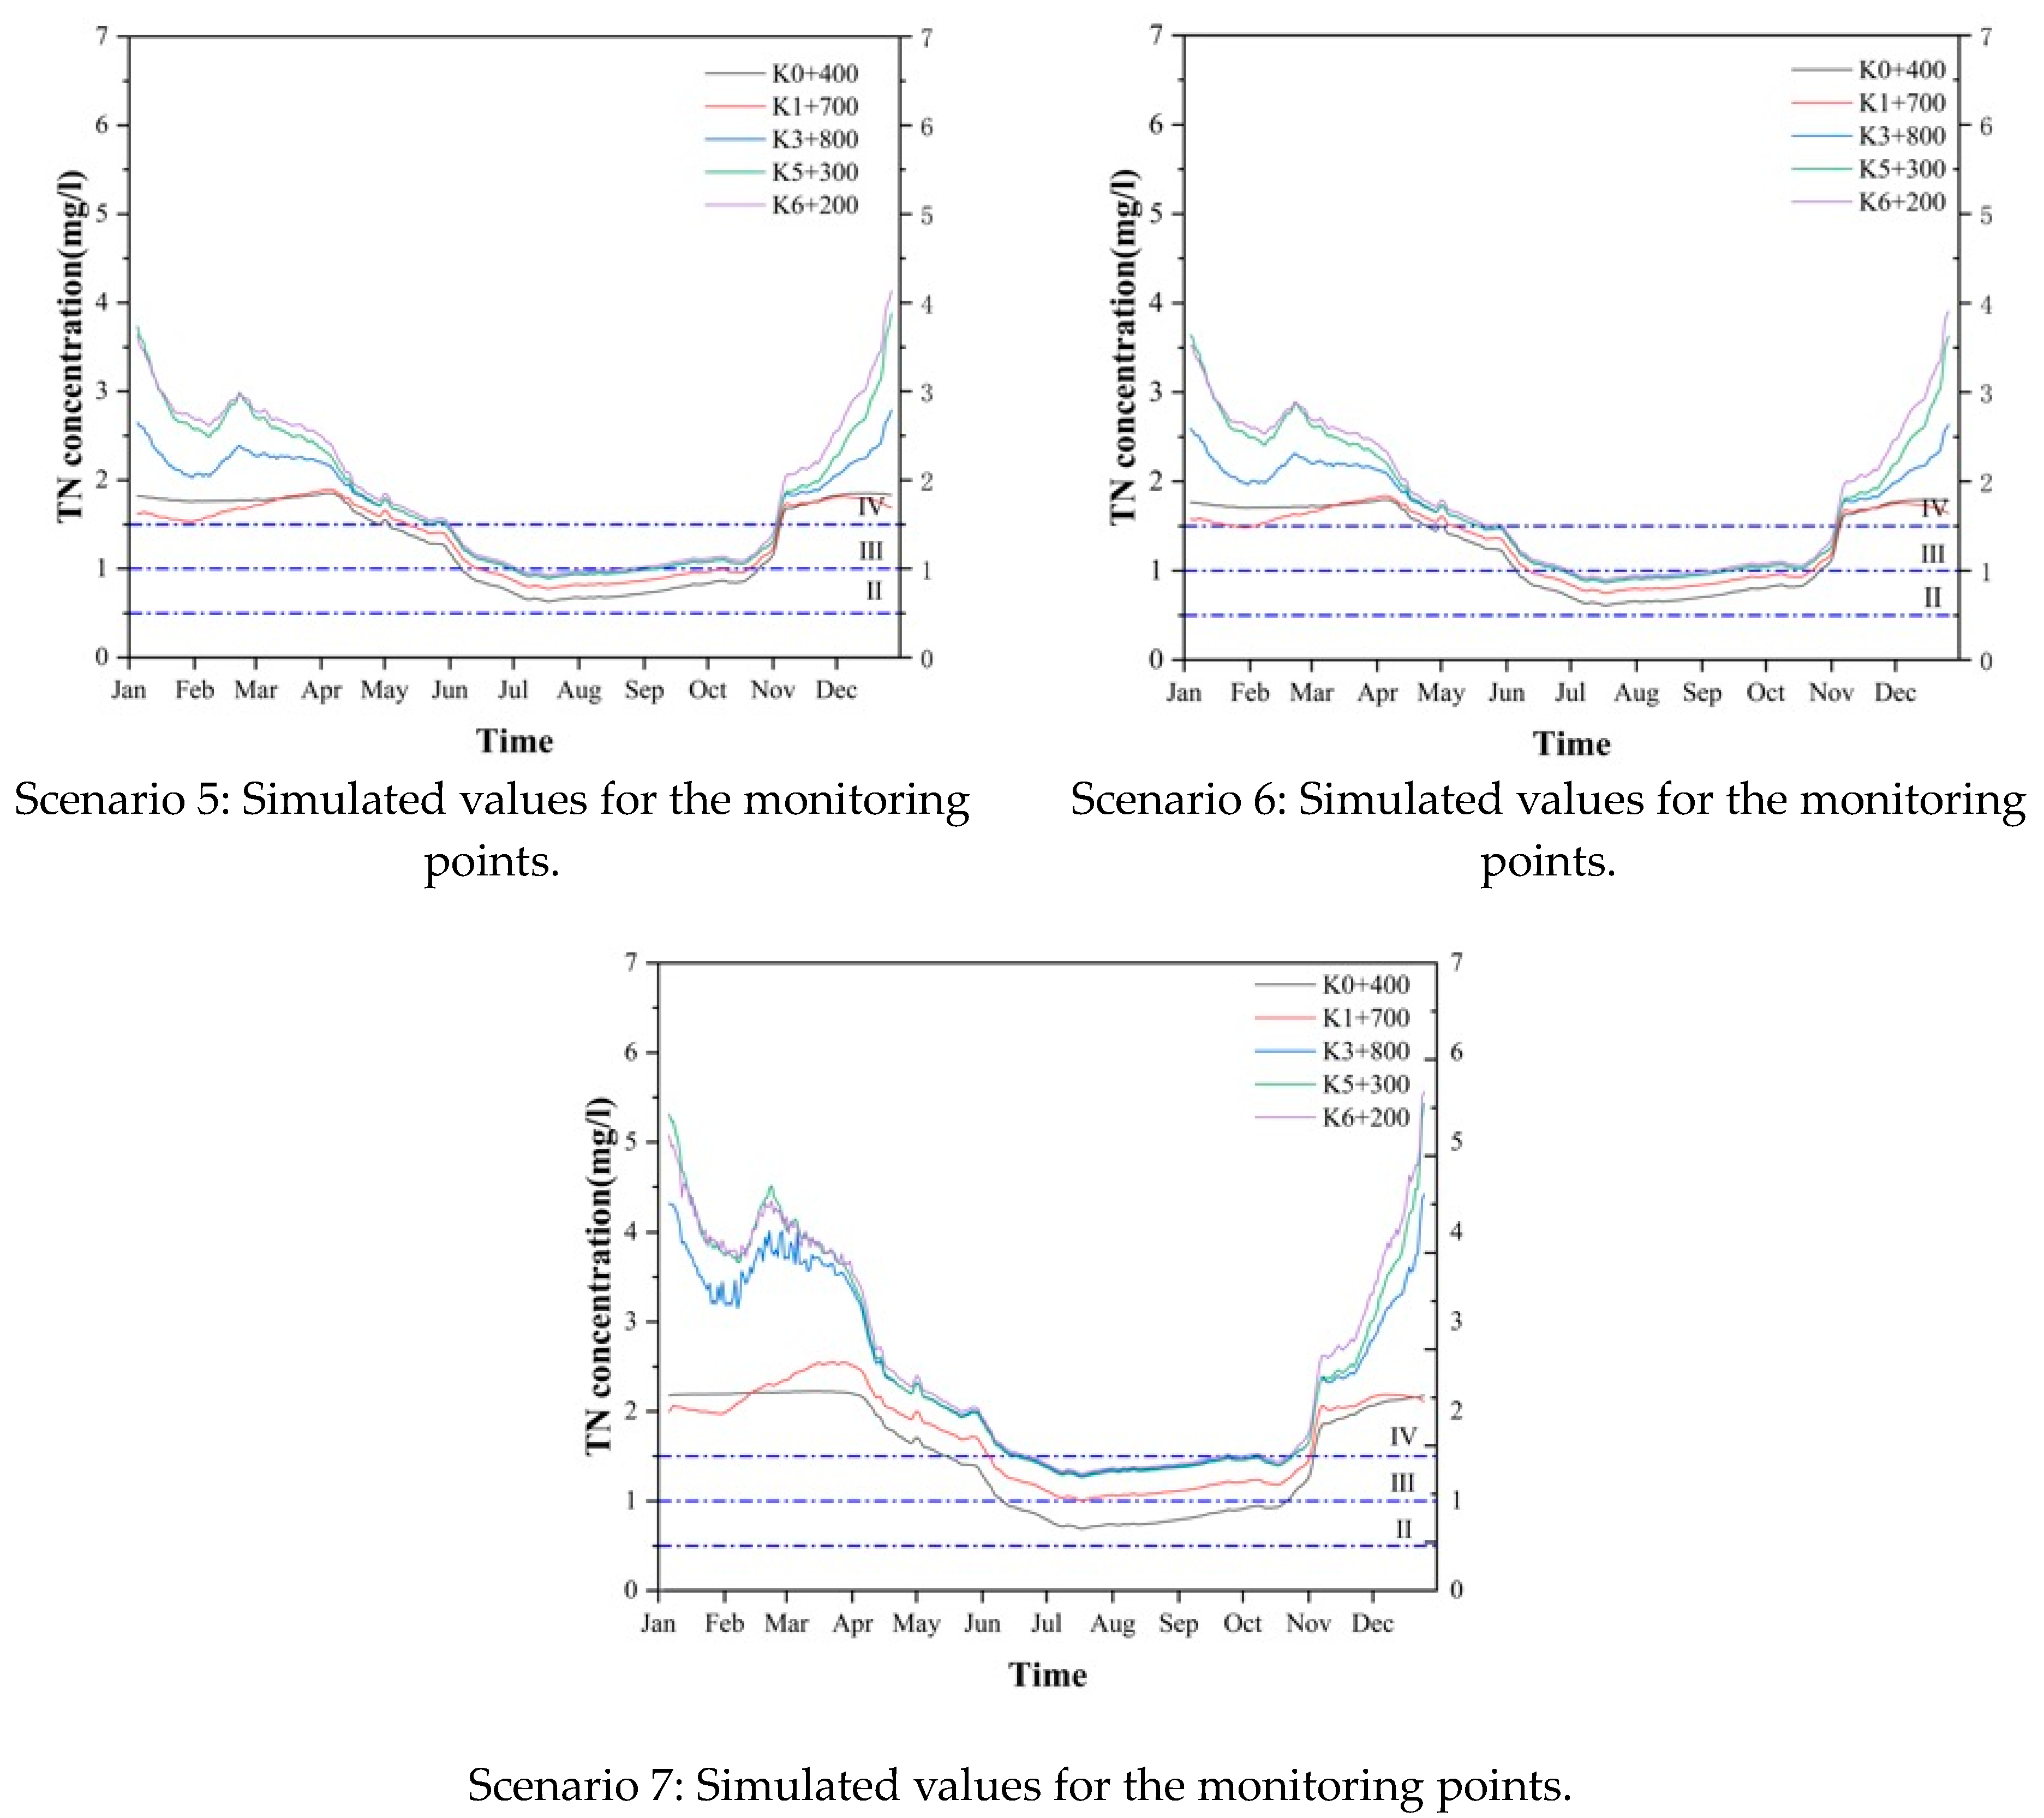
Taking the Xiyong River as an example, seven different scenario hypotheses on ecological engineering restoration were proposed in this paper, which were based on the MIKE21 hydrodynamic and water quality model. The distribution of the TN concentration in the Xiyong River was numerically simulated and the comprehensive compliance estimated. Finally, we propose a reasonable water ecosystem treatment measure and therefore present a technical reference and theoretical support for the design of the comprehensive treatment of Xiyong River’s water environment.

2. Materials and Methods

2.1. Study Area

Most of the rivers in Shenzhen belong to small- and medium-sized river basins [23]. The rivers run from north to south. The upstream is characterized by a mountainous river, the middle reach is characterized by a plain river network, and the downstream is characterized by a tidal river network. The river has the characteristics of rain-sourced rivers with an extremely uneven distribution of rainwater, in other words, the water rises and falls sharply in the flood season, and there is almost no water in the river in the drought season. The water quality in the upper reaches of the river is good, but the indicators of ammonia nitrogen and TN in the water quality in the middle and lower reaches of the river exceed the national surface water Case V standard, most of which are bad Case V water bodies.
The Xiyong River studied in this paper is typically a small river. The river is in the Nan’ao Office of Dapeng New District, Shenzhen, with a watershed area of 9.5 km2. It originates from the Sheyinkeng (place name) at the southernmost end of the Nan’ao Office of Dapeng New District, and flows into Dapeng Bay from north to south at Xiyong Bay, at the end of the river. The average annual precipitation in many years in the basin is 2127 mm, the annual distribution of precipitation is very uneven, and the precipitation from April to October accounts for 90% of the annual precipitation.
According to the geographical location of Xiyong River (Figure 1), we can see that the upstream of Xiyong River runs through Xiyangwei Village, the middle reach of the river passes through Nanshe Village, Xiyong Village, and Xigong Village, while the river connects with the tributary of Xigong Village at the downstream end, before finally flowing into Dapeng Bay through Xiyongkou after gathering. According to the water pollution condition of the river, and the current situation of the bank surface slope, this river can be divided into four sections. The first section is the section from the upstream to Xiyangwei Village, which is located at the upstream of the river. The original ecology is good and the bank slope is natural. There is no pollution in this section and the water quality conditions are good. The second section is the section from Xiyangwei Village to Nanshe Village, which passes through Xiyangwei Village. The village has sewage discharge, and the sewage outfalls are mainly concentrated in this area. The third section is from Nanshe Village to the tributary of Xigong Village. The river bank is basically based on the combination of the natural slope and the slope formed by the fish ponds. The river bank is relatively low and the water flow separation condition is poor, which results in the water in fish ponds and farmland entering the river. The fourth section is from the tributary of Xigong Village to the coastal outfall. The river bank is in a natural state with serious loss of water and soil. At the end of the river, there is a damp-proof gate that restricts the backward flow of seawater. The ecosystem of the whole river is relatively fragile, and the nitrogen content in the water body seriously exceeds the standard. The water environment control has attracted the great attention of the Water Department.

2.2. Model Equation

The MIKE21 software has the advantages of a high calculation accuracy and wide adaptability, and has powerful functions in the numerical simulation of two-dimensional free surface flow. Compared with other numerical models, the MIKE21 model has been refined and evolved based on many engineering experiences, and is widely used in the study of water flow field and water quality changes. The MIKE21 water environment model mainly includes hydrodynamic and water quality simulation processes, which can well-simulate and analyze the process of river ecological management.

2.2.1. Hydrodynamic Governing Equations

The maximum water depth of Xiyong River is less than 10 m, and there is no obvious stratification in the river. Therefore, using the MIKE21 two-dimensional hydrodynamic model is good enough to meet the requirements of computation. The governing equations of the 2D hydrodynamics in a Cartesian coordinate system are continuity equations and momentum equations of integral Navier–Stokes mean equations of incompressible fluid in three dimensions along the direction of water depth, which is mainly used to simulate the flow field, velocity, water level, and other water movement phenomena in the river.
The continuity equation is as follows:
h t + h u ¯ x + h v ¯ y = h S
The momentum equations are as follows:
h u ¯ t + h u ¯ 2 x + h u v ¯ y = f v ¯ h g h η x h ρ 0 p a x g h 2 2 ρ 0 ρ x + τ s x ρ 0 τ b x ρ 0 1 ρ 0 s x x x + s x y y + x h T x x + y h T x y + h u s S
h v ¯ t + h v ¯ 2 y + h u v ¯ x = f u ¯ h g h η y h ρ 0 p a y g h 2 2 ρ 0 ρ y + τ s y ρ 0 τ b y ρ 0 1 ρ 0 s y x x + s y y y + x h T x y + y h T y y + h v s S
where t is time; x and y are Cartesian coordinates; η denotes the water level; d is the still water depth; h = η + d is the total water depth; u and v are velocity components of x and y direction, respectively; f = 2ωsin ψ, which is the Coriolis force coefficient, where ω is the Earth rotational angular speed and ψ is the local latitude; g is the gravitational acceleration and ρ is the water density; s x x , s x y , and s y y are the radiation stress components, respectively; S is the source term, while u s and v s denote the flow velocity of the source term.

2.2.2. Water Quality Control Equations

The water quality module in the MIKE software was used to simulate the movement and transformation process of the water pollutants including mainly the convection diffusion module (AD module) and water ecology module (ECO Lab module). The AD module was used to simulate the convection, diffusion, and other transport processes of pollutants in water and its two-dimensional transport. The diffusion equation is as follows:
t h c + x u h c + y v h c + K d h c S = x h λ x c x + y h λ y c y
where c denotes the pollutant concentration; h is the water depth; u and v are the flow velocities in the x and y directions, respectively; K d is the linear attenuation coefficient; λ x and λ y denote the diffusion coefficients in the x and y directions; S denotes the source-ink term.
The ECO Lab module is a complicated water quality and ecology module with which the physical, chemical, biological, and ecological processes in the water environment can be described. Its hydrodynamic relationship can be expressed by a series of differential coupling equations, and its non-conservative formula is the following equation:
c t + u c x + v c y + w c z = D X 2 c x 2 + D y 2 c y 2 + D z 2 c z 2 + S c + P c
where Pc, the coupling pass-through formula between state variables, can be written as follows:
P c = d c d t i = 1 n process i
In the above two equations, c is the concentration of state variables; u, v and w denote the flow velocities in the x, y, and z directions, respectively; Dx, Dy, and Dz denote the diffusion coefficients; Sc is the source-ink term; Pc represents various reaction processes of substance concentration change in the water body; n indicates the number of processes in which state variables occur.

3. Model Building and Validation

3.1. Model Building

3.1.1. Model Concept

In order to understand the hydrodynamic relationship between the water body of the Xiyong River and the surrounding environment, a conceptual model of the river course was established, as shown in Figure 2. The model included the input and output items, simulating the flow and change process of the river water body. The input items included the upstream of the main stream, the north of Xiyong Village, Xiyong Village, and the tributaries of Xigong River as well as four sewage outlets. The village domestic sewage discharge points on both sides of the upstream of the river were simulated as two sewage outlets, and the sewage discharge simulation of fish ponds and farmland in the middle and downstream of the river was set as two sewage outlets. The output item was that the downstream of the main stream flows into Xiyong Beach. This conceptual model also included the effect of rainfall on the hydrodynamic state of the river.

3.1.2. Grid Processing

The boundary of the model used in calculation was determined by the UTM projection coordinate system algorithm in MIKE software, based on which we could see that the projection zone of Xiyong River is UTM49. Then, the Xiyong River was meshed with triangular meshes, and some narrow parts were refined. After more than 90 times of smoothing, the optimal meshed graph of the model was obtained (Figure 3). The mesh had 10,415 computing grids and 6421 computing nodes. The measured CAD geological exploration data were used to generate data boundaries and terrain data files, and the topographic difference graph was obtained. In order to better analyze the variation law of the concentration of each water quality index in the water quality simulation, the river basin was arranged with five interval monitoring points according to the actual distribution situation of villages, farmland, fish ponds, sewage outlets, and tributaries around the Xiyong River, which are marked as K0 + 400, K1 + 700, K3 + 800, K5 + 300, and K6 + 200, respectively. The distribution of monitoring points is shown in Figure 4.

3.1.3. Model Data and Boundary Conditions

The model data mainly included the river flow, water level, water quality, meteorological data, etc. The river flow and water level data were from the actual data of the Water Department under jurisdiction, and the meteorological data such as rainfall were from the Meteorological Department under jurisdiction. Based on the field sampling at the river monitoring points, the TN concentration distribution data in the water quality at the monitoring points were obtained by using experimental analysis with the method of alkaline potassium persulfate digestion ultraviolet spectrophotometry. All data were from the 2020 statistics. According to the river conceptual model, the flow and water quality input and output boundaries are shown in Figure 5.

3.1.4. Parameter Setting

According to the model concept and river hydraulic conditions, the model parameters were finally determined through repeated trial calculation and calibration. The model parameters were set as follows: the dry water depth of the model was hdry = 0.005 m, the submerged water depth was hflood = 0.05 m, and the wet water depth was hwet = 0.1 m. The constant eddy viscosity was set to 0.8, and the bed bottom friction coefficient was taken as the Manning coefficient of 32 m 1 / 3 / s . Among the water quality parameters, the diffusion coefficient was 2 m/s, and the degradation coefficient was 1.84 × 10⁻⁶/s. The simulation step was set to 86,400 s, that is, one day. The simulation period was from 1 January 2020 to 31 December 2020.

3.2. Model Validation

3.2.1. Hydrodynamic Model Validation

After the construction of the hydrodynamic model, in order to improve the applicability and accuracy of the hydrodynamic model, it was necessary to modify and verify the model parameters over many times. We selected the water level at the K6 + 200 monitoring point for verification. Comparing the measured water level with the simulated water level, it can be seen from Figure 6 that the simulated water level and the measured water level had little difference, the change trend was basically similar, and the average relative error was only 2.9%, indicating that the simulated value was basically consistent with the measured value, and the hydrodynamic model was verified.

3.2.2. Water Quality Model Validation

In the evaluation method of water quality model validation, the percentage bias coefficient is often used to describe the degree of deviation between the measured value and the simulated value. In Equation (7), PBIAS is the percentage deviation coefficient, M is the measured value, C is the simulated value, and n is the number of measured values. For water pollutants, PBIAS ≤ 25% indicates excellent results, 25% < PBIAS ≤ 40% indicates good results, 40% < PBIAS ≤ 70% indicates average results, and being more than 70% indicates inconformity with the actual situation.
P B I A S = i = 1 n ( M C ) i = 1 n M × 100
The comparison between the measured value and the simulated value of TN in the river course was carried out as shown in Figure 7. The difference between the measured value and the simulated value was small, and the change trend in the nitrogen concentration with the location of the monitoring point was basically consistent. According to Equation (7), the percentage bias coefficient PBIAS was 17.8%, indicating that the overall simulation results were excellent. The average value of laboratory tests for the K6 + 200 monitoring point was 2.65 mg/L, and the average value of multiple simulations was 2.48 mg/L. The simulated value was slightly lower than the measured value, and the relative error was only 6.8%. Thus, the water quality model was further verified.
According to the year 2020 water quality monitoring report and the Revision of Shenzhen Sewage System Layout Plan (2011–2020), the annual average concentration of TN in the main stream is 1.78 mg/L, the annual average concentration of TN in the north tributary of Xiyong Village is 1.87 mg/L, and the annual average concentration of TN in the tributary of Xiyong Village is 2.34 mg/L. The annual average concentration of TN in the tributary of Xigong River is 2.17 mg/L, the annual average emission concentration of TN in the two sewage outlets is 16.96 mg/L and 22.79 mg/L, respectively, and the annual average emission concentration of TN in the two sewage outlets of the fishing ponds is 6.74 mg/L and 12.87 mg/L, respectively. We obtained from the Shenzhen Meteorological Bureau the monthly precipitation of Shenzhen in 2020. In seven months of 2020, specifically, in January, March, May, August, October, November, and December, we conducted water quality sampling and TN concentration laboratory testing at five monitoring points located along the river, respectively, and the test results were obtained. The above river information is shown in Figure 8.

4. Results and Discussion

4.1. Scenario Setting

There were seven different schemes in this scenario hypotheses. Scenario 1 is the simulation of the initial state of the river, which is mainly used to investigate the distribution of TN concentration in the natural state of the river. Under natural conditions, the upstream and tributaries of the main stream as well as the sewage outlets and the surrounding fish ponds and farmland contribute the main sources of TN in the Xiyong River. The initial state of the simulation is to input the annual average emission concentration of TN into the open boundary of the model, and the simulation results are used as the basis for evaluating the simulation effect of subsequent treatment measures. Scenario 2 is the simulation of the improved water quality in the upstream of the river, which is mainly used to investigate the change in the TN concentration of the whole river if the TN concentration in the upstream water decreases by 60%. Scenario 3 is the simulation of the pollution control status of the tributary, which is mainly devoted to investigating the change in the TN concentration of the whole river after the TN concentration of the tributary decreases by 20%. Scenario 4 is the simulation of the pollution control status at sewage outlets, which is designed to mainly investigate the distribution of the TN concentration of the whole river after the TN concentration at the two sewage outlets decreases by 60%. Scenario 5 is the simulation of the pollution control status of fish ponds and farmland, which is mainly contributed to investigate the distribution of the TN concentration of the whole river after the treatment of fish ponds and farmland, which are located within 800 m along both banks of the river. Scenario 6 is the simulation of the river water environment restoration, which is used mainly to investigate the distribution of the TN concentration of the whole river after taking measures such as river bank slope ecological treatment and planting aquatic plants. Scenario 7 mainly examines the impact of precipitation. The specific measures and corresponding boundary conditions of different scenarios are listed in Table 1.

4.2. Discussion

4.2.1. Water Quality Simulation Results

Figure 9 is the simulation results and local enlargement for August under Scenario 1. From the perspective of spatial distribution, and taking the simulation results in August as an example, the TN concentration values of five monitoring points at K0 + 400, K1 + 700, K3 + 800, K5 + 300, and K6 + 200, which are arranged from upstream to downstream, are listed in Table 2. The TN concentration distribution in the upstream of the river was relatively low, indicating that the ecological conditions in the upstream are relatively good. The TN concentration in the middle of the river was significantly increased, mainly because this part is located at the village gathering point, where sewage outlets are located and domestic sewage is discharged into the river without treatment. The TN concentration in the lower reaches of the river reached the highest for the following two reasons. On one hand, the purification capacity of the river itself is weak, and TN concentration from the upper and middle reaches diffuses to the lower reaches. On the other hand, fish ponds and farmland are distributed on both banks of the lower reaches of the river, which means that sewage, fertilizers, etc. are discharged into the river. In addition, the loss of local water and soil results in a rapid increase in the concentration of TN in the lower reaches and a serious deterioration in the water quality. From the perspective of time distribution, taking the simulation results of the downstream monitoring point K6 + 200 as an example, the simulated values of TN concentration in the 12 months of 2020 at this monitoring point are listed in Table 3. The concentration of TN in the river was large in the dry seasons of spring (February to April) and winter (November to January of the next year), while in the wet seasons of summer (May to July) and autumn (August to October), the concentration of TN in the river was low, which indicates that the river inflow has a great impact on the concentration distribution of TN in the river.
According to the simulation results, the maximum TN concentration in Xiyong River occurred at the downstream coordinate (162,963.60, 10,496.90) point in the dry season (December), and the minimum TN concentration occurred at the upstream coordinate (162,436.61, 12,634.70) point in the wet season (August). The simulation results are in accordance with the actual distribution of the TN concentration in the river.

4.2.2. Scenario Results

The simulation results of TN concentration at five monitoring points under different scenarios are shown in Figure 10. Taking the simulation results of Scenario 6 as an example, from the perspective of spatial distribution, the concentration of TN at the five monitoring points of K0 + 400, K1 + 700, K3 + 800, K5 + 300, and K6 + 200 gradually increased, and the concentration of TN at the downstream reached the maximum, but the increase in the TN concentration slowed significantly after the comprehensive treatment of pollutants. From the perspective of time distribution, the concentration of TN was relatively low from July to October, while it reached the maximum in January and December. After comprehensive treatment of the river channel, the concentration of TN in the river was still large in the dry season in winter and spring, and small in the wet season in summer and autumn, but the difference between the concentration of TN in the dry season and the wet season had been significantly reduced.
In order to analyze the simulation effect under different scenarios, the simulation results of the TN concentration at monitoring point K6 + 200 in August are listed in Table 4. It can be seen that with the increase in the emission reduction measures, the TN concentration at the monitoring point gradually decreased from the maximum value of 1.59 mg/L in the initial state to the minimum value of 0.958 mg/L, with a decrease of 40%, indicating that the emission reduction measures taken have been effective. Compared with the initial natural state, the TN concentration could be reduced by 13% under rainfall conditions. It is particularly noteworthy that the Scenario 4 emission reduction measures could reduce the TN concentration by up to 25%, the Scenario 5 emission reduction measures could reduce the TN concentration by 38%, and the Scenario 6 emission reduction measures could reduce the TN concentration by 40%, which indicates that the comprehensive treatment measures of water environment and ecology had the most obvious effect on reducing TN pollution, followed by fish pond and farmland pollution control measures.

4.2.3. Prediction of Time Needed to Meet the Case II Water Quality Requirements under Different Scenario Hypotheses

The treatment effect evaluation needs to compare the TN concentration after treatment with different water quality standards. The standard content of the TN concentration in different grades of surface water in China is shown in Table 5, and the prediction of time of the TN concentration reaching the standard under different scenarios is shown in Table 6. According to the prediction results under different scenarios, it is easy to see that all of the treatment measures had a promoting effect on the improvement in the water quality of Xiyong River. It will take 3 to 14 years for the TN concentration of the river to reach Case III water (1.0 mg/L), while it will take 4 to 18 years to reach Case II water (0.5 mg/L). Here, the standards of Case III water and Case II water are defined in the Environmental Quality Standard for Surface Water. The treatment measures proposed in Scenario 6 can be taken to reach the standard of the TN concentration of the river in a relatively short time.
According to the prediction results under Scenario 6, after comprehensive water environment control measures are taken for Xiyong River, the simulated value of the annual average TN concentration in the river course was 1.974 mg/L, and the reduction in the annual average value was 0.496 mg/L. According to the TN concentration of different water quality grades in Table 5, it was predicted that the treatment measures scheme proposed in Scenario 6 could make the river reach the Case III water quality standard in 3 years and the Case II water quality standard in 4 years. Similarly, the treatment scheme in Scenario 2 could make the TN concentration of the river reach the Case III water quality standard in 14 years and the Case II water quality standard in 18 years. The treatment scheme in Scenario 3 could make the TN concentration of the river reach the Case III water quality standard in 12 years and the Case II water quality standard in 16 years. The treatment scheme proposed in Scenario 4 could make the TN concentration of the river reach the Case III water quality standard in 7 years and the Case II water quality standard in 9 years. Finally, the treatment scheme under Scenario 5 could make the TN of the river reach the water quality standard of Case III in 4 years and the Case II water quality standard in 6 years.
According to the simulation results in Table 6, it can be seen that if we only considered sewage interception and purification measures to the main stream and tributaries, the effect was not obvious, although it did improve the water quality to a certain extent. Aside from these sewage interception and purification measures, if a systematic sewage treatment system is established to reduce the TN emissions from the sewage outlets along the Xiyong River, then the reduction rate of the TN concentration in the river course can be significantly accelerated, reaching the Case III water quality in 7 years, and reaching the Case II water quality in 9 years. Moreover, if we continue to strengthen the water environment control of the river basin, clear the fish ponds along the downstream, renovate the farmland ditches, and reduce the loss of water and soil along the river, then it will only take 4 years for the TN concentration of the river to reach the Case III water quality, and only 6 years to reach the Case II water quality. Finally, if we continue to carry out comprehensive treatment of the Xiyong River such as river regulation, ecological slope protection, and aquatic plant cultivation, then the TN concentration of the river can be reduced by 0.496 mg/L in one year, with a reduction of 20%. This will meet the Case III water quality requirements in 3 years and the Case II water quality requirements in 4 years. It can be seen that the treatment measures proposed in Scenario 6 are the most ideal and feasible treatment measure to reduce the TN concentration in the Xiyong River.
Generally speaking, for small- and medium-sized river basins with steep terrain, narrow riverbeds, and a relatively closed water body, the self-purification ability of the river is poor, and the TN concentration of the river is mainly affected by external sources, so embracing engineering and ecological measures to control the external sources to a certain extent can effectively improve the water quality of the river.

5. Conclusions

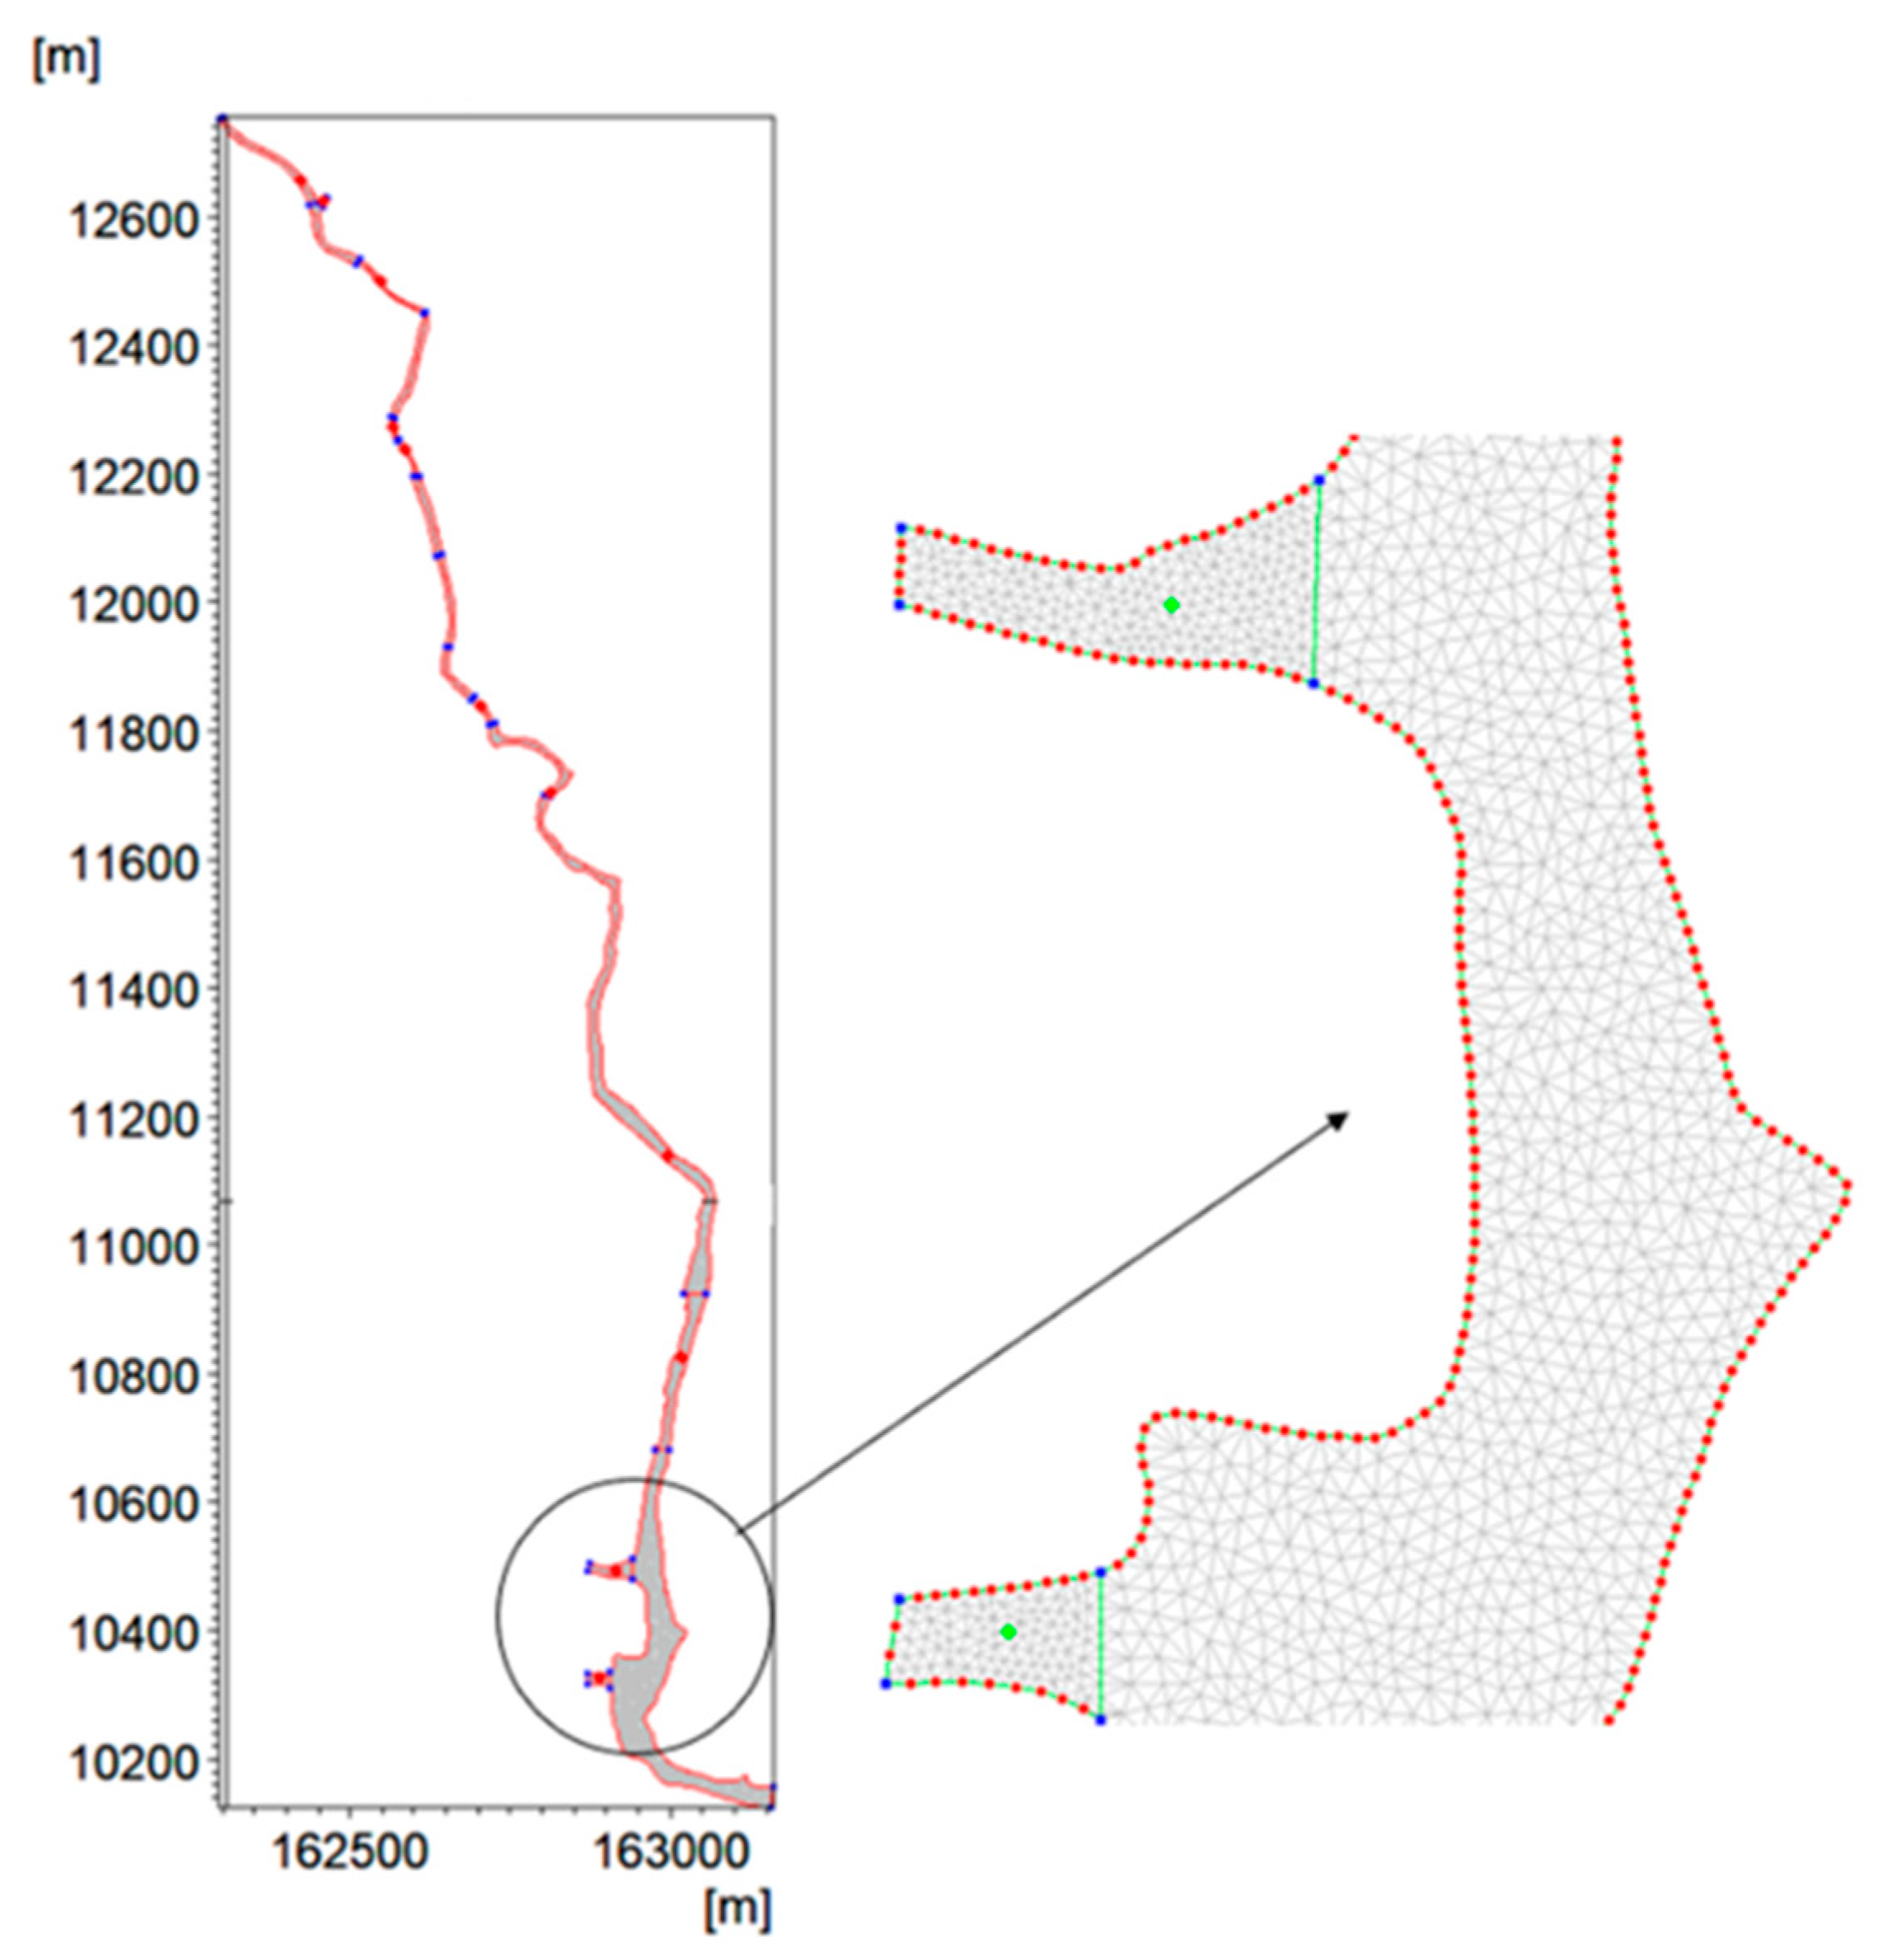
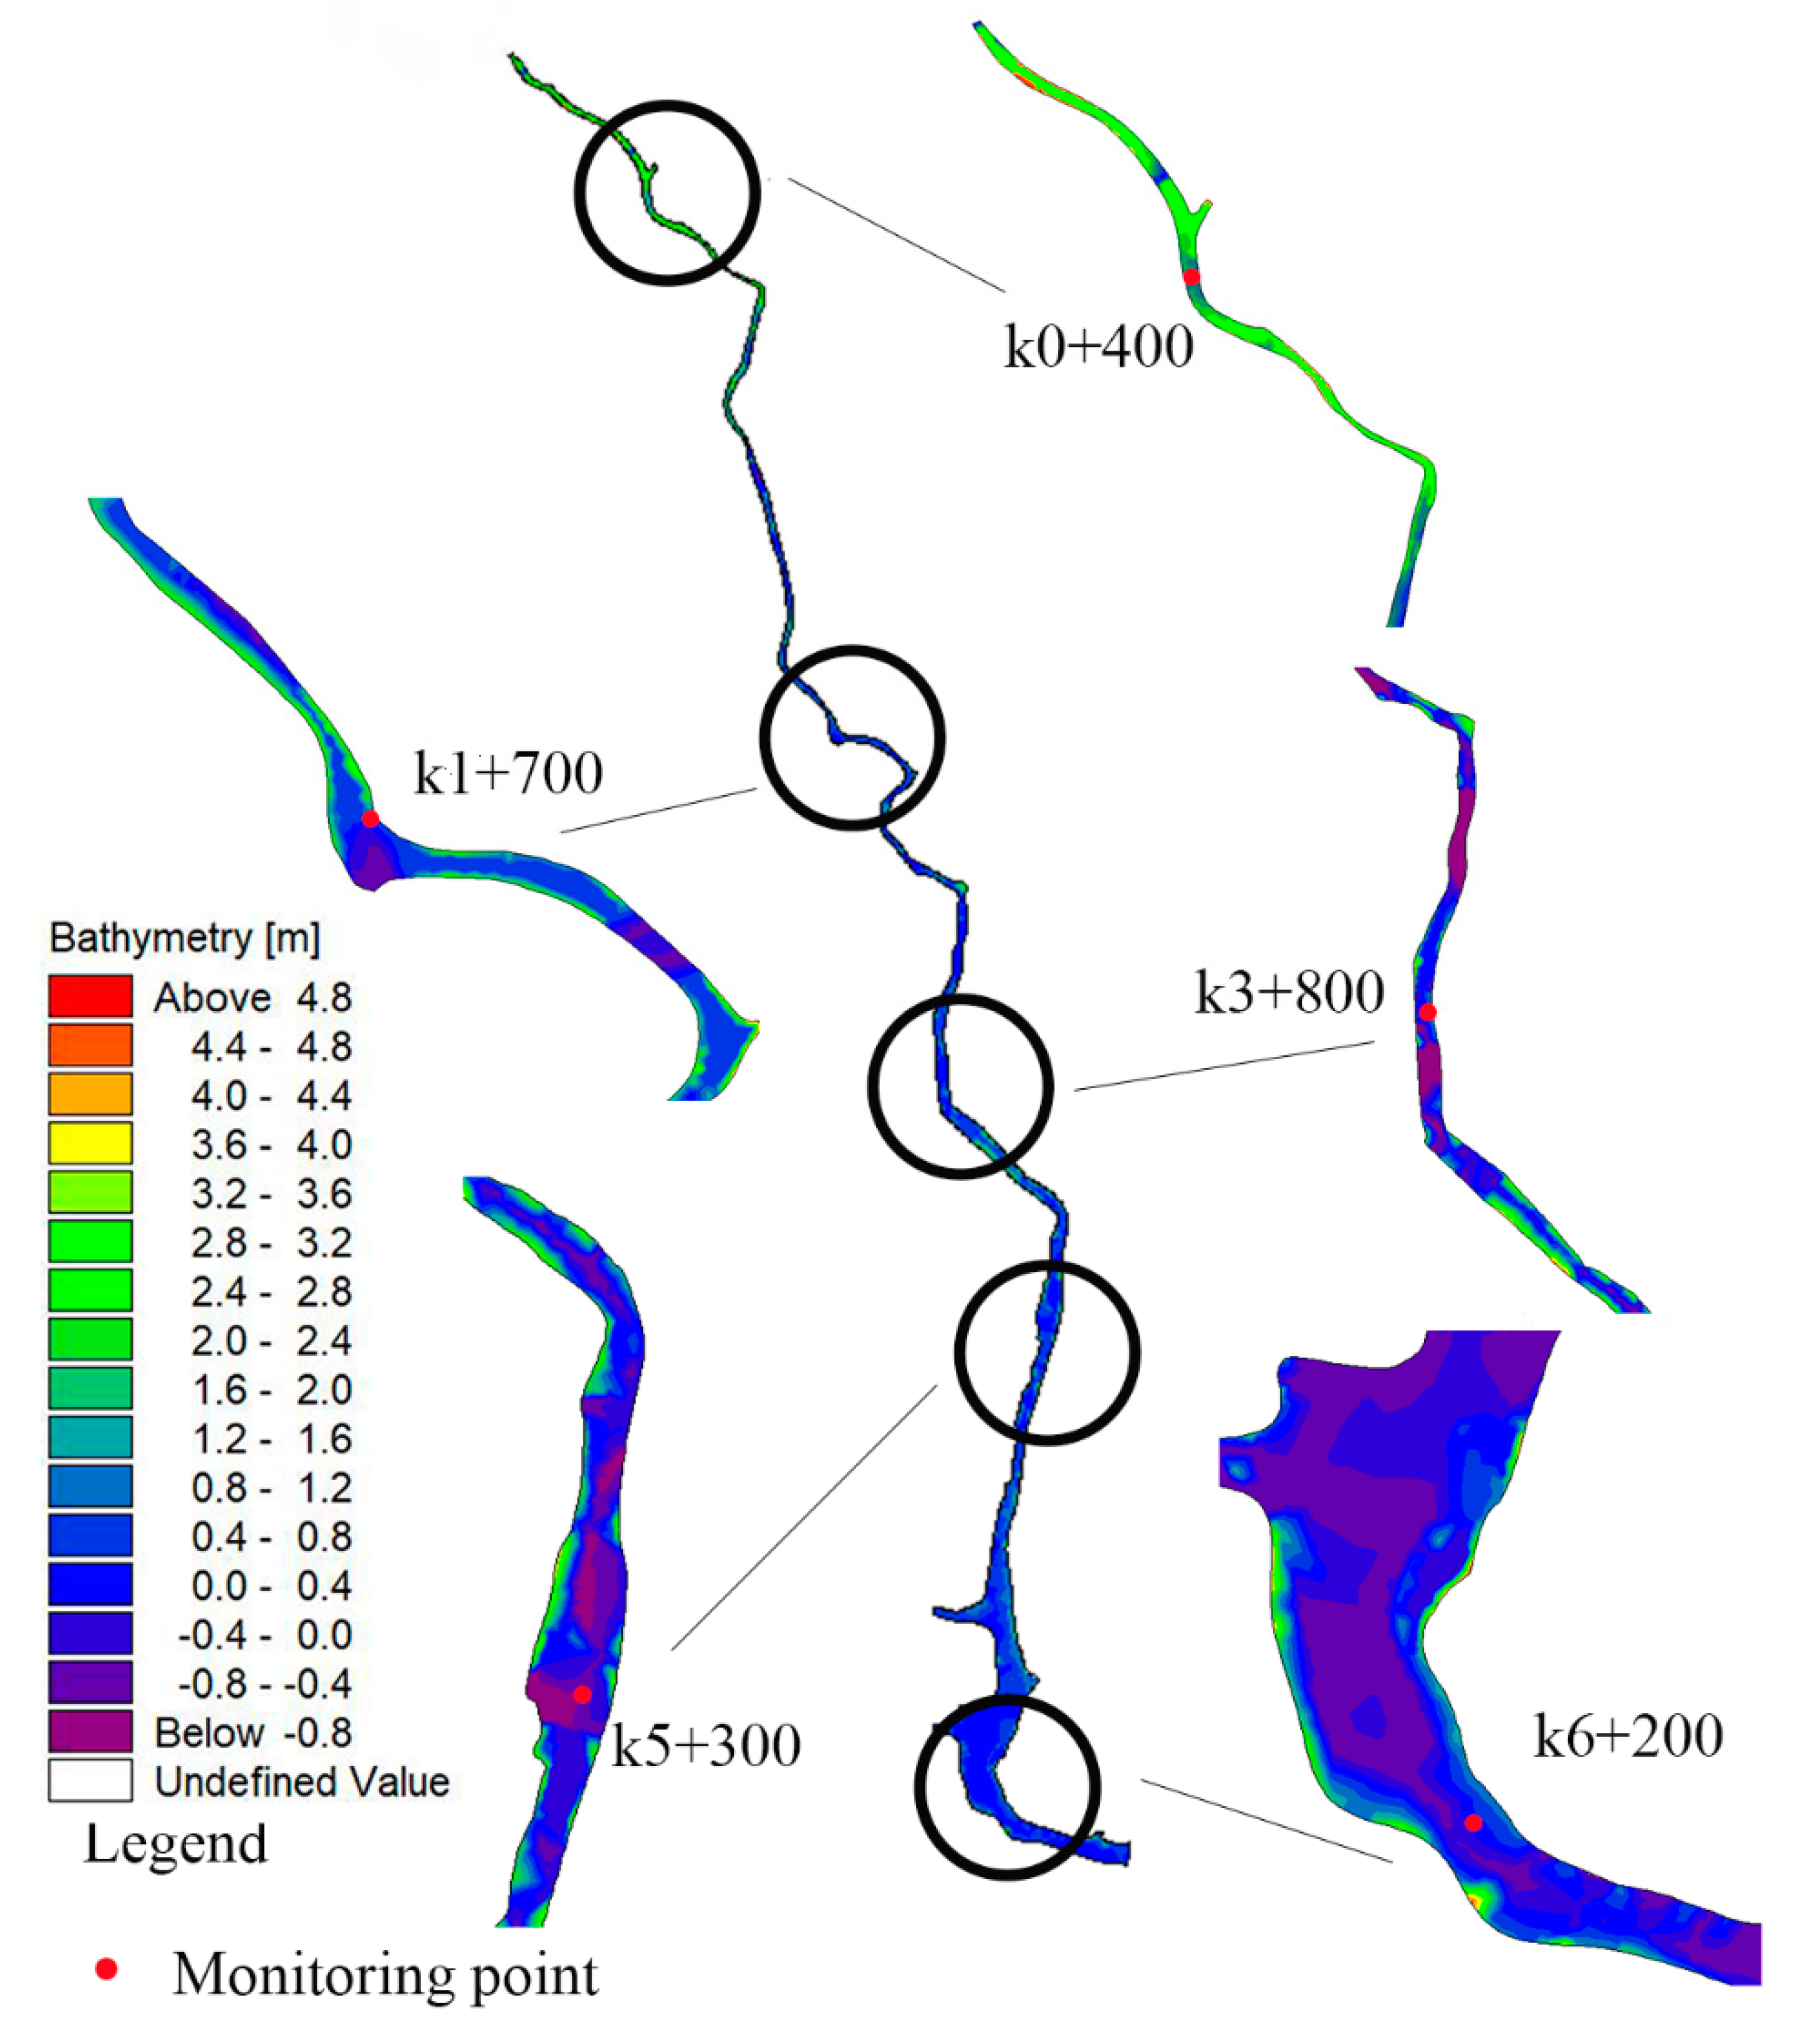
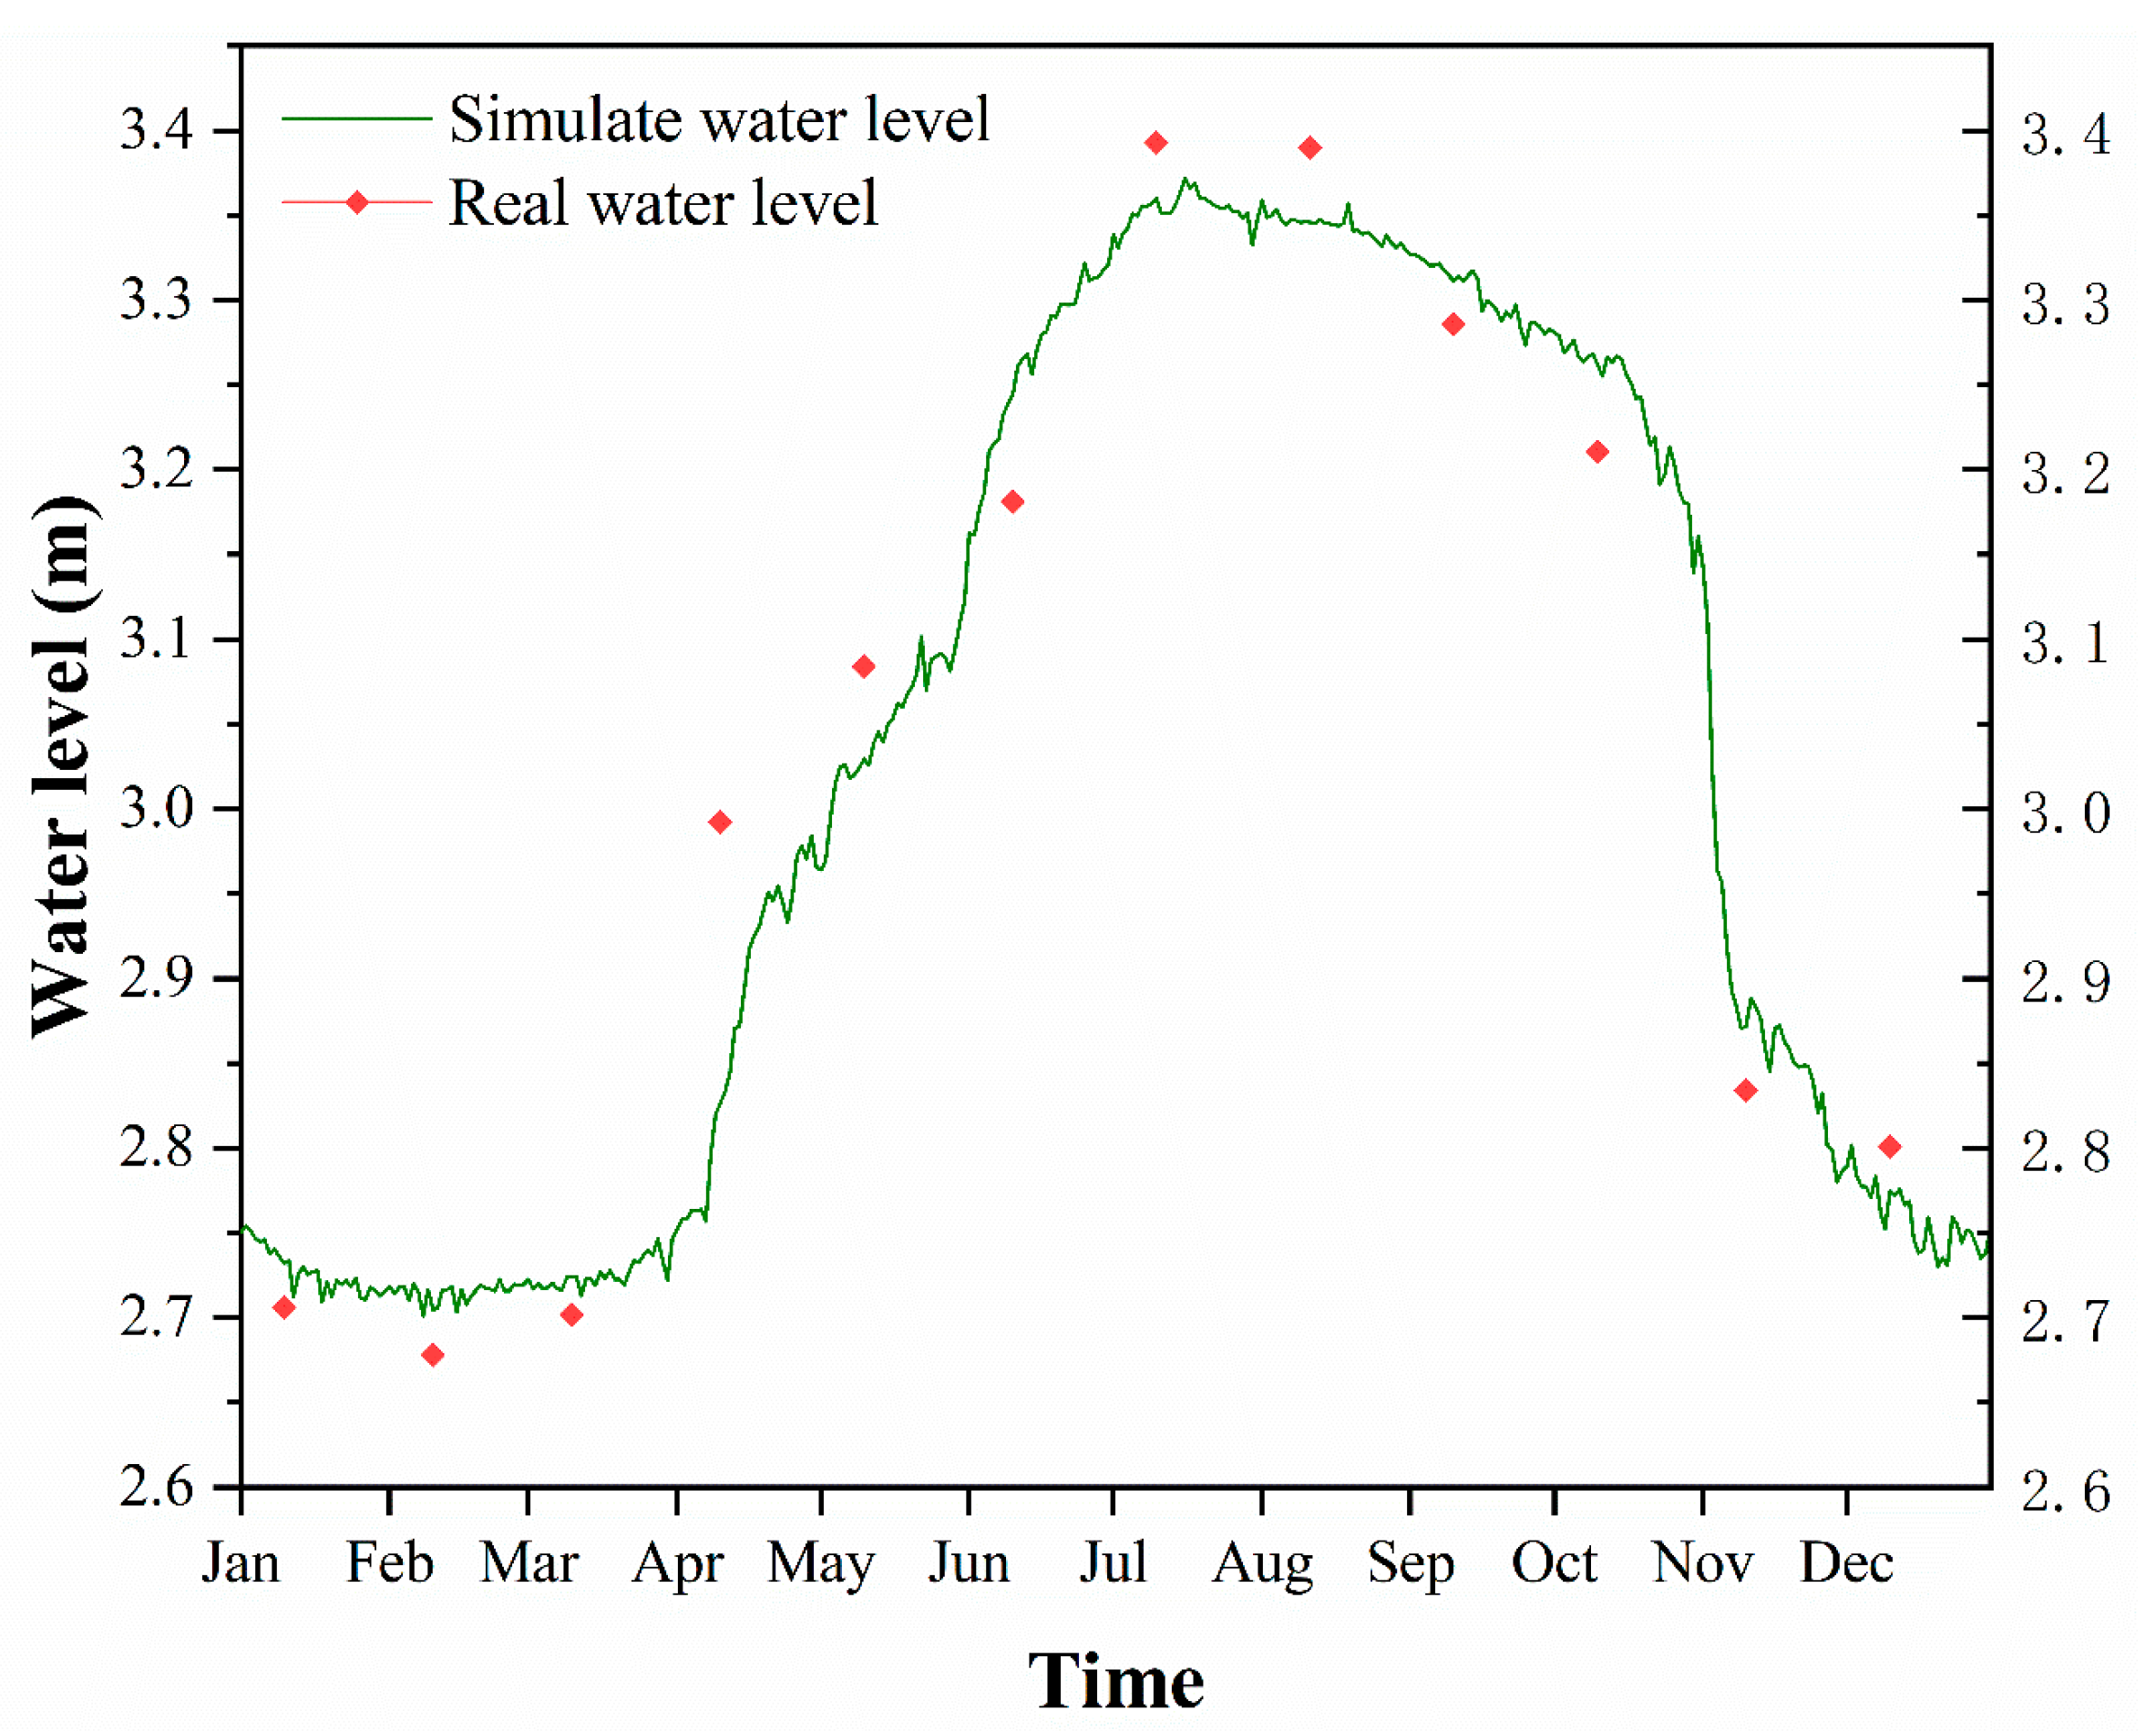
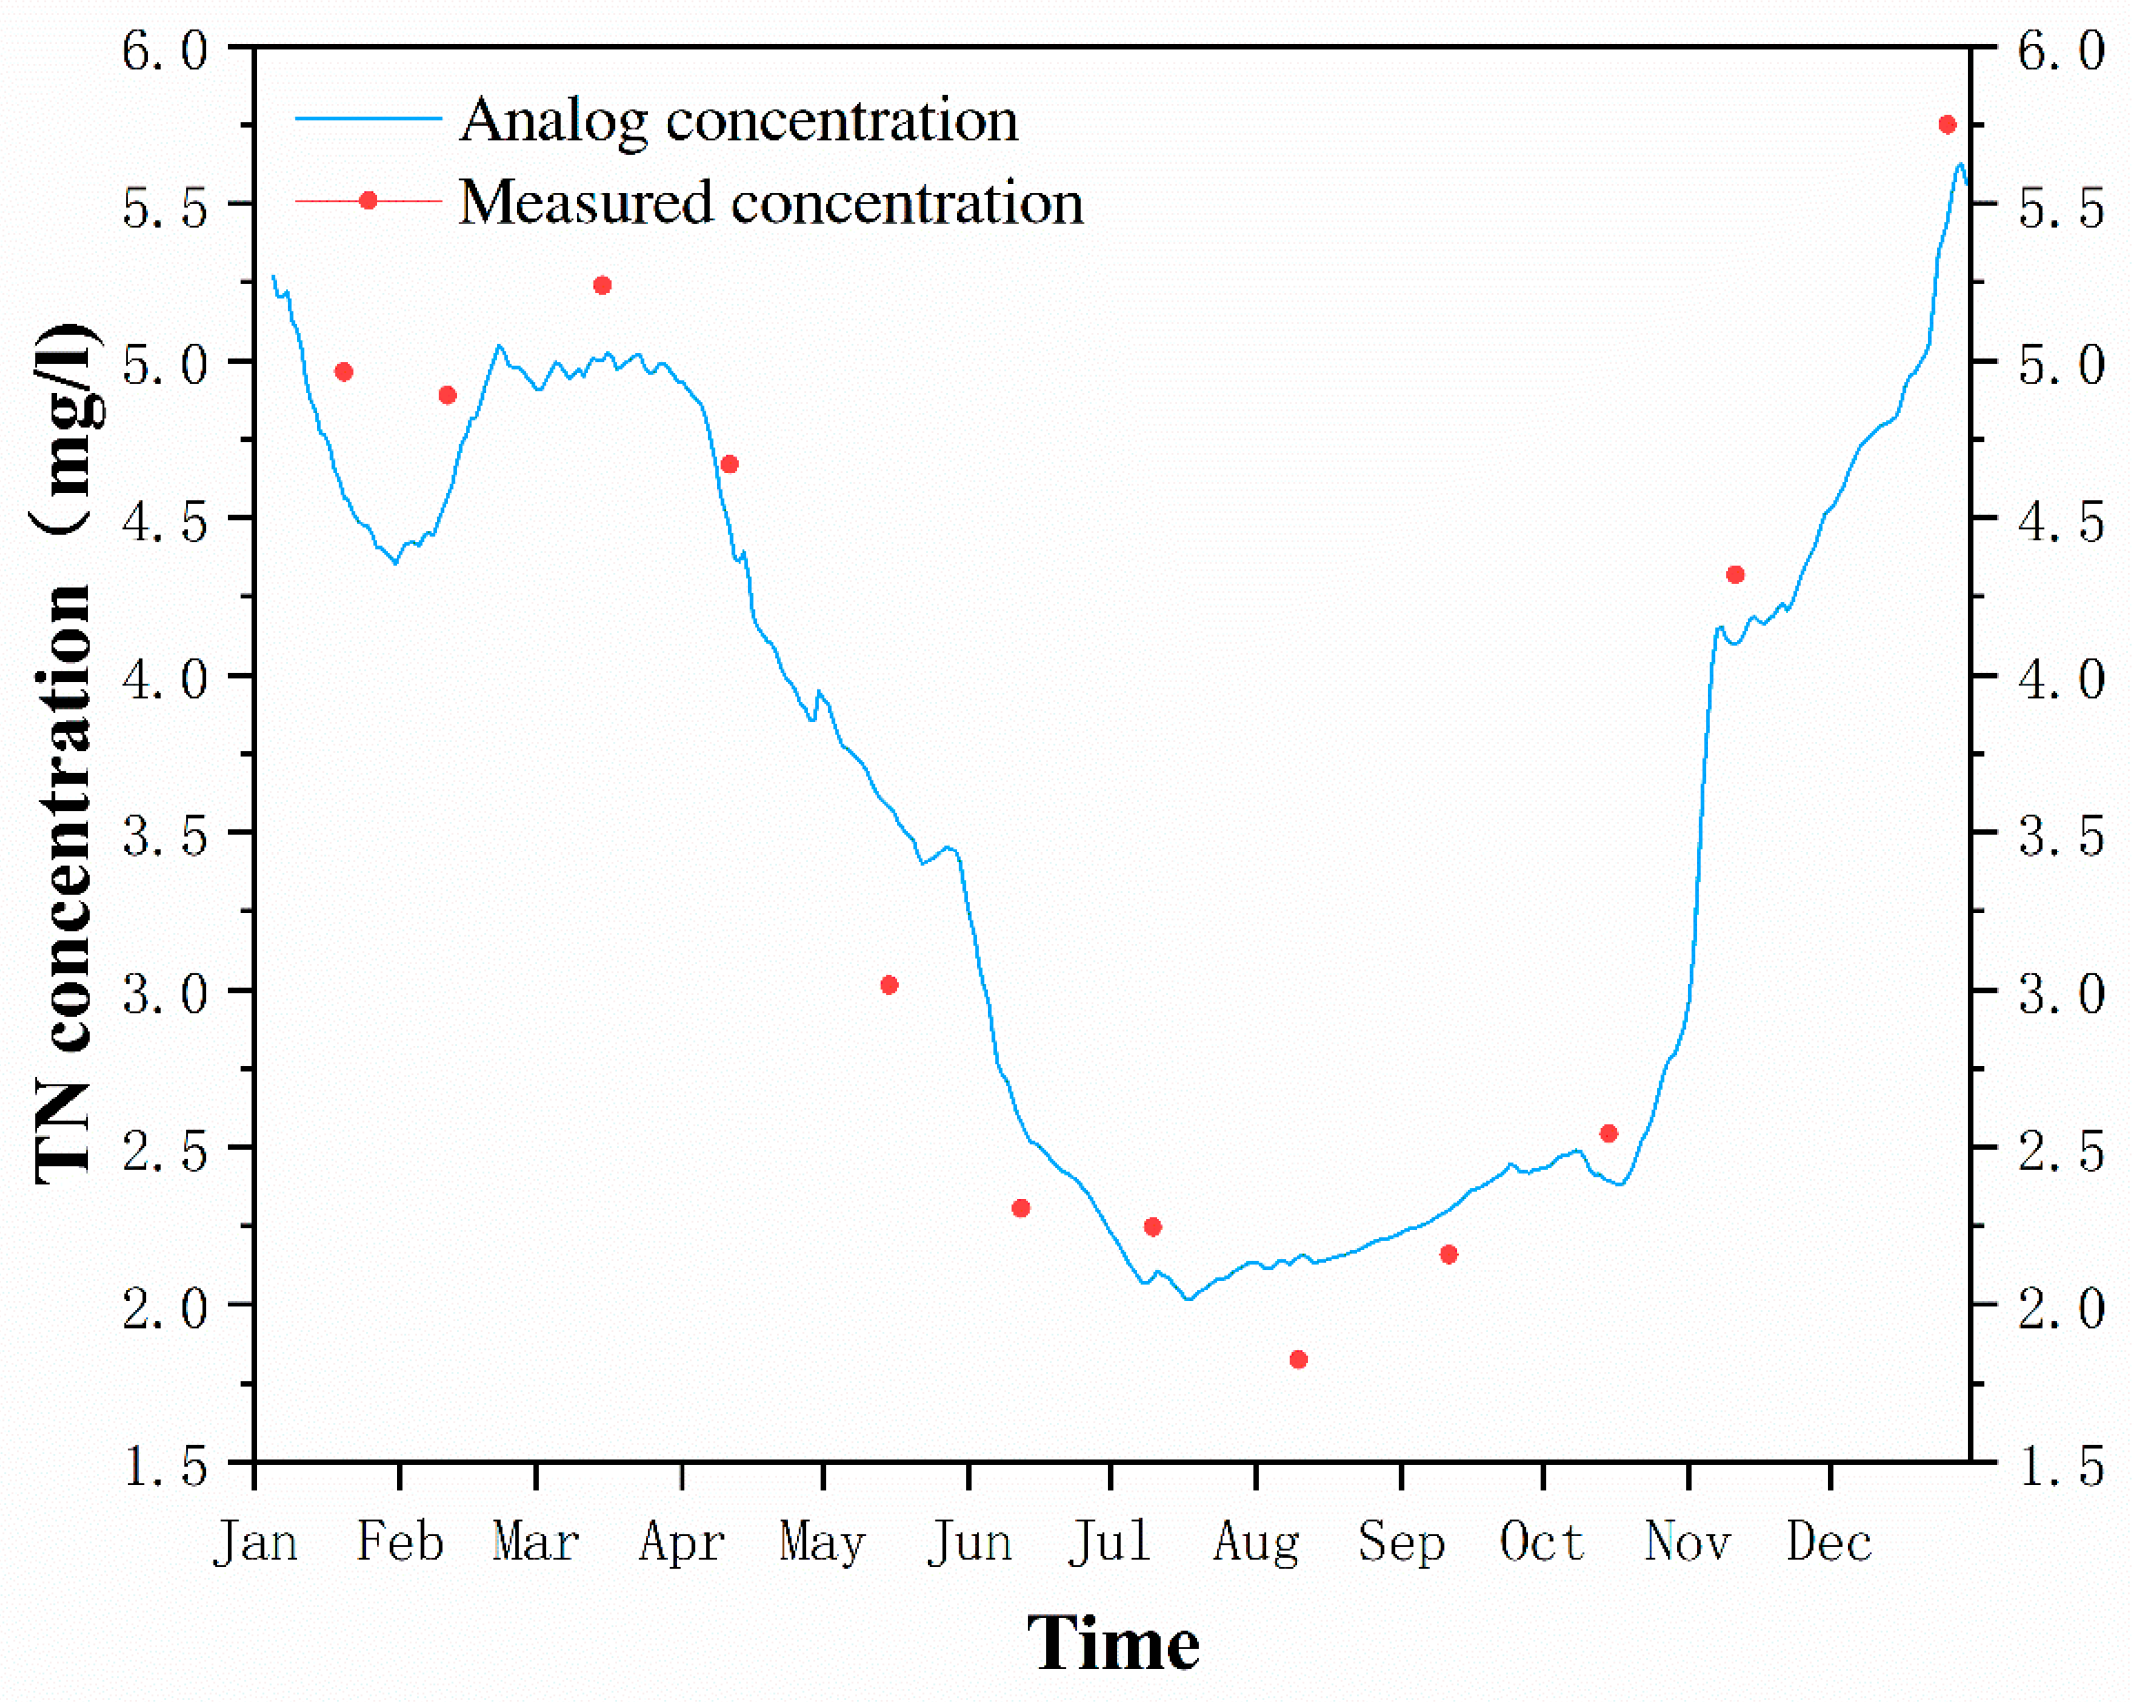
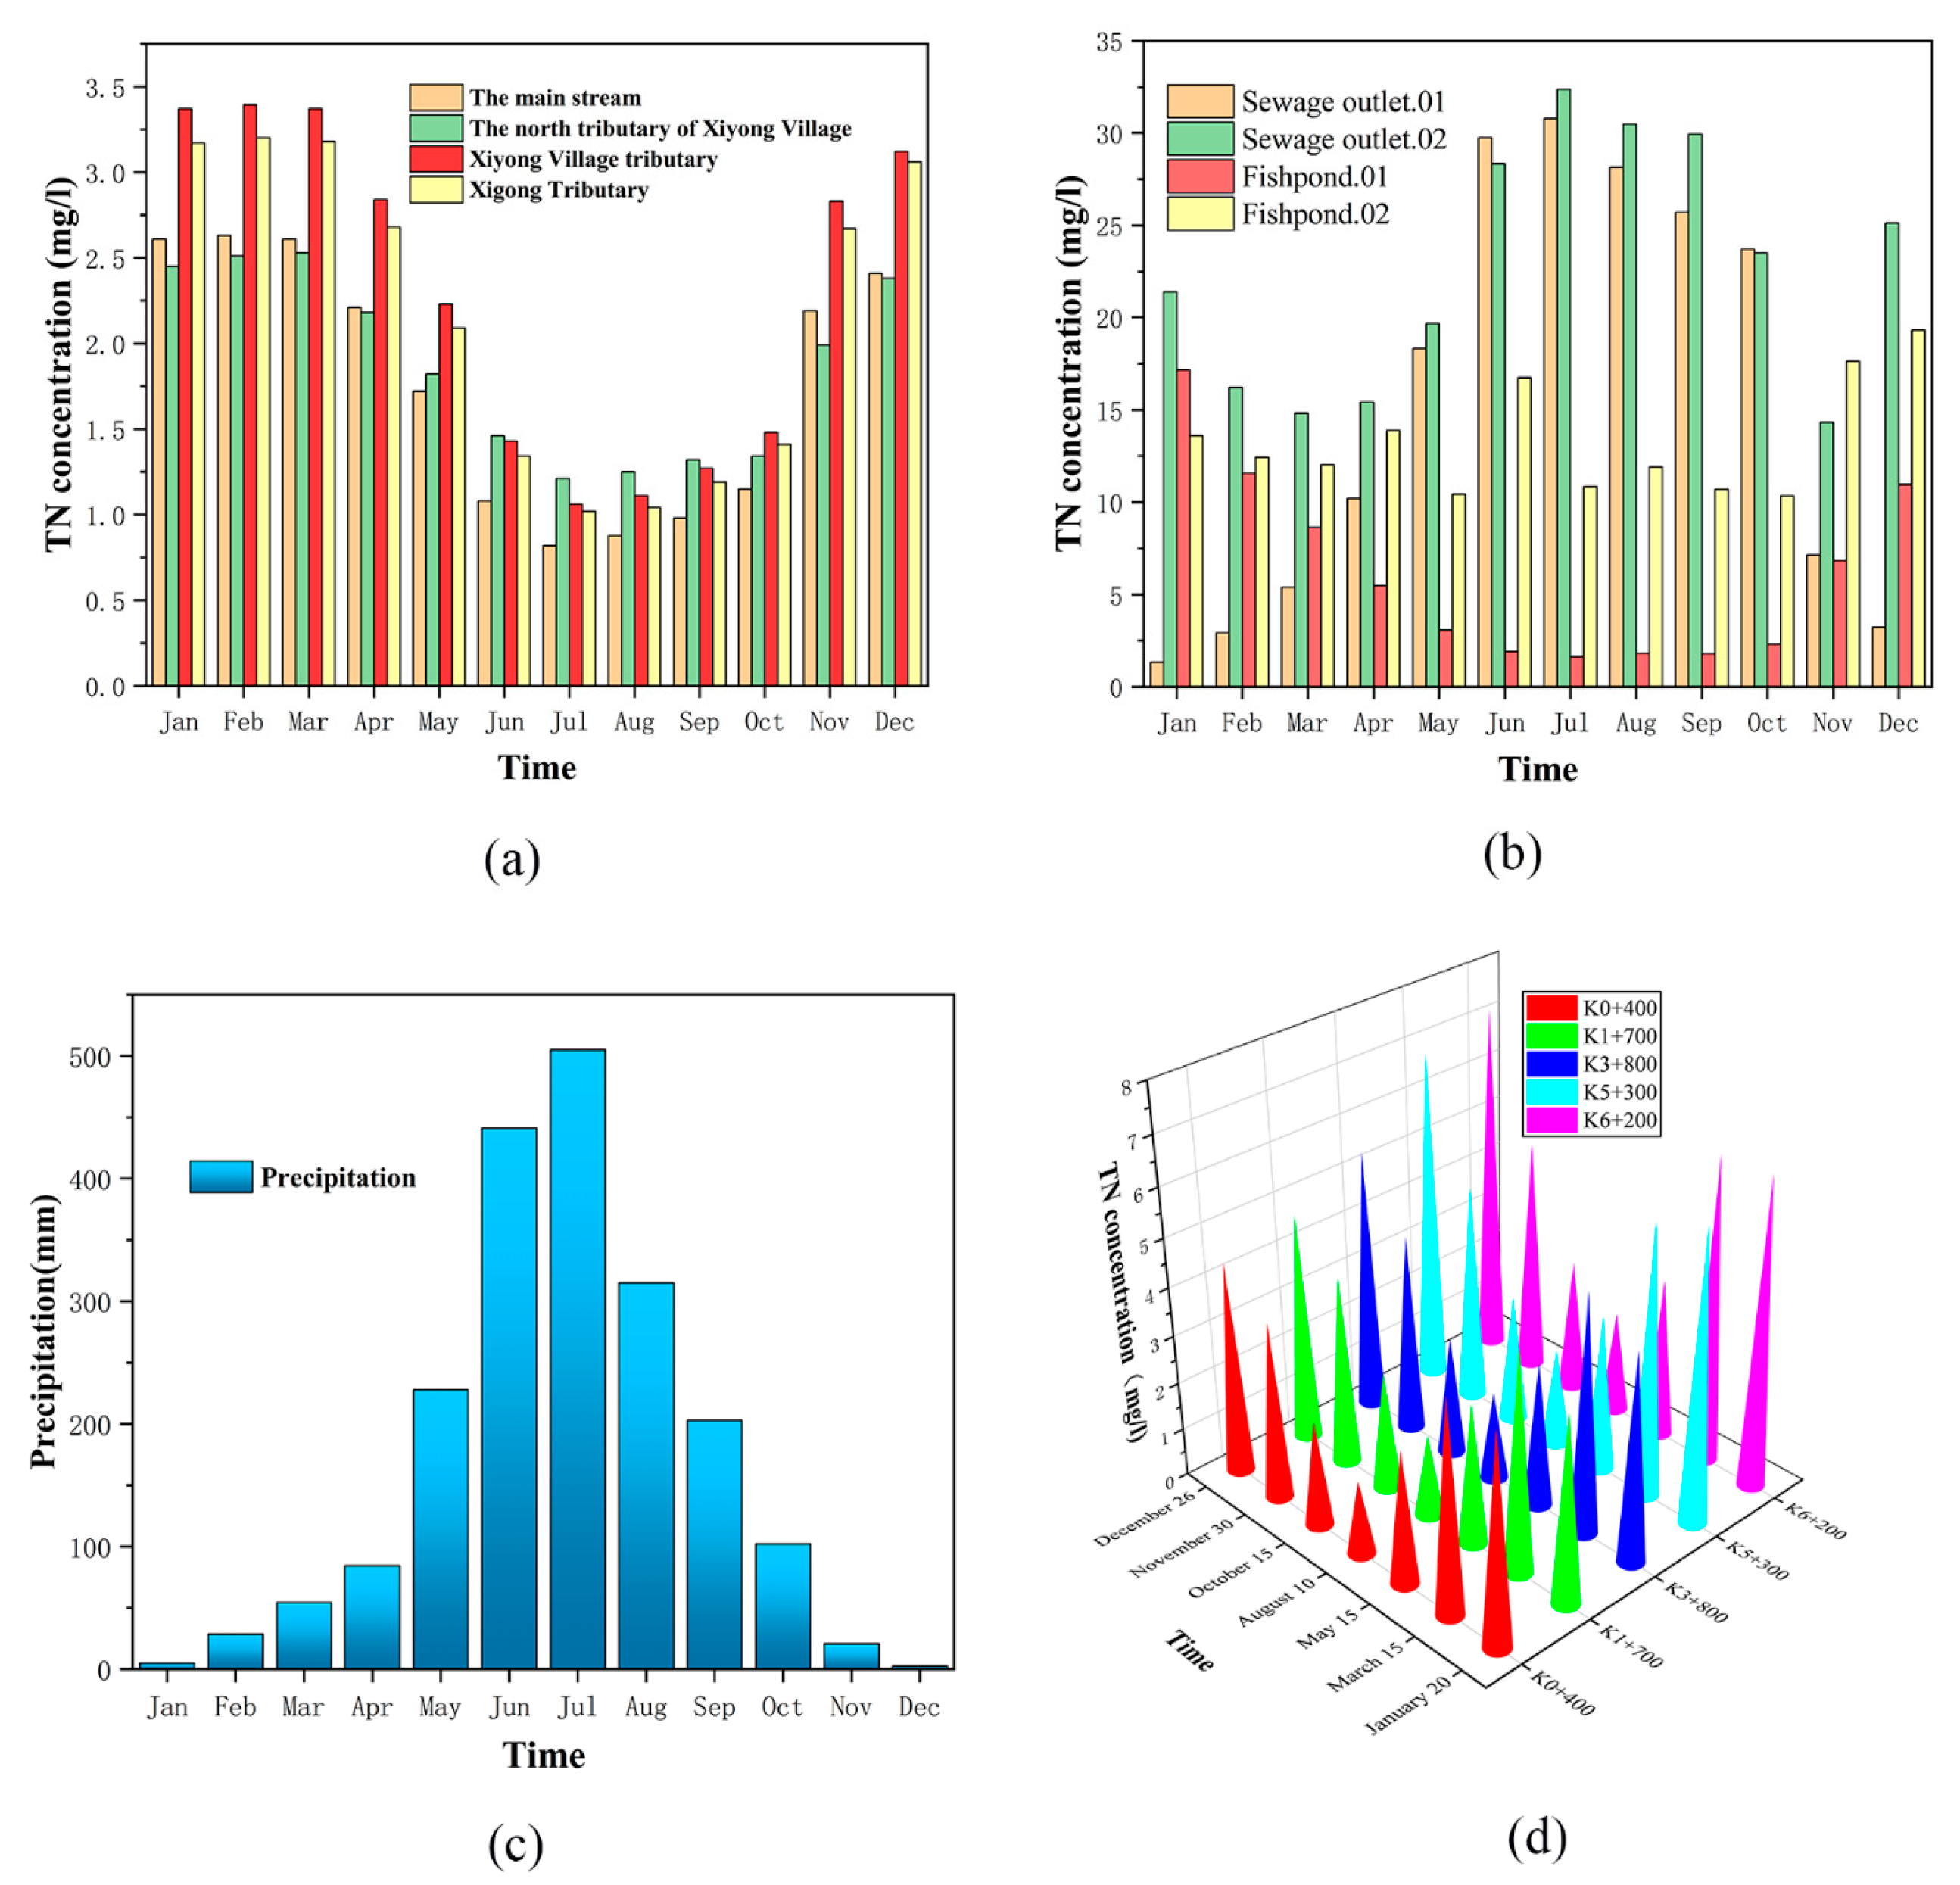
Based on the hydrodynamic module and the water quality module in MIKE21, this paper established the numerical computing model for the Xiyong River. The relative error of water level comparison was 2.9%, and the PBIAS coefficient of the concentration comparison deviation was 17.8%. The hydrodynamic and water quality models were fully verified for their reliability. Numerical simulations of the total nitrogen concentrations were conducted under seven different scenarios. Based on the simulation results, the temporal and spatial distribution patterns of the total nitrogen concentrations were obtained, and the factors leading to high total nitrogen concentrations in the river water were analyzed to provide a basis for the ecological restoration of water quality in the Xiyong River.
The simulation results showed that taking different measures could promote the reduction of TN concentration in the river. When undertaking the comprehensive treatment measures of river water ecology such as intercepting and purifying the main and tributaries of the river, sewage treatment at sewage outlets along the river as well as the regulation of fishing fields and farmland ditches, the annual average TN concentration in the river could be reduced by 0.496 mg/L, with a reduction of 20%. This comprehensive scheme could make the TN concentration of the river reach the Case III water quality standard in 3 years, and the Case II water quality standard in 4 years.
In this paper, the water environment model only considered a single water quality indicator of TN, and other pollution factors were not included in the model. Therefore, later studies can extend and improve the model with additional data to make the water environment model more comprehensive. In addition, this paper established a hydrodynamic model of the Xiyong River Basin without considering the influence of the downstream seawater backflow on the water quality, and the hydrodynamic and water quality characteristics of the Xiyong River and the sea inlet can be further studied in the future.

Author Contributions

Methodology and writing—original daft, J.Z.; Conceptualization and resources, Y.Y.; Software, H.L.; Funding acquisition, Y.Y.; Methodology and formal analysis, W.Z. All authors have read and agreed to the published version of the manuscript.

Funding

This work was supported by grants from the National Key Research and Development Program of China (2021YFC3001903).

Informed Consent Statement

Informed consent was obtained from all subjects involved in the study.

Data Availability Statement

Not applicable.

Acknowledgments

We are very grateful to the anonymous reviewers and editors for their constructive comments.

Conflicts of Interest

The authors declare no conflict of interest.

References

  1. Tang, C.; Yi, Y.; Yang, Z.; Zhang, S.; Liu, H. Effects of ecological flow release patterns on water quality and ecological restoration of a large shallow lake. J. Clean. Prod. 2018, 174, 577–590. [Google Scholar] [CrossRef]
  2. Li, S.; Feng, J.; Zhang, S. Simulation analysis of ecological water replenishment measures on water quality improvement of Qilu Lake. Water Resour. Power 2020, 38, 35–39. [Google Scholar]
  3. Wu, Y.; Zhang, G. Review of development frontiers and prospects of wetlands eco-hydrological models. Acta Ecol. Sin. 2018, 38, 2588–2598. [Google Scholar]
  4. Cui, G.; Chen, X.; Xiang, L. Evaluation of water environment improvement by interconnected river network in plain area. J. Hydraul. Eng. 2017, 48, 1429–1437. [Google Scholar]
  5. Angello, Z.; Behailu, B.; Tränckner, J. Selection of Optimum Pollution Load Reduction and Water Quality Improvement Approaches Using Scenario Based Water Quality Modeling in Little Akaki River, Ethiopia. Water 2021, 13, 584. [Google Scholar] [CrossRef]
  6. Arefinia, A.; Bozorg-Haddad, O.; Oliazadeh, A.; Loaiciga, H.A. Reservoir water quality simulation with data mining models. Environ. Monit. Assess 2020, 192, 482. [Google Scholar] [CrossRef] [PubMed]
  7. Costa, C.; Leite, I.R.; Almeida, A.K.; de Almeida, I.K. Choosing an appropriate water quality model-a review. Environ. Monit. Assess 2021, 193, 38. [Google Scholar] [CrossRef]
  8. Masoumi, F.; Najjar-Ghabel, S.; Salimi, N. Automatic calibration of the two-dimensional hydrodynamic and water quality model using sequential uncertainty fitting approach. Environ. Monit. Assess. 2021, 193, 2. [Google Scholar] [CrossRef] [PubMed]
  9. Liu, C.; Liu, S.; Li, D. An Analysis of the impact of Zhonghuan Sewage Outlet on Water Quality of the Yangtze River Based On MIKE21 Model. China Rural. Water Hydropower 2020, 1, 72–78. [Google Scholar]
  10. Guo, Y. Ecological Restoration and Numerical Simulation of Water Environment in Bahe River Basin. Master’s Thesis, Xi’an University of Technology, Xian, China, 2019. [Google Scholar]
  11. Shu, C.; Li, L.; Feng, T. Simulation of emergent water pollution accident in river-type drinking water sources based on MIKE 21: Case of Nanchang reach of Ganjiang River. Yangtze River 2019, 50, 73–77. [Google Scholar]
  12. Li, D.; Bu, S.; Gu, L. Simulated water quality test and examination of Yanghe Reservoir based on the MIKE 21 model. J. Saf. Env. 2018, 18, 1094–1100. [Google Scholar]
  13. Hu, Y.; Zhou, L. Numerical simulation analysis on two-dimensional hydrodynamics and water quality of Shifosi Reservoir based on MIKE21. People’s Yangtze River 2021, 52, 31–38. [Google Scholar]
  14. Ma, N. Research of Hydrodynamic and Water Quality Model in Mou reservoir. Master’s Thesis, Hebei University of Engineering, Handan, China, 2017. [Google Scholar]
  15. Gong, X.; Sun, R.; Lu, C. Research on the Water Quality and Quantity Response Based on MIKE 21 in the Upper—Reach Lakes of Nansi Lake. China Rural. Water Hydropower 2019, 435, 70–76. [Google Scholar]
  16. Yang, W.; Zhang, L.; Zhang, Y.; Li, Z.; Xiao, Y.; Xia, J. Developing a comprehensive evaluation method for Interconnected River System Network assessment: A case study in Tangxun Lake group. J. Geogr. Sci. 2019, 29, 389–405. [Google Scholar] [CrossRef] [Green Version]
  17. Zeng, F. Study on Flood Conveyance Capacity of Rivers in Small and Medium Basins Without Hydrological Station—A Case Study of Downstream Basin of Yingna River Reservoir. Master’s Thesis, Dalian University of Technology, Dalian, China, 2022. [Google Scholar]
  18. Zhang, X.; Wu, X.; Zhu, G.; Wang, T.; Chen, H. Simulation of diffuse source polluted water environment based on MIKE21: A case study of the urban section of the Bai river. Water Pract. Technol. 2022, 17, 1893–1913. [Google Scholar] [CrossRef]
  19. Wang, Q.; Peng, W.; Dong, F.; Liu, X.; Ou, N. Simulating Flow of An Urban River Course with Complex Cross Sections Based on the MIKE21 FM Model. Water 2020, 12, 761. [Google Scholar] [CrossRef] [Green Version]
  20. Li, J.; Chen, Y.; Wang, Z. Effect of pollution load reduction on water quality in rural lakes in the shallow hill water network area. Water Supply 2022, 22, 6213–6229. [Google Scholar] [CrossRef]
  21. Yang, H.; Wang, J.; Li, J.; Zhou, H.; Liu, Z. Modelling impacts of water diversion on water quality in an urban artificial lake. Environ. Pollut. 2021, 276, 116694. [Google Scholar] [CrossRef] [PubMed]
  22. Yu, Y. Simulation and Effect Evaluation of Water Environment Treatment Project for Medium and Small Sized Rivers through the Model MIKE 11. Master’s Thesis, Huazhong University of Science and Technology, Wuhan, China, 2021. [Google Scholar]
  23. Wang, Y.; Chen, H. Problems and Countermeasures of River Water Environment in Shenzhen City. Water Resour. Plan. Des. 2020, 3, 82–86. [Google Scholar]
Figure 1. The geographical location of the study area.
Water 15 02359 g001
Figure 2. Model concept of Xiyong River.
Water 15 02359 g002
Figure 3. Meshing with a partial enlargement figure.
Water 15 02359 g003
Figure 4. Monitoring points of the Xiyong River.
Water 15 02359 g004
Figure 5. The input and output boundaries of the flow and water quality.
Water 15 02359 g005
Figure 6. Comparison of the simulated and measured water level values of K6 + 200.
Water 15 02359 g006
Figure 7. Comparison of the water quality simulation and actual measurement results at K6 + 200.
Water 15 02359 g007
Figure 8. The information about the river characteristics: (a) discharge data from the mainstream and tributary; (b) discharge data from the sewage outfall; (c) basin precipitation data; (d) measured TN concentration at the monitoring points.
Water 15 02359 g008
Figure 9. Scenario 1: Simulation results and partial zoom in August. ((AD) represent different river sections respectively).
Water 15 02359 g009
Figure 10. Comparison of the simulation results between the different monitoring points.
Water 15 02359 g010aWater 15 02359 g010b
Table 1. Scenario hypotheses schemes.
ScenariosTreatment Measures
Scenario 1No measures. The TN discharge concentration of the main stream, tributaries, and sewage outlets is set as the 2020 initial statistical concentration value.
Scenario 2The pollutant treatment of the upstream of the main stream so that the TN concentration in the upstream water decreases by 60%.
Scenario 3Scenario 2 + the pollutant treatment of three tributaries so that the TN concentration of three tributaries decreases by 20%.
Scenario 4Scenario 3 + the pollutant treatment of two sewage outlets next to the village so that the TN concentration at the two sewage outlets decreases by 60%.
Scenario 5Scenario 4 + the pollutant treatment of point pollutant from fish ponds and farmlands, which are within 800 m along the river so that the TN concentration at the two sewage outlets decreases by 25%.
Scenario 6Scenario 5 + comprehensive treatment measures of the water environment in the river course so that the TN flowing into the water body decreases by about 35%.
Scenario 7The concentration of TN in rainfalls is 0 mg/L.
Table 2. Scenario 1: Simulated results of the TN concentration at five monitoring points in August.
Monitoring PointsInterval and Coordinates (m)Simulation Results (mg/L)
K0 + 400Upper stream (162,448.85, 125,85.59)0.871
K1 + 700Middle stream (162,726.85, 11,789.14)1.249
K3 + 800Middle stream (162,882.09, 11,327.58)1.575
K5 + 300Lower stream (163,040.41, 10,925.16)1.555
K6 + 200Lower stream (162,999.60, 10,182.99)1.598
Table 3. Scenario 1: Simulated values from January to December at K6 + 200.
MonthSimulation Results (mg/L)MonthSimulation Results (mg/L)
15.00971.599
24.63681.598
34.45791.699
43.183101.758
52.456113.089
61.849125.231
Table 4. Seven scenarios: August simulation values at K6 + 200.
Simulation Values (mg/L)The Percentage Decreased byScenariosSimulation Values (mg/L)The Percentage Decreased by
Scenario 11.598——Scenario 50.99638%
Scenario 21.4459%Scenario 60.95840%
Scenario 31.42611%Scenario 71.38913%
Scenario 41.19925%
Table 5. The standard of the TN concentration of surface water with different cases (mg/L).
IIIIIIIVV
TN≤0.20.51.01.52.0
Table 6. Prediction of the TN concentration reaching standards (average value of the five monitoring points).
ScenariosTN Concentration Values (mg/L)Annual Reduction (mg/L)Years Needed to Reach Case III Water QualityYears Needed to Reach Case II Water Quality
Scenario 12.47
Scenario 22.3650.1051418
Scenario 32.3470.1231216
Scenario 42.2290.24179
Scenario 52.1020.36846
Scenario 61.9740.49634
Scenario 72.160.310
Disclaimer/Publisher’s Note: The statements, opinions and data contained in all publications are solely those of the individual author(s) and contributor(s) and not of MDPI and/or the editor(s). MDPI and/or the editor(s) disclaim responsibility for any injury to people or property resulting from any ideas, methods, instructions or products referred to in the content.

