
Metal Transport in the Mixing Zone of an Estuarine River to the Northern Gulf of Mexico

Abstract
:1. Introduction
2. Methods
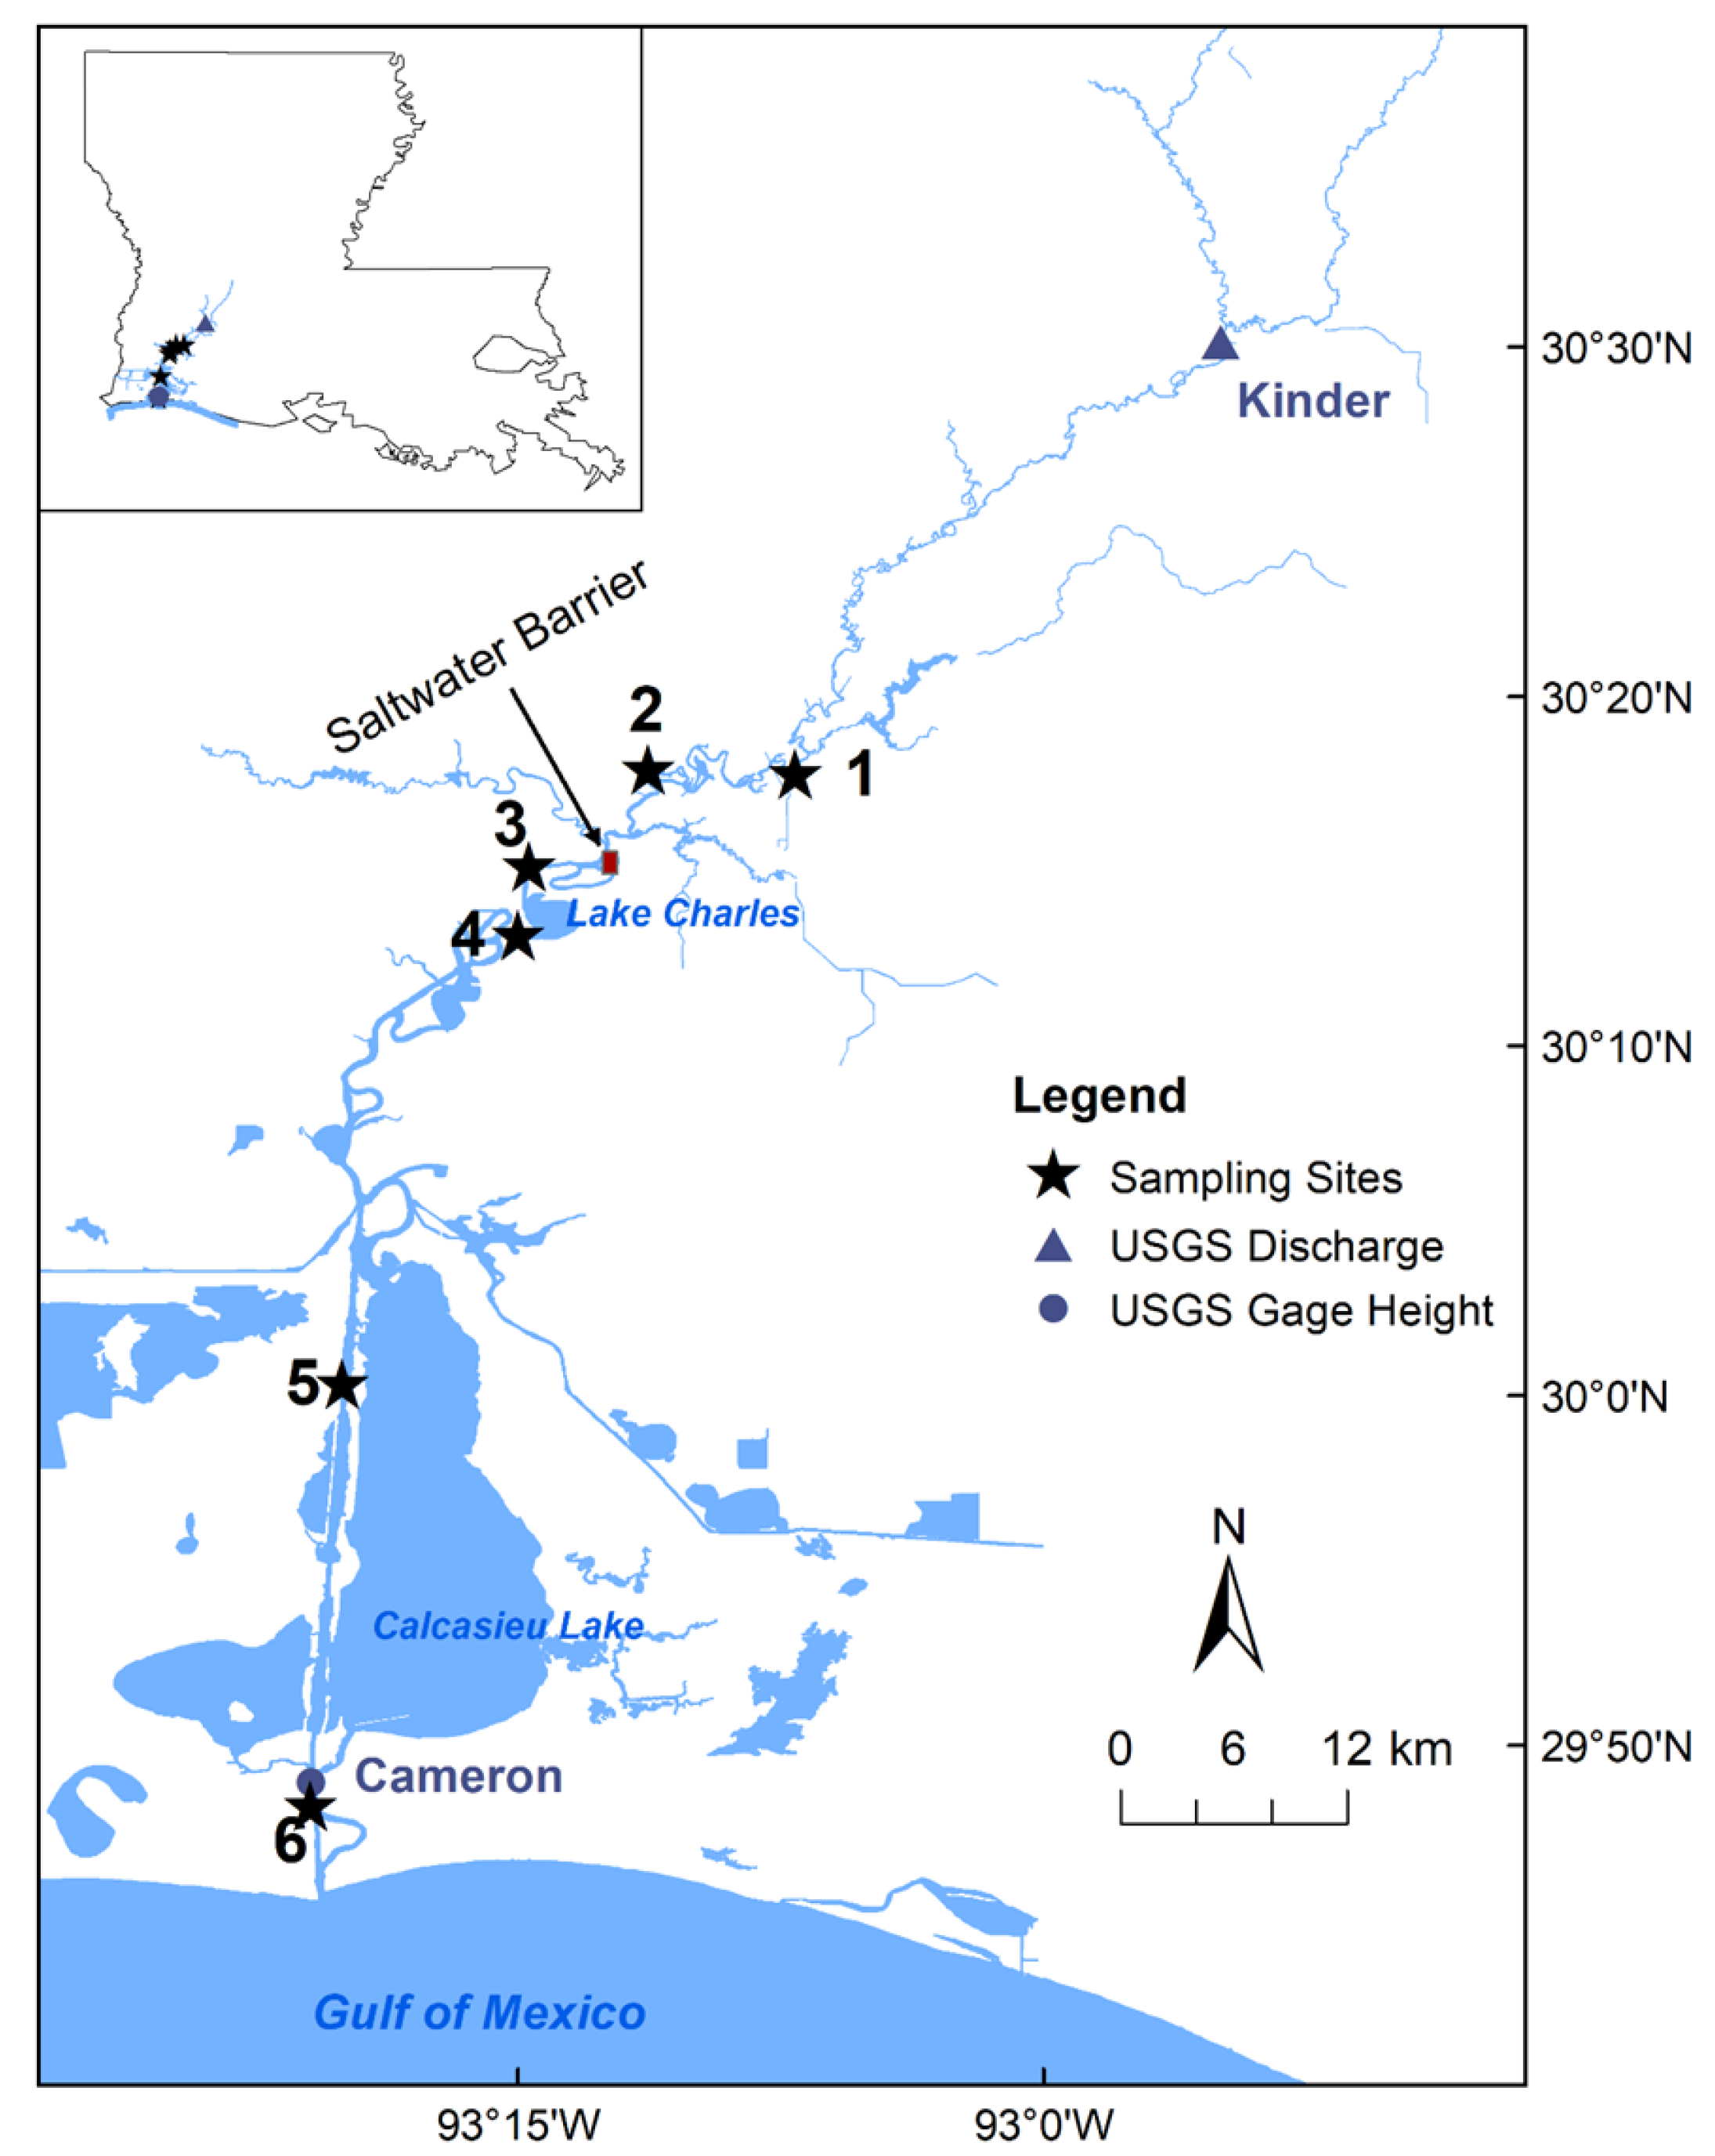
2.1. Study Area
2.2. Sample Collection
2.3. Sample Analysis
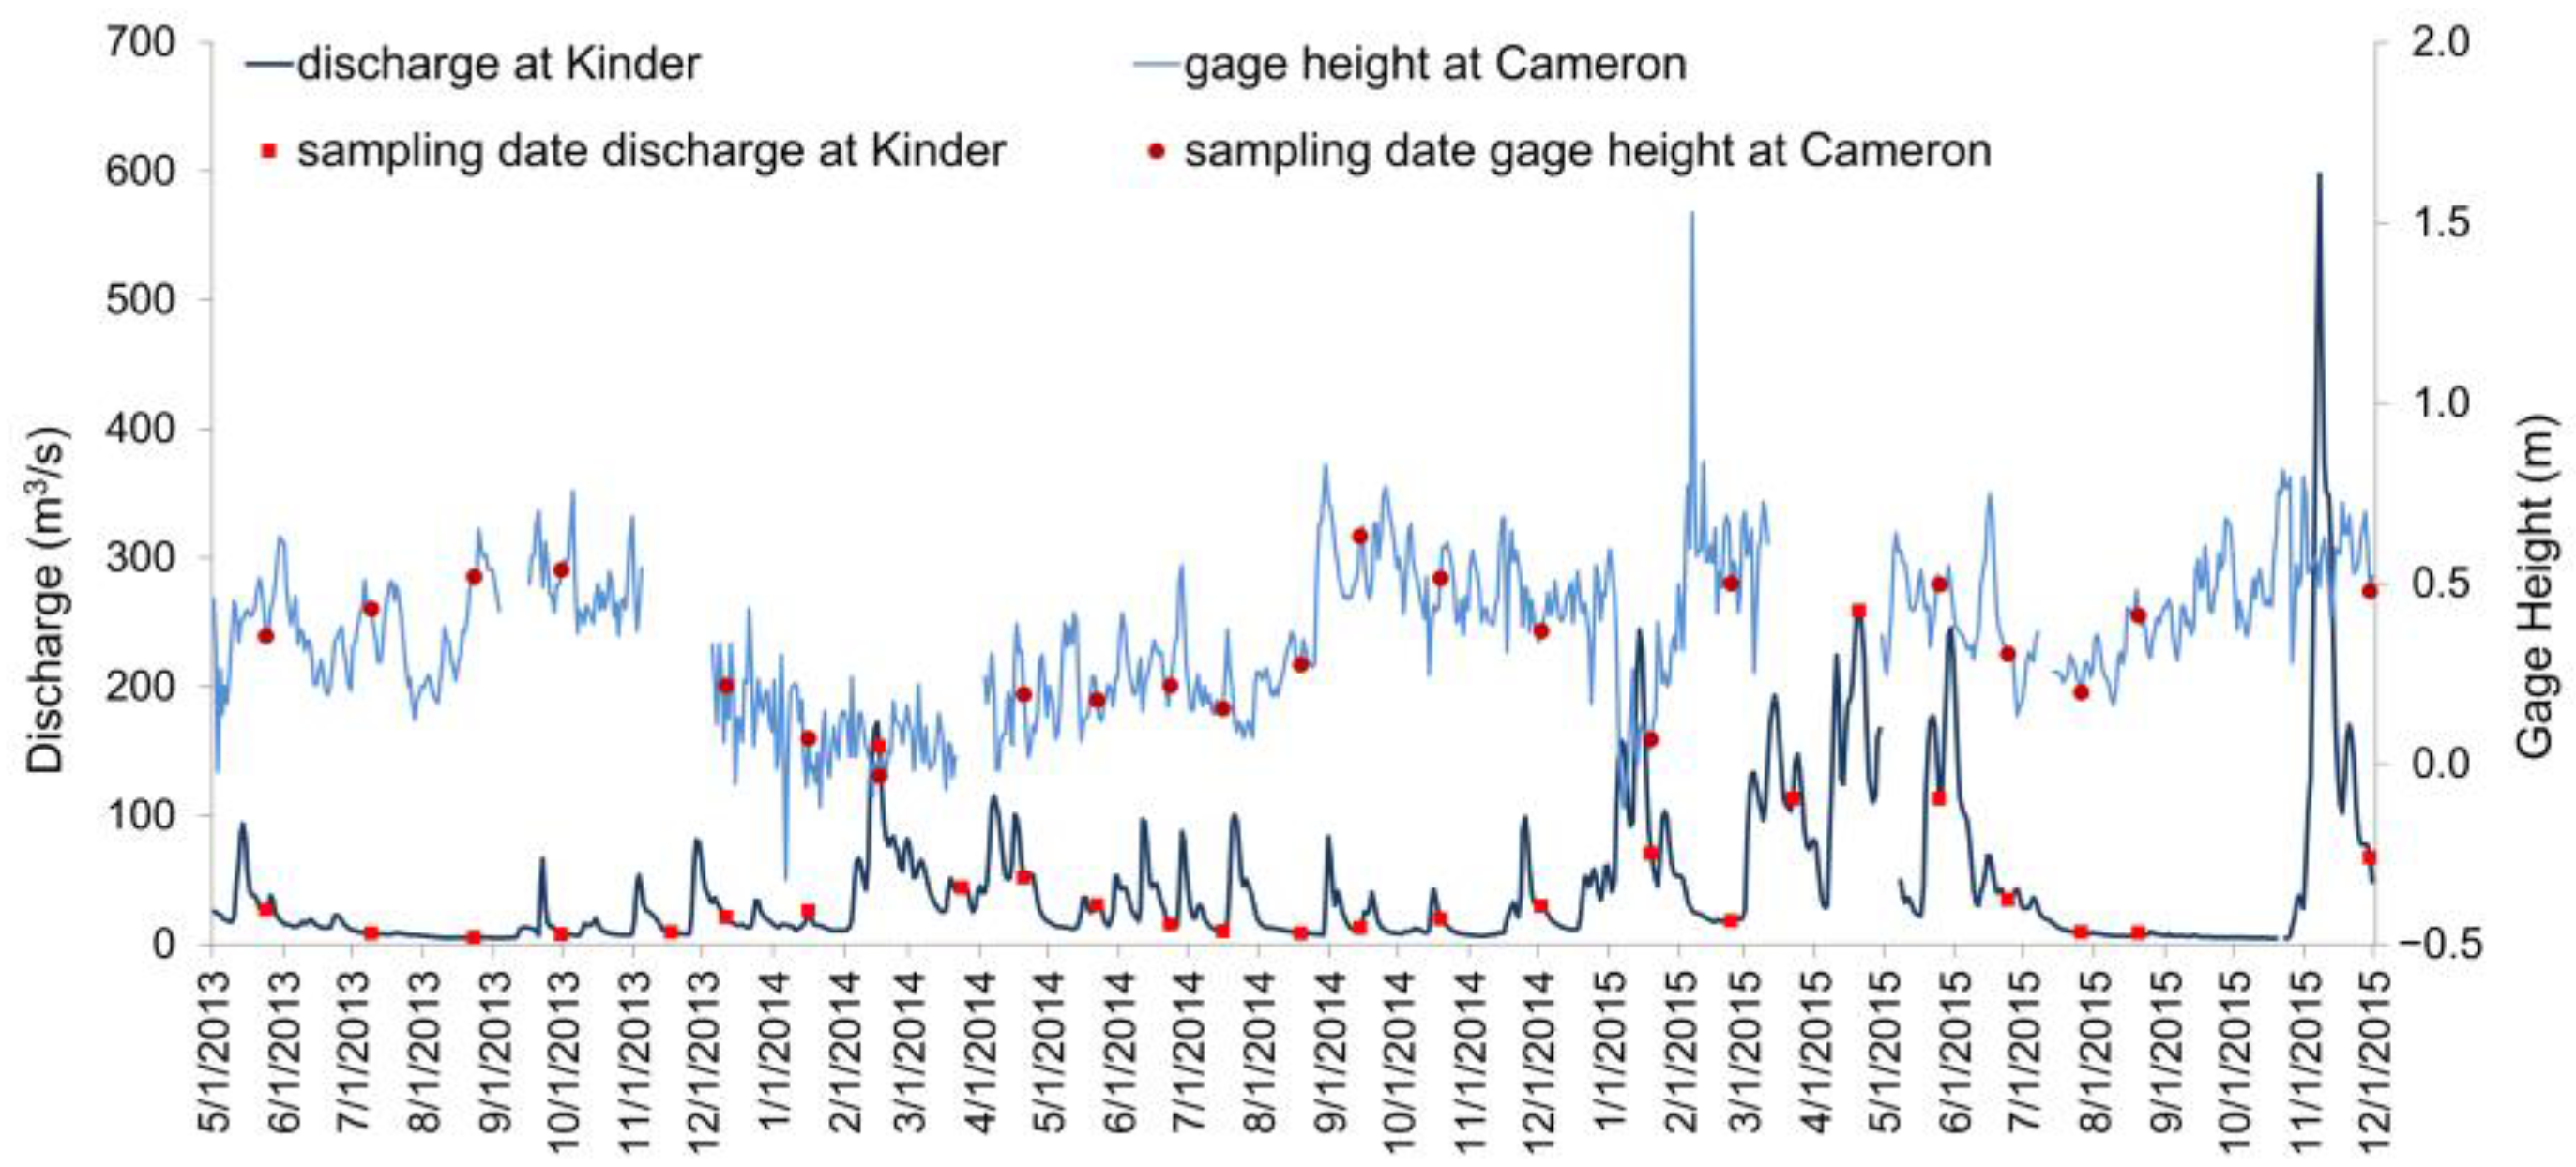
2.4. Other Data Collection
2.5. Data Analysis
3. Results
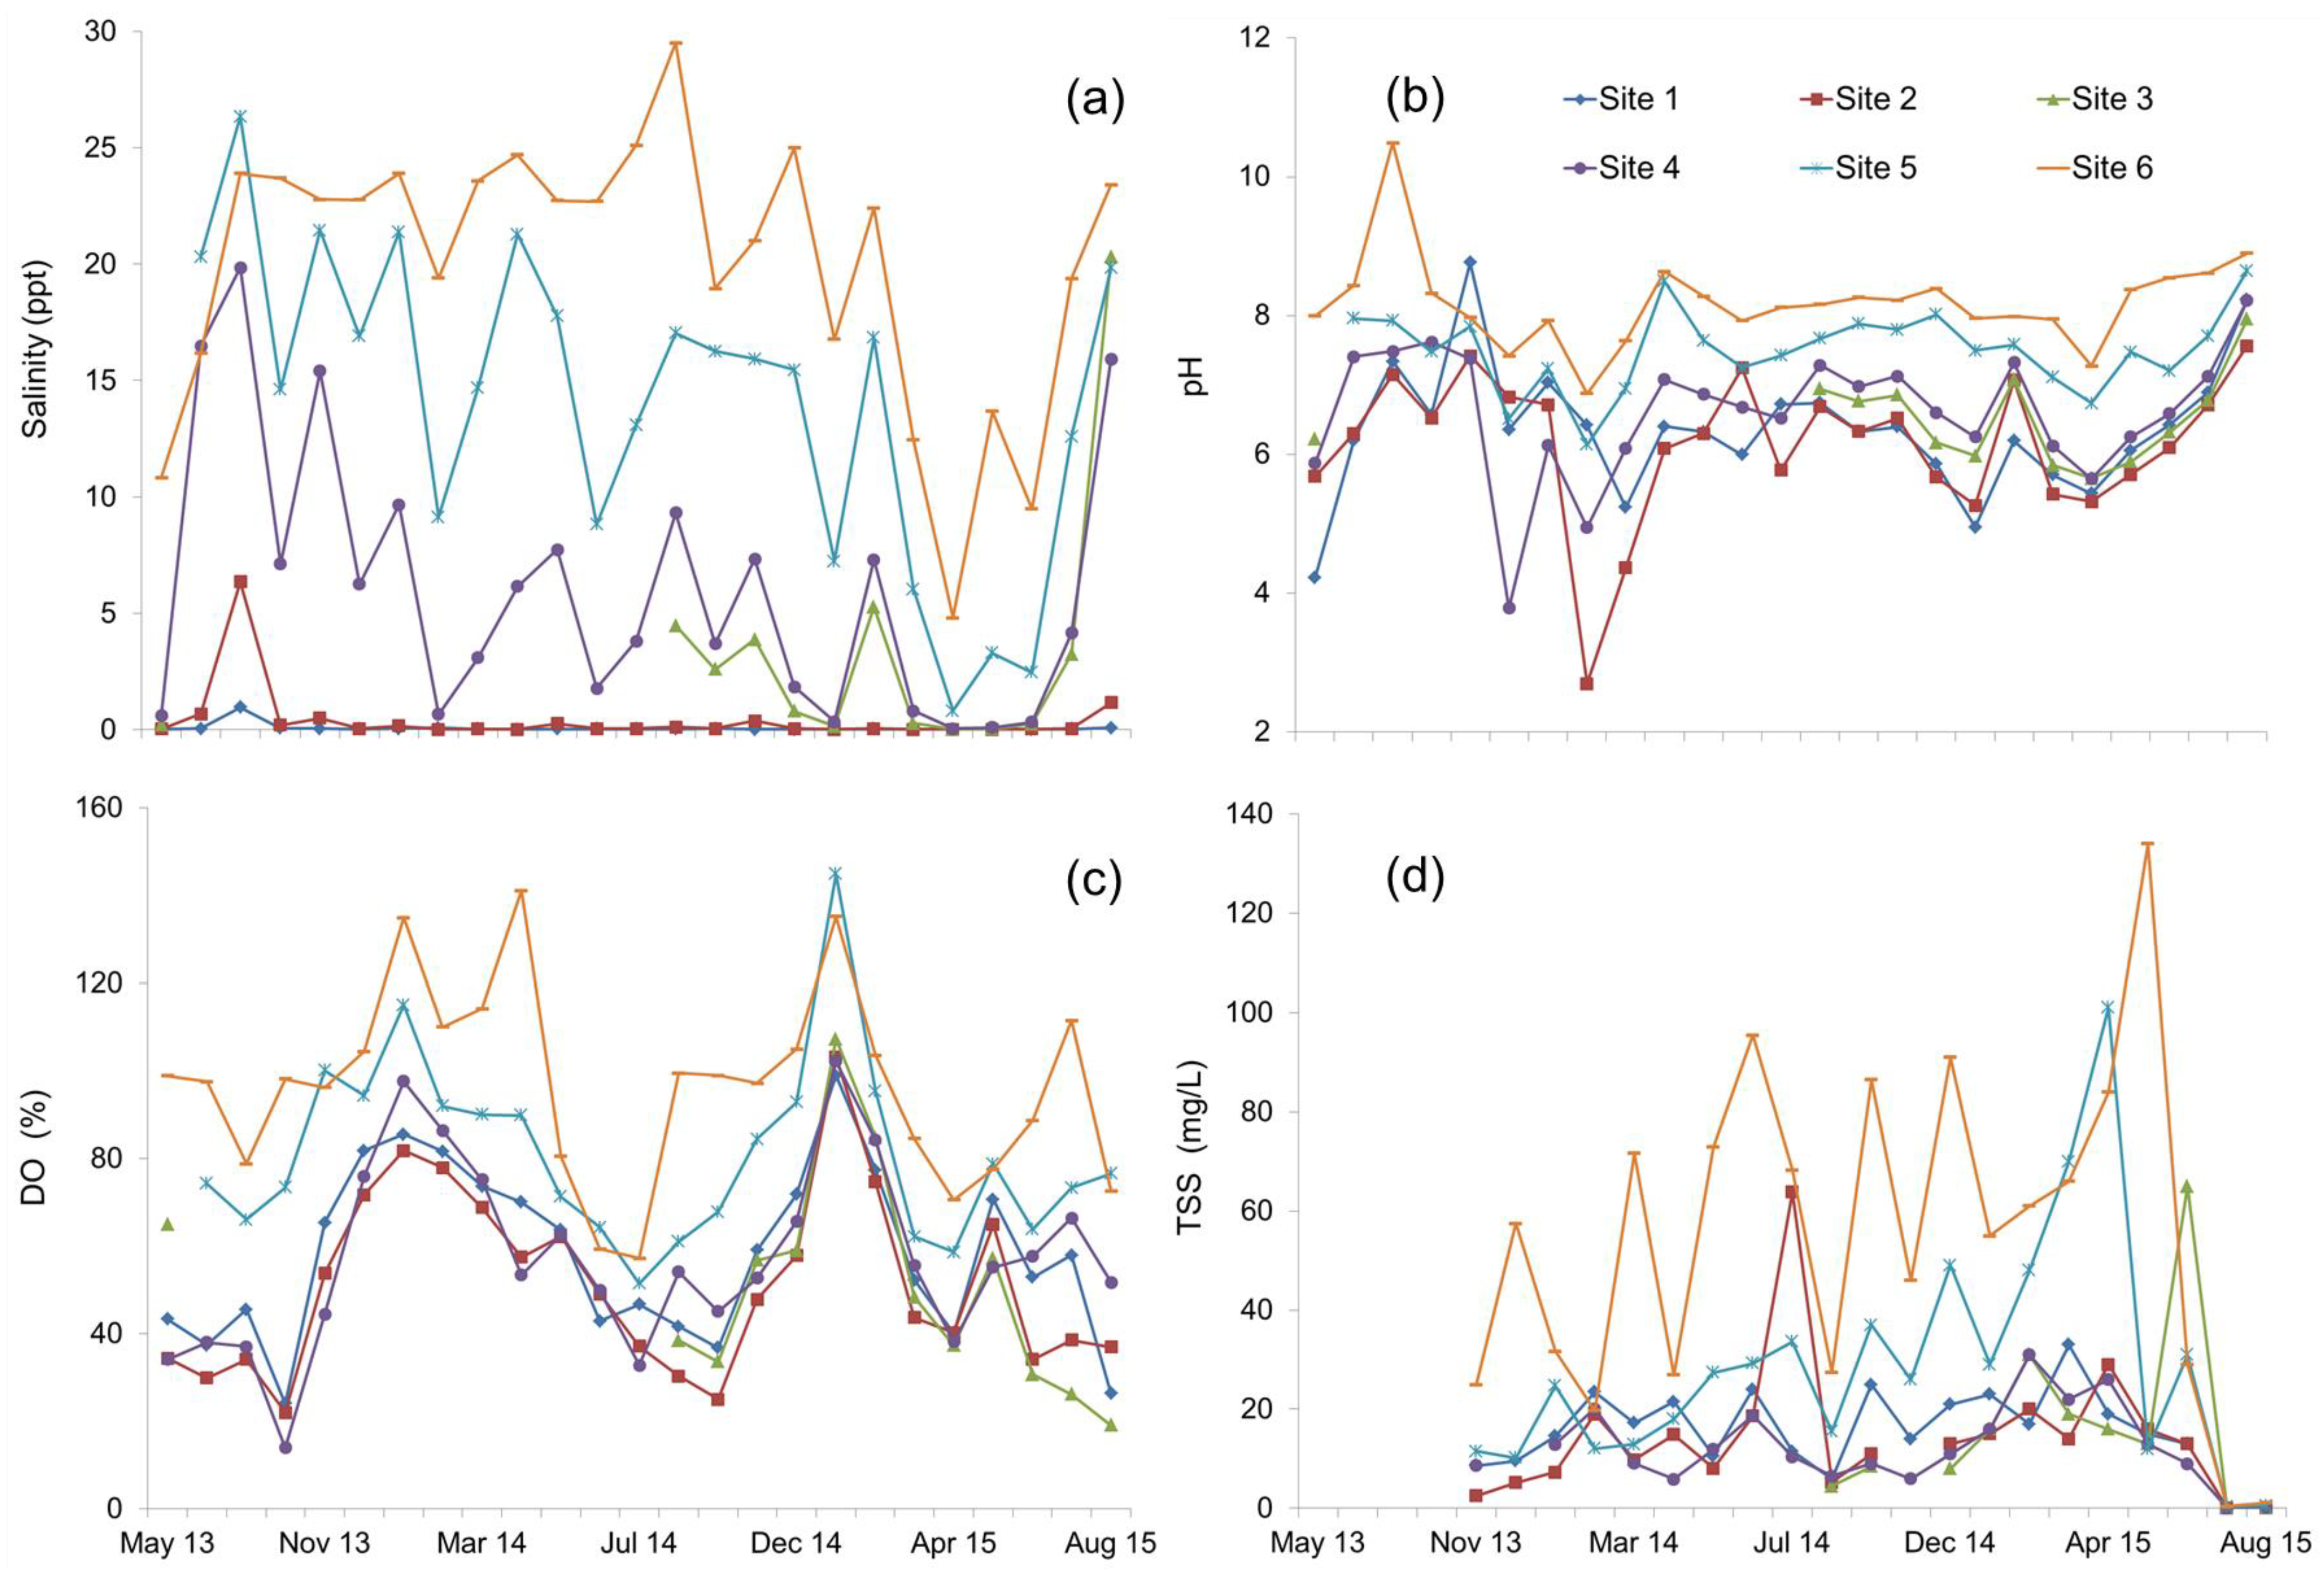
3.1. Hydrology and Ambient Conditions
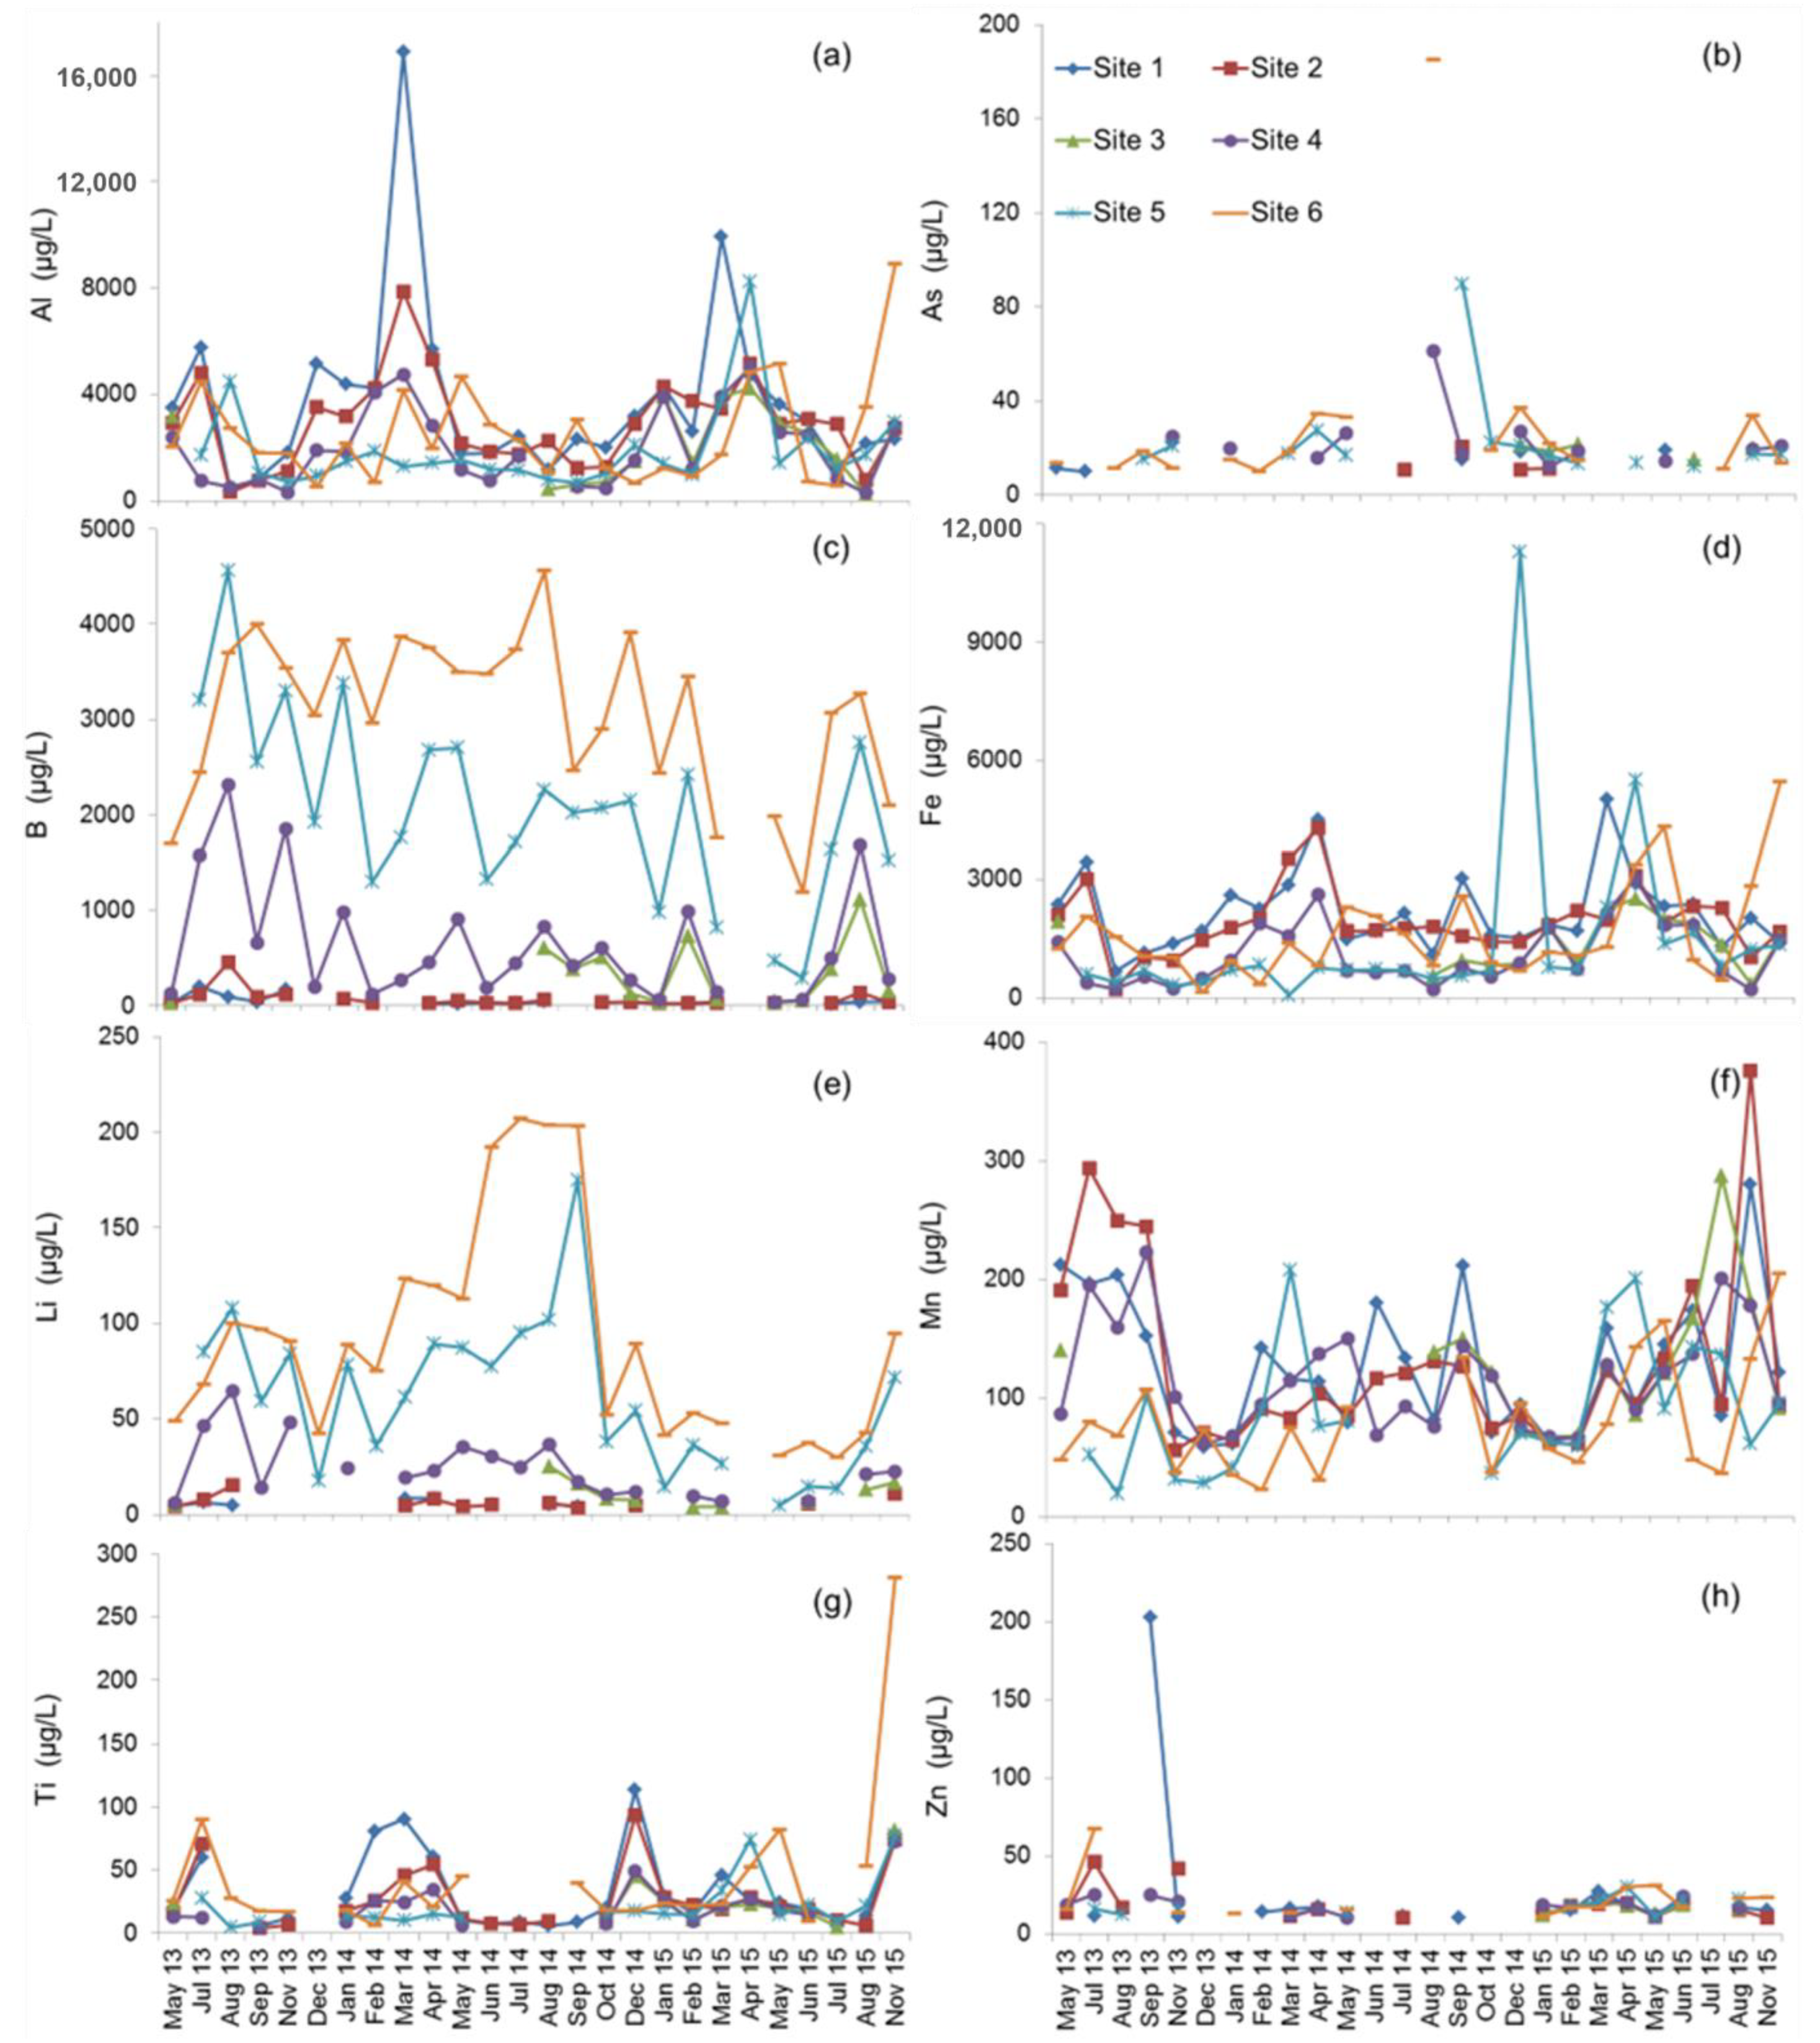
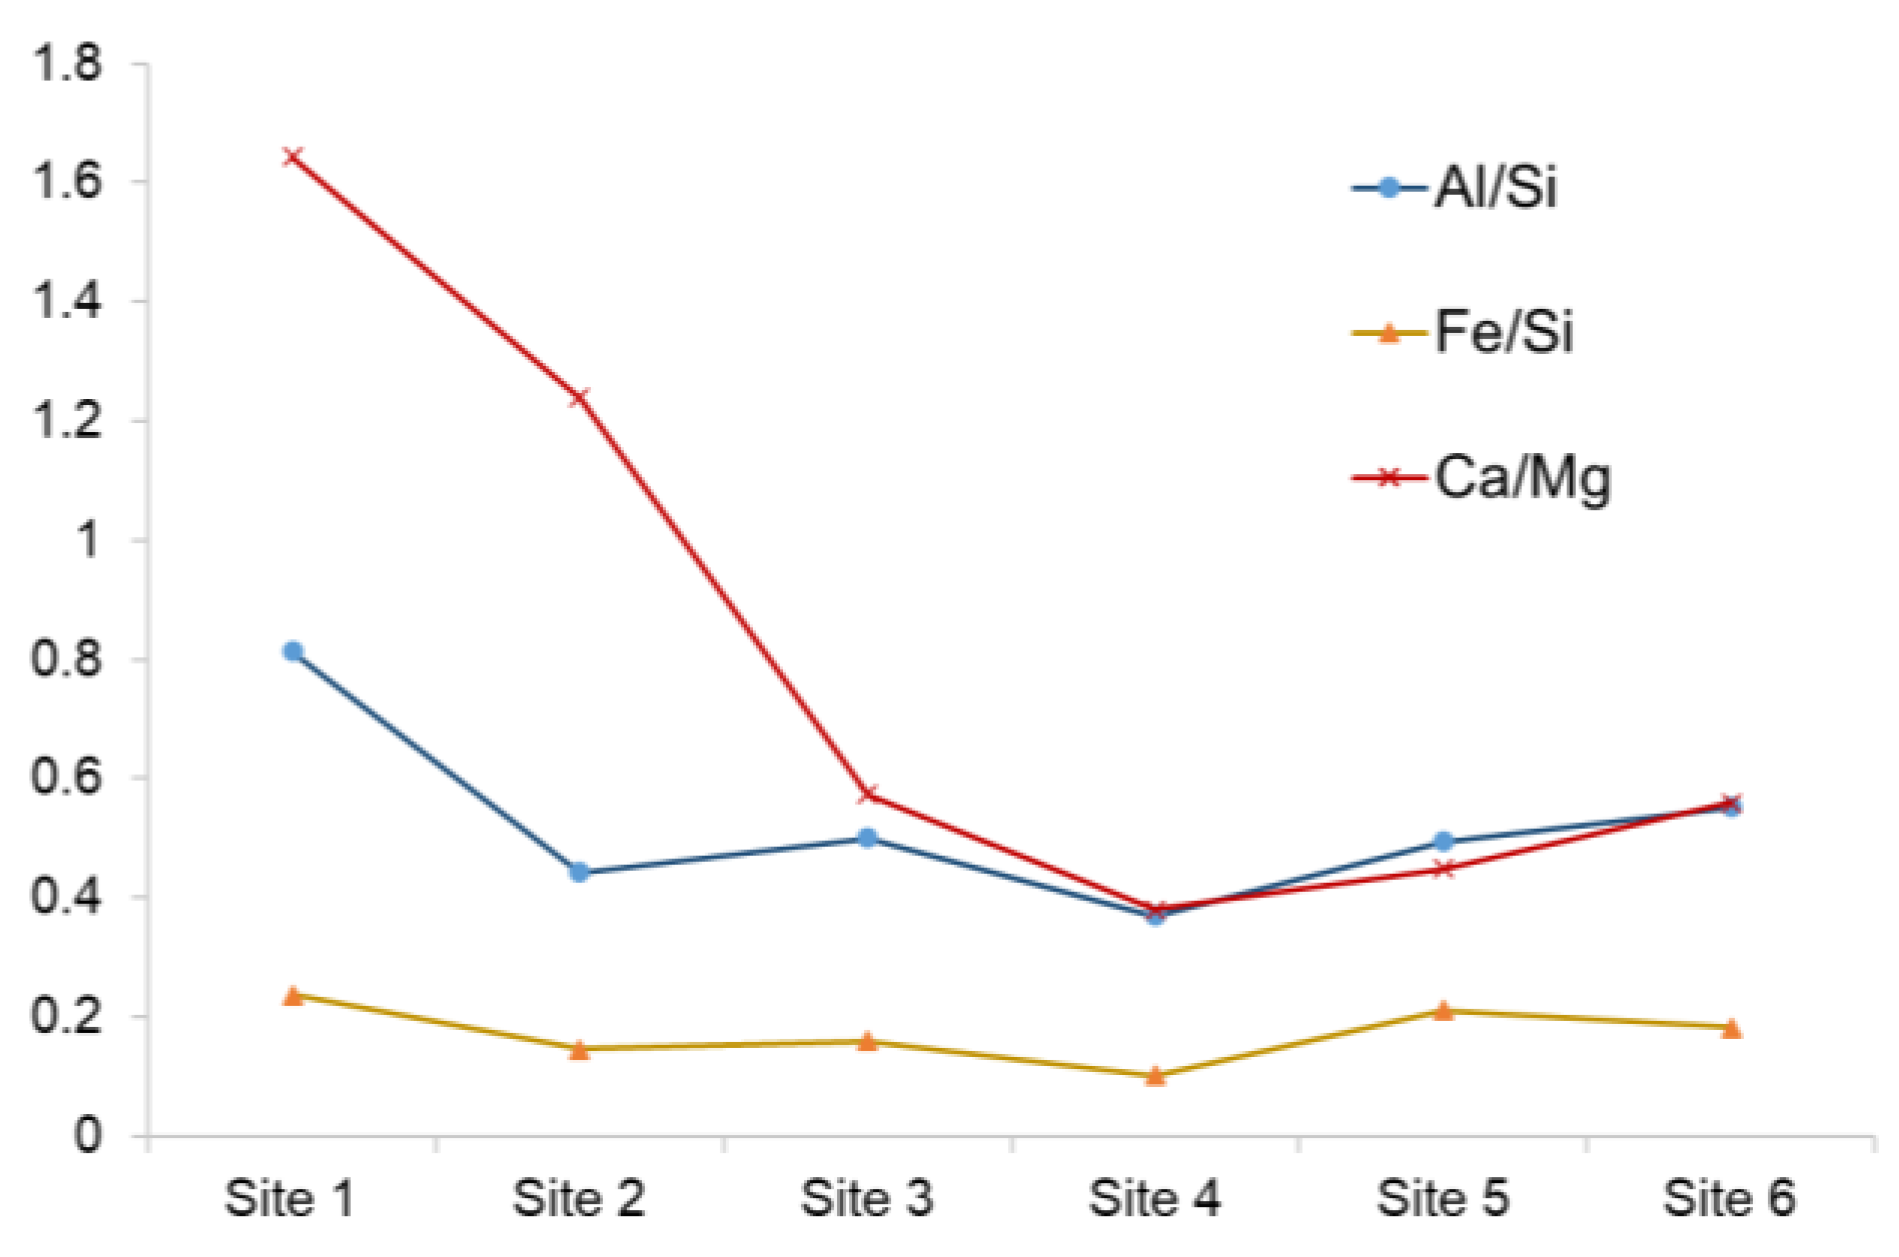
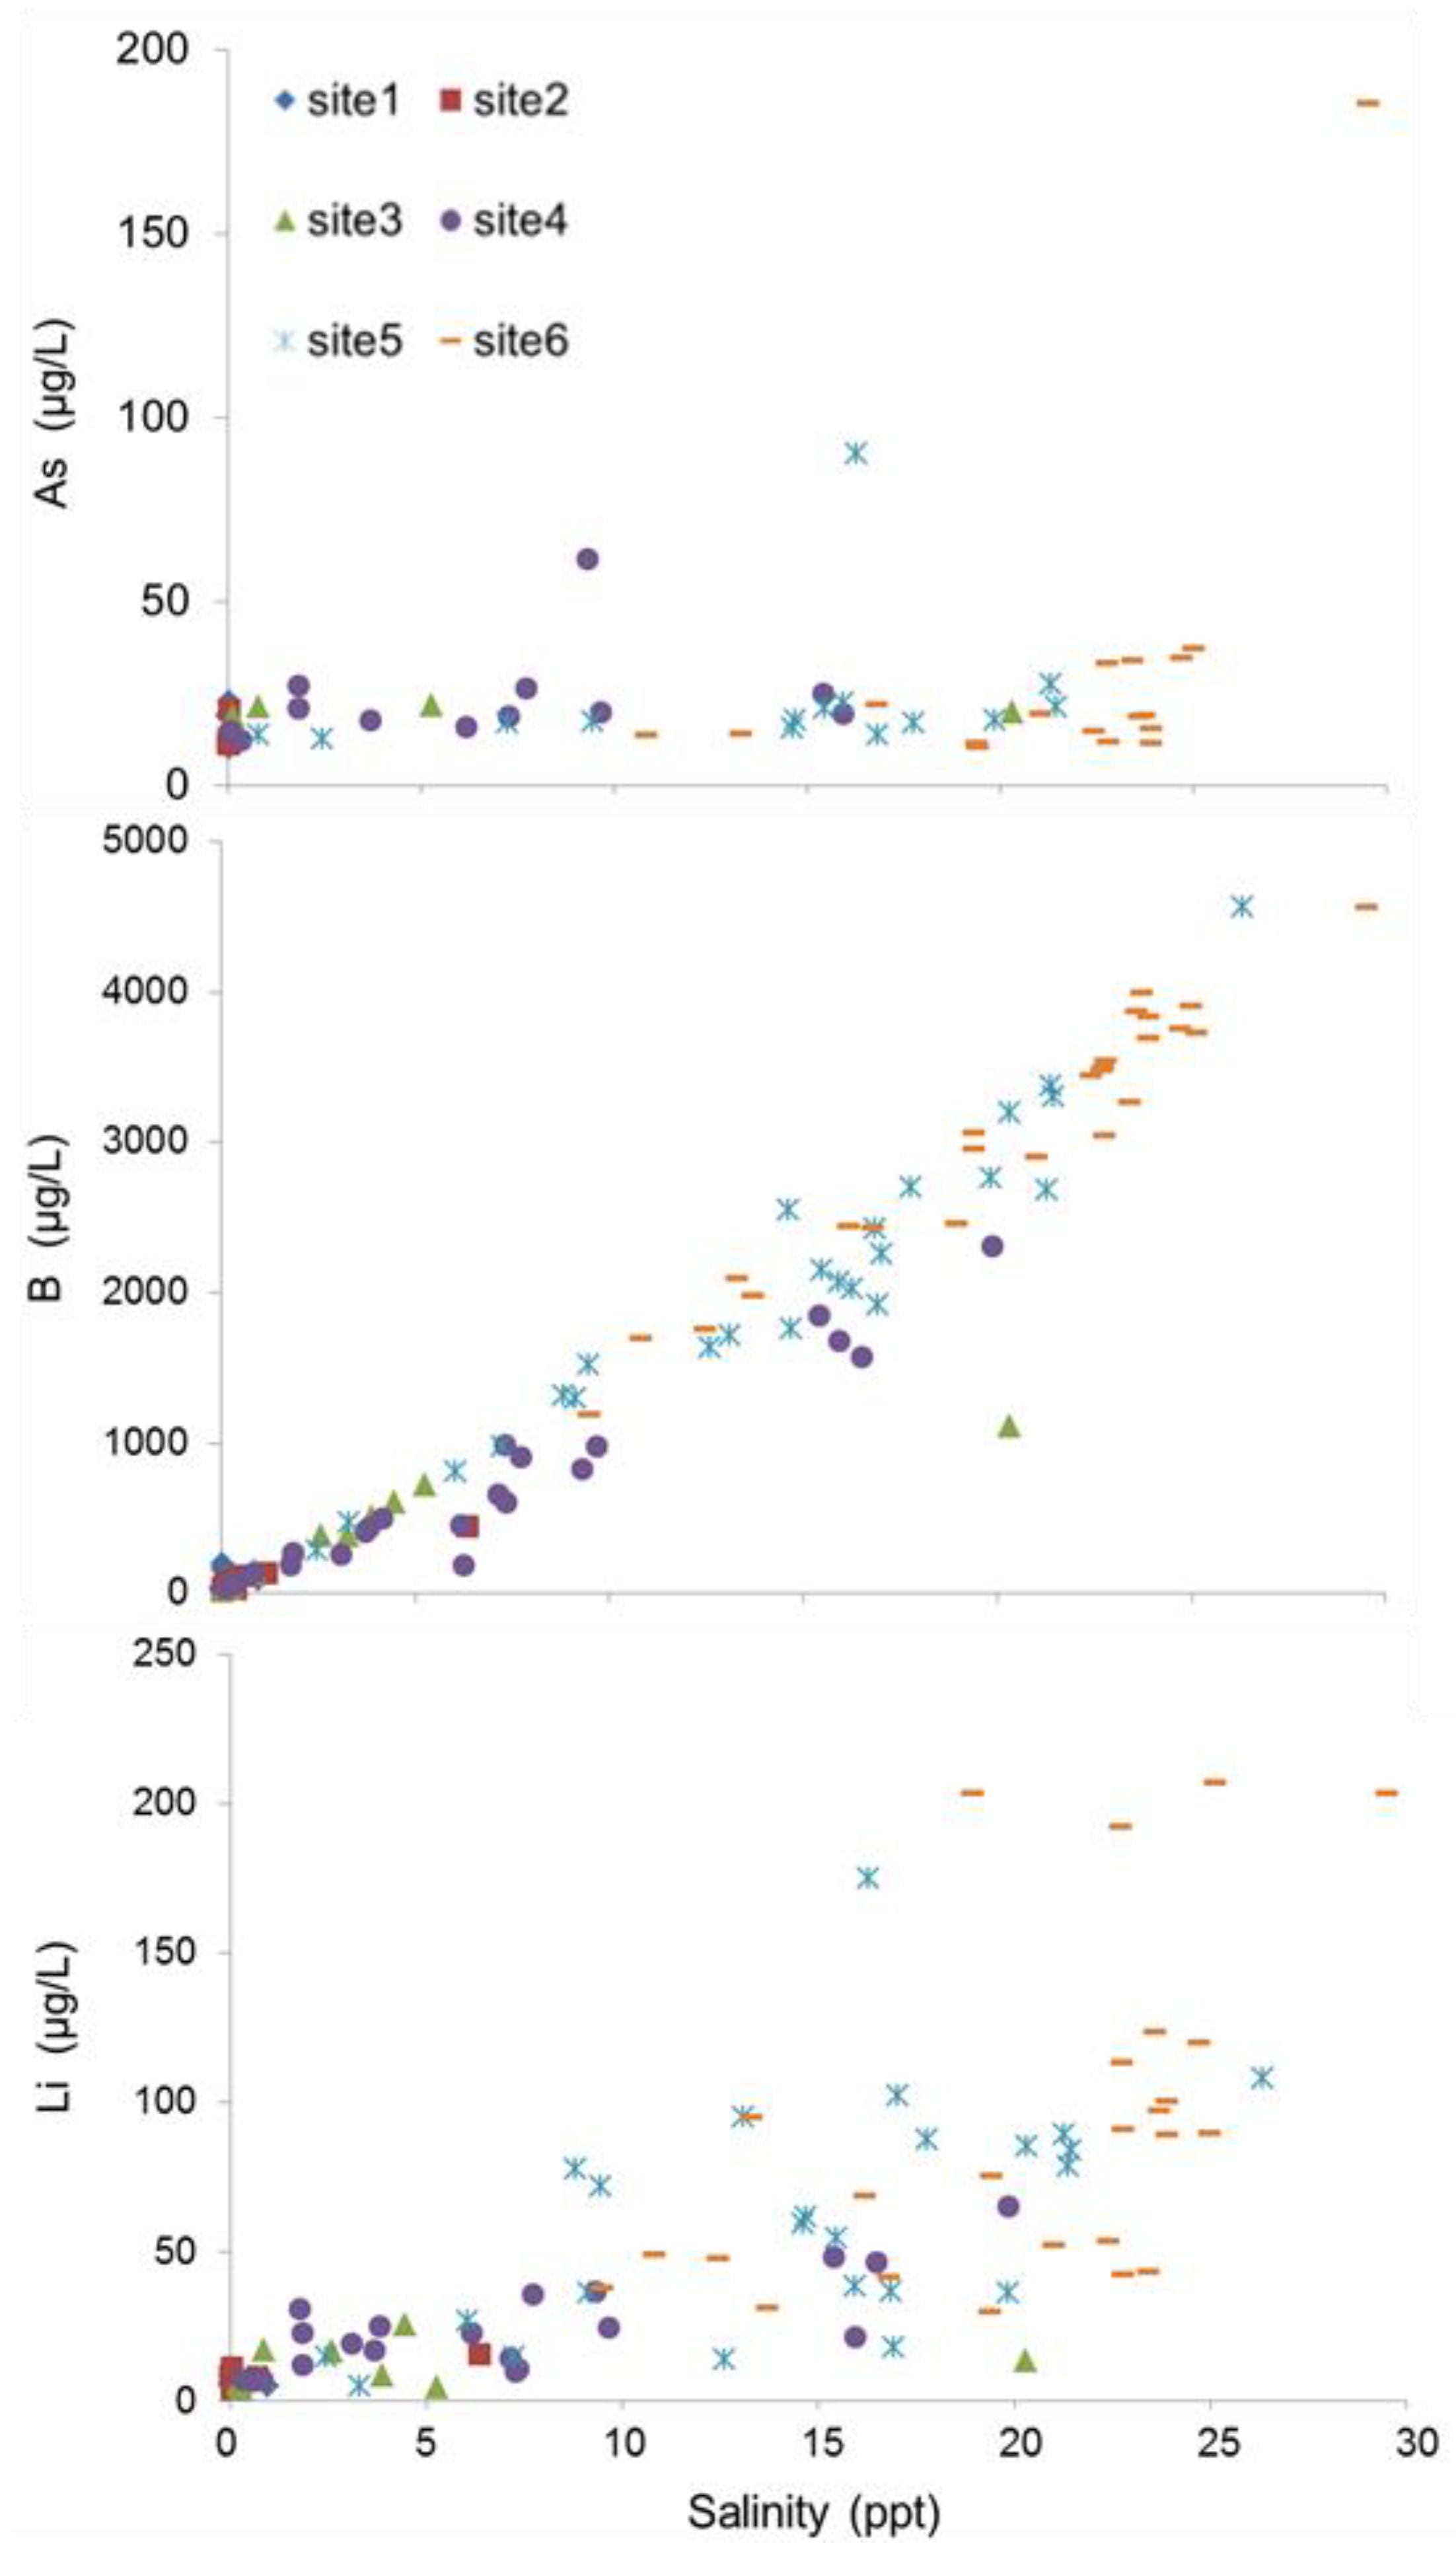
3.2. Spatial Variation in Metal Concentrations
3.3. Seasonal Variation in Metal Concentrations
3.4. Metal Loads and Transport
4. Discussion
4.1. Longitudinal and Seasonal Changes in Metal Concentration
4.2. Correlation between Metal Concentrations and Ambient Water Conditions
4.3. Environment Risk of Metals in the Calcasieu River
5. Conclusions
Author Contributions
Funding
Data Availability Statement
Acknowledgments
Conflicts of Interest
References
- Ridgway, J.; Shimmield, G. Estuaries as Repositories of Historical Contamination and their Impact on Shelf Seas. Estuar. Coast. Shelf Sci. 2002, 55, 903–928. [Google Scholar] [CrossRef]
- Barletta, M.; Lima, A.R.; Costa, M.F. Distribution, sources and consequences of nutrients, persistent organic pollutants, metals and microplastics in South American estuaries. Sci. Total. Environ. 2019, 651, 1199–1218. [Google Scholar] [CrossRef]
- Kennish, M.J. Environmental threats and environmental future of estuaries. Environ. Conserv. 2002, 29, 78–107. [Google Scholar] [CrossRef]
- Williams, T.; Bubb, J.; Lester, J. Metal accumulation within salt marsh environments: A review. Mar. Pollut. Bull. 1994, 28, 277–290. [Google Scholar] [CrossRef]
- Barbee, N.C.; Ganio, K.; Swearer, S.E. Integrating multiple bioassays to detect and assess impacts of sublethal exposure to metal mixtures in an estuarine fish. Aquat. Toxicol. 2014, 152, 244–255. [Google Scholar] [CrossRef] [PubMed]
- Moore, D.R.; Sample, B.E.; Suter, G.W.; Parkhurst, B.R.; Teed, R.S. A probabilistic risk assessment of the effects of methylmercury and PCBs on mink and kingfishers along East Fork Poplar Creek, Oak Ridge, Tennessee, USA. Environ. Toxicol. Chem. Int. J. 1999, 18, 2941–2953. [Google Scholar] [CrossRef]
- MacDonald, D.D.; Moore, D.R.J.; Ingersoll, C.G.; Smorong, D.E.; Carr, R.S.; Gouguet, R.; Charters, D.; Wilson, D.; Harris, T.; Rauscher, J.; et al. Baseline Ecological Risk Assessment of the Calcasieu Estuary, Louisiana: Part 1. Overview and Problem Formulation. Arch. Environ. Contam. Toxicol. 2011, 61, 1–13. [Google Scholar] [CrossRef]
- Macdonald, D.D.; Ingersoll, C.G.; Smorong, D.E.; Sinclair, J.A.; Lindskoog, R.; Wang, N.; Severn, C.; Gouguet, R.; Meyer, J.; Field, J. Baseline Ecological Risk Assessment of the Calcasieu Estuary, Louisiana: Part 2. An Evaluation of the Predictive Ability of Effects-Based Sediment-Quality Guidelines. Arch. Environ. Contam. Toxicol. 2011, 61, 14–28. [Google Scholar] [CrossRef]
- Birch, G.; Drage, D.; Thompson, K.; Eaglesham, G.; Mueller, J. Emerging contaminants (pharmaceuticals, personal care products, a food additive and pesticides) in waters of Sydney estuary, Australia. Mar. Pollut. Bull. 2015, 97, 56–66. [Google Scholar] [CrossRef]
- Dorado, S.; Booe, T.; Steichen, J.; McInnes, A.S.; Windham, R.; Shepard, A.; Lucchese, A.E.B.; Preischel, H.; Pinckney, J.; Davis, S.E.; et al. Towards an Understanding of the Interactions between Freshwater Inflows and Phytoplankton Communities in a Subtropical Estuary in the Gulf of Mexico. PLoS ONE 2015, 10, e0130931. [Google Scholar] [CrossRef]
- Scavia, D.; Justic, D.; Bierman, V.J. Reducing hypoxia in the Gulf of Mexico: Advice from three models. Estuaries 2004, 27, 419–425. [Google Scholar] [CrossRef]
- Luís, L.G.; Ferreira, P.; Fonte, E.; Oliveira, M.; Guilhermino, L. Does the presence of microplastics influence the acute toxicity of chromium(VI) to early juveniles of the common goby (Pomatoschistus microps)? A study with juveniles from two wild estuarine populations. Aquat. Toxicol. 2015, 164, 163–174. [Google Scholar] [CrossRef] [PubMed]
- Pinto, A.B.; Pagnocca, F.C.; Pinheiro, M.A.A.; Fontes, R.F.C.; de Oliveira, A.J.F.C. Heavy metals and TPH effects on microbial abundance and diversity in two estuarine areas of the southern-central coast of São Paulo State, Brazil. Mar. Pollut. Bull. 2015, 96, 410–417. [Google Scholar] [CrossRef] [PubMed]
- Geselbracht, L.L.; Freeman, K.; Birch, A.P.; Brenner, J.; Gordon, D.R. Modeled Sea Level Rise Impacts on Coastal Ecosystems at Six Major Estuaries on Florida’s Gulf Coast: Implications for Adaptation Planning. PLoS ONE 2015, 10, e0132079. [Google Scholar] [CrossRef] [PubMed] [Green Version]
- Yang, Z.; Wang, T.; Voisin, N.; Copping, A. Estuarine response to river flow and sea-level rise under future climate change and human development. Estuar. Coast. Shelf Sci. 2015, 156, 19–30. [Google Scholar] [CrossRef]
- Turner, A. Trace-metal partitioning in estuaries: Importance of salinity and particle concentration. Mar. Chem. 1996, 54, 27–39. [Google Scholar] [CrossRef]
- Du Laing, G.; Rinklebe, J.; Vandecasteele, B.; Meers, E.; Tack, F. Trace metal behaviour in estuarine and riverine floodplain soils and sediments: A review. Sci. Total. Environ. 2009, 407, 3972–3985. [Google Scholar] [CrossRef]
- LDWF (Louisiana Department of Wildlife and Fisheries). Partt VI A—Waterbody Management Plan Series—Calcasieu River, Louisiana. 2012. Available online: http://184.106.97.89/sites/default/files/calcasieu_river_mp-a_12-13-12.pdf (accessed on 13 March 2016).
- Mueller, C.S.; Ramelow, G.J.; Beck, J.N. Mercury in the Calcasieu River/Lake Complex, Louisiana. Bull. Environ. Contam. Toxicol. 1989, 42-42, 71–80. [Google Scholar] [CrossRef]
- Gaston, G.R.; Nasci, J.C. Trophic Structure of Macrobenthic Communities in the Calcasieu Estuary, Louisiana. Estuaries 1988, 11, 201–211. [Google Scholar] [CrossRef]
- Gaston, G.R.; Brown, S.S.; Rakocinski, C.F.; Heard, R.W.; Summers, J.K. Trophic structure of macrobenthic communities in northern Gulf of Mexico estuaries. Gulf Caribb. Res. 1995, 9, 111–116. [Google Scholar] [CrossRef] [Green Version]
- Gaston, G.R.; Lee, D.L.; Nasci, J.C. Estuarine Macrobenthos in Calcasieu Lake, Louisiana: Community and Trophic Structure. Estuaries 1988, 11, 192–200. [Google Scholar] [CrossRef]
- Beck, J.N.; Ramelow, G.J.; Thompson, R.S.; Mueller, C.S.; Webre, C.L.; Young, J.C.; Langley, M.P. Heavy metal content of sediments in the Calcasieu River/Lake Complex, Louisiana. Hydrobiologia 1990, 192, 149–165. [Google Scholar] [CrossRef]
- Byrne, R.H. Calcium carbonate saturation states in the world’s oceans. Annu. Rev. Mar. Sci. 1995, 6, 221–246. [Google Scholar]
- Gordon, A.L.; Kleinberg, R.L. Calcium, magnesium, and the cycle of oceanic deep circulation. J. Geophys. Res. Ocean 1983, 88, 647–659. [Google Scholar]
- Lee, J.H.; Kim, G.; Kim, K.R. Boron in natural and engineered aquatic systems: Speciation and its impact on biota—A review. Water Res. 2016, 100, 58–74. [Google Scholar]
- Tomascak, P.B.; Bohlke, J.K.; Gehrels, G.E. Using Li isotopes to trace water-rock interactions, evaluate sources of solutes, and assess contamination in granitoid aquifers, New Hampshire, USA. Geo-Chim. Cosmochim. Acta 2004, 68, 3601–3620. [Google Scholar]
- Pogge von Strandmann, P.A.; James, R.H.; Van Calsteren, P.; Gíslason, S.R.; Burton, K.W.; Mokadem, F. Lithium, magnesium and calcium isotopes in Icelandic basaltic systems: Fractionation and tracing of mantle processes. Geochim. Cosmochim. Acta 2017, 202, 283–302. [Google Scholar]
- Han, A.; Dai, M.; Kao, S.-J.; Gan, J.; Li, Q.; Wang, L.; Zhai, W.; Wang, L. Nutrient dynamics and biological consumption in a large continental shelf system under the influence of both a river plume and coastal upwelling. Limnol. Oceanogr. 2012, 57, 486–502. [Google Scholar] [CrossRef] [Green Version]
- Forsido, T.T.; McCrindle, R.I.; Maree, J.; Monyatsi, L. Removal of Al, Ba and Mg from industrial wastewater using EAFDS and lime. Appl. Water Sci. 2020, 10, 1–7. [Google Scholar] [CrossRef]
- Sudaryanto; Naily, W. Ratio of Major Ions in Groundwater to Determine Saltwater Intrusion in Coastal Areas. IOP Conf. Ser. Earth Environ. Sci. 2018, 118, 012021. [Google Scholar] [CrossRef] [Green Version]
- Ball, J.W.; Runkel, R.L.; Nordstrom, D.K. Evaluating remedial alternatives for the Alamosa River and Wightman Fork, near the Summitville Mine, Colorado: Application of a reactive-transport model to low- and high-flow simulations. In Environmental Sciences and Environmental Computing; Zannetti, P., Ed.; The EnviroComp Institute: Fremont, CA, USA, 2004; Volume 11, Chapter 3; Available online: http://www.envirocomp.org (accessed on 3 March 2023).
- Brick, C.M.; Moore, J.N. Diel Variation of Trace Metals in the Upper Clark Fork River, Montana. Environ. Sci. Technol. 1996, 30, 1953–1960. [Google Scholar] [CrossRef]
- Jiann, K.-T.; Santschi, P.H.; Presley, B.J. Relationships Between Geochemical Parameters (pH, DOC, SPM, EDTA Concentrations) and Trace Metal (Cd, Co, Cu, Fe, Mn, Ni, Pb, Zn) Concentrations in River Waters of Texas (USA). Aquat. Geochem. 2013, 19, 173–193. [Google Scholar] [CrossRef]
- Keim, B.D.; Faiers, G.E.; Muller, R.A.; Grymes, J.M., III; Rohli, R.V. Long-term trends of precipitation and runoff in Louisiana, USA. Int. J. Climatol. 1995, 15, 531–541. [Google Scholar] [CrossRef]
- Mahowald, N.M.; Baker, A.R.; Bergametti, G.; Brooks, N.; Duce, R.A.; Jickells, T.D.; Kubilay, N.; Prospero, J.; Tegen, I. Atmospheric global dust cycle and iron inputs to the ocean. Glob. Biogeochem. Cycles 2005, 19, GB4025. [Google Scholar] [CrossRef]
- Burton, K.W.; Vigier, N. Lithium Isotopes as Tracers in Marine and Terrestrial Environments. In Handbook of Environmental Isotope Geochemistry. Advances in Isotope Geochemistry; Springer: Berlin/Heidelberg, Germany, 2012; pp. 41–59. [Google Scholar] [CrossRef]
- Gaillardet, J.; Viers, J.; Dupré, B. Trace elements in river waters. Treatise Geochem. 2003, 5, 605. [Google Scholar]
- Marchand, L.; Mench, M.; Jacob, D.; Otte, M. Metal and metalloid removal in constructed wetlands, with emphasis on the importance of plants and standardized measurements: A review. Environ. Pollut. 2010, 158, 3447–3461. [Google Scholar] [CrossRef]
- Olivie-Lauquet, G.; Gruau, G.; Dia, A.; Riou, C.; Jaffrezic, A.; Henin, O. Release of trace elements in wetlands: Role of seasonal variability. Water Res. 2001, 35, 943–952. [Google Scholar] [CrossRef]
- Shiller, A. Dissolved trace elements in the Mississippi River: Seasonal, interannual, and decadal variability. Geochim. Cosmochim. Acta 1997, 61, 4321–4330. [Google Scholar] [CrossRef]
- Pontér, C.; Ingri, J.; Boström, K. Geochemistry of manganese in the Kalix River, northern Sweden. Geochim. Cosmochim. Acta 1992, 56, 1485–1494. [Google Scholar] [CrossRef]
- EPA-822-R-02-047; National Recommended Water Quality Criteria. US EPA (United States Environmental Protection Agency), Office of Science and Technology: Washington, DC, USA, 2010.
- EPA 440/5-86-001; Quality Criteria for Water. US EPA (United States Environmental Protection Agency), Office of Science and Technology: Washington, DC, USA, 1986.
- Bhattarai, S. Spatial Distribution of Heavy Metals in Louisiana Sediments and Study of Factors Impacting the Concentrations. Master’s Thesis, Louisiana State University and Agricultural & Mechanical College, Baton Rouge, LA, USA, 2006. [Google Scholar]
- McKee, J.E.; Wolf, H.W. Water Quality Criteria; Report for Jul 60–Feb 63 (No. PB-82-188244; PUB-3-A); California Institute of Technology: Pasadena, CA, USA, 1963. [Google Scholar]
- Yang, Z.; Xia, X.; Wang, Y.; Ji, J.; Wang, D.; Hou, Q.; Yu, T. Dissolved and particulate partitioning of trace elements and their spatial–temporal distribution in the Changjiang River. J. Geochem. Explor. 2014, 145, 114–123. [Google Scholar] [CrossRef]
- Jia, Z.; Li, S.; Liu, Q.; Jiang, F.; Hu, J. Distribution and partitioning of heavy metals in water and sediments of a typical estuary (Modaomen, South China): The effect of water density stratification associated with salinity. Environ. Pollut. 2021, 287, 117277. [Google Scholar] [CrossRef] [PubMed]


| Site ID | River Distance from Gulf (km) | Temperature (°C) | Salinity (ppt) | pH | DO (%) | TSS (mg/L) |
|---|---|---|---|---|---|---|
| Site 1 | 87.9 | 21.58 | 0.07 ± 0.18 a | 6.34 ± 0.92 a | 58.0 ± 19.2 a | 17 ± 7 a |
| Site 2 | 73.5 | 21.83 | 0.40 ± 1.24 a | 6.13 ± 1.03 a | 51.2 ± 20.1 a | 15 ± 131 a |
| Site 3 | 62.6 | 22.88 | 3.02 ± 5.30 ab | 6.48 ± 0.62 a | 51.2 ± 23.8 a | 19 ± 16 a |
| Site 4 | 58.1 | 22.14 | 5.83 ± 5.71 b | 6.61 ± 0.91 a | 57.3 ± 20.7 a | 14 ± 7 a |
| Site 5 | 27.0 | 22.51 | 13.96 ± 6.60 c | 7.47 ± 0.59 b | 81.3 ± 20.3 b | 34 ± 23 b |
| Site 6 | 4.5 | 22.81 | 19.71 ± 5.87 d | 8.14 ± 0.68 b | 96.4 ± 21.2 c | 68 ± 43 c |
| Al | As | B | Fe | Li | Mn | Ti | Zn | Temperature | Salinity | pH | DO% | TSS | Discharge | |
|---|---|---|---|---|---|---|---|---|---|---|---|---|---|---|
| Al | 1.00 | 0.60 | 0.56 | −0.22 | −0.28 | −0.38 | 0.24 | 0.41 | ||||||
| As | 1.00 | 0.61 | ||||||||||||
| B | 1.00 | 0.78 | −0.38 | 0.98 | 0.72 | 0.56 | 0.50 | |||||||
| Fe | 1.00 | 0.39 | −0.26 | 0.35 | 0.36 | |||||||||
| Li | 1.00 | 0.35 | 0.78 | 0.58 | 0.41 | 0.42 | ||||||||
| Mn | 1.00 | 0.48 | −0.31 | −0.61 | ||||||||||
| Ti | 1.00 | 0.56 | ||||||||||||
| Zn | 1.00 | 0.37 | ||||||||||||
| Temperature | 1.00 | 0.29 | −0.55 | −0.28 | ||||||||||
| Salinity | 1.00 | 0.73 | 0.52 | 0.44 | −0.26 | |||||||||
| pH | 1.00 | 0.35 | 0.37 | −0.33 | ||||||||||
| DO% | 1.00 | 0.25 | ||||||||||||
| TSS | 1.00 | |||||||||||||
| Discharge | 1.00 |
| Site ID | Al | As | B | Ca | Fe | Li | Mg | Mn | Si | Ti | Zn |
|---|---|---|---|---|---|---|---|---|---|---|---|
| (mg/L) | (μg/L) | (μg/L) | (mg/L) | (μg/L) | (μg/L) | (mg/L) | (μg/L) | (mg/L) | (μg/L) | (μg/L) | |
| Site 1 | 4 ± 3 a | 16 ± 5 | 50 ± 50 a | 5 ± 6 | 2170 ± 1010 | 6 ± 2 a | 2 ± 4 | 130 ± 60 | 8 ± 4 | 34 ± 31 | 27 ± 47 |
| Site 2 | 3 ± 2 ab | 14 ± 5 | 70 ± 90 a | 9 ± 20 | 1930 ± 840 | 7 ± 3 a | 12 ± 37 | 130 ± 80 | 7 ± 2 | 26 ± 24 | 19 ± 11 |
| Site 3 | 2 ± 1 b | 19 ± 3 | 320 ± 340 a | 27 ± 26 | 1400 ± 670 | 11 ± 7 a | 68 ± 84 | 130 ± 60 | 5 ± 2 | 25 ± 21 | 17 ± 3 |
| Site 4 | 2 ± 1 b | 23 ± 13 | 640 ± 620 a | 43 ± 48 | 1090 ± 780 | 24 ± 16 a | 122 ± 134 | 120 ± 50 | 5 ± 2 | 22 ± 18 | 18 ± 5 |
| Site 5 | 2 ± 2 b | 23 ± 20 | 2070 ± 990 b | 184 ± 175 | 1430 ± 2310 | 61 ± 40 b | 444 ± 261 | 90 ± 50 | 4 ± 3 | 22 ± 20 | 18 ± 6 |
| Site 6 | 3 ± 2 b | 30 ± 41 | 3070 ± 850 c | 328 ± 377 | 1630 ± 1240 | 92 ± 56 c | 627 ± 308 | 80 ± 50 | 5 ± 4 | 44 ± 59 | 22 ± 14 |
| Parameter | Mass Loads (t yr−1) | Flux (kg km−2 yr−1) | Proportion (%) |
|---|---|---|---|
| Al | 5985 | 1359 | 22.93 |
| B | 40 | 9 | 0.15 |
| Ca | 4876 | 1107 | 18.68 |
| Fe | 3163 | 718 | 12.12 |
| Mg | 1907 | 433 | 7.31 |
| Mn | 165 | 37 | 0.63 |
| Si | 9909 | 2251 | 37.97 |
| Ti | 55 | 12 | 0.21 |
| Total | 26,100 | 5928 | 100 |
| PCA Factor | |||
|---|---|---|---|
| Variable | 1 (33.4%) | 2 (20.1%) | 3 (13.7%) |
| Temperature | −0.16 | 0.62 | |
| Salinity | 0.43 | 0.14 | |
| pH | 0.35 | 0.29 | |
| DO% | 0.25 | 0.23 | −0.43 |
| TSS | 0.13 | 0.46 | 0.25 |
| Discharge | −0.21 | 0.26 | −0.12 |
| Al | −0.24 | 0.39 | |
| As | 0.24 | ||
| B | 0.43 | 0.17 | |
| Fe | −0.19 | 0.36 | 0.12 |
| Li | 0.38 | 0.15 | |
| Mn | −0.23 | 0.44 | |
| Ti | −0.12 | 0.44 | |
| Zn | −0.15 | 0.29 | 0.23 |
Disclaimer/Publisher’s Note: The statements, opinions and data contained in all publications are solely those of the individual author(s) and contributor(s) and not of MDPI and/or the editor(s). MDPI and/or the editor(s) disclaim responsibility for any injury to people or property resulting from any ideas, methods, instructions or products referred to in the content. |
© 2023 by the authors. Licensee MDPI, Basel, Switzerland. This article is an open access article distributed under the terms and conditions of the Creative Commons Attribution (CC BY) license (https://creativecommons.org/licenses/by/4.0/).
Share and Cite
Wu, Z.; He, S.; Xu, Y.-J. Metal Transport in the Mixing Zone of an Estuarine River to the Northern Gulf of Mexico. Water 2023, 15, 2229. https://doi.org/10.3390/w15122229
Wu Z, He S, Xu Y-J. Metal Transport in the Mixing Zone of an Estuarine River to the Northern Gulf of Mexico. Water. 2023; 15(12):2229. https://doi.org/10.3390/w15122229
Chicago/Turabian StyleWu, Zhenwei, Songjie He, and Yi-Jun Xu. 2023. "Metal Transport in the Mixing Zone of an Estuarine River to the Northern Gulf of Mexico" Water 15, no. 12: 2229. https://doi.org/10.3390/w15122229