Article

Evaluation of Urban Flood Governance Efficiency Based on the Data Envelopment Analysis Model and Malmquist Index: Evidence from 30 Provincial Capitals in China

1
School of Public Administration, Xi’an University of Architecture and Technology, Xi’an 710055, China
2
School of Management, Xi’an University of Architecture and Technology, Xi’an 710055, China
*
Author to whom correspondence should be addressed.
Water 2023, 15(14), 2513; https://doi.org/10.3390/w15142513
Submission received: 18 May 2023 / Revised: 30 June 2023 / Accepted: 7 July 2023 / Published: 9 July 2023
(This article belongs to the Section Hydrology)

Abstract

:
Urban flooding disasters endanger people’s lives and property while causing significant economic damage to cities. To further improve the efficiency of urban flooding governance and promote the optimal allocation of resources, this article selects the number of people in flood control, medical and health security, financial expenditure on flood control, affected population, and direct economic loss as evaluation indicators from the input–output perspective; it measures the efficiency of urban flooding governance in 30 provincial capitals in China from 2012 to 2021 using the DEA model and Malmquist index method and identifies the key factors affecting the efficiency of urban flooding governance. The research results show that in 2021, the average value of the comprehensive technical efficiency of flood disaster governance in 30 provincial capitals in China was 0.408, the development trend was not optimistic, and the constraint factor was scale efficiency. The interannual average value of the total factor productivity index of urban flood disaster governance from 2012 to 2021 was 0.976, and the overall trend was decreasing year by year, during which some cities were able to achieve a yearly increase in governance efficiency, but most cities still faced a severe situation in flood disaster governance. The total factor productivity index varied enormously across towns with the variation in annual precipitation; the greater the annual precipitation, the greater the total factor productivity index of urban flooding disaster governance in the urban agglomerations, and the comprehensive technical efficiency change was consistent with its trend change. This consistency has a positive contribution to the total factor productivity index of urban flooding disaster governance.

1. Introduction

Urban flooding is caused by heavy or continuous precipitation exceeding the city’s drainage capacity, resulting in waterlogging disasters in the city. According to the relevant data from the Ministry of Water Resources, on average, more than 180 cities are affected by urban flooding in China every year. In June 2022, Guilin, Guangxi, was affected by persistent heavy rainfall, and severe urban flooding occurred. In July, parts of Sichuan Province suffered from multiple rounds of heavy rainfall, causing different degrees of internal flooding in 13 cities, such as Mianyang, Aba and Ya’an. In August, heavy rainfall occurred in central and southeastern Liaoning Province, triggering secondary disasters such as urban flooding, causing 549,000 people to be affected in nine cities, including Jinzhou, Fuxin and Panjin, with direct economic losses of CNY 7.6 billion. Urban flooding concerns people’s lives and property safety. As a core area of regional economic development and a population center, once an urban flooding disaster occurs, normal production activities and people’s lives are greatly affected.
General Secretary Xi Jinping noted that the governance of waterlogging is a crucial task to ensure the safe development of cities. The governance of urban flooding is both a major livelihood project and a significant development project. The Party and the State attach great importance to the governance of urban flooding and have issued many relevant policy documents, such as “Implementation Opinions on Strengthening the Governance of Urban Flooding”, to guide the governance of urban flooding disasters; these policies aim to further promote the governance of urban flooding disasters, improve the capacity of urban drainage and flood prevention, and make every effort to avoid casualties. In recent years, various regions and departments in China have vigorously promoted the construction of urban drainage and flood control facilities, and positive progress has been made in urban flood control. However, many problems still exist, such as insufficient natural storage space, lagging construction of drainage facilities, and weak emergency management capacity [1]. In 2021, Zhengzhou, Henan Province, was severely flooded because of the “7–20” heavy rainstorm disaster, and the leading cadres of the municipal government, relevant districts, counties (cities), and departments were exposed to being insufficiently prepared and poorly organized; thus, they were improperly handled in the process of dealing with the disaster [2].
In the face of natural disasters and “man-made disasters”, improving the efficiency of urban flooding disaster governance is important so that human, material and financial resources can play a more accurate and efficient role in the process of urban flooding disaster governance; moreover, improving the efficiency of urban flooding disaster governance would minimize the casualties and property damage caused by urban flooding disasters and, therefore, constitutes the key to promoting urban flooding governance work. The evaluation of urban flooding disaster governance efficiency is a prerequisite for improving such efficiency, providing a scientific basis for proposing targeted optimization strategies, and is of great significance for further improving urban flooding disaster prevention and mitigation capacity and strengthening urban lifeline construction.
At present, research on urban flooding hazards is mainly concentrated in the disciplines of building science and engineering, water and hydropower engineering, meteorology, environmental science and resource utilization, and the research content is mostly carried out in two aspects of urban flooding hazard risk warning [3,4] and assessment [5]. Urban flooding risk warning is mainly based on refined flood models of hydraulics, integrated observations and two-dimensional nonconstant flow dynamics models to simulate the flow process of water in rivers and underground pipe networks [6,7]. The above study provides data support to realize the identification and early warning of urban flooding hazards and further promotes the establishment of urban flooding meteorological risk monitoring and warning systems. There are numerous research perspectives and diverse research methods for urban flooding risk assessment. Common research perspectives in current studies include different land types [8], vulnerability exposure [9], scenario simulation with multisource data [10], and pedestrian safety [11]. Urban flooding risk assessment methods include GIS spatial analysis modeling techniques [12], information diffusion techniques, hydraulic drainage models, XGBoost [13], and hierarchical gray correlation analysis methods. By using different research perspectives and methods, many researchers have assessed the risk level of urban flooding, which in turn provides scientific support for the formulation of urban flood management policies and emergency plans and provides information guarantees and decision support for urban disaster prevention and mitigation resource allocation and pre-disaster inspections.
Research on urban flooding within the management scope is mainly focused on constructing disaster prevention systems and prevention and control strategies. By analyzing the mechanism of urban flooding formation [14] and the characteristics of underground space flooding [15], we explore the disaster-causing factors [16], construct a disaster prevention system [17], and propose corresponding prevention and control countermeasures. There are studies based on multi-wisdom technology support, carrying out multi-scenario simulations based on runoff control indexes [18] and using the sponge city concept [19]; such studies build an urban flood control system and formulate low-impact development flood remediation plans [20,21,22]. However, the process of urban flooding disaster prevention and mitigation also faces many governance dilemmas, such as infinite urban sprawl, persistent information silos [23], and fragmentation of policy formulation and implementation [24]. The response strategies for the above problems are mainly developed from two aspects. At the technical level, many researchers have introduced the concept of data governance to propose intelligent construction of pipe networks [25] and efficient data sharing [26] to cope with flooding disasters. At the management level, some scholars have also adopted holistic governance theory to overcome the limitations of fragmented urban flood governance and then proposed urban flood governance paths and feasible strategies.
Currently, research on urban flooding at home and abroad is intense and rich, covering almost the whole process of urban flooding governance and undertaking aspects such as urban flooding risk warning, risk assessment, or the construction of disaster prevention systems and prevention and control strategies. However, few studies have looked back at the whole governance process after a disaster and evaluated the efficiency of urban flooding governance from the input and output perspectives. The evaluation of government governance efficiency serves as a crucial driver for establishing governance systems and modernizing governance capabilities. Currently, governance efficiency evaluation studies mainly focus on government departments, not only in terms of evaluating their overall governance efficiency [27] but also with respect to exploring the governance efficiency, constraints, and improvement strategies of each department considering specific aspects such as air pollution [28,29,30], regional ecological environment [31,32], rural livelihoods [33,34,35], and poverty [36,37,38].
Based on the above analysis, we find that current studies have paid less attention to the issue of urban flooding disaster management efficiency and rarely quantified the management efficiency of Chinese provincial capitals. Therefore, we consider 30 provincial capitals in China as the research object and first analyze the urban flooding governance efficiency of each provincial capital city in China from a static perspective using the DEA model. Then, using the Malmquist index, we observe the development of urban flooding disaster governance efficiency in provincial capital cities over the past 10 years and dynamically analyze the effect of government policy interventions in conjunction with the specific actions of government departments regarding urban flooding disaster management. Finally, based on the geographical differences in annual precipitation, the 30 provincial capitals in China are divided into three major urban clusters to observe the regional characteristics of urban flooding disaster governance efficiency. We expect to identify the key factors limiting the efficiency of urban flooding governance by analyzing the results of the evaluation of urban flooding governance to provide a scientific basis for the refined management of urban flooding during normal times and precise governance during disasters. The innovation of this paper is to evaluate the efficiency of urban flooding governance in 30 provincial capitals in China, identify the constraints, and then promote the development of urban flooding governance by “filling in the gaps”. In addition, although the research object of this article is limited to 30 provincial capitals in China, neighboring cities can improve their own flooding governance work by referring to the flooding governance strategies of provincial capitals, so this study has some practical significance.

2. Methods and Data

2.1. DEA Model

Data envelopment analysis (DEA) is a nonparametric technical efficiency analysis method based on relative comparisons among evaluated objects. It was first proposed by Charnes, Cooper and Rhodes in the United States in 1978, and it has special advantages in analyzing efficiency problems in multi-input and multioutput situations. DEA refers to the evaluated objects as decision-making units (DMUs), and each DMU must be comparable to be evaluated for relative efficiency. The model uses a linear programming approach to measure the input–output efficiency of each DMU and determines the production frontier surface by comparing the efficiency values. A DMU is said to be DEA effective, and its comprehensive technical efficiency (TE) value is 1 if it is on the production frontier; if it is not on the production frontier, a DMU is characterized as DEA ineffective, and its comprehensive technical efficiency value is greater than 0 and less than 1. DEA-ineffective DMUs need to determine their relative efficiency by calculating the ratio of projection points to ineffective points.
Charnes, Cooper, and Rhodes proposed the CCR model in 1978 to evaluate overall efficiency under the assumption of constant returns to scale (CRS), with the resulting technical efficiency including scale efficiency (SE). However, in the actual production process, DMUs adhere less often to the assumption of constant returns to scale or optimal scale production, so in 1984, Banker, Charnes and Cooper developed the BCC model based on the CCR model. The BCC model evaluates the efficiency of decision units based on variable returns to scale (VRS), and the model yields a comprehensive technical efficiency that excludes the effect of scale. China’s provincial capitals are affected by climate factors, geographical factors, etc., coupled with different levels of urban infrastructure construction and significant differences in the disaster prevention and mitigation capabilities of various government departments, so it is difficult to achieve constant returns to scale in the process of flooding disaster governance in each provincial capital city. Therefore, this article adopts the BCC model with variable returns to scale to statically evaluate the efficiency of urban flood governance by measuring the comprehensive technical efficiency (TE), pure technical efficiency (PTE) and scale efficiency of flood governance in 30 provincial capital cities in 2012 and 2021. The planning equation of the output-oriented BCC model can be presented as follows:
min ϕ ε ( i = 1 m s i + j = 1 n s j + ) s . t . { r = 1 s μ r x i r + s i = x i k r = 1 s μ r y j r s j + = ϕ y j k r = 1 s μ r = 1 ϕ , μ r , s i , s j + 0
In Equation (1), r DMUs are selected, and each DMU has m inputs and n outputs, x i r is the i -th input of the r -th decision unit, and y i r is the j -th input of the r-th decision unit where r = 1,2,..., s ; i = 1,2,..., m ; j = 1,2,..., n . ϕ is the comprehensive technical efficiency evaluation value of the DMU, ε is a non-Archimedean infinitesimal, and s i and s j + are input and output slack variables, respectively. When ϕ = 1 and s i = s j + = 0 , the decision unit is DEA strongly effective; when ϕ = 1, s i = 0 or s j + = 0, the decision unit is DEA weakly effective; and when ϕ < 1, the decision unit is DEA ineffective. The comprehensive technical efficiency in the BCC model can be further decomposed into pure technical efficiency and scale efficiency; when the DMU is DEA ineffective, the reasons for its DEA ineffectiveness can be explored by analyzing the pure technical efficiency and scale efficiency of the DMU, and on this basis, countermeasure suggestions can be made.

2.2. Malmquist Index

The DEA model uses cross-sectional data to simultaneously analyze the static efficiency values of each DMU, but this cannot reflect the changes in urban flooding disaster governance efficiency in China in recent years. Hence, the article introduces the Malmquist index, which is the total factor productivity (TFP) change index, to evaluate the efficiency of relevant government departments in China in the past 10 years based on panel data. The Malmquist index was first used to measure production efficiency, and then, Färe R et al. (1994) combined the Malmquist index with DEA to reflect the changes in the Malmquist index using comprehensive technical efficiency change (EC) and technological progress efficiency change (TC). Assuming that the input and output vectors for periods t and t + 1 are ( x t , y t ) and ( x t + 1 , y t + 1 ), respectively, and the output functions are E t and E t + 1 , respectively, then the Malmquist index expression for periods t to t + 1 can be expressed as follows:
M ( x t + 1 , y t + 1 , x t , y t ) = [ E t ( x t + 1 , y t + 1 ) E t ( x t , y t ) × E t + 1 ( x t + 1 , y t + 1 ) E t + 1 ( x t , y t ) ] 1 2
In Equation (2), E t ( x t , y t ) and E t + 1 ( x t + 1 , y t + 1 ) are the technical efficiency values of the DMU in the two periods. If M > 1, it indicates that total factor productivity has increased from period t to t + 1; if M = 1, it suggests that total factor productivity has remained unchanged from period t to t + 1; if M < 1, it indicates that total factor productivity has decreased from period t to t + 1. Furthermore, the Malmquist index is the product of the comprehensive technical efficiency change index and the technological progress efficiency change index, and its expression is as follows:
M ( x t + 1 , y t + 1 , x t , y t ) = E C × T C E C = E t + 1 ( x t + 1 , y t + 1 ) E t ( x t , y t ) T C = [ E t ( x t , y t ) E t + 1 ( x t , y t ) × E t ( x t + 1 , y t + 1 ) E t + 1 ( x t + 1 , y t + 1 ) ] 1 2
In Equation (3), if E C > 1, it means that the comprehensive technical efficiency of urban flooding disaster governance has increased from period t to t + 1; if E C = 1, it means that the comprehensive technical efficiency of urban flooding disaster governance has remained unchanged during this period; if E C < 1, it means that the comprehensive technical efficiency of urban flooding disaster governance has decreased from period t to t + 1. If T C > 1, it indicates that the technology applied in urban flooding disaster governance has progressed from period t to t + 1; if T C = 1, it indicates that the technology applied in urban flooding disaster governance has remained the same during the period; if T C < 1, it indicates that the technology applied in urban flooding disaster governance has declined from period t to t + 1.
To further clarify the specific meaning of the main notations in the text, we summarize the abbreviations of the proper nouns involved in the DEA model and Malmquist index, as shown in Table 1.

2.3. Evaluation Indicators

The article studies the efficiency of urban flooding disaster governance, and based on the principles of scientific, holistic and guiding selection of indicators, it first determines the indicator categories as input and output indicators by considering the DEA model; subsequently, it further subdivides the input indicators into human input, material input and financial input and finally determines the evaluation index system of urban flooding disaster governance efficiency by referring to government policy documents such as “Implementation Opinions of the General Office of the State Council on Strengthening Urban Flooding governance” and “National Flood and Drought Control Emergency Plan”.
Specifically, the governance of urban flooding disasters mainly includes two aspects: usual governance and disaster rescue. Therefore, the evaluation indexes of urban flooding governance efficiency are also selected from the above two aspects to achieve a full-time evaluation of urban flooding governance efficiency. The specific evaluation indicators of urban flooding governance efficiency mainly refer to the government policy documents “Implementation Opinions of the General Office of the State Council on Strengthening Urban Flooding Governance” and “National Flood and Drought Control Emergency Plan”, of which the former mainly gives implementation opinions for urban flooding governance in normal times, and the latter focuses on guiding rescue and relief work during urban flooding disasters.
For input indicators, according to the types of input indicators identified by the DEA model, combined with the specific requirements in the “Implementation Opinions of the General Office of the State Council on Strengthening Urban Flooding Governance”, such as strengthening the construction of professional teams and increasing government financial investment, we screened out the human input as the number of people in flood control and the financial input as the financial expenditure on flood control related to urban flood control work. On this basis, we further referred to the emergency security section in the latest “National Flood and Drought Emergency Plan” issued by the General Office of the State Council, which includes communication and information security, emergency team security, medical rescue security, public security, financial security, social mobilization security, etc. Considering whether the data can be quantified, we finally chose emergency team security, medical rescue security and financial security, and the specific indicators are the number of people in flood control and management, medical and health security and financial expenditure on flood control.
For output indicators, according to the quantitative standards of government departments for urban flooding disaster statistics, which include affected population, dead population, missing population, and direct economic loss, we classify them into two perspectives of life safety and property safety. Life safety is expressed by the sum of the affected population, the dead population and the missing population, and property safety is the direct economic loss caused by the urban flooding disaster.
Since DEA is a data analysis method to evaluate the relative effectiveness of each decision-making unit, the more evaluation indexes there are, the smaller the difference between the relative efficiency values of each decision-making unit, and its comparability is relatively poor. Therefore, the number of urban flooding disaster governance efficiency evaluation indexes based on the DEA model is not suitable to be too many. In summary, the evaluation index system of urban flooding disaster governance efficiency is shown in Table 2.
The human input in the process of urban flooding disaster governance is the number of people involved in flood control, specifically, the number of urban nonprivate sector staff involved in the management, operation, maintenance and rescue of water conservancy and public facilities. The material input is mainly focused on medical and health protection during disasters, measured by the number of beds in medical and health institutions. Additionally, the financial input is measured by the financial expenditure of flood control projects in municipal financial accounts. The output indicators for evaluating urban flooding disaster management efficiency are people’s lives and property safety. Life is mainly expressed in the number of affected people, and property safety is reflected in the direct economic loss caused by the disaster.
In order to test the effectiveness of the evaluation index system of urban flooding disaster governance, we chose the data of 30 provincial capitals in China in 2021 and used DEA model to evaluate the urban flooding disaster governance efficiency. According to the DEA model results, the urban flooding governance efficiency in Zhengzhou City in 2021 was very low, which is consistent with the reality of the severe urban flooding caused by the “7–20” heavy rainstorm in Zhengzhou, Henan Province in 2021, resulting in huge casualties and economic losses. Based on the above analysis, we are more certain of the validity of the evaluation index system of urban flooding disaster governance efficiency.

2.4. Data Source

The China Meteorological Administration stated that urban flooding could occur in any area, and there is no major distribution area from the perspective of urban design studies [39]. Therefore, this article analyzes the static and dynamic measures of urban flooding governance efficiency in 30 provincial capitals in China based on the current state of urban flooding governance, excluding Taipei, Hong Kong, Macau and Tibet, due to a lack of data in these regions. In addition, considering the continuity and validity of the data, the research period chosen for the article is 2012–2021; this period dynamically reflects the changes in the efficiency of government departments’ participation in urban flooding disaster governance and provides a realistic basis for the improvement of urban flooding disaster governance efficiency in the future.
The data used in the article are obtained from the statistical yearbooks of provincial capitals and the relevant bulletins issued by government departments. The number of people in flood control and the number of beds in medical and health institutions in the input indicators are obtained from the statistical yearbook of each city. The financial expenditure data of flood control are obtained from the financial accounts of each provincial capital city, and some missing data are obtained from the city’s National Economic and Social Development Statistical Bulletin. The affected population and direct economic loss in the output indicators are obtained from the China Flood and Drought Disaster Defense Bulletin. Few missing data are completed by interpolation within the above dataset.

3. Empirical Results and Analysis

3.1. Static Analysis of the DEA Model

The article used DEAP2.1 software to evaluate the efficiency of flood disaster governance in 30 provincial capitals in China in 2012 and 2021 based on the DEA (output-BCC) model. Statistically, it analyzed the comprehensive technical efficiency, pure technical efficiency, scale efficiency and scale return of flood disaster governance in each city, as shown in Table 3.

3.1.1. Comprehensive Technical Efficiency Analysis

The primary reference for evaluating the effectiveness of urban flooding governance in China was the comprehensive technical efficiency value in the DEA model, which reflects whether the inputs and outputs of various government departments in urban flooding governance have reached an overall relatively effective level. When the comprehensive technical efficiency value is 1, urban flooding disaster governance is effective, and vice versa; the closer the value is to 1, the higher the efficiency of urban flooding disaster governance. As seen from Table 3, the comprehensive technical efficiency of urban flooding disaster governance in China was 0.464 in 2012, and it declined to 0.408 in 2021, showing that the overall efficiency was not high, indicating that urban flooding disaster governance in China has not reached the optimal input–output scale and that there is still much room for improvement. In light of Figure 1, a comparative analysis of the efficiency of urban flooding disaster governance in China’s provincial capitals shows that the provincial capitals with effective urban flooding disaster governance in 2012 were Hohhot, Haikou, Xining, and Yinchuan, and that the comprehensive technical efficiency of Hohhot, Xining, and Yinchuan was still on the production frontier in 2021. Other provincial capitals were relatively ineffective in governing urban flooding hazards, but their governance efficiency varied widely.
The comprehensive technical efficiency in the BCC model is the product of pure technical efficiency and scale efficiency. Among these two measures, pure technical efficiency refers to the ratio of actual output to maximum output at the same input scale, and the closer its value is to 1, the closer the technical and governance capability of the provincial capital city is to the advanced level in the urban flooding disaster governance process. Scale efficiency refers to the productivity achieved by improving the input scale at the same technical and governance level, and the closer its value is to 1, the closer the input scale of the provincial capital city is to the optimal scale in the flooding disaster governance process [40]. Eight provincial capitals, including Beijing, Tianjin, Shenyang, Harbin, Hangzhou, Hefei, Nanchang, and Chongqing, improved their urban flooding disaster governance efficiency in 2021 and elevated its level compared to 2012, indicating that these cities have optimized the scale of investment in urban flooding disaster governance and, therefore, have achieved significant results in governance. Among these capitals, Hefei, Hangzhou, and Nanchang had a large increase in urban flooding disaster governance efficiency, mainly due to the increase in scale efficiency. A total of 19 cities, including Shijiazhuang, Taiyuan, Changchun, Shanghai, Nanjing, Fuzhou, Jinan, Zhengzhou, and so on, saw a decrease in urban flooding disaster governance efficiency in 2021 compared to 2012, with Taiyuan, Xi’an, Guiyang, Urumqi, and Lanzhou experiencing a greater reduction in overall technical efficiency. The decrease in comprehensive technical efficiency in Taiyuan, Xi’an, and Lanzhou was mainly due to the decrease in both pure technical efficiency and scale efficiency, among which the scale efficiency value decreased more, indicating that these three cities had reduced technical and management capabilities of the process of urban flood disaster governance, and the productivity achieved by adjusting the scale of inputs was significantly reduced. The decrease in comprehensive technical efficiency in Guiyang and Urumqi was due to the reduction in scale efficiency, which indicates that the effectiveness of the scale of inputs in urban flood disaster governance was reduced in these two cities.

3.1.2. Pure Technical Efficiency Analysis

In 2012, the average value of the pure technical efficiency of urban flood governance in China was 0.976. Eight cities, Taiyuan, Hohhot, Changchun, Zhengzhou, Haikou, Xining, Yinchuan, and Urumqi, had effective pure technical efficiency in urban flooding disaster governance, accounting for 26.7%, indicating that the technical and management capabilities of those cities in urban flooding disaster governance were at the leading level in China. There were 21 cities (70%) that had reached the average level of pure technical efficiency in urban flooding governance, indicating that most cities in China have strong technical and management capabilities in urban flooding management. Beijing and Chengdu had the lowest pure technical efficiency of 0.876, suggesting that the technology and management capacity of urban flooding disaster governance in these two cities need further improvement. In 2021, the average value of the pure technical efficiency of urban flooding governance in China was 0.979, an increase of 0.03 compared to 2012. The cities that effectively achieved pure technical efficiency were Hohhot, Shanghai, Nanjing, Jinan, Haikou, Xining, Yinchuan, and Urumqi. There were 24 cities, such as Beijing, Tianjin, Shijiazhuang, and Shenyang, that reached the average level of pure technical efficiency, accounting for 80%, an increase of 10% compared with 2012, indicating that the technical and management capabilities of urban flooding disaster governance in China are steadily and slightly developing and improving. The pure technical efficiency of urban flooding governance in Zhengzhou was the lowest, at 0.738, and there is an urgent need to strengthen the application of technology and update management concepts to improve its technical and management capabilities.

3.1.3. Scale Efficiency Analysis

In 2012, the average scale efficiency of urban flooding disaster governance in China was 0.471. The cities that reached the optimal scale of urban flooding disaster governance were Hohhot, Haikou, Xining, and Yinchuan. Eleven cities, including Taiyuan, Nanchang, Changsha, and Guiyang, had reached the average level of efficiency in the scale of urban flooding disaster governance, accounting for 36.7% of the total cities. In 2021, the average scale efficiency of urban flooding governance in China was 0.413, which was lower than that in 2012. Hohhot, Xining, and Yinchuan were still scale efficient, indicating that the above cities had always been in the optimal state of input scale in 2012 and 2021. Twelve provincial capitals reached the average scale efficiency of urban flooding disaster governance, including Taiyuan, Hangzhou, Hefei, and Fuzhou, accounting for 40%, which is a slight improvement compared with 2012.
In light of Table 3, it was found, through the above analysis, that the scale efficiency was smaller than the pure technical efficiency except for the cities with effective comprehensive technical efficiency of urban flooding disaster governance, which shows that the scale efficiency was the main factor limiting the efficiency of urban flooding disaster governance. The input scale should be adjusted in time to improve the scale efficiency of urban flooding disaster management. Looking at the scale returns of urban flood governance in 2012 and 2021, cities that were not on the production frontier showed decreasing scale returns, indicating that these cities achieved limited improvement in governance efficiency by increasing inputs, and thus their scale inputs of human, material, and financial resources were not fully utilized, indicating that the direction of the use of inputs should be adjusted and planned to improve their scale efficiency.

3.2. Dynamic Analysis of the Malmquist Index

Based on the above static evaluation of urban flooding disaster governance efficiency in China, this article further introduced the Malmquist index to analyze panel data from 2012 to 2021 to dynamically evaluate urban flooding disaster governance efficiency and analyze the changing trend of such efficiency according to its dynamic characteristics. Using DEAP2.1 software, Malmquist index analysis was conducted for urban flooding disaster governance in 30 provincial capitals in China from 2012 to 2021, and the results and their decomposition indexes are shown in Table 4.

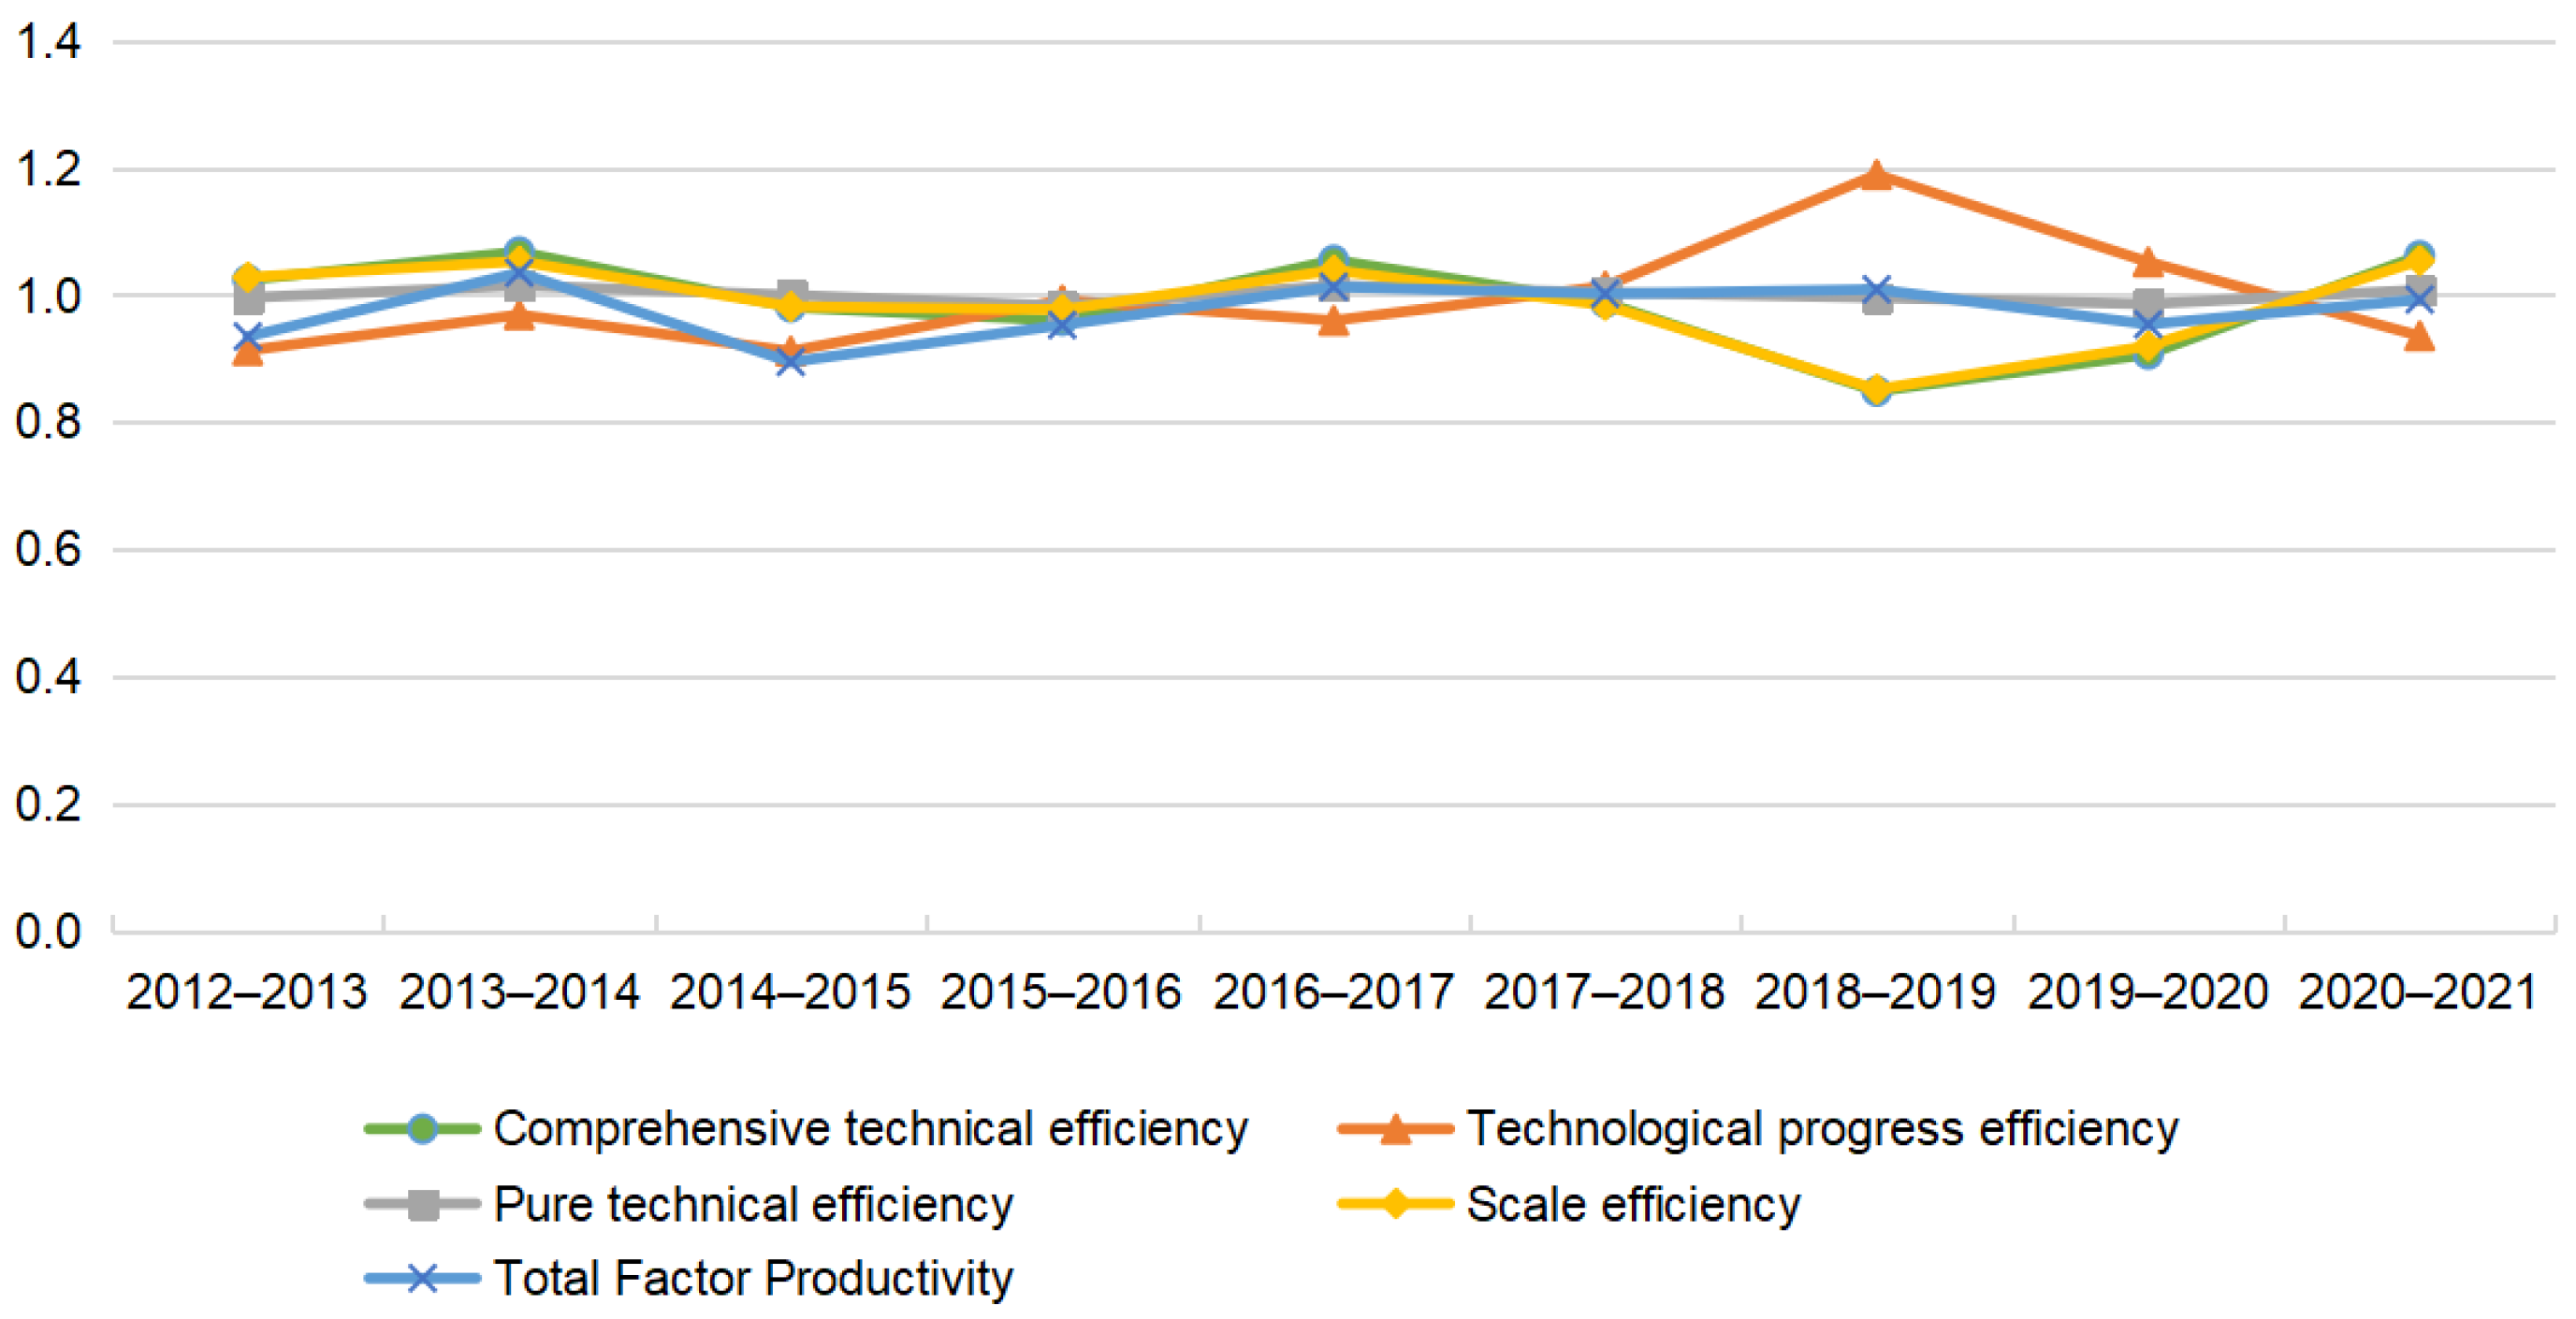
3.2.1. Period Analysis

In general, the total factor productivity of urban flooding governance in China from 2012 to 2021 decreased with an annual decrement of 2.4%, indicating that the effectiveness of urban flooding governance in China is not optimistic. The changing direction of the total factor productivity index can be further decomposed into an average annual decrease of 1.4% in comprehensive technical efficiency and an average yearly decline of 1% in technical progress efficiency, indicating that the technical efficiency of urban flooding disaster governance has not only decreased but has also experienced technological regression. At an annual level, the average annual growth of total factor productivity of urban flooding disaster governance was 3.5% in 2013–2014, and total factor productivity was greater than 1 in 2016–2019, indicating that urban flooding disaster governance was effective in China during this period. In 2014–2015, the total factor productivity of urban flooding disaster governance was the lowest (0.895), and in 2013–2014, total factor productivity was the highest (1.035). The up-and-down fluctuations were not significant, and the overall urban flooding disaster governance was relatively stable.
From 2012 to 2021, the comprehensive technical efficiency of urban flooding disaster governance decreased by 1.4% per year on average, with an overall decreasing trend and a negative contribution to the total factor productivity of urban flooding disaster governance. The comprehensive technical efficiency can be further decomposed into pure technical efficiency and scale efficiency. From the decomposed indexes, the average value of pure technical efficiency was approximately 1, and the fluctuation range was small, indicating that the technical and management capacity of urban flooding disaster governance in China has remained unchanged in the past 10 years. The scale efficiency decreased by 1.5% annually and fluctuated widely, indicating that the quantity and direction of inputs should be reasonably adjusted and that the input structure should be optimized promptly in future work on internal flooding disaster governance. Further examining Figure 2, it can be observed that the comprehensive technical efficiency and scale efficiency moved in the same direction, indicating that the comprehensive technical efficiency of urban flooding disaster governance in China has been mainly influenced by scale efficiency, which is consistent with the results of the previous static analysis.
From 2012 to 2021, the average value of the technological progress efficiency of urban flooding disaster governance was 0.990, with an average annual reduction of 1%. The technological progress efficiency value for urban flooding disaster governance was the smallest in 2014–2015 (0.912) and the largest in 2018–2019 (1.189), experiencing significant fluctuation. The technological progress efficiency values for 2012–2017 and 2020–2021 were both less than 1, indicating that urban flooding disaster governance was in a state of technological decline in the above years. From 2017 to 2020, the technical progress efficiency of urban flooding disaster governance reached a value greater than 1, indicating that flooding disaster governance was subject to greater technical support during this period. This aligns with the government’s work report in March 2017, which proposed to “launch a three-year action to eliminate key flood-prone sections of urban areas and promote the construction of sponge cities” [41], resulting in urban flooding disaster governance experiencing a stage of technical progress. Hence, urban flooding disaster governance showed a phase of technological progress during this period.

3.2.2. Regional Analysis

The abovementioned stage analysis of urban flooding disaster governance efficiency in China is based on the time dimension. To further explore the regional differences in total factor productivity, the article measured the total factor productivity index and its decomposition index for 30 provincial capitals in China, as shown in Table 5.
The total factor productivity of urban flooding disaster governance in China from 2012 to 2021 was greater than 1 in eight cities, including Hangzhou, Hefei, Harbin, Chongqing, Shenyang, Nanchang, Hohhot, and Urumqi, indicating that the flooding disaster governance efficiency for these cities had been improving year by year and that the development trend had improved. Exploring the reasons for their growth, given the decomposition index of total factor productivity in Table 5, it can be seen that the technological progress efficiency in Hangzhou, Urumqi and Hohhot was greater than the comprehensive technical efficiency, which shows that technological progress is the key to improving the efficiency of flood disaster governance in the above cities. The comprehensive technical efficiency of Hefei, Harbin, Chongqing, Shenyang, and Nanchang was greater than their technological progress efficiency. The slow average annual growth rate of pure technical efficiency compared to scale efficiency was a limiting factor in improving comprehensive technical efficiency. Therefore, total factor productivity can be further improved by enhancing the technical and management capacity of flood disaster governance in the above cities. The total factor productivity of 17 cities, including Xi’an, Wuhan, Guiyang, Lanzhou, and Haikou, was lower than the average. The reasons for this were that 11 cities, including Changchun, Shijiazhuang, Nanning, and Chengdu, had low overall technical efficiency, and 10 cities, except Zhengzhou, had low scale efficiency that restricted the improvement of urban flood disaster governance efficiency.
Precipitation is one of the causes of urban flooding, and it is also an important basis for government departments to prevent urban flooding and plan the direction of financial investment. Therefore, based on the average annual precipitation of China’s provincial capitals from 2012 to 2021, the 30 provincial capitals were divided into three groups of urban agglomerations with 400 mm annual precipitation and 800 mm annual precipitation as the boundary (Figure 3). The total factor productivity index and its decomposition results are shown in Table 6.
The overall efficiency of urban flooding disaster governance in China’s provincial capital cities showed a decreasing trend year by year. Based on the annual precipitation as a subregion, the urban agglomerations with higher annual precipitation had a higher total factor productivity index. Further observation of the decomposition index shows that the comprehensive technical efficiency and total factor productivity changed in the same direction, indicating that the comprehensive technical efficiency has a greater impact on urban flooding disaster governance’s total factor productivity index. Among these measures, the magnitude of change in scale efficiency was large, which is consistent with the direction of change in comprehensive technical efficiency and has a positive and significant effect. Annual precipitation is a critical reference for urban flooding disaster governance, and the improvement of governance efficiency must still be achieved by adjusting the input structure. In contrast to the distribution trend of the comprehensive technical efficiency, the technological progress efficiency of urban agglomerations with annual precipitation of 400 mm to 800 mm was the largest (0.993), followed by urban agglomerations with less than 400 mm annual precipitation (0.991), and the smallest value of (0.989) was in cities with more than 800 mm annual precipitation, but its overall fluctuation was minimal.

3.3. Empirical Results

The article used the DEA model and Malmquist index to conduct an empirical study on the efficiency of flooding disaster governance in 30 provincial capitals from 2012 to 2021 and obtained the following results.
First, the overall efficiency of urban flooding disaster governance in China was low, and scale efficiency constrained its development. The comprehensive technical efficiency of urban flooding disaster governance in China was 0.408 in 2021, lower than 0.464 in 2012, and its development trend is not optimistic. In 2012 and 2021, the pure technical efficiency was greater than the scale efficiency; its values were 0.976 and 0.979, respectively, indicating that the technical and management capacity of urban flooding disaster governance had slightly improved, but the difference in this value among provincial capitals was small, and the change was not significant. Scale efficiency varies widely among provincial capitals, and cities with lower values can adjust the structure of inputs and the direction of use to increase comprehensive technical efficiency.
Second, the overall efficiency of urban flooding governance in China was decreasing, and both comprehensive technical efficiency and technological progress efficiency need to be improved. The efficiency of flooding disaster governance in the 30 provincial capitals in China fell by 2.4% annually from 2012 to 2021, and the interannual averages of comprehensive technical efficiency and technological progress efficiency also showed a decreasing trend year by year, with the former decreasing more. In the future, attention should be given to improving the comprehensive technical efficiency in urban flooding disaster governance, and the technical support for urban flooding disaster governance should be further strengthened to promote technological progress. Further examination of the Malmquist index and its decomposition index of urban flooding governance in different provincial capitals shows that some cities’ total factor productivity index was greater than 1, indicating that these cities could improve their governance efficiency of urban flooding governance year by year. However, there were still more cities with an annual decrease in urban flooding governance efficiency due to the variability of urban flooding governance in provincial capitals. Therefore, these cities should consider their specific conditions and make up for their shortcomings to improve the efficiency of their urban flooding disaster governance.
Third, there was a significant difference in the efficiency of urban flooding governance among cities in different annual precipitation regions, and thus, the efficiency of urban flooding governance should be improved according to local conditions. According to the annual precipitation, China’s provincial capital cities were divided into three major urban agglomerations. The total factor productivity index of each urban agglomeration was less than 1, and the difference was more prominent, which indicates that there was a relationship between the efficiency of urban flooding disaster governance and the annual precipitation of the city, and more specifically, that the higher total factor productivity index of cities was associated with higher annual precipitation. The comprehensive technical efficiency of urban flooding disaster governance in each urban agglomeration had considerable variation, which was consistent with the trend of the total factor productivity index and contributed positively to it. Urban agglomerations with annual precipitation greater than 800 mm had the lowest efficiency of technical progress (0.989) and should increase technical investment in urban flood disaster governance. In contrast, urban agglomerations with annual precipitation less than 800 mm should put more effort into enhancing their comprehensive technical efficiency, particularly in improving scale efficiency and optimizing the input structure while adjusting the scale input to achieve the optimal allocation of resources.

4. Discussion

To effectively guide the governance of urban flooding disasters, we conducted static and dynamic evaluations of urban flooding disaster governance efficiency in China’s provincial capitals and analyzed its constraints. Specifically, the research aims of this paper included the following points. First, it quantified the efficiency of urban flooding disaster governance to understand the overall level of urban flooding disaster governance in China. Then, we analyzed the limiting factors affecting efficiency improvement based on the decomposition index of urban flooding disaster governance as an important aspect for the next stage of urban flooding disaster governance promotion. Finally, we expected that the urban flooding governance strategy based on quantitative analysis could facilitate the optimal allocation of limited human, material and financial resources by governmental departments and thus promote the further development of urban flooding governance.
Based on the urban flooding disaster governance data of 30 provincial capitals in China from 2012 to 2021, we evaluated their governance efficiency using the DEA model and Malmquist index. First, the overall efficiency of urban flooding disaster governance in China was low, which is consistent with the actual situation of urban flooding disaster governance in China. According to the disaster statistics of the National Disaster Reduction Center of the Ministry of Emergency Management, there are different degrees of urban flooding disasters in China every year; these disasters seriously impact people’s lives, property safety and regional economic development. The overall inefficiency of urban flooding disaster governance in China corresponds to the current research on the improvement of urban flooding disaster governance capacity. Second, for the majority of provincial capitals, scale efficiency was the main factor limiting the efficiency of urban flooding disaster governance. This finding is closely related to the urbanization process of our provincial capitals. China is a developing country, and the infrastructure development of its provincial capitals has gradually improved along with accelerating urbanization. However, the economic development level of each district and county in the provincial capital city is somewhat different, so there is also a large difference in the investment of each government department in urban flood governance based on meeting the basic needs of the people. Urban flooding disaster governance often shows the characteristics of “headache to treat the head, the foot to treat the foot”, and it is difficult to achieve its scale benefits by improving the overall governance capacity of the area. Third, there was a significant difference in the efficiency of urban flooding governance among cities in different annual precipitation regions. The governance of urban flooding disasters by various government departments in China is associated with annual urban precipitation. Influenced by topography and climatic features, annual precipitation shows the characteristics of more in the south and less in the north, more in the east and less in the west. However, in recent years, extreme precipitation events have occurred frequently and severely due to the influence of global warming. Therefore, government departments can no longer rely solely on local annual precipitation characteristics and previous years’ governance experience to promote the current urban flooding disaster governance work. This explains, to some extent, the slow improvement in the efficiency of urban flooding governance in China in the past decade.
There is a long way to go to improve the governance of urban flooding disasters. This paper used the DEA model and Malmquist index to quantify the efficiency of urban flooding disaster governance in 30 provincial capitals in China from 2012 to 2021, which enriched the current methodology and content of urban flooding disaster governance research to a certain extent. We analyzed the efficiency of urban flooding disaster governance, identified its constraints, and provided corresponding suggestions for future urban flooding disaster governance in specific provincial capitals. This is of great practical significance to promote the construction of urban lifelines and maintain the safety of people’s lives and properties. However, this paper also has some limitations. On the one hand, due to the limitation of the DEA model itself, there should not be too many evaluation indicators for urban flooding disaster governance efficiency. On the basis of considering the validity of evaluation indicators and the differences in the governance efficiency of decision-making units, we made reference to the government’s policy recommendations on urban flooding disaster governance and screened the input indicators. Nevertheless, the evaluation of the overall level of urban flooding disaster governance efficiency through some evaluation indicators may appear to be biased. On the other hand, the article does not discuss the issue of the potential costs for provincial capitals to adopt the recommendations of this paper’s urban flooding disaster governance work. This is important for the implementation of the article’s findings. We will consider and discuss these shortcomings more extensively. However, it provides a new perspective for our future research on urban flooding disasters.

5. Conclusions

In this study, we first determined the primary and secondary indicators for the evaluation of urban flooding disaster governance efficiency according to the type of DEA model input indicators and then decided on the number of tertiary indicators in combination with the model’s own characteristics. Second, we referred to government policy documents about urban flooding disaster governance, determined the evaluation indexes of urban flooding disaster governance efficiency, and constructed an evaluation index system. Finally, we analyzed the efficiency of urban flooding disaster governance using panel data for 30 provincial capitals in China from 2012 to 2021 and drew the following conclusions.
(1)
Among the 30 provincial capitals we selected, only approximately 25% had high comprehensive technical efficiency. Most cities were affected by scale efficiency and had low efficiency in urban flood disaster governance. Therefore, China’s urban flooding disaster governance has not been at the optimal input–output scale for a long time. The efficiency of urban flooding governance through increased human, material and financial investment by government departments has been very limited.
(2)
From 2012 to 2021, the efficiency of urban flooding disaster governance in China’s provincial capitals showed a decreasing trend year by year, but it was largely influenced by national policies. In 2017, the government strongly supported the construction of sponge cities, and accordingly, various government departments were able to receive greater policy support, financial support and technical support in the process of urban flooding disaster governance. Based on this, the efficiency of technological progress in urban flooding disaster governance in China continued to be high after 2017.
(3)
China’s urban flooding disaster governance efficiency has obvious regional features, and the promotion of urban flooding disaster governance is closely related to the local annual precipitation characteristics. The greater the annual precipitation in the capital city is, the more efficient the urban flooding governance. Government departments tend to learn from previous years’ experiences in managing urban flooding, which makes it difficult to withstand the huge impact of extreme precipitation events on cities in the long run.

Author Contributions

Conceptualization, B.G. and X.H.; methodology, B.G. and X.H.; software, X.H.; validation, B.G. and X.H.; formal analysis, X.H.; investigation, X.H.; resources, B.G.; data curation, X.H.; writing—original draft preparation, X.H.; writing—review and editing, X.H. and B.G.; visualization, X.H. and J.L.; supervision, B.G. and W.Z.; project administration, B.G. All authors have read and agreed to the published version of the manuscript.

Funding

This research received no external funding.

Data Availability Statement

The data are available in the manuscript.

Conflicts of Interest

The authors declare no conflict of interest.

References

  1. General Office of State Council. Implementation Opinions of the General Office of the State Council on Strengthening Urban Flooding Governance. The State Council of the People’s Republic of China. Available online: http://www.gov.cn/gongbao/content/2021/content_5605102.htm (accessed on 8 April 2021).
  2. State Department Disaster Investigation Group. Investigation Report on the “7–20” Extraordinary Rainstorm Disaster in Zhengzhou, Henan Province. Ministry of Emergency Management of the People’s Republic of China. Available online: https://www.mem.gov.cn/gk/sgcc/tbzdsgdcbg/202201/P020220121639049697767.pdf (accessed on 21 January 2022).
  3. Acosta-Coll, M.; Ballester-Merelo, F.; Martínez-Peiró, M. Early warning system for detection of urban pluvial flooding hazard levels in an ungauged basin. Nat. Hazards 2018, 92, 1237–1265. [Google Scholar] [CrossRef]
  4. Olanrewaju, C.C.; Chitakira, M. Flood risk predictions in African urban settlements: A review of Alexandra Township, South Africa. In Disaster Risk Reduction for Resilience; Springer: Berlin/Heidelberg, Germany, 2023; pp. 215–238. [Google Scholar]
  5. Tu, Y.; Shi, H.; Zhou, X.; Liu, L.; Lev, B. Flood risk assessment of metro stations based on the SMAA-2-FFS-H method: A case study of the “7–20” rainstorm in Zhengzhou, China. In Stochastic Environmental Research and Risk Assessment; Springer: Berlin/Heidelberg, Germany, 2023; pp. 1–20. [Google Scholar]
  6. Guo, K.; Guan, M.; Yu, D. Urban surface water flood modelling-a comprehensive review of current models and future challenges. Hydrol. Earth Syst. Sci. 2021, 25, 2843–2860. [Google Scholar] [CrossRef]
  7. Yang, Y.; Sun, L.; Li, R.; Yin, J.; Yu, D. Linking a storm water management model to a novel two-dimensional model for urban pluvial flood modeling. Int. J. Disaster Risk Sci. 2020, 11, 508–518. [Google Scholar] [CrossRef]
  8. Sarmah, T.; Das, S.; Narendr, A.; Aithal, B.H. Assessing human vulnerability to urban flood hazard using the analytic hierarchy process and geographic information system. Int. J. Disaster Risk Reduct. 2020, 50, 101659. [Google Scholar] [CrossRef]
  9. Rana, I.A.; Routray, J.K. Multidimensional model for vulnerability assessment of urban flooding: An empirical study in Pakistan. Int. J. Disaster Risk Sci. 2018, 9, 359–375. [Google Scholar] [CrossRef] [Green Version]
  10. Wang, Y.; Chen, A.S.; Fu, G.; Djordjević, S.; Zhang, C.; Savić, D.A. An integrated framework for high-resolution urban flood modelling considering multiple information sources and urban features. Environ. Model. Softw. 2018, 107, 85–95. [Google Scholar] [CrossRef]
  11. Li, Y.; Zhou, W.H.; Shen, P. Pedestrian danger assessment under rainstorm-induced flood disaster for an artificial island. Int. J. Disaster Risk Reduct. 2022, 78, 103133. [Google Scholar] [CrossRef]
  12. Zhou, Q.; Su, J.; Arnbjerg-Nielsen, K.; Ren, Y.; Luo, J.; Ye, Z.; Feng, J. A GIS-based hydrological modeling approach for rapid urban flood hazard assessment. Water 2021, 13, 1483. [Google Scholar] [CrossRef]
  13. Liu, X.; Zhou, P.; Lin, Y.; Sun, S.; Zhang, H.; Xu, W.; Yang, S. Influencing Factors and Risk Assessment of Precipitation-Induced Flooding in Zhengzhou, China, Based on Random Forest and XGBoost Algorithms. Int. J. Environ. Res. Public Health 2022, 19, 16544. [Google Scholar] [CrossRef]
  14. Wu, M.; Wu, Z.; Ge, W.; Wang, H.; Shen, Y.; Jiang, M. Identification of sensitivity indicators of urban rainstorm flood disasters: A case study in China. J. Hydrol. 2021, 599, 126393. [Google Scholar] [CrossRef]
  15. Shin, E.; Kim, H.J.; Rhee, D.S.; Eom, T.; Song, C.G. Spatiotemporal flood risk assessment of underground space considering flood intensity and escape route. Nat. Hazards 2021, 109, 1539–1555. [Google Scholar] [CrossRef]
  16. Ma, C.; Qi, W.; Xu, H.; Zhao, K. An integrated quantitative framework to assess the impacts of disaster-inducing factors on causing urban flood. Nat. Hazards 2022, 113, 1903–1924. [Google Scholar] [CrossRef]
  17. Zhao, F.; Cai, J.Z.; Zeng, H.Y.; Qie, Z.Q.; Du, Q.Y.; Wang, J.F.; Qiu, H.; Chen, S.; Hou, Z.Q. Construction of urban flooding prevention system under “One City, One Executor, and One Network” model: Case study of Kunming, China. Nat. Hazards Rev. 2021, 22, 05021006. [Google Scholar] [CrossRef]
  18. Shi, Y.; Zhai, G.; Zhou, S.; Lu, Y.; Chen, W.; Deng, J. How can cities respond to flood disaster risks under multi-scenario simulation? A case study of Xiamen, China. Int. J. Environ. Res. Public Health 2019, 16, 618. [Google Scholar] [CrossRef] [PubMed] [Green Version]
  19. Jiang, Y.; Zevenbergen, C.; Ma, Y.C. Urban pluvial flooding and stormwater management: A contemporary review of China’s challenges and “sponge cities” strategy. Environ. Sci. Policy 2018, 80, 132–143. [Google Scholar] [CrossRef]
  20. Pour, S.H.; Abd Wahab, A.K.; Shahid, S.; Asaduzzaman, M.; Dewan, A. Low impact development techniques to mitigate the impacts of climate-change-induced urban floods: Current trends, issues and challenges. Sustain. Cities Soc. 2020, 62, 102373. [Google Scholar] [CrossRef]
  21. Qi, W.; Ma, C.; Xu, H.; Chen, Z.; Zhao, K.; Han, H. Low impact development measures spatial arrangement for urban flood mitigation: An exploratory optimal framework based on source tracking. Water Resour. Manag. 2021, 35, 3755–3770. [Google Scholar] [CrossRef]
  22. Dadrasajirlou, Y.; Karami, H.; Mirjalili, S. Using AHP-PROMOTHEE for selection of best Low-Impact Development designs for urban flood mitigation. Water Resour. Manag. 2023, 37, 375–402. [Google Scholar] [CrossRef]
  23. Yang, Q.; Wang, J.; Liu, X.; Xia, J. MAS-based interaction simulation within asymmetric information on emergency management of urban rainstorm disaster. Complexity 2020, 2020, 1759370. [Google Scholar] [CrossRef]
  24. O’Donnell, E.C.; Lamond, J.E.; Thorne, C.R. Learning and Action Alliance framework to facilitate stakeholder collaboration and social learning in urban flood risk management. Environ. Sci. Policy 2018, 80, 1–8. [Google Scholar] [CrossRef]
  25. Ye, L. Study on embedded system in monitoring of intelligent city pipeline network. Comput. Commun. 2020, 153, 451–458. [Google Scholar] [CrossRef]
  26. Songchon, C.; Wright, G.; Beevers, L. Quality assessment of crowdsourced social media data for urban flood management. Comput. Environ. Urban Syst. 2021, 90, 101690. [Google Scholar] [CrossRef]
  27. Duan, P.X.; Meng, W. Evaluation of Government Governance Efficiency under the New Development Concept:“Do One’sBest” or “Do According to One’s Ability”. J. Jiangxi Univ. Financ. Econ. 2022, 4, 22–34. [Google Scholar]
  28. Li, Y.; Huang, S.; Yin, C.; Sun, G.; Ge, C. Construction and countermeasure discussion on government performance evaluation model of air pollution control: A case study from Beijing-Tianjin-Hebei region. J. Clean. Prod. 2020, 254, 120072. [Google Scholar] [CrossRef]
  29. Ahmad, N.A.; Ismail, N.W.; Sidique, S.F.A.; Mazlan, N.S. Air pollution, governance quality, and health outcomes: Evidence from developing countries. Environ. Sci. Pollut. Res. 2023, 30, 41060–41072. [Google Scholar] [CrossRef]
  30. Zhu, J.; Lu, C.; Wei, Z. Perception of Air Pollution and the Evaluation of Local Governments’ Environmental Governance: An Empirical Study on China. Atmosphere 2023, 14, 212. [Google Scholar] [CrossRef]
  31. Lihua, W.U.; Tianshu, M.A.; Yuanchao, B.I.A.N.; Sijia, L.I.; Zhaoqiang, Y.I. Improvement of regional environmental quality: Government environmental governance and public participation. Sci. Total Environ. 2020, 717, 137265. [Google Scholar]
  32. Wang, R.; Zhao, X.; Zhang, L. Research on the impact of green finance and abundance of natural resources on China’s regional eco-efficiency. Resour. Policy 2022, 76, 102579. [Google Scholar] [CrossRef]
  33. Gupta, D.; Fischer, H.; Shrestha, S.; Ali, S.S.; Chhatre, A.; Devkota, K.; Fleischman, F.; Khatri, D.B.; Rana, P. Dark and bright spots in the shadow of the pandemic: Rural livelihoods, social vulnerability, and local governance in India and Nepal. World Dev. 2021, 141, 105370. [Google Scholar] [CrossRef]
  34. Sun, P.; Zhou, L.; Ge, D.; Lu, X.; Sun, D.; Lu, M.; Qiao, W. How does spatial governance drive rural development in China’s farming areas? Habitat Int. 2021, 109, 102320. [Google Scholar] [CrossRef]
  35. Yang, W.; Wen, C.; Lin, B. Research on the design and governance of new rural public environment based on regional culture. J. King Saud Univ.-Sci. 2023, 35, 102425. [Google Scholar] [CrossRef]
  36. Song, J.; Geng, L.; Fahad, S.; Liu, L. Fiscal decentralization and economic growth revisited: An empirical analysis of poverty governance. Environ. Sci. Pollut. Res. 2022, 29, 28020–28030. [Google Scholar] [CrossRef] [PubMed]
  37. Latiff, A.M.A.; Isa, C.M.M.; Jaapar, A. Governance practices in poverty alleviation projects: Case study from stewardship-driven perspective and sustainability context. In Green Infrastructure: Materials and Applications; Springer: Berlin/Heidelberg, Germany, 2022; pp. 227–244. [Google Scholar]
  38. Hassan, M.S.; Bukhari, S.; Arshed, N. Competitiveness, governance and globalization: What matters for poverty alleviation? Environ. Dev. Sustain. 2020, 22, 3491–3518. [Google Scholar] [CrossRef]
  39. China Meteorological Administration. The Distribution of Urban Flooding. China Meteorological Administration. Available online: https://www.cma.gov.cn/2011xzt/2018zt/20100728/2010072809/201807/t20180706_472582.html (accessed on 4 July 2019).
  40. Feng, Z.R.; Yin, J.Y. Research on the efficiency of poverty alleviation through e-commerce in China based on DEA model and Malmquist index. Lanzhou Acad. J. 2021, 11, 134–148. [Google Scholar]
  41. State Council. Government Work Report 2017. The State Council of the People’s Republic of China. Available online: http://www.gov.cn/guowuyuan/2017zfgzbg.htm (accessed on 5 March 2017).
Figure 1. Comprehensive technical efficiency of urban flood disaster governance in provincial capitals in 2012 and 2021.
Water 15 02513 g001
Figure 2. Malmquist index decomposition and its trend for urban flooding disaster governance from 2012 to 2021.
Water 15 02513 g002
Figure 3. Annual average precipitation of 30 provincial capital cities from 2012 to 2021.
Water 15 02513 g003
Table 1. The specific meanings of the main notations in the DEA model and Malmquist index.
Main NotationSpecific Meaning
DEAData envelopment analysis
DMUDecision-making unit
CRSConstant returns to scale
VRSVariable returns to scale
TEComprehensive technical efficiency
PTEPure technical efficiency
SEScale efficiency
TFPTotal factor productivity
ECComprehensive technical efficiency change
TCTechnological progress efficiency change
Table 2. Evaluation index system of urban flooding disaster governance efficiency.
Primary IndicatorsSecondary IndicatorsTertiary IndicatorsIndicator Descriptions
Input IndicatorsHuman InputsNumber of people in flood controlNumber of urban nonprivate sector staff involved in water resources and public facilities management, operation, maintenance and rescue (people)
Material InputMedical and health securityNumber of beds in medical and health institutions (sheets)
Financial InputFinancial expenditure on flood controlCity’s financial spending for flood control (CNY 10,000)
Output IndicatorsLife SafetyAffected populationNumber of people affected by urban flooding disasters (10,000 people)
Property SafetyDirect economic lossProperty loss caused by urban flooding disaster (CNY 10,000)
Table 3. Efficiency values of flood disaster governance by provincial capitals in 2012 and 2021.
Cities20122021
TEPTESEScale ReturnTEPTESEScale Return
Beijing0.0990.8760.113drs0.1370.9930.138drs
Tianjin0.2050.9710.211drs0.2610.9990.262drs
Shijiazhuang0.3420.9490.361drs0.2820.9850.286drs
Taiyuan0.8351.0000.835drs0.4160.9660.430drs
Hohhot1.0001.0001.000-1.0001.0001.000-
Shenyang0.2120.9540.222drs0.2310.9970.232drs
Changchun0.3791.0000.379drs0.2710.9980.272drs
Harbin0.2080.9930.210drs0.2640.9840.268drs
Shanghai0.1090.9940.110drs0.1071.0000.107drs
Nanjing0.3200.9910.323drs0.2721.0000.272drs
Hangzhou0.3070.9390.327drs0.5280.9970.530drs
Hefei0.3580.9900.361drs0.7920.9970.794drs
Fuzhou0.4310.9940.434drs0.4180.9960.419drs
Nanchang0.5070.9780.519drs0.6740.9950.677drs
Jinan0.3930.9800.401drs0.2661.0000.266drs
Zhengzhou0.2341.0000.234drs0.1590.7380.216drs
Wuhan0.2140.9770.220drs0.1580.9710.163drs
Changsha0.4730.9680.489drs0.3390.9800.346drs
Guangzhou0.1730.9840.176drs0.1690.9990.169drs
Nanning0.4040.9920.407drs0.2980.9970.299drs
Haikou1.0001.0001.000-0.8691.0000.869drs
Chongqing0.1090.9480.116drs0.1360.9720.140drs
Chengdu0.2970.8760.340drs0.1380.9200.150drs
Guiyang0.7300.9930.735drs0.4340.9950.436drs
Kunming0.4080.9880.412drs0.2820.9940.283drs
Xi’an0.5140.9880.520drs0.2070.9150.226drs
Lanzhou0.7800.9690.805drs0.5340.9910.539drs
Xining1.0001.0001.000-1.0001.0001.000-
Yinchuan1.0001.0001.000-1.0001.0001.000-
Urumqi0.8631.0000.863drs0.5991.0000.599drs
Average0.4640.9760.471 0.4080.9790.413
Note: “TE” refers to comprehensive technical efficiency, “PTE” refers to pure technical efficiency, and “SE” refers to scale efficiency. “drs” indicates decreasing returns to scale, and “-” indicates constant returns to scale.
Table 4. Malmquist index and its decomposition results for urban flooding disaster governance from 2012 to 2021.
YearComprehensive
Technical Efficiency
Technological
Progress Efficiency
Pure
Technical
Efficiency
Scale
Efficiency
Total
Factor
Productivity
2012–20131.0240.9130.9961.0280.935
2013–20141.0680.9691.0151.0531.035
2014–20150.9810.9121.0000.9820.895
2015–20160.9600.9920.9830.9770.953
2016–20171.0550.9601.0151.0391.013
2017–20180.9881.0141.0040.9841.002
2018–20190.8491.1890.9960.8521.009
2019–20200.9071.0520.9860.9200.954
2020–20211.0620.9361.0081.0540.993
Average0.9860.9901.0000.9850.976
Table 5. Malmquist index and decomposition results of flood disaster governance in 30 provincial capitals in China.
CitiesComprehensive
Technical Efficiency
Technological
Progress Efficiency
Pure
Technical
Efficiency
Scale
Efficiency
Total
Factor
Productivity
Beijing1.0370.9451.0141.0230.980
Tianjin1.0270.9511.0031.0240.977
Shijiazhuang0.9790.9871.0040.9750.966
Taiyuan0.9251.0580.9960.9290.979
Hohhot1.0001.0051.0001.0001.005
Shenyang1.0101.0041.0051.0051.013
Changchun0.9641.0081.0000.9640.971
Harbin1.0271.0060.9991.0281.032
Shanghai0.9980.9531.0010.9970.950
Nanjing0.9820.9971.0010.9810.979
Hangzhou1.0621.0761.0071.0551.143
Hefei1.0920.9721.0011.0911.061
Fuzhou0.9960.9651.0000.9960.962
Nanchang1.0320.9761.0021.0301.007
Jinan0.9580.9891.0020.9560.948
Zhengzhou0.9581.0040.9670.9910.962
Wuhan0.9670.9640.9990.9670.931
Changsha0.9640.9861.0010.9630.951
Guangzhou0.9970.9501.0020.9950.947
Nanning0.9670.9991.0010.9660.965
Haikou0.9850.9611.0000.9850.946
Chongqing1.0250.9931.0031.0221.017
Chengdu0.9181.0481.0050.9130.963
Guiyang0.9440.9981.0000.9440.942
Kunming0.9600.9901.0010.9590.950
Xi’an0.9040.9710.9910.9120.878
Lanzhou0.9590.9841.0030.9570.944
Xining1.0000.9821.0001.0000.982
Yinchuan1.0000.9461.0001.0000.946
Urumqi0.9611.0441.0000.9611.003
Average0.9860.9901.0000.9850.976
Table 6. Malmquist index and decomposition results of regional urban flooding disaster governance.
Annual PrecipitationComprehensive
Technical Efficiency
Technological
Progress Efficiency
Pure
Technical
Efficiency
Scale
Efficiency
Total
Factor
Productivity
<400 mm0.9730.9911.0010.9730.964
400–800 mm0.9820.9930.9980.9840.974
>800 mm0.9930.9891.0020.9910.981
Average0.9860.9901.0000.9850.976
Note: Cities with annual precipitation less than 400 mm include Lanzhou, Yinchuan and Urumqi; cities with annual precipitation greater than 400 mm and less than 800 mm include Beijing, Tianjin, Shijiazhuang, Taiyuan, Hohhot, Shenyang, Changchun, Harbin, Jinan, Zhengzhou, Xi’an and Xining; cities with annual precipitation greater than 800 mm include Shanghai, Nanjing, Hangzhou, Hefei, Fuzhou, Nanchang, Wuhan, Changsha, Guangzhou, Nanning, Haikou, Chongqing, Chengdu, Guiyang and Kunming.
Disclaimer/Publisher’s Note: The statements, opinions and data contained in all publications are solely those of the individual author(s) and contributor(s) and not of MDPI and/or the editor(s). MDPI and/or the editor(s) disclaim responsibility for any injury to people or property resulting from any ideas, methods, instructions or products referred to in the content.

