Article

Rainfall-Induced Landslide Assessment under Different Precipitation Thresholds Using Remote Sensing Data: A Central Andes Case

by
Gonzalo Maragaño-Carmona
1,2,3,
Ivo J. Fustos Toribio
1,*,
Pierre-Yves Descote
2,
Luis F. Robledo
2,
Diego Villalobos
2 and
Gustavo Gatica
2
1
Department of Civil Engineering, University of La Frontera, Temuco 4811230, Chile
2
Faculty of Engineering-CIS, Universidad Andres Bello, Santiago 8370134, Chile
3
Master on Engineering Sciences Program, Faculty of Engineering and Sciences, Universidad de La Frontera, Temuco 4811230, Chile
*
Author to whom correspondence should be addressed.
Water 2023, 15(14), 2514; https://doi.org/10.3390/w15142514
Submission received: 12 May 2023 / Revised: 19 June 2023 / Accepted: 26 June 2023 / Published: 9 July 2023
(This article belongs to the Topic Landslide Prediction, Monitoring and Early Warning)

Abstract

:
The determination of susceptibility to rainfall-induced landslides is crucial in developing a robust Landslide Early Warning System (LEWS). With the potential uncertainty of susceptibility changes in mountain environments due to different precipitation thresholds related to climate change, it becomes important to evaluate these changes. In this study, we employed a machine learning approach (logistic models) to assess susceptibility changes to landslides in the Central Andes. We integrated geomorphological features such as slope and slope curvature, and precipitation data on different days before the landslide. We then split the data into a calibration and validation database in a 50/50% ratio, respectively. The results showed an area under the curve (AUC) performance of over 0.790, indicating the model’s capacity to represent prone-landslide changes based on geomorphological and precipitation antecedents. We further evaluated susceptibility changes using different precipitation scenarios by integrating Intensity/Duration/Frequency (IDF) products based on CHIRPS data. We concluded that this methodology could be implemented as a Rainfall-Induced Landslides Early Warning System (RILEWS) to forecast RIL occurrence zones and constrain precipitation thresholds. Our study estimates that half of the basin area in the study zone showed a 59% landslide probability for a return of two years at four hours. Given the extent and high population in the area, authorities must increase monitoring over unstable slopes or generate landslide early warning at an operational scale to improve risk management. We encourage decision-makers to focus on better understanding and analysing short-duration extreme events, and future urbanization and public infrastructure designs must consider RIL impact.

1. Introduction

The Central Andes (32–34 °S) experienced an intense activity of rainfall-induced landslides (RILs) associated with extreme hydrometeorological events [1,2,3]. In South America, RILs commonly affect communities socially and economically, limiting the development of populations in the mountain environment [4]. Stand-out variations in the frequency of RILs in the Andes have not been documented in detail, limiting the preparation plans of the competent authorities. Therefore, changes in RIL frequencies could negatively impact the Andes in future, increasing damage to the infrastructure. This work will analyse the variation in susceptibility to RILs in the Maipo River basin (as a representative case study for Central Andes) using a Bayesian approach that integrates geomorphological and precipitation constraints.
Worldwide, changes in susceptibility to RIL have been documented in the literature [5,6]. An accurate assessment of these changes necessitates the consideration of extreme precipitation events frequencies [7,8]. Such events significantly impact slope stability and the likelihood of landslides, leading to a diminished quality of life for affected populations. Evaluating this issue requires utilizing historical global precipitation data and considering temporal and spatial coverage [9,10]. Additionally, low-income countries face inherent limitations regarding instrumentation for RIL’s comprehensive monitoring and early warning systems [11]. The scarcity of precipitation data exacerbates the challenge of developing precise RIL susceptibility models. However, recent advancements in remote-sensing technology have enabled the estimation of global precipitation with reduced uncertainty [12,13]. Hence, implementing integrated approaches incorporating local data, remote sensing and a susceptibility approach becomes imperative to obtain a more precise and comprehensive assessment of changes in RIL susceptibility on a global scale.
Strategies have been generated in recent decades to define susceptibility to RIL using different approaches worldwide [14,15,16,17,18]. Mainly, susceptibility landslide models underestimate the geomorphological conditions, prioritizing the regional and local precipitation thresholds [11] and limiting their application in public policies [19]. Generally, methodological approaches are based on qualitative methods, semi-quantitative methods [20], statistical methods [18,21,22] and automatic-learning methods [21,23]. An accurate estimation of RIL susceptibility becomes essential to understanding and assessing the risks associated. A deep understanding of the prone landslide under different precipitation thresholds allows for generating better operational procedures for decision-makers [24]. A proper RIL susceptibility analysis provides robust information for the planning and implementation of mitigation and prevention measures, contributing to the protection of human life, infrastructure and the environment. These approaches are oriented toward understanding how slopes respond to RILs, enabling the creation of efficient early warning systems for RILEWS (Rainfall-Induced Landslide Early Warning Systems). At a regional scale, South America has shown an increase of human losses due to extreme precipitation events [25]. The human casualties reach critical levels due to the lack of early warning systems. The countries with the most significant RIL-related loss of life in South America are Colombia and Perú [26,27,28,29]. However, Ecuador and Chile have seen an increase in the rate of occurrence and damage caused to the population [30]. RIL events in the Central Andes stand out, increasing their frequency in the province of Mendoza, Argentina [2,4,31]. In Refs. [2,32,33,34], the Central Andes stand out, a place with strong structural and lithological control [32,33,35]. The Central Andes region, spanning from 28° to 36 °S, exhibits a consistent lithological and structural pattern along its north-south distribution. Stand-out lithological variability with an east-west trend is primarily influenced by tectonic structures such as folds and faults [32,33]. These structures allow the identification of deformation and collision processes influenced by regional orogenesis over time. These distinctive features will enable the selection of representative areas, which can provide substantial information for surface process studies and facilitate the establishment of generalizations based on these representative areas.
The article evaluates the spatial and temporal variability in RIL susceptibility in the Maipo River basin, a heavily populated Andean basin in the Central Andes. Analysing the likelihood of RIL events occurring under different precipitation thresholds makes it possible to determine RIL susceptibility. The study used probability functions (Probit/Logit models) based on a machine-learning approach (logistic models), using remote sensing, geomorphological and hydrometeorological data. This methodology can be integrated as RILEWS to assess the river basin’s threat level and how this can be affected in the short and medium term by hydrometeorological events. The rest of the article is organised as follows: Section 2 presents the study zone’s characteristics and its most characteristic features. Section 3 explains the methodology (for example, the Probit and Logit functions), databases and approaches used to evaluate the variation in RIL susceptibility. Section 4 provides the results obtained in the modelling and the spatial relationship present for the values obtained. Section 5 discusses the models’ performance and the feasibility of being integrated into a future LEWS. Finally, in Section 5, there is a conclusion.

2. Materials and Methods
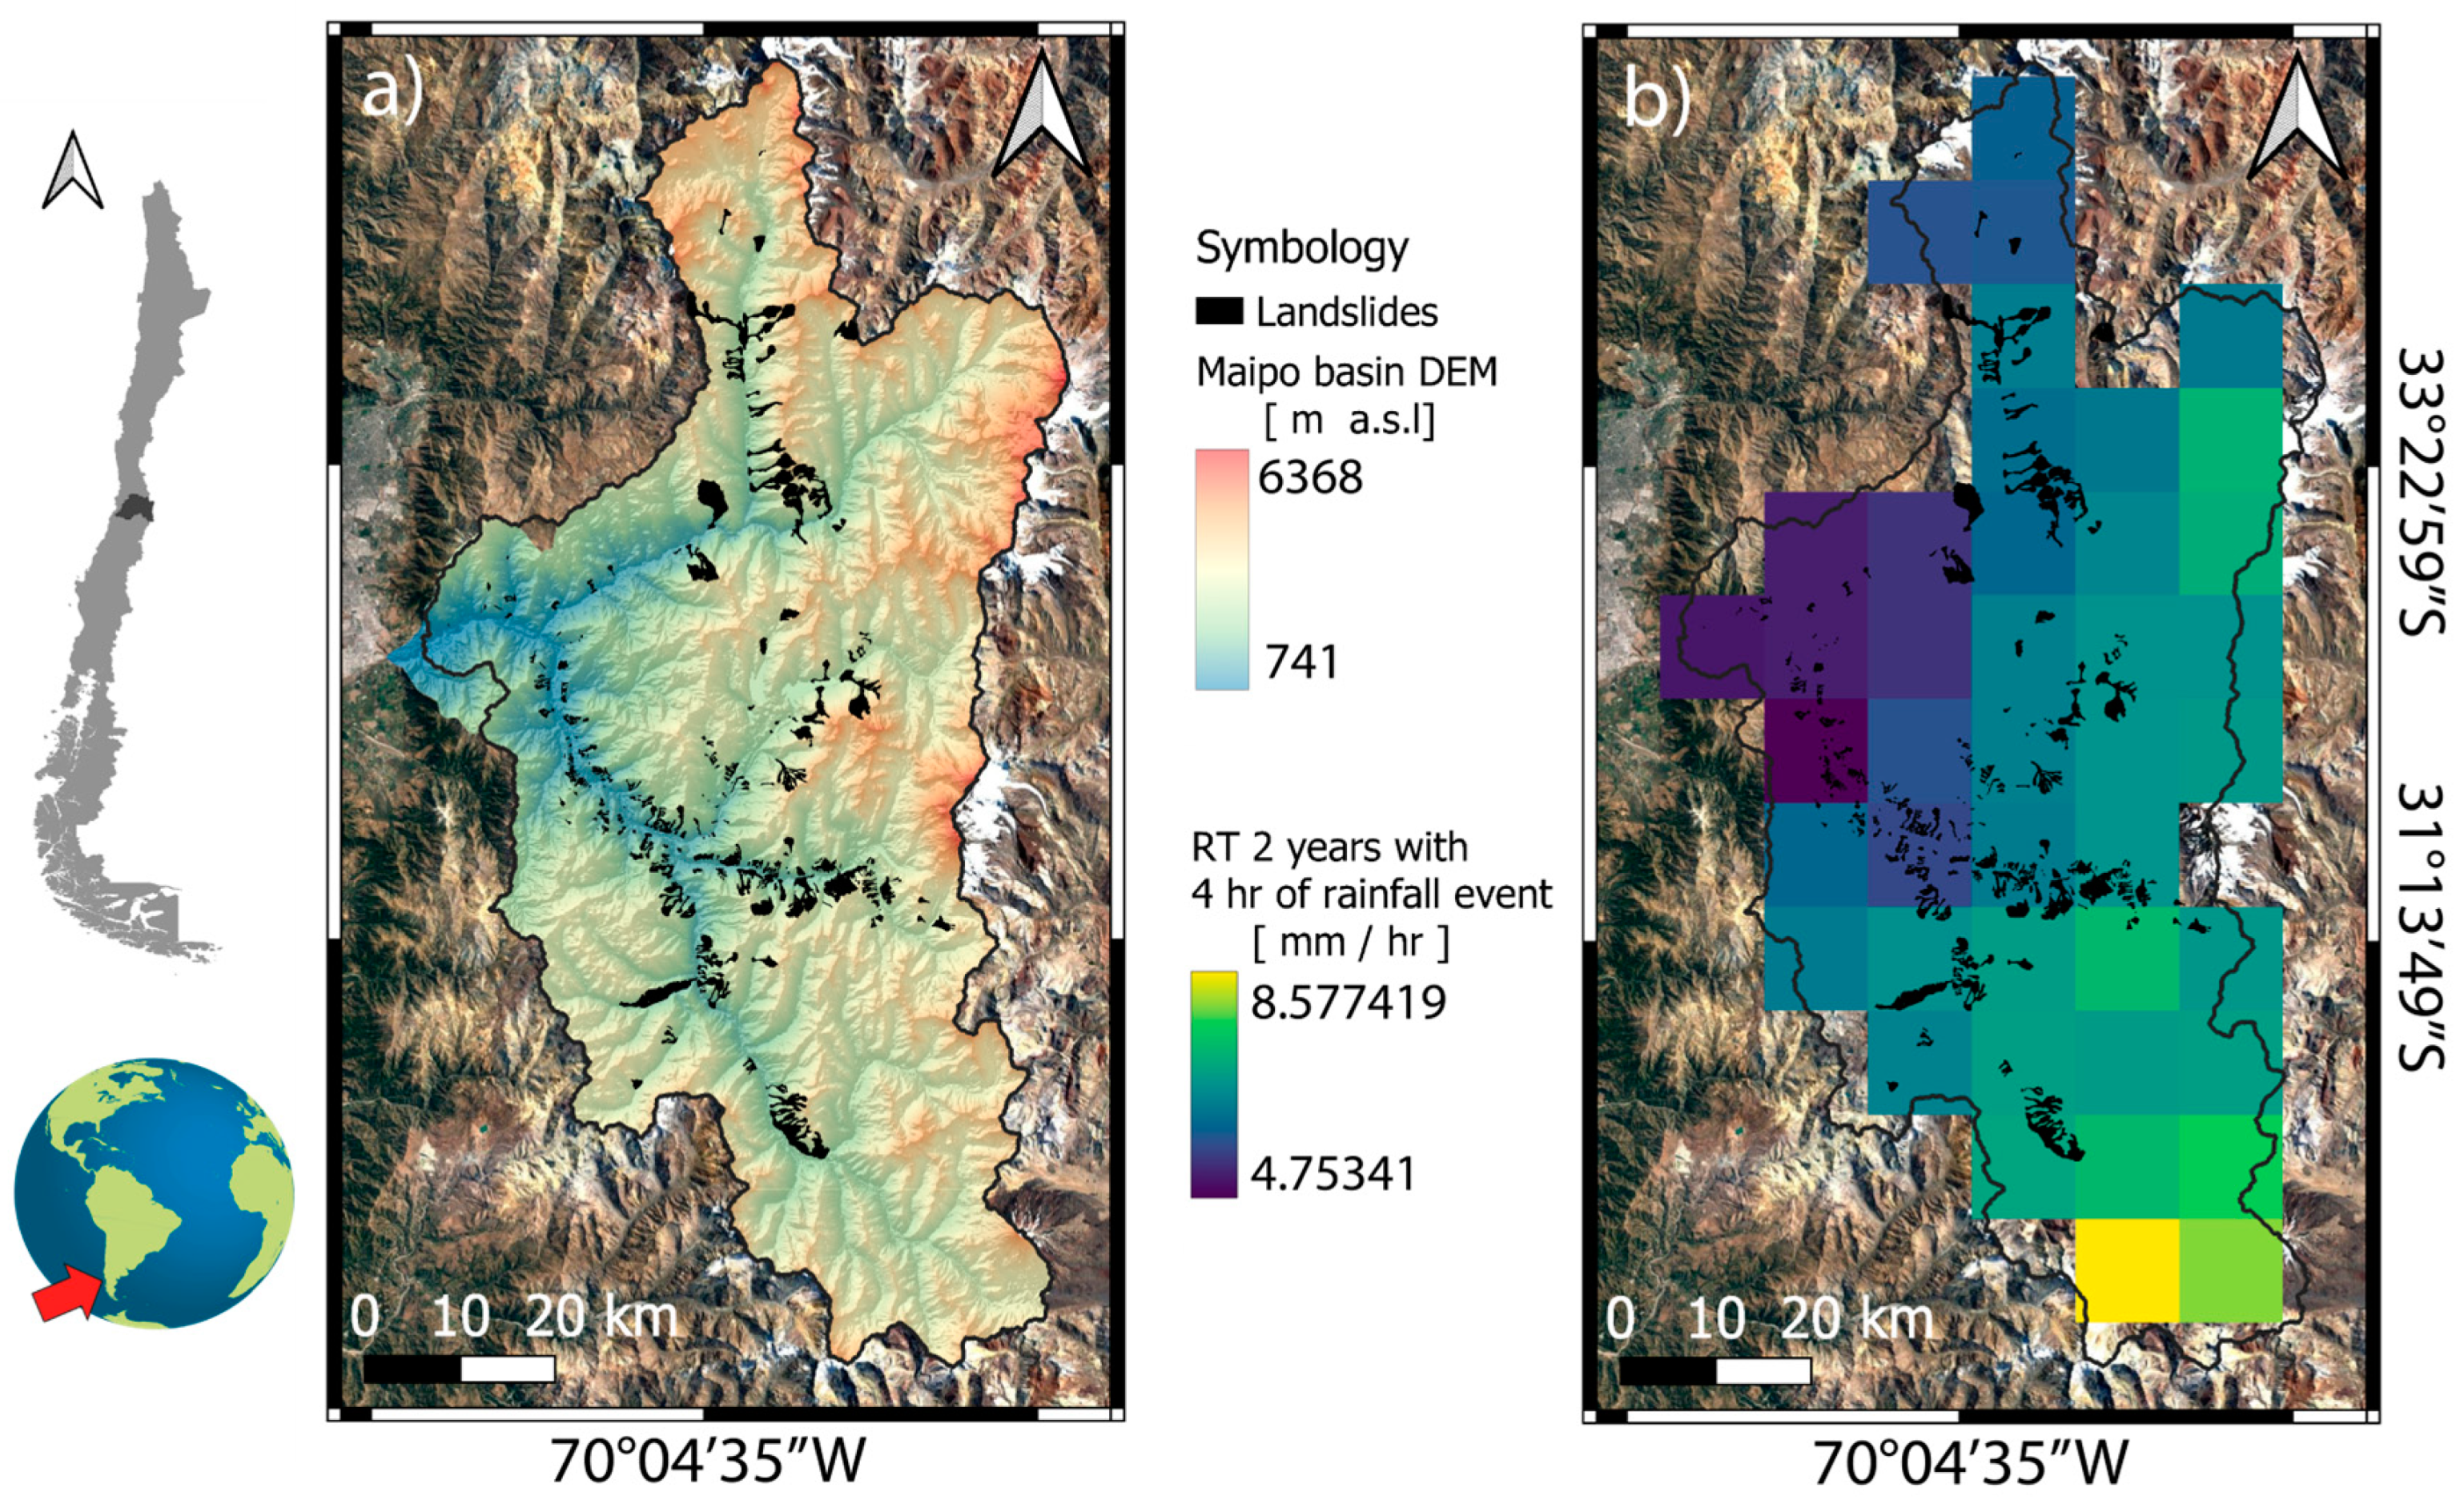
2.1. Study Zone

The Maipo basin is located in the Central Andes (33 °S/70 °W) (Figure 1). The zone has high summits and extensive valleys resulting from the action of different climate controls, particularly glacial and erosional processes related to the Andes Mountains rivers [36,37]. The zone presents uneven terrain, which exposes geological processes like kilometres-long deformations and faulting, volcanism, zones with hydrothermal alteration and geothermal centres. These properties generate RIL in the area due to modifying the terrain features, emphasizing topographic changes and soils with clay due to hydrothermal alteration [38]. From the above, the site is highly susceptible to RIL, but without knowing its impact beyond a qualitative analysis.
Lithologies of the area could be separated into two rock sets. The eastern boundary of the Maipo River basin exhibits sedimentary, volcanic and highly deformed volcano-sedimentary units from the Mesozoic Era [34]. In contrast, over the central and western areas of the basin, volcanic and volcano-sedimentary units from the Cenozoic Era emerge with less deformation. This group also includes the current volcanic and sedimentary products. The emplacement of the different bodies was controlled by the inversion of normal faults and by the Aconcagua fold and thrust belt, which affected both basement blocks and sedimentary cover [35] (Figure 1).
The area’s climate is warm and temperate, showing rainier winters than summers, classified as Csb (Mediterranean) according to the Köppen–Geiger system. The precipitation stations installed in the Maipo basin show annual values of 1177 mm [39]. Moreover, the driest months run between November to March, with an average value of 29 mm. The highest precipitation occurs between April and September, with monthly precipitation averaging nearly 100 mm [39]. The precipitation patterns of the last few decades have gradually decreased with extreme precipitation events. Hydrometeorological events with precipitation peaks exceeding 160 mm have increased, generating RILs and floods in the Maipo River [19,40,41]. However, in the last 60 years, the zone has experienced devastating landslides, which have had a significant economic and social impact on Chile as a nation [19,27,42]. Some registered events correspond to the 2013, 2016 and 2021 RILs [3,19,42]. The fast vertical changes of the 0 isotherms generate liquid precipitation over snow-covered soil, triggering landslides, mudflow and debris flow in the area [19,42]. These events are relevant due to their proximity to densely populated communities. A good example corresponds to the extreme precipitation events of the year 2013, where intense precipitation generated favourable conditions to saturate the soil and lose slope stability (Figure 2). The results of this event were numerous landslides and debris flows, generating damages in public infrastructure. These cases, without notice, increase the infrastructure damage and economic losses, reducing the inhabitants’ quality of life.

2.2. Methodology

We used geomorphological and precipitation forcing in the Central Andes to evaluate the spatial and temporal variability in RIL susceptibility. The study proposes that the occurrence of RILs could be assessed by logistic distributions, allowing the analysis of RIL’s probability under scarce dataset availability. Geomorphological indicators and spatially distributed precipitation data are used, and the probability establishes “landslide likely” or “landslide not likely”. Next, we present a methodological scheme where the input data is used along the implementation stages (cal/val) to evaluate the susceptibility of RIL occurrences according to different precipitation scenarios based on intensity/duration/frequency (IDF) curves.

2.2.1. Data

The in situ evidence shows that precipitation and topography promote generation of RILs in the study zone [19,42]. A complete database was created using CHIRPS data on topography and daily precipitation. The topographic data include elevation and slope angle values derived from 1-arc second SRTM, RIL spatial and temporal distributions, and slope standard dispersion along the material release area. To assess the performance using external data from the Bayesian models, the initial database was separated into calibration and validation databases.
The study area has 14 weather stations, of which most have fewer than 15 years of data with a high presence of gaps. Moreover, the stations are placed in the lower parts of the basin, not being suitable to measure the precipitation in the generation zone of the RIL. Therefore, a low temporal extension of the weather stations becomes difficult to use as reference stations. Moreover, many landslides have no weather data in older periods (previous to 2000). To overpass this limitation, several satellite precipitation products such as PERSIAN, TMPA, CMORPH or CHIRPS allow one to reduce the spatial coverage of estimates, reaching the 0.05 degree. The CHIRPS product utilized daily estimations to constrain precipitation values for each RIL event with exact dates and localization. This approach proved instrumental in addressing the area’s limited availability of hydrometeorological data. Sub-daily scale analysis was not feasible due to the absence of landslide occurrence timestamps in the historical databases. Previous studies established that CHIRPS has lower uncertainty metrics becoming suitable for hydrological applications. The precipitation data were correlated using a point-pixel approach with the spatial location of the existing RILs in the registry. In the same way, a library of intensity/duration/frequency (IDF) curves of precipitation events were considered from CHIRPS products [12]. The IDF product has intensity values under different return periods of 2, 5, 10 and 25 years with durations of 4, 8, 12 and 24 h. The IDF dataset has a spatial coverage that accurately estimates the impact of different extreme precipitation events in the river basin by evaluating its degree susceptibility changes.
Geomorphological characteristics were integrated using the SRTM (Shuttle Radar Topography Mission), forcing the spatial resolution at 30 m. In recent decades, SRTM products have been used by the geoscientific community to perform complex treatments of the spatial data [11,44,45]. SRTM is suitable to understand the geomorphological features of the terrain, becoming a useful support in landslide assessment. RIL assessment was carried out using SRTM in numerical modelling [16,46,47], or predictive models [48]. We used two geomorphological features in our approach. First, we utilised surface slope values as a proxy to assess steepness, and second, we considered the standard deviation of the slope within a 60 m radius of each pixel. This comprehensive approach allowed us to capture the dispersion of elevations over a short distance, revealing the soil’s predisposition to generate RIL (Rainfall-Induced Landslide) events.
We used RIL registry, provided by the National Geology and Mining Service (SERNAGEOMIN) previously used by [11]. The dataset has 500 events in the Central Andes; however, 100 RILs are emplaced inside the basin, and just 58 had an exact date. The final database includes mudflows, debris flows and landslides. This catalogue of landslides is the most complete to date, being improved by the integration of global sources such as the Global Landslide Catalogue (GLC) [11] and the Global Fatal Landslide Database (GFLD) [49] used in other studies [9,50].
It is important to note that integrating CHIRPS and SRTM may introduce uncertainties due to the different spatial resolutions of these two products. However, despite this consideration, numerous hydrological [51,52] and natural hazard studies [53,54,55] have consistently demonstrated that integrating these sources allows for rigorous analyses with scientific validity.

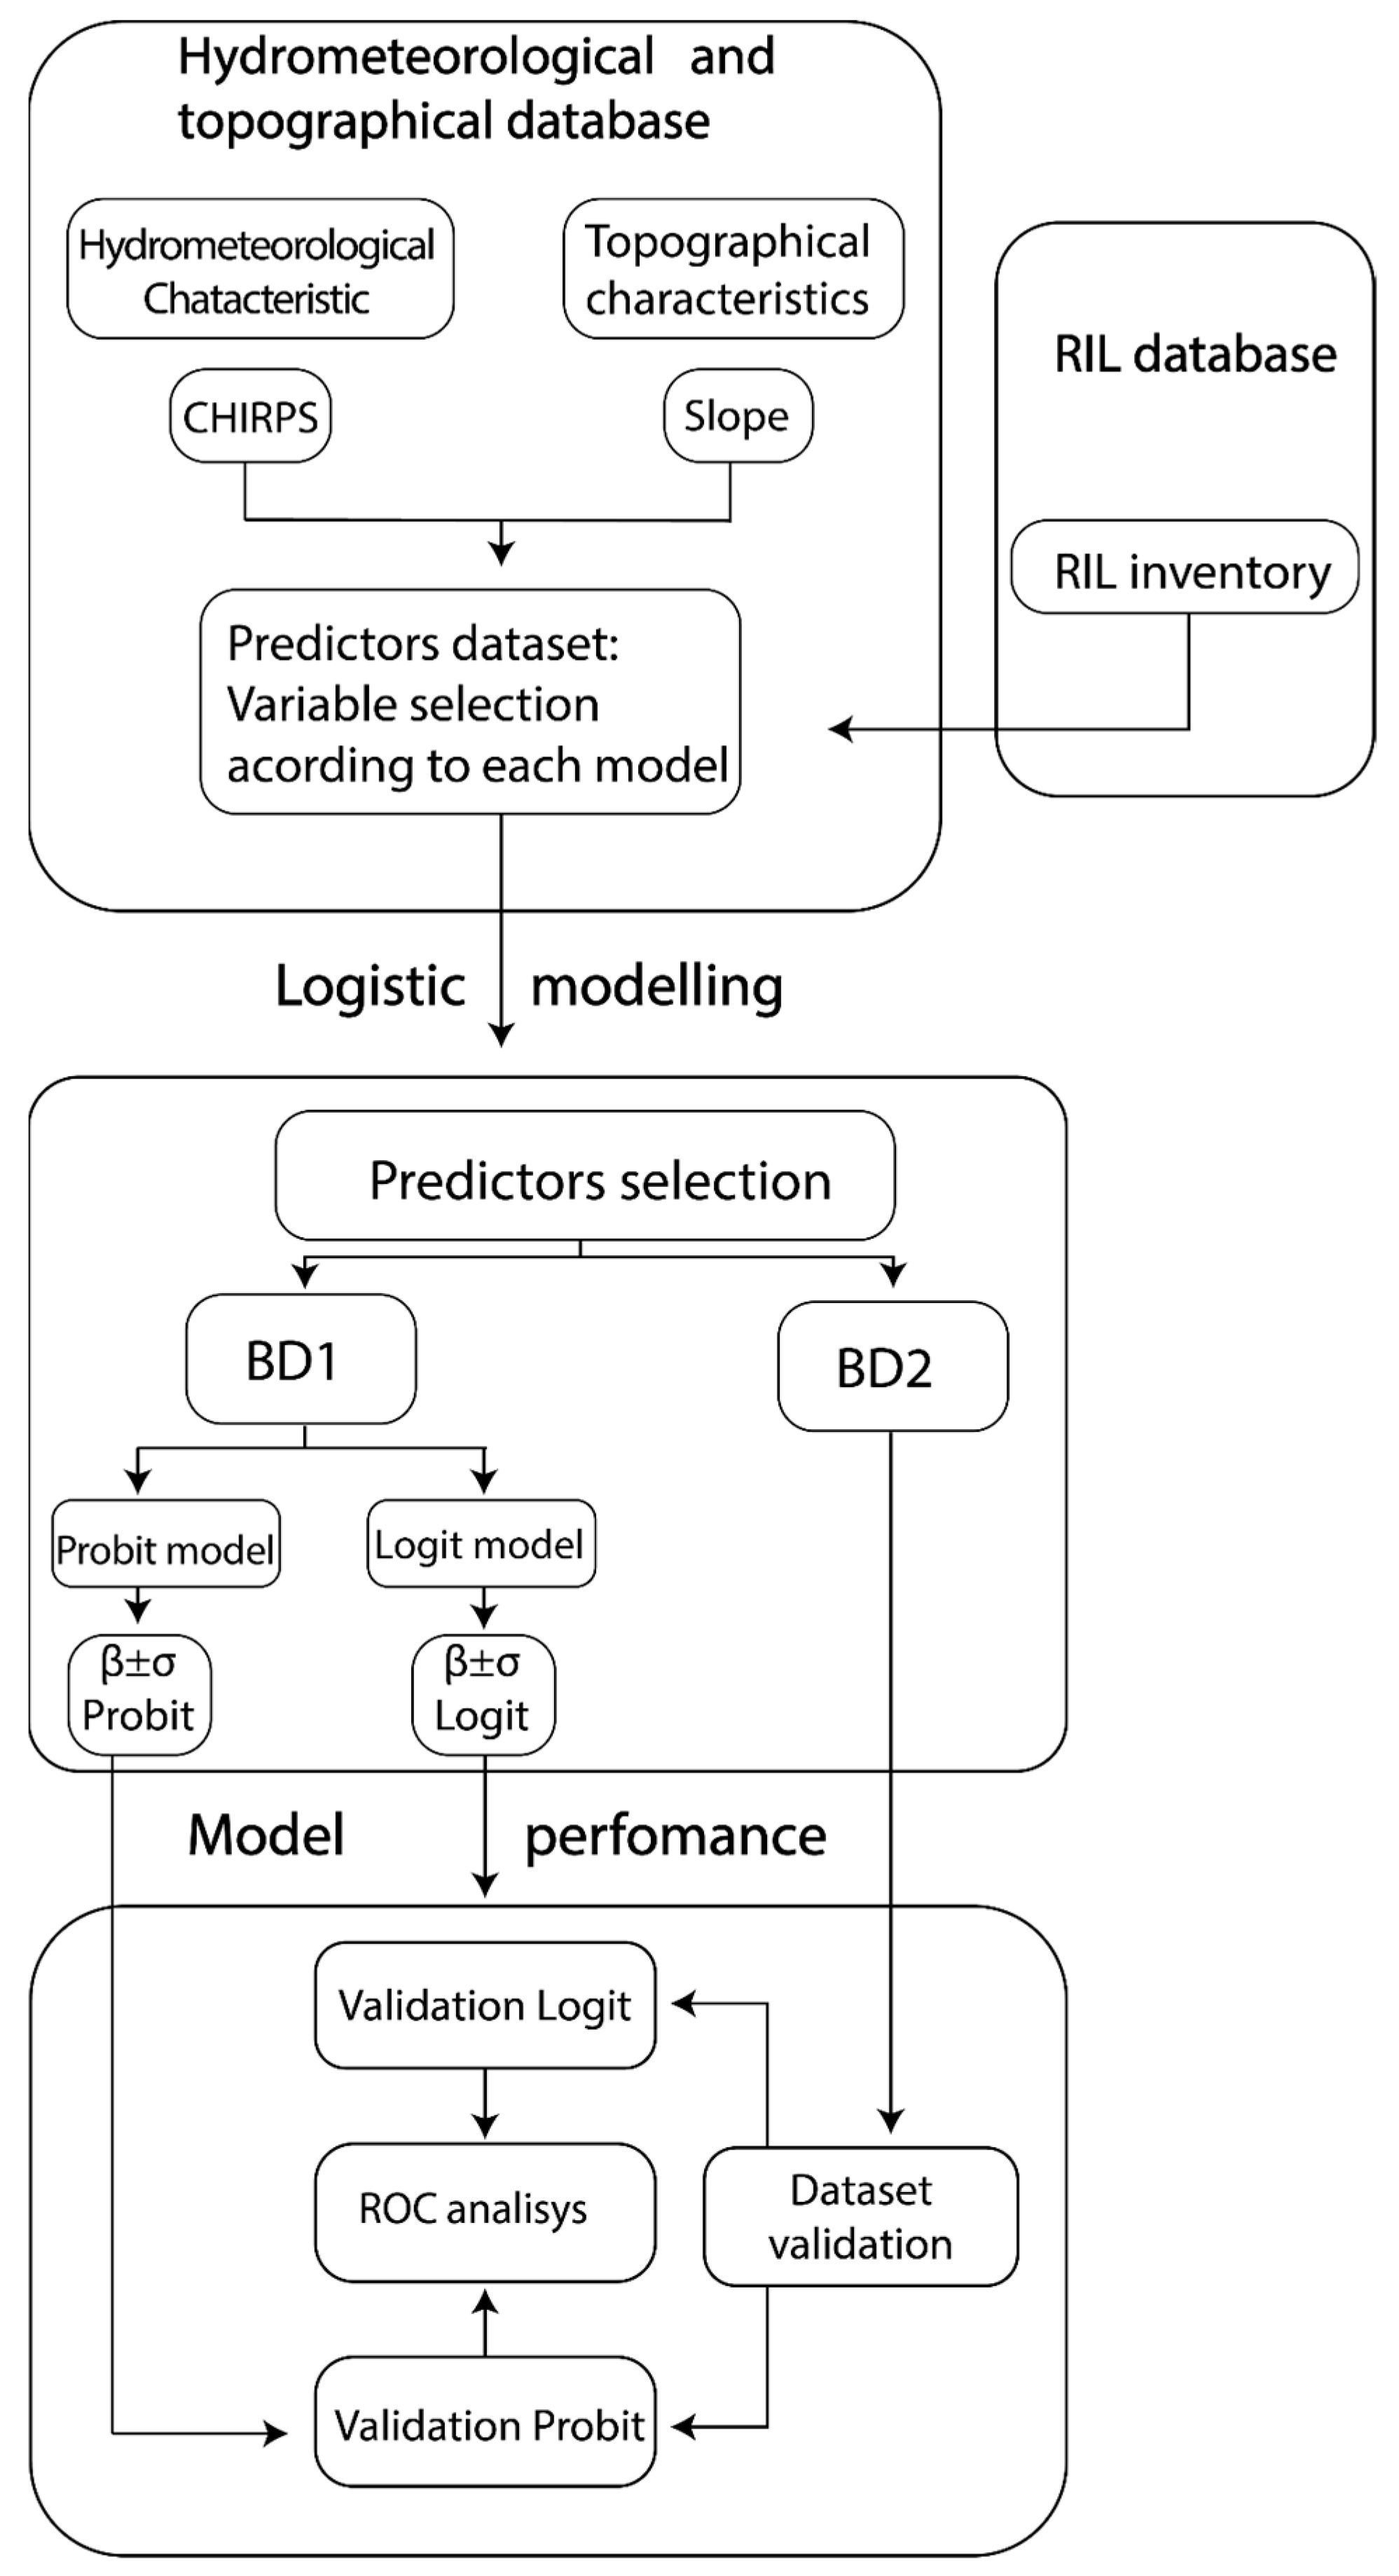
2.2.2. Model Training and Validation

To generate a spatially distributed susceptibility model, a logistic model will be maintained. The database is integrated into a Bayesian inference model. Bayesian models are useful tools for establishing models with limited data and low computational consumption, allowing operational functionality in LEWS. As the primary approach, this work will consider implementing a statistical model based on the Logit and Probit probability models (Figure 3), which have demonstrated promising results in the Southern Andes [11,15,16]. The database was separated into a calibration database (SDB1) and a validation database, independent from the calibration database (SDB2). The separation rate is 50/50%.
The Logit distribution model fits the occurrence probability of an event by a logistic curve. The Logit (L) distribution model is given by Equation (1).
L   ( l i   = 1 ) = e x p   ( β o + k = 1 N   β K X K ) 1 + e x p   ( β o + K = 1 N   β K X K )   ,
where L ( l i = 1) is the RIL occurrence probability, N is the number of predictors used ( X K ), β K is the coefficient of the function and β o is the intercept. A Probit distribution also uses binary dependent variables; its main difference with the logit distribution is the inverse normal distribution [56]. The Probit (P) distribution is given by Equation (2).
P   ( y i = 1 ) = ϕ 1   ( β o + K = 1 N   β K X K + ϵ )
where k ,   β and X k refer to the same variables as the logit distribution, ϵ is the error in the fit with the standard normal distribution, and ϕ 1 denotes an inverse normal probability function [57]. The two distributions were implemented using three predictors that correspond to daily precipitation, slope and dispersion of the slope in a range of 90 m. A calibration set was selected 100 times to obtain β k and their standard deviations are denoted by k , respectively.
A Receiver Operating Characteristic (ROC) analysis was performed from the results obtained to evaluate the model’s performance. A ROC analysis assesses the model’s capacity to correctly classify RIL events under the geomorphological and precipitation conditions that triggered them in space and time. Thus, it is possible to determine the ability to fit the calibration data with the validation values as a future prognosis tool, for example, in the case of future RILEWS.
ROC analysis evaluated each regression’s quality using the independent database DB2 (Figure 3). The DB2 georeferenced to the initial Rainfall-Induced Landslide initiation area. The landslide susceptibility zones were compared with the pixel of the generated model (the pixel that includes the point). Thus, the degree of accuracy in identifying a new RIL under different slopes and precipitation conditions was determined. A probability threshold (tolerance) was established to define the moment at which the models correctly identify a RIL event.
We evaluated the sensitivity (S) using the validation database. Thus, the sensitivity of the RIL prediction can be characterised by its operational implementation in future RILEWS. Then, the sensitivity of each iteration was estimated (Equation (3)), which represents the capacity of the set of estimators to correctly detect RIL events [58]. In addition, the specificity (E) was calculated (Equation (4)) to evaluate the ability to detect non-RIL events or true negatives (TN) to avoid false positives (FP) [58].
S = T P T P + F N
E = T N T N + F P
where: S = Sensitivity, E = Specificity, TP = True positive, FN = False negative, TN = True negative, FP = False positive.

2.2.3. Spatial and Temporal Assessment

Following the model validation by ROC analysis, a basin’s response under different precipitation thresholds was assessed (Figure 3). We used IDF curves generated in previous studies [12] for Chile’s entire central zone by considering a daily temporal resolution. The IDF curve maps are resampled from the original 10 km to values of 30 m according to the native resolution of the logistic model. Thus, the impact of different precipitation intensities can be evaluated on the slopes of the river basin to understand the most susceptible zones and if they change under different precipitation conditions. From this, the probability changes in the river basin were analysed.

3. Results

The section provides the results obtained from the modelling strategy. We used predictive Logit and Probit models to determine the probability distribution of RIL occurrence (Section 3.1). Additionally, we evaluated the variation in RIL occurrence probabilities considering hydrometeorological scenarios (Section 3.2).

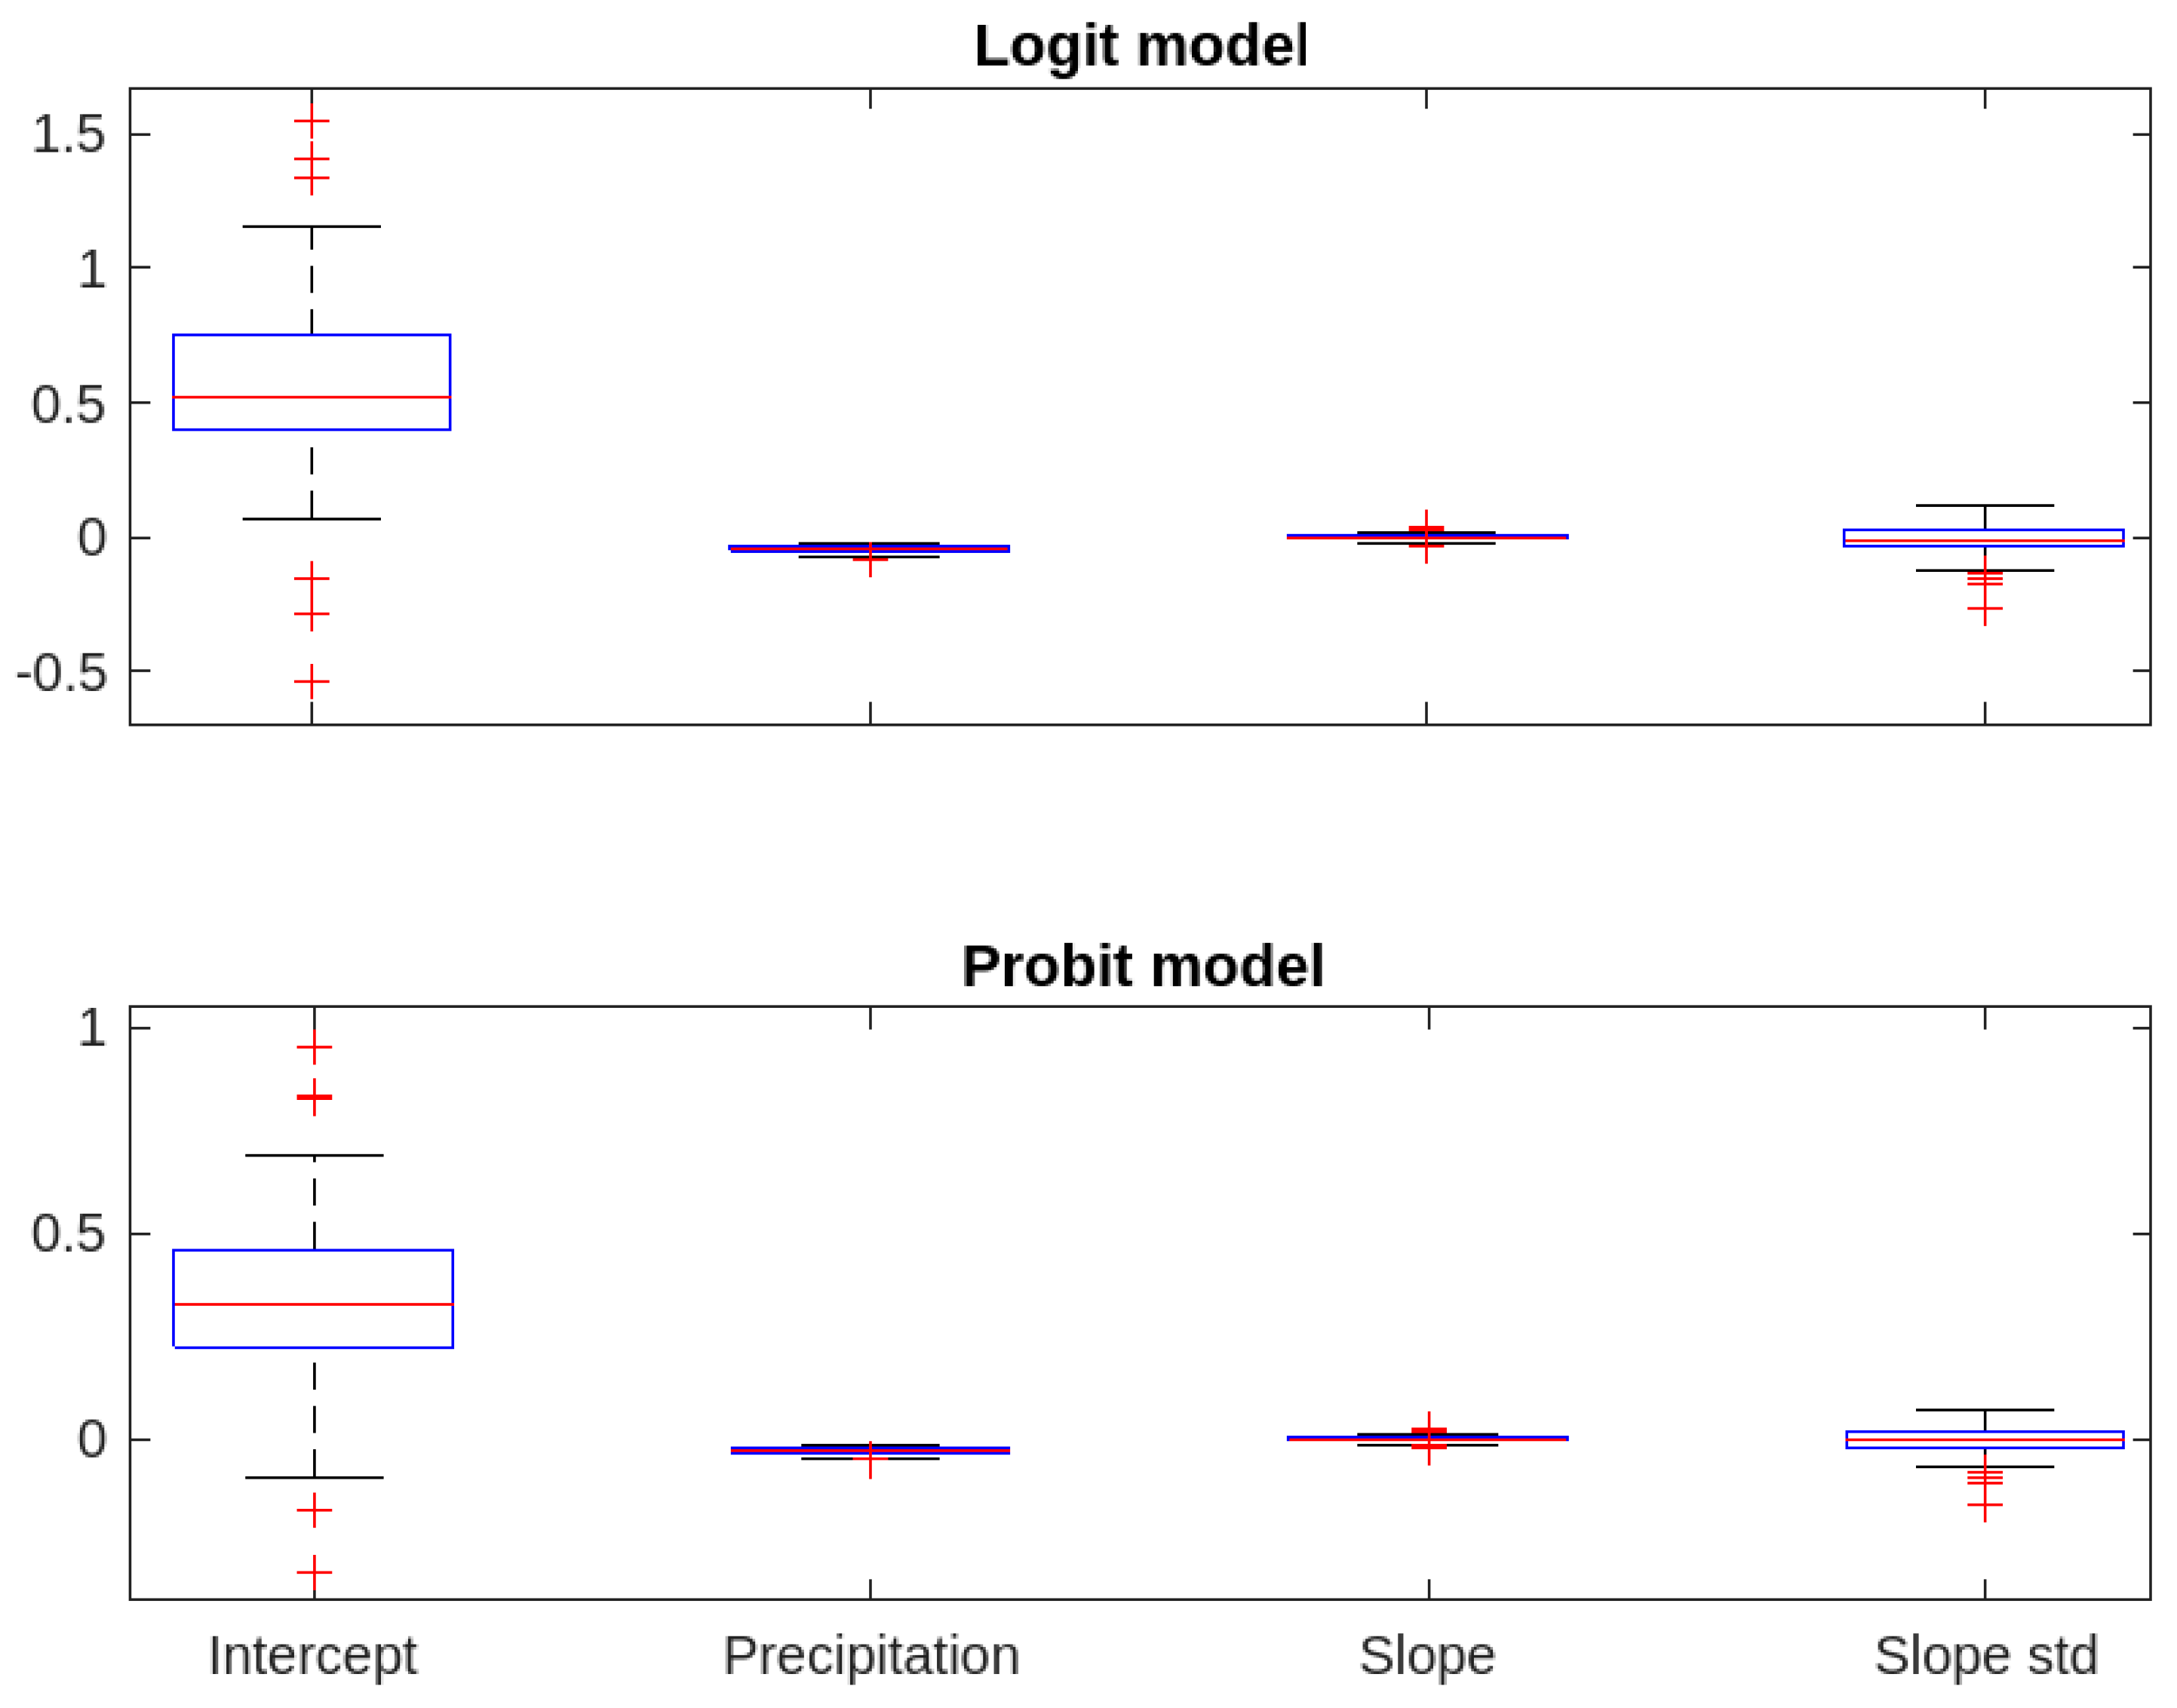
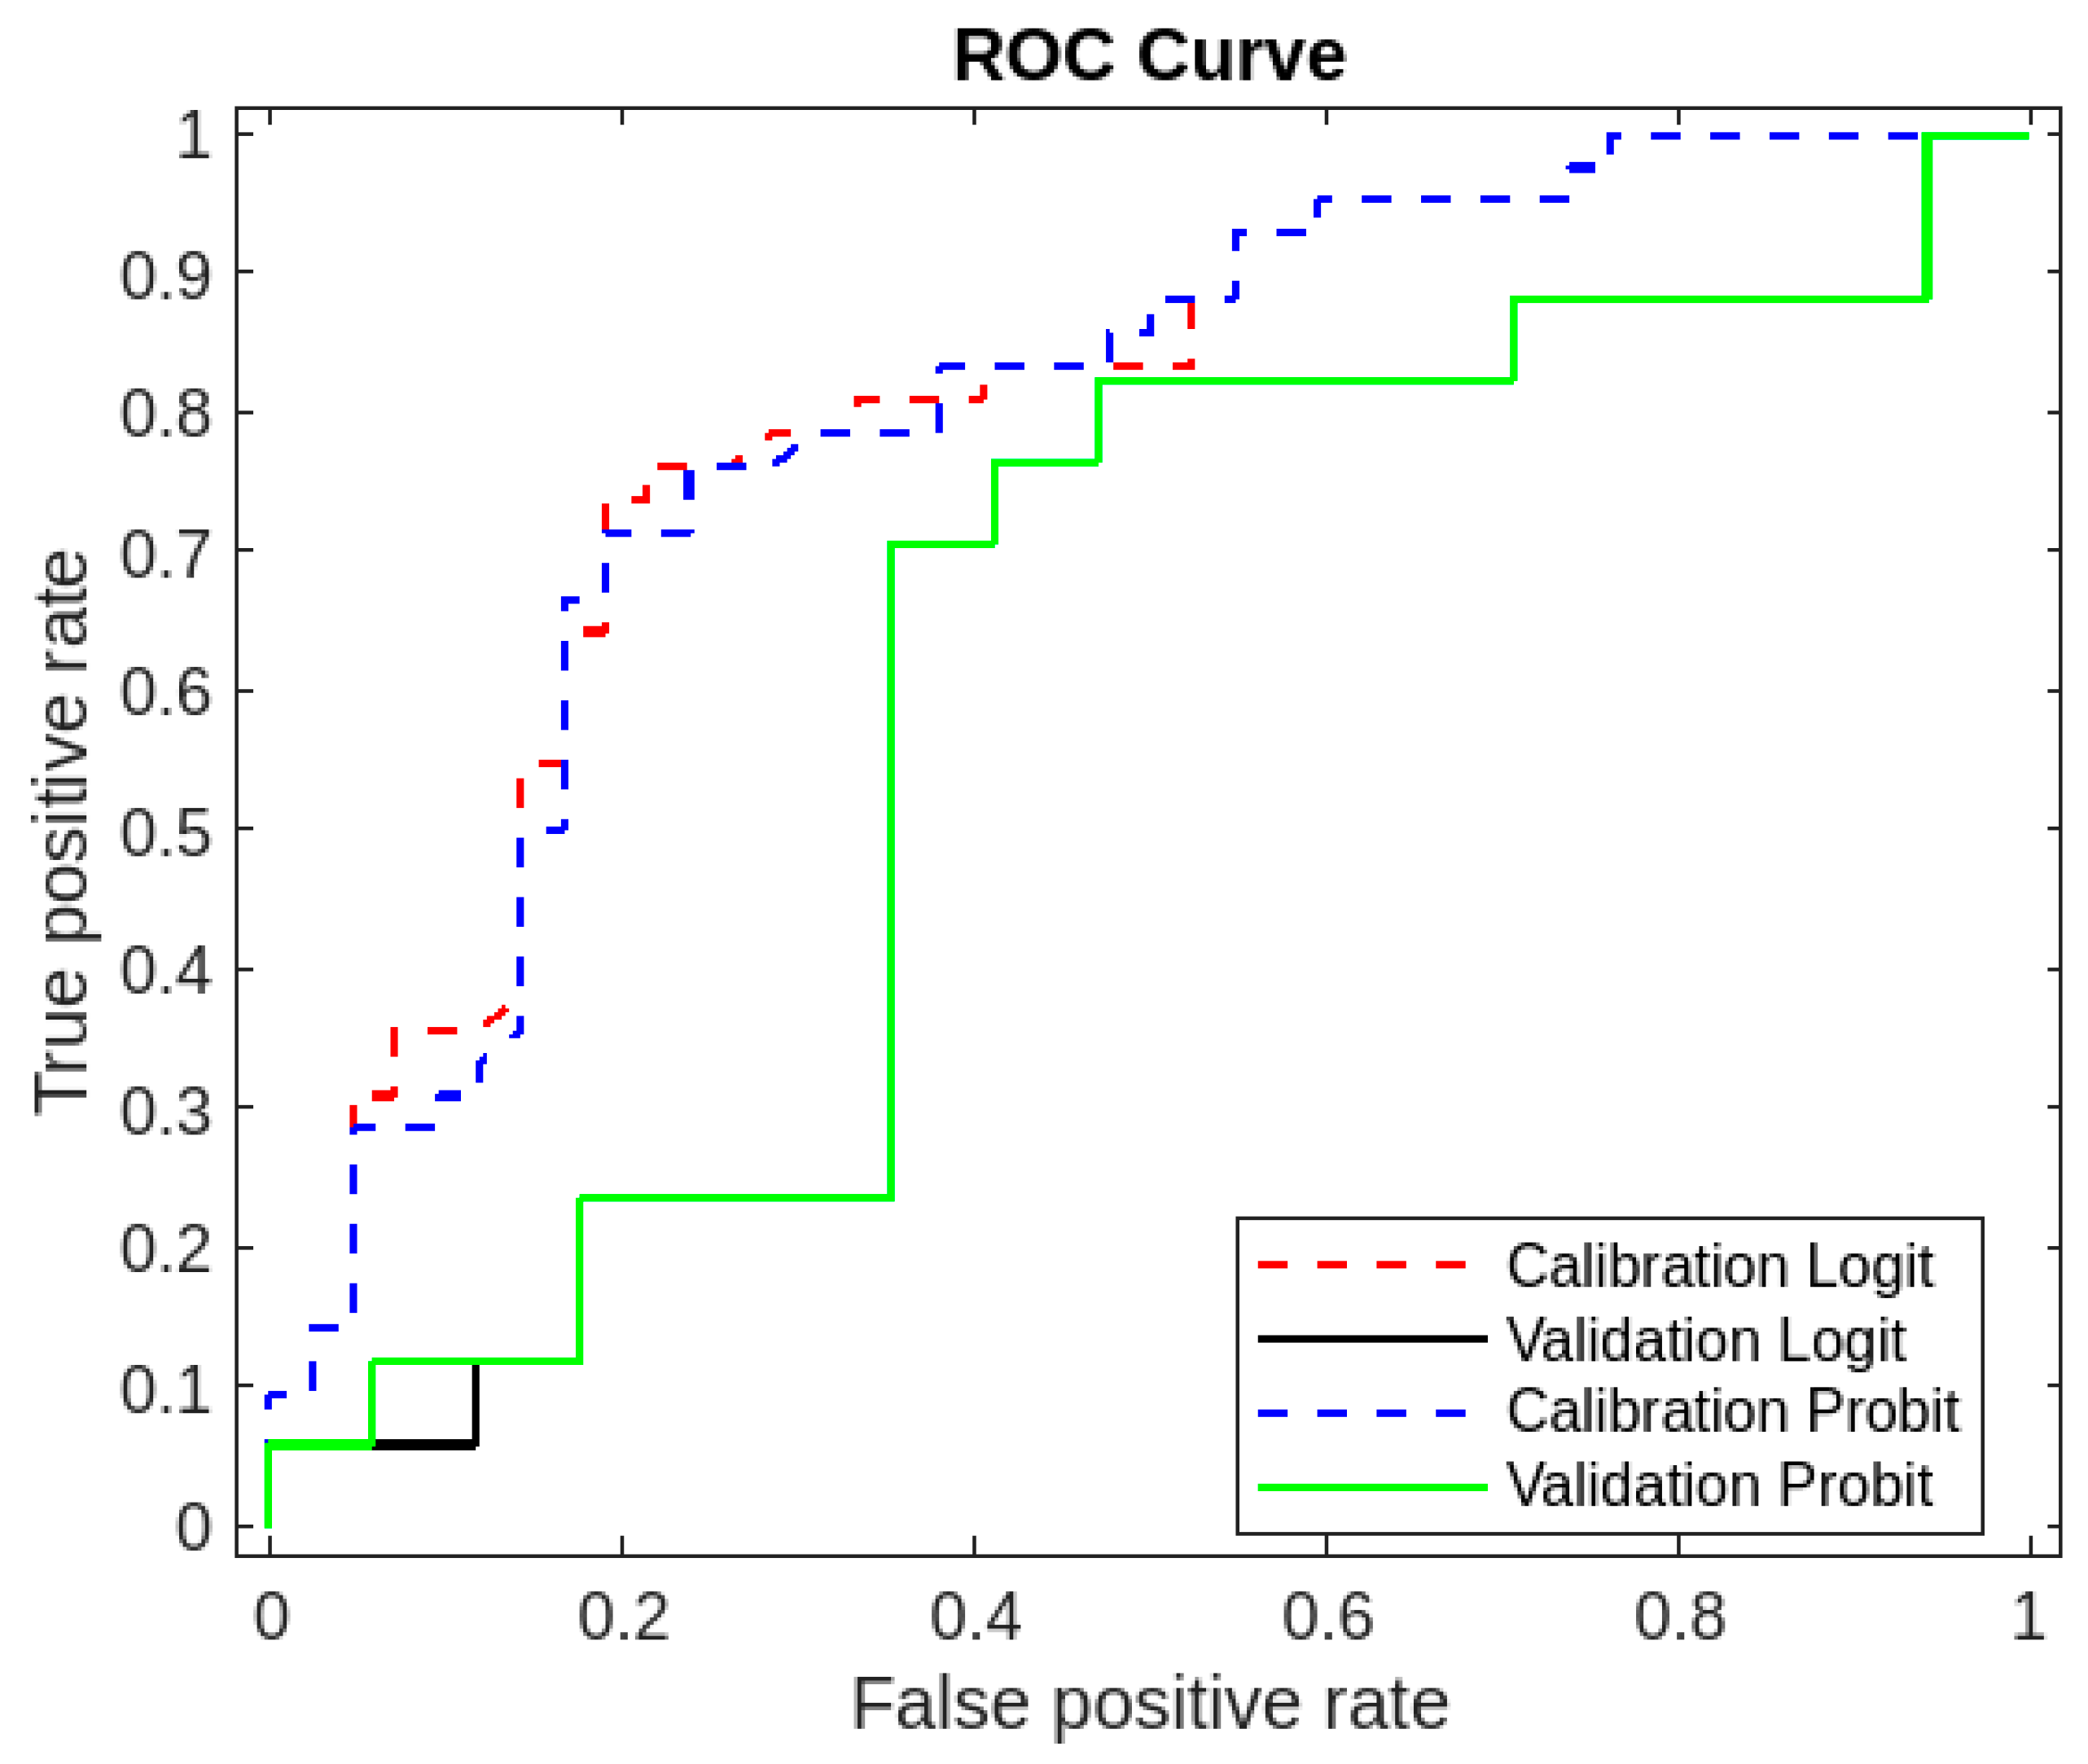
3.1. Model Training and Validation

The estimators selected for the Logit and Probit models are the variables precipitation, slope, standard deviation of the slope (Slope std) and intercept (Figure 4). For the Logit model, the precipitation estimator presented a median of −0.042963 with a 75th percentile of −0.034747 and a 25th percentile of −0.051299. For the slope estimator, a median of 0.0012559 was obtained, with a 75th percentile of 0.0074464 and a 25th percentile equal to −0.0038287. Moreover, the slope standard deviation estimator showed an estimated median equal to −0.0094525 and 75th percentile of 0.027428, and a 25th percentile of −0.033528. Additionally, the intercept estimator had a median of 0.52208, with 75th and 25th percentiles of 0.74902 and 0.39865, respectively (Figure 4).
Moreover, for the Probit model, the estimator precipitation presented a median equal to −0.026656, with the 75th percentile equal to −0.019658 and the 25th percentile equal to −0.031279. The variable slope presented a median of 0.00046619, 75th percentile of 0.0035535 and 25th percentile equal to −0.0027549. The standard deviation of the slope had a median equal to −0.0037141. Meanwhile, the 75th percentile showed a value of 0.020158, and the 25th percentile reached −0.017904. Finally, the intercept estimator presented a median of 0.32954, with 75th and 25th percentiles equal to 0.46231 and 0.22477, respectively.
The validation and calibration curves obtained for the Logit and Probit models show results that exceed 0.79 for calibration and 0.60 for validation. Table 1 summarises the calibration and validation values for the Logit and Probit models, respectively. The calibration value obtained for the Logit function was 0.7965, while the Probit function reached 0.7908. The validation values slightly decrease to 0.6021 for the Logit function and 0.6055 for the Probit model. The ROC curve shows differences between the validation and calibration curves of the Logit and Probit models (Figure 5). The calibration curves of the Logit and Probit models exhibit a better fit, emphasizing the low values in false positive rate cases and high values in true positive rate cases. In contrast, the validation curves of the Probit and Logit models always have higher rates of false positives and lower rates of true positives (Figure 5).

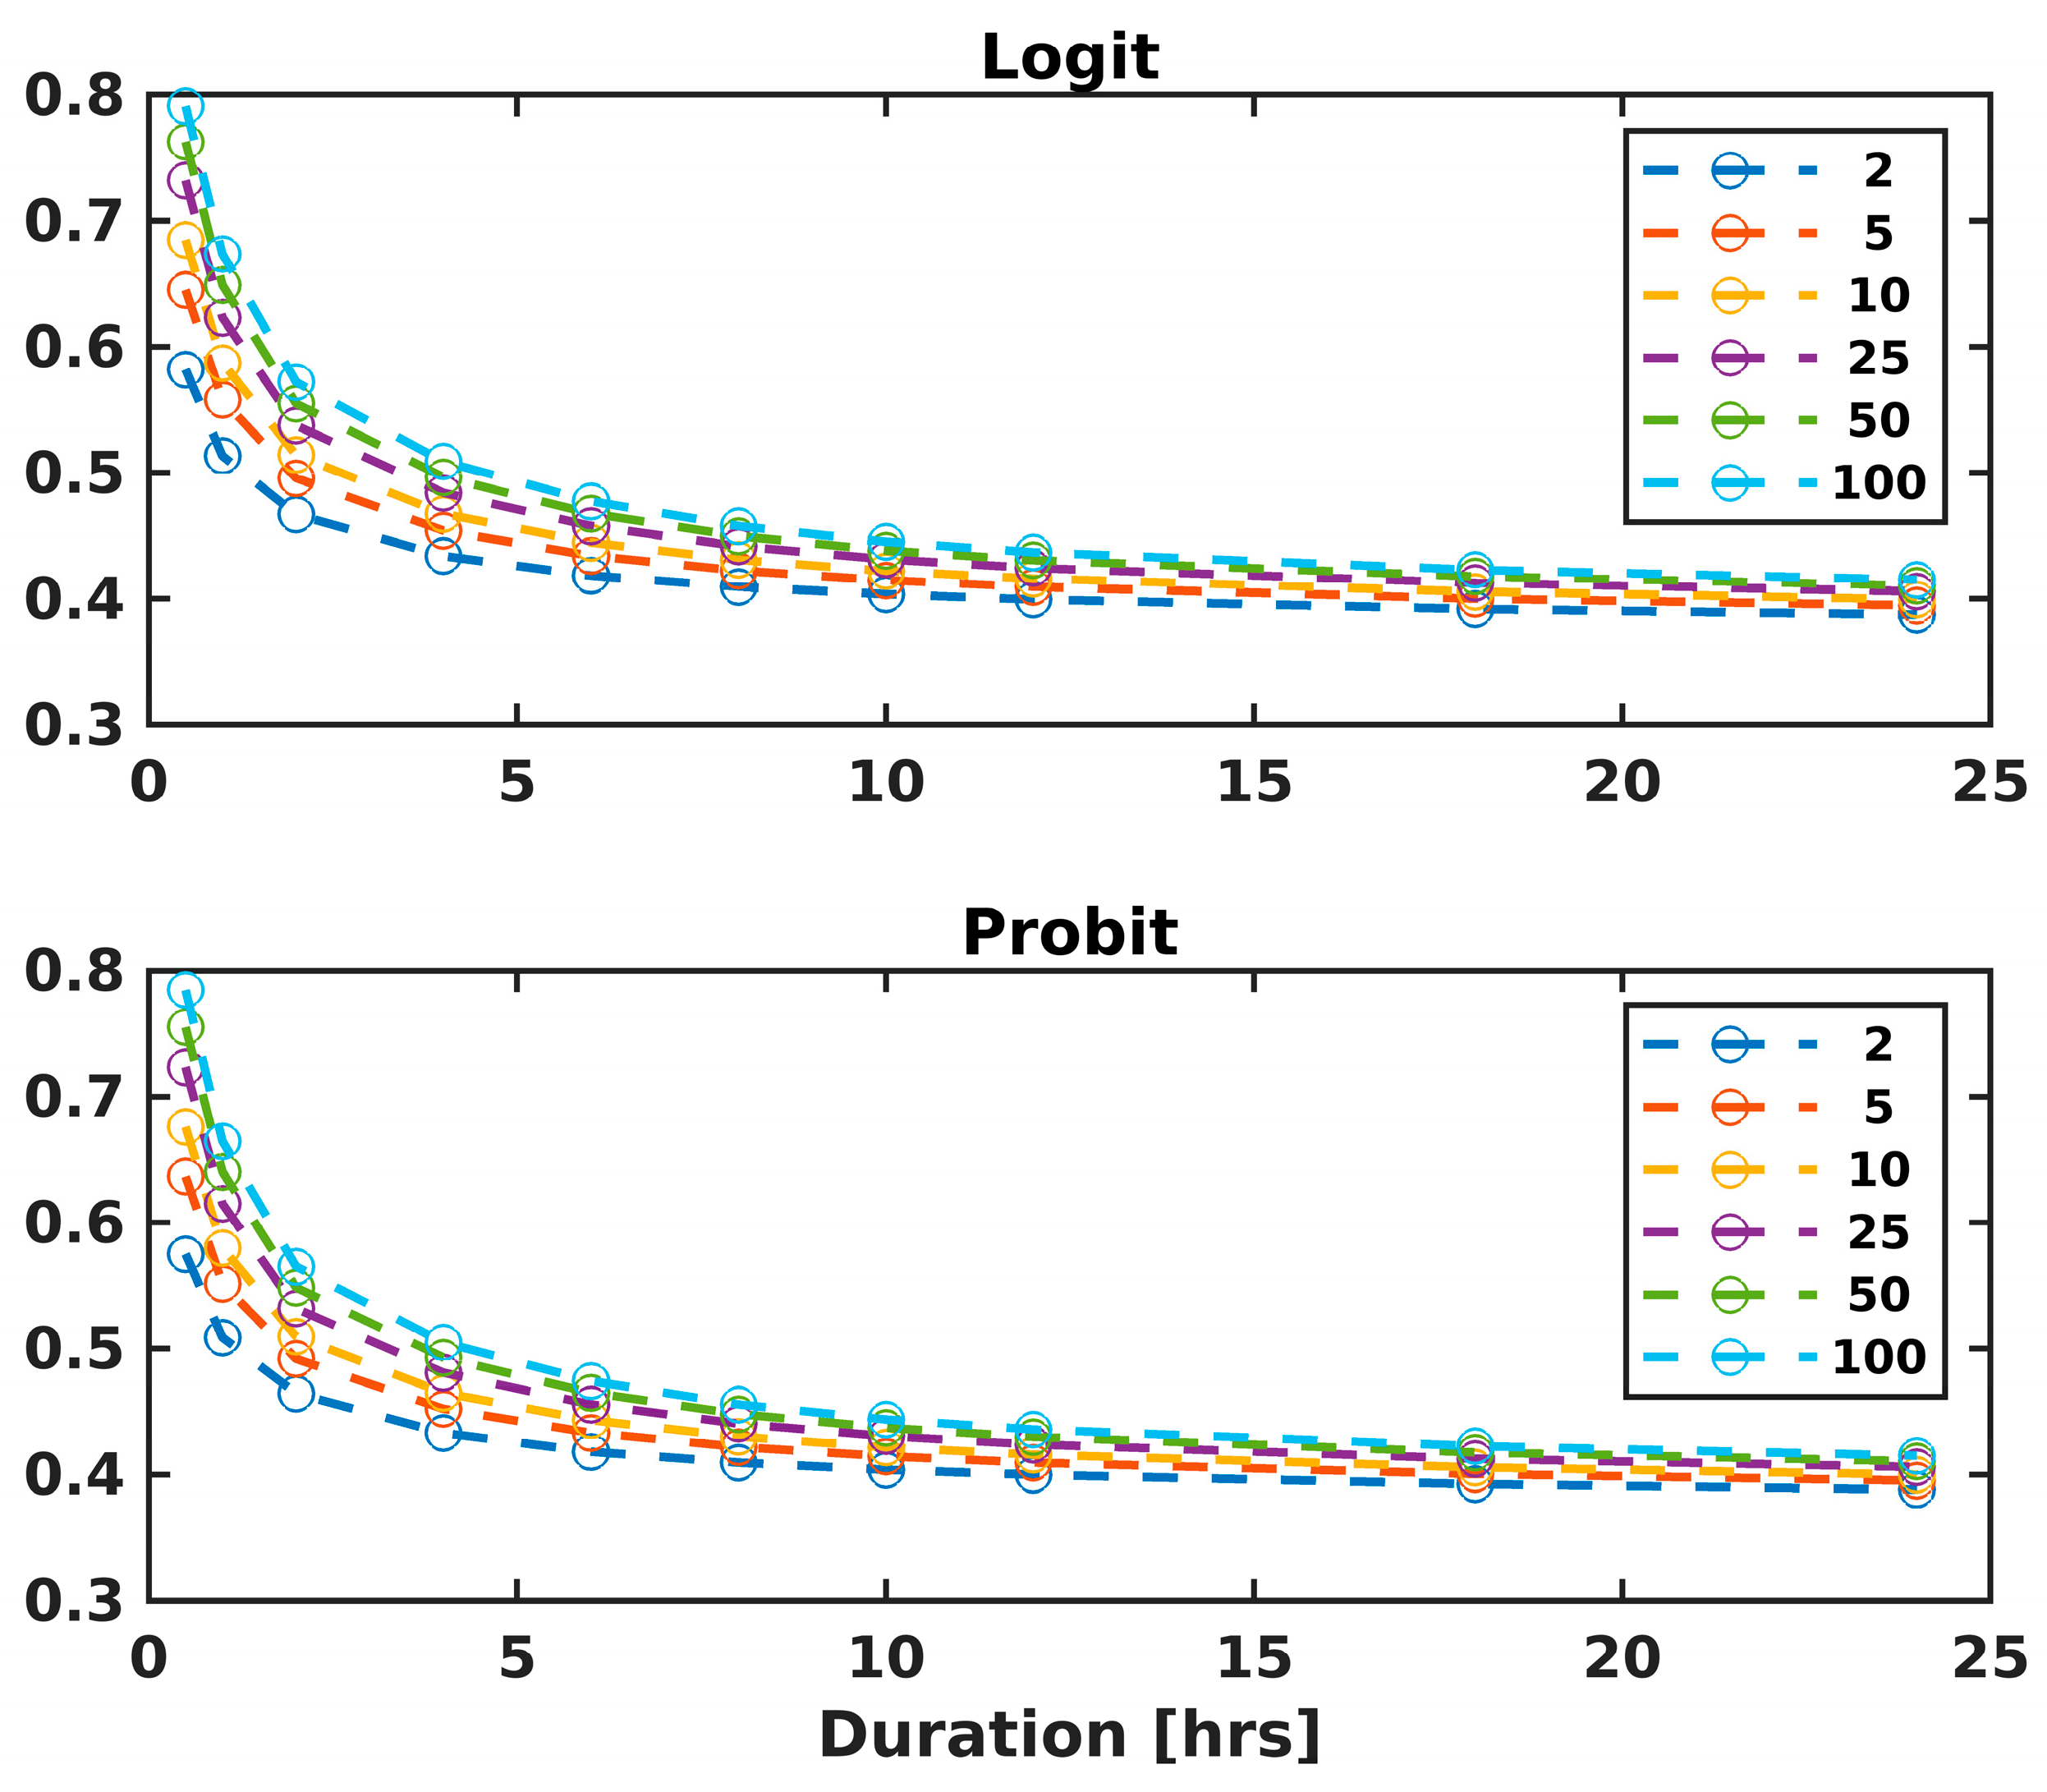
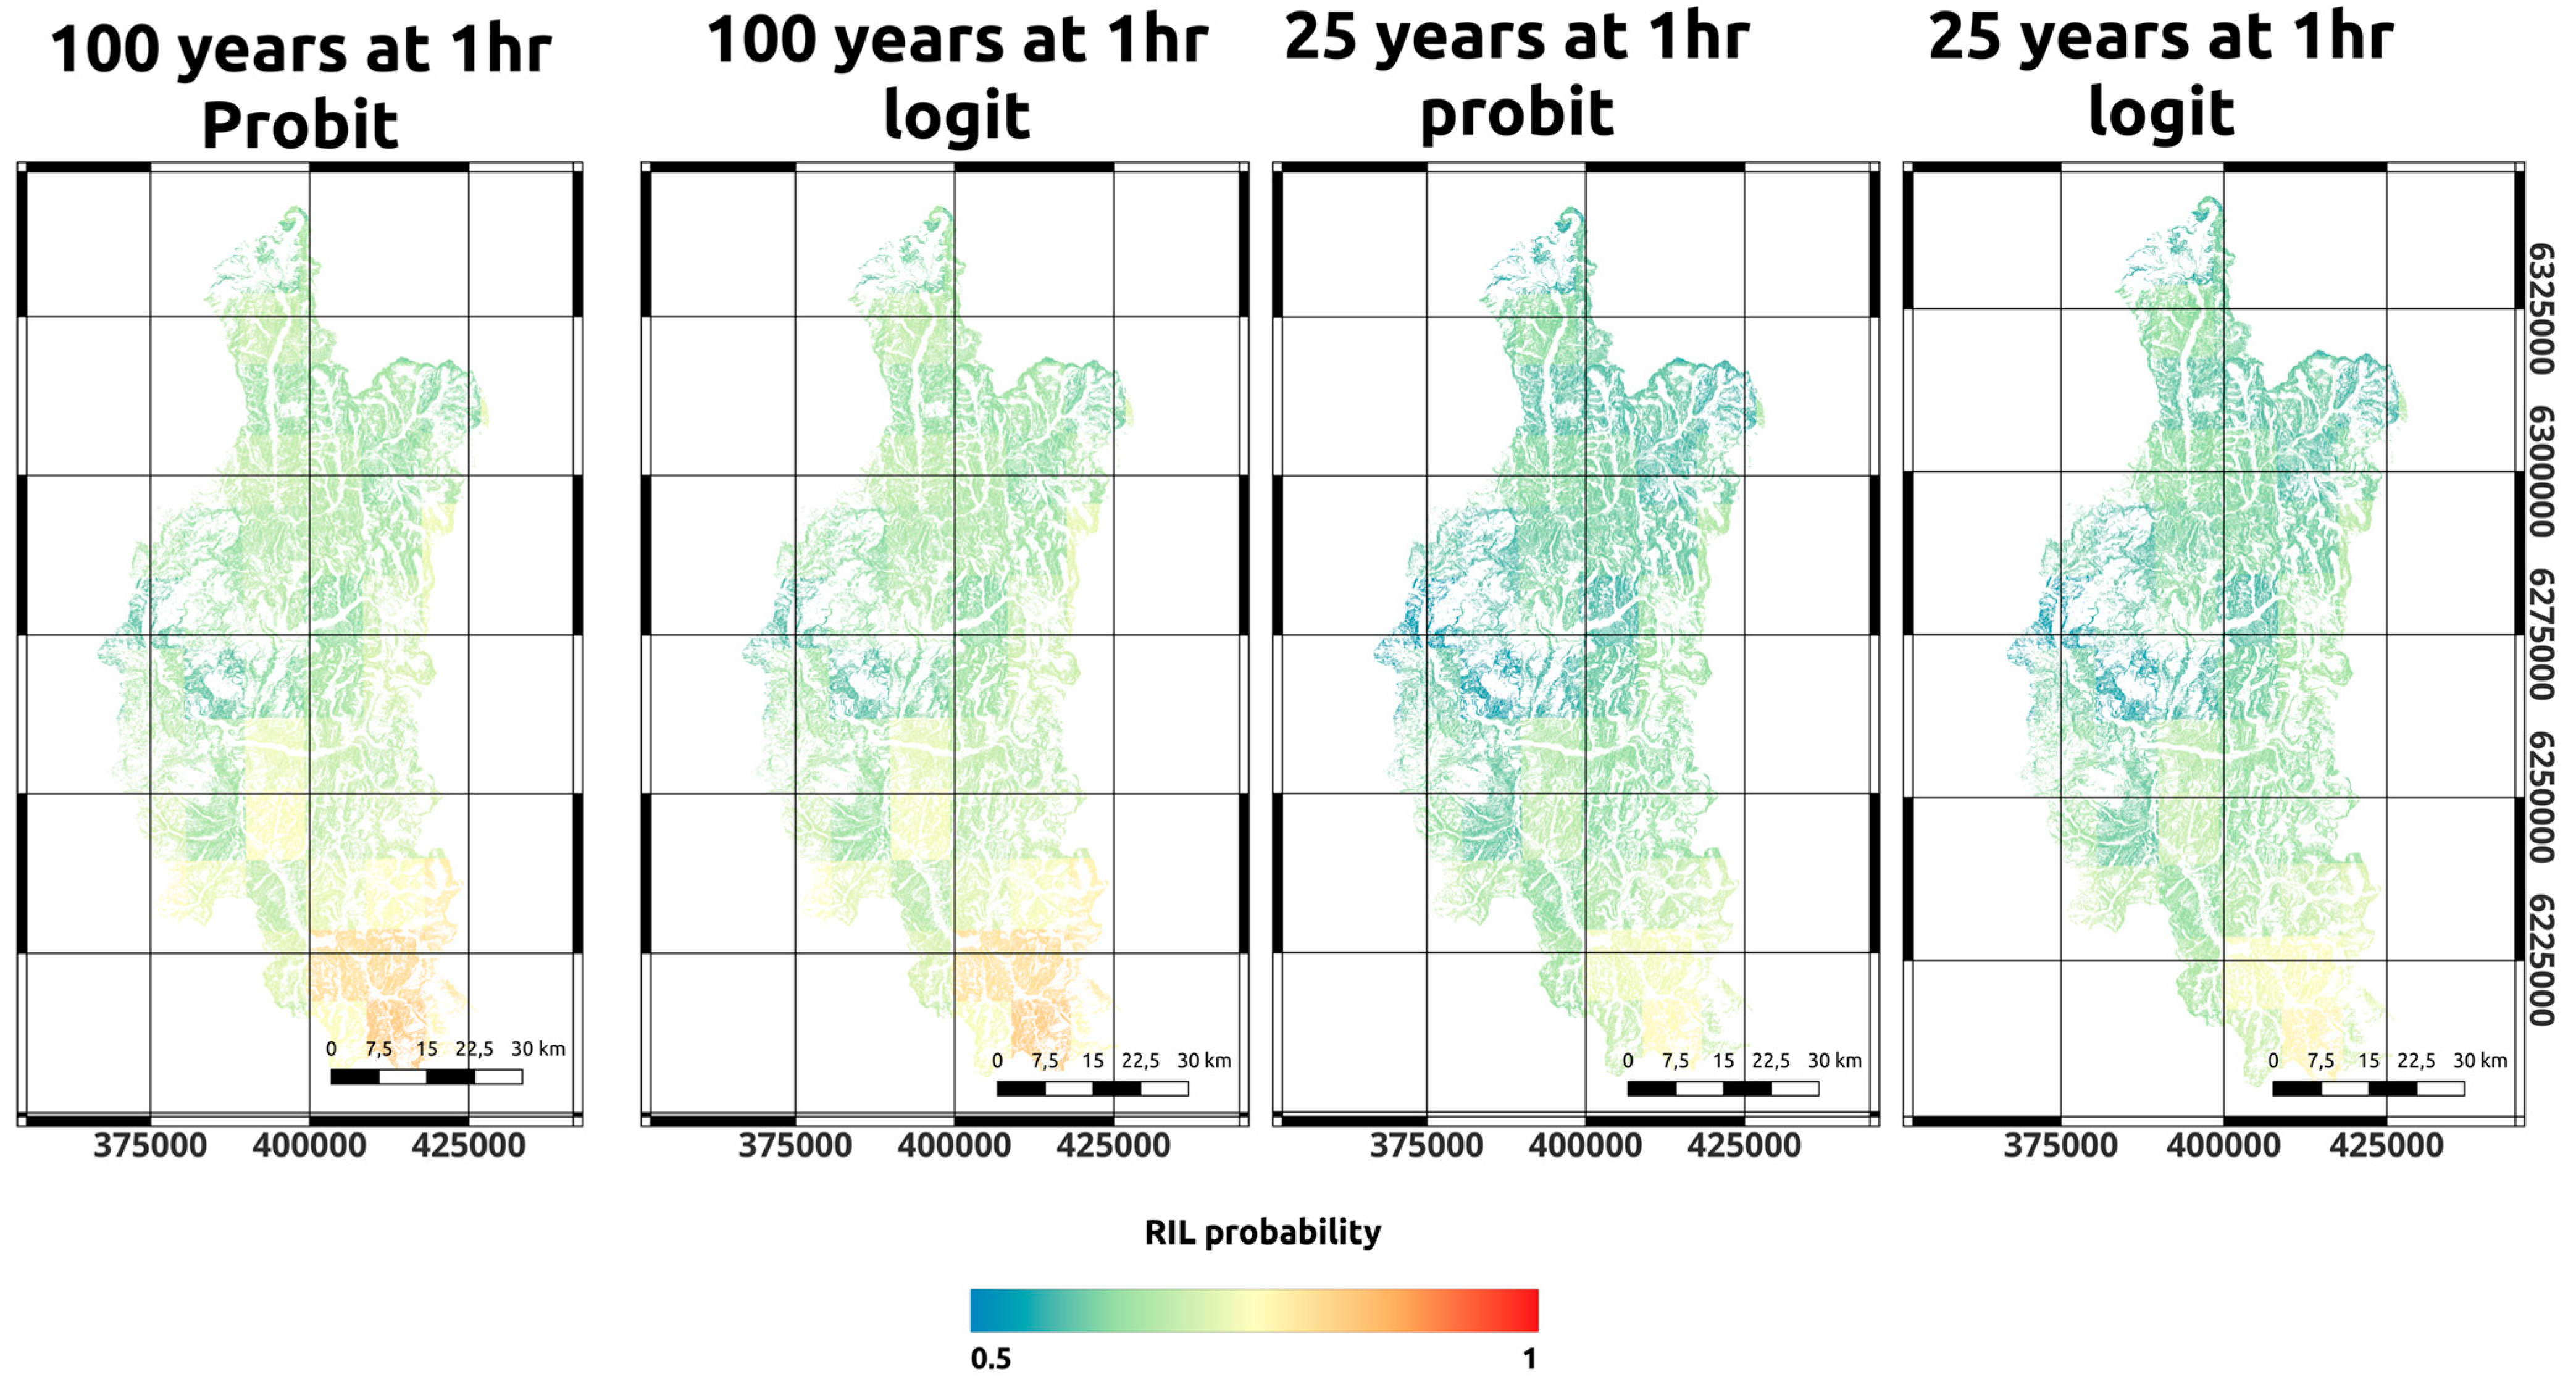
3.2. Spatial and Temporal Assessment

The median values obtained for the probability of RIL occurrence have a strong impact on the basin during short-duration extreme events, reaching over 0.8 (or 80%) (Figure 5). The Logit model curves show slightly higher probabilities of RIL occurrence than the Probit models (0.79 vs. 0.78, respectively, for 30 min of duration, Figure 6). The trend values of the Logit and Probit models indicate that the cases with the highest values correspond to those with return periods of 25, 50 and 100 years, with precipitation thresholds of 0.5 hr, and median values ranging from 0.726023 to 0.791746 (Figure 6).
It was mainly observed that half of the basin area has a probability of RIL occurrence during durations of 30 to 60 min for both the logit and probit models. Additionally, the median probability decreased for return periods longer than four years (see Figure 6). Hence, the basin is highly vulnerable to short-term events, with more than half of the catchment area exceeding a median probability value of 0.55 for all cases. The probability of RIL occurrence decreased for durations exceeding eight hours, as shown in Figure 6.
The Logit models exhibited slightly higher values than the Probit models (Figure 6). We compared the models without identifying significant discrepancies. For each particular hydrometeorological event, the most significant discrepancies were found for events with a return period of ten years and thresholds of 1 and 4 h. For a return period of one hundred years, with a precipitation threshold of 2 h, there was a difference in probability of 0.02. In contrast, the least significant discrepancies between the values of both models in each hydrometeorological event studied were identified for a return period of 2, 5, 10 and 25 years, with a difference of less than 0.02 (Figure 6).

4. Analysis and Discussion

We compared two logistic models around three variables as forcing variables to estimate the probability of RIL occurrence in the Maipo River basin (33.59 °S/70.38° W), one of the most populated basins in the Central Andes. We integrated geomorphological features (slope, slope dispersion) of the SRTM digital elevation model and precipitation data on different days (CHIRPS database) before the landslide. We established a Bayesian relation between conditioning factors (topography/geomorphology) and triggers (precipitation at different intensities). The results allowed quantification for the first time of the degree of susceptibility to RIL in a basin of the Central Andes, showing that the half-area basin has RIL probability over 50% in short-duration events (less than one hour of duration). This study improves preliminary results that have only established qualitative limits [29,59]. The high reliability of the calibration (AUC > 0.79), obtained through the ROC analysis [59,60,61,62], will open the door to RILEWS in future work [48,63].

4.1. Modeling

The good agreement between the validation and calibration results (ROC values) demonstrates the feasibility of both models (Table 1). The results of the estimators showed a low interquartile range in the inversions, suggesting a good agreement (less than 0.06 of difference for predictive variables, Figure 4). The results were interpreted as a stable model, not depending on the randomness of the database. Moreover, the intercept must be evaluated with caution for operational scale models such as RILEWS. The dispersion degree of intercept reached a difference of 2.3 for logit and probit. Nevertheless, both models have high rates of True Positives and low False Positive values, reaching 0.9 (Figure 5). A solid ability to differentiate true positives from true negatives can correctly generate a good separation of periods with RIL probability from periods without RIL probability spatially [59,60,61]. The implementation proposal of this methodology as a RILEWS would make it possible to forecast RIL occurrence zones, constraining how the precipitation thresholds under a RIL could take place. Our results could suit an operational RILEWS scale considering the geomorphological features and the distributed precipitation values above the place as a proxy [8,11,24,64].
The prediction capacity of Logit showed a better performance than the Probit distribution. Despite the quantitative performance, the values of AUC could be negligible at an operational level as RILEWS. The values of the ROC curve show a better fit for the Logit/Probit calibration models, providing AUC over 0.7 in both cases (Table 1). The AUC reported was similar or greater than similar studies [48,61,62]. The quality of the calibration and validation values suggests that this model could be integrated into warning systems before landslides (RILEWS) [63]. From this, it is proposed that both models be used due to the excellent performance during the validation stage [8]. Refs. [15,16] demonstrated that for the Biobío zone (Southern Andes), AUC of 0.6 was sufficient to generate probability models for RIL by using climate indicators. From this, it is proposed that the results generated could have the same performance. The results of this study showed the possibility of introducing a simple Bayesian model compared to other methods, such as neural networks [55,65,66] or deep learning approaches [67,68], requiring a more robust landslide inventory, which is not available currently. Although remote sensing data could allow delimitating of the spatial distribution of landslides, the temporal identification is unsuitable due to the long revisit time of satellite products in the Central Andes. Accurate time delimitation of the landslide generation is essential to improve landslide susceptibility models.

4.2. Spatial and Temporal Assessment

The most contrastive probability difference of the Logit/Probit models is identified for precipitation thresholds of 0.5 h and return periods of 25, 50 and 100 years (example in Figure 7). Our results show that short and intense events must be evaluated in detail for the Central Andes zone. The soil hydraulic properties of the zone, mainly permeability, are susceptible to fast events, concordant with the Bayesian approach derived in the present manuscript. Extreme events in the Central and Southern Andes have been shown to activate RILs, causing severe damage to the population and infrastructure [29,59,69]. The abrupt changes for 30 min precipitation events highlight the importance of having precipitation estimation/forecast systems in the Central Andes. The present study allowed one for the first time to identify the spatial and temporal distribution of RIL in a highly populated basin in the Central Andes. Our results introduce quantitative information for better decision-making, showing that more than half of the basin is landslide-prone, susceptible to short-duration precipitation, reaching over 70% for a return period over ten years (Figure 6).
The zone is highly complex due to the heterogeneity of soil/rock formations. The relief formation related to the active tectonism favoured geomorphological conditions in RIL activation [37]. Heavy rains can affect the mechanical integrity of the soil/rock due to fast water content variations [24,70]. Water content variations predispose the formation of noticeable gully incisions in the study zone, characterised by its sharp relief (Figure 1). Moreover, the zone ends up reflecting the degree of soil weathering. The high presence of rock/soil discontinuities allows water infiltration to decrease the medium’s cohesion [19,30].
The landslide-prone zones showed a correlation with the existing lithological units. The areas with mapped RIL and RIL-prone zones are related to volcanogenic units from the Cenozoic Era. Moreover, the marine and continental sedimentary units show a lower predisposition to landslide. In the Maipo basin, the lithologies show the impact of hydrothermal fluids [38,71]; in addition, at the regional scale, at least two deformation events are noted with evident folding and faulting on the rocky units of the zone [33,34,35,70], which, together with the climate action, are evidenced in the weak mechanical integrity of rocks [24]. The slopes of the valleys in the area expose a wide variety of unconsolidated deposits of diverse selection on the surface. In turn, these unstable [33,35,37]. The main mechanism of RIL activation is due to the low water infiltration capacity in the volcanogenic and carbonate units, partially preventing the effective infiltration of rainwater into the lithologies, so that preferably, the water runs off in a superficial way, predisposing the transport of the debris arranged sequentially on the surface.
It is crucial to consider the different geological processes in the zone to significantly estimate the mechanical properties of rocks affected by deformation processes. The competitive difference among the different units is noteworthy and conditions the erosive processes that further trigger later movements of rocks and soils.

4.3. Implications of the Study

The present study analyses the impact of short precipitation in the Central Andes zone. We perform a Bayesian analysis to understand the RIL probability based on geomorphological features along a representative area of the Central Andes. The landslide triggering conditions in the study area depended on several variables such as lithology, geomorphology, and exogenous agents. RILs can transport large volumes of material, affecting extensive areas in the foothills [30]. The forced logistic model using IDF curves shows that in extreme cases, the median susceptibility of the river basin reaches 80% (Figure 6). This value is high; therefore, a constant monitoring and/or mitigation measures must be taken when considering the precipitation as forcing. Our estimations determined that half of the area could become landslide-prone under short periods during a return period of fewer than five years (Figure 7). The recurrence of precipitation events predisposes the zone to be affected by new and extreme landslides, increasing the population’s vulnerability due to the increased urbanisation in Central Chile. Therefore, a new constraint for decision-makers must be considered, suggesting that civil infrastructure design would be involved in future events. From the results, we propose that efforts should focus on understanding and analysing short-duration extreme events. These results have deep implications for sediment generation and erosion for a sediment source that reaches the subduction trench. Therefore, this study allows us to understand that the Central Andes could generate sediment.

4.4. Future Outlook

The present study introduces a novel susceptibility approach for a basin situated in the Central Andes. Our research not only opens up new possibilities in terms of landslide mitigation strategies but also takes a Bayesian perspective into account. However, further improvement of the model can be achieved by incorporating additional geomechanical features such as soil/rock cohesion and other relevant rheological properties in a more comprehensive manner. It is important to note that the zone under investigation has experienced significant alteration due to the influence of hydrothermal fluids, resulting in the weakening of rocks and soil bodies [38]. The structural control observed in the Maipo basin indicates a pronounced alteration caused by the ascent of hydrothermal fluids, affecting various lithologies [38,41]. Looking ahead, we encourage the exploration of alternative approaches to susceptibility assessment that consider the spatial distribution of lithology and the mechanical qualities of rocks and soils, thereby enhancing the accuracy and reliability of the results obtained.
Moreover, the high variability of the soil geotechnical features become essential fully understanding the interaction between the rheological properties and the generation of RILs in the Central Andes. A wide variety of gravitational events differ widely from each other. This first approach allows one for the first time to understand the impact of different precipitation thresholds over a densely populated basin in the Central Andes. Future studies must improve the soil variability to improve the quality of decision-makers over the territory.
The model carried out in this study demonstrated that the logistic model is suitable to establish rainfall-induced landslides probabilities. Our study complements previous studies to develop a robust rainfall early warning system in the Southern Andes [9,11]. Recent studies of precipitation quality suggest that in situ weather stations could be replaced by numerical models [16] or remotely sensed measures [11,13,29,44,59] in South America. Future phases could introduce the use of operational precipitation forecasts such as GFS [72], Weather Research Forecast (WRF) [73] and CHIRPS-GEFS [10].
The performance of predictive models relies heavily on the quantity and quality of input data [11]. Regarding natural hazard planning, decision-makers often require preliminary estimates of the size or volume of landslides that could occur under specific precipitation events. However, the available database for the study zone is inadequate for determining this information. This limitation stems from the limited number of variables and the absence of previous measurements of size or volume. In the future, additional data on size or volume in preliminary reports could contribute to developing more accurate models. In the meantime, decision-makers must consider using physical-based models only if the zone has an accurate geotechnical characterization. These models could provide valuable support for decision-making processes.
Despite the number of landslides in the database being comparable with other studies [11,16], we suggest increasing the inventory in future studies. A deep and accurate determination of landslides will increase the AUC values and sensibility of the models. It is worth noting that there is only one way to divide the calibration and validation databases. Previous studies used logistic models and divided the calibration and validation database (50/50) to obtain predictive models that exceed 87% in performance [11]. In contrast, ref. [74] divided their databases into 80/20 for the calibration and validation stages, reaching an AUC performance between 0.839 and 0.898 for four different models. The division of the cal/val databases is constrained by the availability and quality of the data.
In the future, conditioning and conditioning variables of RILs will be integrated to improve the performance of the present results. The wide soil variability showed that the RIL distribution in the basin is inhomogeneous. The soil variability will impact the conditioning factors. An integration of new variables such as soil moisture and textural properties will make it possible to implement RILEWS at the operational level in future instances. It is suggested that future studies evaluate the presence of sectors with slow deformations using other methodologies to identify RIL reactivation. A long-term surface deformation monitoring is allowed in similar zones to constrain and forecast slope failure, improving landslide-early warning systems.

5. Conclusions

To understand the spatial and temporal variability of susceptibility to RILs, we performed a Bayesian analysis based on logistic regressions. Our validation results demonstrated that logit and probit distributions can spatially represent RIL-prone zones with an ROC value of 0.79. The good agreement between validation and calibration results suggests that the models are stable and do not depend on the data-driven model variability. The results might be limited to the size of the RIL catalog, due to the variability of the intercept requiring a future increase of the RIL database with additional features such as geomechanical properties. We conclude that it is possible to apply this methodology as an early warning system for rain-induced landslides (RILEWS), since from this approach, it is possible to delimit the zones most prone to suffer RIL in a highly populated area due to their true positive rates and low false positive values suggesting that the model is suitable to future RILEWS.
The estimation of probable RIL zones at a spatial and temporal scale under different rainfall durations showed a strong influence of short-period duration, these types of events becoming relevant in future mitigation plans to decision-makers. The results of the study could be useful in an operational scale RILEWS considering as a proxy the geomorphological characteristics and precipitation values distributed over the site. The importance of implementing RILEWS for mountain areas is that it is possible to delimit the zones prone to suffer RIL in a highly populated area. In the same way, our study allows one to estimate probable RIL zones at a spatial and temporal level under different precipitation durations.
The present study analyzed the impact of short- and long-duration precipitation in the Central Andes area. We determined that half of the area could become prone to landslides induced by short-duration precipitation during a return period of fewer than five years, increasing the vulnerability of the population due to increased urbanization in Central Chile. We encourage decision-makers to focus on a better understanding and analysis of short-duration extreme events. Our article addresses a priority case study at the Chilean level. The approach we use will generate key tools for national and international decision-making in geohazard risk management. In the future, this will provide a solid basis for the implementation of land-use planning policies, the design of building codes and the elaboration of disaster response and recovery plans.
Our results showed that the Maipo basin has a wide variability to susceptibility of the RIL under different precipitation thresholds. The study area showed a landslide probability of 59% for half of the basin area (two-year 4 h return). The probability implies that the area is highly susceptible, introducing a new degree of freedom in public policies. Authorities should monitor or generate RILEWS on a permanent operational basis. The results of this study could be used in the future to support decision-making by public entities. In addition, the application of this approach will allow one in the future to optimally redistribute economic and human resources to improve risk management in years with high risk of RIL occurrence, as well as to make estimates related to the amount of sediment generated at the basin level and its possible influence on tectonism.
Finally, future studies should be oriented to restrict the values of soil variability, in addition to expanding the catalog of RILs in the area, which will improve the quality of decision-making on the territory. In addition, future developments and public infrastructures should take into account the impact of RILs in their design. The performance of predictive models depends on the quantity and quality of input data. In the future, it is suggested to integrate conditioning variables of the RILs to improve the performance of the current results.

Author Contributions

Conceptualisation, I.J.F.T. and G.M.-C.; methodology, I.J.F.T. and G.M.-C.; software, I.J.F.T. and G.M.-C.; formal analysis, I.J.F.T., G.M.-C., L.F.R., P.-Y.D., G.G. and D.V.; writing—original draft preparation, G.M.-C. and I.J.F.T.; writing—review and editing, I.J.F.T., G.M.-C., L.F.R., P.-Y.D., G.G. and D.V. All authors have and read and agreed to the published version of the manuscript.

Funding

This study was funded by the PII180007 project of the Universidad Nacional Andrés Bello, Chile, and the School of Resources and Environmental Engineering, Jiangxi University, Ganzhou, China under ANID-NSFC agreement.

Data Availability Statement

Development was carried out using free software and databases provided by the National Geology and Mining Service (SERNAGEOMIN) and SOTERLAC. The results will be publicly available via Zenodo (https://zenodo.org/record/8003669, accessed on 27 June 2023). Additional software/database can be requested of the corresponding author under reasonable request.

Acknowledgments

We thank the Civil Engineering Department of the Universidad de la Frontera, Temuco, for its full support, as well as each of the people who contributed in the different stages of the development of this article.

Conflicts of Interest

The authors declare no conflict of interest.

References

  1. Jeanneret, P.; Moreiras, S.M. Inventario de procesos de remoción en masa en la cuenca baja del Río Blanco (31ºS), Andes Centrales Argentinos. Rev. Mex. De Cienc. Geológicas 2018, 35, 215–227. [Google Scholar] [CrossRef] [Green Version]
  2. Moreiras, S.M.; Jeanneret, P.; Lauro, C.; Vergara Dal Pont, I.; Correas González, M.; Junquera Torrado, S. Deslizamientos asociados a la degradación del permafrost: Evidencias geomorfológicas en el pasado y presente en los Andes Centrales (31–34° S). Geo UERJ 2019, 35, e45036. [Google Scholar] [CrossRef]
  3. Sepúlveda, S.A.; Alfaro, A.; Lara, M.; Carrasco, J.; Olea-Encina, P.; Rebolledo, S.; Garcés, M. An active large rock slide in the Andean paraglacial environment: The Yerba Loca landslide, central Chile. Landslides 2020, 18, 697–705. [Google Scholar] [CrossRef]
  4. Hermanns, R.L.; Folguera, A.; Penna, I.; Fauqué, L.; Niedermann, S. Landslide Dams in the Central Andes of Argentina (Northern Patagonia and the Argentine Northwest). 2010, pp. 147–176. Available online: https://www.researchgate.net/publication/225556828_Landslide_Dams_in_the_Central_Andes_of_Argentina_Northern_Patagonia_and_the_Argentine_Northwest (accessed on 11 May 2023).
  5. Kirschbaum, D.; Stanley, T.; Zhou, Y. Spatial and temporal analysis of a global landslide catalog. Geomorphology 2015, 249, 4–15. [Google Scholar] [CrossRef]
  6. Brenning, A.; Schwinn, M.; Ruiz-Páez, A.P.; Muenchow, J. Landslide susceptibility near highways is increased by 1 order of magnitude in the Andes of southern Ecuador, Loja province. Nat. Hazards Earth Syst. Sci. 2015, 15, 45–57. [Google Scholar] [CrossRef] [Green Version]
  7. Soto, J.; Palenzuela, J.A.; Galve, J.P.; Luque, J.A.; Azañón, J.M.; Tamay, J.; Irigaray, C. Estimation of empirical rainfall thresholds for landslide triggering using partial duration series and their relation with climatic cycles. An application in southern Ecuador. Bull. Eng. Geol. Environ. 2017, 78, 1971–1987. [Google Scholar] [CrossRef]
  8. Gariano, S.; Brunetti, M.; Iovine, G.; Melillo, M.; Peruccacci, S.; Terranova, O.; Vennari, C.; Guzzetti, F. Calibration and validation of rainfall thresholds for shallow landslide forecasting in Sicily, southern Italy. Geomorphology 2015, 228, 653–665. [Google Scholar] [CrossRef]
  9. Marra, F.; Destro, E.; Nikolopoulos, E.I.; Zoccatelli, D.; Creutin, J.D.; Guzzetti, F.; Borga, M. Impact of rainfall spatial aggregation on the identification of debris flow occurrence thresholds. Hydrol. Earth Syst. Sci. 2017, 21, 4525–4532. [Google Scholar] [CrossRef] [Green Version]
  10. Harrison, L.; Landsfeld, M.; Husak, G.; Davenport, F.; Shukla, S.; Turner, W.; Peterson, P.; Funk, C. Advancing early warning capabilities with CHIRPS-compatible NCEP GEFS precipitation forecasts. Sci. Data 2022, 9, 1–13. [Google Scholar] [CrossRef]
  11. Fustos-Toribio, I.; Manque-Roa, N.; Antipan, D.V.; Sotomayor, M.H.; Gonzalez, V.L. Rainfall-induced landslide early warning system based on corrected mesoscale numerical models: An application for the southern Andes. Nat. Hazards Earth Syst. Sci. 2022, 22, 2169–2183. [Google Scholar] [CrossRef]
  12. Zambrano-Bigiarini, M.; Soto, C.; Baez-Villanueva, O. Spatially-distributed IDF curves for Center-Southern Chile using IMERG. In Proceedings of the EGU General Assembly Conference Abstracts, Vienna, Austria, 3–8 May 2020; European Geosciences Union: Vienna, Austria, 2020. [Google Scholar]
  13. Zambrano-Bigiarini, M.; Nauditt, A.; Birkel, C.; Verbist, K.; Ribbe, L. Temporal and spatial evaluation of satellite-based rainfall estimates across the complex topographical and climatic gradients of Chile. Hydrol. Earth Syst. Sci. 2017, 21, 1295–1320. [Google Scholar] [CrossRef] [Green Version]
  14. Cárdenas, N.Y.; Mera, E.E. Landslide susceptibility analysis using remote sensing and GIS in the western Ecuadorian Andes. Nat. Hazards 2016, 81, 1829–1859. [Google Scholar] [CrossRef] [Green Version]
  15. Fustos, I.; Remy, D.; Abarca-Del-Rio, R.; Muñoz, A. Slow movements observed with in situ and remote-sensing techniques in the central zone of Chile. Int. J. Remote Sens. 2017, 38, 7514–7530. [Google Scholar] [CrossRef]
  16. Fustos, I.; Abarca-Del-Río, R.; Mardones, M.; González, L.; Araya, L. Rainfall-induced landslide identification using numerical modelling: A southern Chile case. J. S. Am. Earth Sci. 2020, 101, 102587. [Google Scholar] [CrossRef]
  17. Orejuela, I.P.; Toulkeridis, T. Evaluation of the susceptibility to landslides through diffuse logic and analytical hierarchy process (AHP) between Macas and Riobamba in Central Ecuador. In Proceedings of the 7th International Conference on eDemocracy and eGovernment, ICEDEG, Buenos Aires, Argentina, 22–24 April 2020; pp. 201–207. [Google Scholar] [CrossRef]
  18. Rossi, M.; Reichenbach, P. LAND-SE: A software for statistically based landslide susceptibility zonation, version 1.0. Geosci. Model Dev. 2016, 9, 3533–3543. [Google Scholar] [CrossRef] [Green Version]
  19. Sepulveda, N.; Jara, C. Efectos geológicos del sistema frontal de la zona central del pais, 14–18 abril de 2016. In Región Metropolitana, Comuna de San José de Maipo; Servicio Nacional de Geología y Minería: Santiago, Chile, 2016; Available online: https://portalgeo.sernageomin.cl/Informes_PDF_Nac/RM-2016-01.pdf (accessed on 11 May 2023).
  20. Althuwaynee, O.F.; Pradhan, B. Semi-quantitative landslide risk assessment using GIS-based exposure analysis in Kuala Lumpur City. Geomat. Nat. Hazards Risk 2016, 8, 706–732. [Google Scholar] [CrossRef] [Green Version]
  21. Reichenbach, P.; Rossi, M.; Malamud, B.D.; Mihir, M.; Guzzetti, F. A review of statistically-based landslide susceptibility models. Earth Sci. Rev. 2018, 180, 60–91. [Google Scholar] [CrossRef]
  22. Moosavi, V.; Niazi, Y. Development of hybrid wavelet packet-statistical models (WP-SM) for landslide susceptibility mapping. Landslides 2015, 13, 97–114. [Google Scholar] [CrossRef]
  23. Hervás, J.; Bobrowsky, P. Mapping: Inventories, Susceptibility, Hazard and Risk. Landslides Disaster Risk Reduct. 2008, 321–349. [Google Scholar] [CrossRef]
  24. Kim, J.; Jeong, S.; Park, S.; Sharma, J. Influence of rainfall-induced wetting on the stability of slopes in weathered soils. Eng. Geol. 2004, 75, 251–262. [Google Scholar] [CrossRef]
  25. Sepúlveda, S.A.; Petley, D.N. Regional trends and controlling factors of fatal landslides in Latin America and the Caribbean. Nat. Hazards Earth Syst. Sci. 2015, 15, 1821–1833. [Google Scholar] [CrossRef] [Green Version]
  26. B, A.S.; Franco, J.P.; Pineda, C.E.R. Metodología para evaluación de riesgo por flujo de detritos detonados por lluvia: Caso Útica, Cundinamarca, Colombia. Obras y Proy. 2016, 20, 31–43. [Google Scholar] [CrossRef] [Green Version]
  27. Poveda, G.; Espinoza, J.C.; Zuluaga, M.D.; Solman, S.A.; Garreaud, R.; van Oevelen, P.J. High Impact Weather Events in the Andes. Front. Earth Sci. 2020, 8, 162. [Google Scholar] [CrossRef]
  28. Trauth, M.H.; A Alonso, R.; Haselton, K.R.; Hermanns, R.L.; Strecker, M.R. Climate change and mass movements in the NW Argentine Andes. Earth Planet. Sci. Lett. 2000, 179, 243–256. [Google Scholar] [CrossRef]
  29. Calderón-Guevara, W.; Sánchez-Silva, M.; Nitescu, B.; Villarraga, D.F. Comparative review of data-driven landslide susceptibility models: Case study in the Eastern Andes mountain range of Colombia. Nat. Hazards 2022, 113, 1105–1132. [Google Scholar] [CrossRef]
  30. Mergili, M.; Santiago, C.I.M.; Moreiras, S.M. Causas, características e impacto de los procesos de remoción en masa, en áreas contrastantes de la región Andina. Cuad. De Geogr. Rev. Colomb. De Geogr. 2015, 24, 113–131. [Google Scholar] [CrossRef]
  31. Moreiras, S.M. Climatic effect of ENSO associated with landslide occurrence in the Central Andes, Mendoza Province, Argentina. Landslides 2005, 2, 53–59. [Google Scholar] [CrossRef]
  32. Arriagada, C.; Ferrando, R.; Córdova, L.; Morata, D.; Roperch, P. El Oroclino del Maipo: Un rasgo estructural de primer orden en la evolución geodinámica Mioceno a Reciente en los Andes de Chile central. Andean Geol. 2013, 40, 419–437. [Google Scholar] [CrossRef] [Green Version]
  33. Martínez, F.; Arriagada, C.; Peña, M.; Deckart, K.; Charrier, R. Tectonic styles and crustal shortening of the Central Andes “Pampean” flat-slab segment in northern Chile (27–29°S). Tectonophysics 2016, 667, 144–162. [Google Scholar] [CrossRef]
  34. Levi, B.; Nyström, J.; Thiele, R.; Åberg, G. Geochemical trends in Mesozoic-Tertiary volcanic rocks from the Andes in central Chile, and tectonic implications. J. S. Am. Earth Sci. 1988, 1, 63–74. [Google Scholar] [CrossRef]
  35. Giambiagi, L.B.; Ramos, V.A.; Godoy, E.; Alvarez, P.P.; Orts, S. Cenozoic deformation and tectonic style of the Andes, between 33° and 34° south latitude. Tectonics 2003, 22, 1041. [Google Scholar] [CrossRef]
  36. Angillieri, M.Y.E.; Villarroel, C.D.; Ocaña, R.E.; Forte, A.P. Examples of landslide dams and their stability in the Blanco River basin. Central Andes, San Juan Argentina. J. S. Am. Earth Sci. 2022, 118, 103946. [Google Scholar] [CrossRef]
  37. Lavenu, A.; Cembrano, J. Deformacion compresiva cuaternaria en la Cordillera Principal de Chile central (Cajon del Maipo, este de Santiago).Quaternary compressional deformation in the Main Cordillera of Central Chile (Cajon del Maipo, east of Santiago). Andean Geol. 2008, 35, 233–252. [Google Scholar] [CrossRef]
  38. Felipe, A.; Susana, L.; Alejandro, S.; Cristóbal, G.; Rodrigo, G. Geoquímica de Fluidos y Mineralogía Asociada a Zonas de Alteración y Depósitos Termales Secundarios, Cajón del Maipo, Región Metropolitana, Chile. La Serena: 2015. Available online: https://www.researchgate.net/publication/293654733_Geoquimica_de_fluidos_y_mineralogia_asociada_a_zonas_de_alteracion_y_depositos_termales_secundarios_Cajon_del_Maipo_Region_Metropolitana_Chile (accessed on 11 May 2023).
  39. Alvarez-Garreton, C.; Mendoza, P.A.; Boisier, J.P.; Addor, N.; Galleguillos, M.; Zambrano-Bigiarini, M.; Lara, A.; Puelma, C.; Cortes, G.; Garreaud, R.; et al. The CAMELS-CL dataset: Catchment attributes and meteorology for large sample studies— Chile dataset. Hydrol. Earth Syst. Sci. 2018, 22, 5817–5846. [Google Scholar] [CrossRef] [Green Version]
  40. Sepúlveda, S.; Moreiras, S. Large volume landslides in the Central Andes of Chile and Argentina (32°–34°S) and related hazards. Ital. J. Eng. Geol. Environ. 2016, 287–294. [Google Scholar] [CrossRef]
  41. Lara, M.; Sepúlveda, S.A.; Celis, C.; Rebolledo, S.; Ceballos, P. Landslide susceptibility maps of Santiago city Andean foothills, Chile. Andean Geol. 2018, 45, 433. [Google Scholar] [CrossRef] [Green Version]
  42. Gajardo, A. Reconocimiento Geológico de los Eventos de Remoción en Masa Ocurridos el 21 de enero de 2013, en el Cajón del Maipo, Región Metropolitana. Región Metropolitana: 2013. Available online: https://portalgeo.sernageomin.cl/Informes_PDF_Nac/RM-2013-08.pdf (accessed on 11 May 2023).
  43. Marchi, L. Linking Debris Flows and Landslides to Large Floods in Gravel-Bed Rivers. In Gravel-Bed Rivers. Chichester; John Wiley & Sons, Ltd.: London, UK, 2017; pp. 467–495. [Google Scholar] [CrossRef]
  44. Rabby, Y.W.; Ishtiaque, A.; Rahman, M. Evaluating the Effects of Digital Elevation Models in Landslide Susceptibility Mapping in Rangamati District, Bangladesh. Remote Sens. 2020, 12, 2718. [Google Scholar] [CrossRef]
  45. Yang, L.; Meng, X.; Zhang, X. SRTM DEM and its application advances. Int. J. Remote Sens. 2011, 32, 3875–3896. [Google Scholar] [CrossRef]
  46. Asaka, T.; Iwashita, K.; Kudou, K.; Aoyama, S.; Yamamoto, Y. Change detection method for landslide area using RGB color composite image of SRTM and ALOS/PALSAR InSAR DEM: A case study of the Iwate-Miyagi Nairiku Earthquake in 2008. In Proceedings of the 2011 IEEE International Geoscience and Remote Sensing Symposium, Vancouver, BC, Canada, 24–29 July 2011; pp. 1977–1980. [Google Scholar] [CrossRef]
  47. Van Westen, C. Geo-Information tools for landslide risk assessment: An overview of recent developments. Landslides Eval. Stab. 2004, 1, 39–56. [Google Scholar] [CrossRef]
  48. Shou, K.-J.; Yang, C.-M. Predictive analysis of landslide susceptibility under climate change conditions—A study on the Chingshui River Watershed of Taiwan. Eng. Geol. 2015, 192, 46–62. [Google Scholar] [CrossRef]
  49. Froude, M.J.; Petley, D.N. Global fatal landslide occurrence from 2004 to 2016. Nat. Hazards Earth Syst. Sci. 2018, 18, 2161–2181. [Google Scholar] [CrossRef] [Green Version]
  50. Wang, X.; Otto, M.; Scherer, D. Atmospheric triggering conditions and climatic disposition of landslides in Kyrgyzstan and Tajikistan at the beginning of the 21st century. Nat. Hazards Earth Syst. Sci. 2021, 21, 2125–2144. [Google Scholar] [CrossRef]
  51. Riazi, M.; Khosravi, K.; Shahedi, K.; Ahmad, S.; Jun, C.; Bateni, S.M.; Kazakis, N. Enhancing flood susceptibility modeling using multi-temporal SAR images, CHIRPS data, and hybrid machine learning algorithms. Sci. Total. Environ. 2023, 871, 162066. [Google Scholar] [CrossRef] [PubMed]
  52. Mengistu, A.G.; Woldesenbet, T.A.; Dile, Y.T. Evaluation of observed and satellite-based climate products for hydrological simulation in data-scarce Baro -Akob River Basin, Ethiopia. Ecohydrol. Hydrobiol. 2021, 22, 234–245. [Google Scholar] [CrossRef]
  53. Neeti, N.; Murali, C.A.; Chowdary, V.; Rao, N.; Kesarwani, M. Integrated meteorological drought monitoring framework using multi-sensor and multi-temporal earth observation datasets and machine learning algorithms: A case study of central India. J. Hydrol. 2021, 601, 126638. [Google Scholar] [CrossRef]
  54. Dahal, A.; Lombardo, L. Explainable artificial intelligence in geoscience: A glimpse into the future of landslide susceptibility modeling. Comput. Geosci. 2023, 176, 105364. [Google Scholar] [CrossRef]
  55. Gómez, D.; Aristizábal, E.; García, E.F.; Marín, D.; Valencia, S.; Vásquez, M. Landslides forecasting using satellite rainfall estimations and machine learning in the Colombian Andean region. J. S. Am. Earth Sci. 2023, 125, 104293. [Google Scholar] [CrossRef]
  56. Hagle, T.M.; Ii, G.E.M. Goodness-of-Fit Measures for Probit and Logit. Am. J. Politi- Sci. 1992, 36, 762. [Google Scholar] [CrossRef]
  57. Mccullagh, P.; Nelder, J. Generalized Linear Models; Routledge: Abingdon, UK, 2019. [Google Scholar] [CrossRef]
  58. Fawcett, T. An Introduction to ROC analysis. Pattern Recogn. Lett. 2006, 27, 861–874. [Google Scholar] [CrossRef]
  59. Angillieri, M.Y.E. Debris flow susceptibility mapping using frequency ratio and seed cells, in a portion of a mountain international route, Dry Central Andes of Argentina. Catena 2020, 189, 104504. [Google Scholar] [CrossRef]
  60. Metz, C.E. Basic Principles of ROC Analysis. 2018. Available online: http://gim.unmc.edu/dxtests/ROC1.htm (accessed on 4 May 2018).
  61. Mandrekar, J.N. Receiver Operating Characteristic Curve in Diagnostic Test Assessment. J. Thorac. Oncol. 2010, 5, 1315–1316. [Google Scholar] [CrossRef] [PubMed] [Green Version]
  62. DeMARIS, A. Explained Variance in Logistic Regression. Sociol. Methods Res. 2002, 31, 27–74. [Google Scholar] [CrossRef]
  63. Piciullo, L.; Calvello, M.; Cepeda, J.M. Territorial early warning systems for rainfall-induced landslides. Earth Sci. Rev. 2018, 179, 228–247. [Google Scholar] [CrossRef]
  64. Pineda, M.C.; Viloria, J.; Martínez-Casasnovas, J.A. Landslides susceptibility change over time according to terrain conditions in a mountain area of the tropic region. Environ. Monit. Assess. 2016, 188, 1–12. [Google Scholar] [CrossRef] [Green Version]
  65. Bragagnolo, L.; da Silva, R.V.; Grzybowski, J.M.V. Artificial neural network ensembles applied to the mapping of landslide susceptibility. CATENA 2020, 184, 104240. [Google Scholar] [CrossRef]
  66. Ortiz, J.A.V.; Martínez-Graña, A.M. A neural network model applied to landslide susceptibility analysis (Capitanejo, Colombia). Geomat. Nat. Hazards Risk 2018, 9, 1106–1128. [Google Scholar] [CrossRef] [Green Version]
  67. Azarafza, M.; Azarafza, M.; Akgün, H.; Atkinson, P.M.; Derakhshani, R. Deep learning-based landslide susceptibility mapping. Sci. Rep. 2021, 11, 1–16. [Google Scholar] [CrossRef] [PubMed]
  68. Zhu, L.; Huang, L.; Fan, L.; Huang, J.; Huang, F.; Chen, J.; Zhang, Z.; Wang, Y. Landslide Susceptibility Prediction Modeling Based on Remote Sensing and a Novel Deep Learning Algorithm of a Cascade-Parallel Recurrent Neural Network. Sensors 2020, 20, 1576. [Google Scholar] [CrossRef] [Green Version]
  69. Sepúlveda, S.A.; Moreiras, S.; Lara, M.; Alfaro, A. Debris flows in the Andean ranges of central Chile and Argentina triggered by 2013 summer storms: Characteristics and consequences. Landslides 2014, 12, 115–133. [Google Scholar] [CrossRef]
  70. Zhang, W.; Tang, L.; Li, H.; Wang, L.; Cheng, L.; Zhou, T.; Chen, X. Probabilistic stability analysis of Bazimen landslide with monitored rainfall data and water level fluctuations in Three Gorges Reservoir, China. Front. Struct. Civ. Eng. 2020, 14, 1247–1261. [Google Scholar] [CrossRef]
  71. Piquer, J.; Rivera, O.; Yáñez, G.; Oyarzún, N. The Piuquencillo fault system: A long-lived, Andean-transverse fault system and its relationship with magmatic and hydrothermal activity. Solid Earth 2021, 12, 253–273. [Google Scholar] [CrossRef]
  72. Rao, G.V.; Reddy, K.V.; Sridhar, V.; Srinivasan, R.; Umamahesh, N.; Pratap, D. Evaluation of NCEP-GFS-based Rainfall forecasts over the Nagavali and Vamsadhara basins in India. Atmospheric Res. 2022, 278, 106326. [Google Scholar] [CrossRef]
  73. Michalakes, J.; Dudhia, J.; Gill, D.; Henderson, T.; Klemp, J.; Skamarock, W.; Wang, W. The Weather Research and Forecast Model: Software Architecture and Performance. 2005. Available online: https://www.researchgate.net/publication/213880051_The_Weather_Reseach_and_Forecast_Model_Software_Architecture_and_Performance (accessed on 11 May 2023).
  74. Ling, S.; Zhao, S.; Huang, J.; Zhang, X. Landslide susceptibility assessment using statistical and machine learning techniques: A case study in the upper reaches of the Minjiang River, southwestern China. Front. Earth Sci. 2022, 10, 986172. [Google Scholar] [CrossRef]
Figure 1. (a) Relief map with the location of RILs of the study zone. (b) CHIRPS product with IDF of 2 years and duration of 4 h.
Water 15 02514 g001
Figure 2. RIL was activated in the Maipo river basin on 21 January 2013. (a) Proximal and middle zone of a debris flow, located over ancient alluvial deposits. (b) Debris-flow deposits with metric blocks immersed in sandy to silty material. (c) The channel after the erosion of the debris-flow deposits (Estero San Alfonso). (d) Partial obstruction of Rio Maipo caused by the debris-flow deposit of a tributary. Based from [42,43].
Water 15 02514 g002
Figure 3. Methodological approach, in the section “Predictor dataset”.
Water 15 02514 g003
Figure 4. Comparison of estimators used for the configuration of the Logit and Probit models.
Water 15 02514 g004
Figure 5. Validation and calibration curves for the Logit and Probit functions.
Water 15 02514 g005
Figure 6. Comparison between IDF values for median probability of the RIL occurrence.
Water 15 02514 g006
Figure 7. Comparison between IDF values for median probability of the RIL occurrence.
Water 15 02514 g007
Table 1. Calibration and validation values for the Logit and Probit models.
A.U.C.CalibrationValidation
Logit0.79650.6021
Probit0.79080.6055
Disclaimer/Publisher’s Note: The statements, opinions and data contained in all publications are solely those of the individual author(s) and contributor(s) and not of MDPI and/or the editor(s). MDPI and/or the editor(s) disclaim responsibility for any injury to people or property resulting from any ideas, methods, instructions or products referred to in the content.

