Article

Drip Irrigation Reduced Fertilizer Nitrogen Loss from Lettuce Field—A Case Study Based on 15N Tracing Technique

1
Institute of Water Conservancy Science of Nanjing, Nanjing 210000, China
2
Gaochun Water Affairs Bureau, Nanjing 210000, China
3
Chuhe River Management Office of Nanjing, Nanjing 210000, China
4
College of Agricultural Science and Engineering, Hohai University, Nanjing 210000, China
*
Authors to whom correspondence should be addressed.
Water 2022, 14(4), 675; https://doi.org/10.3390/w14040675
Submission received: 19 January 2022 / Revised: 16 February 2022 / Accepted: 18 February 2022 / Published: 21 February 2022
(This article belongs to the Special Issue Pollution and Restoration of Agricultural Soil and Water Resources)

Abstract

:
Nitrogen losses under different irrigation modes have been evaluated by many studies, yet it is not very clear whether the lost N sources are from the soil or fertilizer. In order to quantitatively investigate the effects of different irrigation modes on fertilizer N loss, we used the 15N-labeledurea (15N abundance of 19.6%) as fertilizer and the lettuce (Lactuca sativa var. angustana iris) as the plant material to conduct a field experiment under three different lower limits of drip irrigation, including 75% (DR1), 65% (DR2) and 55% (DR3), accounting for the field water capacity. A furrow irrigation treatment (FI) with the same irrigation regime as DR2 was used as the control. The fate and balance of 15N under these treatments were studied. The results showed that, after the lettuce harvest, 36.9–48.8% of the applied fertilizer 15N remained in 0–80-cm soil, 32.6–39.4% was absorbed by plants, and 18.6–26.3% was lost via pathways such as volatilization or leaching. Under the same irrigation regime, 15N loss caused by FI (26.3%) was significantly (p < 0.05) higher than that byDR2 (18.9%). Moreover, FI increased the amount of total 15N, mineral 15N and organic 15N in the deeper soil layers (60 cm depth and below), leading to a potential risk of 15N leaching. The soil 15N residue was relatively lower under DR1, while the crop-absorbed 15N or 15N loss was atthe highest level among the three drip irrigation treatments. The correlation analysis results showed that increasing the total irrigation amount or increasing the irrigation frequency might increase the 15N loss. We concluded that using drip irrigation instead of furrow irrigation with controlling the lower irrigation limit at 65% is conducive to improving crop 15N utilization and reducing 15N loss from lettuce fields.

1. Introduction

Lettuce (Lactuca sativa var. angustana iris) belongs to Lactuca L. in Compositae [1]. Many studies have shown that lettuce contains a low sugar content but high contents of beneficial substances such as inorganic salts, vitamins and carotene. Meanwhile, it is rich in mineral elements such as potassium, sodium, calcium, phosphorus, iron and zinc. Lettuce is proven to be an important vegetable crop with nutritional and health-keeping value and is widely cultivated all over the world [2,3].
The main edible organ of stem-use lettuce is the underground part of lettuce. In order to create a suitable growth environment for the underground part of lettuce, ridge planting has been adopted in most cultivation areas, which also provides conditions for furrow irrigation. Most vegetable cultivated areas of China use the traditional irrigation methods such as hand irrigation or furrow irrigation. Under protected cultivation, the irrigation means were relatively advanced; about 30% of the protected areas adopted water-saving irrigation methods such as drip or spray irrigation, while these advanced irrigation methods have not been well-popularized in field cultivation [4]. On the other hand, in China, vegetable production generally presents the characteristics of “high input and high output” [5]. According to a survey, the average input of pure N (nitrogen amount from the nitrogen fertilizer) fora one-season vegetable crop reaches 469–2000 kg ha−1, and chemical fertilizer N is applied excessively, causing multiple soil environmental and ecological problems [6]. Furrow irrigation will undoubtedly increase the risk of runoff loss and leaching loss of chemical fertilizer N [7].
A large number of studies have shown that drip irrigation is conducive to improving crop N use efficiency and reducing the risk of N loss [8,9]. However, most of these studies have used common N fertilizer as the N source. When studying the fate of fertilizer N in the soil–crop system, it is difficult to distinguish whether the observed N comes from the soil or fertilizer, thus limiting the quantitative investigation of fertilizer N loss under the impact of different irrigation modes. We hypothesized that, compared to furrow irrigation, the different soil moisture conditions created by drip irrigation may affect the plant absorption for fertilizer nitrogen and change the distribution of fertilizer nitrogen in the soil layers, which may, finally, impact the loss of fertilizer nitrogen. Therefore, in this study, 15N labeling was used as a means to distinguish soil N and fertilizer N, and a traditional furrow irrigation was used as a control to research the distribution and loss of fertilizer N under different lower limits of drip irrigation. The objective is: (1) to compare the effects of furrow irrigation and drip irrigation on the fate of fertilizer N, (2) to evaluate the differences of fertilizer N loss among different drip irrigation regimes and (3) to find out the main driving factors of irrigation that affect fertilizer N loss.

2. Material and Method

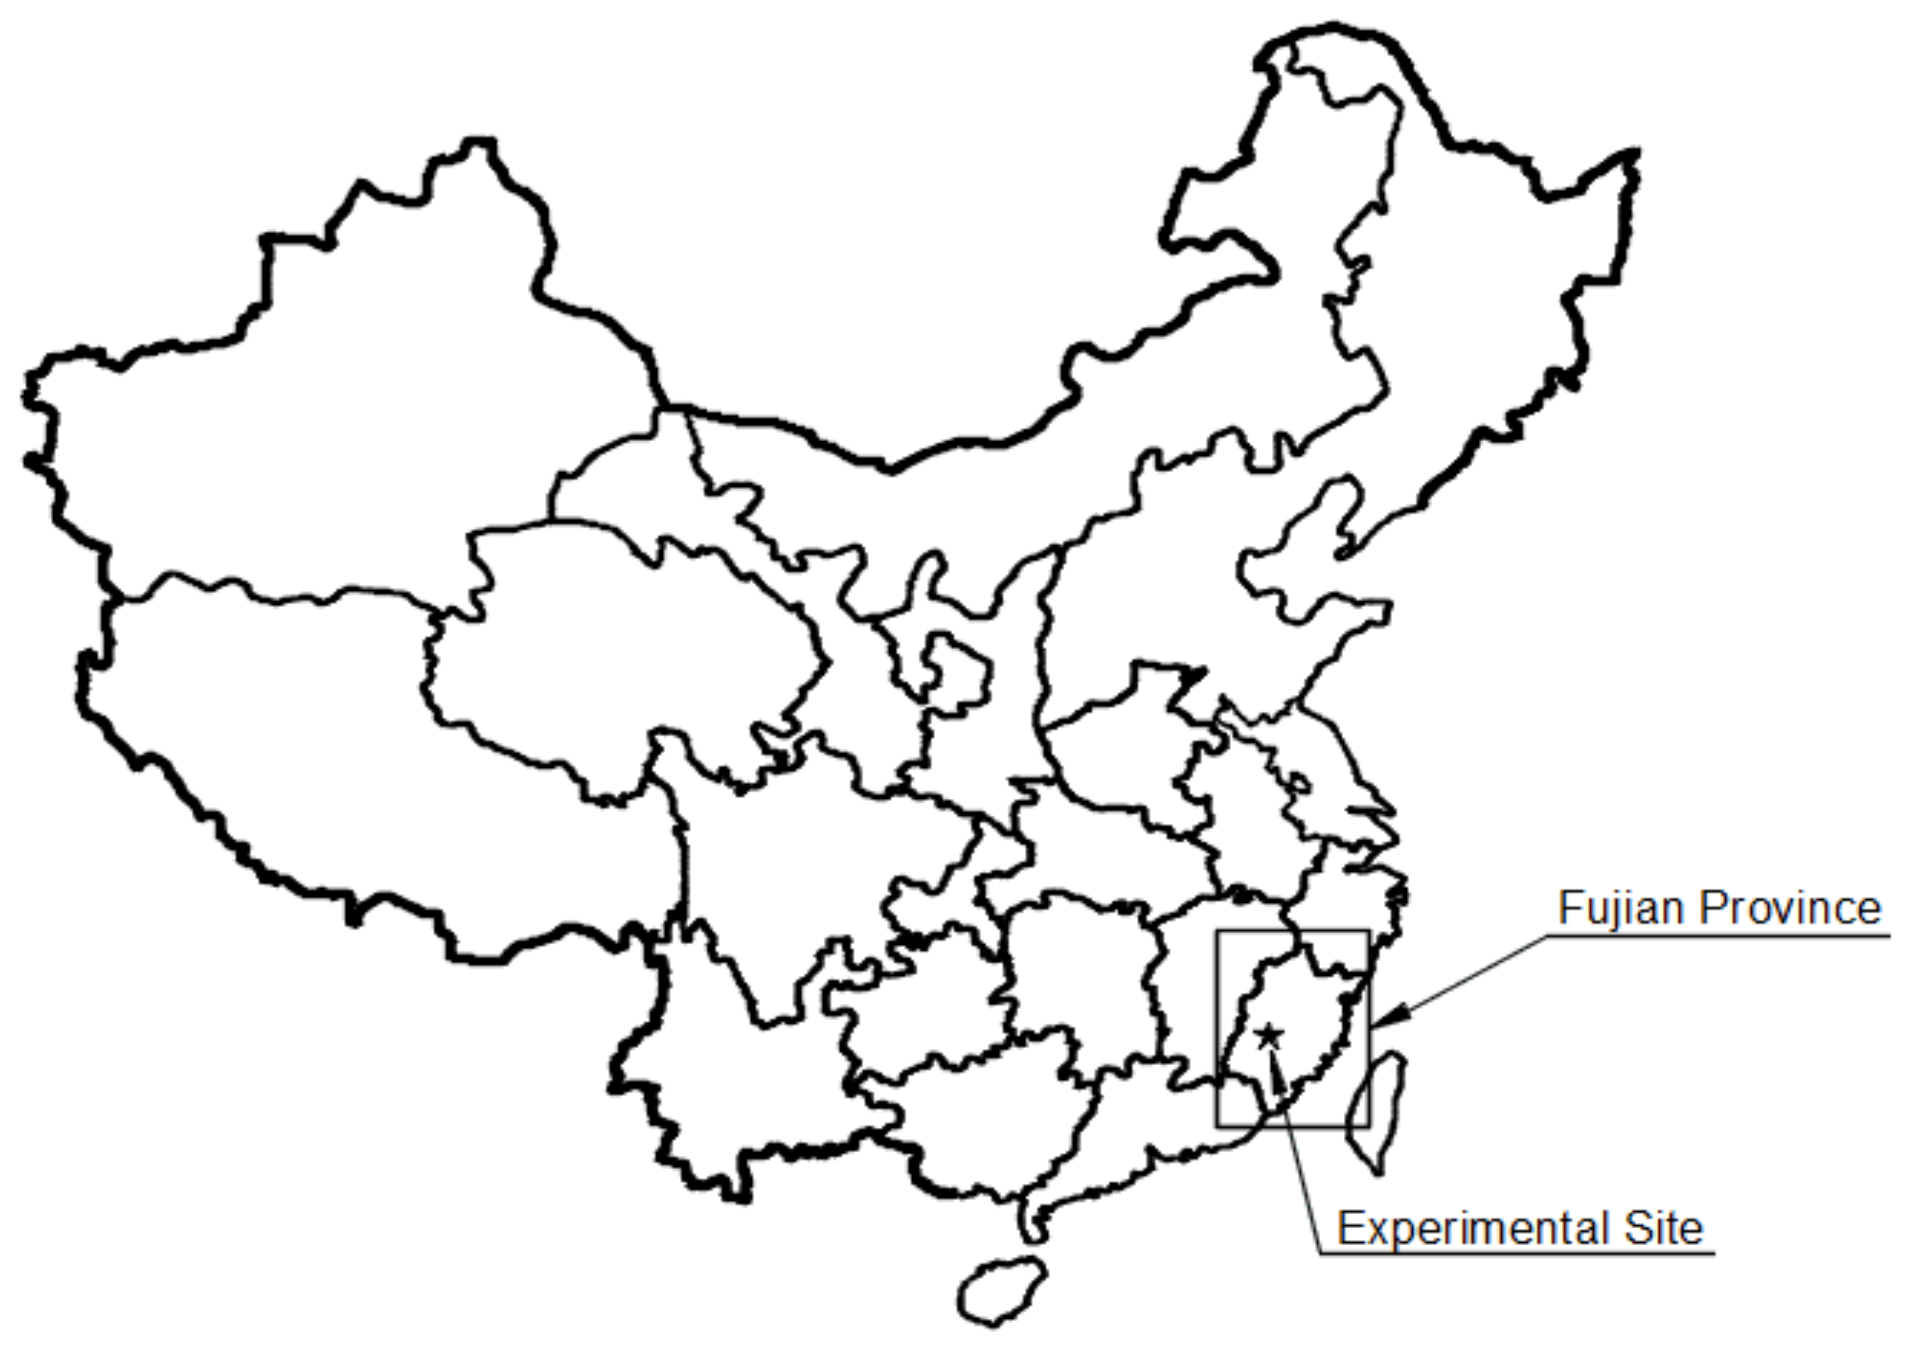
2.1. Experimental Site

The experiment was conducted from 15 September to 30 December in 2020 at Fruit Science Demonstration Base of the Old Liberated Area (Figure 1) in Yunxiao County, Fujian Province, China. The annual average temperature in Yunxiao County is 21.3 °C. In the past ten years, the extremely maximum temperature was 38.1 °C, and the extreme minimum temperature was −0.2 °C. The annual precipitation is 1730.6 mm, and the frost-free duration is 347 days. The county has a subtropical marine monsoon climate. In the experimental year, the average temperature from September to December was 33, 31, 28 and 25 °C, respectively, and the rainfall was 165, 55, 36 and 30 mm, respectively. The soil type in the experimental site was red soil, according to the Chinese Soil Taxonomy. The physical and chemical properties of the soil in the plough layer were as follows: pH (pHw) of 5.9, available N (using the alkali hydrolysis nitrogen diffusion method) of 90.2 mg kg−1, available P (using the Olsen method) of 12.2 mg kg−1, available K (using the flame photometer method) of 152.3 mg kg−1, bulk density (using the ring knife method) of 1.26 g cm−3 and field water capacity (using the ring knife method) of 29.8%.

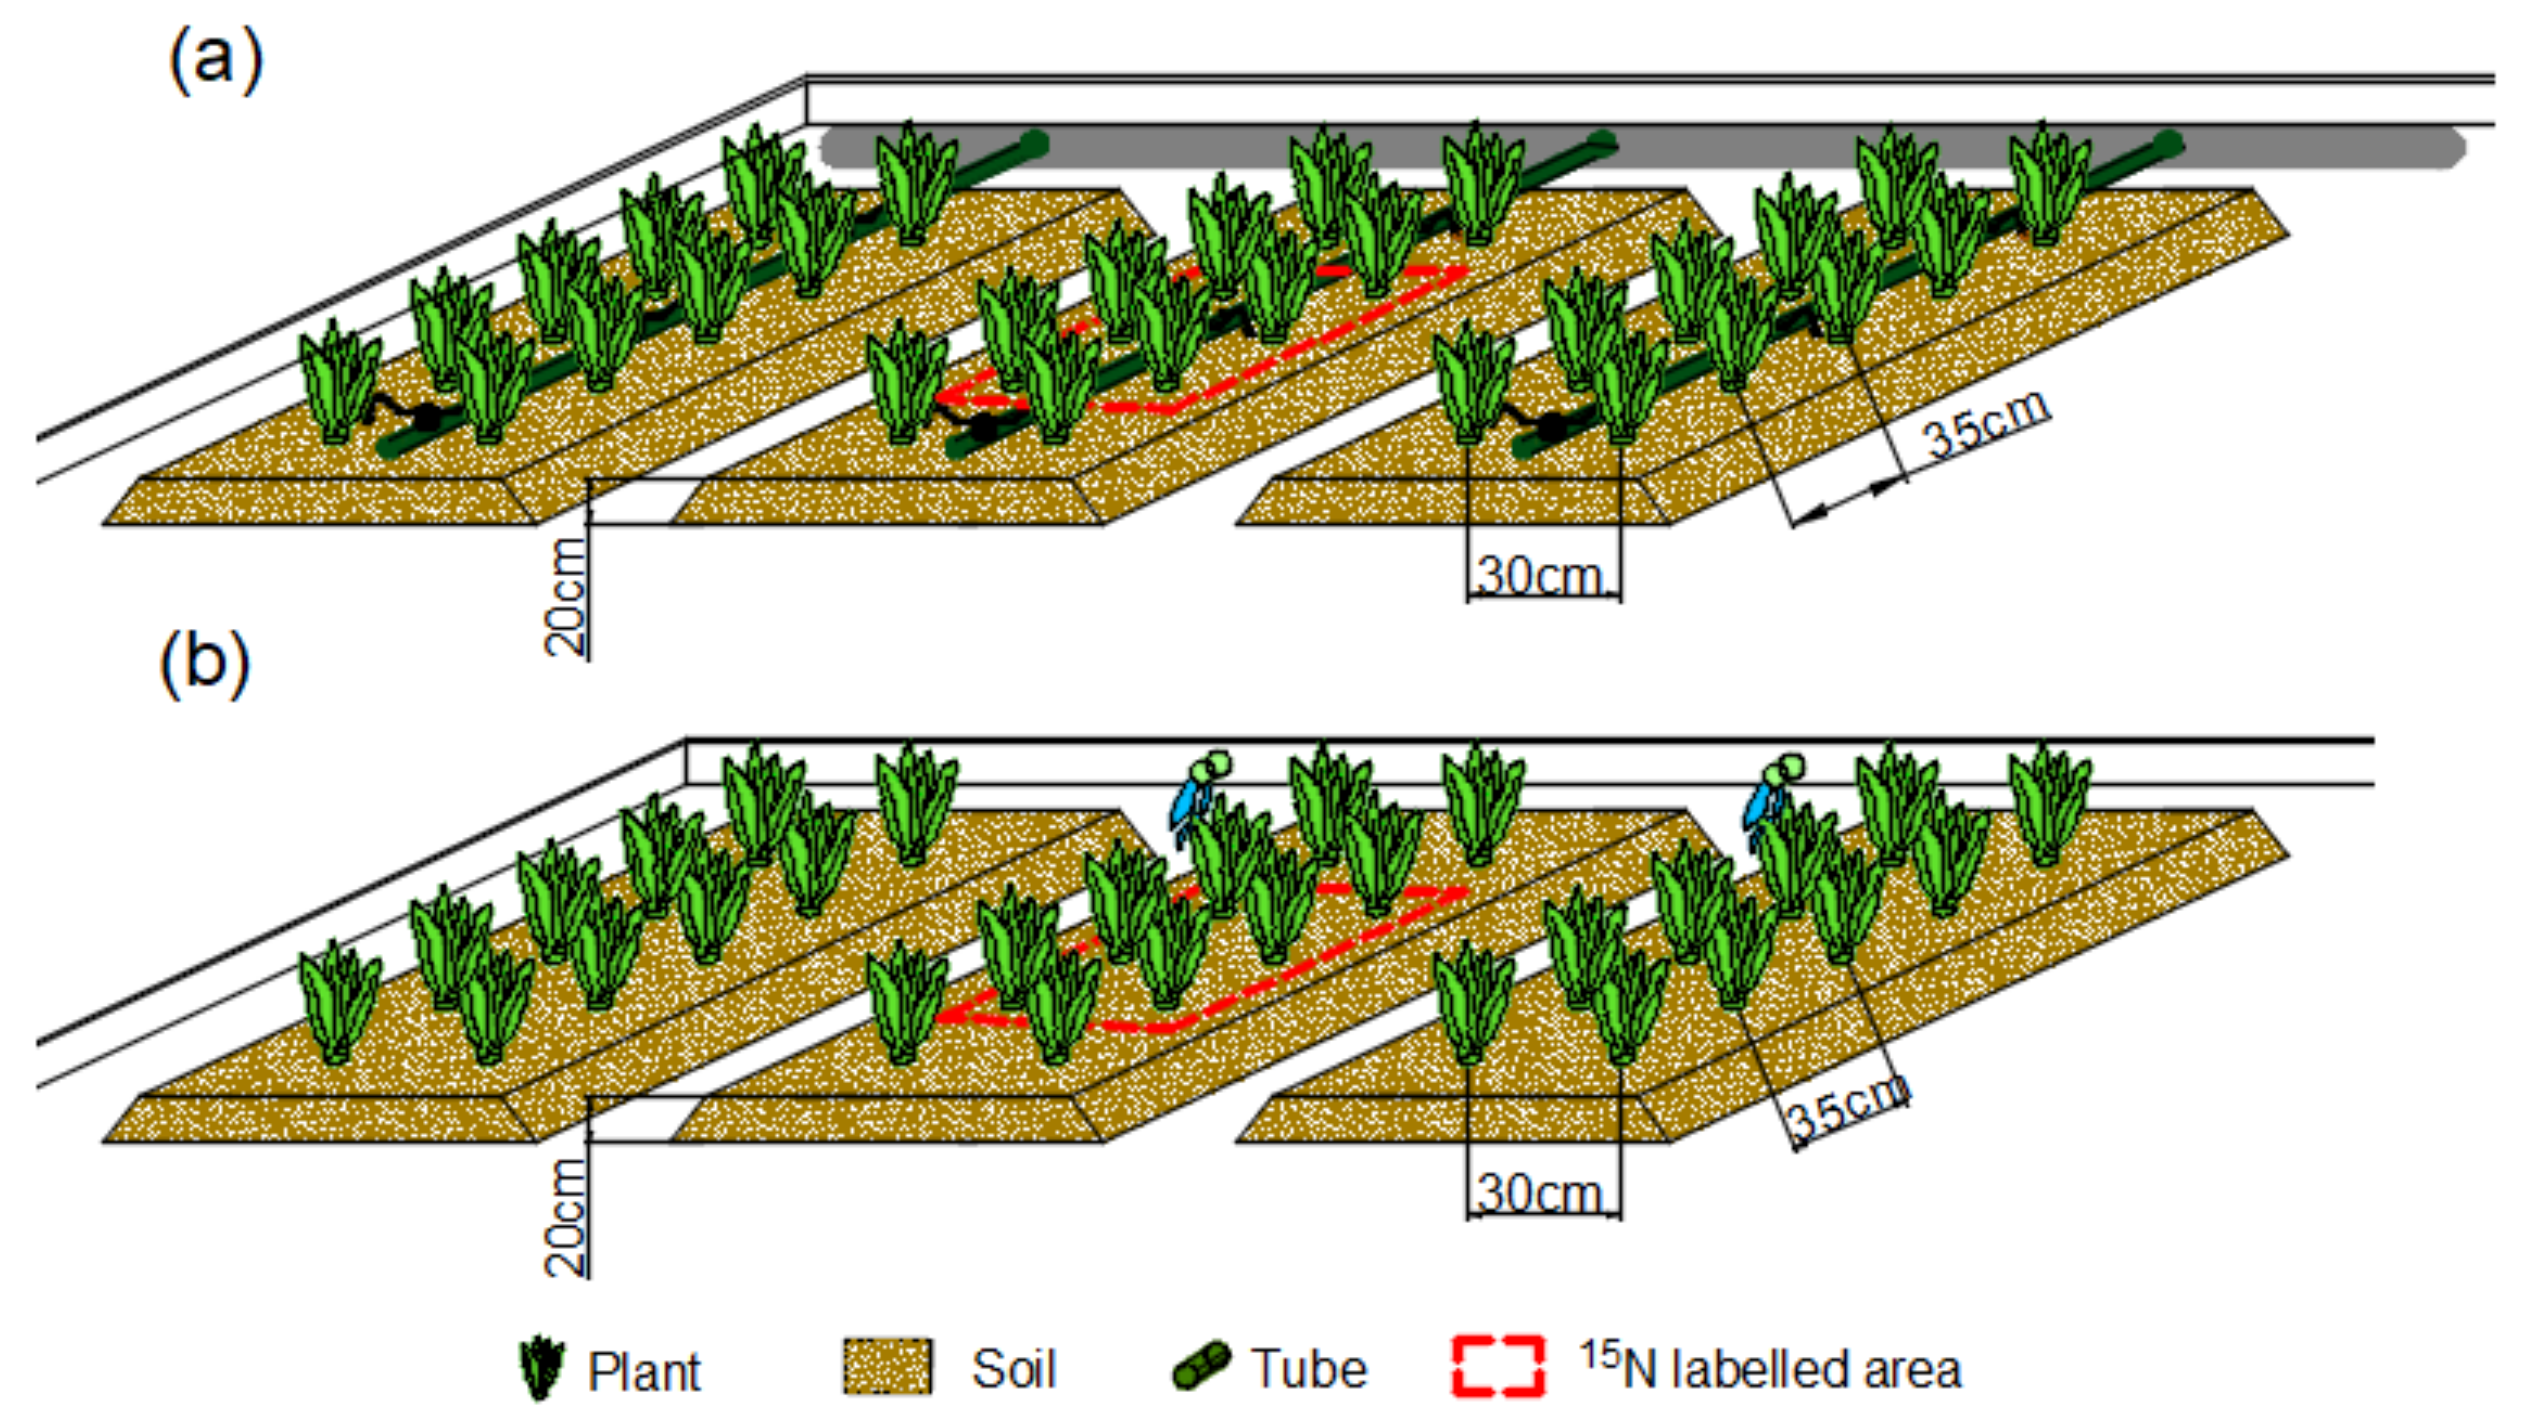
2.2. Experimental Design

In this experiment, the water-sensitive plant lettuce (Lactuca sativa var. angustana iris) was used as the material. The variety of lettuce used in this experiment was “Feiqiao lettuce 1”. The lettuce seeds were soaked in clean water for 8 h, wrapped in sand cloth and placed in the refrigerator at 5 °C for 10 h to break the dormancy. The seeds were flipped once during the 10 h to facilitate the orderly germination. After this, the seeds were taken out and placed in the shade for 20 h. The seeds were sowed in the seedling tray when 2/3 of the seeds exposed white buds. Seedlings were transplanted into the field at the seedling age of 25 d, when each seedling had 4 to 5 leaves.
From the rosette stage, three different lower limits of drip irrigation, including 75% (DR1), 65% (DR2) and 55% (DR3), accounted for the field water capacity and were controlled. The soil moisture in the plough layer was measured everyday; the irrigation was started once the moisture reached the lower limits and finished until reaching the upper limit of 95%. A furrow irrigation treatment (FI) with the same irrigation regime as DR2 was used as the control. The local irrigation practice was furrow irrigation, and the water was supplied to 1/3 of the furrow height then naturally dried. In this study, the converted furrow irrigation quota according to the DR2 treatment was consistent with the local practice. The irrigation quota was calculated as follows:
M = S × r × h × Q × ( q 1 q 2 ) / 0.95
where M is the irrigation quota (m3), S is the irrigation area (m2), r is the soil bulk density (kg m−3), h is the planned depth of wetted soil (0.2 m), Q is the field water capacity (%), q1 is the upper limit of irrigation, q2 is the lower limit of irrigation and 0.95 is the irrigation coefficient.
To sum up, there were four different irrigation treatments in this study. Each treatment was repeated three times. The specific division of the growth stages of lettuce is shown in Table 1. The total irrigation amount, irrigation quota, irrigation interval and irrigation frequency for the treatments are displayed in Table 2.
The field experimental area was divided into 12 blocks. Each treatment occupied 3 blocks, and the area of each block was 32 m2. One block contained three ridges of lettuce, with ridge heights of 20 cm, width of 60 cm and spacing between the two ridges of 20 cm. The lettuces were planted with a row-to-row spacing of 30 cm and plant-to-plant spacing of 35 cm. A micro-block was established in the center of each block, where 6 lettuces were planted and 15N-labeled fertilizer was applied for these 6 lettuces. The blocks for the drip irrigation treatment (DR1, DR2 or DR3) and the furrow irrigation treatment (FI) were respectively shown in Figure 2a,b (Figure 2a,b does not show all lettuces in the block). In order to prevent the lettuce outside the micro-block from absorbing the 15N, the micro-block was protected by buried two impervious membranes (60 cm of both width and length) perpendicular to the ridge. Meanwhile, to prevent the lateral infiltration of water between blocks, a 60-cmdepth impervious membrane was used to separate adjacent blocks. An additional soil ridge without lettuce planting was arranged between the furrow irrigation block and other blocks.
The fertilization for each block was consistent. The total fertilizer application rate was 675 kg ha−1 of urea (CO(NH2)2, N of 46%), 600 kg ha−1 of calcium superphosphate (Ca(H2PO4)2 and CaSO4·2H2O, P of 16%) and 375 kg ha−1 of potassium sulfate (K2SO4, K of 43%). The calcium superphosphate was all applied as the basal fertilizer. The urea, as well as the potassium sulfate, was applied 40% for the basal fertilizer, 20% for the first topdressing and 40% for the second topdressing. The dates of basal fertilization, first topdressing and second topdressing were 12 October, 28 October and 22 November, respectively. The fertilizer was applied at a 6-cm soil depth using a hole applicator. The urea (15NH2CO15NH2) with 15N abundance of 19.6% was used as the N fertilizer in the micro-block. Except using 15N fertilizer, the micro-block was in-line with the block on the variety and application method of other fertilizers, as well as irrigation and field management. In the early and late growth stages of lettuce, heart rot and downy mildew were prevented, respectively, using plant protection chemicals, including propineb, imidacloprid, putrescine, etc.

2.3. Sampling and Measurement

In this experiment, the indicators, including soil mass moisture content, plant dry matter, plant total N, soil mineral N and 15N atom percentage excess, were measured.
After water control was started, samples of soil at 0–20-cm depths were collected once a day with a soil drill for determining the soil mass moisture content. The soil mass moisture content (%) was determined by the oven drying method.
On 28 December (harvest stage), the soil samples in the micro-block were collected using the five-point sampling method. The soil drill was used to collect soil samples of 10 cm per layer to the depth of 80 cm. Three lettuce plants were randomly selected from each micro-block, and each plant was separated into the aboveground part and the underground part. The plant samples were dried in an oven at 70 °C to a constant weight and then weighed to determine the plant dry matter (kg ha−1). The plant total N (%) was measured by the Kjeldahl method after digestion with H2SO4-H2O2 [10].
The dried plant samples were ground and passed througha 0.15-mm sieve. Similarly, the soil samples after natural air drying were ground and passed from the 0.15-mm sieve for the measurement. The mineral N in the fresh soil samples was extracted with 2-M KCl, and the extraction solution was distilled with MgO and Devarda alloy simultaneously to obtain distillate. The 15N atom percentage excess (%) in dry plant, dry soil or distillate was determined using an isotope mass spectrometer (Finniga-Mat-251, Mass-Spectrometers, Finnigan, Germany) [11,12].

3. Calculations

(1) 15N use efficiency of lettuce (15NUE, %) [13]:
N dff = C s × E s E f
15 NUE = Ndff M f × 100 %
where Ndff (kg ha−1) is the total amount of 15N in lettuce plant, Cs (kg ha−1) is the total N in lettuce plant, Es (%) is the 15N atomic percentage excess in lettuce plant (%), Ef (%) is the 15N atom percentage excess in labeled N fertilizer and Mf (kg ha−1) is the total amount of 15N in the labeled N fertilizer.
(2) Soil organic 15N (kg ha−1): the organic 15N is the amount difference between the total 15N and the mineral 15N [14].
(3) 15N recovery (kg ha−1): the 15N recovery is sum of the soil residual 15N in the 0–80-cm layer and the lettuce plant 15N [15].
(4) 15N loss (kg ha−1): the 15N loss is the amount difference between the total 15N application and 15N recovery [16].
Statistical analysis were conducted using the SPSS (Statistical Product and Service Solutions) 17.0 software by International Business Machines Corporation in New York, the United States of America.

4. Result

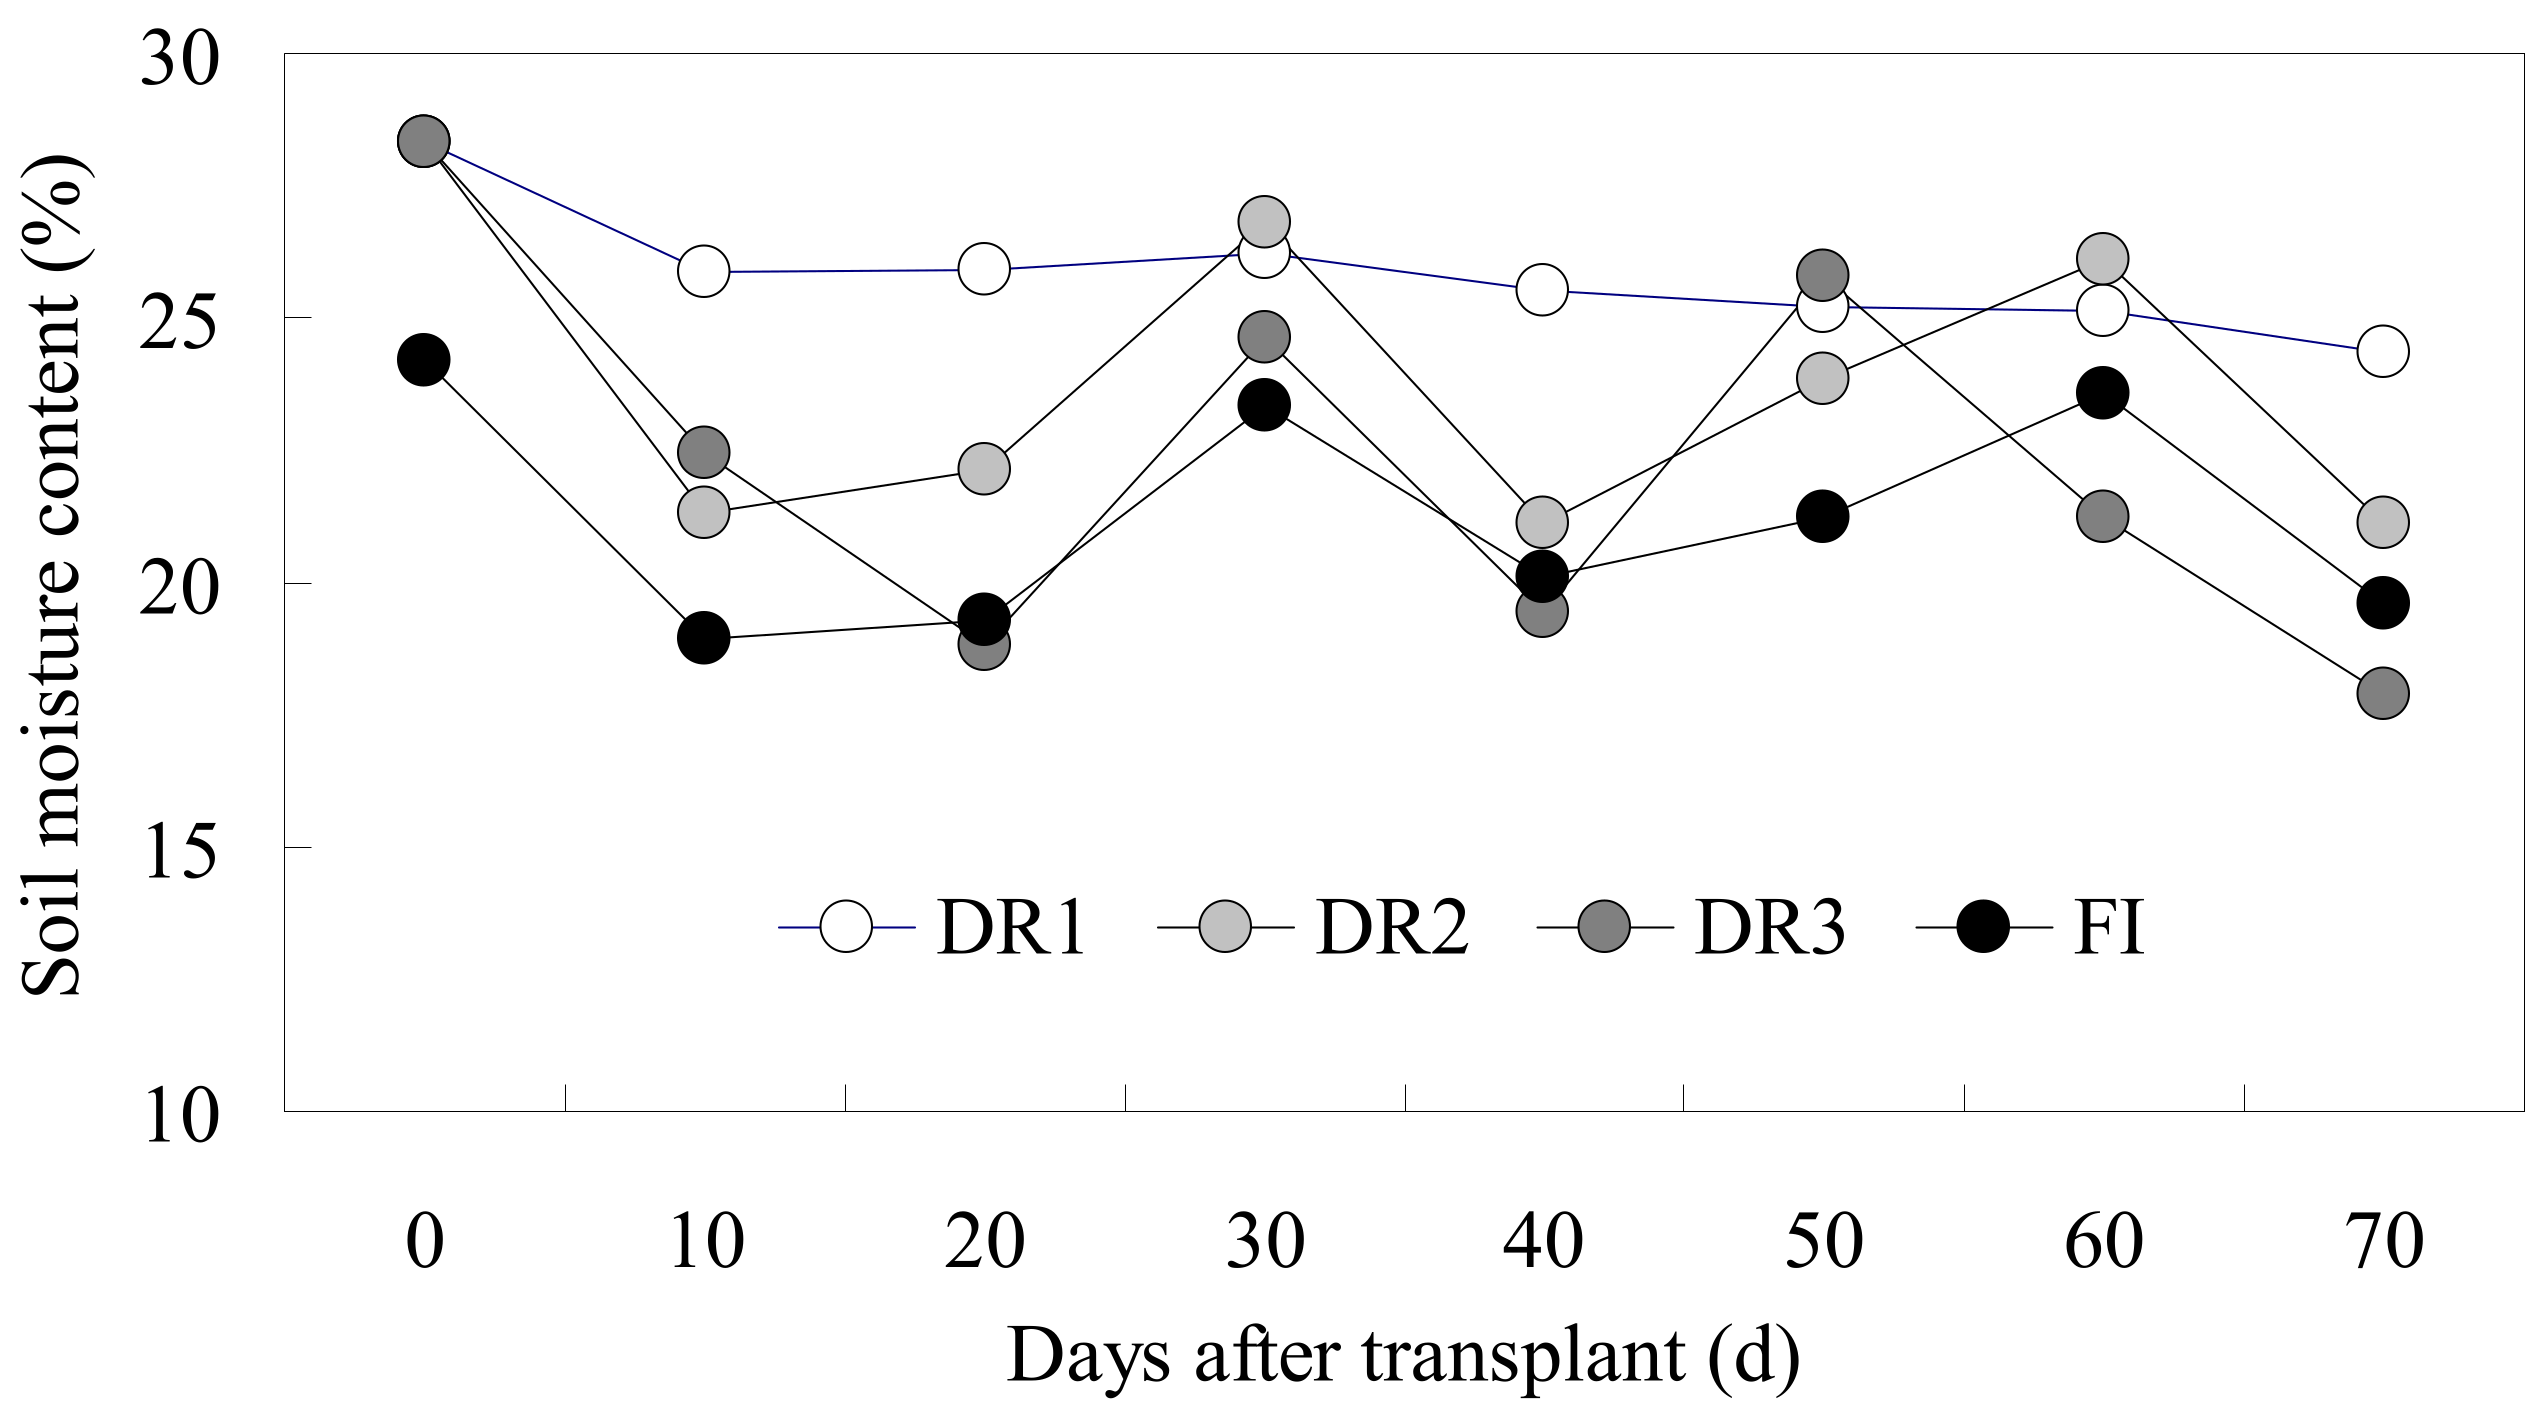
4.1. Variation of Soil Moisture in Plough Layer

The soil moisture in the plough layer showed a fluctuating regularity (Figure 3) under the different irrigation modes. The soil moisture under DR1 varied slightly and was at a high level of 24.3–28.3%. The soil moisture under DR2 during the whole growth period of lettuce was generally lower than that under DR1, except for some individual time points such as 30 and 60 days after transplanting, which was mainly due to the fact that the DR2 treatment conducted the irrigation exactly before these two time points. Similarly, the soil moisture under DR3 was lower than under DR2. It was worth noting that the average soil moisture under FI was 10.78% lower than under DR2, although the irrigation regimes of FI and DR2 were the same. This might be due to the furrow depth of 20 cm; FI firstly infiltrated the soil at a depth of 13–20 cm, according to the irrigation quota, and the wetting of the 0–13-cm soil layer needed to rely on the affection of the soil capillary. However, the soil moisture formed by the soil capillary under the FI treatment was lower than that directly dripped from the ridge surface under the DR2 treatment.

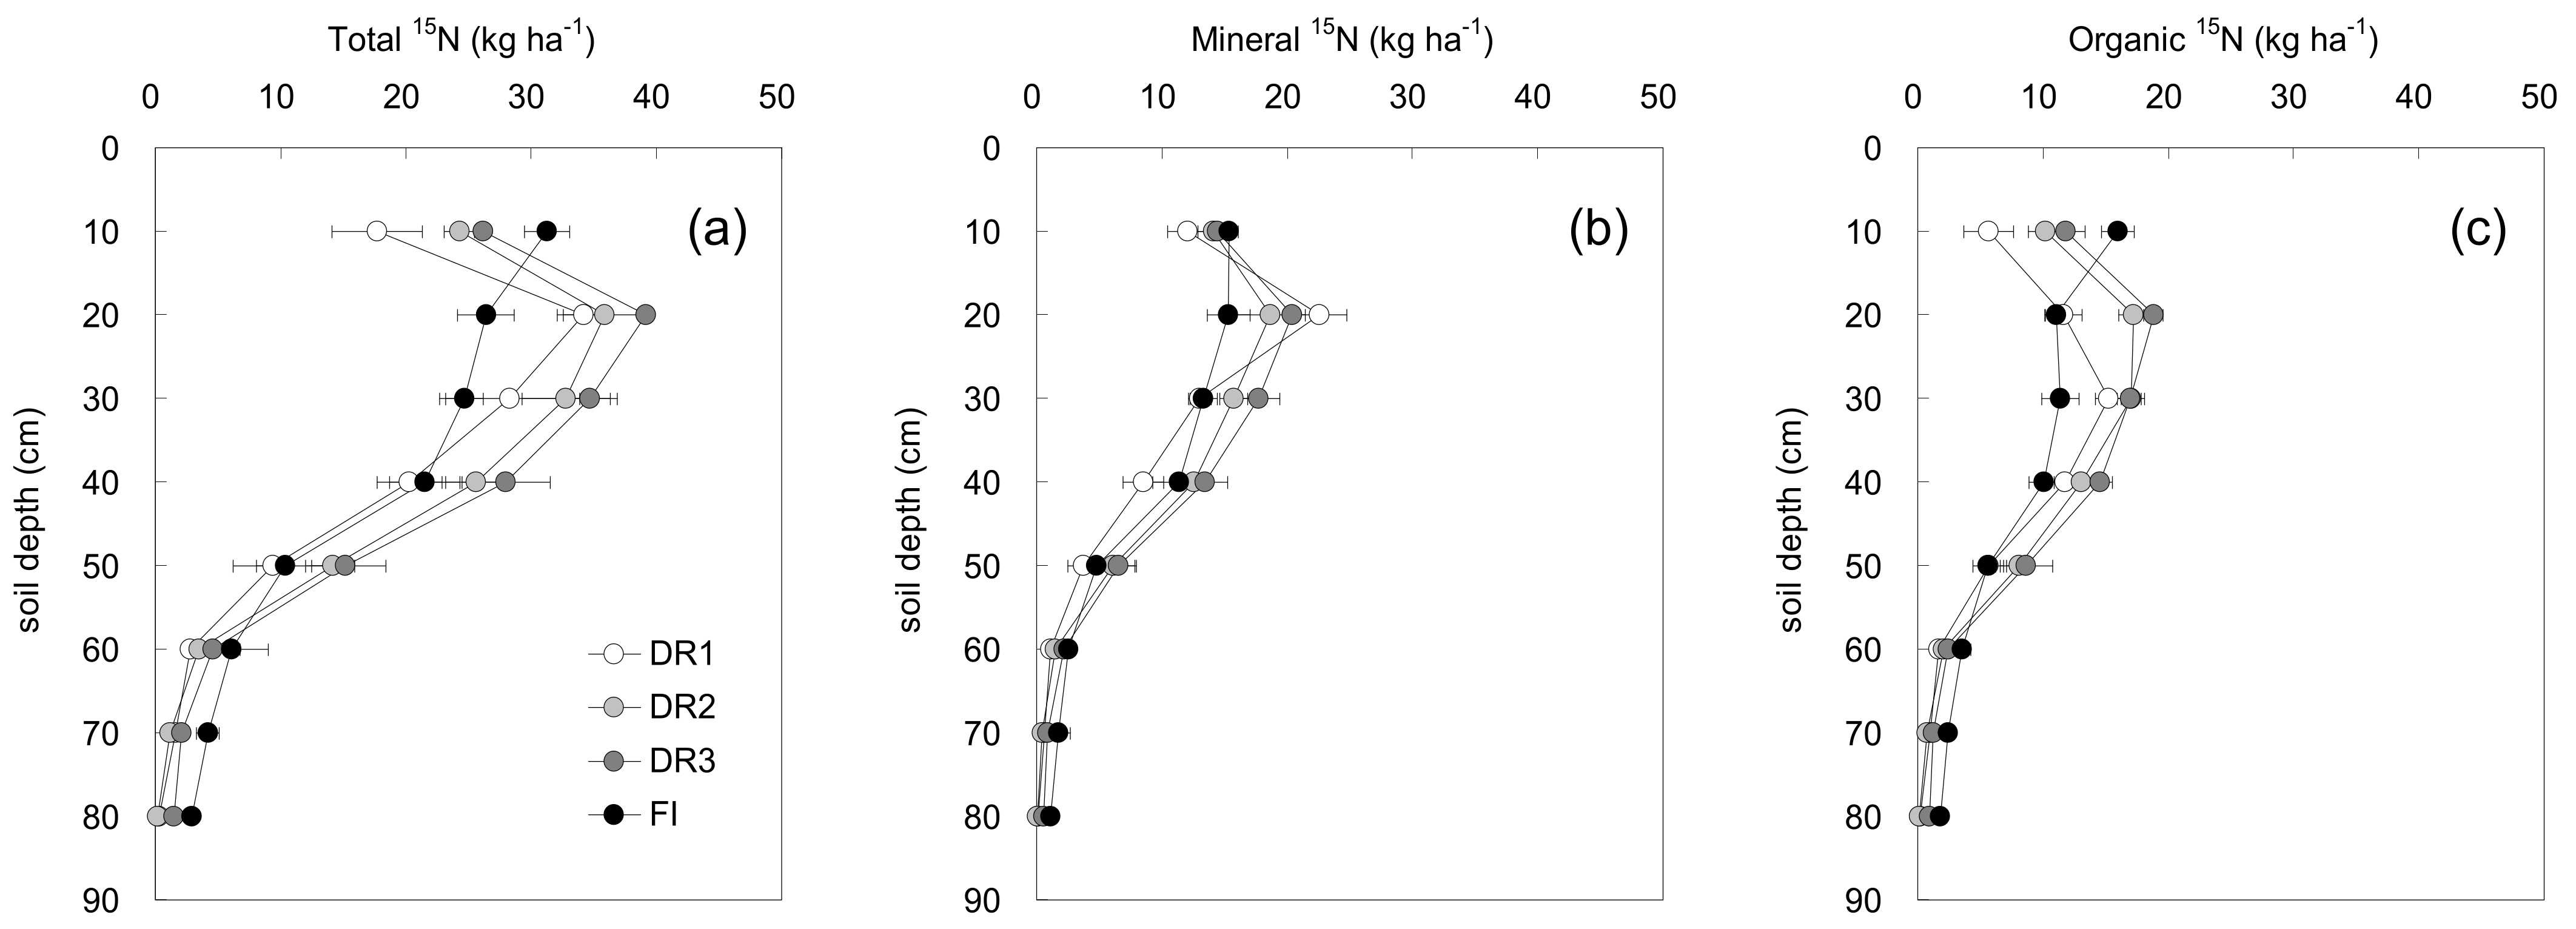
4.2. Effects of Different Irrigation Modes on the Fate of Fertilizer 15N in Soil

More than 80% of the residual 15N were in the 0–40-cm soil layer (Figure 4a). The 15N in the 10-cm soil layer treated with FI was obviously higher than that with the three drip irrigation treatments, which might be due to the fact that the 0–10-cm soil under FI has no directly downward irrigation water leaching compared with that under the drip irrigation treatments; therefore, the total amount of 15N residual in the 10-cm soil layer under FI was relatively higher. The highest 15N residue in the 20, 30, 40 or 50-cm layer was detected in the DR3 soil, while the highest 15N in the 60, 70 or 80-cm soil layers was found under FI. For each soil layer, the amount of total 15N residue was different among the four treatments, and the difference was especially obvious in the soil layers of 10–50 cm, indicating that both changes in the irrigation regime and irrigation method will influence the fate of the total 15N in the soil profile.
For the total soil residual 15N, 50.2–53.9% existed in the mineral form (Figure 4b). The mineral 15N mainly concentrated in the 10, 20, 30 and 40-cm soil layers, where the lettuce fleshy stems were distributed. The highest mineral 15N of 15.3 kg ha−1 in the 10-cm soil layer was found in FI and was 3.3, 1.2 and 0.9 kg ha−1 higher than DR1, DR2 and DR3, respectively. The mineral 15N in the 20-cm soil layer under DR1 was the highest, recorded as 22.6 kg ha−1. The mineral 15N in the 30–50-cm soil layer was the highest under DR3, but in 60 cm or below the 60-cm layer, mineral 15N was found the highest under FI; this regularity was similar to that of the total 15N.
The organic 15N among the different treatments showed significant differences in the soil layers of 10, 20, 30 or 40 cm (Figure 4c). The organic 15N under the drip irrigation treatments (DR1, DR2 and DR3) was generally higher than that under FI, and these organic 15N were mainly distributed in the 10–40-cm soil layer. FI treatment obtained the highest organic 15N content of 16.0 kg ha−1inthe 10-cm soil layer; however, the organic 15N contents under FI were the lowest among the four treatments in the 20–50-cm soil layer. Overall, among the three drip irrigation treatments, the organic 15N in each soil layer of DR3 was relatively higher, followed by DR2.

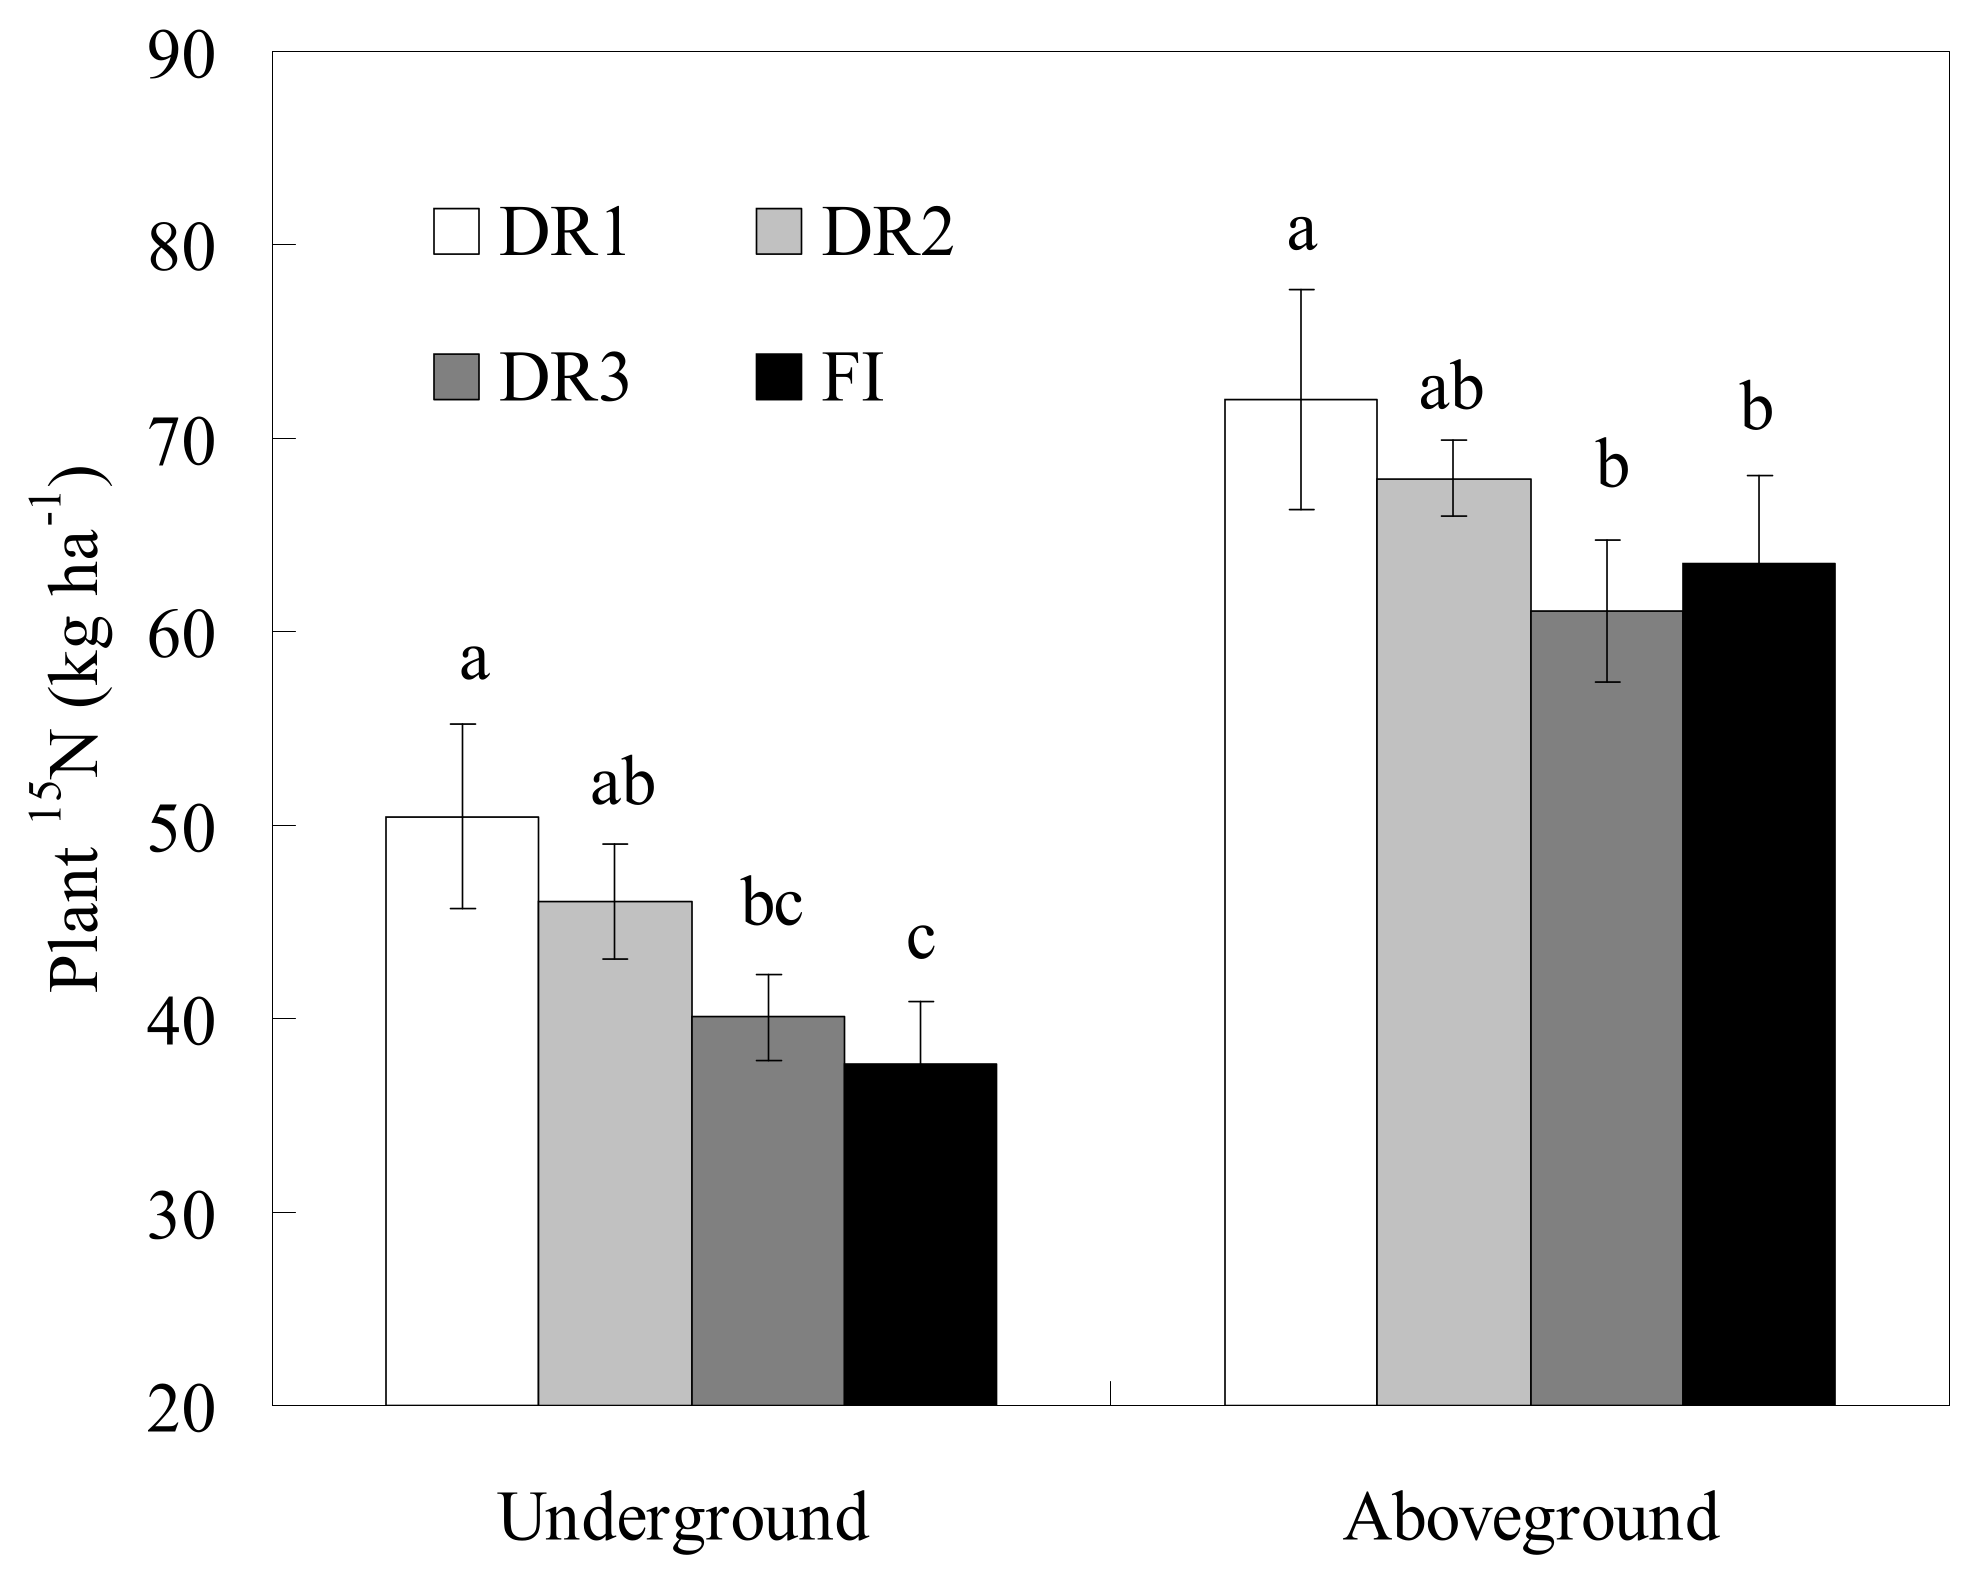
4.3. Effects of Different Irrigation Modes on Plant 15N Distribution

The plant 15N of the underground part was the highest under DR1, reaching 50.4 kg ha−1, significantly (p < 0.05) higher than under DR3 or FI, while there was no significant difference with that under DR2 (Figure 5). Meanwhile, plant 15N of the aboveground part under DR1 (72.0 kg ha−1) was also at the highest level, which was significantly (p < 0.05) higher compared to DR3 or FI. As seen from the observation results of FI and DR2, drip irrigation was obviously more conducive to 15N accumulation in the underground part of lettuce compared with furrow irrigation when under the same irrigation regime.

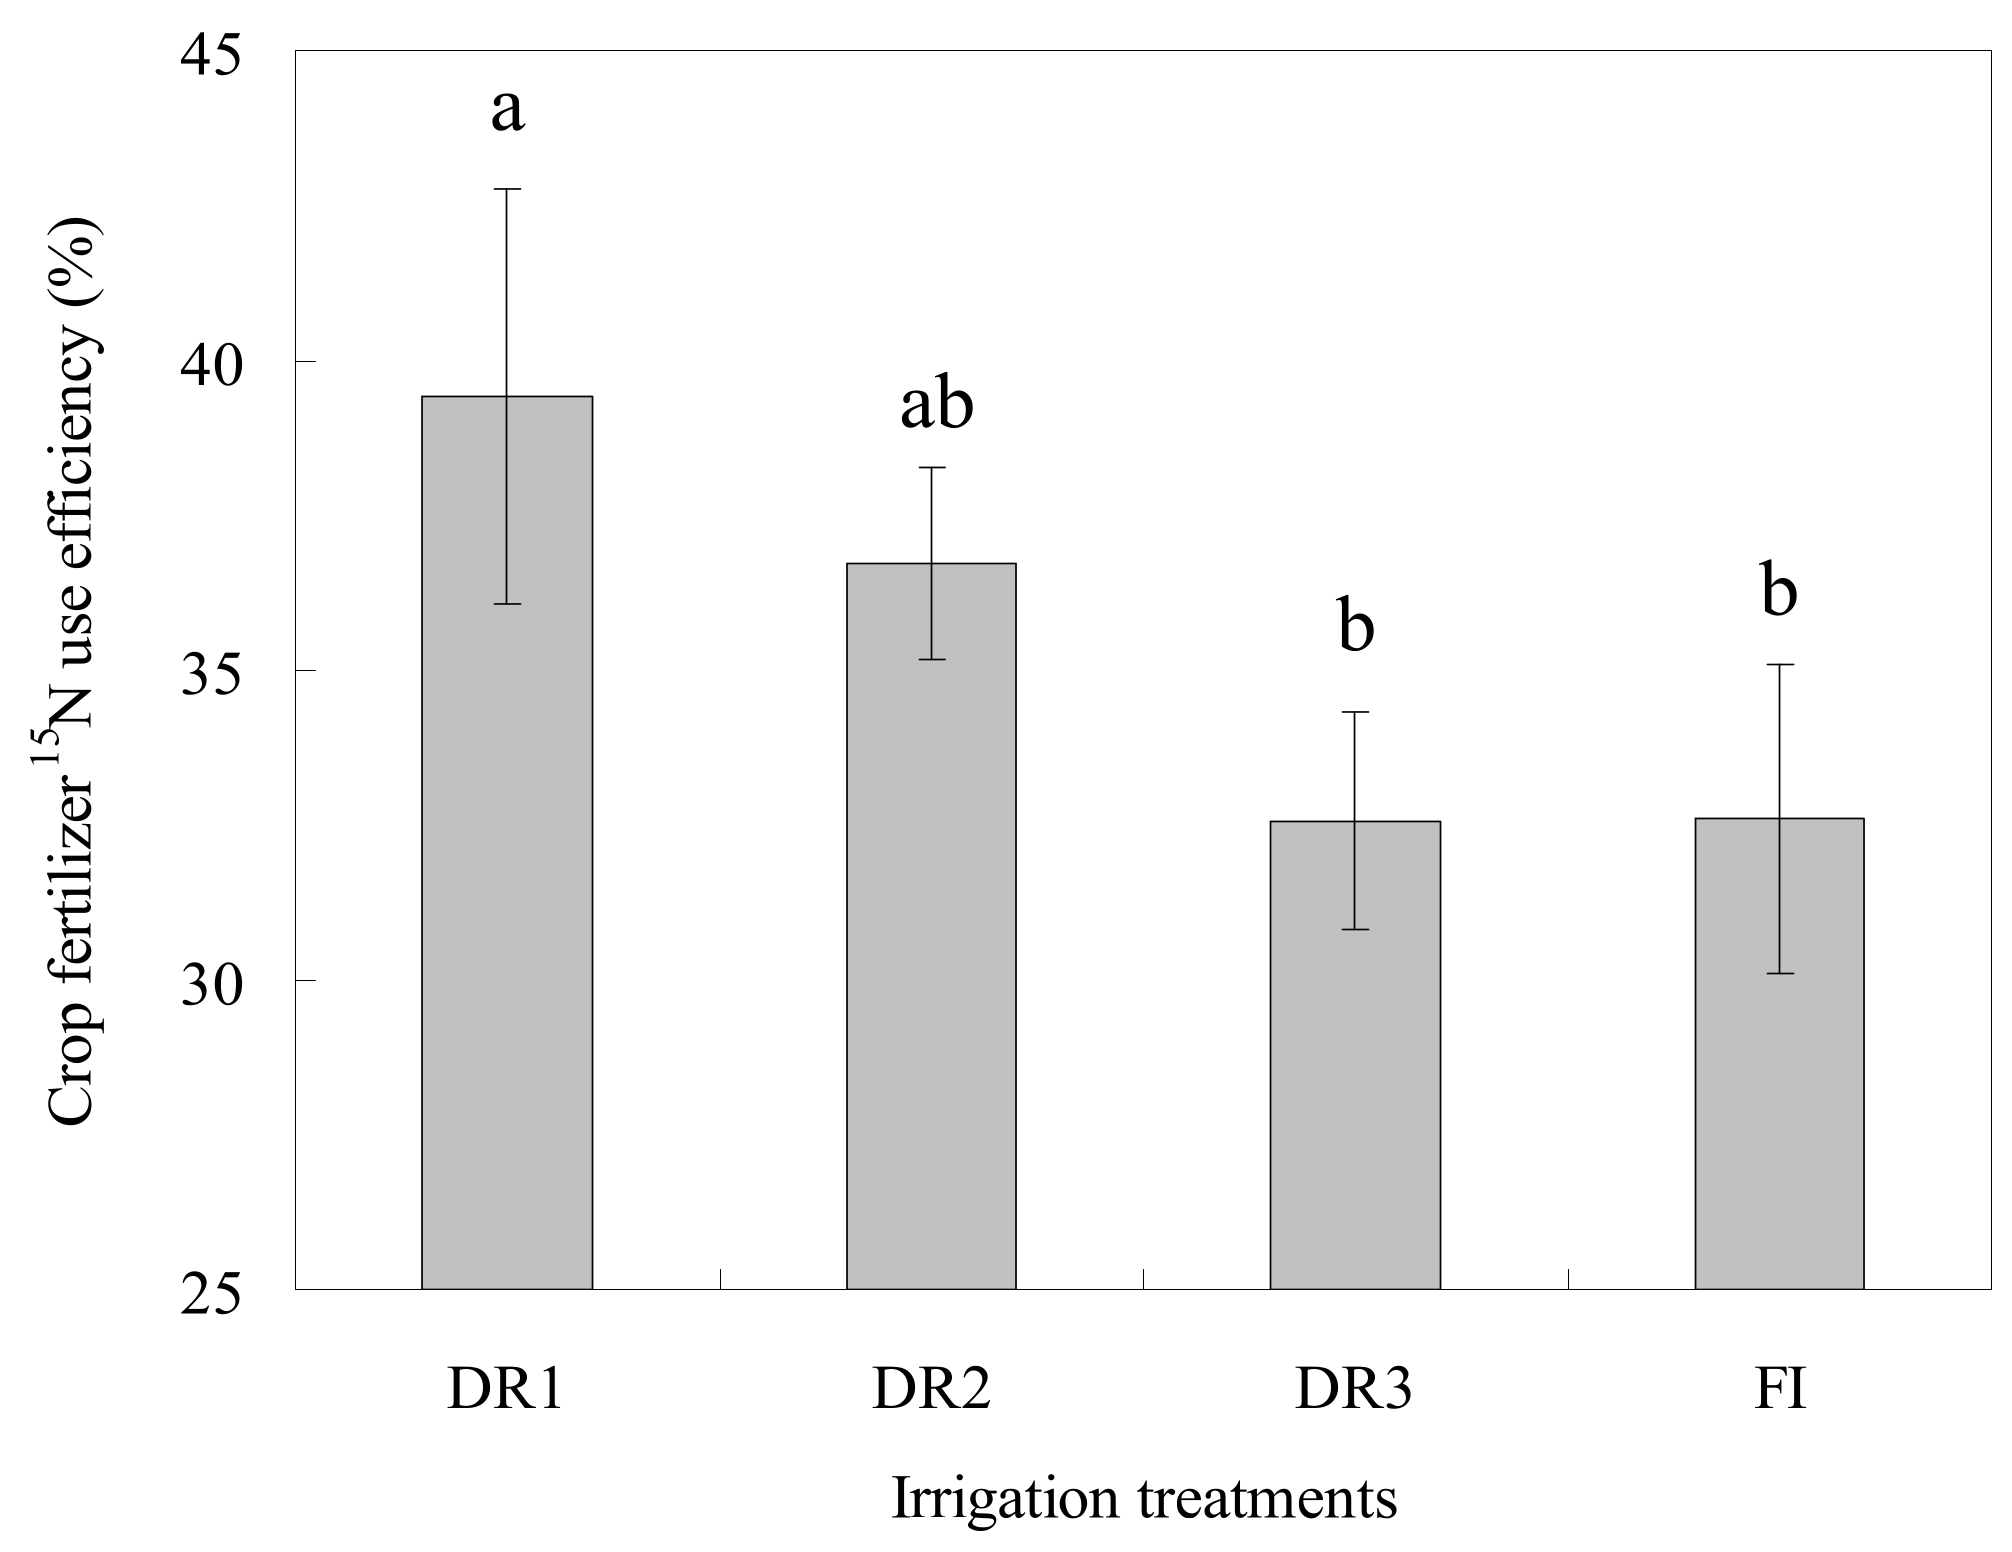
4.4. 15NUE of Lettuce under Different Irrigation Modes

The difference of lettuce 15NUE under the four irrigation modes was shown in Figure 6. The 15NUEunder DR1 was the highest, recording as 39.4%, followed by DR2 (36.7%); 15NUE treated with DR3 and FI was both 32.6%, showing no significant (p > 0.05) difference.
Under the same irrigation regime, the lettuce 15NUE of the drip irrigation treatment (DR2) was 12.7% higher than that of the furrow irrigation treatment (FI), indicating that using the drip irrigation instead of furrow irrigation was conducive to improving the in-season fertilizer N use efficiency.

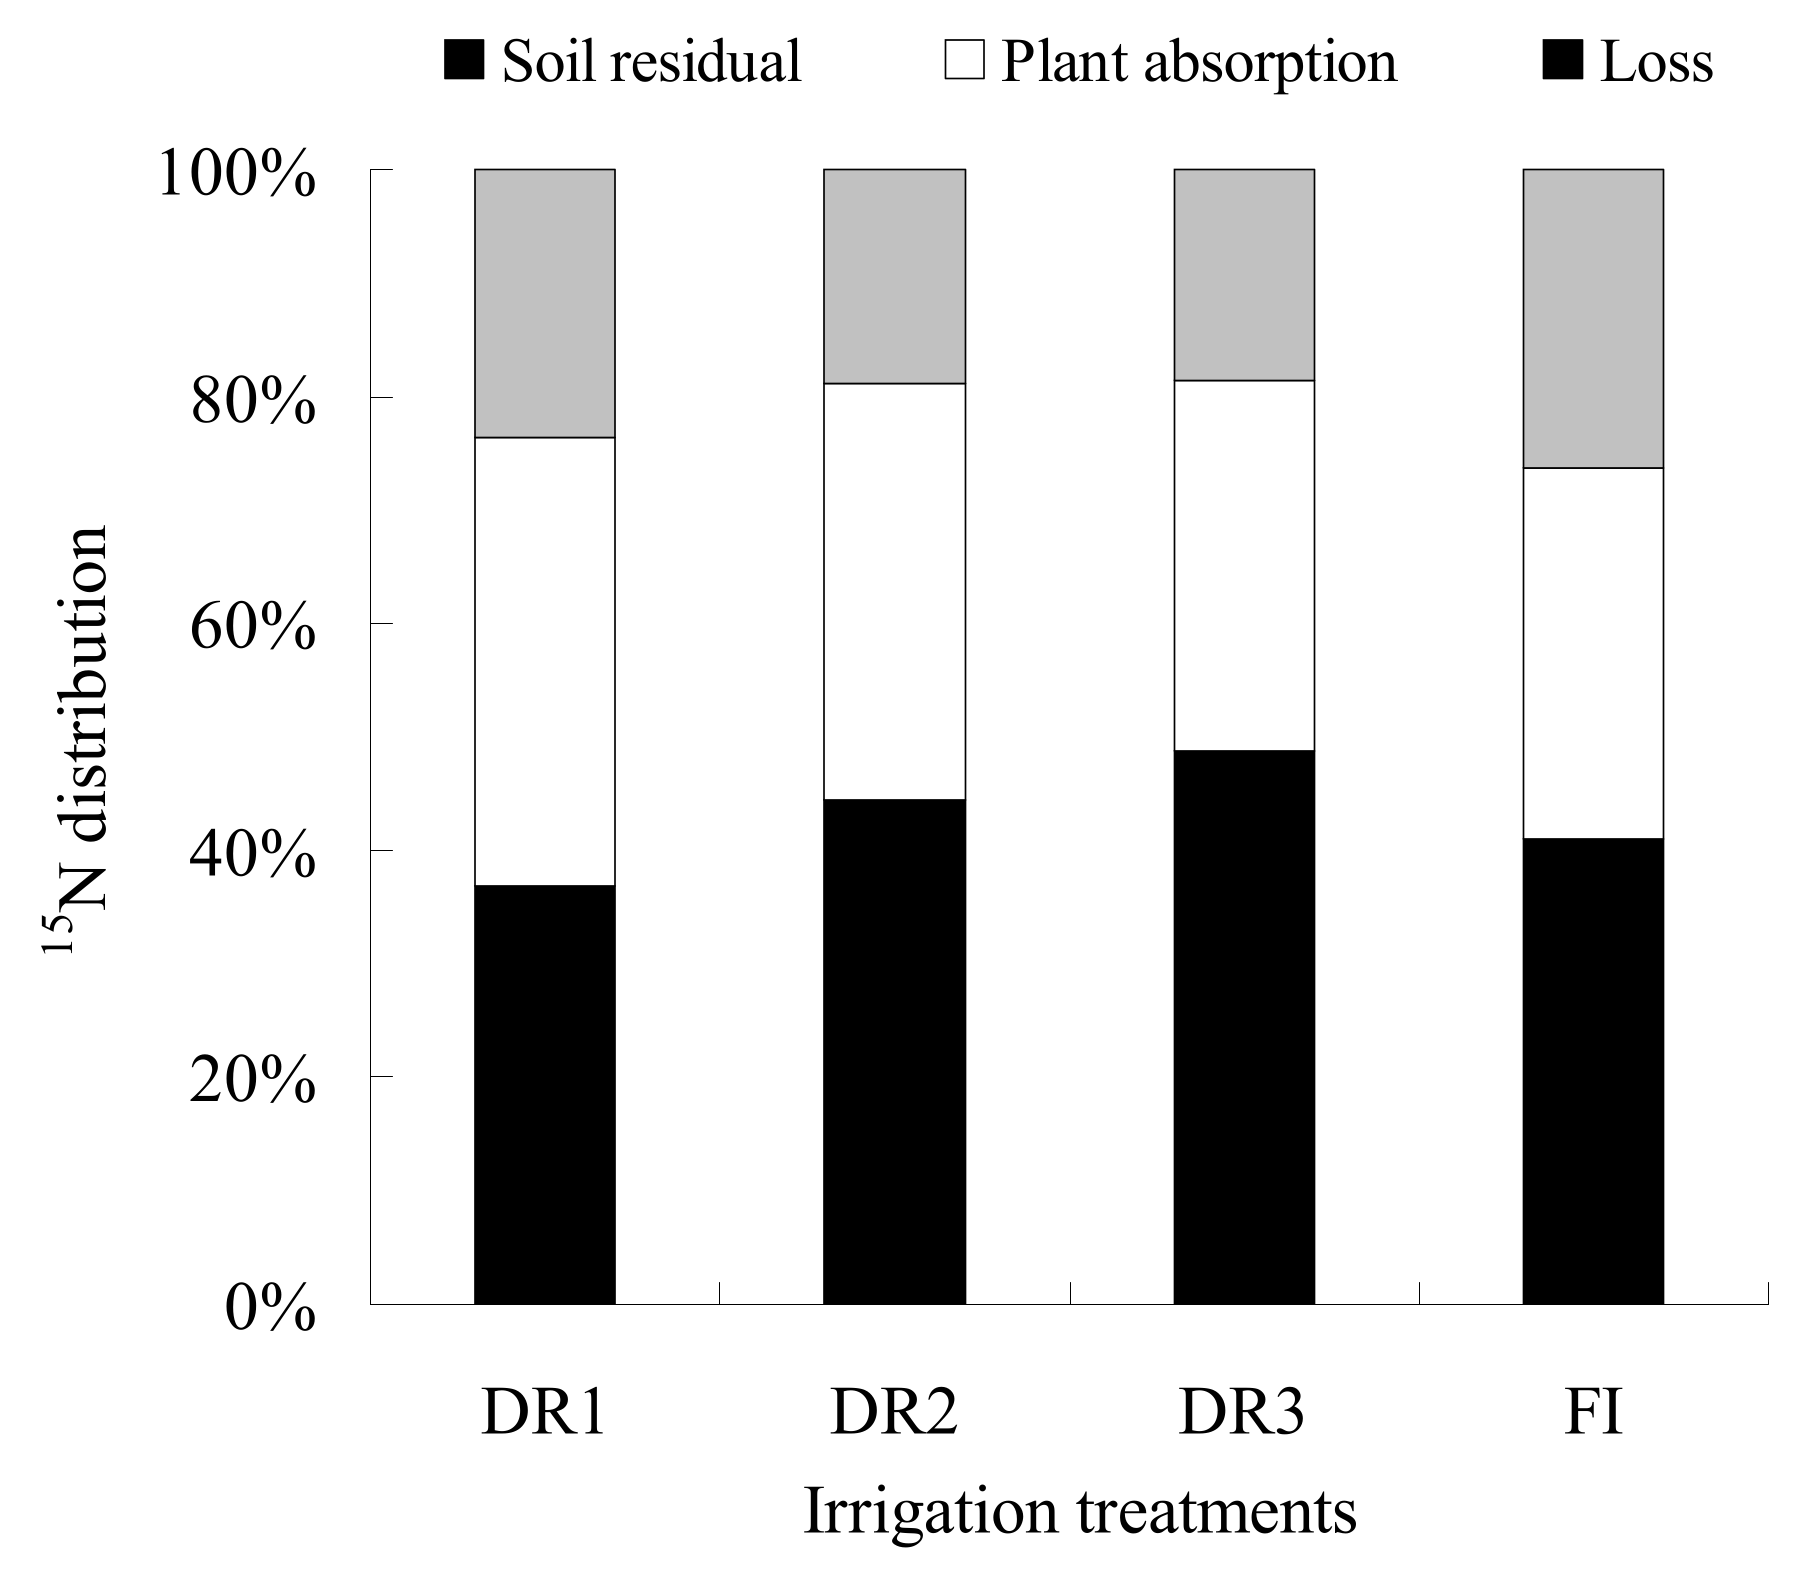
4.5. 15N Balance under Different Irrigation Modes

After one season cultivation of lettuce, 114.6–151.5 kg ha−1 of the total applied 15N remained in the 0–80-cm soil (Table 3), accounting for a proportion of 36.9–48.8% (Figure 7): 101.1–122.4 kg ha−1 were absorbed by the lettuce plant, accounting for 32.6–39.4%, and 57.9–81.8 kg ha−1 was lost via pathways such as volatilization or leaching, accounting for 18.6–26.3%.
Among the different treatments, DR1 possessed a lowest residual amount of 15Nbut a relatively higher plant 15N absorption and 15N. On the contrary, the soil residual 15N under DR3 was in a high level, while the plant 15N and 15N loss were the lowest, this might be due to the high irrigation quota under DR3 that leached 15N into the deeper soil layer, thus reducing the amount of 15N exposed to the plant rootzone.
Compared with DR2, FI significantly (p < 0.05) increased the 15N loss by 23.0 kg ha−1. However, there was no significant (p > 0.05) difference in the soil residual 15N or plant 15N between FI and DR2.

4.6. 15N Loss and Its Driving Factors

Table 4 showed the correlation between 15N loss and various irrigation factors. The 15N loss was positively related with the total irrigation amount, irrigation times and average soil moisture in the plough layer, and the correlation coefficients were 0.731, 0.937 and 0.922, respectively. This suggested that, during the irrigation process, increasing the total irrigation amount or times might increase the loss of fertilizer N.

5. Discussion

Our results found that furrow irrigation promoted the migration of fertilizer N to the deeper soil layer; this provided an explanation on the previous result by Wu [17] that furrow irrigation caused more deep leakage and more nitrate-N loss than drip irrigation. In this study, DR3 increased the amount of total 15N, mineral 15N or organic 15N in deep soil compared with the other two drip irrigation treatments; this was consistent with the research conclusion by Wang [18] that irrigation with a high quota but low frequency increased N leaching into deep soil when compared to that with a low quota but high frequency. A study on protected vegetable fields also showed that the accumulation of nitrate-N in the 40–60-cm soil layer was mainly influenced by the irrigation quota and nitrogen application rate compared with other influencing factors such as soil pH and soil organic carbon [19]. This was mainly because, under a long drought duration of soil, especially for soil with a high clay content, its water loss made it easy to cause soil dry shrinkage and form cracks, and the irrigation water took the dissolved fertilizer 15N into the deep soil through these cracks. Of course, from the perspective of 15N residue in the 20–50-cm soil layer, the higher 15N residue in the middle soil layer under DR3 might also be another potential factor leading to more 15N accumulation in the deep layer.
The relatively low total 15N amount but highest mineral 15Nin the 20-cm soil layer observed under DR1 (Figure 3) indicated that the wetter soil under DR1 (Figure 2) was more conducive to the mineralization of 15N in the plough layer. This conclusion was in-line with Miller’s [20] result that a 2-week dry–wet alternation significantly increased the amount of soil N mineralization compared to a 4-week dry–wet alternation. It was suggested that, in practice, irrigation with a smaller quota but higher frequency was more conducive to soil N mineralization. On the contrary, the experiment by Franzluebbers [21] proved that the amount of soil mineral N measured after 3–6 weeks of air drying was two to five times higher than that during wetting. This illustrated that the earlier researcher sobtained different conclusions on the effect of the moisture condition on N mineralization. The reason responsible for the difference might be that soil N mineralization was affected not only by soil moisture but by various other factors, such as soil temperature and pH, as well as the determination time.
Many studies have investigated the fate of applied fertilizer N. About half of the fertilizer N applied to the soil will be lost in various forms, and the fate of applied N was: a crop absorption of 35%, ammonia volatilization of 11%, nitrification–denitrification of 35%, leaching loss of 2%, runoff loss of 5% and other unknown losses of 12% [18]. Hou’s [22] findings in the experiment of N balance in a tobacco field noted that the utilization efficiency of fertilizer 15N in the current season was only about 20%, and crops tended to absorb soil N rather than fertilizer N. After one-season cultivation, more than 50% of the applied 15N remained in the tobacco cultivated soil, which was higher than the 36.9–48.8% measured in this study. An earlier study pointed out that irrigation affected the fate of fertilizer 15N mainly through changing the soil 15N distribution and influencing the crop 15N absorption [16].
Our study showed that drip irrigation could significantly increase the amount of 15N absorbed by crops compared with furrow irrigation when under the same irrigation regime. The explanation might be that the drip irrigation provided more soil moisture in the plough layer when under the same irrigation system (Figure 3). Du [23] demonstrated that the crop absorption of fertilizer nitrogen increased with more water supply in the crop rhizosphere. A low soil moisture content would limit the growth of soil microorganisms and hinder the mineralization of nitrogen in the soil, thus reducing the absorption of nitrogen by crops [24]. In our study, the three irrigation lower limits were in a relatively suitable range for lettuce, and there was no extremely high or low water supply. Therefore, on the whole, the fertilizer nitrogen absorbed by lettuce was positively correlated with the soil moisture in the plough layer. However, it should be noted that the soil moisture was not the greater, the better; excessive soil moisture would enhance denitrification under the anaerobic soil environment that causes a reduction on the rate of soil N mineralization, finally decreasing crop nitrogen absorption [25]. Aprevious study showed that water-saving irrigation, such as alternative rootzone irrigation, increased fertilizer 15NUE compared to traditional irrigation [26]. The irrigation practice affected the lettuce 15NUE, which might be attributed to the variation in root growth and in the quantity and form of 15N in rootzone soil. In this study, DR1 was more conducive to the absorption of 15N by crops (Table 3), which might be due to: (1) compared with furrow irrigation, drip irrigation could provide more soil moisture for the plough layer (Figure 2), which promoted the formation of lettuce fleshy stem; the formation process needed to accumulate dry matter, thus promoting the absorption and utilization of 15N; (2) under frequent irrigation (DR1), the fertilizer in a shallow soil layer was more fully dissolved, and more fertilizer was in the available state; this increased the amount of fertilizer N that could be directly absorbed by crops. An early research demonstrated that different irrigations might impact plant absorption for water and fertilizer nitrogen via influencing the soil nitrogen metabolism [27].
The 15N loss caused by irrigation might have various influencing factors and reasons, including direct and indirect factors. In addition to the above-mentioned 15N deep leaching by downward irrigation water, the soil dry–wet alternation condition caused by irrigation will affect the N2O emission from topsoil and directly impact the gaseous loss of 15N [28]. When dry and wet alternations occurred frequently, the nitrification and denitrification would alternately happen, and this process promotedN2O emission [29]. On the other hand, if the irrigation method was appropriate, the suitable soil moisture environment promoted the development of the lettuce underground part, which enhanced the crop utilization of 15N and indirectly reduced the 15N loss; this might be the reason that drip irrigation significantly reduced 15N loss compared with furrow irrigation (Table 3) when used the same irrigation regime in our study. Our study detected that 15N loss was positively correlated with total irrigation amount and irrigation times (Table 4), indicating that the increase in total irrigation amount or frequency might cause the increase in fertilizer N loss during the irrigation process.
In those areas with serious agricultural non-point source pollution, it is imperative to use water-saving irrigation modes such as drip irrigation to reduce the output of the pollutants. Our study quantitatively revealed the amount of nitrogen loss reduced by drip irrigation compared with furrow irrigation, which provided a certain basis for the popularization of drip irrigation technology in similar lettuce cultivation areas. More importantly, we suggested that the irrigation regime is of great importance while promoting drip irrigation technology. In previous studies, most of the irrigation regime evaluations considered the irrigation amount, water use efficiency, crop yield and quality [30], and a few employed the fertilizer nitrogen use efficiency as one of the evaluation indicators [31,32]. However, the rare irrigation studies considered the nitrogen loss, especially the fertilizer nitrogen loss. One deficiency of our study is that the number of drip irrigation treatments in this experiment was not enough. If there were more irrigation regimes, the high-quality prediction model of the fertilizer nitrogen loss amount can be established. The fertilizer nitrogen loss indicator, combined with the traditional indicators such as water use efficiency, crop yield and quality, will be conducive to form a more completed indicator system for the evaluation of the irrigation regime or the irrigation–fertilization coupling regime. Another research entry point can be started from the variety of nitrogen fertilizer. Urea is widely used, because it contains a high nitrogen content of 46% and is easy to be stored and fast to show fertilizer efficiency [33,34]. However, there are many other nitrogen fertilizers with different properties, mainly including ammonium and nitrate nitrogen fertilizer. Whether drip irrigation will change the loss of fertilizer nitrogen under applying other varieties of nitrogen fertilizer, what degree it changes and through what pathways, deserves to be investigated in the future.

6. Conclusions

After the lettuce harvest, 36.9–48.8% of the applied fertilizer 15N remained in 0–80-cm soil, 32.6–39.4% was absorbed by plants, and 18.6–26.3% lost via pathways, such as the volatilization or leaching. Under the same irrigation regime, 15N loss caused by FI (26.3%) was significantly (p < 0.05) higher than that byDR2 (18.9%). Moreover, FI increased the amount of total 15N, mineral 15N and organic 15N in the deeper soil layer (60-cm depth and below), leading to a potential risk of 15N leaching. The soil 15N residue was relatively lower under DR1, while the crop-absorbed 15N or 15N loss was at the highest level among the three drip irrigation treatments. The correlation analysis results showed that increasing the total irrigation amount or increasing the irrigation frequency might increase 15N loss. We concluded that, using drip irrigation instead of furrow irrigation with controlling the lower irrigation limit of 65% is conducive to improving crop 15N utilization and reducing 15N loss from the lettuce field. Further research can be carried out on the impact of irrigation on gaseous nitrogen emissions, so as to make the research regarding the impact of drip irrigation on nitrogen loss more complete.

Author Contributions

Conceptualization, Q.J. and J.Y.; methodology, Q.J.; software, M.X.; validation, S.L. and J.C.; formal analysis, Q.J.; investigation, J.C. and Y.Q.; resources, Q.J.; data curation, Y.Q. and Q.D.; writing—original draft preparation, Q.J. and J.C.; writing—review and editing, Q.J. and J.C.; visualization, J.C.; supervision, S.L.; project administration, M.X.; funding acquisition, Q.J. All authors have read and agreed to the published version of the manuscript.

Funding

This research was funded by [Starting funder of the Institute of Water Conservancy Science of Nanjing] grant number [Y919002] and [Young and Middle-aged Project of Education Department of Fujian Province] grant number [JAT210784]. And The APC was funded by [Starting funder of the Institute of Water Conservancy Science of Nanjing] grant number [Y919002].

Data Availability Statement

Not applicable.

Conflicts of Interest

The authors declare no conflict of interest.

References

  1. Peng, X.; Yang, J.; Cui, P.; Chen, F.; Fu, Y.; Hu, Y.; Zhang, Q.; Xia, X. Influence of allicin on quality and volatile compounds of fresh-cut stem lettuce during cold storage. LWT-Food Sci. Technol. 2015, 60, 300–307. [Google Scholar] [CrossRef]
  2. Xu, Z.-J.; Qiu, X.-Y.; Liu, W.-H.; Xiang, Y.-C. Absorption and enrichment of zinc and cadmium by lettuce in complex contaminated soil. J. Ecol. Rural Environ. 2008, 24, 71–75. [Google Scholar]
  3. Yu, G.F.; Wu, H.T.; Qing, C.L.; Jiang, X.; Zhang, J.Y. Bioavailability of humic substance-bound mercury to lettuce and its relationship with soil properties. Commun. Soil Sci. Plant Anal. 2004, 35, 1123–1139. [Google Scholar] [CrossRef]
  4. Huo, H.-X.; Niu, W.-Q. Development and expectation of protected vegetable irrigation technology. Water-Sav. Irrig. 2012, 4, 22–26. [Google Scholar]
  5. Li, D.-P.; Wu, Z.-J. Impact of chemical fertilizers application on soil ecological environment. Yingyong Shengtai Xuebao 2008, 19, 1158–1165. [Google Scholar]
  6. Wang, Y.; Zhu, Y.; Zhang, S.; Wang, Y. What could promote farmers to replace chemical fertilizers with organic fertilizers? J. Clean. Prod. 2018, 199, 882–890. [Google Scholar] [CrossRef]
  7. Fan, Z.; Lin, S.; Zhang, X.; Jiang, Z.; Yang, K.; Jian, D.; Chen, Y.; Li, J.; Chen, Q.; Wang, J. Conventional flooding irrigation causes an overuse of nitrogen fertilizer and low nitrogen use efficiency in intensively used solar greenhouse vegetable production. Agric. Water Manag. 2014, 144, 11–19. [Google Scholar] [CrossRef]
  8. Ma, H.; Yang, T.; Niu, X.; Hou, Z.; Ma, X. Sound Water and Nitrogen Management Decreases Nitrogen Losses from a Drip-Fertigated Cotton Field in Northwestern China. Sustainability 2021, 13, 1002. [Google Scholar] [CrossRef]
  9. Sturm, M.; Kacjan-Marsic, N.; Zupanc, V.; Bracic-Zeleznik, B.; Lojen, S.; Pintar, M. Effect of different fertilisation and irrigation practices on yield, nitrogen uptake and fertiliser use efficiency of white cabbage (Brassica oleracea var. capitata L.). Sci. Hortic. 2010, 125, 103–109. [Google Scholar] [CrossRef]
  10. Uzun, S.; Ozaktan, H.; Uzun, O. Effects of Different Nitrogen Dose and Sources as Top-Dressing on Yield and Silage Quality Attributes of Silage Maize. An. Acad. Bras. Cienc. 2020, 92, e20190030. [Google Scholar] [CrossRef]
  11. Liang, B.; Yang, X.; Murphy, D.V.; He, X.; Zhou, J. Fate of (15) N-labeled fertilizer in soils under dryland agriculture after 19 years of different fertilizations. Biol. Fertil. Soils 2013, 49, 977–986. [Google Scholar] [CrossRef]
  12. Hou, M.; Shao, X.; Li, Y. Effects of water and N-15-labelled fertilizer coupling on the growth, N uptake, quality and yield, of flue-cured tobaccos: A two-year lysimeter experiment. Res. Crop. 2013, 14, 950–959. [Google Scholar]
  13. Liang, B.; Zhao, W.; Yang, X.; Zhou, J. Fate of nitrogen-15 as influenced by soil and nutrient management history in a 19-year wheat-maize experiment. Field Crop. Res. 2013, 144, 126–134. [Google Scholar] [CrossRef]
  14. Zhao, W.; Liang, B.; Yang, X.; Zhou, J. Fate of residual N-15-labeled fertilizer in dryland farming systems on soils of contrasting fertility. Soil Sci. Plant Nutr. 2015, 61, 846–855. [Google Scholar] [CrossRef] [Green Version]
  15. Hou, M.; Zhong, F.; Jin, Q.; Liu, E.; Feng, J.; Wang, T.; Gao, Y. Fate of nitrogen-15 in the subsequent growing season of greenhouse tomato plants (Lycopersicon esculentum Mill) as influenced by alternate partial root-zone irrigation. RSC Adv. 2017, 7, 34392–34400. [Google Scholar] [CrossRef] [Green Version]
  16. Xu, R.; Chen, J.; Lin, Z.; Chen, X.; Hou, M.; Shen, S.; Jin, Q.; Zhong, F. Fate of urea-N-15 as influenced by different irrigation modes. RSC Adv. 2020, 10, 11317–11324. [Google Scholar]
  17. Wu, X.; Zhang, S. Nitrogen translation and transform experiments in winter wheat field under water-saving irrigation. J. Tsinghua Univ. 1998, 38, 92–95. [Google Scholar]
  18. Wang, X.; Sun, X.; Ma, J. The current situation of research on the mechanism of nitrogen migration in soil. Shanxi Hydraul. Sci. 2012, 2, 4–6. [Google Scholar]
  19. Lei, H.; Li, G.; Ding, W.; Xu, C.; Wang, H.; Li, H. Modeling nitrogen transport and leaching process in a greenhouse vegetable field. Chin. J. Eco-Agric. 2021, 29, 38–52. [Google Scholar]
  20. Miller, A.E.; Schimel, J.P.; Meixner, T. Episodic rewetting enhances carbon and nitrogen release from chaparral soils. Soil Biol. Biochem. 2005, 37, 2195–2204. [Google Scholar] [CrossRef]
  21. Franzluebbers, K.; Weaver, R.W.; Juo, A. Carbon and nitrogen mineralization from cowpea plants part decomposing in moist and in repeatedly dried and wetted soil. Soil Biol. Biochem. 1994, 26, 1379–1387. [Google Scholar] [CrossRef]
  22. Hou, M.; Shao, X.; Jin, Q.; Gao, X. A N-15 tracing technique-based analysis of the fate of fertilizer N: A 4-year case study in eastern China. Arch. Agron. Soil Sci. 2017, 63, 74–83. [Google Scholar] [CrossRef]
  23. Du, Y.D.; Cao, H.X.; Liu, S.Q.; Gu, X.B.; Cao, Y.X. Response of yield, quality, water and nitrogen use efficiency of tomato to different levels of water and nitrogen under drip irrigation in Northwestern China. J. Integr. Agric. 2017, 16, 1153–1161. [Google Scholar] [CrossRef] [Green Version]
  24. Mario, C.; Abraham, J.; Wesström, I. Influence of irrigation and fertilisation management on the seasonadistribution of water and nitrogen in a semi-arid loamy sandy soil. Agric. Water Manag. 2018, 199, 120–137.25. [Google Scholar]
  25. Zhang, X.; Chen, Z.; Chang, P.; Qu, Y. Research Progress of Soil Nitrogen Mineralization. North. Hortic. 2010, 6, 33–36. [Google Scholar]
  26. Hou, M.; Jin, Q.; Lu, X.; Li, J.; Zhong, H.; Gao, Y. Growth Water Use, and Nitrate-N-15 Uptake of Greenhouse Tomato as Influenced by Different Irrigation Patterns, N-15 Labeled Depths, and Transplant Times. Front. Plant Sci. 2017, 8, 666. [Google Scholar] [CrossRef] [PubMed]
  27. Wang, J.W.; Niu, W.Q.; Li, Y.; Lv, W. Subsurface drip irrigation enhances soil nitrogen and phosphorus metabolism in tomato root zones and promotes tomato growth. Appl. Soil Ecol. 2018, 124, 240–251. [Google Scholar] [CrossRef]
  28. Beare, M.; Gregorich, E. Compaction effects on CO2 and N2O production during drying and rewetting of soil. Soil Biol. Biochem. 2009, 41, 611–621. [Google Scholar] [CrossRef]
  29. Vinther, F. Measured and simulated denitrification activity in a cropped sandy and loamy soil. Biol. Fertil. Soils 1992, 14, 43–48. [Google Scholar] [CrossRef]
  30. Shao, G.; Guo, Q.; Lan, J.; Chen, C.; Gao, Z. Entropy weight coefficient evaluation of irrigation and drainage scheme based onanalysis of quality and rain ingredients of tomato. J. Drain. Irrig. Mach. Eng. 2012, 30, 733–737. [Google Scholar]
  31. Yan, J. 15N tracing technique based evaluation of entropy weightcoefficients of water and nitrogen coupling schemes for flue-cured tobacco. J. Northwest AF Univ. 2014, 42, 25–31. [Google Scholar]
  32. Zhong, F.L.; Hou, M.M.; He, B.Z.; Chen, I.Z. Assessment on the coupling effects of drip irrigation and organic fertilization based on entropy weight coefficient model. PeerJ 2017, 5, e3855. [Google Scholar] [CrossRef] [PubMed]
  33. Li, G.H.; Zhao, B.; Dong, S.T.; Zhang, J.W.; Liu, P.; Lu, W.P. Controlled-release urea combining with optimal irrigation improved grain yield, nitrogen uptake, and growth of maize. Agric. Water Manag. 2020, 227, 105834. [Google Scholar] [CrossRef]
  34. Davis, A.M.; Tink, M.; Rohde, K.; Brodie, J.E. Urea to dissolved ‘organic’ nitrogen losses from intensive, fertilised agriculture. Agric. Ecosyst. Environ. 2016, 223, 190–196. [Google Scholar] [CrossRef] [Green Version]
Figure 1. The experimental site.
Water 14 00675 g001
Figure 2. Experimental block and micro-block (15N labeled area) ((a) the drip irrigation block and (b) the furrow irrigation block).
Water 14 00675 g002
Figure 3. Dynamic changes of soil moisture in the plough layer under different irrigation modes (DR1, DR2 and DR3 represent lower irrigation limits of 75%, 65% and 55% of the field capacity, respectively. FI is the furrow irrigation treatment with the same irrigation regime as DR2).
Water 14 00675 g003
Figure 4. The distribution of total 15N (a), mineral 15N (b) and organic 15N (c) in the soil profile under different irrigation modes (DR1, DR2 and DR3 represent lower irrigation limits of 75%, 65% and 55% of the field capacity, respectively. FI is the furrow irrigation treatment with the same irrigation regime as DR2. The data in the figure are the mean ± SD).
Water 14 00675 g004
Figure 5. The distribution of 15N in lettuce plants under different irrigation modes (DR1, DR2 and DR3 represent lower irrigation limits of 75%, 65% and 55% of the field capacity, respectively. FI is the furrow irrigation treatment with the same irrigation regime as DR2. The data in the figure are the mean ± SD. Different letters (a, b and c) indicate significant differences at the level of 0.05 according to Duncan’s multiple range test).
Water 14 00675 g005
Figure 6. Effects of different irrigation modes on the 15N use efficiency of lettuce (DR1, DR2 and DR3 represent lower irrigation limits of 75%, 65% and 55% of the field capacity, respectively. FI is the furrow irrigation treatment with the same irrigation regime as DR2. The data in the figure are the mean ± SD. Different letters (a and b) indicate significant differences at the level of 0.05, according to Duncan’s multiple range test).
Water 14 00675 g006
Figure 7. The distribution proportion of 15N under different irrigation treatments (DR1, DR2 and DR3 represent the lower irrigation limits of 75%, 65% and 55% of the field capacity, respectively. FI is the furrow irrigation treatment with the same irrigation regime as DR2).
Water 14 00675 g007
Table 1. The division of the growth stages of lettuce.
DateGrowth StagesWater Treated Periods
15 September–17 SeptemberSeed germination
18 September–12 OctoberSeedling stage
13 October–16 NovemberRosette stage
17 November–26 DecemberFleshy stem expansion stage
27 December–30 DecemberHarvest stage
Note: ☆ represents that, in this period, the lettuce was treated with different irrigation treatments.
Table 2. The irrigation regime.
TreatmentRosette Stage to Fleshy Stem Expansion StageThe Irrigation Amount during Whole Growth Period (mm)
Irrigation TimesIrrigation Interval (d)Irrigation Quota (mm)Irrigation Amount
(mm)
DR188.715.8126.5299.1
DR2514.023.7118.6291.2
DR3323.531.694.9267.5
FI514.023.7118.6291.2
Table 3. The fate and balance of 15N under different irrigation modes.
TreatmentTotal 15N
(kg ha−1)
15N Recovery (kg ha−1)15N Loss
(kg ha−1)
Soil ResidualPlant Absorption
DR1310.5114.6 ± 15.06 b122.4 ± 10.42 a73.5 ± 4.67 a
DR2310.5137.8 ± 10.71 ab114.0 ± 4.82 ab58.8 ± 5.91 b
DR3310.5151.5 ± 11.18 a101.1 ± 5.43 b57.9 ± 5.74 b
FI310.5127.5 ± 13.66 ab101.2 ± 7.73 b81.8 ± 5.94 a
Note: DR1, DR2 and DR3 represent the lower irrigation limits of 75%, 65% and 55% of the field capacity, respectively. FI is the furrow irrigation treatment with the same irrigation regime as DR2. The data in the figure are the mean ± SD. Different letters (a and b) indicate significant differences at the level of 0.05 according to Duncan’s multiple range test.
Table 4. Correlation between 15N loss and irrigation factors.
15N LossTotal Irrigation AmountIrrigation TimesIrrigation QuotaAverage Soil Moisture
15N loss10.731 *0.937 *−0.8910.922 *
Total irrigation amount 10.923−0.9610.938
Irrigation times 1−0.9930.999
Irrigation quota 1−0.997
Average soil moisture 1
Note: * represents a significant correlation at the 0.05 level.
Publisher’s Note: MDPI stays neutral with regard to jurisdictional claims in published maps and institutional affiliations.

