Article

The Climate Road—A Multifunctional Full-Scale Demonstration Road That Prevents Flooding and Produces Green Energy

by
Theis Raaschou Andersen
*,
Søren Erbs Poulsen
and
Karl Woldum Tordrup
Research Center for Built Environment, Energy, Water and Climate, VIA University College, 8700 Horsens, Denmark
*
Author to whom correspondence should be addressed.
Water 2022, 14(4), 666; https://doi.org/10.3390/w14040666
Submission received: 28 January 2022 / Revised: 15 February 2022 / Accepted: 19 February 2022 / Published: 21 February 2022

Abstract

:
This paper presents a multifunctional full-scale demonstration road, the Climate Road, which combines climate adaptation and mitigation in a single system. The Climate Road is located at Hedensted, Denmark and is 50 m long and 8 m wide, and the depth of the roadbed is 1 m. Half of the Climate Road, i.e., 25 m, is paved with permeable asphalt and the remaining 25 m with traditional asphalt. All surface water drains into the roadbed, which stores up to 120 m3 of water, either directly through the permeable asphalt or by drain grates. In addition, 800 m of geothermal pipes are embedded in the roadbed, distributed over four 200 m w-loops, two buried 1 m below the asphalt and two similar loops at 0.5 m depth. The Climate Road was tested from May 2019 to May 2021. In the project period, a total precipitation value of 1654 mm was recorded, the mean temperature was 9.3 °C and the most intense rainfall was 40.3 mm/30 min. The long-term infiltration performance of the permeable asphalt shows that the overall infiltration capacity slowly reduces. The reduction can be hindered, but not completely prevented, with annual restorative cleaning. After two years of operation, the Climate Road still, by a large margin, fulfils the recommendations of the infiltration capacity of 97.2 mm/h for the vast majority of the road section. The total volume reduction capacity is estimated to be between 15 and 30%. Based on an analysis of 61 single rain events, the event detention time is found to range between 10 and 130 min, with an average of 35 min. During the project period, the Climate Road produced a total of 98 MWh for a nearby kindergarten, with an average coefficient of performance (COP) of 3.1.

1. Introduction

Currently, around half of the world’s population lives in urban areas, constituting only 2% of the land surface while occupying around 75% of the Earth’s resources [1]. This urbanisation is expected to continue in the future, owing to both the larger areal extent of the cities as well as an increase in population density [2]. Large city areas are now covered by impermeable surfaces such as roads, rooftops, car parks and pavements [3,4]. Historically, the vast majority of surface water has been drained through sewers. Consequently, the hydrological cycle is no longer sustainable in cities as large amounts of precipitation are excluded from the hydrological cycle [5]. These problems are further exacerbated by future climate changes, where climate models estimate that the severity of extreme weather events in Denmark, such as more frequent and more intense precipitation events during the summer, will increase, and that winters will become wetter [6]. The changing precipitation patterns have already caused flooding in cities, as well as the uncontrolled leaching of uncleaned sewage to natural recipients as the existing sewage network does not have the necessary capacity. Therefore, over the last 20 years, there has been an increasing focus on using Sustainable Urban Drainage Systems (SUDS) and Nature-Based Solutions (NBS) in the cities. Implementing SUDS and NBS in the urban surface water management plan has many benefits. In part, studies show that handling surface water using SUDS is less expensive than traditional methods [7,8,9]. The SUDS and NBS view the surface water as a resource that can be used to make cities green, counteract the urban heat effect and provide increased liveability [10,11]. Permeable pavements (PP) are increasingly used in urban areas as they are able to attenuate runoff peak flows; collect, store and infiltrate surface waters; and improve stormwater quality, as well as mitigate heat island effects [11,12,13,14,15,16,17].
Zhang and Kevern [14] conducted a review of permeable asphalt (PA) in cold regions with respect to its design, construction and maintenance practices. They found that PA had a lower frost penetration depth and, therefore, a lower risk of frost damage, due to the fast responses to warm air temperatures. Furthermore, regular restorative maintenance was needed for the PA to partially retain its long-term performance. In particular, sanding during winter maintenance should be avoided. The long-term infiltration performance is single-handedly the largest drawback of PA as it tends to become clogged by sand and fine material over time, which lowers the infiltration capacity and, thereby, the performance [18,19,20]. Støvring et al. [20] evaluated the restoration cleaning effect on nine PP systems in Denmark. They found that restoration cleaning had a significant immediate effect on the PP infiltration capacity. However, one year after cleaning, the functionality of the cleaned PP was as good as the non-cleaned PP, implying that clogging due to improper maintenance overrides the effect of cleaning. Hence, either better maintenance protocols are needed or regular maintenance of PP must be conducted in order for the PP to retain its functionality.
While climate adaptation concerns minimising the consequences of climate change on society, climate mitigation is mainly focussed on decarbonisation to prevent further climate change. In order to decrease greenhouse gas emissions, governments are passing laws to increase the use of renewable sources of energy. Denmark has committed itself to being independent of coal, oil and gas by 2050. Similarly, the EU aims to reduce its greenhouse gas emissions by up to 80–95% by 2050 compared to 1990. Thus, the energy sector in Denmark is currently undergoing a green transition. Forecasts predict that heat pumps will gradually take over energy production in Denmark by replacing fossil fuels and biomass. Using the Earth’s stable and low temperatures in the upper few hundred meters of the subsurface with ground source heat pump (GSHP) systems provides sustainable heating and cooling. GSHPs are environmentally and economically more beneficial compared to traditional and conventional heating sources [21,22]. Thus, the utilisation of GSHP systems is well suited for the future heating and cooling supply in Denmark. Traditionally, near-surface GSHP systems use heat exchangers embedded in the soil and not in anthropogenic structures such as PP. Novo et al. [23] investigated the temperature distribution in the subsurface (0.5 m) under various PP and weather conditions to evaluate the potential of combining PP with GSHP, as well as the effects of these combined systems on the water quality. They found that the subsurface temperature depends on the type of pavement. During the summer months, temperatures in the subsurface under PP were higher than the air temperatures, thus hampering the application of the system as a heat sink, whereas the GSHP system enabled the use of the subsurface for heating in the autumn and winter months. Charlesworth et al. [24] investigated the performance of a GSHP system embedded in a PP. The GSHP was connected to a nearby building and was evaluated with respect to its heating and cooling performance. The authors found that there was obvious potential in combining PP and the GSHP system, but that the system needed to be investigated in more detail before this potential could be fully realised. They found that the geothermal piping was buried at too shallow a depth (35 cm), as ambient temperatures influenced the temperatures in the tank, resulting in a low coefficient of performance (COP) value of 1.8.
In the present project, we have combined a 50 m PA (ordinary road with heavy traffic) with a GSHP system utilising the roadbed in a full-scale demonstration project, for supplying a nearby kindergarten with room heating and domestic hot water. The road section is referred to as the “Climate Road” and it is located near Hedensted in Denmark (Figure 1). The purposes of this study were to evaluate the long-term performance of the Climate Road from May 2019 to May 2021 as a climate adaptation solution, and additionally to evaluate the potential for geothermal energy production with the GSHP using the geothermal pipes embedded in the roadbed.

2. Materials and Methods

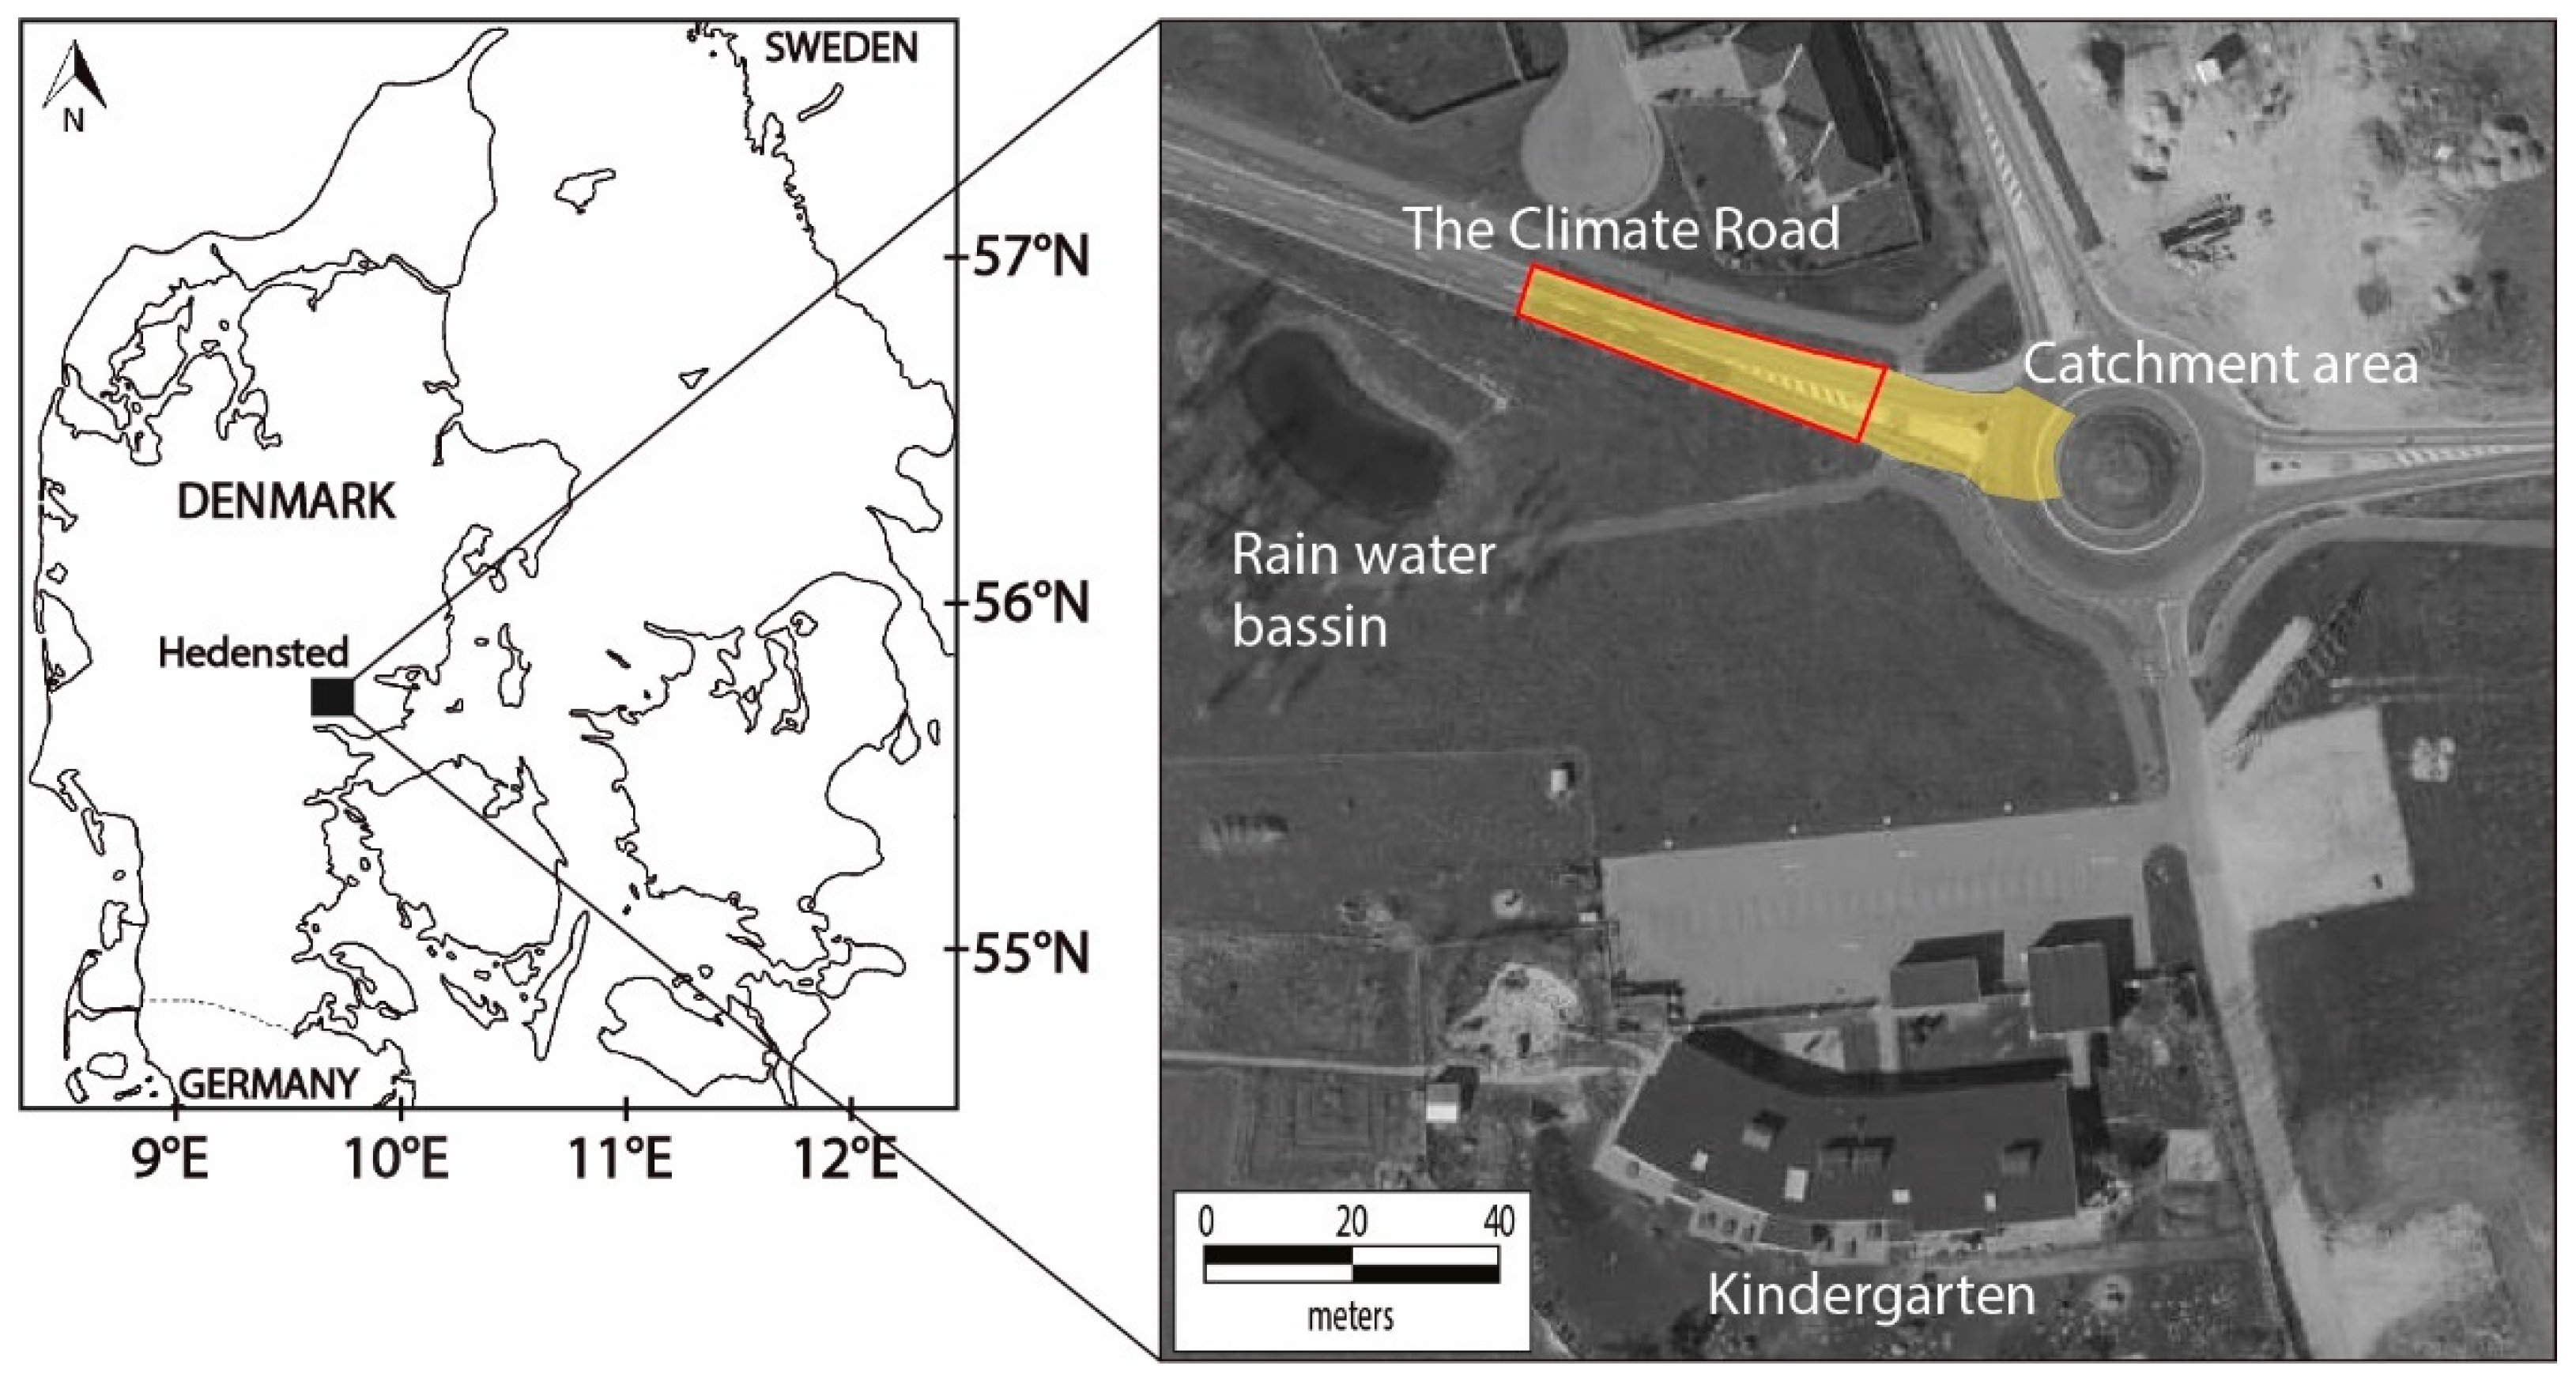
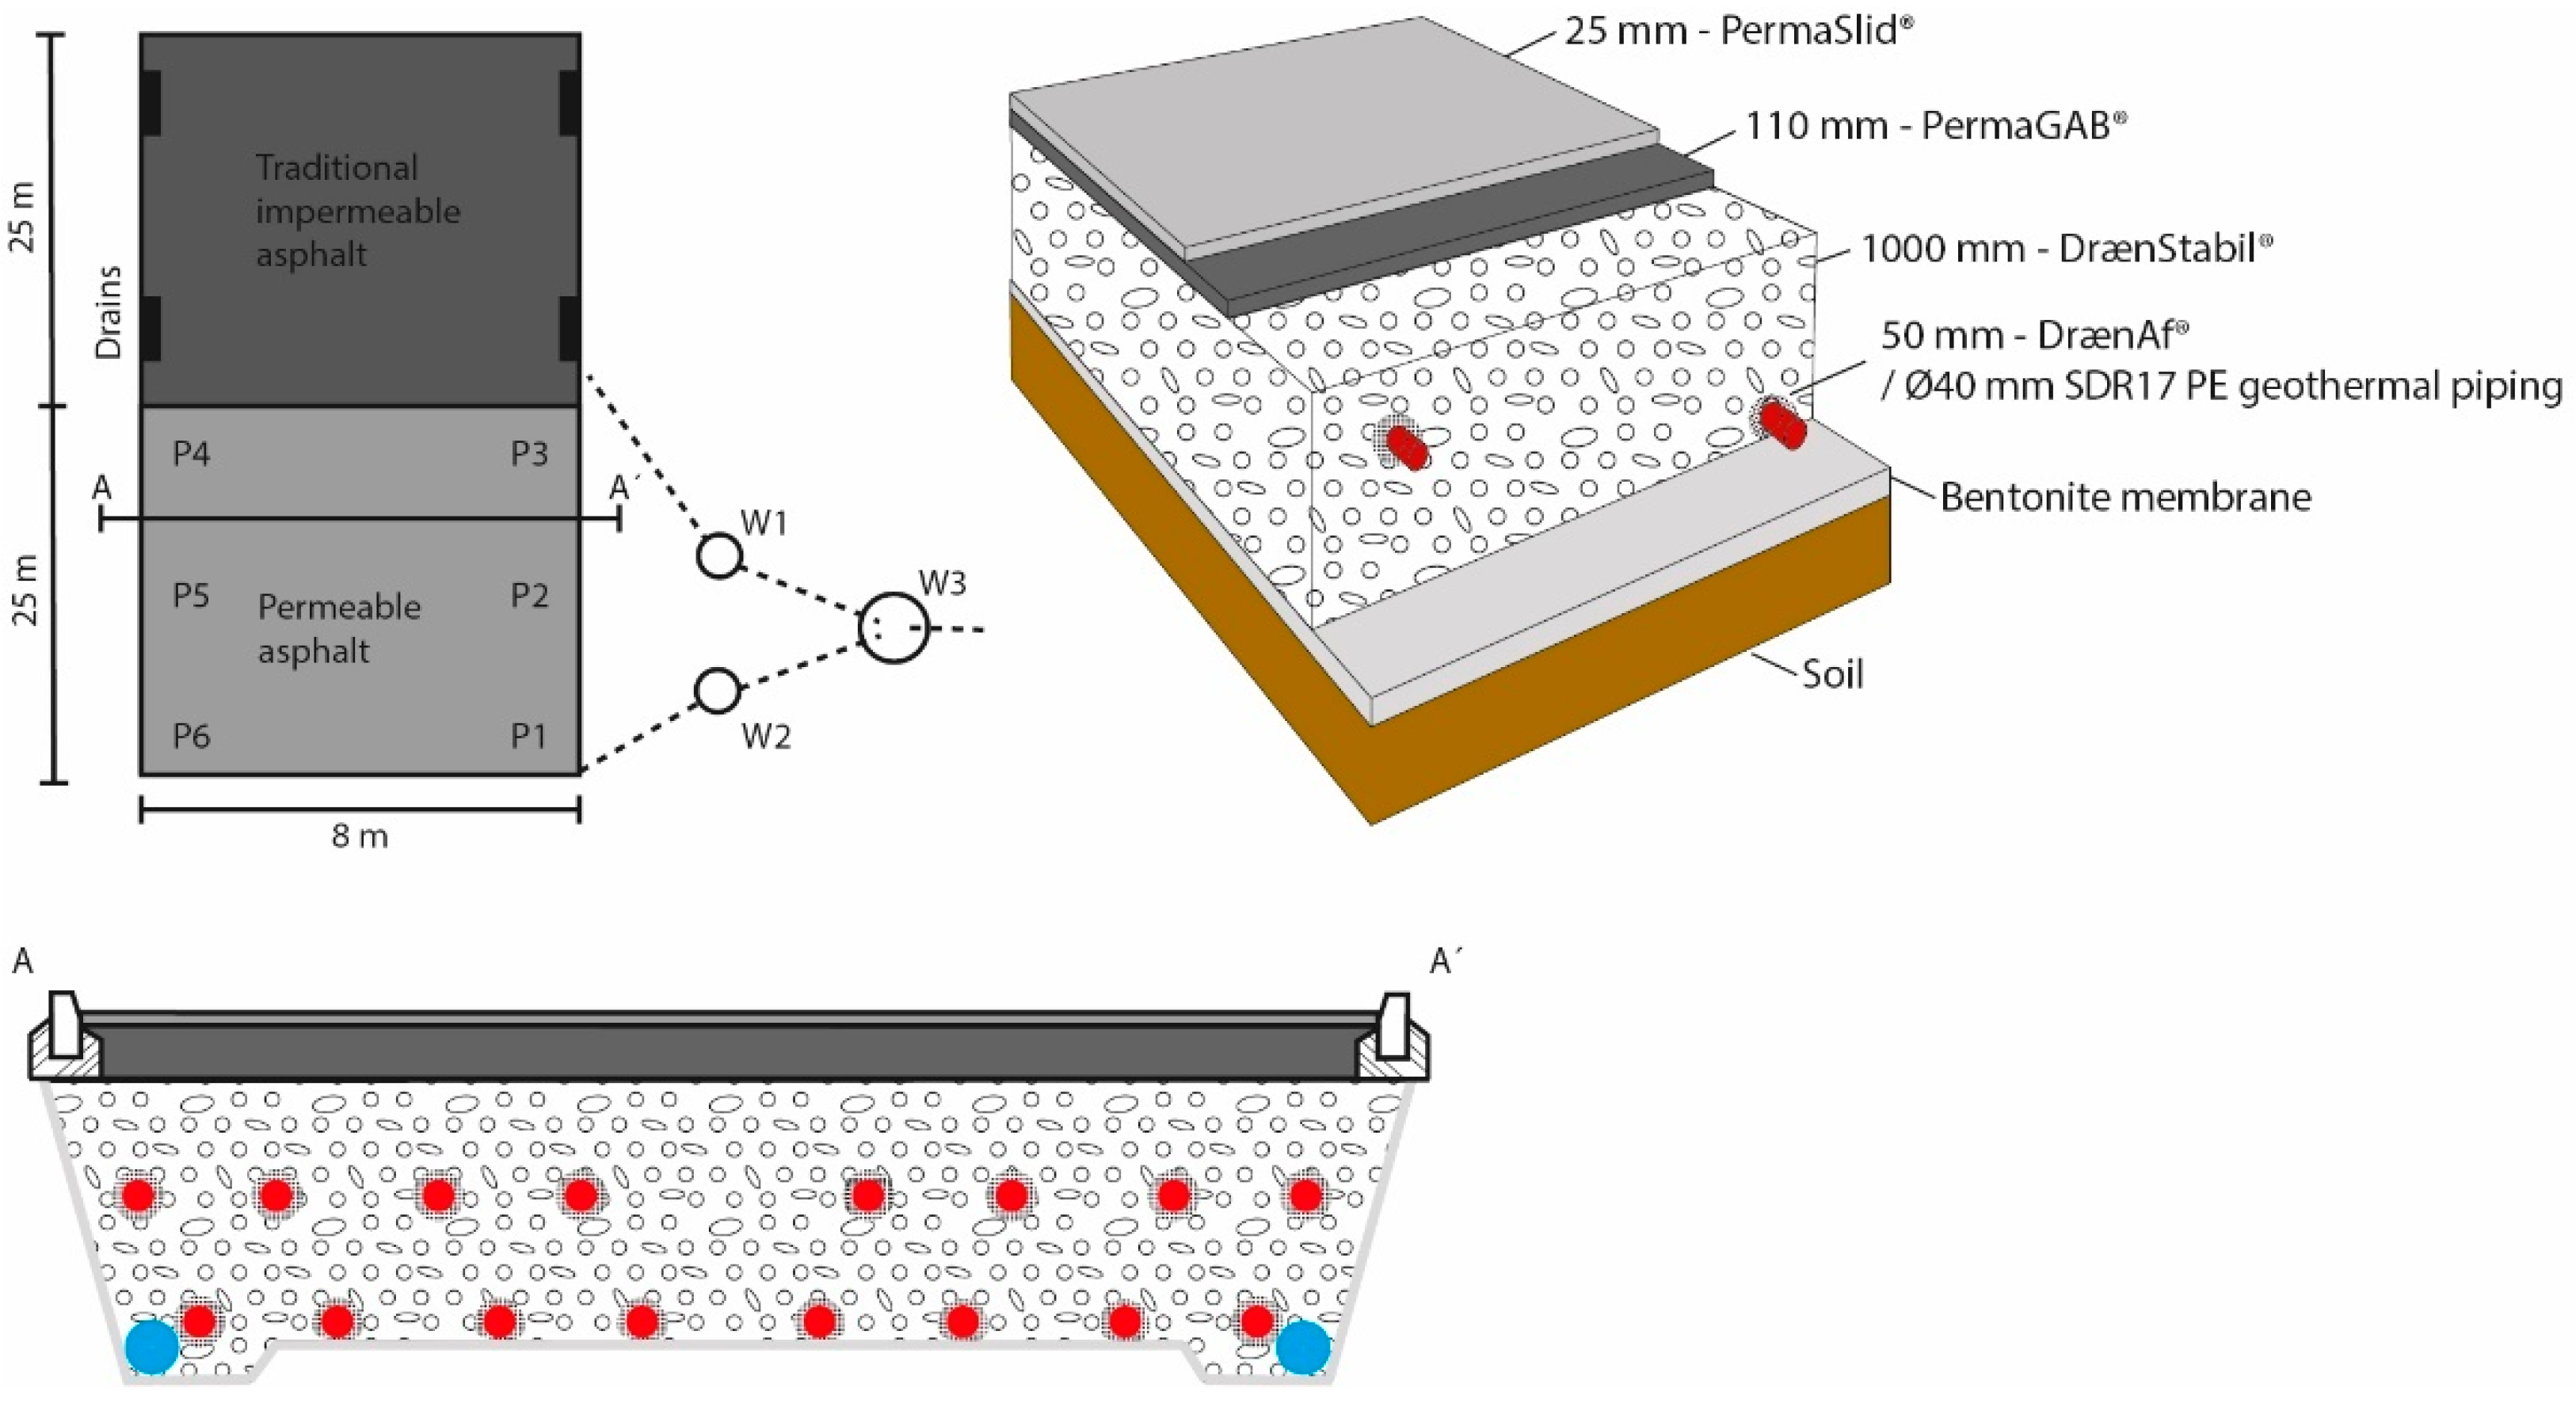
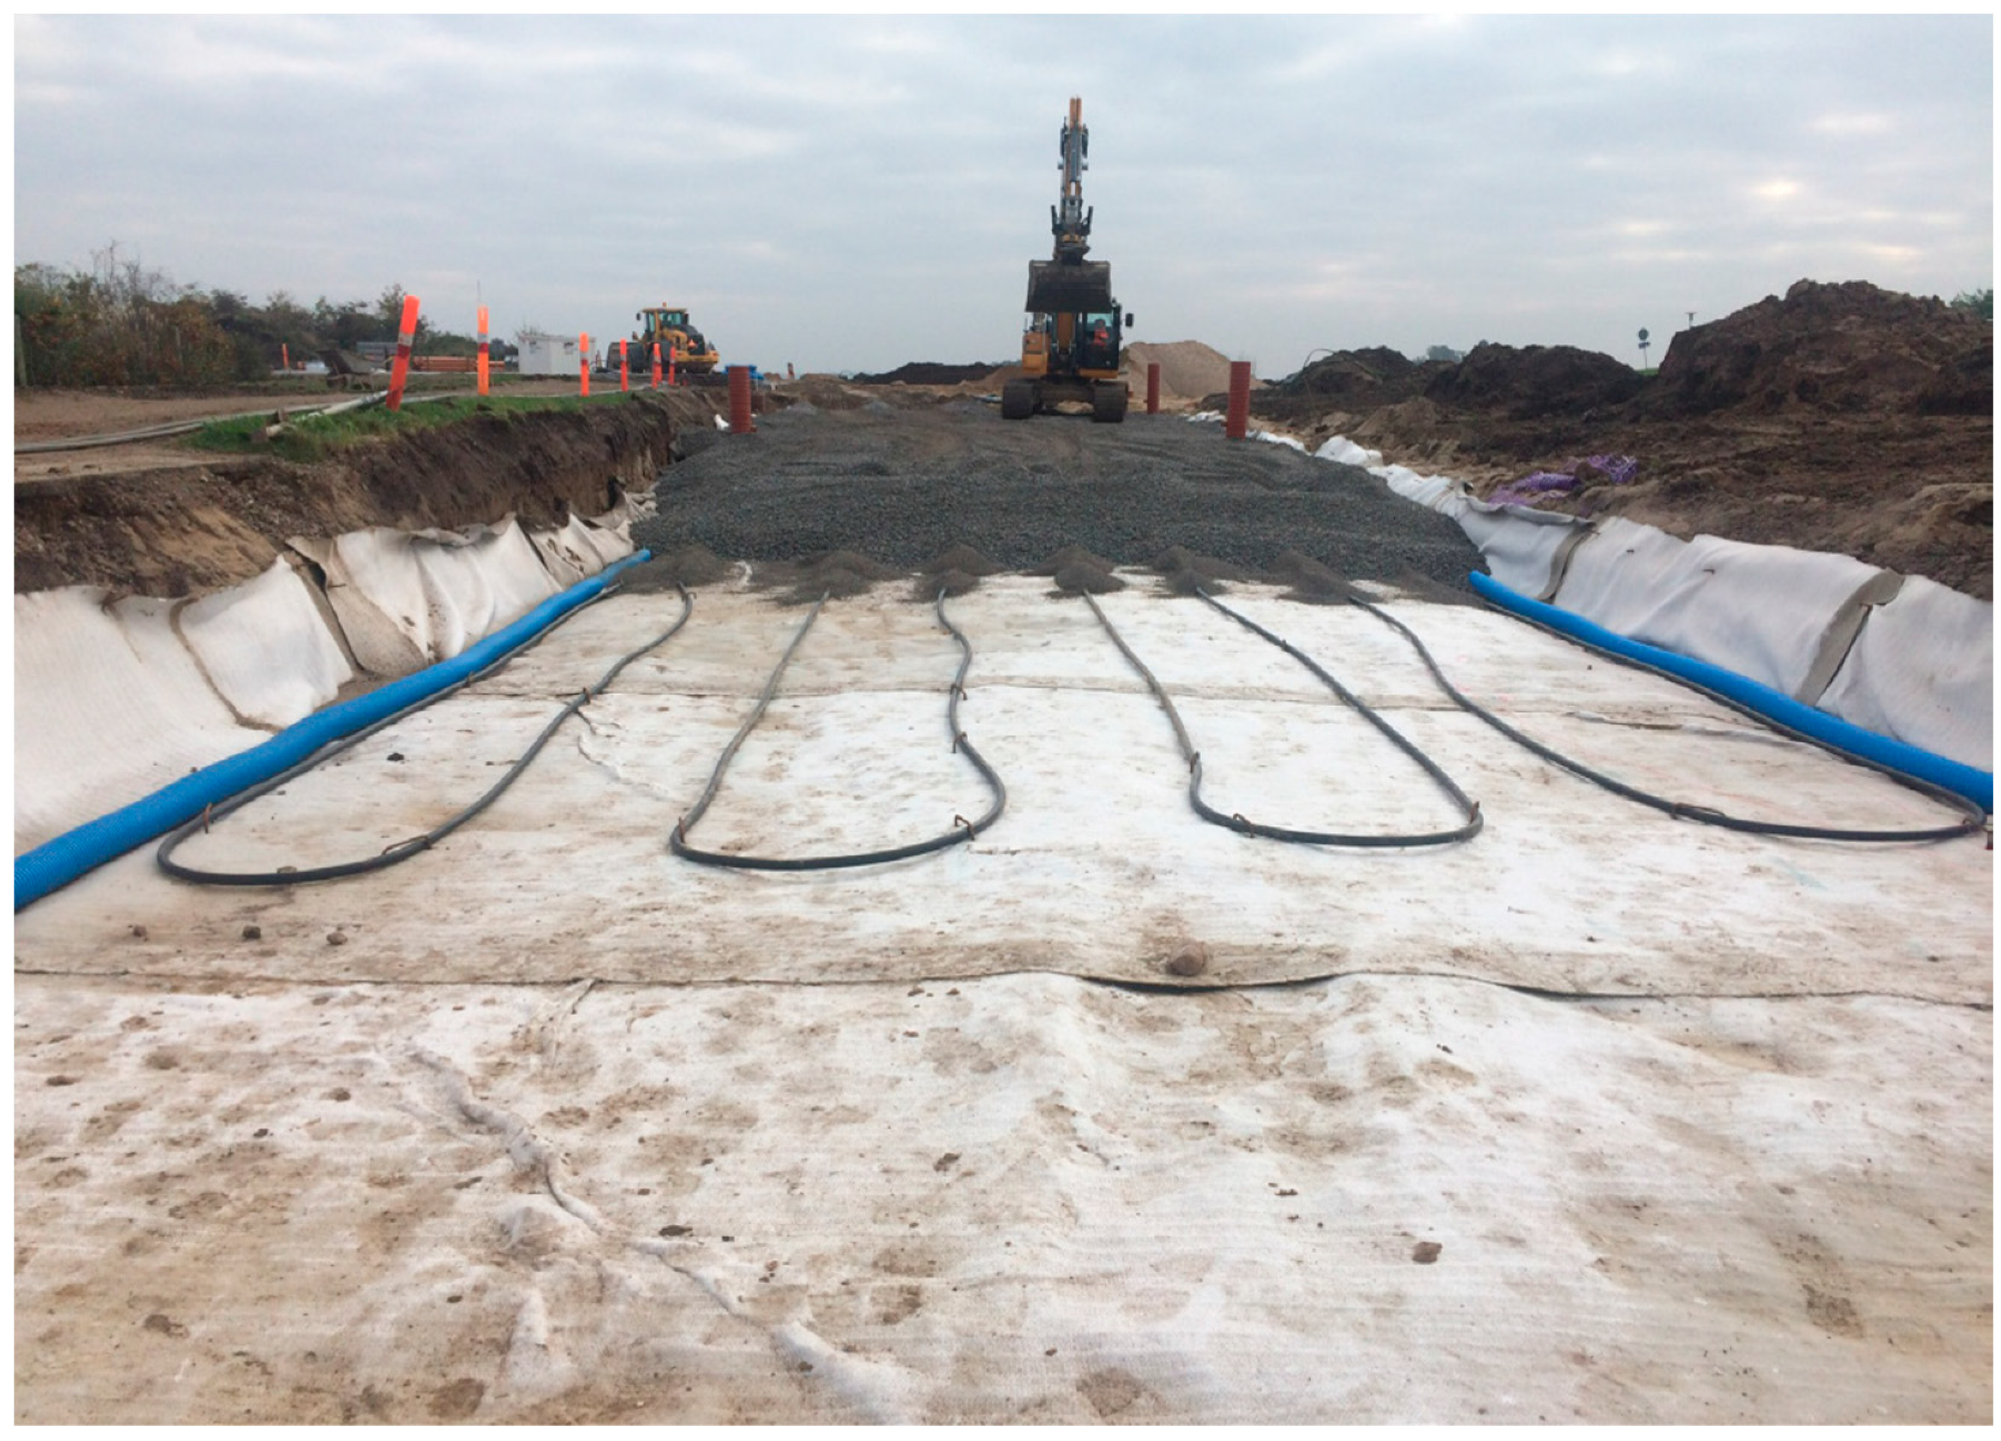
2.1. Construction of Climate Road

The Climate Road has served as a traditional road with different kinds of traffic (e.g., trucks, cars and bicycles) since its opening in March 2018. The Climate Road is situated near a roundabout in a newly developed residential area, as indicated in Figure 1. A kindergarten is located 100 m south of the Climate Road, and a rainwater basin is located 30 m southwest of the road (Figure 1).
Figure 2 illustrates the construction of the Climate Road and Figure 3 shows a photograph of the Climate Road during construction.
The Climate Road measures 50 m in length, 8 m in width and 1 m in depth. An impermeable bentonite membrane lines the sides and bottom of the roadbed (white membrane in Figure 3) to ensure hydraulic separation from the surrounding natural soil and groundwater, preventing uncontrolled leakage to and from the roadbed. Two drainage systems, each 25 m in length, were constructed at the bottom of the roadbed, along the sides and slightly submerged. Each drainage system consists of two perforated pipes with a diameter of 160 mm (blue pipes in Figure 3), draining the infiltrated rain into nearby monitoring wells (W1 and W2 in Figure 2), where the drainage water discharge is measured separately for the two drain systems with two flow meters. The drainage water is then pumped to the rainwater basin (Figure 1). The first group of Ø40 mm geothermal piping (SDR17) is placed just above the bentonite membrane (100 cm below the pavement). The section comprises 4 × 100 m loops (black pipes in Figure 3). The pipes are placed in protecting mounds of fine-grained aggregate DrænAF® with a medium grain size of D50 = 3.3 ± 1 mm, as per DS-EN 933-1 (material around the pipes in Figure 2 and Figure 3) to prevent breakage. Overlaying the first section of geothermal pipes is approximately 50 cm of crushed gravel aggregate DrænStabil® with a medium grain size of D50 = 17.0 ± 5 mm, according to DS-EN 933-1 (material filling the roadbed in Figure 3). Both DrænAF®, DrænStabil®, PermaGAB® and PermaSLID® is manufactured by NCC, Kolding, Denmark. The DrænStabil® is well sorted (D15 = 5.3 ± 2 mm), with sharp ends for the material to preserve its bearing capacity even in fully saturated conditions. The second group of geothermal pipes are placed 50 cm below the asphalt surface, comprising yet again 2 × 200 m w-loops, interbedded with DrænAF® and overlaid by approximately 50 cm of DrænStabil®. Hence, the geothermal pipes are placed well below the pavements, protecting them when road maintenance is conducted. The roadbed has an overall porosity value of 30% and is able to store 120 m3 of water or 300 mm of water. On top of the upper layer of DrænStabil®, the Climate Road is paved with 25 m of permeable asphalt and 25 m of traditional asphalt, respectively. Both sections are designed to have the same load-bearing capacity. Each section is connected to the drainage systems, allowing for a direct comparison between the drainage performance of the two road sections. The permeable asphalt consists of two layers: 110 mm PermaGAB® and a 25 mm wear layer of PermaSLID®. The PermaGAB® and PermaSLID® have a maximum aggregate size of 16 and 11 mm, respectively. The bitumen content and filler content are adjusted to give a Marshall air void of 19–22% (2 × 50 blows) with the actual aggregate density. Cellulose fibres are added to prevent bitumen drainage. The Climate Road is produced with polymer-modified bitumen or with the addition of an elastomer to 40/60 or 70/100 standard bitumen. The E-modulus is approximately half of a normal standard dense graded asphalt with the same bitumen type. Hence, the PermaSLID® at the Climate Road has an E-modulus of 1.000 MPa

2.2. Data

2.2.1. Infiltration Capacity

Two infiltration methods, Becker’s method [25] and the ASTM C1781/C1781 M-13 method [26], have been used at the Climate Road to monitor the long-term performance of the infiltration capacity of the permeable asphalt. With time, the voids in the wear layer (PermaSLID®) will be clogged by fine material, thereby lowering the infiltration capacity.
Both methods rely on the time duration for a specified column of water to infiltrate vertically through the permeable asphalt. Becker’s method [25] is a simple falling head test in which the time it takes for a 100 mm water column to infiltrate through the permeable asphalt is measured. The transparent tube has a diameter of 140 mm and is sealed with putty to avoid horizontal leakage between the tube and the asphalt during the test. The infiltration is estimated by computing the arithmetic mean of three consecutive measurements. The infiltration rate is calculated from Equation (1):
I = L t ln ( h 1 h 2 )   ,
where I is the infiltration rate in cm/s, L is the length of the sample in cm, h1 is the initial head in cm (35 cm), h2 is the final head in cm (25 cm) and t is the time taken for the water to infiltrate (s).
The ASTM C1781/C1781 M-13 test is conducted according to the guidelines in [26]. The ASTM is a constant head test in which a metal ring with a 300 mm diameter is placed on the permeable asphalt and a constant head between 10 and 15 mm is obtained by adding water to it until all the water (20 L) is used. The infiltration rate can be calculated by applying Equation (2):
I = K M D 2 t   ,
where I is the infiltration rate in mm/h, M is the mass of the infiltrated water (kg), D is the diameter of the metal ring (300 mm), K is 4,583,666,000 mm3 s/kg h and t is the time taken for the water to infiltrate (s).

2.2.2. Hydraulic Data
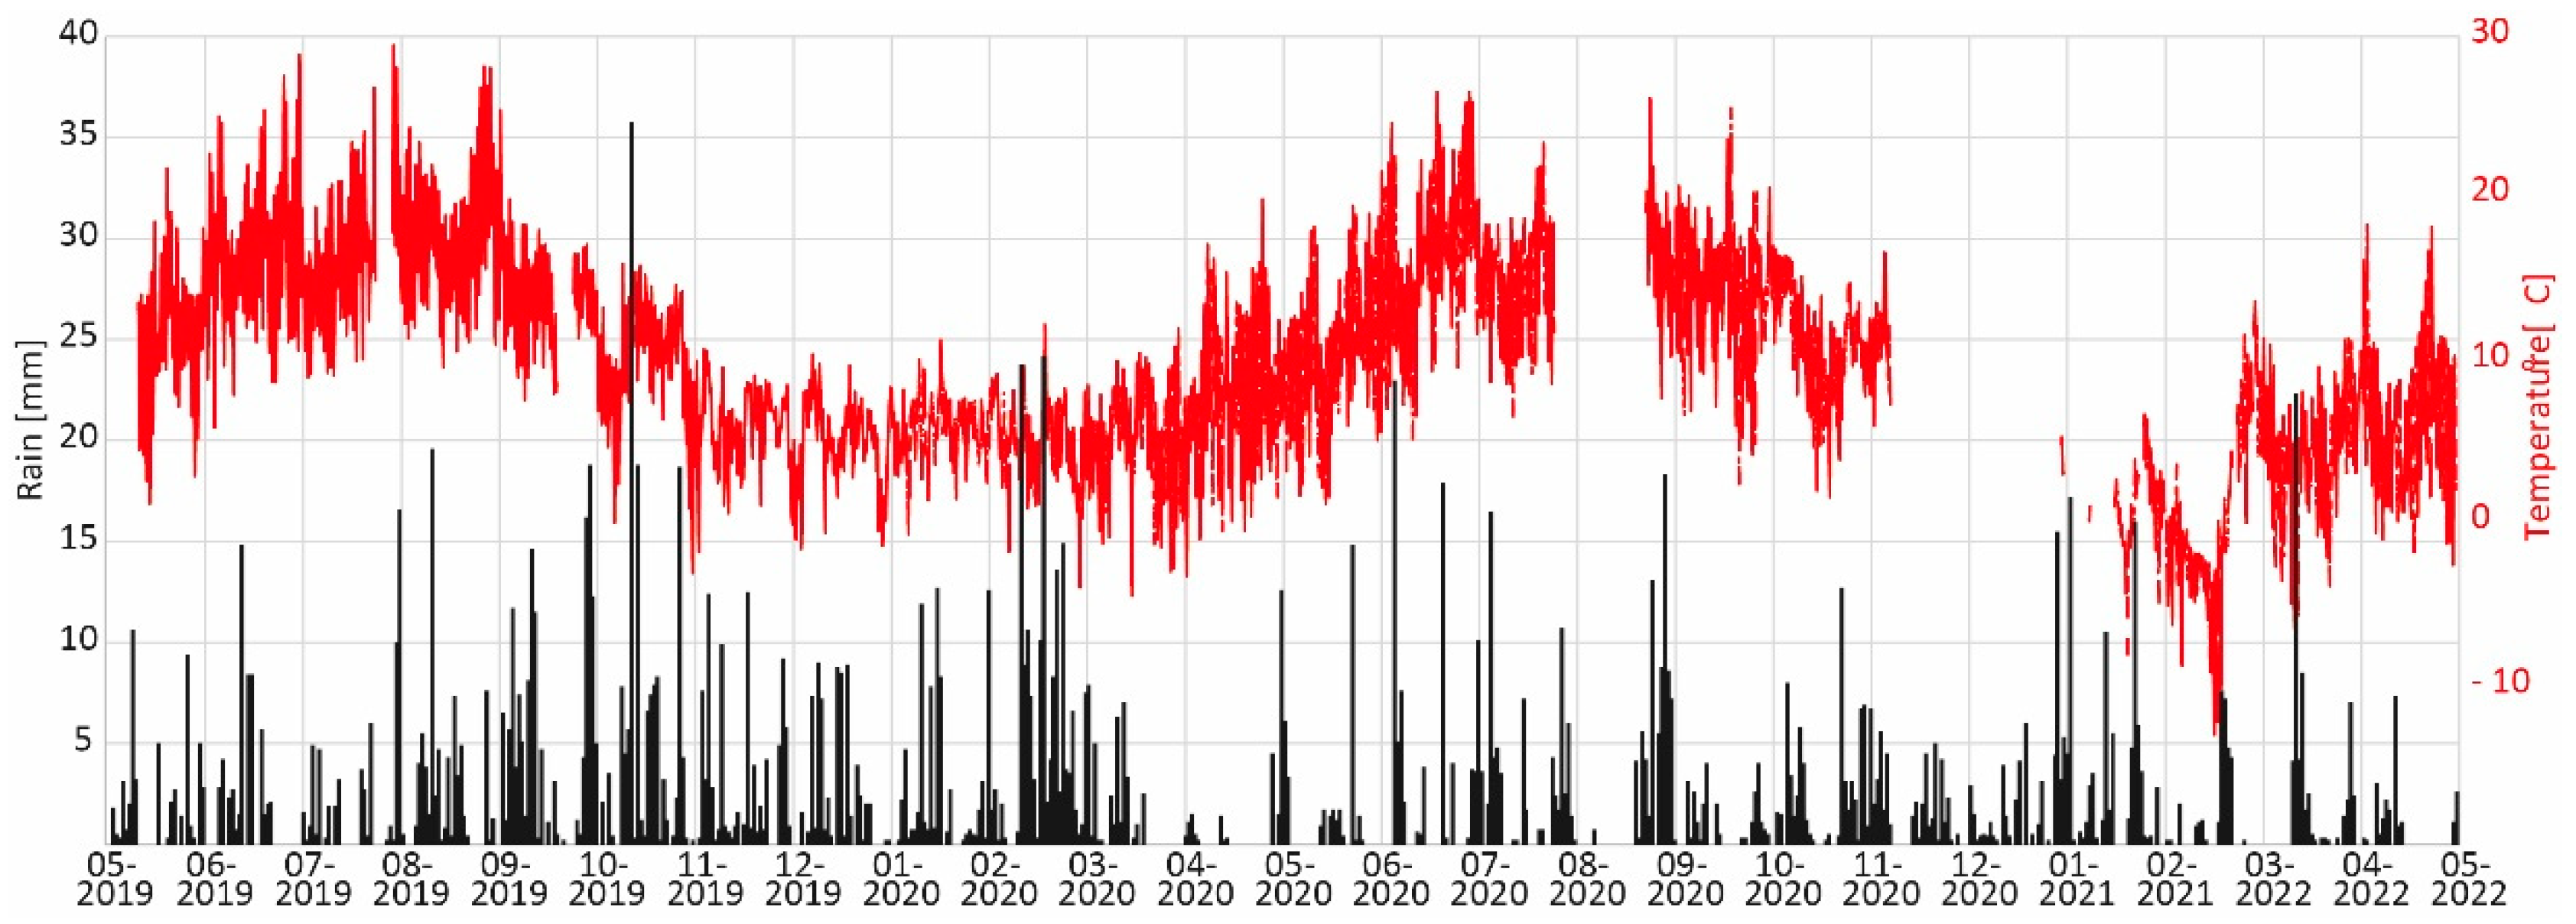
The hydraulic data from the Climate Road are obtained in two ways. The end pipes of the two drainage systems (one from the traditional asphalt section and one from the permeable asphalt section) each have a flow meter installed in W3 (Figure 2). The data from the flow meter were obtained manually during the project period. Furthermore, a pressure transducer (TD-Diver from Eijkelkamp, 11110402) and a Baro-Diver were installed in W2 (Figure 2), located between the Climate Road and the flow meter, measuring the water level from the permeable drainage section. The precision of the pressure transducer is ± 0.05% of its full scale, and the head of the water level was recorded every 10 min, providing detailed reaction timings of the water dynamics.
In order to evaluate the retention capacity of the Climate Road, individual rain events were analysed. Events with a total rainfall depth higher than 3 mm were used to evaluate the storage capacity of the roadbed, as well as to investigate the event detention time. The event detention time was calculated as the time difference between the onset of the rain event and the time at which the corresponding response was recorded in W2.
The potential catchment area of the Climate Road is estimated based on the location of drain grates and the elevation of the road surface. In Figure 1, the estimated catchment area for the Climate Road is approximately 800 m2.

2.2.3. Weather Data

Weather data were collected using a Davis Vantage Pro2 weather station located 100 m from the Climate Road, near the kindergarten. The data acquisition included precipitation, wind direction and speed, temperature, solar radiation and humidity. The Davis Vantage Pro2 records precipitation using a tipping-bucket rain gauge with a 0.2 mm resolution. All data were recorded online using a sampling time of 5 min.

2.2.4. Geothermal Data

The GSHP data were recorded in the period from May 2019 to December 2020. The compiled data included measured electricity consumption by the heat pump, brine temperatures to and from the heat pump as well as brine flow. The dimensionless monthly average coefficient of performance (COP) of the heat pump is calculated using Equation (3):
COP = Q W   ,
Q is the heat (J) supplied by the heat pump and W (J) is the electrical work required by the heat pump to produce the heat. The power connection to the GSHP is fitted with a separate electricity meter that measures the total electrical energy W consumed by the heat pump. The heat extracted from the Climate Road can be calculated as the difference QW.

3. Results and Discussion

Data monitoring was conducted from May 2019 onwards. There were gaps in the recorded data, typically caused by power failure or damaged equipment.

3.1. Long-Term Surface Infiltration Capacity
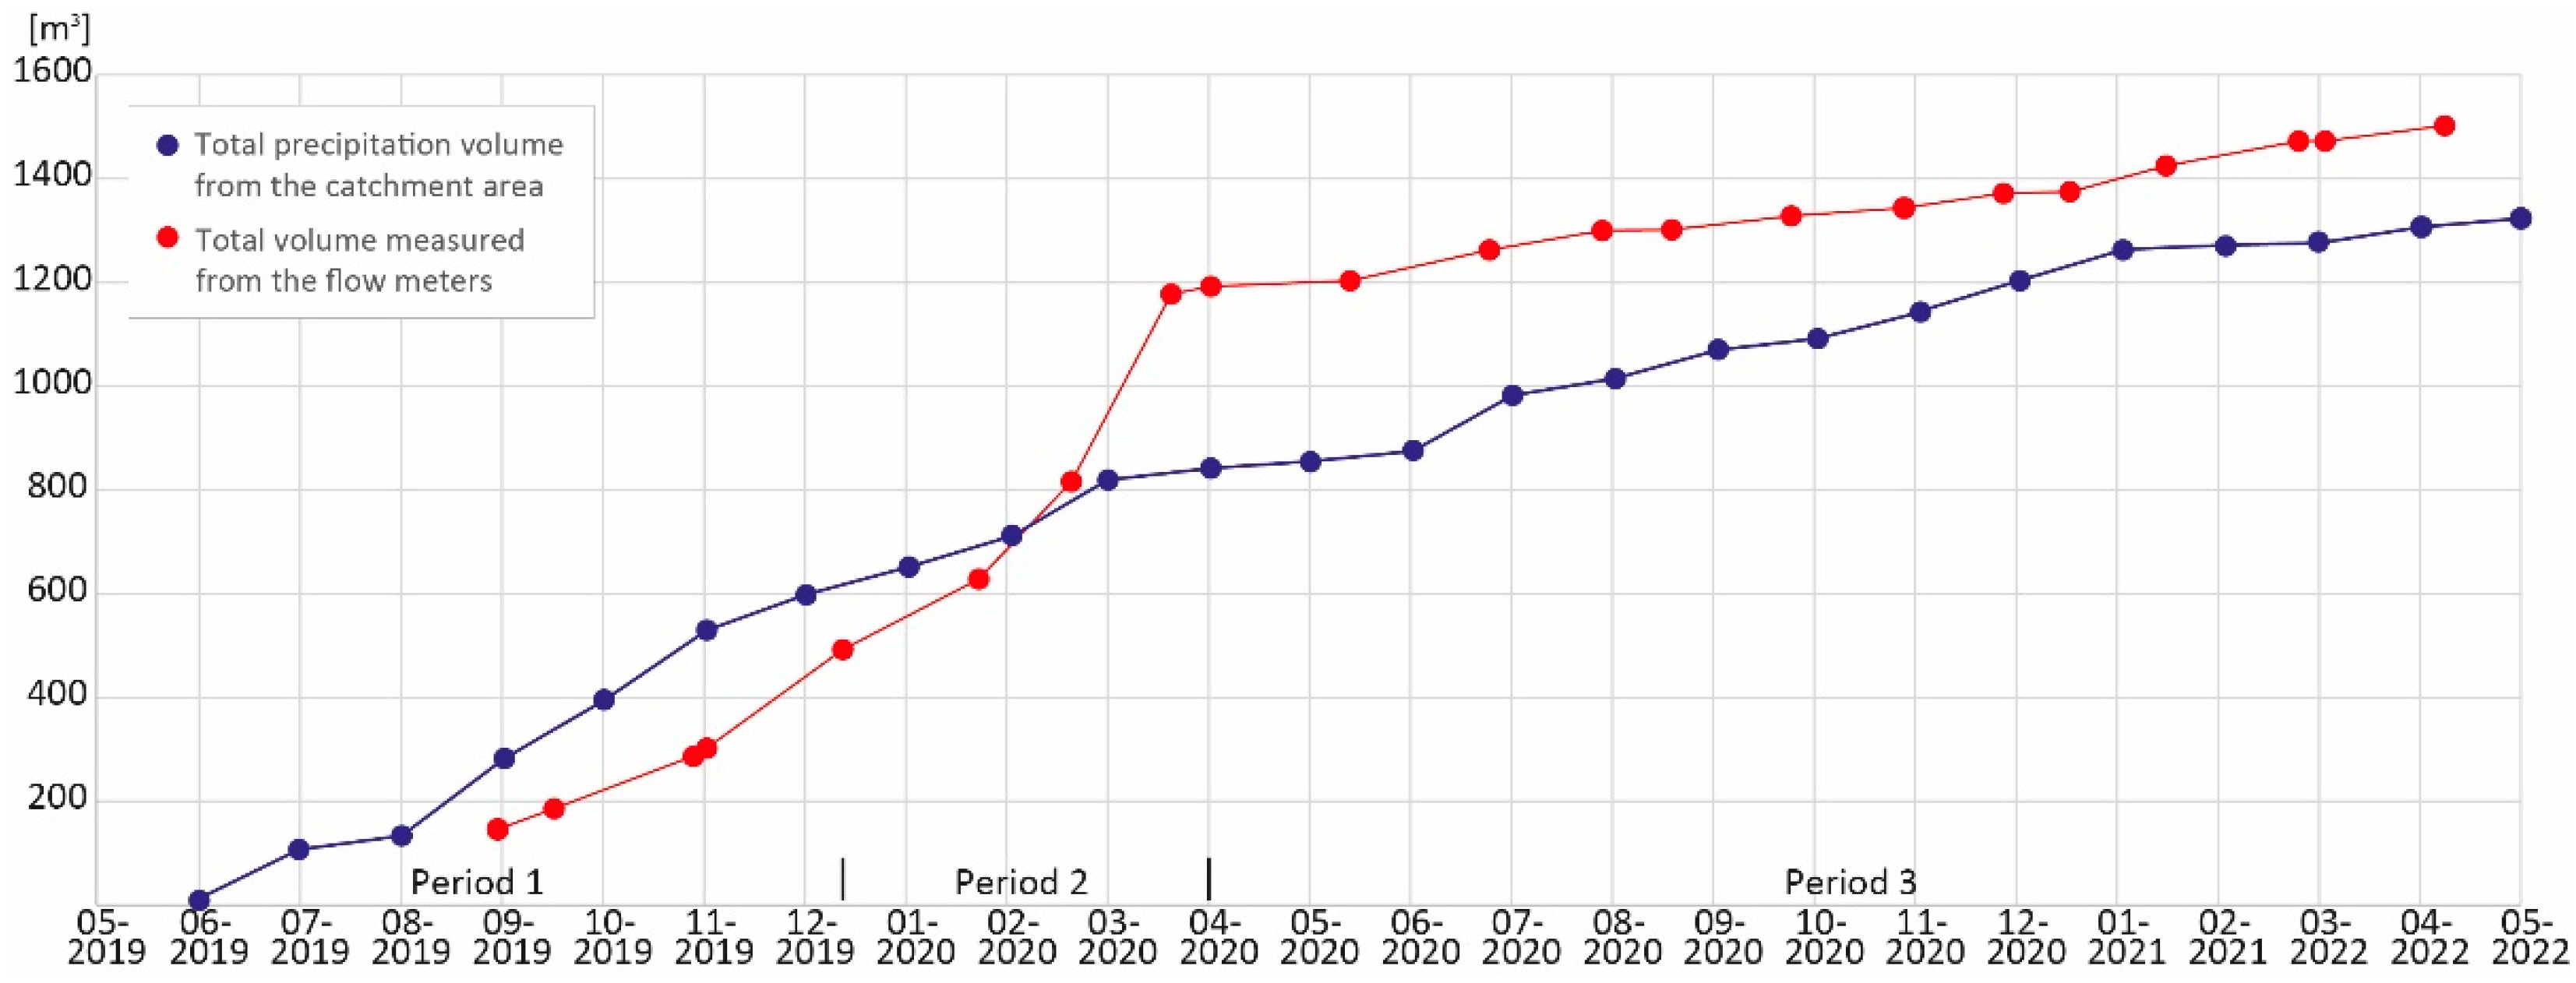
A total of 270 infiltration measurements were performed from May 2019 to May 2021 (approximately 12 measurements per month) using Becker’s method. In Table 1, the infiltration time and the calculated infiltration capacity using Equation (1) are shown. The positions (P) are given in Figure 2. Measurements conducted immediately after restorative cleaning are marked in grey in Table 1. When the infiltration times were greater than 300 s, the measurements were stopped. These are marked with (c) in Table 1. Based on Dutch criteria [25], the following t-values can be used to evaluate the permeability of permeable asphalt. t ≤ 30 s implies that the PA is in good condition with high permeability. t values between 30 and 50 s indicate that the PA is moderately clogged and, therefore, has medium permeability, but that it is still possible to clean it. t values ≥ 75 s imply that the PA is completely clogged and cleaning will not have any significant effect on its permeability.
As indicated in Table 1, the long-term infiltration capacity changes significantly during the time of operation. During the first seven months of operation, five of the six measure points (except P4) more or less retain the initial infiltration capacity, with t values near 5 s. P4, however, is observed to lose its infiltration capacity within the first couple of months, with t values above 100 s, and is often completely clogged. P4 is located at the point where traffic from the areas with urban development encounters the permeable asphalt first. In general, throughout the project period, the left lane (P4, P5 and P6) of the Climate Road experienced significantly more sand clogging than the opposite lane.
On 12-12-2019, the Climate Road was cleaned using the hydrovac method, where water is injected into the permeable asphalt under high pressure, liquefying the clogging soil particles, at which point they are vacuumed immediately. The hydrovac cleaning had an immediate effect on the infiltration capacity of P4, which changed from clogged to unclogged (to t = 58.3 s). However, P4 was clogged again after one month. Until the 1st of April 2020, after nearly one year of operation, the right lane (P1 to P3) performed well, with t values ranging from 5 to 140 s; meanwhile, the left lane (P4 to P6) tended to become increasingly clogged, with almost the entire lane becoming clogged around March 2020. From April 2020 to May 2021, the right lane (P1 to P3) continued to perform very well, with t values generally under 20 s; meanwhile, the left lane continued to be clogged throughout most of this period. The second restoration cleaning had an effect on the performance but only for a limited time, implying that the clogging due to the soil from the incoming traffic on the right lane exceeded the effect of the restoration cleaning. Similar observations were made by Støvring, Dam and Jensen [20], who concluded that the cleaned areas did not perform any better than uncleaned areas, one year after restorative cleaning.
Table 2 shows the results from the ASTM C1781/C1781 M-13 test. A total of 156 measurements were performed between March 2020 and May 2021, all within 30 cm of the measurement points used for Becker’s method. Measurements conducted immediately after restorative cleaning are marked in grey.
An overall tendency similar to that found with Becker´s method is observed from the ASTM measurements, in which P1, P2, P3 and P6 had good infiltration capacity, all above 250 mm/h, throughout the monitoring period, whereas P4 and P5 showed low to medium permeability (under 100 mm/h) due to clogging. The restorative cleaning conducted on 01-04-2020 had a positive effect, especially on the infiltration capacity of P4, P5 and P6; for example, P5 changed from 43 mm/h prior to the restorative cleaning to 637 mm/h after cleaning. However, after 6 to 8 months, the infiltration capacity was similar to that prior to the restorative cleaning. The infiltration capacity, following the second restorative cleaning that took place on 24-02-2021, was high again (e.g., P5 is 575 mm/h), but not at the same level as before the first restorative cleaning, indicating slow but deep clogging in the road, which could not be mitigated by restorative cleaning. Similar observations have been made by Drake, Bradford and Marsalak [27], Zhang and Kevern [14] as well as Støvring, Dam and Jensen [20].
As observed from Table 1 and Table 2, there were large differences between the infiltration capacities obtained from the two methods: Becker´s method resulted in infiltration capacities five times higher than those obtained with the ASTM method. Similar results have been observed by multiple authors [28,29,30]. No direct correlation between the two methods could be established in this investigation. The differences are primarily attributed to the difference between the constant head method (ASTM) and falling head method (Becker´s method), as well as the size of the infiltration area. Since the ASTM method employs a larger area than in Becker´s method, and because it has a lower constant head (between 1.0 and 1.5 cm) than Becker´s method, with an initial head h1 of 35 cm, the infiltration estimates from the ASTM method are assumed to be the most accurate.
The clogging at the Climate Road is attributed to the deposition of fine particles in the voids of the PermaSLID® and PermaGAB®. In the case of the Climate Road, the vast majority of particles most likely originate from the areas with ongoing urban development, as indicated by the more or less continuous clogging of the traffic lane coming from the roundabout. This was also verified during field inspections as sand was repeatedly observed on the lane coming from the roundabout. The clogging of the opposite lane is most likely due to redeposition of this sand, in addition to pavement wear from tire friction and sediment from tires. Transport of sediments from adjacent traditional pavement areas onto the PP has been reported by Brown and Borst [13].
Even though a general decrease in the infiltration capacity of the Climate Road is observed, it is still well within the recommendations of the infiltration capacity. In the Netherlands, PP should have an initial infiltration capacity of 194 mm/h and should hold a minimum of 97.2 mm/h (270 L/s ha) throughout the life of the PP [18,31]. The Climate Road meets both these criteria. Similar criteria exist in Belgium, Germany and Denmark [20]. According to the Danish Metrological Institute, the largest daily and hourly rain events recorded in Denmark were 169 and 100 mm, respectively. Thus, if properly maintained, the Climate Road can infiltrate all everyday rain, all rain from cloudbursts (Denmark 15 mm/30 min), as well as more extreme events, without any issues. Furthermore, with a storage capacity of 120 m3 in the roadbed itself, the Climate Road (400 m2) can store 33% of a year’s precipitation in Denmark (annual precipitation: approximately 900 mm). Thus, the Climate Road is a very effective climate adaptation solution for the Danish climate.

3.2. Water Balance

The monthly rainfall measured by the Davis Vantage Pro2 weather station can be observed in Figure 4, along with the temperatures.
The mean temperature during the project period was 9.3 °C, spanning from 29 °C on 29-07-2019 to −14.9 °C on 14-02-2021. Continuous temperatures below 0 °C were observed in the winter of 2020–2021. February 2021 was especially cold, with a mean temperature of 0 °C. Winter 2019–2020 was, on the other hand, characterised by only a few continuous days of frost.
A total of 1654 mm of precipitation was observed throughout the project period (May 2019 to May 2021). The largest continuous rain event with rain everyday lasted from 08-02-2020 to 05-03-2020, with precipitation of 170.2 mm (Figure 4). September 2019 was the wettest month recorded, with a total precipitation value of 141.1 mm. The most intense rainfalls were, in general, observed during the summer months. August 2019 had multiple heavy summer storms. On 10-08-2019, precipitation of 39.8 mm between 9.10 and 9.30 a.m. was observed. On 27-08-2019, 40.3 mm of precipitation occurred in 30 min.
The total recorded volume of water drained from the Climate Road was 1582 m3. The 883 m3 of rainwater drained through the permeable asphalt exceeded the 699 m3 that drained from the traditional asphalt. This is attributed to the permeable asphalt section being located downstream from the traditional asphalt, thus indicating that some of the rainwater passes the drains upstream and flows to the permeable asphalt, where it infiltrates to the roadbed during heavy or long rain events.
In Figure 5, the total precipitation volume from the catchment area (800 m2) is plotted against the volume measured by the flow meters. The figure can be subdivided into three periods, each with a distinct ratio of precipitation volume to volume measured from the flow meters. The first period is from 01-05-2019 to 12-12-2019, where a total drained volume of 490 m3 was recorded. The precipitation volume of 598 m3 was calculated for a similar time period using a catchment area of 800 m2, providing a volume reduction capacity (retention) of the Climate Road of 18%.
A significantly different picture was observed from 12-12-2019 to 01-04-2020. During this period, a total of 700 m3 was recorded from the flow meters. However, only precipitation of 390 mm was monitored from 01-12-2019 to 01-04-2020, implying that the catchment area in this period must have been significantly larger than the estimated 800 m2. In fact, a catchment area of approximately 1800 m2 is needed to account for the entire water volume monitored in the flow meters. The extended catchment area is most likely the result of saturated soil around the Climate Road, hindering the precipitation from infiltration, and thereby causing the precipitation to become surface runoff instead. Surface runoff during winter is a result of gradual saturation of the soil during autumn and early winter, thereby obstructing precipitation from infiltrating [32].
The third period was from 01-04-2020 to 01-05-2021 and was similar to the first period, with the precipitation volume from the catchment area being approximately parallel to the volume measured from the water counters. A total of 340 m3 was measured from the water counters and a precipitation volume of 481 m3 was calculated for the catchment area, providing a volume reduction capacity (retention) of the Climate Road of 30%.
As the size of the catchment area for the Climate Road varies significantly over the seasons, the calculated volume reduction capacity (15 to 30%) also varies correspondingly. The vast majority of the reduction is probably due to evaporation, although minor seepage from the bentonite mats must also be expected. Støvring et al. [12] investigated the reduction capacity from a laboratory-size but otherwise comparable setup as the Climate Road (permeable asphalt and a 0.5 m roadbed comprising NCC DrænStabil). They found a reduction capacity of 37% (280 mm/year of a total precipitation of 756 mm/year), which they assumed was caused by evaporation. The differences in reduction capacity could be the result of the slightly higher average temperature in their investigation (9.4 degrees compared to 9.1 in our investigation), but the primary reason is most likely due to much higher surface infiltration rates in this investigation, limiting the amount of water that is stored in the upper voids and thus evaporating freely. Furthermore, the roadbed of the Climate Road is twice as deep (1.0 m). Thus, during summer, when most of the evaporation occurs, the roadbed in the Climate Road is cooler. As the aggregates in the roadbed (DrænStabil) have a medium grain size of D50 = 17.0 ± 5 mm, capillary forces are negligible and, thus, water is not transported to the surface, which would otherwise increase the evaporation. Lower evaporation rates for permeable asphalt systems are also reported by Brown and Borst [13].
Another source of water volume reduction is the storage capacity of the roadbed. Pratt et al. [33] observed that rain events up to 5 mm did not produce any runoff and attributed this to surface wetting of the aggregates. The larger the surface area of the aggregates was, the larger the flow reduction was. In their investigation, granite produced the highest runoff [33]. Individual rain events have also been investigated from the Climate Road to evaluate the potential storage capacity of the roadbed. A total of 61 rain events resulting in a rain depth of minimum 3 mm have been analysed (see Table 3). The rain events were scattered throughout the project period, occurring during both winter and summer. From the analysis, it is observed that rain events below 0.7 mm rain depth in general do not produce a significant response from the logger in W2. In a few cases, rain events up to 4.1 mm are not recorded by the water level loggers. This is typically during the summer and following a longer dry period. In these cases, the entire roadbed is most likely almost completely dry and the aggregates are, therefore, able to retain the rain due to surface wetting. This is also consistent with the findings of Støvring et al. [12] and Randall et al. [19].

3.3. Event Detention Time

A total of 61 individual rain events for measuring the detention time are shown in Table 3. Cases with infiltration of melting snow were omitted from the analysis. In total, 25 rain events produced rain depths from 3 to 5 mm, 23 rain events produced rain depths between 5 and 10 mm and 13 rain events were above 10 mm. The majority of rain events occurred during the summer and autumn period, while winter and spring had fewer rain events. This is either due to frost or due to multiple small rain events, in which case the base logger level could not be established between the events. The event detention time differs from 10 to 130 min, with an average event detention time of 35 min. There is a clear tendency for rain intensity to be the dominant factor with respect to the event detention time. For rain events with a rain intensity above 5 mm/h, the average event detention time is 22 min, whereas for rain events with a rain intensity below 5 mm/h, the average event detention time is 40 min.

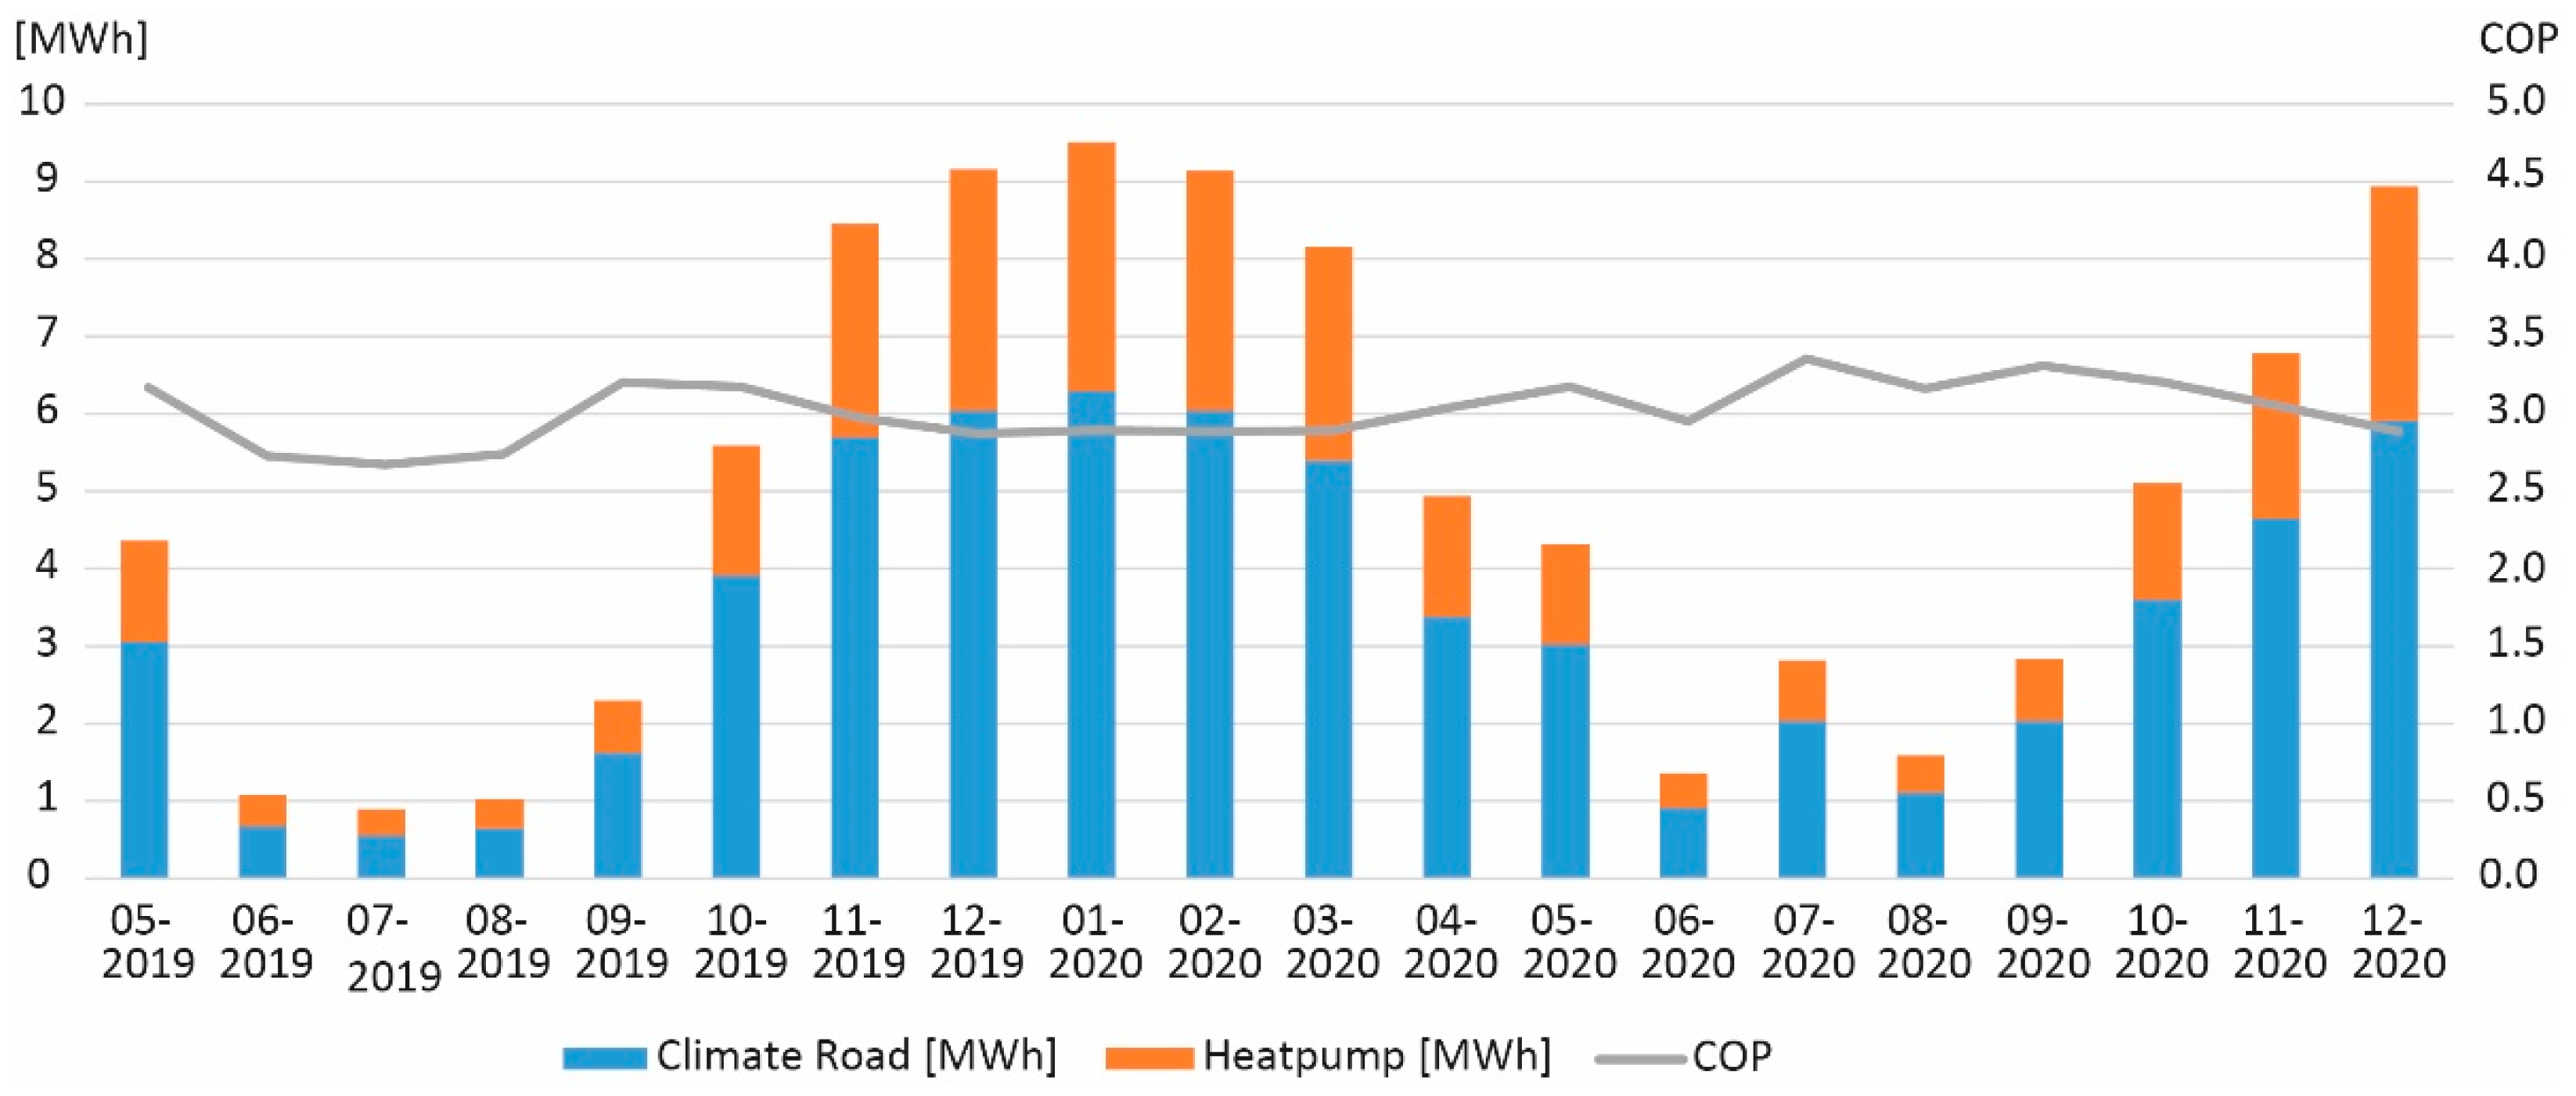
3.4. Energy Production

The energy production from the Climate Road as well as the COP is displayed in Figure 6. The Climate Road has been able to produce a total of 98 MWh of heat from May 2019 to December 2020, with an average COP value of 3.1. On 2019-11-20, a GSHP inspection revealed that a single geothermal pipe was leaking brine, and consequently, it was disconnected at the manifold, effectively reducing the total of the length of the ground heat exchanger to 600 m. The GSHP was disconnected from the Climate Road in January 2020 and reconnected to its original ground heat exchangers as the brine temperature to the heat pump had fallen below 0 °C for a longer period of time, which is not permitted according to the Danish legislation for GSHP systems. The Climate Road will not be able to fully supply the heating demand of the kindergarten if operation is to be continued, and this lack of production capacity was further amplified by the loss of one of the four geothermal pipes.
To supplement the heat pump, solar collectors are installed on the roof of the kindergarten, providing additional heating of approximately 5 MWh/year. The Climate Road in combination with the solar collectors has been able the fully supply the energy demands from the kindergarten from May 2019 to December 2020; however, the energy production cannot be sustained over time.
As observed from Figure 6, energy demand from the kindergarten correlates with the yearly temperature variations in Denmark (Figure 4). The highest energy demands ˃ 5 MWh were observed from October until March, and the lowest, ˂1 MWh, were observed in the summer from June to August. The COP value was fairly stable at around 3 during the project period, which is higher than for other similar research demonstration projects in which GSHP and SUDS have been combined. For example, Tota-Maharaj et al. [34] found COP values between 2.3 and 4.5 for their indoor rigs, and between 1.5 and 4.5 for their outdoor rigs, whereas Charlesworth et al. [24] found a mean COP value of 1.8. The predominant reason for the higher COP values in this investigation is most likely the higher capacity of GSHP in the Climate Road, with 800 m of geothermal pipe heat exchangers, the continuous infiltration of water to the pipes and the depth of the GSHP pipes (0.5 and 1.0 m, respectively). When the length of the geothermal pipe in the roadbed was reduced to 600 m in November 2019, a drop in the COP was also observed.

4. Conclusions

During two years of operation, the Climate Road has shown considerable potential: partly as a climate adaptation solution, where the Climate Road is able to drain and store large amounts of precipitation (120 m3), and partly as a climate mitigation solution, where it has been able to produce approximately 50 MWh/year of clean renewable energy. The energy production corresponds to the annual energy demand of five newly built Danish 130 m2 family houses with an energy consumption of 10 MWh/year/house. However, the recorded energy production cannot be sustained and further studies have been undertaken to estimate the energy production levels that comply with national legislation. Nevertheless, the Climate Road can serve as a collective heating supply in areas where traditional district heating is not possible and where green solutions for climate adaption and mitigation are in demand.
The climate adaptation and climate mitigation solutions supplement each other well. The large amounts of precipitation that the Climate Road is able to drain and store in the roadbed continuously saturate the aggregates around the GSHP pipes, thereby enhancing the heat transfer from the surroundings to the pipes. The roadbed also makes it possible to install hundreds of meters of geothermal pipes as the Climate Road does not take up space in the urban environment. Thus, the Climate Road makes it possible to build both a climate adaptation solution as well as a clean renewable energy source in densely populated areas using the existing road infrastructure. Furthermore, climate roads can act as retention basins, holding large amounts of rainwater until the existing sewer system has regained its capacity to handle the rainwater following extreme precipitation events, thereby lowering the demand for new sewer systems and traditional rainwater retarding basins.
With respect to the Climate Road’s functionality as a climate adaptation solution, we conclude the following:
  • The long-term surface permeability of the permeable asphalt has been examined with 156 ASTM C1781/C1781 M-13 measurements and 270 Becker test measurements. Even though the two methods yield very different infiltration capacities, with Becker’s method yielding infiltration rates five times higher than those obtained with the ASTM method, the same trend in infiltration capacity can be observed. In general, the permeable asphalt shows large infiltration capacities (above 250 mm/h) during the project period. The lowest infiltration capacity measured with the ASTM method was 43 mm/h, which is still able to handle a cloudburst in Denmark (15 mm/30 min).
  • The long-term surface permeability test also highlights that the infiltration capacity decreases during the time of operation but can be partially restored with restorative cleaning, although not to the same level as before the first restorative cleaning; this indicates slow yet deep clogging in the road, which cannot be removed.
  • A total of 1654 mm of precipitation was observed throughout the project period (May 2019 to May 2021). Assuming a catchment area of 800 m2, the volume reduction capacity of the Climate Road is between 15 and 30%. The vast majority of the retention is assigned to evaporation, although minor seepage from the bentonite mats must also be expected.
  • A total of 61 rain events with a minimum rain depth of 3 mm have been analysed in order to investigate the storage capacity of the roadbed as well as the event detention time. Rain events below 0.7 mm rain depth in general do not produce a significant response. In a few cases, events with rain depths up to 4.1 mm do not yield any signal downstream. This is typically after a long dry period, typically during the summer, where the roadbed is most likely dry, which enables the aggregates to retain the rain due to surface wetting. The event detention time differs from 10 to 130 min, with an average event detention time of 35 min. There is a clear tendency for the rain intensity to be the determining factor for the event detention time. For rain events with a rain intensity above 5 mm/h, the average event detention time is 22 min, whereas for those with a rain intensity below 5 mm/h, the average event detention time is 40 min.
With respect to the Climate Road serving as a basis for providing energy to a GSHP system, we conclude the following:
  • The Climate Road produces approximately 50 MWh/year of energy, ranging from ˃ 5 MWh from October until March to ˂ 1 MWh from June to August, with a COP value of 3.1. This production rate cannot be sustained over time and further research is required for estimating sustainable energy production levels that comply with the national legislation on GSHP systems. The high COP values found in this investigation are most likely due to the total length of the geothermal pipes (800 m in the roadbed), the continuous infiltration of water to the geothermal pipes and the depth of the GSHP pipes (0.5 and 1.0 m, respectively).

Author Contributions

Conceptualisation, T.R.A. and S.E.P.; methodology, T.R.A., S.E.P. and K.W.T.; investigation, T.R.A., S.E.P. and K.W.T.; data curation, T.R.A., S.E.P. and K.W.T.; writing—original draft preparation, T.R.A.; writing—review and editing, T.R.A., S.E.P. and K.W.T.; visualisation, T.R.A. and K.W.T. All authors have read and agreed to the published version of the manuscript.

Funding

This research project was funded by EU LIFE, grant number LIFE15 IPC/DK/000006-C2C CC.

Acknowledgments

The authors are grateful to the municipality of Hedensted as well as NCC for their assistance and collaboration during the project. The authors would also like to thank Kirsten Landkildehus Thomsen for carrying out the field and laboratory work. We would also like to thank Anna Bondo Medhus, who provided helpful comments and suggestions that improved the paper. Finally, the authors would like to thank the journal reviewers, whose constructive and relevant comments significantly improved the paper.

Conflicts of Interest

The authors declare no conflict of interest and the funders had no role in the design of the study; collection, analyses or interpretation of data; writing of the manuscript or in the decision to publish the results.

References

  1. Pacione, M. Urban Geography: A Global Perspective; Routledge: New York, NY, USA, 2009. [Google Scholar]
  2. Department of Economic and Social Affairs, Population Division. World Urbanization Prospects: The 2018 Revision; ST/ESA/SER.A/420; United Nations: New York, NY, USA, 2019. [Google Scholar]
  3. Hibbs, B.J.; Sharp, J.M. Hydrogeological Impacts of Urbanization. Environ. Eng. Geosci. 2012, 18, 3–24. [Google Scholar] [CrossRef]
  4. Ferguson, B.K. Porous Pavements; Taylor & Francis: Abingdon, UK, 2005. [Google Scholar]
  5. Volkan Oral, H.; Radinja, M.; Rizzo, A.; Kearney, K.; Andersen, T.R.; Krzeminski, P.; Buttiglieri, G.; Ayral-Cinar, D.; Comas, J.; Gajewska, M.; et al. Management of Urban Waters with Nature-Based Solutions in Circular Cities; Exemplified through Seven Urban Circularity Challenges. Water 2021, 13, 3334. [Google Scholar] [CrossRef]
  6. Langen, P.L.; Boberg, F.; Pedersen, R.A.; Christensen, O.B.; Sørensen, A.; Madsen, M.S.; Olesen, M.; Darholt, M. Klimaatlas—Rapport Danmark; Danmarks Meteorologiske Institut: Copenhagen, Denmark, 2019. [Google Scholar]
  7. Ossa-Moreno, J.; Smith, K.M.; Mijic, A. Economic Analysis of Wider Benefits to Facilitate SuDS Uptake in London, UK. Sustain. Cities Soc. 2017, 28, 411–419. [Google Scholar] [CrossRef] [Green Version]
  8. Duffy, A.; Jefferies, C.; Waddell, G.; Shanks, G.; Blackwood, D.; Watkins, A. A Cost Comparison of Traditional Drainage and SUDS in Scotland. Water Sci. Technol. 2008, 57, 1451–1459. [Google Scholar] [CrossRef] [PubMed]
  9. Webber, J.L.; Fu, G.; Butler, D. Comparing Cost-effectiveness of Surface Water Flood Management Interventions in a UK Catchment. J. Flood Risk Manag. 2019, 12, e12523. [Google Scholar] [CrossRef] [Green Version]
  10. Oral, H.V.; Carvalho, P.; Gajewska, M.; Ursino, N.; Masi, F.; van Hullebusch, E.D.; Kazak, J.K.; Exposito, A.; Cipolletta, G.; Andersen, T.R.; et al. A Review of Nature-Based Solutions for Urban Water Management in European Circular Cities: A Critical Assessment Based on Case Studies and Literature. Blue-Green Syst. 2020, 2, 112–136. [Google Scholar] [CrossRef] [Green Version]
  11. Moretti, L.; Loprencipe, G. Climate Change and Transport Infrastructures: State of the Art. Sustainability 2018, 10, 4098. [Google Scholar] [CrossRef] [Green Version]
  12. Støvring, J.; Dam, T.; Jensen, M.B. Hydraulic Performance of Lined Permeable Pavement Systems in the Built Environment. Water 2018, 10, 587. [Google Scholar] [CrossRef] [Green Version]
  13. Brown, R.A.; Borst, M. Quantifying Evaporation in a Permeable Pavement System. Hydrol. Process. 2015, 29, 2100–2111. [Google Scholar] [CrossRef]
  14. Zhang, K.; Kevern, J. Review of Porous Asphalt Pavements in Cold Regions: The State of Practice and Case Study Repository in Design, Construction, and Maintenance. J. Infrastruct. Preserv. Resil. 2021, 2, 4. [Google Scholar] [CrossRef]
  15. Yu, Z.; Gan, H.; Xiao, M.; Huang, B.; Zhu, D.Z.; Zhang, Z.; Wang, H.; Lin, Y.; Hou, Y.; Peng, S.; et al. Performance of Permeable Pavement Systems on Stormwater Permeability and Pollutant Removal. Environ. Sci. Pollut. Res. 2021, 28, 28571–28584. [Google Scholar] [CrossRef] [PubMed]
  16. Vaz, I.C.M.; Ghisi, E.; Thives, L.P. Stormwater Harvested from Permeable Pavements as a Means to Save Potable Water in Buildings. Water 2021, 13, 1896. [Google Scholar] [CrossRef]
  17. Mohsen, E.; Abdalla, H.; Selseth, I.; Muthanna, M.; Helness, H.; Alfredsen, K.; Gaarden, T.; Sivertsen, E. Hydrological Performance of Lined Permeable Pavements in Norway. Blue-Green Syst. 2021, 3, 107–118. [Google Scholar] [CrossRef]
  18. Boogaard, F.; Lucke, T. Long-Term Infiltration Performance Evaluation of Dutch Permeable Pavements Using the Full-Scale Infiltration Method. Water. 2019, 11, 320. [Google Scholar] [CrossRef] [Green Version]
  19. Randall, M.; Støvring, J.; Henrichs, M.; Bergen Jensen, M. Comparison of SWMM Evaporation and Discharge to In-Field Observations from Lined Permeable Pavements. Urban Water J. 2020, 17, 491–502. [Google Scholar] [CrossRef]
  20. Støvring, J.; Dam, T.; Bergen Jensen, M. Surface Sedimentation at Permeable Pavement Systems: Implications for Planning and Design. Urban Water J. 2018, 15, 124–131. [Google Scholar] [CrossRef]
  21. Ahmadi, M.H.; Ahmadi, M.A.; Sadaghiani, M.S.; Ghazvini, M.; Shahriar, S.; Alhuyi Nazari, M. Ground Source Heat Pump Carbon Emissions and Ground-Source Heat Pump Systems for Heating and Cooling of Buildings: A Review. Environ. Prog. Sustain. Energy 2018, 37, 1241–1265. [Google Scholar] [CrossRef]
  22. Self, S.J.; Reddy, B.V.; Rosen, M.A. Geothermal Heat Pump Systems: Status Review and Comparison with Other Heating Options. Appl. Energy 2013, 101, 341–348. [Google Scholar] [CrossRef]
  23. Novo, A.V.; Bayon, J.R.; Castro-Fresno, D.; Rodriguez-Hernandez, J. Temperature Performance of Different Pervious Pavements: Rainwater Harvesting for Energy Recovery Purposes. Water Resour. Manag. 2013, 27, 5003–5016. [Google Scholar] [CrossRef]
  24. Charlesworth, S.M.; Faraj-Llyod, A.S.; Coupe, S.J. Renewable Energy Combined with Sustainable Drainage: Ground Source Heat and Pervious Paving. Renew. Sustain. Energy Rev. 2017, 68, 912–919. [Google Scholar] [CrossRef]
  25. Vejdirektoratet. Two-Layer Porous Asphalt—Lifecycle—The Øster Søgade Experiment; Danish Road Directorate: Hedehusene, Denmark, 2008. [Google Scholar]
  26. ASTM International. Standard Test Method for Surface Infiltration Rate of Permeable Unit Pavement Systems (No. C1781/C1781 M-13). Am. Soc. Test. Mater. 2013, M-13, 1–5. [Google Scholar]
  27. Drake, J.; Bradford, A. Assessing the Potential for Restoration of Surface Permeability for Permeable Pavements through Maintenance. Water Sci. Technol. 2013, 68, 1950–1958. [Google Scholar] [CrossRef]
  28. Li, H.; Kayhanian, M.; Harvey, J.T. Comparative Field Permeability Measurement of Permeable Pavements Using ASTM C1701 and NCAT Permeameter Methods. J. Environ. Manag. 2013, 118, 144–152. [Google Scholar] [CrossRef] [PubMed]
  29. Qin, Y.; Yang, H.; Deng, Z.; He, J. Water Permeability of Pervious Concrete Is Dependent on the Applied Pressure and Testing Methods. Adv. Mater. Sci. Eng. 2015, 2015, 1–6. [Google Scholar] [CrossRef] [Green Version]
  30. Chen, L.-M.; Chen, J.-W.; Chen, T.-H.; Lecher, T.; Davidson, P. Measurement of Permeability and Comparison of Pavements. Water 2019, 11, 444. [Google Scholar] [CrossRef] [Green Version]
  31. Boogaard, F.; Lucke, T.; Beecham, S. Effect of Age of Permeable Pavements on Their Infiltration Function. CLEAN—Soil Air Water 2014, 42, 146–152. [Google Scholar] [CrossRef]
  32. Latron, J.; Gallart, F. Seasonal Dynamics of Runoff-Contributing Areas in a Small Mediterranean Research Catchment (Vallcebre, Eastern Pyrenees). J. Hydrol. 2007, 335, 194–206. [Google Scholar] [CrossRef]
  33. Pratt, C.J.; Mantle, J.D.G.; Schofield, P.A. Urban stormwater reduction and quality improvement through the use of permeable pavements. Water Sci. Technol. 1989, 21, 769–778. [Google Scholar] [CrossRef]
  34. Tota-Maharaj, K.; Grabowiecki, P.; Scholz, M. Energy and Temperature Performance Analysis of Geothermal (Ground Source) Heat Pumps Integrated with Permeable Pavement Systems for Urban Run-off Reuse. Int. J. Sustain. Eng. 2009, 2, 201–213. [Google Scholar] [CrossRef] [Green Version]
Figure 1. Overview map.
Water 14 00666 g001
Figure 2. Upper left: 2D overview map. Upper right corner: Composition of the Climate Road. Lower sketch: Cross-section of the Climate Road. The drawing is not to scale.
Water 14 00666 g002
Figure 3. The Climate Road during construction.
Water 14 00666 g003
Figure 4. Temperature (red) and rain (black) during the project period.
Water 14 00666 g004
Figure 5. Precipitation from the catchment area and the water measured by the flow meters. The 3 periods are marked above the x axis.
Water 14 00666 g005
Figure 6. Energy produced and COP values from the Climate Road.
Water 14 00666 g006
Table 1. Infiltration time and calculated infiltration capacity using Becker’s method.
Location/DateP1P2P3P4P5P6
[s][mm/h][s][mm/h][s][mm/h][s][mm/h][s][mm/h][s][mm/h]
20-05-2019529,193529,193529,193529,193529,193529,193
27-05-2019529,193529,193529,193529,193529,193529,193
13-06-2019529,193529,193529,1931071364529,193529,193
27-06-2019529,193529,193529,193324561529,193529,193
30-07-2019529,193529,193529,193334423529,193529,193
13-08-2019529,193529,193529,19313.211,058529,193529,193
27-08-2019529,193529,193529,19311.213,033529,193529,193
11-09-2019529,193529,193529,19323661916.78741529,193
23-09-2019529,193529,193529,193383841529,193529,193
08-10-2019529,193529,193529,193CC13.710,655529,193
24-10-2019529,193529,193529,19339.437052754066.223,543
05-11-20196.323,169529,193529,19318081111.512,6936.223,543
18-11-20196.123,929529,193529,193C2412.411,7726.921,155
05-12-20196.422,807529,193529,193C2410.114,4526.821,466
12-12-20196.522,457529,193529,19358.3250413.510,812529,193
19-12-20196.821,466529,193529,19382178012.911,3155.427,031
08-01-20208.217,801529,193529,193C2413.310,975529,193
22-01-202010.913,3925.128,6216.223,543C2442.734186.921,155
05-02-202021.268855.228,071818,24612012165.128,6214.731,057
19-02-20207.319,996529,1935.427,0313004878.118,021624,328
06-03-20201401043529,1937.619,206274533100146025.45747
17-03-20204036495.327,5417.519,46285171721468226.95426
20-03-20201691239.914,7445.725,608142102834.44243364055
24-03-202011.312,9179.914,7445.526,54036.83967CCCC
26-03-202023.861338.417,3775.725,608CCCC443317
30-03-20201113,2708.616,9739.315,695542703CC275406
01-04-202055.7262113.810,5775.526,54069211595153621.96665
06-04-202036.3402112.711,49310.813,516463173110132714.510067
16-04-202028.7508613.211,0584.234,75446.53139236619334423
10-06-20202460821589246.721,7861410,426C24712056
24-06-202038.23821300487720,8523004872585661171248
08-07-202043.33371300487916,219244598CC901622
28-07-202048.130353004879.515,36538.73772CC224652
18-08-202015973117.38437916,21942.13467CC1381058
02-09-202013.510,81228.4514017.28486781871CC41.23543
23-09-202013.111,1439.315,6957.718,957901622CC163896
09-10-20201410,4267.718,95720.870181451007CCCC
20-10-20201113,27013.610,7337.419,725172849CCCC
05-11-202015.9918045.9318013.410,893300487CC158924
20-11-202023.5621123.462387.220,273209698CC169864
23-02-202111.712,47625.557249.814,895CCCC261559
24-02-202129.3498217.3843711.812,370CC10813521181237
08-04-202156.7257434.1428129.64931CC127114959.92437
03-05-202130.148492266356.821,466CC139105022.96374
19-05-202113.310,9758.317,5867.718,957CC37.73872771896
Table 2. Calculated infiltration capacity from the ASTM method (Equation (2)).
Location/DateP1P2P3P4P5P6
[mm/h][mm/h][mm/h][mm/h][mm/h][mm/h]
06-03-202019047958----
17-03-20201386530545375842652079
20-03-20203041378710,1862876471741
24-03-20203401398710,186475424543
26-03-2020334051069670-316677
30-03-2020354338157958302431543
01-04-20201567304193165666371997
06-04-202018033041448713143182369
16-04-202018352397103244736031132
22-04-202034473041----
10-06-2020245422647009377244918
24-06-2020178718355184340101257
08-07-2020163018693787460145301
28-07-2020140515323512210103274
18-08-2020251534356945828200370
02-09-2020261223693880480146484
23-09-2020328650558042799377285
09-10-202030412058456825154103
20-10-2020468345688988142163141
05-11-20203531223950301164361
20-11-202037381959555133964463
23-02-20212952175656126698212
24-02-2021216720376386491575970
08-04-2021362527914132858491126
03-05-202132342079749049496994
Table 3. Event detention time.
Event No.Initial Time
for Rain Event
Rain DepthMaximum Rainfall IntensityInitial Time
for Logger Response
Event Detention Time
[mm][mm/h] [min]
121-05-2019 13:304.32.421-05-2019 14:2050
212-06-2019 19:2049.416.212-06-2019 19:4020
314-06-2019 17:207.61.714-06-2019 17:5030
415-06-2019 09:4015.65.615-06-2019 10:1030
518-06-2019 15:204.32.618-06-2019 16:1050
619-06-2019 12:2010519-06-2019 12:4020
721-06-2019 10:403.5321-06-2019 11:3050
830-07-2019 22:504.30.930-07-2019 23:2030
931-07-2019 16:2013.22.331-07-2019 16:5030
1007-08-2019 13:109.28.807-08-2019 13:3020
1107-08-2019 16:3018.27.607-08-2019 16:4010
1208-08-2019 10:508.2808-08-2019 11:2030
1308-08-2019 17:104.33.808-08-2019 17:5040
1410-08-2019 01:408.43.410-08-2019 02:1030
1510-08-2019 09:1040.820.210-08-2019 09:2010
1617-08-2019 05:404.80.317-08-2019 06:2040
1719-08-2019 14:203.6319-08-2019 14:4020
1827-08-2019 16:2014.48.227-08-2019 17:0040
1904-09-2019 19:3019.57.104-09-2019 20:0030
2009-09-2019 18:006.40.609-09-2019 19:0060
2110-09-2019 03:30100.910-09-2019 04:3060
2227-09-2019 00:407.11.127-09-2019 01:1030
2327-09-2019 13:4010.29.527-09-2019 13:5010
2428-09-2019 11:108.27.528-09-2019 11:2010
2529-09-2019 20:406.80.829-09-2019 21:2040
2608-10-2019 03:2040.508-10-2019 04:2060
2710-10-2019 13:30105.510-10-2019 13:5020
2804-11-2019 06:004.30.304-11-2019 07:0060
2908-11-2019 01:308.10.808-11-2019 02:0030
3009-12-2019 08:003.40.809-12-2019 08:3030
3115-12-2019 08:504.60.615-12-2019 09:2030
3220-12-2019 22:105.90.520-12-2019 22:4030
3304-01-2020 07:304.81.504-01-2020 08:1040
3409-01-2020 10:408.30.909-01-2020 11:1030
3514-01-2020 04:508.30.414-01-2020 05:2030
3630-01-2020 01:203.40.430-01-2020 01:5030
3730-01-2020 21:504.01.230-01-2020 22:0010
3809-02-2020 12:2021.62.509-02-2020 12:5030
3915-02-2020 04:004.50.515-02-2020 04:5050
4029-02-2020 10:003.40.529-02-2020 11:1070
4130-04-2020 07:1011.61.130-04-2020 09:20130
4202-05-2020 16:303.90.902-05-2020 17:1040
4322-05-2020 17:0015.32.122-05-2020 17:3030
4404-06-2020 16:1040.94.804-06-2020 16:3020
4513-06-2020 16:2020.88.713-06-2020 16:4020
4628-06-2020 12:204.54.328-06-2020 12:4010
4730-06-2020 00:009.03.830-06-2020 00:3030
4801-07-2020 17:304.31.101-07-2020 18:1040
4904-07-2020 02:304.11.104-07-2020 02:5020
5007-07-2020 12:506.04.607-07-2020 13:4050
5125-08-2020 22:108.31.325-08-2020 22:4030
5228-08-2020 17:508.16.228-08-2020 18:2030
5303-09-2020 18:404.93.403-09-2020 19:2040
5406-09-2020 12:103.22.806-09-2020 12:3020
5504-10-2020 03:504.11.504-10-2020 04:4050
5605-10-2020 19:3012.29.205-10-2020 20:0030
5721-10-2020 15:304.30.621-10-2020 16:3060
5827-12-2020 08:406.20.327-12-2020 09:3050
5921-01-2021 17:405.61.921-01-2021 18:1030
6016-02-2021 21:207.00.416-02-2021 22:0040
6113-03-2021 11:105.00.513-03-2021 12:2070
Publisher’s Note: MDPI stays neutral with regard to jurisdictional claims in published maps and institutional affiliations.

