Article

Experimental Study of Forces Influencing Vertical Breakwater under Extreme Waves

1
Department of Marine Environment and Engineering, National Sun Yat-sen University, Kaohsiung 804, Taiwan
2
Department of Hydraulic and Ocean Engineering, National Cheng Kung University, Tainan 701, Taiwan
3
Marine Science and Information Research Center, National Academy of Marine Research, Kaohsiung 804, Taiwan
*
Author to whom correspondence should be addressed.
Water 2022, 14(4), 657; https://doi.org/10.3390/w14040657
Submission received: 19 January 2022 / Revised: 14 February 2022 / Accepted: 15 February 2022 / Published: 20 February 2022
(This article belongs to the Special Issue Research on the Interaction of Water Waves and Ocean Structures)

Abstract

:
In order to understand the extreme wave acting on the vertical breakwater, a series of experiments were constructed in the wave tank to measure the variations of pressure on the front, rear faces, and below the caisson due to overtopping waves. The front and backward horizontal forces and the uplift forces were estimated by integrating the dynamic wave pressure distributions. The COBRAS numerical model was also used to calculate the wave loads under various overtopping waves. The measured wave pressures and wave forces were compared with the predictions of numerical results and showed good agreement. It was found that the forces acting on the backward side of the vertical structure induced by the wave overtopping should be considered. From the experimental data, new semi-empirical equations for calculating the maximum wave forces are proposed using a least squares approximation.

1. Introduction

Structural stability must be calculated when designing coastal structures or harbor breakwaters against the extreme waves. Studies on perforated caisson breakwaters have used theoretical, physical, and numerical models to investigate the horizontal force on the seaward face and the uplifting forces at the bottom under the wave impact. Such overtopping waves and their accompanying wave forces can induce various mechanisms of structure failure that result in structural instability [1,2,3,4]. Such studies are of crucial importance in coastal and harbor engineering.
The wave force on crown walls was studied by [5,6]. Ref. [7] theoretically modeled the uplift force on a caisson and revised the Goda’s formula [8]. Ref. [9] developed a new semi-empirical method, partially based on experimental measurements, to calculate the wave loads on the wall for regular and irregular waves. Ref. [10] revised Takahashi’s formula [8] by using experimental data. Extensive experimental studies have been conducted to estimate the forces and pressures that are induced by tsunami bore and exerted on structures [11,12,13,14,15]. However, few experiments have been performed to measure the wave pressure on the back side of the vertical breakwater.
Several numerical studies investigated the overtopping wave or tsunami forces on a vertical breakwater (e.g., [16,17,18]). Ref. [19] discussed the ocean wave impact on breakwater. Ref. [20] investigated solitary waves propagating an impermeable trapezoidal breakwater on a sloping seabed. Recently, the numerical model with Navier–Stokes equations and the turbulence closure model were carried out to study more sophisticated wave–structure interaction problem [21,22,23,24]. Ref. [25] used a numerical model and simplified equations to calculate the wave force induced by monochromatic waves impinging on a caisson.
These previous studies have provided valuable results that have elucidated the horizontal and vertical loading on the seaward and bottom faces of different coastal structures. However, these studies have rarely considered the horizontal force on the backward side of a breakwater. At present, the formulas of [8,26] are used most often for caisson design. Ref. [27] discuss the dynamic response of caisson breakwaters using a numerical model, providing a comprehensive review of the historical failures. Ref. [3] provide a simple and intuitive set of prediction formulae that have considered the quasi-static and impact forces, and overturning moments. Ref. [28] describe methods to predict wave overtopping of shoreline structures that recommend approaches for calculating mean overtopping discharges, overtopping wave volumes, and the proportion of waves overtopping a seawall. However, these cannot be used for calculating the maximum horizontal forces of overtopping waves because they do not consider the force on the rear face of a vertical wall that produces zero pressure on the landward side. For an overtopping wave acting on a caisson, wave forces on its rear part appear to be a lower value following the impulse force on the seaward side. The dynamic conditions are different from those where the force on the rear face is not considered. To better evaluate the structural stability of overtopping waves, information about the evaluation of pressure distribution and the horizontal forces acting on different faces, especially the landward side, is required.
In the present study, a physical experiment was conducted to study the pressure distributions of the structure and thereby obtain the total horizontal and uplift forces. We also carried out a COBRAS model to simulate the horizontal wave forces on the rear faces and the lifting forces of a caisson breakwater induced by the overtopping waves. The numerical results simulated from the validated model were compared against the experimental data and the semi-empirical formulas [26]. Asymptotic equations based on the experimental data according to a least squares approximation are also derived in this study.

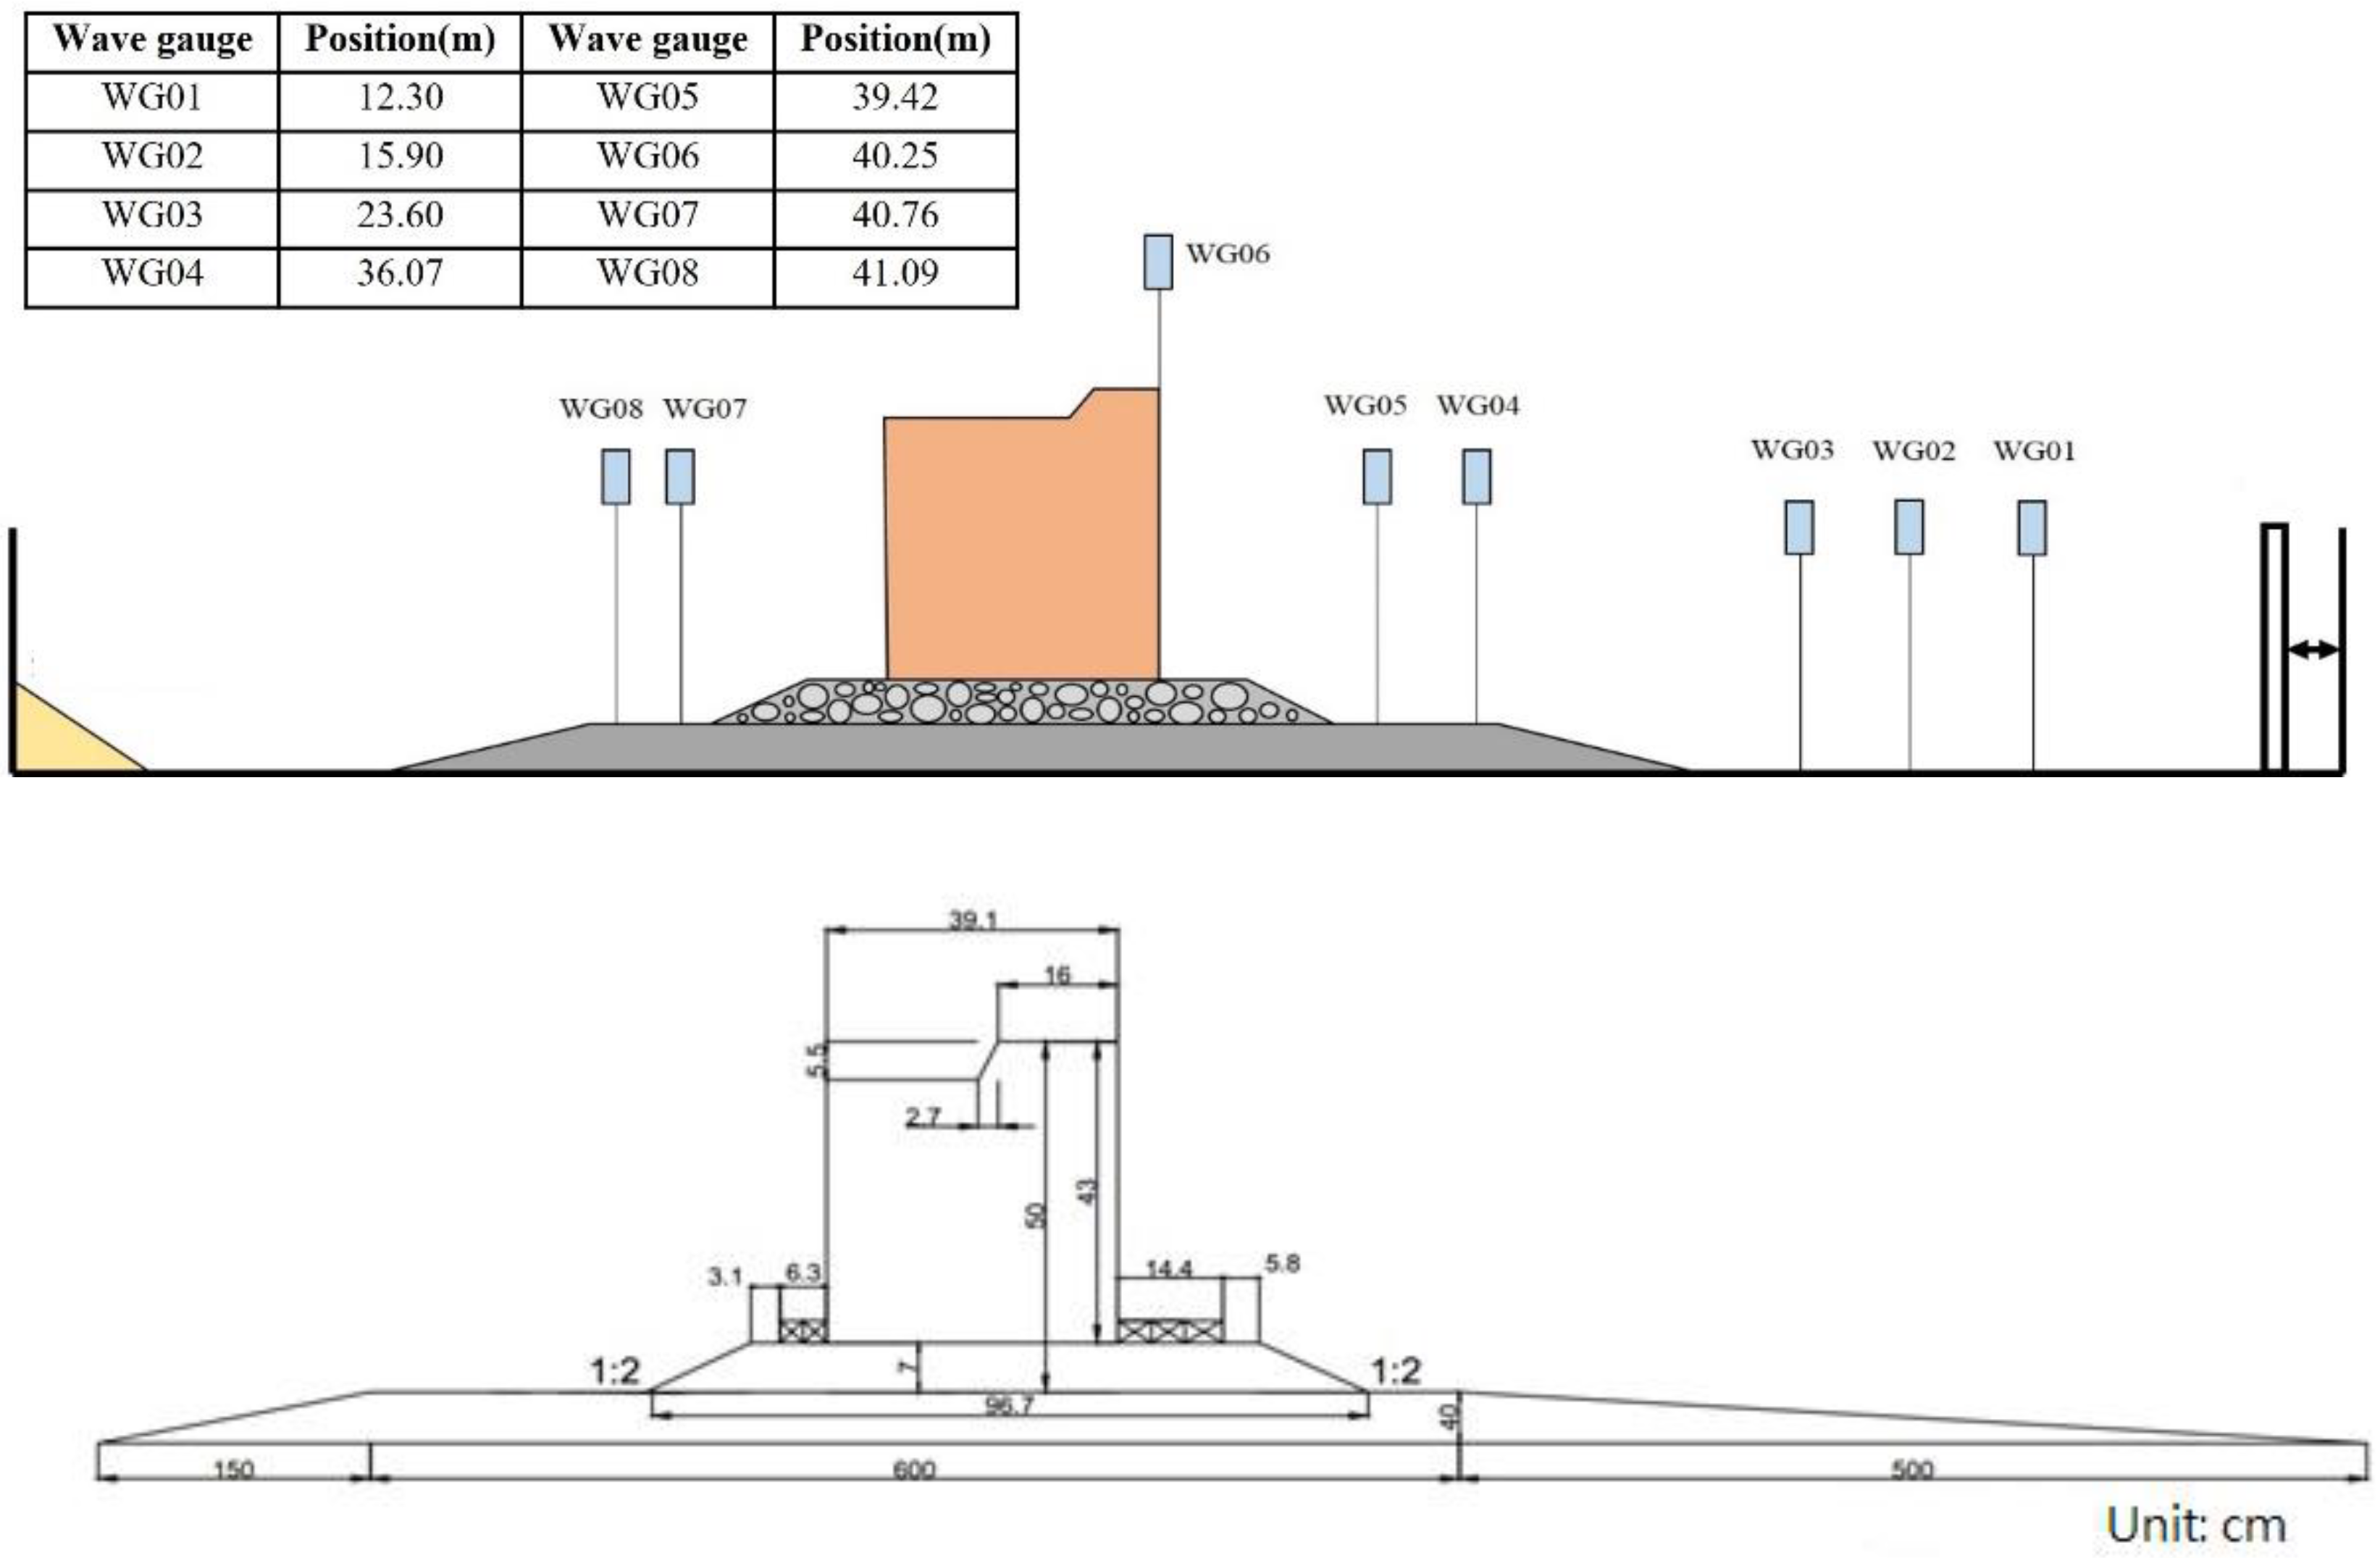
2. Experimental Setup

A physical model of a wave flume at Taichung Harbor and Marine Technology Center was used to study the dynamic wave pressure distributions and the wave forces at different times on different sides, including the front, rear, and bottom faces of a vertical composite breakwater, which is located at Suao port in Taiwan (Figure 1). The caisson had a width and height of 25 m and 27.5 m. The flume had a length, width, and depth of 100, 1.5, and 2 m, respectively, and it comprised a piston and an absorbing wave-maker, with the coordinate origins setting at the wave-maker. The experiment was performed at a constant water depth of 0.823 m. A wooden type of the caisson had a length, width, and height of 39.1, 150, and 43 cm, respectively, and the model scaling is 1:64, which was set-up on the 40 cm height platform. The specifications of the caisson were as follows: the mound height is 7 cm, berm width is 6.3 cm, the crown-wall height is 5.5 cm, caisson width is 39.1 cm and caisson height is 43 cm. The porosity of the bottom was 0.439. Eight wave gauges for measuring the free-surface elevation were placed. The design wave conditions were due to the breakwater of Suao port of 25, 50, and 100 year return period wave conditions. Monochromatic waves with periods of 1.75–1.94 s were used, and their corresponding wavelengths were 4.11–4.70 m and incident wave heights were 12.29–22.54 cm. Table 1 shows the input wave conditions, where CV denotes the coefficient of variation. The test case was repeated five times for each wave parameter. The results demonstrate high repeatability, and we take the averaged value of the experimental data.
The time series of free-surface elevation was measured at eight locations at a sampling rate of 100 Hz to provide water wave propagation data. These sensors are denoted as WGx, where x = 1–8 indicates the gauge number. WG1–WG3 were used to measure the initial wave height, WG4 and WG5 were used to measure the wave heights in front of the caisson, WG6 was located at the front face of the caisson and was used to measure the height of the overtopping wave, and WG7 and WG8 were used to measure the local wave heights at the rear face. The dynamic wave pressures were measured using 22 tiny pressure transducers on the vertical structure at the front (Pf1–Pf9), rear (Pb1–Pb8), and bottom (Pbo1–Pbo5) faces of the caisson. Table 2 lists the positions of the pressure gauges shown in Figure 2. The sampling frequency of the wave pressure transducers was 100 Hz.
The obtained forces were defined as (1) horizontal force on front face, F f (seaward) (2) horizontal force on the back side, F b (backward); (3) F b o (bottom) is the vertical force on the bottom. The total force ( F t ) acting on the caisson is calculated as the sum of F f and F b shown in Figure 3. The wave-induced horizontal forces on the front and rear walls were obtained from integrating the experimental wave pressure distributions along the front and rear walls of a caisson breakwater, and the uplift forces were calculated by integrating the pressure below the caisson.

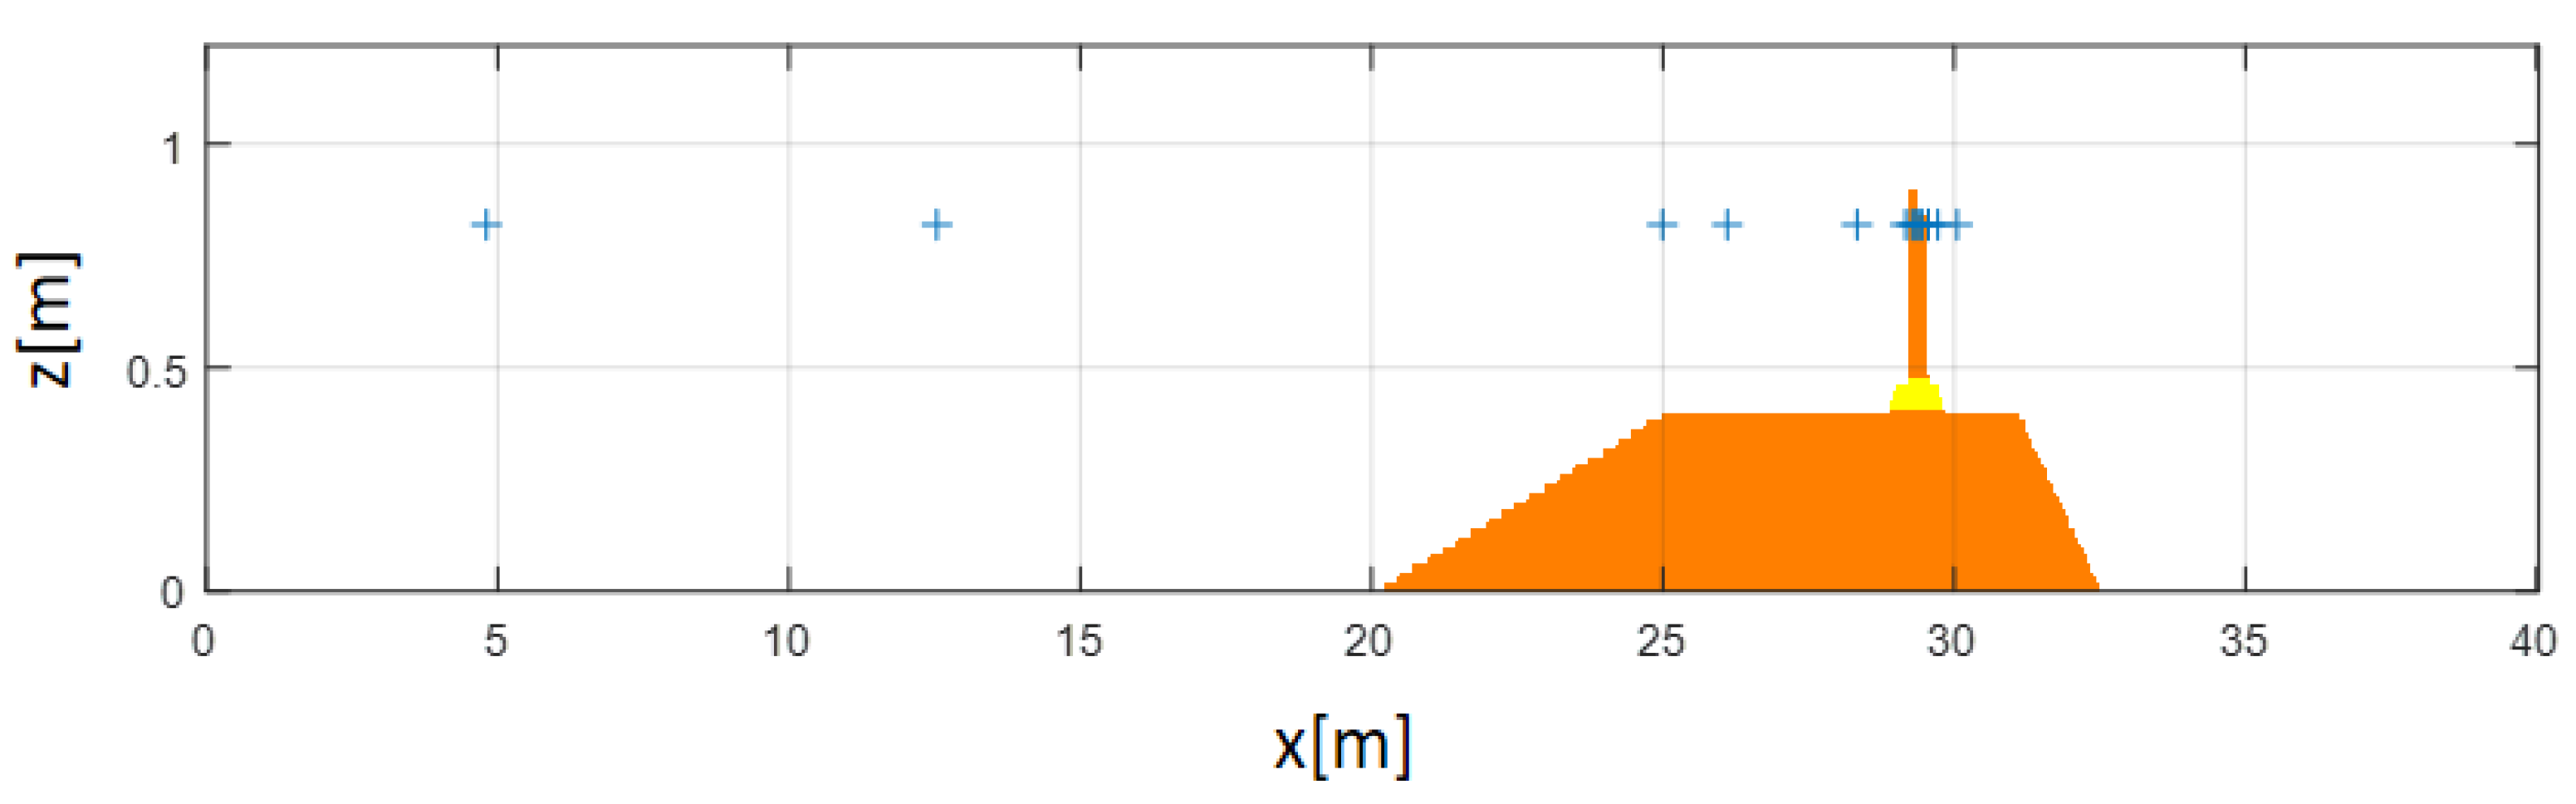
3. Numerical Simulation

In this study, we used the COBRAS numerical model, a depth- and time-resolving two-dimensional vertical numerical model, to solve the RANS equations. Furthermore, we used the k ε turbulence closure model [22,29,30] to simulate the experiments and compare the numerical results with experimental data. The RANS equations can be expressed as
u i x i = 0
u i t + u j u i x j = 1 ρ p x i + g i + 1 ρ τ i j x j u i u j x j
where i , j = 1, 2 for a two-dimensional flow; τ i j is the viscous stress; and ρ , p , and t denote the water density, pressure, and time, respectively. The wave interaction with porous structures was introduced in [31]. The numerical flume shown in Figure 4 was implemented with the experimental setup. The flow in the porous structure is described in the COBRAS model by the Volume-Averaged Reynolds Averaged Navier–Stokes (VARANS) equations as
( n u i ) x i = 0
u i t + u j u i x j = 1 ρ n n p x i + g i 1 ρ n x 3 ( n u b i u b 3 ) + f p i
where n represents a plane porosity that equals the ratio of the fluid area, u b i u b 3 represents a mean stress, and f p i represents the components of the mean force that the grains of the porous media intersected by the plane of integration exerted on the fluid. The numerical flume shown in Figure 4 was implemented with the experimental setup.

4. Results and Discussion

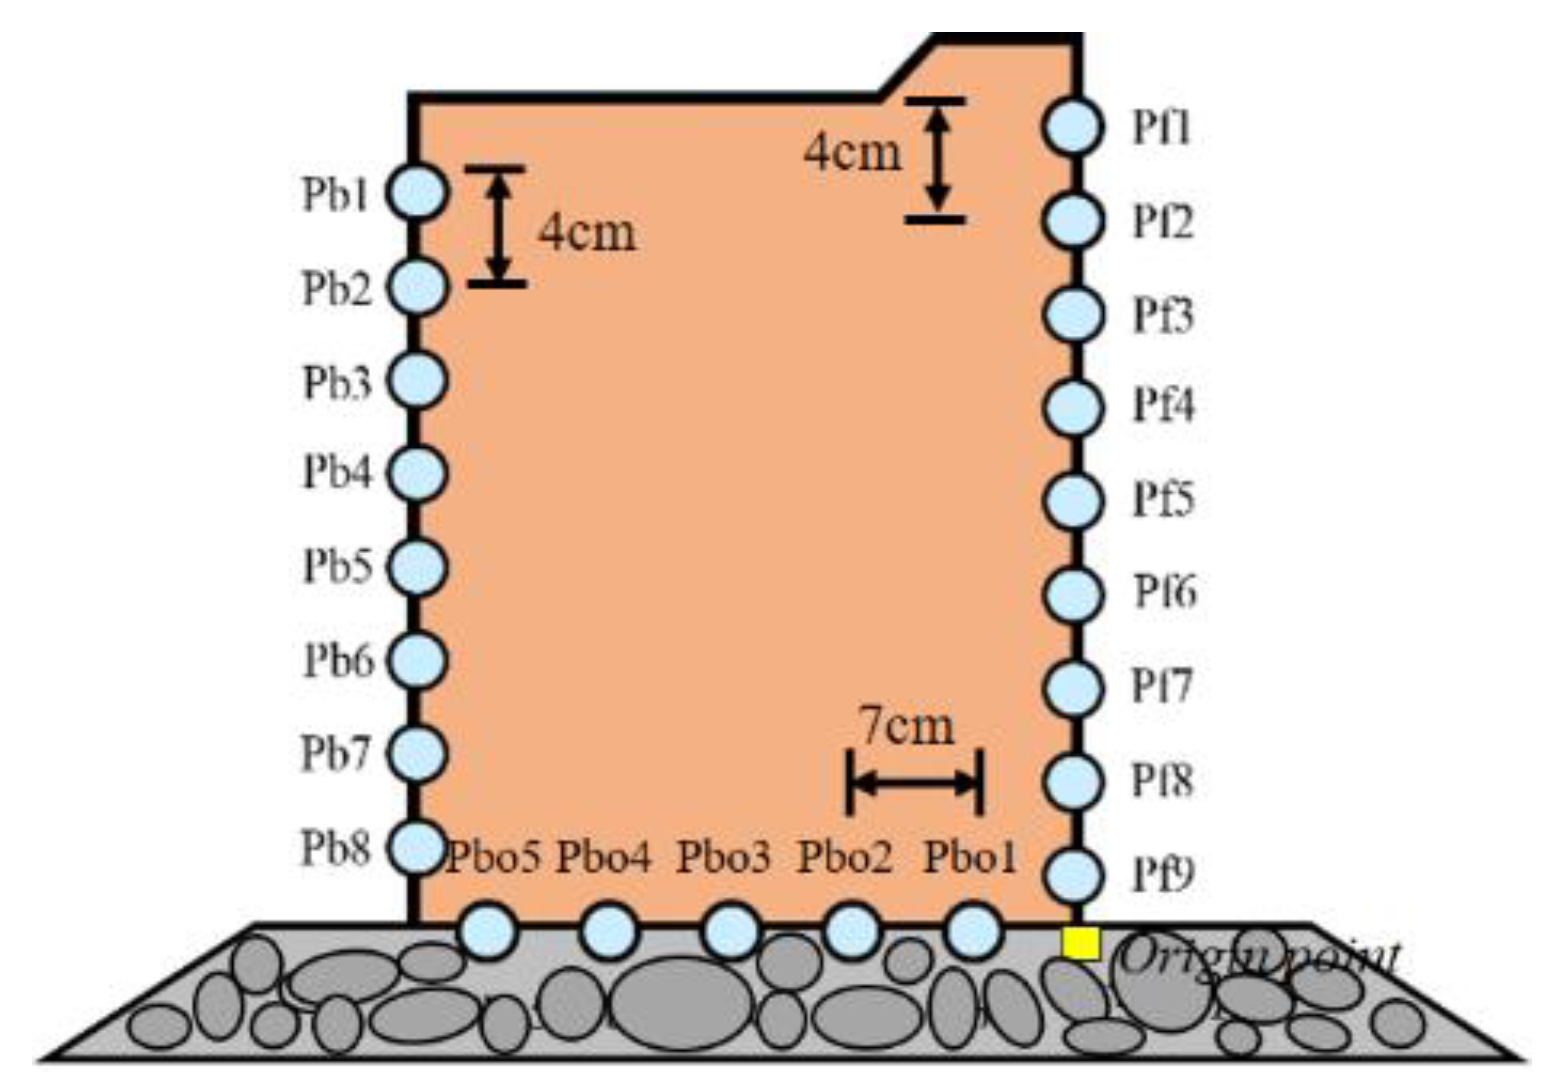
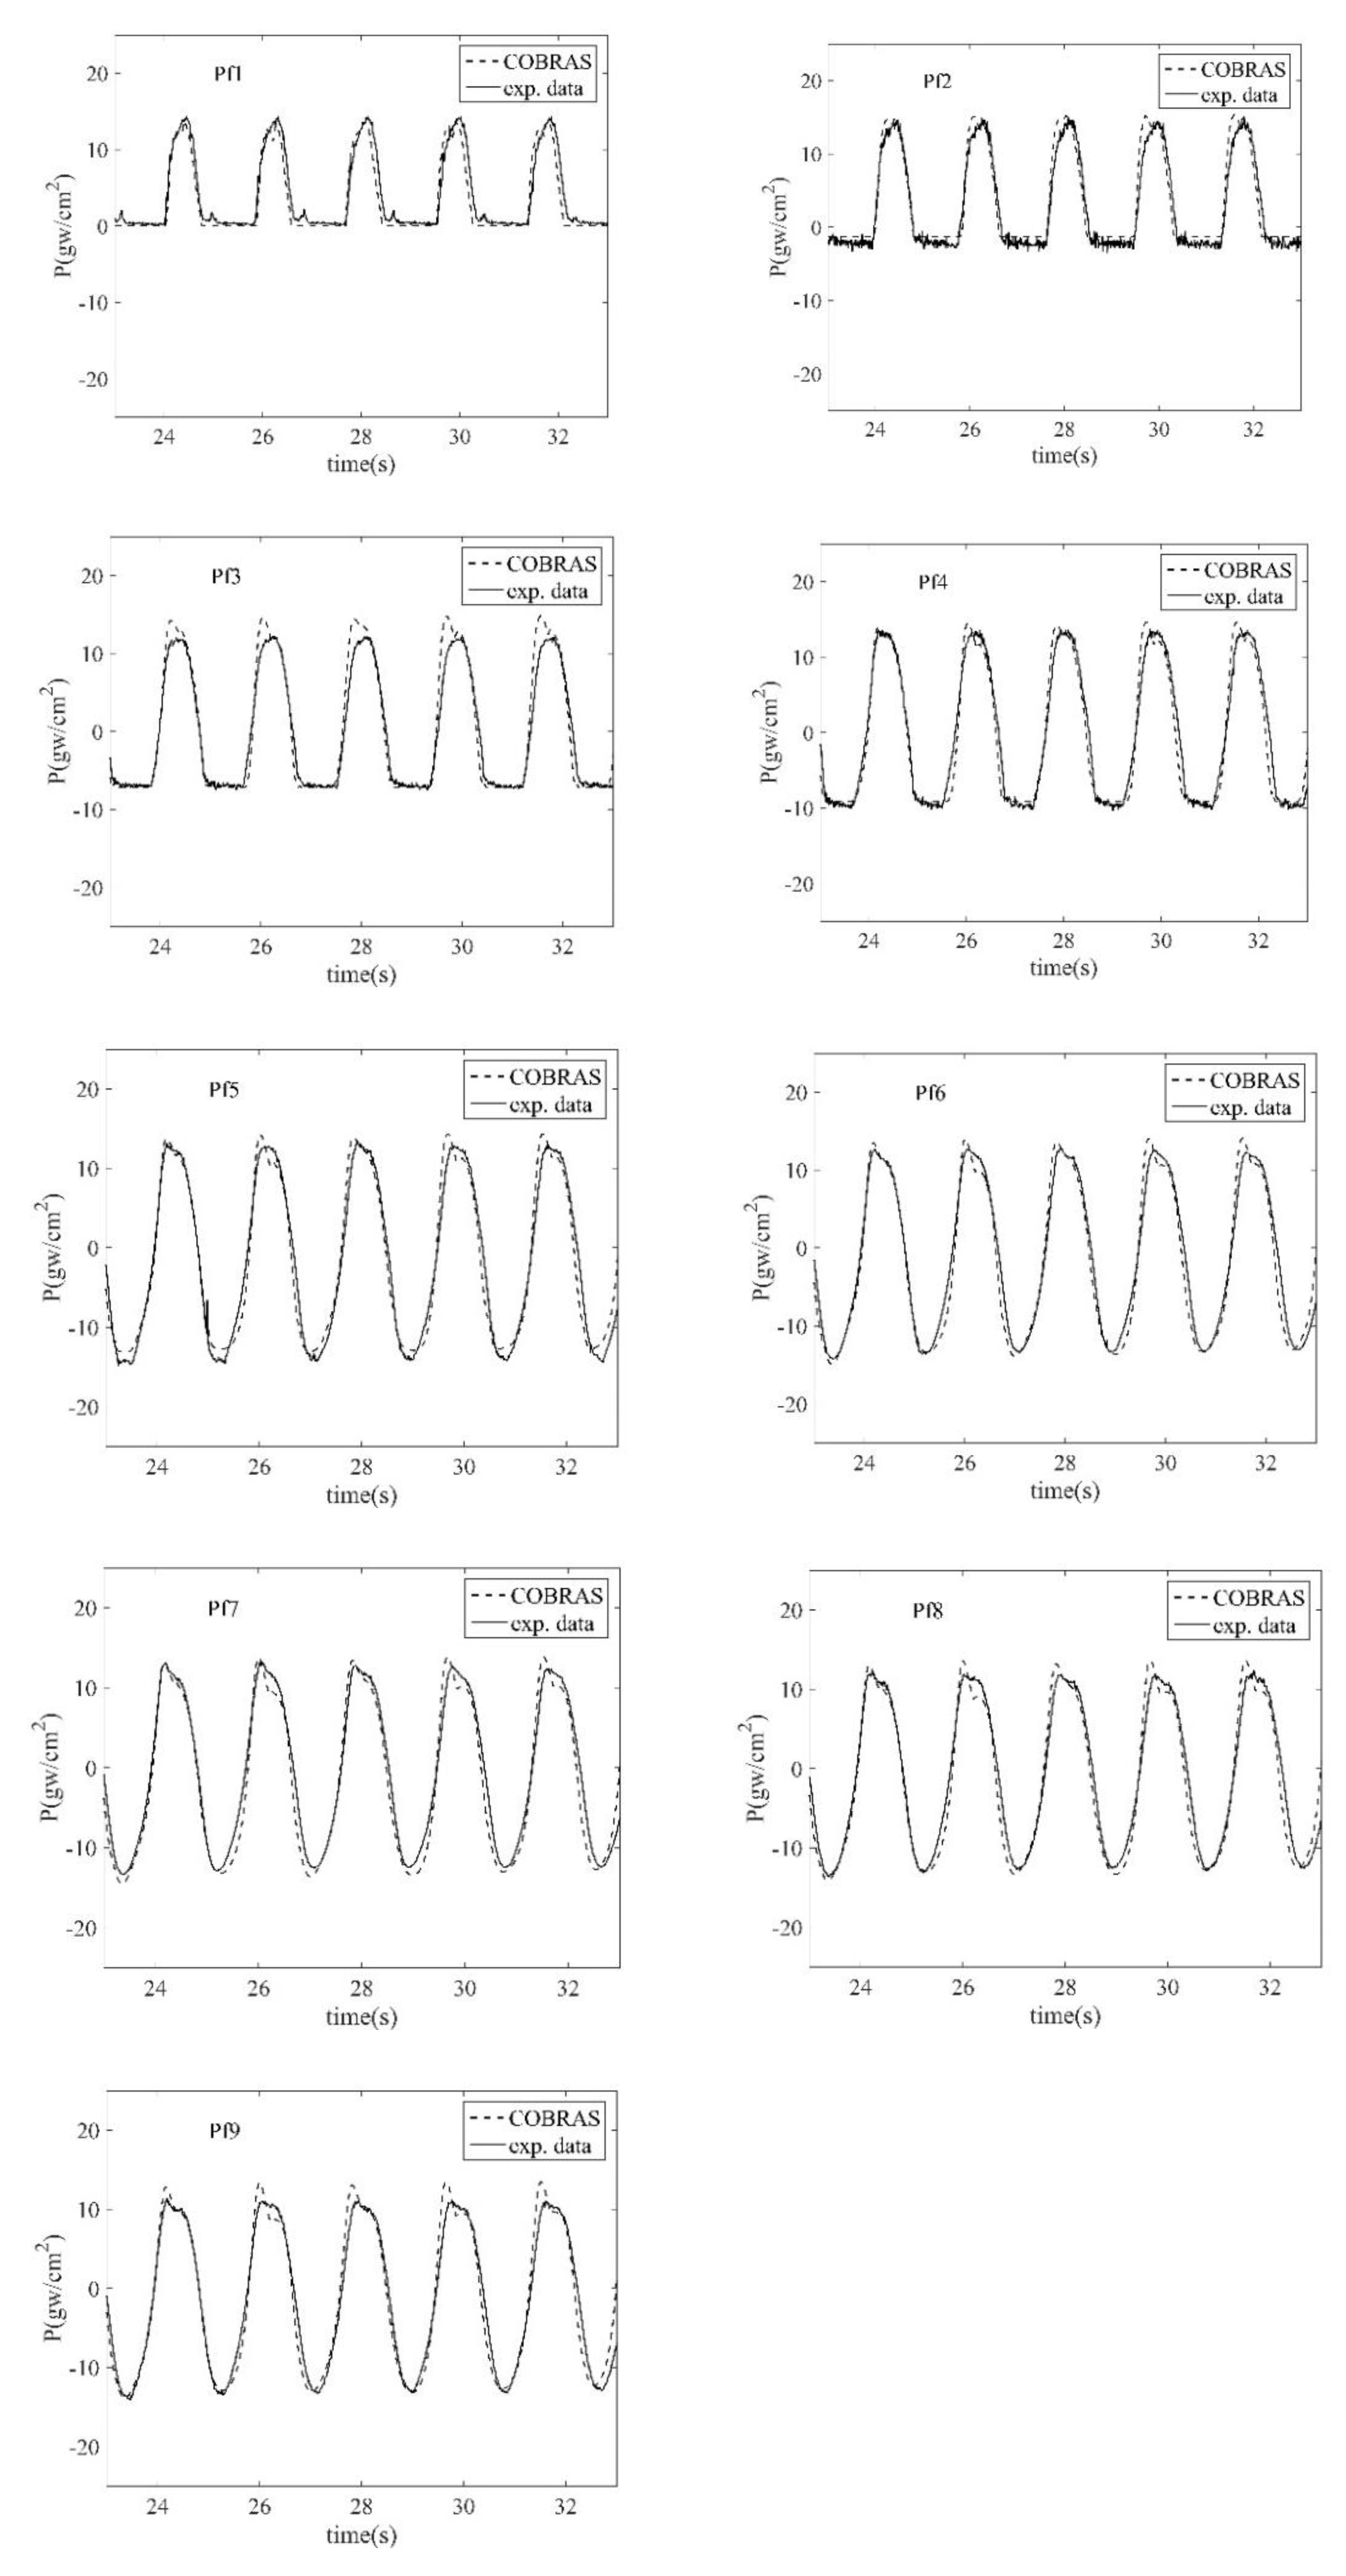
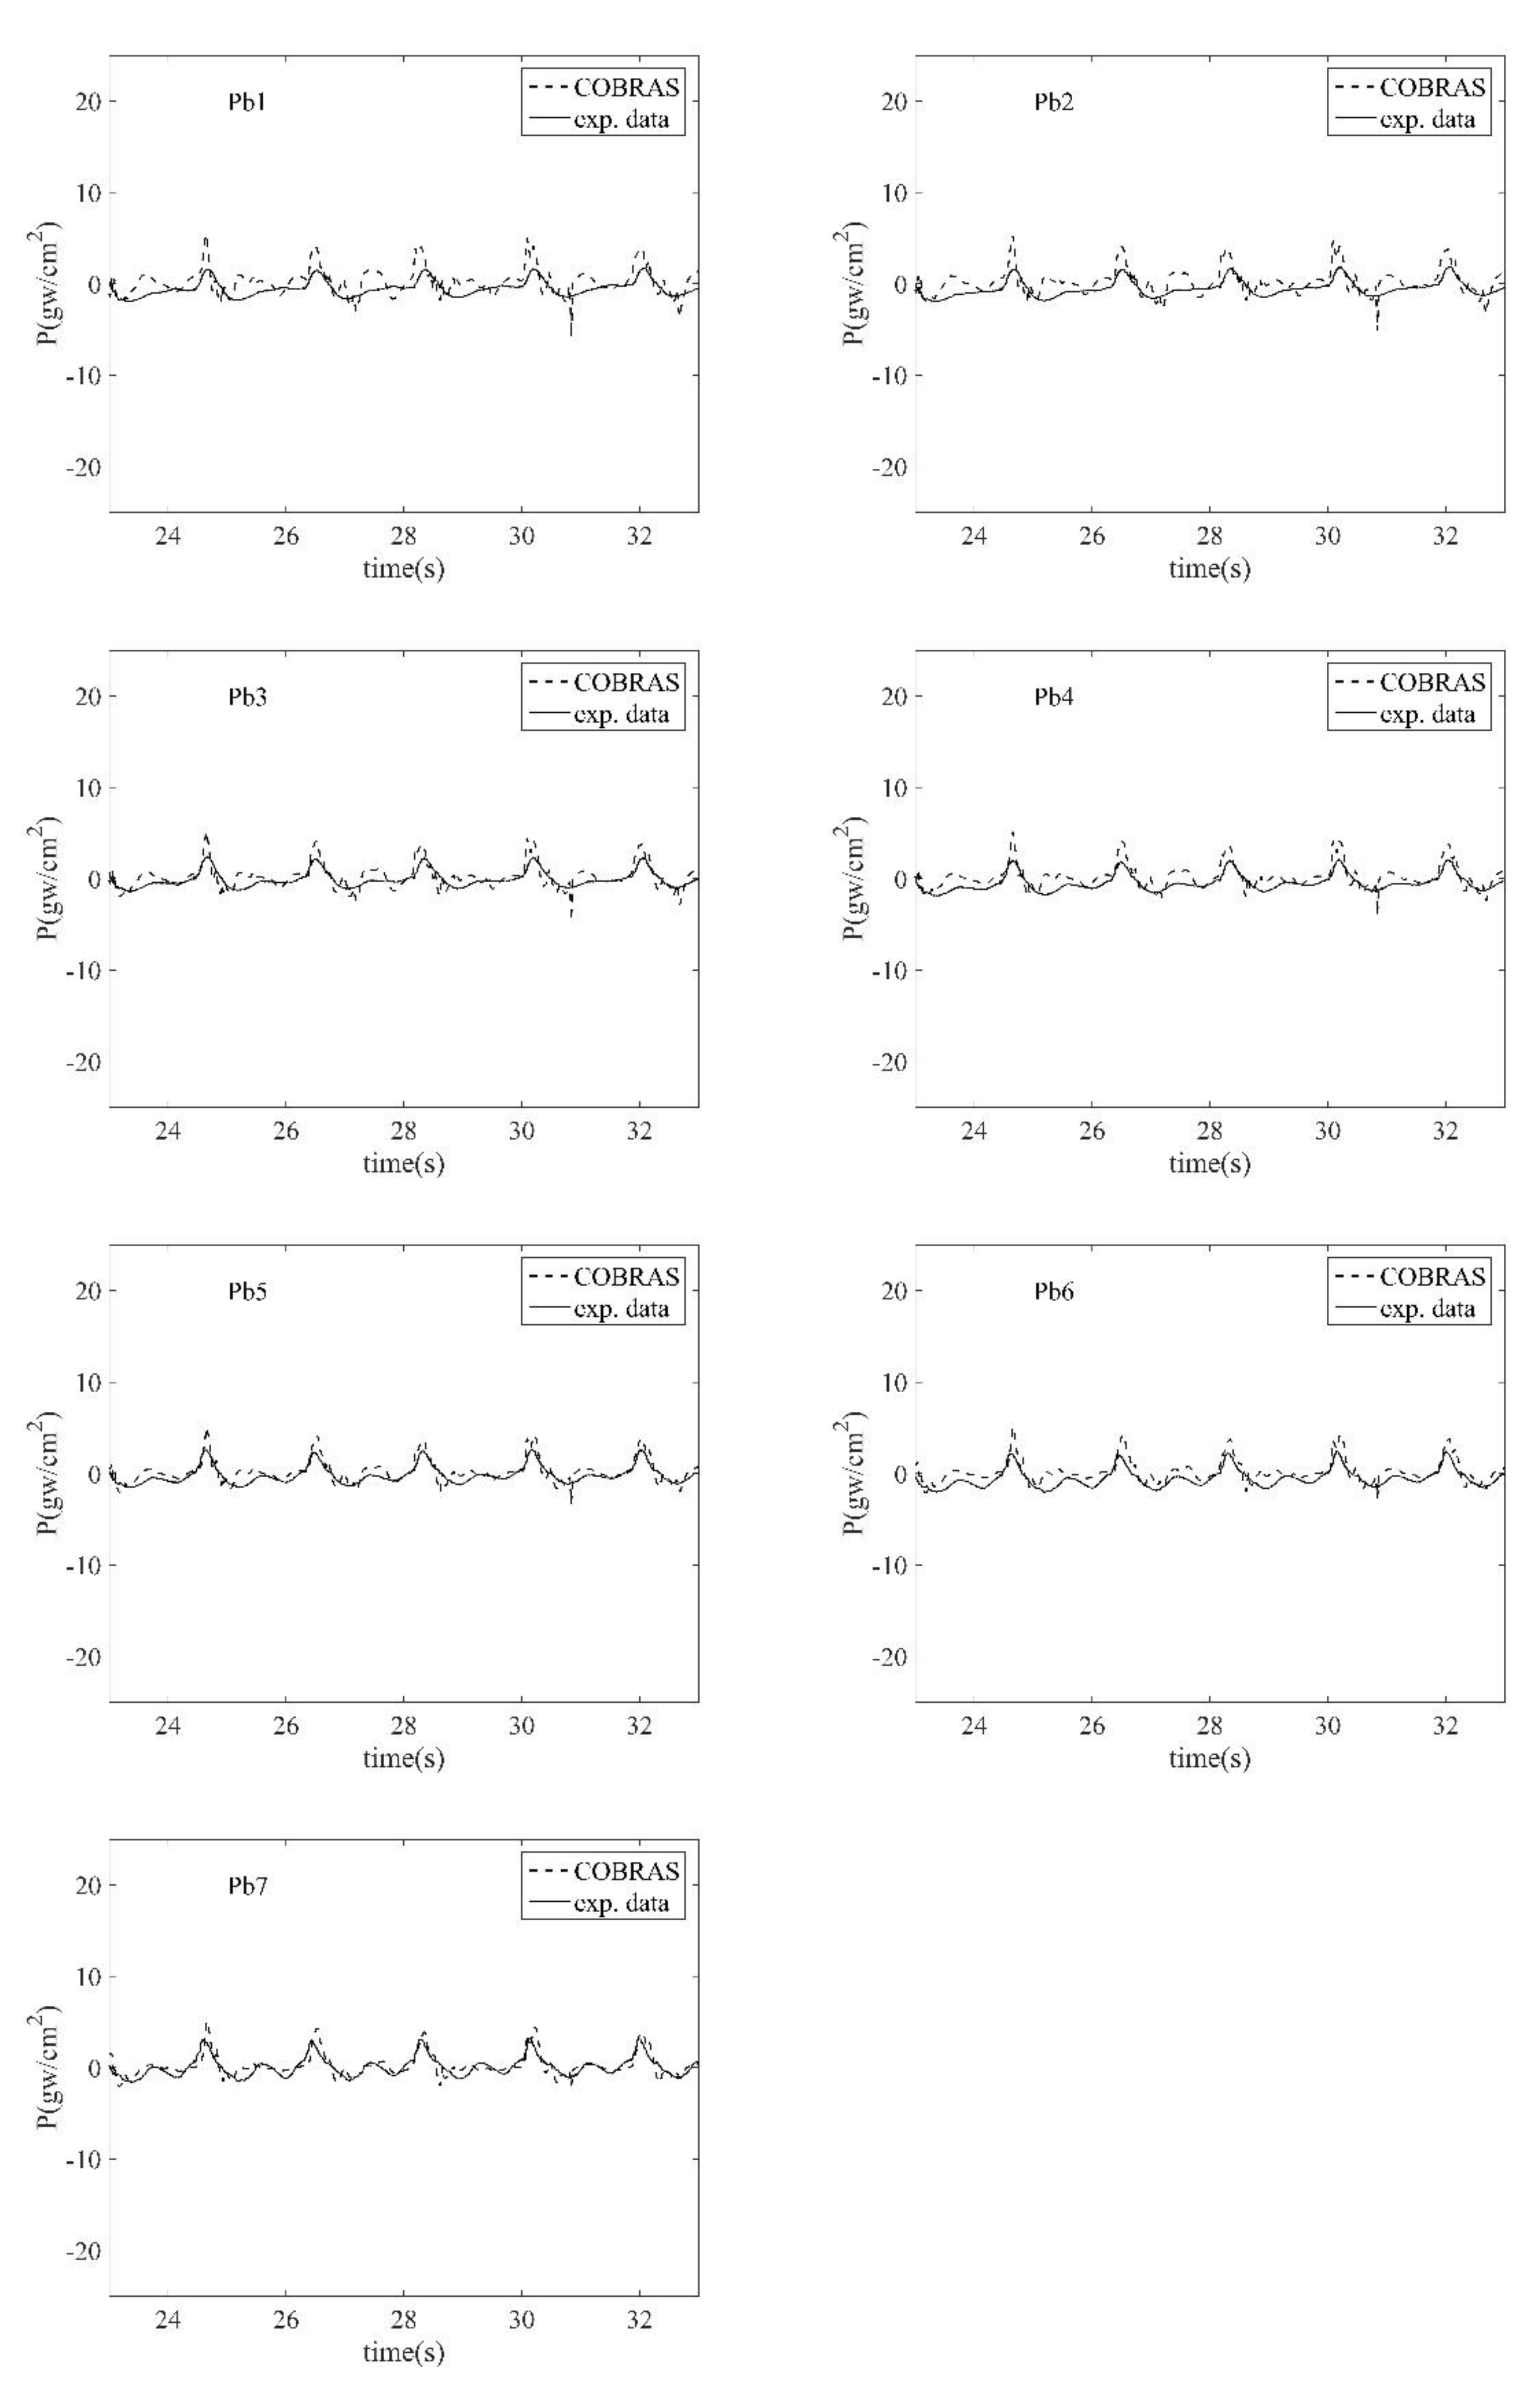
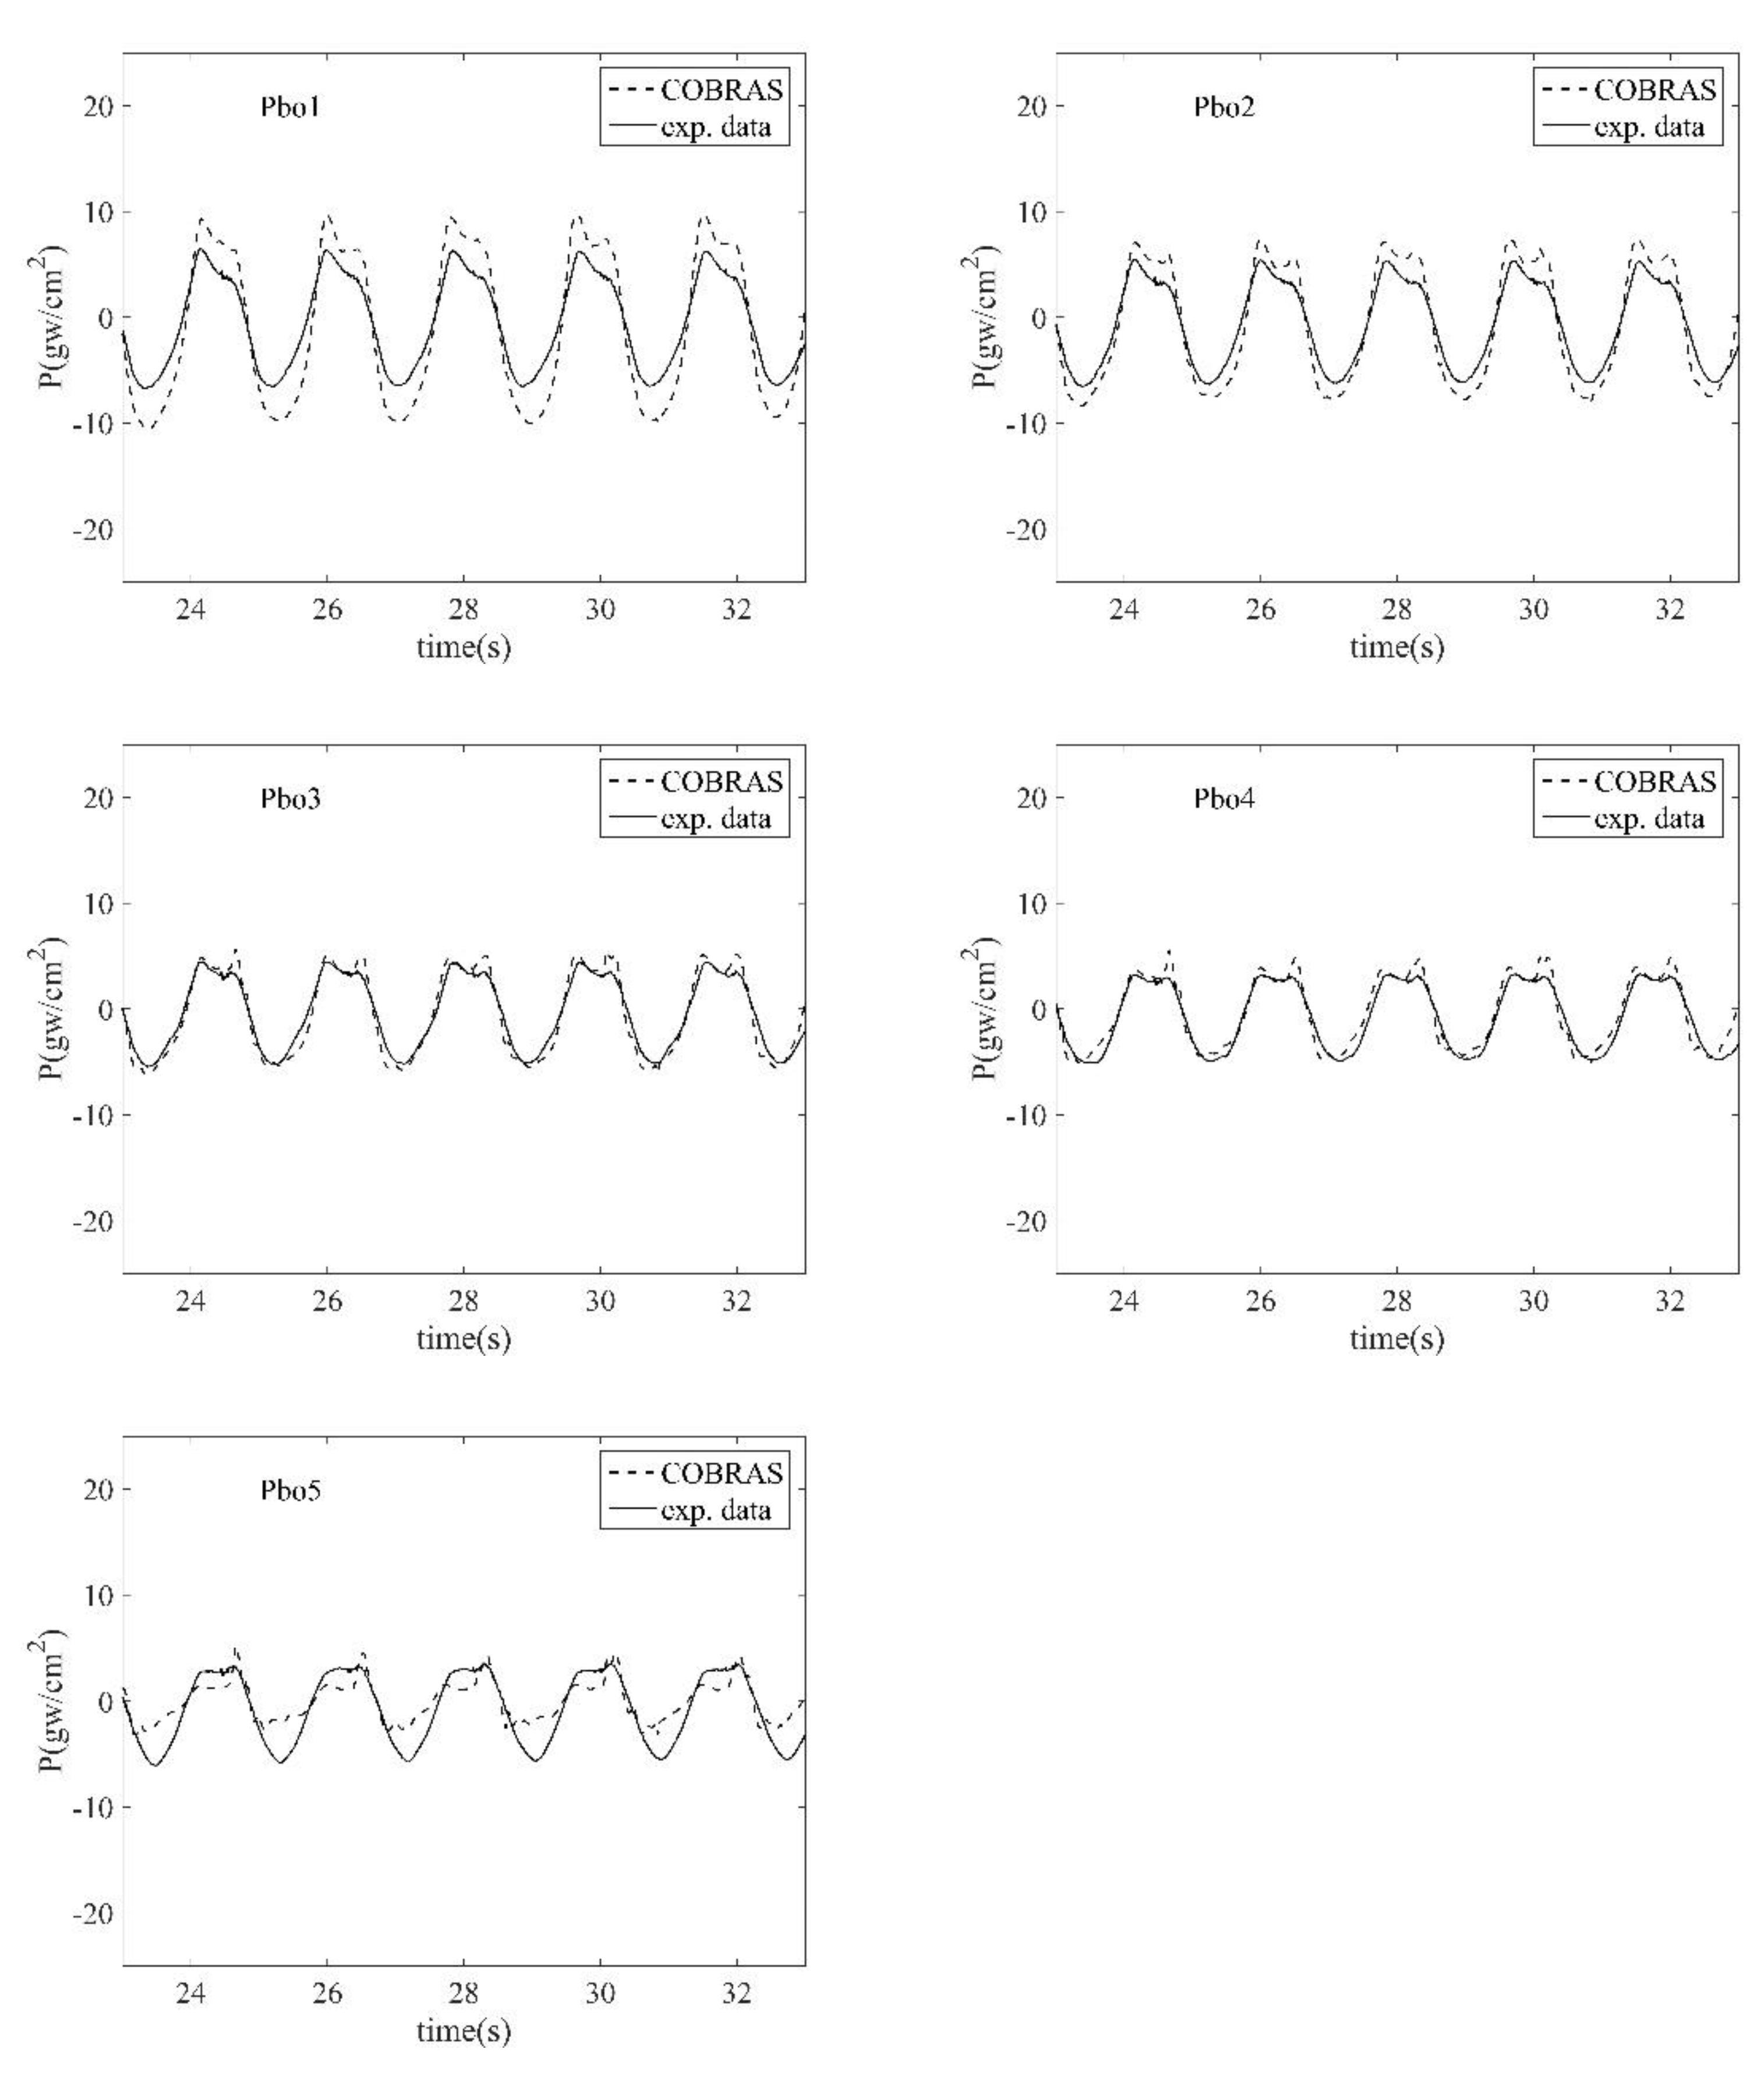
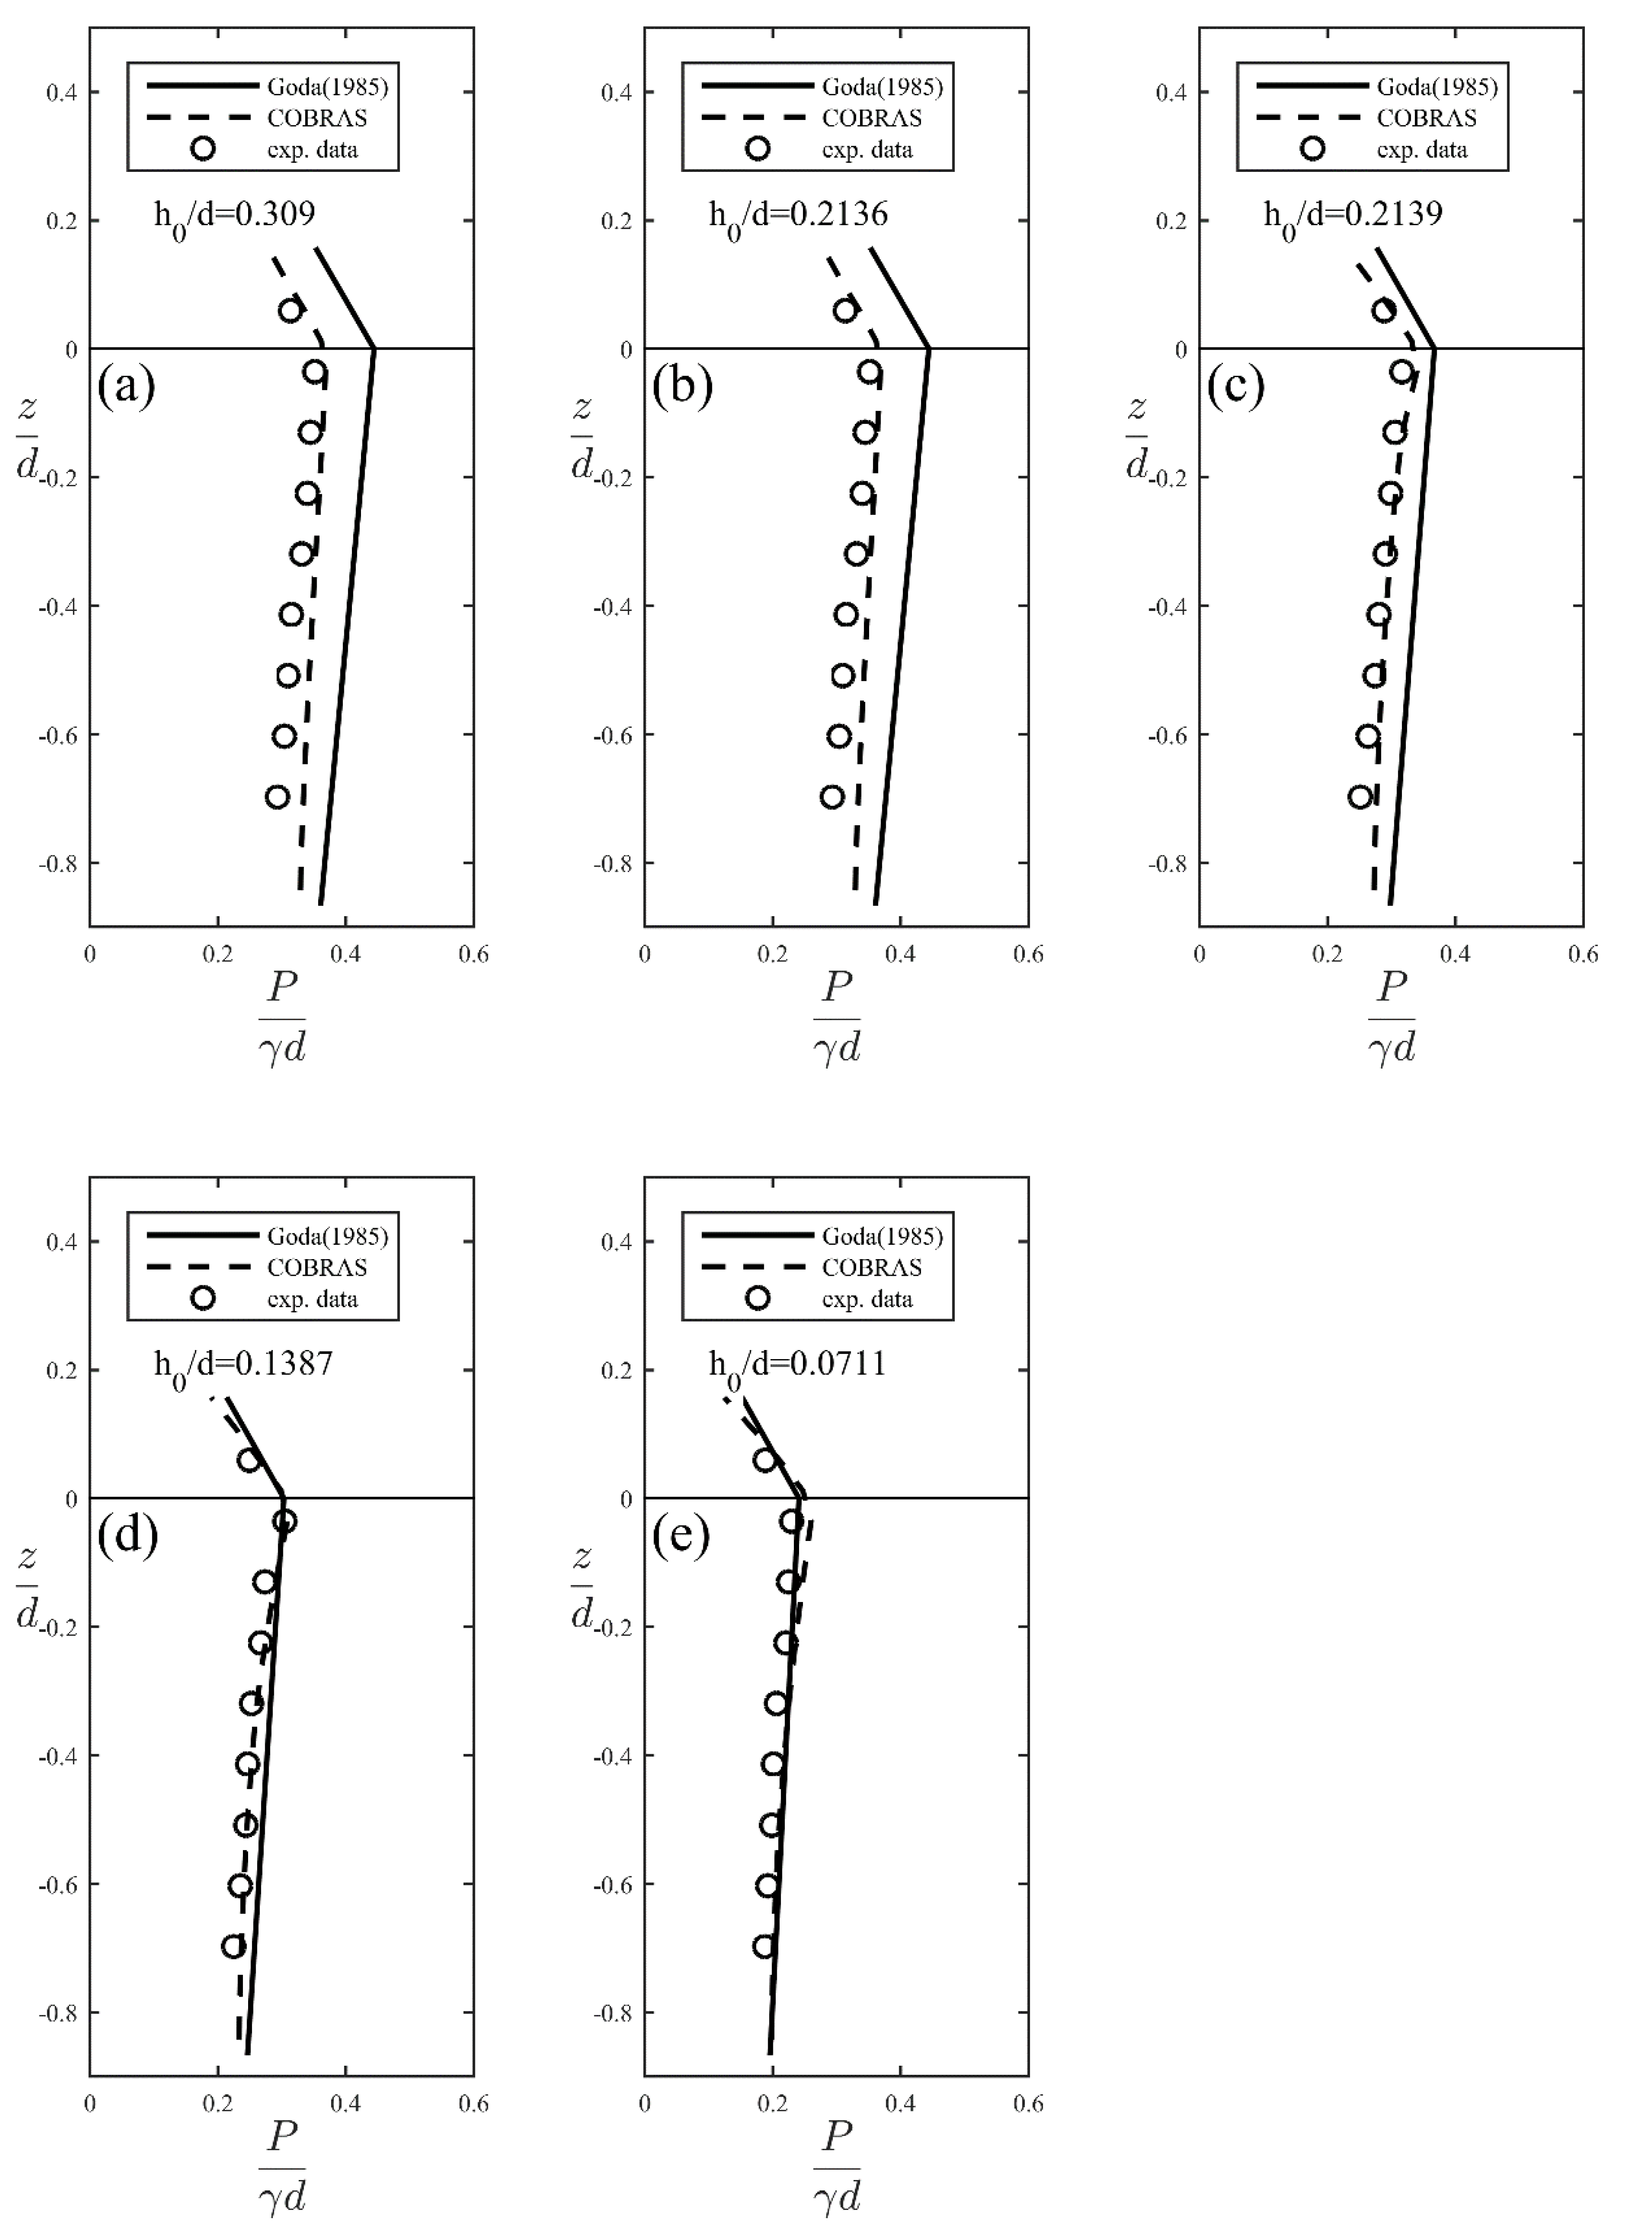
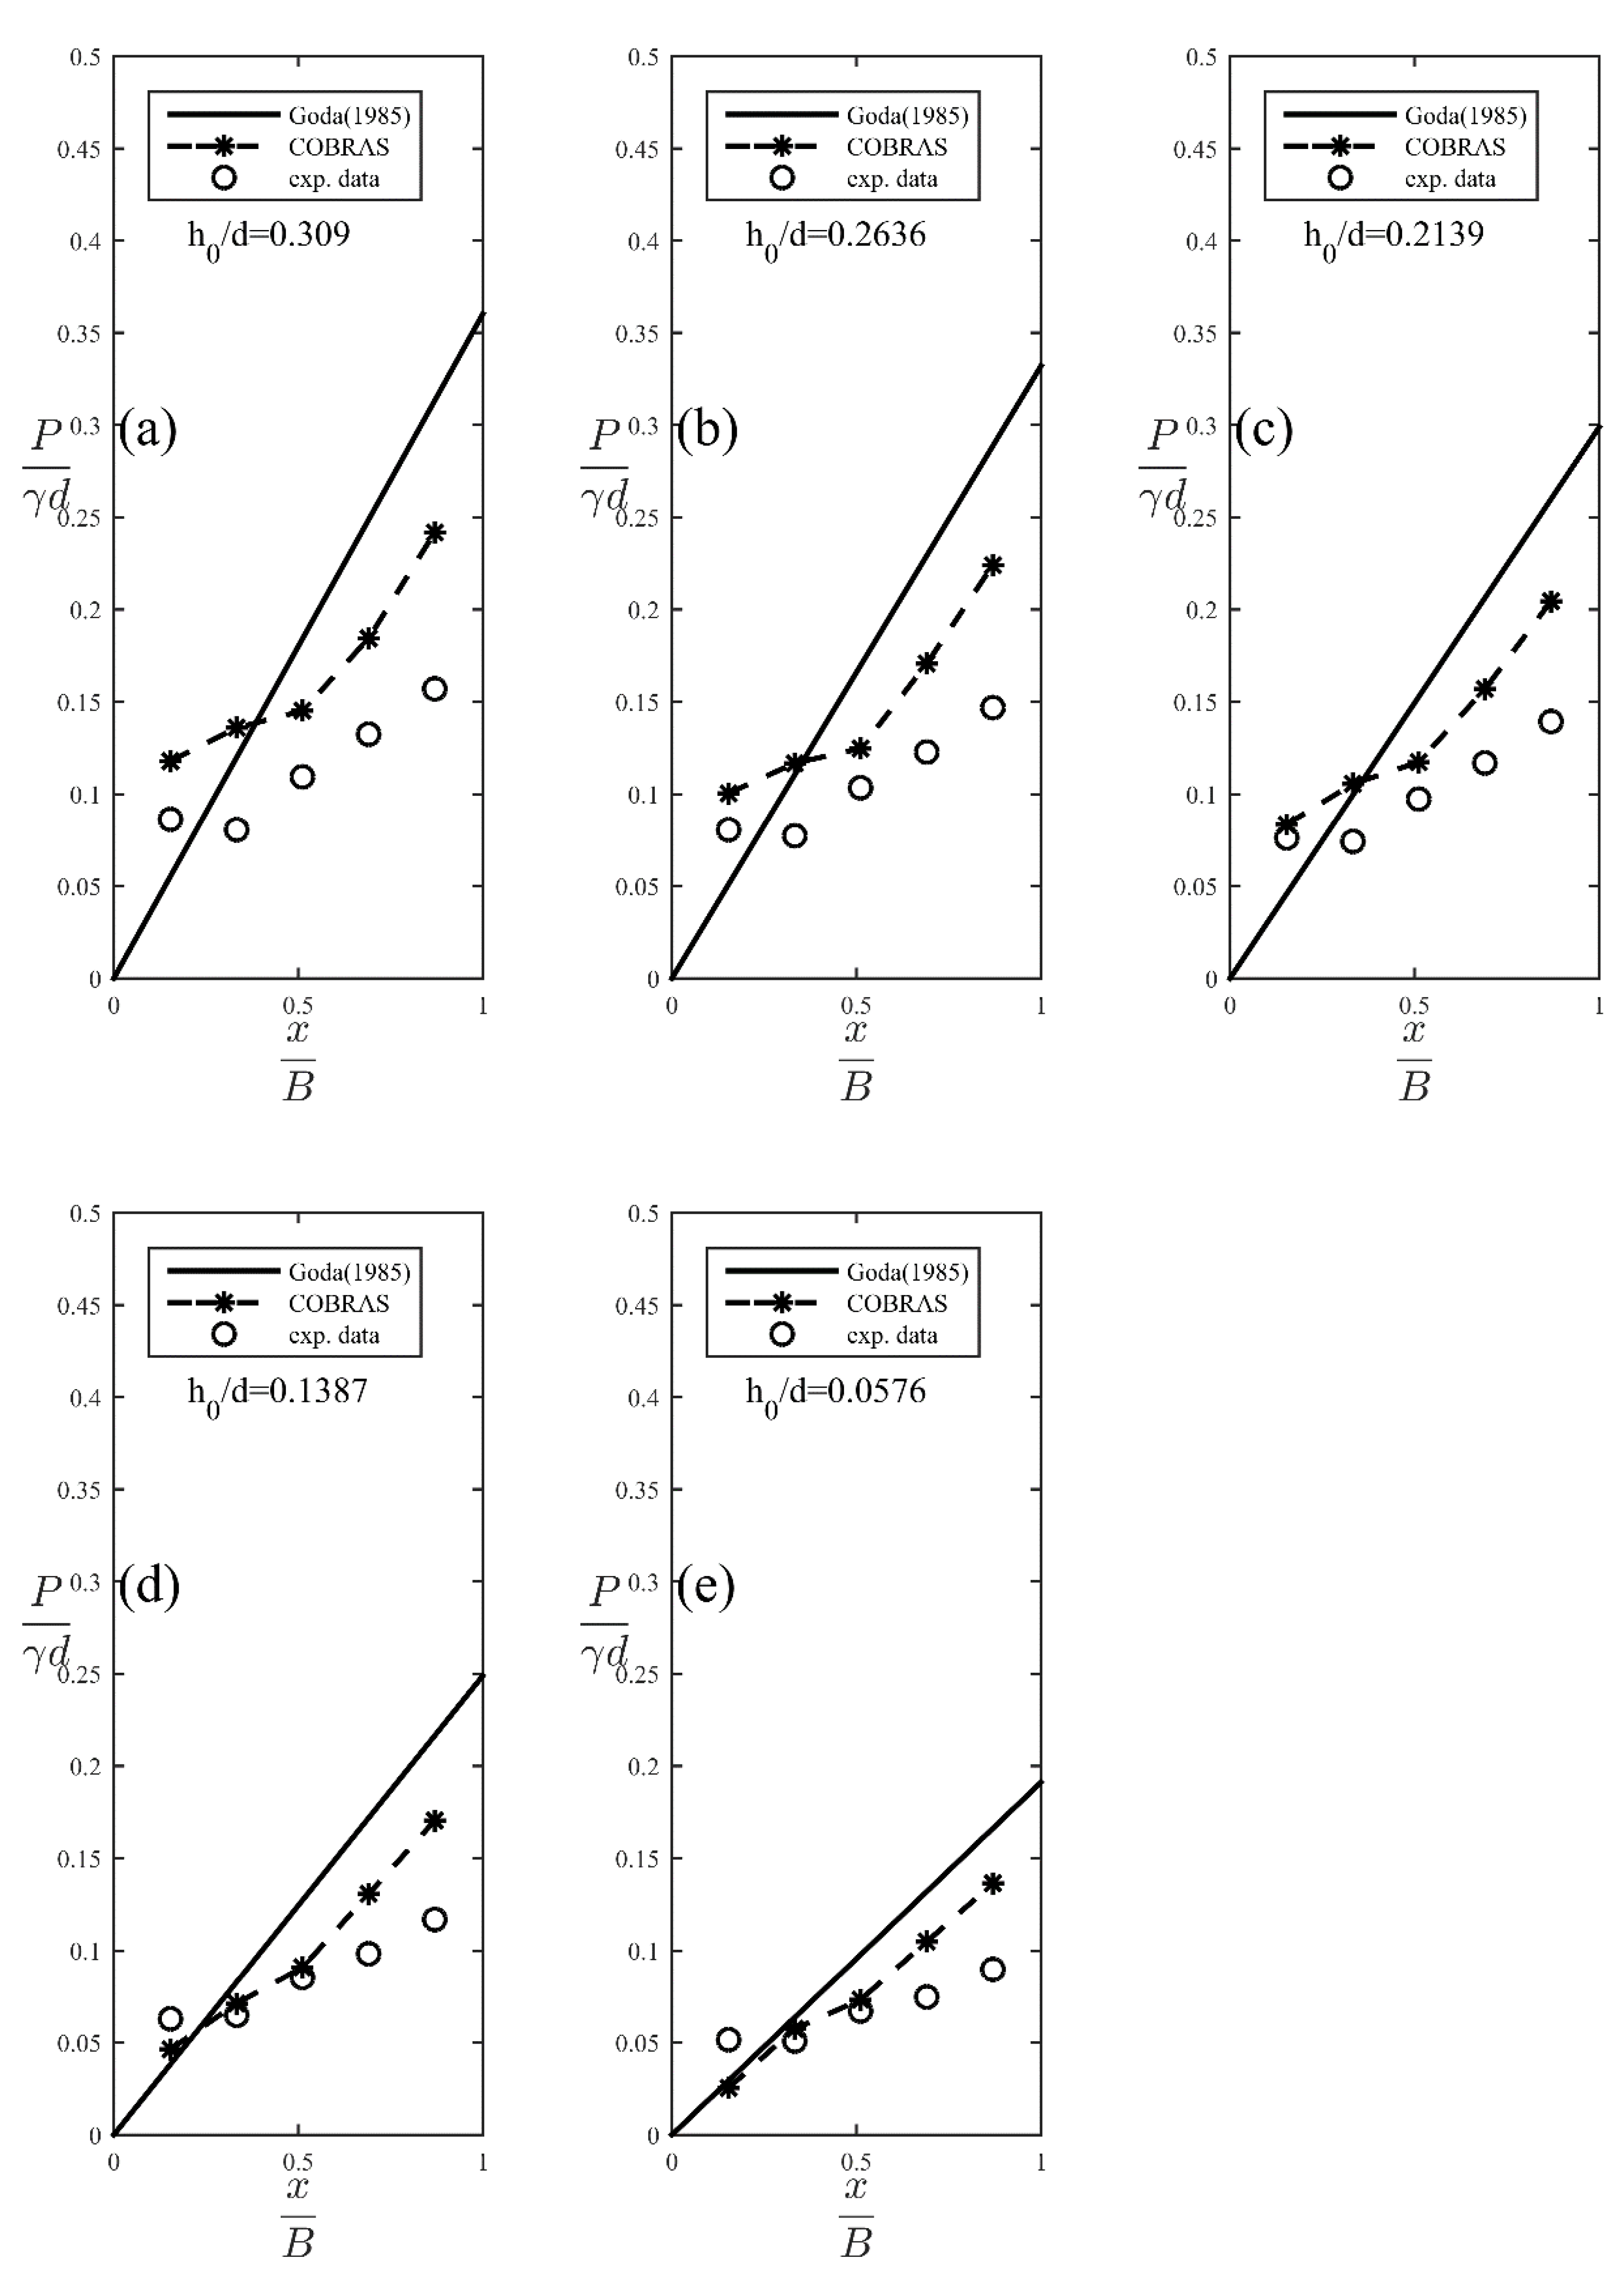
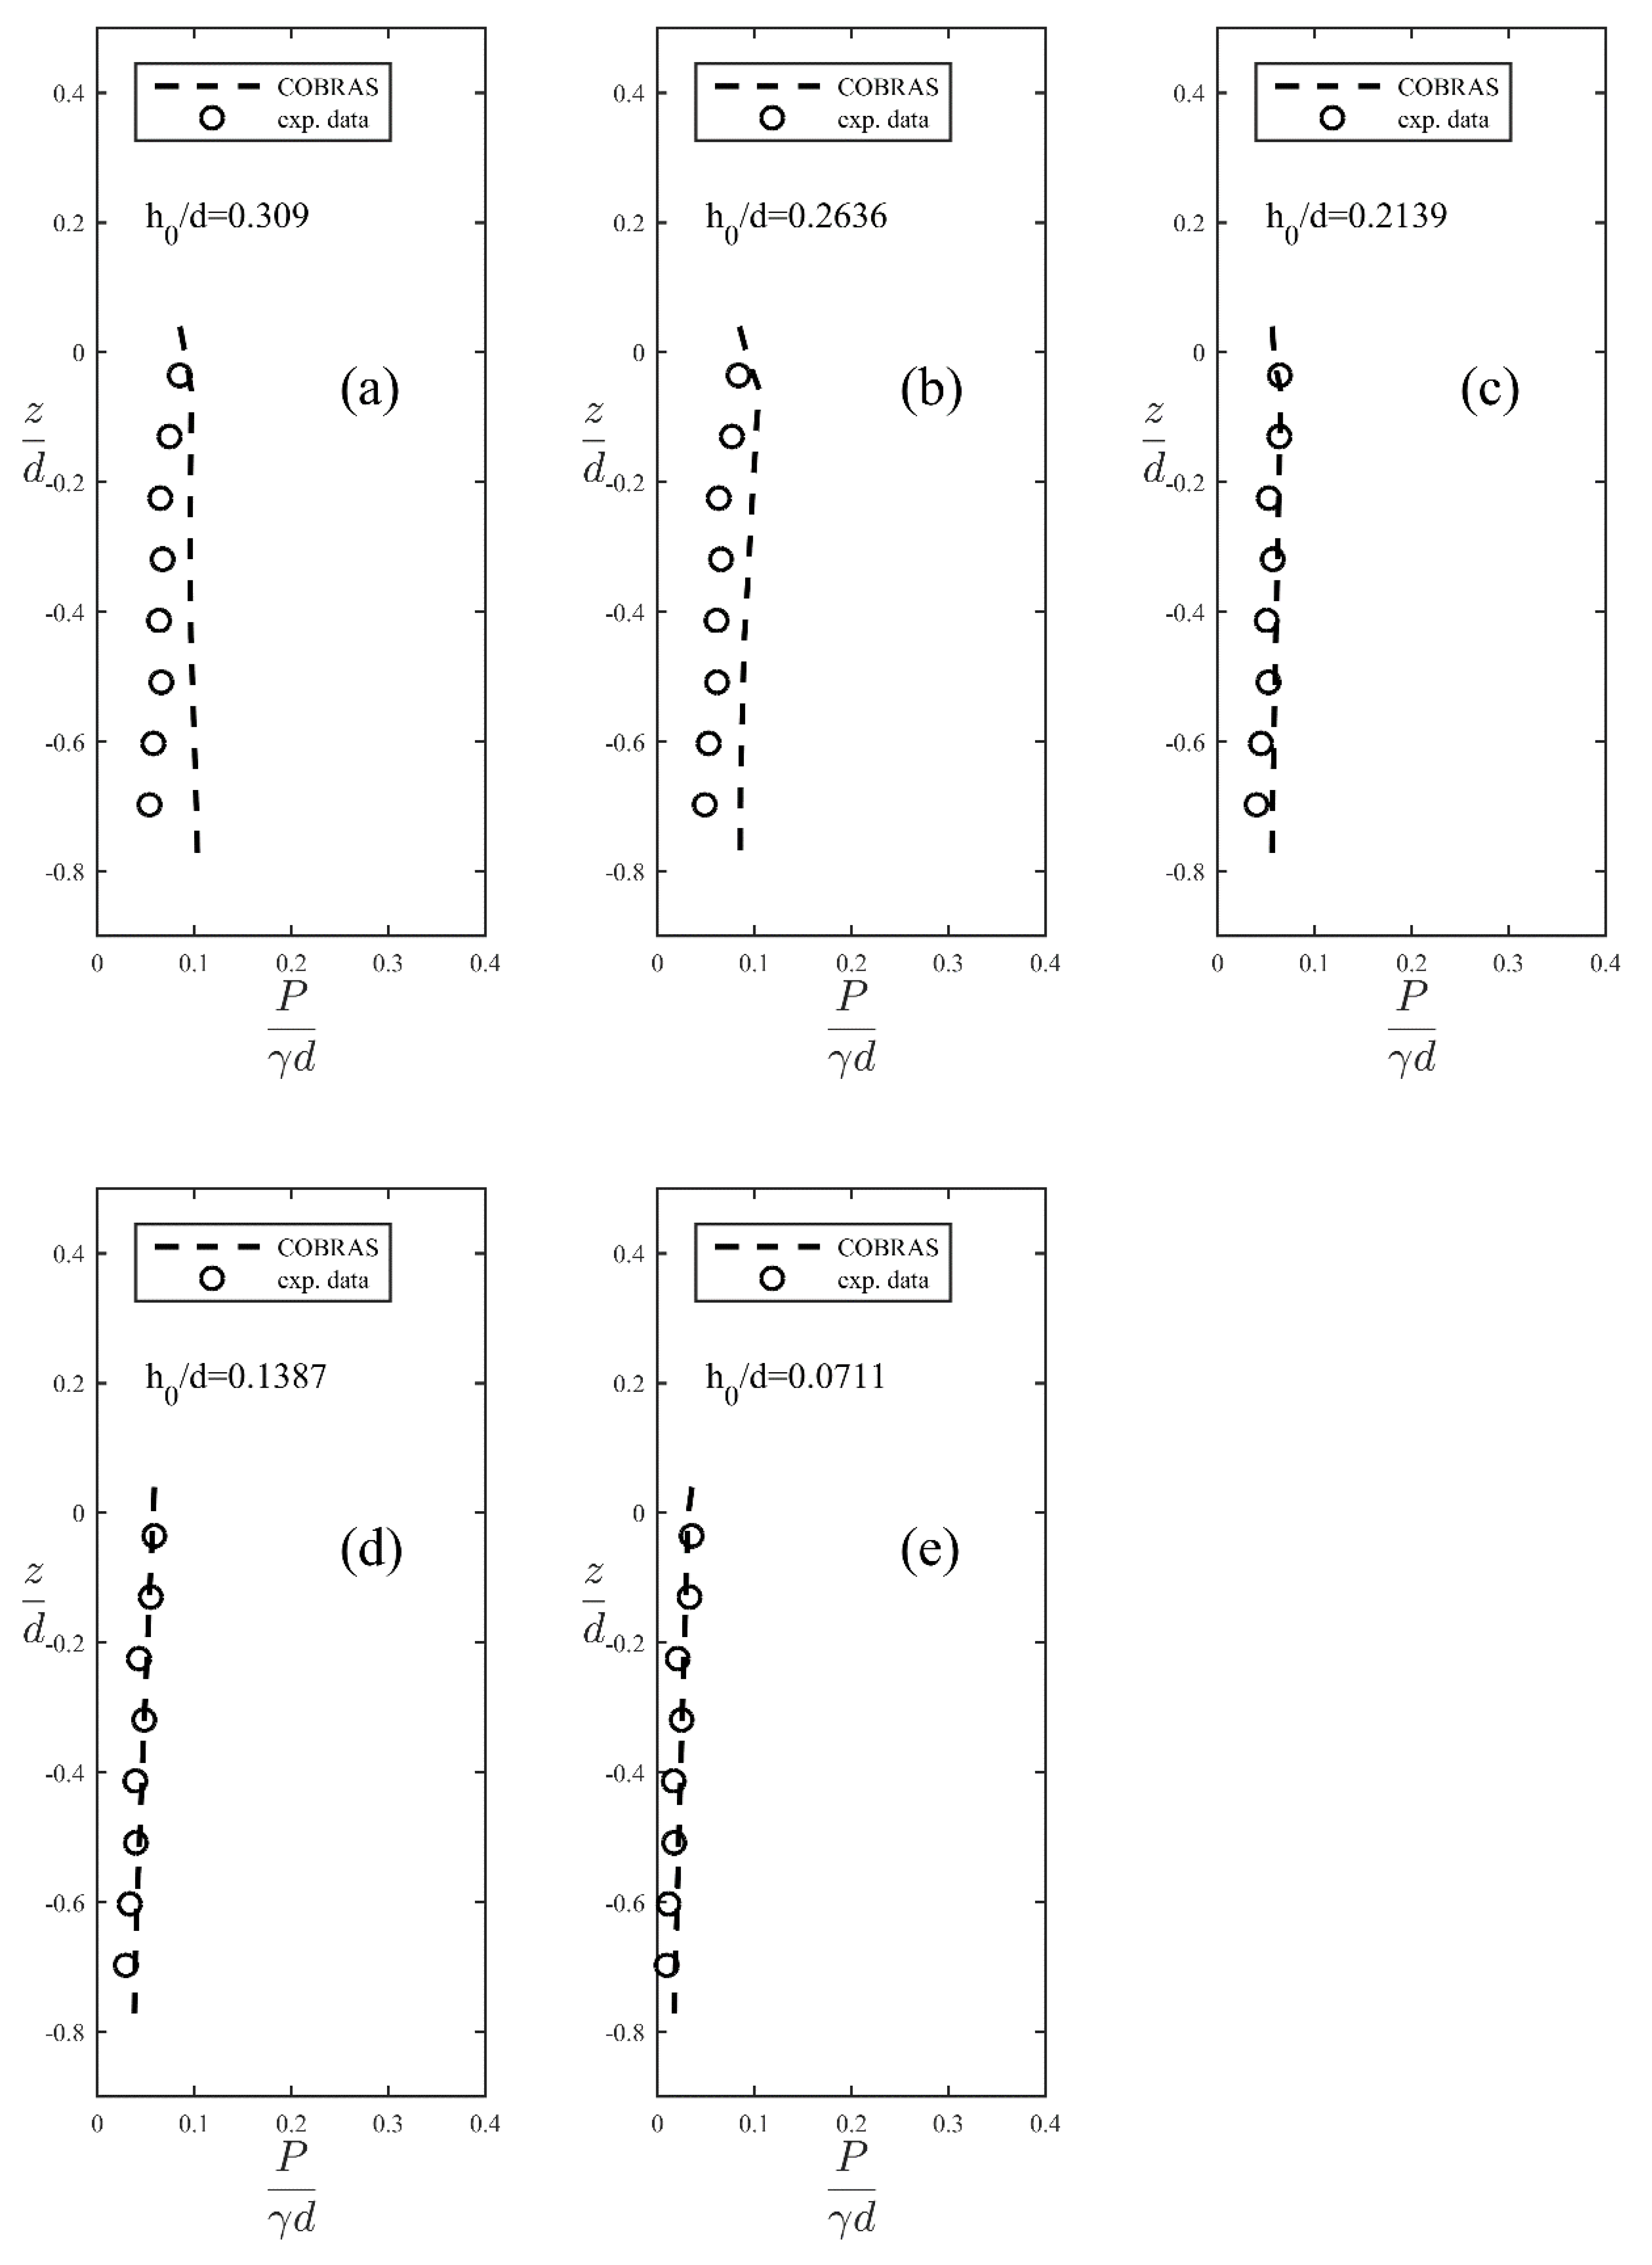
4.1. Dynamic Wave Pressure

Figure 5, Figure 6 and Figure 7 present a comparison of the simulated and measured time series of dynamic pressure at the front, rear and bottom faces of the caisson for a regular wave (wave height H = 22 cm, wave period T = 1.94 s). The readings from nine pressure transducers at the seaward face (Pf1–Pf9), seven pressure transducers at the landward face (Pb1–Pb7) and five pressure transducers below the caisson (Pbo1–Pbo5) were compared. The dashed line represents the numerical simulation, and the solid line represents the experimental measurements. In general, the model makes accurate predictions of the dynamic wave pressure at the front face of the caisson. However, it overestimated the dynamic wave pressure at the rear and bottom faces at the average errors of approximately 10% and 20%, respectively. This was caused by the difference in the formation of the overtopping wave jet and the porous medium below the caisson. The COBRAS model overestimated pressure spikes at certain locations where an overtopping wave jet and high aeration region were expected.
Interestingly, the bottom wave pressure had a double-peak distribution at some dimensionless locations (x/B), as shown in Figure 8, under three wave steepness conditions (H/L = 0.0383, 0.0425, and 0.0468), where x is the pressure gauge location with the original point located at the rear side of the caisson. B is the bottom width of the caisson. The wave steepness was positively associated with bottom wave pressure. When the wave steepness increased, the double-peak distribution of the bottom wave pressure became more obvious.
The maximum wave pressures along the different faces of the caisson, as obtained from the experiments, numerical simulations, and Goda’s formula [26], were plotted against each other in Figure 9, Figure 10 and Figure 11 for various dimensionless overtopping heights (h0/d), where h0 is the height of the overtopping wave that was measured by wave gauges WG06 and d is the still water depth. The numerical simulation results exhibited good agreement with the experimental data. It shows that Goda’s formula yielded estimates that were larger than the experimental data. The results indicated that Goda’s formula overestimated predictions of the maximum forces on the front and bottom faces in cases of large wave steepness and overtopping waves. Previous studies have considered wave pressures on only the seaward and bottom faces of the caisson. Information is scarce to consider the forces acting on the landward side of a breakwater. The experiment in this study shows that it is important to calculate the total horizontal force. The experiment showed the occurrence of a horizontal force on the backward side of a vertical structure for wave overtopping, and the COBRAS model can predict the dynamic wave pressures on different faces of the breakwater.

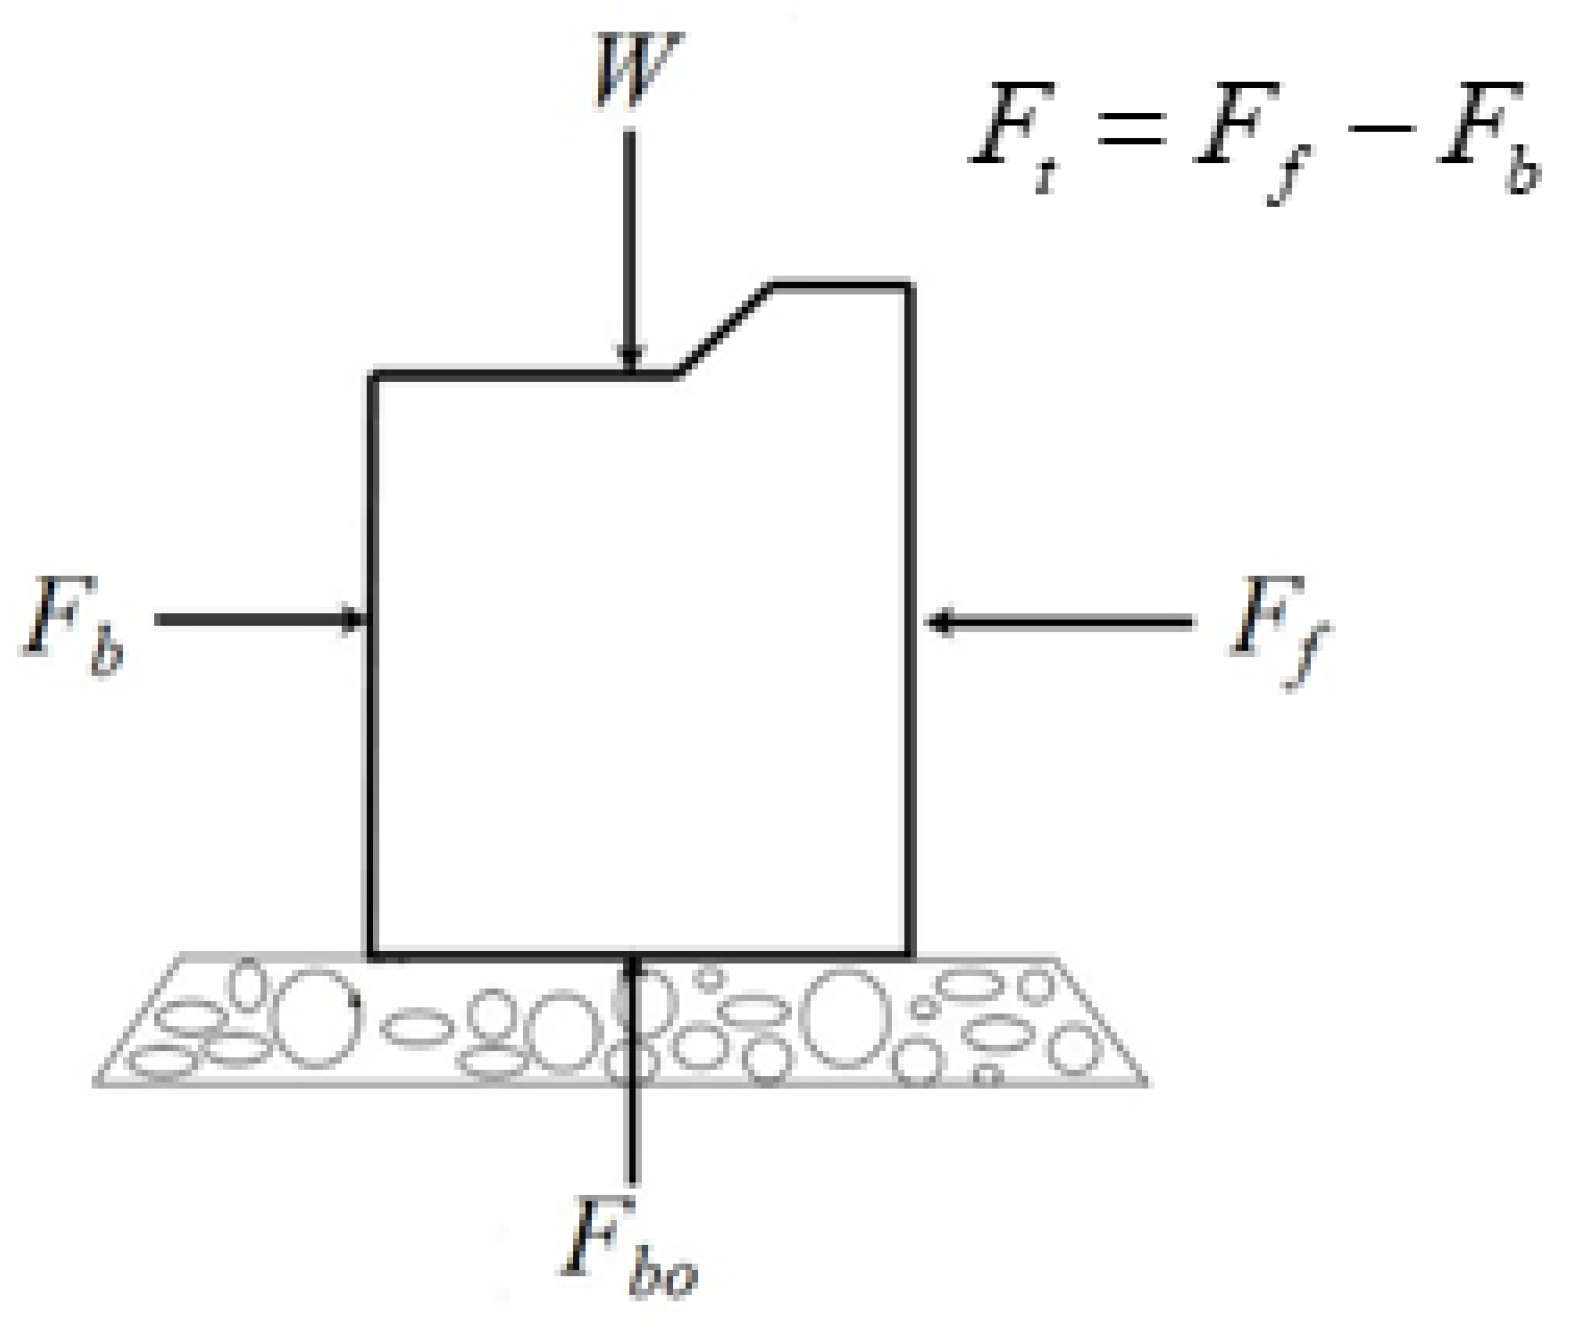
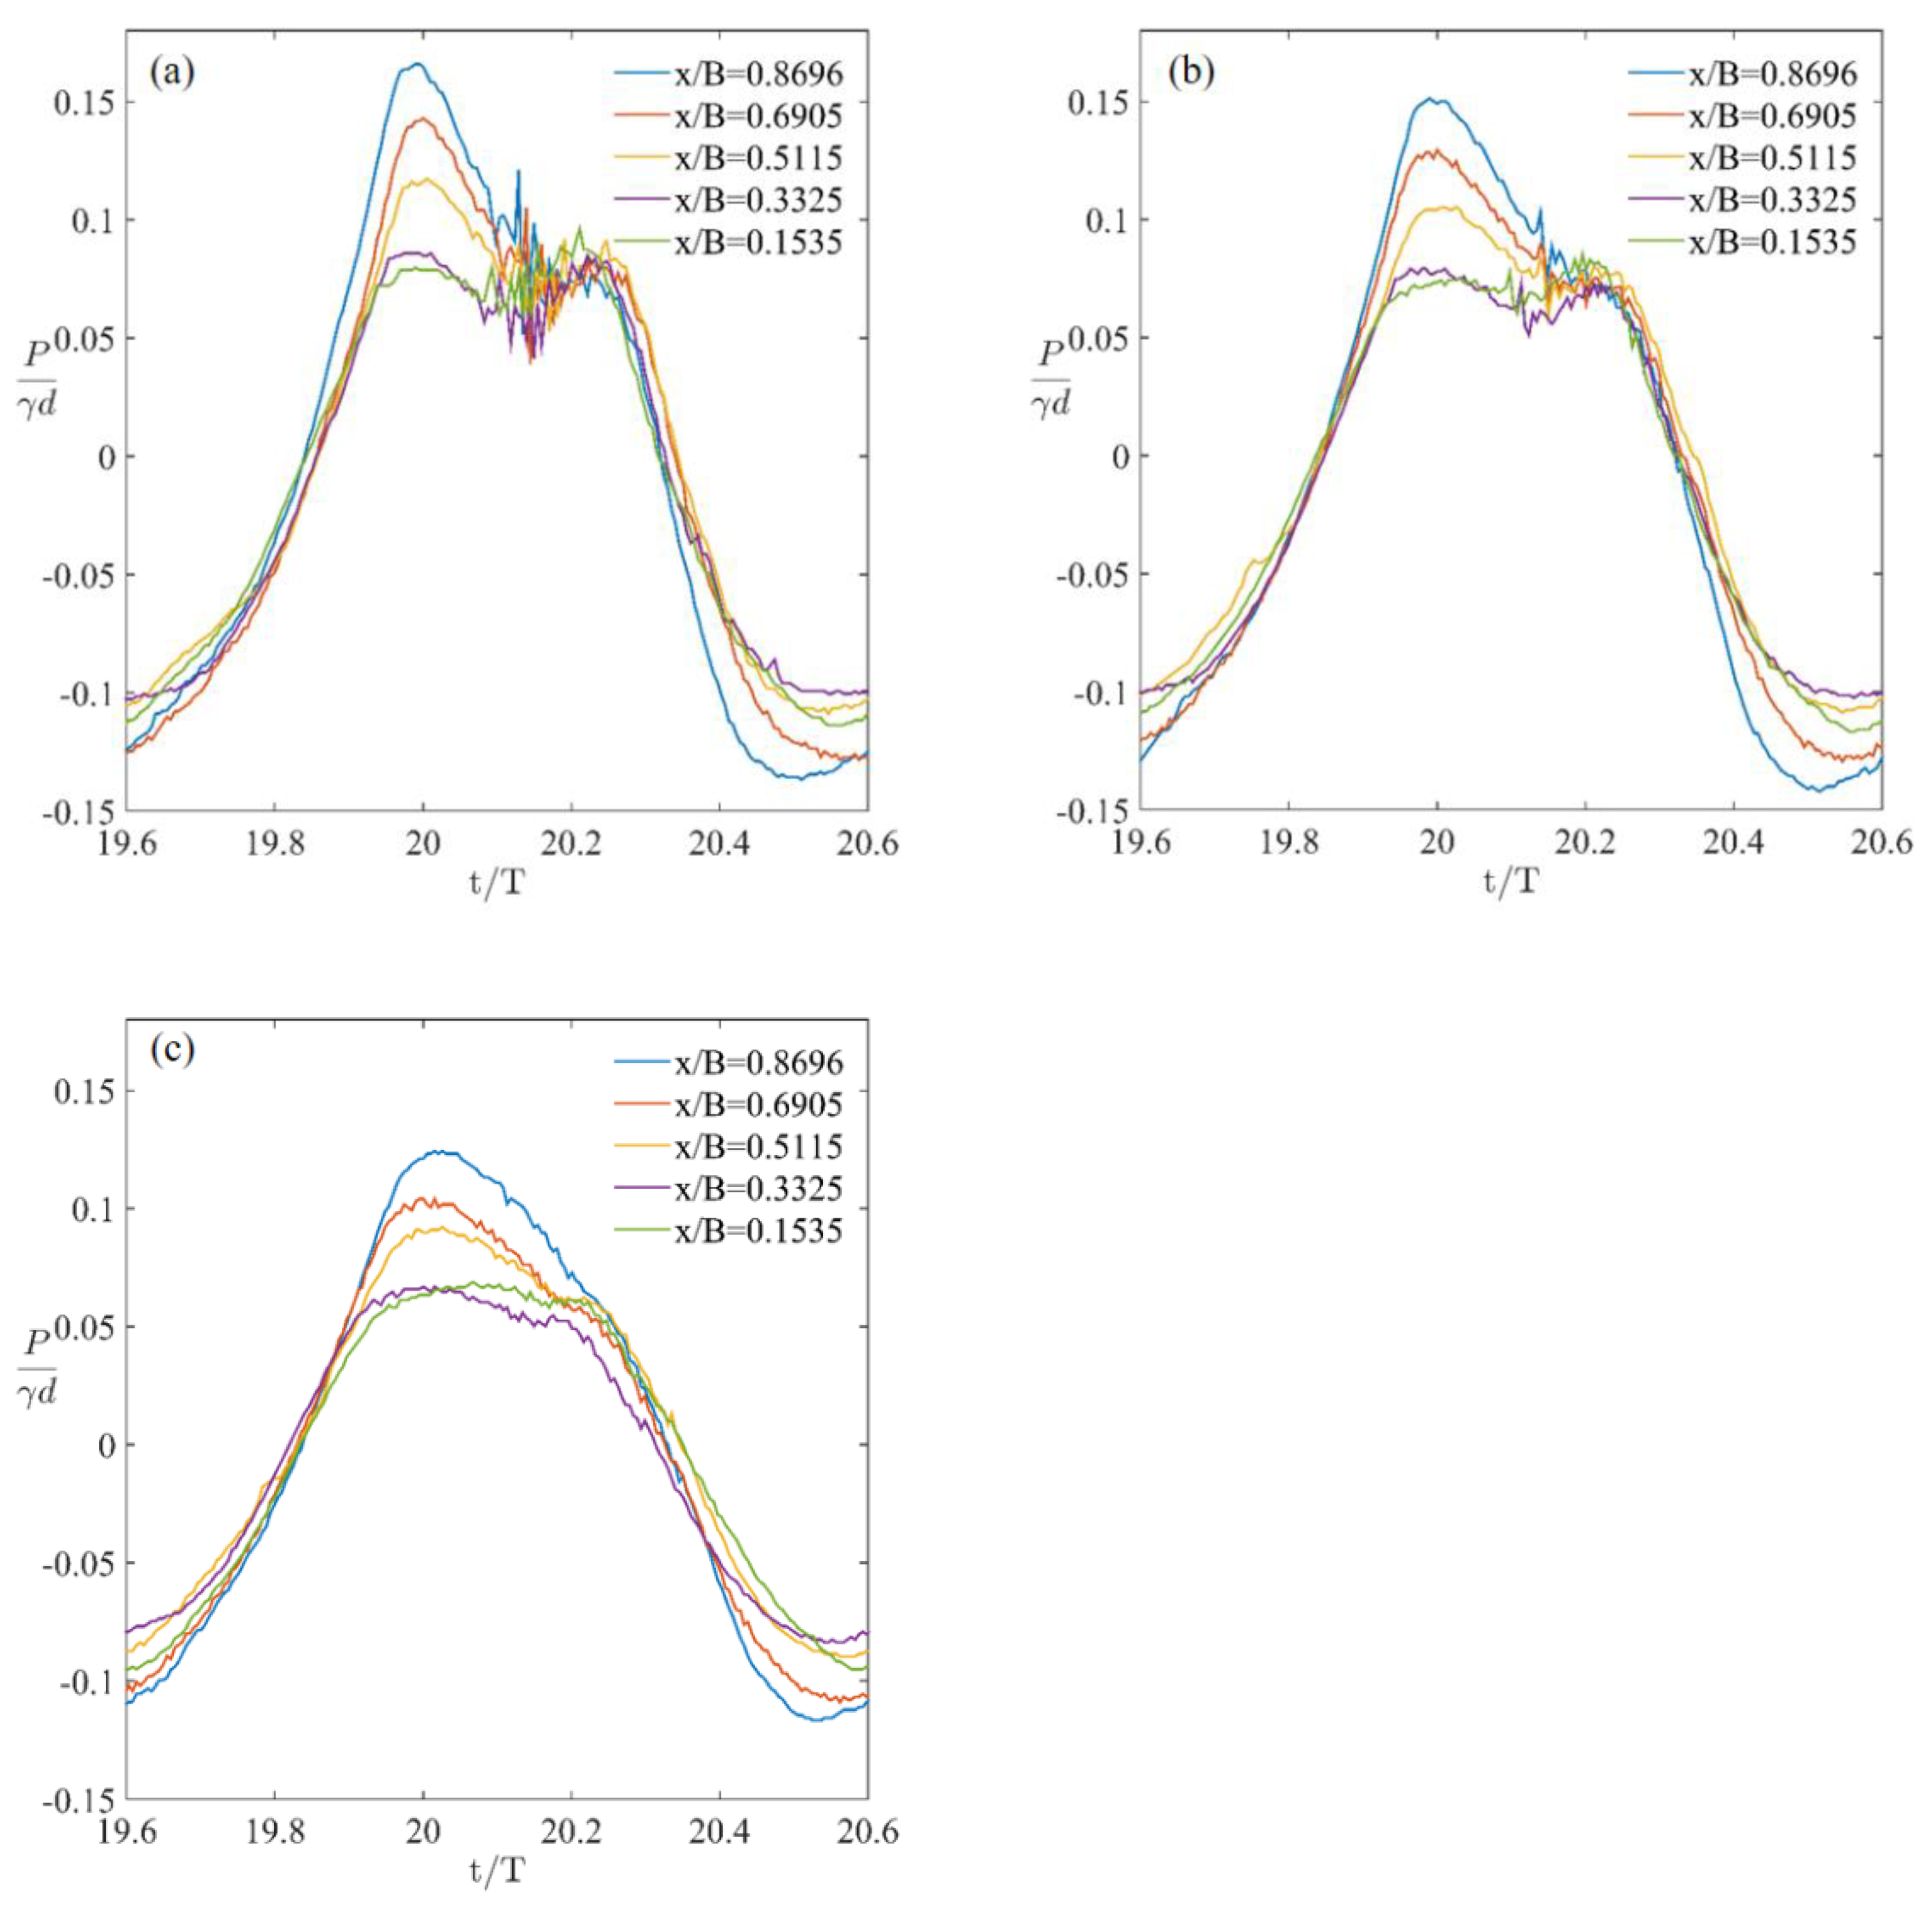
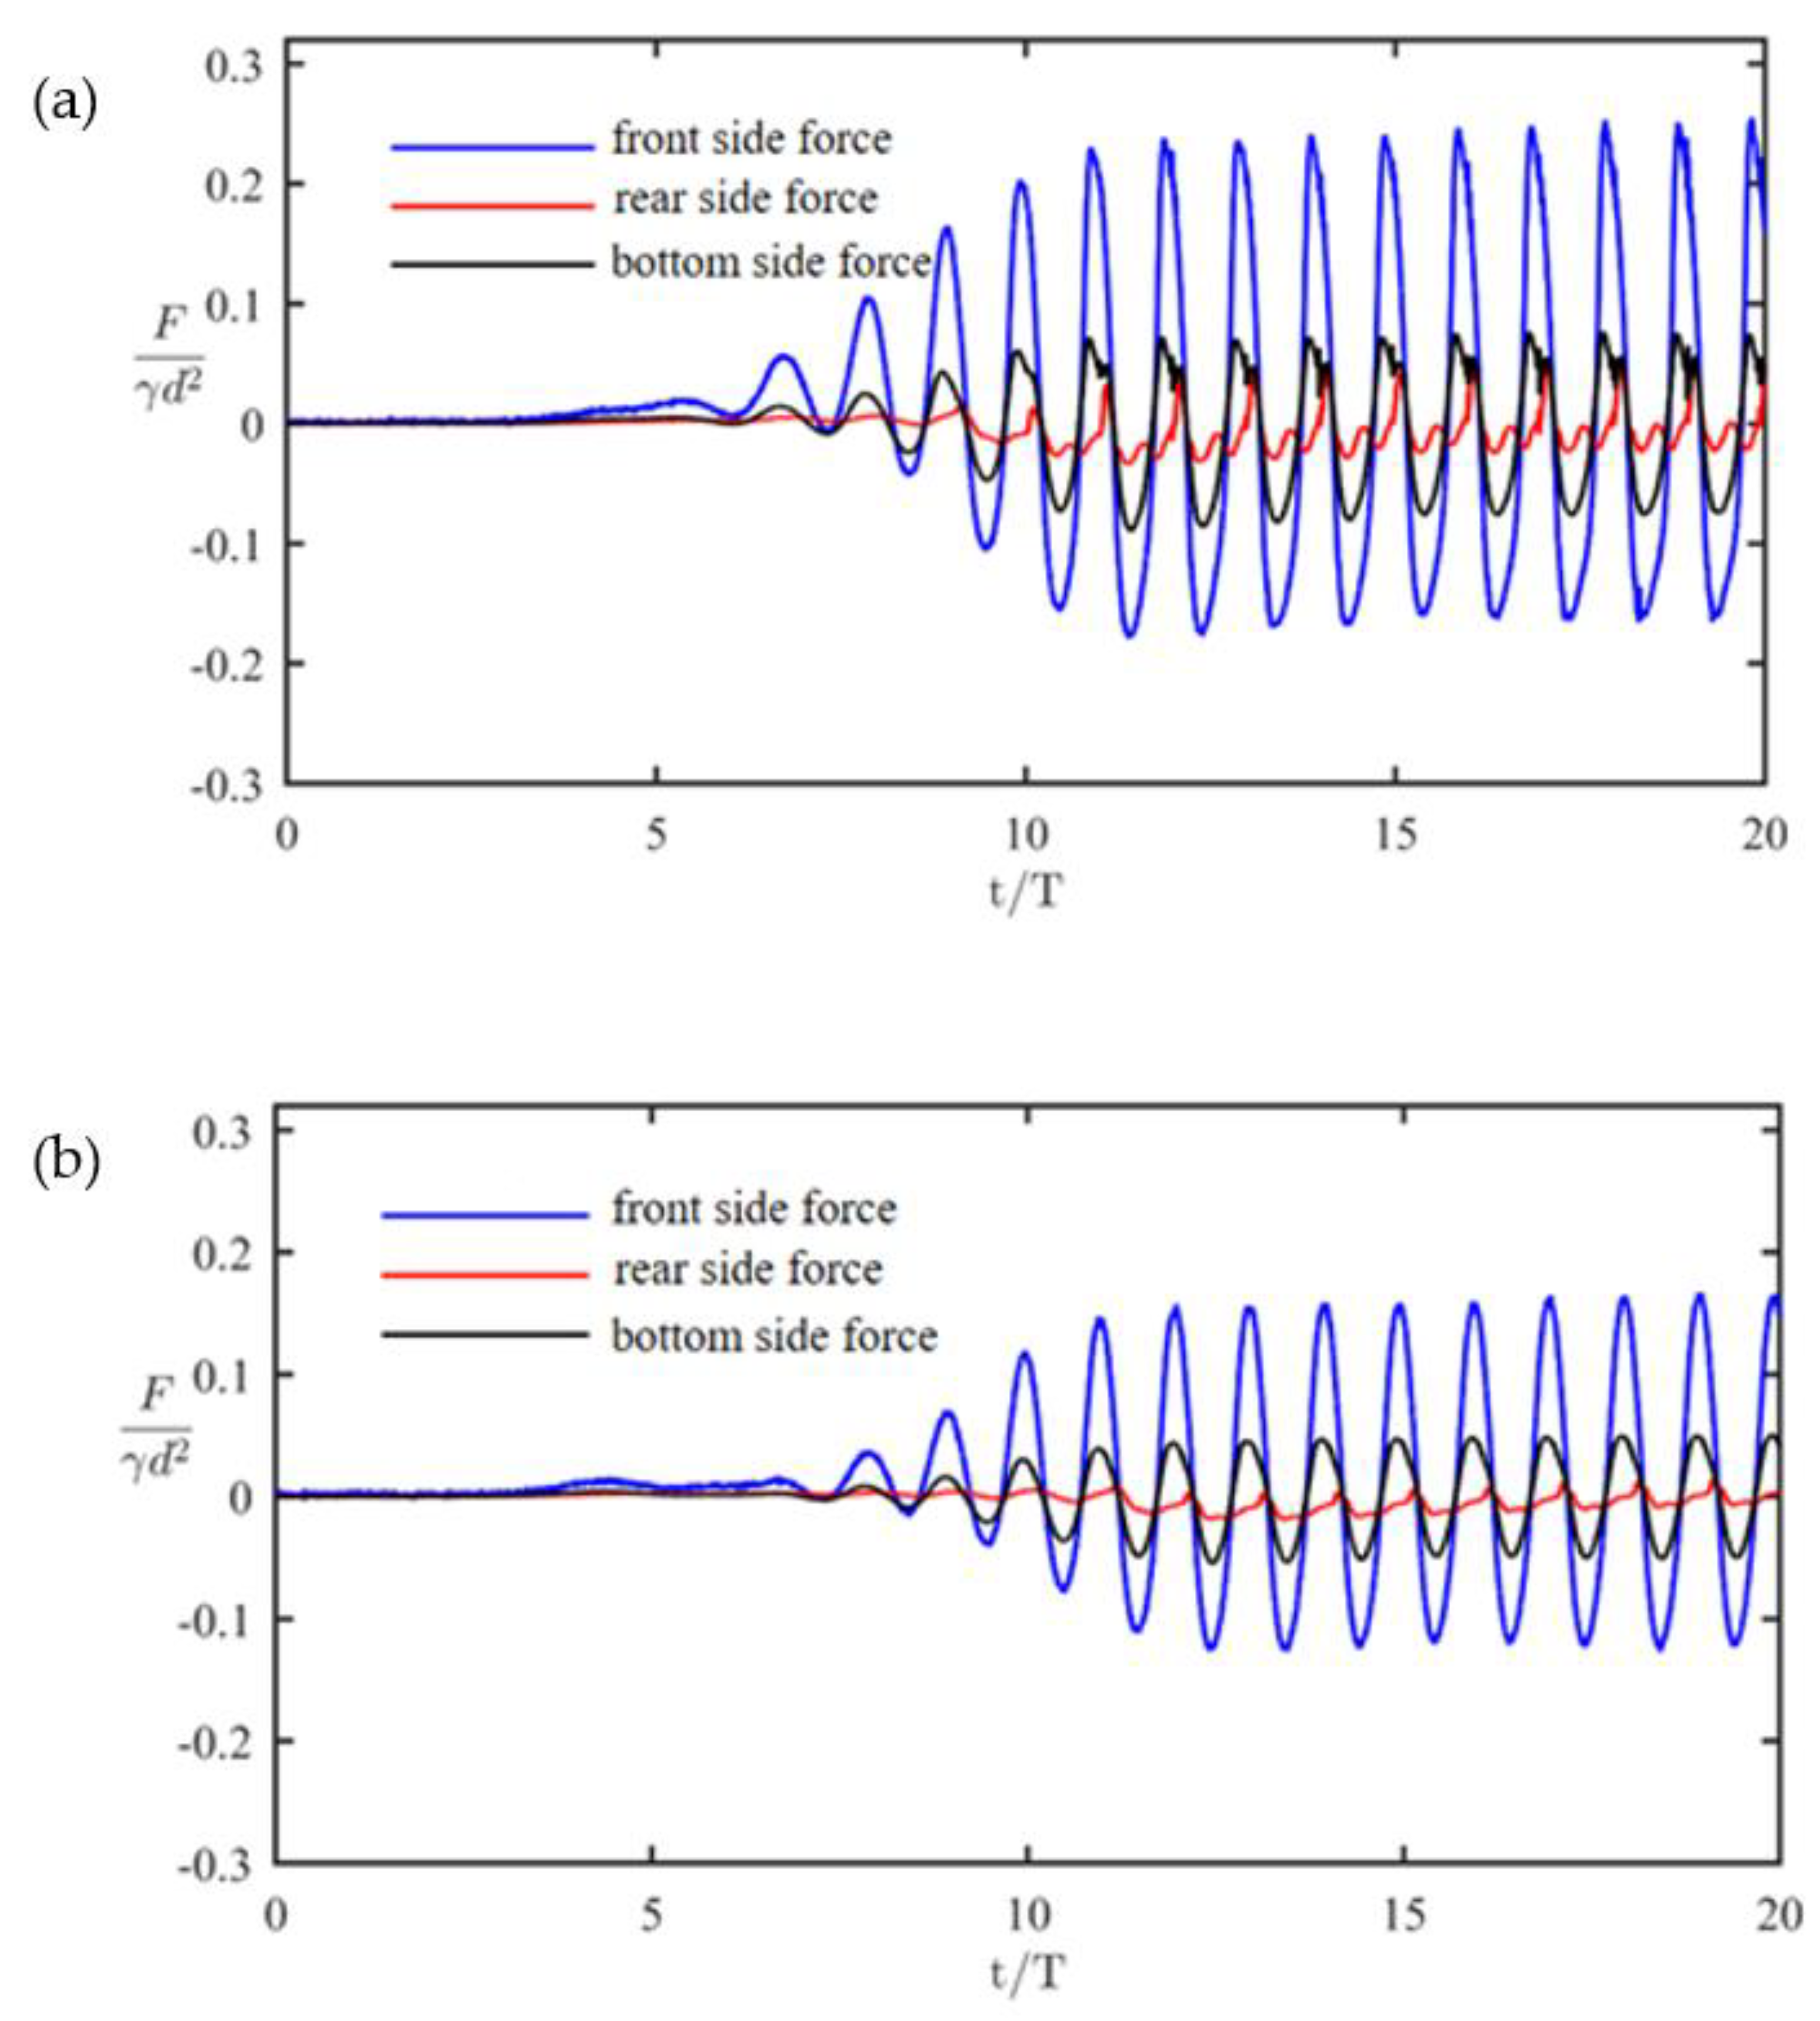
4.2. The Variation of Wave Force

The variation of wave force per unit width acting on the structure was obtained by integrating the experimental data of dynamic pressure along the front, rear, and bottom faces of the caisson breakwater. By integrating the wave-generated pressure distribution along the wall, the horizontal and uplift forces are calculated to identify the extreme wave scenario with respect to the stability of the caisson breakwater. Figure 12 shows the experimental time series of dimensionless horizontal wave forces at seaward and landward faces and the uplift forces below the caisson (reference force F 0 = ρ g d 2 = γ d 2 ) for the wave heights of 22.54 and 12.01 cm and a wave period of 1.94 s. Figure 13 presents an enlarged view of the maximum force in Figure 12. The figure details the phase differences between the occurrence of maximum F f on the seaward face, F b on the rear face, and uplift force F b o . These phase differences of the three forces on the seaward, backward and bottom sides varied with the wave height, and they disappeared for smaller waves. Interestingly, for a larger wave height, the uplift force in Figure 13a exhibited a double-peak distribution owing to the larger horizontal force ( F b ) on the back side of the breakwater for overtopping waves. By contrast, the backward force was smaller, and the uplift force in Figure 13b exhibited a single-peak distribution for the smaller wave overtopping. Clearly, the maximum wave force increased with incident wave height.

4.3. Simplified Equations for Calculating Horizontal Forces and Uplifting Force

It is important to calculate the maximum horizontal forces on the front and backward parts and the vertical wave force below the caisson for the caisson breakwater design consideration. From all of the experimental data for the maximum horizontal wave forces on the seaward side ( F f ) m and backward face ( F b ) m and the maximum lifting force ( ( F b o ) m ) at the bottom, the following dimensionless asymptotic formulae could be derived using a least-squares method:
( F f ) m γ d 2 = 0.671 ( h 0 d ) 2 + 0 . 696 ( h 0 d ) + 0.14 ,
( F b o ) m γ d 2 = 0.115 ( h 0 d ) 2 + 0 . 227 ( h 0 d ) + 0.049 ,
( F b ) m γ d 2 = 0.212 ( h 0 d ) 2 + 0 . 221 ( h 0 d ) .
Equations (5)–(7) are plotted in Figure 14a–c, respectively, and are compared with the empirical formula given by [32]. Notably, [32] only considered the horizontal force at the seaward face. The comparison indicated that the formula given by [32] underestimated the experimental data.

5. Conclusions

In this study, we conducted a laboratory experiment to measure the wave pressure distributions at the different sides of a caisson breakwater for the overtopping waves. We also carried out a COBRAS model that solved the RANS equations with a k−ε turbulence closure model. The numerical simulations were validated with the experimental data, and satisfactory comparisons have demonstrated that it is suitable to simulate the total wave forces induced by overtopping waves. The comparisons of the horizontal and uplift wave forces and the dynamic pressure distribution on the front, rear, and bottom faces of the caisson indicated that the COBRAS model can provide reliable results for waves overtopping over a caisson breakwater. In the experimental data, the dynamic wave pressure distributions at rear faces were different from zero. This phenomenon was also observed in the numerical simulations. This is due to the impact of the overtopping wave jet or the water level fluctuation induced by the overtopping flow. Our results indicated that it is important to further consider the force on the backward face of the structure, when its stability against overtopping waves is a concern. Three regressive equations, represented by Equations (5)–(7), were proposed based on least squares approximation. These empirical equations could be used to calculate the horizontal and vertical forces on a vertical structure as a guide for coastal engineering design.

Author Contributions

Conceptualization, H.-C.H.; methodology, H.-C.H. and Y.-Y.C.; software, Y.-R.C. and M.-S.L.; validation, Y.-R.C. and M.-S.L.; formal analysis, H.-C.H., Y.-Y.C., Y.-R.C. and M.-S.L.; investigation, H.-C.H., Y.-Y.C., Y.-R.C. and M.-S.L. writing—original draft preparation, H.-C.H.; writing—review and editing, H.-C.H. and M.-S.L.; supervision, H.-C.H. and Y.-Y.C.; funding acquisition, H.-C.H. and Y.-Y.C. All authors have read and agreed to the published version of the manuscript.

Funding

The Ministry of Science and Technology, Taiwan (Grant No. MOST 107-2221-E-110-077-MY3 and 110-2221-E-110-016-MY3).

Institutional Review Board Statement

Not applicable.

Informed Consent Statement

Not applicable.

Data Availability Statement

Not applicable.

Acknowledgments

The authors thank the anonymous reviewers for their constructive comments.

Conflicts of Interest

The authors declare no conflict of interest.

References

  1. Allsop, N.; McKenna, J.; Vicinanza, D.; Wittaker, T. New Design Methods for Wave Impact Loading on Vertical Breakwaters and Seawalls. Coast. Eng. Proc. 1996, 1. [Google Scholar] [CrossRef]
  2. Bullock, G.; Obhrai, C.; Peregrine, D.; Bredmose, H. Violent breaking wave impacts. Part 1: Results from large-scale regular wave tests on vertical and sloping walls. Coast. Eng. 2007, 54, 602–617. [Google Scholar] [CrossRef]
  3. Cuomo, G.; Allsop, W.; Bruce, T.; Pearson, J. Breaking wave loads at vertical seawalls and breakwaters. Coast. Eng. 2010, 57, 424–439. [Google Scholar] [CrossRef] [Green Version]
  4. Oumeraci, H.; Kortenhaus, A.; Allsop, N.W.H.; De Groot, M.B.; Crouch, R.S.; Vrijling, J.K.; Voortman, H.G. Probabilistic Design Tools for Vertical Breakwater; Balkema: Rotterdam, The Netherland, 2001. [Google Scholar]
  5. Jensen, O.J. A Monograph on Rubble Mound Breakwaters; Danish Hydraulic Institute: Horsrolm, Denmark, 1984. [Google Scholar]
  6. Pedersen, J.; Burcharth, H.F. Wave Forces on Crown Walls. In Coastal Engineering 1992; Edge, B.L., Ed.; ASCE: New York, NY, USA, 1992; pp. 1489–1502. [Google Scholar]
  7. Takahashi, S.; Tanimoto, K.; Miyanaga, S. Uplift Wave Forces Due to Compression of Enclosed Air Layer and Their Similitude Law. Coast. Eng. Jpn. 1985, 28, 191–206. [Google Scholar] [CrossRef]
  8. Takahashi, S.; Tanimoto, K.; Simosako, K. A proposal of impulsive pressure coefficient for the design of composite breakwaters. In Proceedings of the International Conference Hydro-Technical Engineering for Port and Harbor Construction (Hydro-Port 94), Yokosuka, Japan, 19–21 October 1994; pp. 489–504. [Google Scholar]
  9. Martin, F.L.; Losada, M.A.; Medina, R. Wave loads on rubble mound breakwater crown walls. Coast. Eng. 1999, 37, 149–174. [Google Scholar] [CrossRef]
  10. Tabet-Aoul, E.H.; Ambert, E. Tentative new formula for maximum horizontal wave forces acting on perforated caisson. J. Waterw. Port Coast. Ocean. Eng. 2003, 129, 34–40. [Google Scholar] [CrossRef]
  11. Arnason, H.; Petroff, C.; Yeh, H. Tsunami Bore Impingement onto a Vertical Column. J. Disaster Res. 2009, 4, 391–403. [Google Scholar] [CrossRef]
  12. Robertson, I.; Paczkowski, K.; Riggs, H.R.; Mohamed, A. Tsunami bore forces on walls. In Proceedings of the ASME 2011 30th International Conference on Ocean, Offshore and Arctic Engineering, Rotterdam, The Netherlands, 19–24 June 2011; pp. 395–403. [Google Scholar]
  13. Attary, N.; Van De Lindt, J.W.; Unnikrishnan, V.U.; Barbosa, A.R.; Cox, D.T. Methodology for Development of Physics-Based Tsunami Fragilities. J. Struct. Eng. 2017, 143, 04016223. [Google Scholar] [CrossRef]
  14. Petrone, C.; Rossetto, T.; Goda, K. Fragility assessment of a RC structure under tsunami actions via nonlinear static and dynamic analyses. Eng. Struct. 2017, 136, 36–53. [Google Scholar] [CrossRef] [Green Version]
  15. Alam, M.S.; Winter, A.O.; Galant, G.; Shekhar, K.; Barbosa, A.R.; Motley, M.R.; Eberhard, M.O.; Cox, D.T.; Arduino, P.; Lomonaco, P. Tsunami-Like Wave-Induced Lateral and Uplift Pressures and Forces on an Elevated Coastal Structure. J. Waterw. Port Coastal Ocean Eng. 2020, 146, 04020008. [Google Scholar] [CrossRef]
  16. Khayyer, A.; Gotoh, H. On particle-based simulation of a dam break over a wet bed. J. Hydraul. Res. 2010, 48, 238–249. [Google Scholar] [CrossRef]
  17. Yim, S.C.; Wei, Y.; Azadbakht, M.; Nimmala, S.; Potisuk, T. Case Study for Tsunami Design of Coastal Infrastructure: Spencer Creek Bridge, Oregon. J. Bridg. Eng. 2015, 20, 05014008. [Google Scholar] [CrossRef]
  18. Yeh, H.; Barbosa, A.; Ko, H.; Cawley, J.G. Tsunami Loadings on Structures: Review and Analysis. Coast. Eng. Proc. 2014, 1, 4. [Google Scholar] [CrossRef] [Green Version]
  19. Kato, T.; Terada, Y.; Ito, K.; Hattori, R.; Abe, T.; Miyake, T.; Koshimura, S.; Nagai, T. Tsunami due to the 2004 September 5th off the Kii peninsula earthquake, Japan, recorded by a new GPS buoy. Earth Planets Space 2005, 57, 297–301. [Google Scholar] [CrossRef] [Green Version]
  20. Hsiao, S.-C.; Lin, T.-C. Tsunami-like solitary waves impinging and overtopping an impermeable seawall: Experiment and RANS modeling. Coast. Eng. 2010, 57, 1–18. [Google Scholar] [CrossRef]
  21. Lin, P.; Liu, P.L.-F. A numerical study of breaking waves in the surf zone. J. Fluid Mech. 1998, 359, 239–264. [Google Scholar] [CrossRef]
  22. Lin, P.Z.; Liu, P.L.F. Turbulence transport, vorticity dynamics, and solute mixing under plunging breaking waves in surf zone. J. Geophys. Res. 1998, 103, 15677–15694. [Google Scholar] [CrossRef]
  23. Losada, I.J.; Lara, J.L.; Guanche, R.; Gonzalez-Ondina, J.M. Numerical analysis of wave overtopping of rubble mound breakwaters. Coast. Eng. 2008, 55, 47–62. [Google Scholar] [CrossRef]
  24. Shakibaeinia, A.; Jin, Y.-C. A mesh-free particle model for simulation of mobile-bed dam break. Adv. Water Resour. 2011, 34, 794–807. [Google Scholar] [CrossRef]
  25. Chen, X.; Li, Y.; Teng, B. Numerical and simplified methods for the calculation of the total horizontal wave force on a perforated caisson with a top cover. Coast. Eng. 2007, 54, 67–75. [Google Scholar] [CrossRef]
  26. Goda, Y. Random Seas and Maritime Structures; World Scientific Publishing Company: Tokyo, Japan, 1985. [Google Scholar]
  27. Oumeraci, H.; Kortenhaus, A. Analysis of the dynamic response of caisson breakwaters. Coast. Eng. 1994, 22, 159–183. [Google Scholar] [CrossRef]
  28. Van der Meer, J.W.; Allsop, N.; Bruce, T.; De Rouck, J.; Kortenhaus, A.; Pullen, T.; Schüttrumpf, H.; Troch, P.; Zanuttigh, B. EurOtop: Manual on Wave Overtopping of Sea Defences and Related Sturctures: An Overtopping Manual Largely Based on European Research, but for Worlwide Application, 2nd ed. 2018. Available online: www.overtopping-manual.com (accessed on 19 January 2022).
  29. Ting, F.C.; Kirby, J.T. Observation of undertow and turbulence in a laboratory surf zone. Coast. Eng. 1994, 24, 51–80. [Google Scholar] [CrossRef]
  30. Shih, T.-H.; Zhu, J.; Lumley, J.L. Calculation of Wall-Bounded Complex Flows and Free Shear Flows. Int. J. Numer. Methods Fluids 1996, 23, 1133–1144. [Google Scholar] [CrossRef]
  31. Lin, P.; Liu, P.L.-F. Internal wave-maker for Navier–Stokes equations models. J. Waterw. Port Coast. Ocean. Eng. 1999, 125, 207–217. [Google Scholar] [CrossRef]
  32. Tsai, C.P.; Lee, T.L.; Yeh, P.O. Forces on breakwaters by standing waves with water overtopping. Int. J. Offshore Polar Eng. 1999, 3, 182–187. [Google Scholar]
Figure 1. Schematic of experimental configuration.
Water 14 00657 g001
Figure 2. Position of pressure transducers on caisson breakwater.
Water 14 00657 g002
Figure 3. Wave forces acting on caisson breakwater.
Water 14 00657 g003
Figure 4. Sketch of the numerical model. “+” express the position of wave gauges.
Water 14 00657 g004
Figure 5. The comparison between numerical model and laboratory measurement for the time series of dynamic wave pressure on the seaward face.
Water 14 00657 g005
Figure 6. The comparison between numerical model and laboratory measurement for the time series of dynamic wave pressure on the landward face.
Water 14 00657 g006
Figure 7. The comparison between numerical model and laboratory measurement for the time series of dynamic wave pressure on the bottom face.
Water 14 00657 g007
Figure 8. Time series of dynamic wave pressure below caisson under three wave steepness conditions: H/L = (a) 0.0468; (b) 0.0425; and (c) 0.0383.
Water 14 00657 g008
Figure 9. The comparison of maximum wave pressure along the seaward (front) face of caisson as obtained from experiments, numerical simulations, and Goda’s formula [26] for various dimensionless overtopping heights (h0/d). (a) h0/d = 0.309; (b) h0/d = 0.2136; (c) h0/d = 0.2139; (d) h0/d = 0.1387; (e) h0/d = 0.0711.
Water 14 00657 g009
Figure 10. The comparison of maximum wave pressure along the bottom face of caisson as obtained from experiments, numerical simulations, and Goda’s formula [26] for various dimensionless overtopping heights (h0/d). (a) h0/d = 0.309; (b) h0/d = 0.2636; (c) h0/d = 0.2139; (d) h0/d = 0.1387; (e) h0/d = 0.0576.
Water 14 00657 g010
Figure 11. Comparison of maximum wave pressure along the landward (rear) face of caisson as obtained from experiments and numerical simulations for various dimensionless overtopping heights (h0/d). (a) h0/d = 0.309; (b) h0/d = 0.2636; (c) h0/d = 0.2139; (d) h0/d = 0.1387; (d) h0/d = 0.0711.
Water 14 00657 g011
Figure 12. Experimental time series of dimensionless horizontal forces and uplift forces below caisson for wave period of 1.94 s and wave heights of (a) 22.54 and (b) 12.01 cm.
Water 14 00657 g012
Figure 13. Enlarged view of maximum force in Figure 12: (a) H = 22.54 cm and T = 1.94 s and (b) H = 12.01 cm and T = 1.94 s.
Water 14 00657 g013
Figure 14. Maximum horizontal seaward and backward forces and uplifting force versus various dimensionless overtopping heights.
Water 14 00657 g014
Table 1. Wave conditions used in experiment.
Case No.Wave Height (cm)Mean Wave Height (cm)CVWave Period (s)Mean Wave Period (s)CVWater Depth (cm)
122.4522.541.08%1.941.940.21%82.3
22.351.94
22.811.93
221.3421.170.86%1.941.940.32%
21.191.94
20.981.93
318.8018.690.76%1.941.940.21%
18.531.94
18.741.94
415.2915.431.47%1.941.940.10%
15.301.94
15.691.94
511.7412.012.35%1.941.940.21%
11.981.94
12.301.93
622.2922.411.54%1.851.840.29%
22.151.84
22.801.85
721.0721.020.20%1.841.850.44%
21.001.85
21.001.85
818.4318.380.96%1.841.850.53%
18.531.85
18.191.85
915.7615.521.38%1.861.850.49%
15.431.84
15.361.85
1012.2712.372.08%1.861.850.25%
12.191.85
12.671.86
1122.0522.331.23%1.751.750.13%
22.601.75
22.351.75
1221.0220.870.62%1.751.760.54%
20.801.77
20.801.75
1318.1018.211.59%1.751.760.50%
18.531.77
17.981.76
1415.4415.500.77%1.761.760.17%
15.431.75
15.641.76
1512.2812.291.30%1.771.760.26%
12.141.76
12.461.76
Table 2. Positions of pressure transducers.
Pressure GaugesDistance from the Origin Point (m)
Pf10.390
Pf20.350
Pf30.310
Pf40.270
Pf50.230
Pf60.190
Pf70.150
Pf80.110
Pf90.070
Pbo10.041
Pbo20.111
Pbo30.181
Pbo40.251
Pbo50.321
Pb10.335
Pb20.295
Pb30.255
Pb40.215
Pb50.175
Pb60.135
Pb70.095
Pb80.055
Publisher’s Note: MDPI stays neutral with regard to jurisdictional claims in published maps and institutional affiliations.

