Article

Combined Multilevel Monitoring and Wavelet Transform Analysis Approach for the Inspection of Ground and Surface Water Dynamics in Shallow Coastal Aquifer

1
Department of Hydromechanics and Hydraulics, Faculty of Civil Engineering, Architecture and Geodesy, University of Split, Matice Hrvatske 15, 21000 Split, Croatia
2
Hydrotechnical Laboratory, Faculty of Civil Engineering, Architecture and Geodesy, University of Split, Hrvatskih Velikana bb, Žrnovnica, 21251 Split, Croatia
3
Department of Water Resources, Faculty of Civil Engineering, Architecture and Geodesy, University of Split, Matice Hrvatske 15, 21000 Split, Croatia
4
Faculty of Civil Engineering, Architecture and Geodesy, University of Mostar, Matice Hrvatske bb, 88000 Mostar, Bosnia and Herzegovina
*
Author to whom correspondence should be addressed.
Water 2022, 14(4), 656; https://doi.org/10.3390/w14040656
Submission received: 22 January 2022 / Revised: 16 February 2022 / Accepted: 18 February 2022 / Published: 20 February 2022
(This article belongs to the Special Issue Salt Intrusion in Coastal Areas)

Abstract

:
In this paper, we present an approach based on the simultaneous use of multilevel monitoring systems for the ground and surface water and wavelet-based analysis of the time series observed to detect the main mechanisms influencing the water level, electrical conductivity (EC) and temperature (T) in ground and surface water of the river Neretva coastal aquifer system. Although the area of interest is under significant impact of seawater intrusion, the presented approach enabled the insight to transient response of the system to external loadings like precipitation and irrigation system primarily. The capacity of the monitoring system has been demonstrated on two different subareas, respectively, Diga and Jasenska. While the Diga area is shown to be under significant influence of the seawater, the Jasenska area shows sensitivity to precipitation and pumping station (PS) Modric operative regime. Groundwater parameters as observed during dry periods at Jasenska show the presence of stratification. Wavelet-based analysis enabled the determination of the interdependence of the variables of interest as well as their temporal dependence. Determined regimes of the surface water, as found within the Jasenska channel, are additionally supported by the in situ profiling results, thus strengthening the findings of the study. Our findings reflect the capacity of the approach to capture for the stratification of the groundwater parameters induced by seawater intrusion and external loadings.

1. Introduction

Groundwater in coastal areas has been commonly recognized as an important source of drinking water as well as a precondition for sustainable agricultural production [1,2]. Although the utmost importance of the groundwater resources in coastal aquifer systems, it has faced the negative effects caused by seawater intrusion [3,4,5,6]. This has been identified in the past through reduction in quality indicator values, such as groundwater temperature (T), electrical conductivity (EC) and salinity (Sal), as shown in many previous studies [7,8,9]. The latter implies the necessity for various approaches to tackle the negative effects of the seawater intrusion and testing of appropriate mitigation measures with a final goal to ensure a sufficient volume of water of an appropriate quality.
Monitoring has been widely used as a reliable approach when the seawater intrusion and its relevance upon ground and surface water in coastal aquifers are of interest [10,11,12,13]. The implementation of monitoring systems in costal ecosystems requires a planned and objective orientated purpose [14,15,16,17], which will give crucial and useful information on the processes of interest [18,19,20]. Hereby, costal aquifer monitoring systems have been used as a basis for the inspection and research in different areas.
Groundwater levels in coastal aquifers are mainly influenced by sea level tidal variations and precipitation, with the respective degree of influence depending on the location of the observation well [8]. The tidal effect on groundwater level decreases with distance from the coast as well as the time lag to sea level increases [21]. The basis of those findings have been established in early works [22,23] with consistent to up to date improvements and a wide range of methodological assumptions on whom tidal methods are founded [24,25].
Apart from the hydrogeological scope that arose from tidal method applications, most studies have been focused on time series analysis of groundwater level, EC or T, implying the sensitivity of those variables to external loadings, such as precipitation, seawater intrusion, hydrological processes, local infrastructure operative regimes, etc. [15,26,27]. Using the time series of EC from the observation borehole, Kim et al. [28] applied auto-correlation and cross-correlation methods, as well as spectral density functions to identify the correspondence of groundwater EC and sea level tidal dynamics. The same study showed the highest values of EC occurred during spring tide when sea level is highest, while the lowest values of EC corresponds to the neap tide occurrence. The latter suggests that temporal variations in groundwater quality when analyzed through EC are driven by tidal dynamics, which is consistent with the findings of Fadili et al. [29] and Heiss and Michael [30]. Furthermore, Fadili et al. [29] suggested that coastal monitoring should consider parameters at different depths to ensure reliable groundwater use due to increasing seawater intrusion. Kim et al. [15] presented a study of Jeju Island in Korea where eight multiparameter probes have been installed in a single piezometer at variable depths to monitor temporal variations of both EC and T. The crucial finding of the analysis performed lead to the fact that probes located out of the transition zone did not exhibit temporal variations of EC or T related to tidal oscillations, while probes located within the transition zone successfully detected the movement of the transition zone. The Jeju Island has again been the subject of research interest by Kim et al. [31], who illustrated the benefits of multilevel monitoring in long perforated boreholes. Applying a cross-correlation model to obtained time series from monitoring system processes controlling the seawater–fresh water interaction and the influence of precipitation on the salinity have been identified [31]. Seawater intrusion effects have been shown to vary with depth and to be significantly dependent on the hydrogeological properties of the geologic layer.
In addition, from typical time series based analyses, Zhang et al. [32] focused his research to a complex area in the Pearl river estuary by applying wavelet transform coherence to different subareas of interest. This study evidenced each subarea of the Pearl river estuary possesses different salinity regimes while groundwater level is strongly influenced by sea level and water level oscillations in river waterways. The results supports the salinity regime at different locations in the aquifer, which has been induced by changes in tidal level and precipitation, and is strongly dependent on the position of the piezometer and the geological settings of the area [8,17].
Previous findings in the Neretva coastal aquifer system have been focused mainly to hydrogeological settings [33], main pathways of seawater intrusion identification [17] and the analysis of seawater cline features characterizing the Neretva river [34]. Up to date, there are very few studies in the past [15,31] addressing the combined impacts of external loadings to groundwater, EC and T when obtained through multilevel monitoring in single boreholes of both ground and surface water. This paper demonstrates the implementation and efficiency of multilevel groundwater and surface water monitoring systems to capture the external loadings and seawater intrusion effects present in the Neretva river coastal system. The contributory aims of this paper can be specifically identified as: (i) the implementation of the multilevel monitoring system which covers for ground and surface water parameters within the Neretva valley coastal shallow aquifer in the Republic Croatia; (ii) to determine the seawater intrusion influence to specific subareas of interest; (iii) to detect and distinguish the nature of transience of the EC, T and ground and surface water levels within the ground and surface water. For the purpose of the analysis, the continuous wavelet transform is applied to study frequency changes over time, and wavelet coherence has been used to determine temporal dependence between variables of interest.

2. Materials and Methods
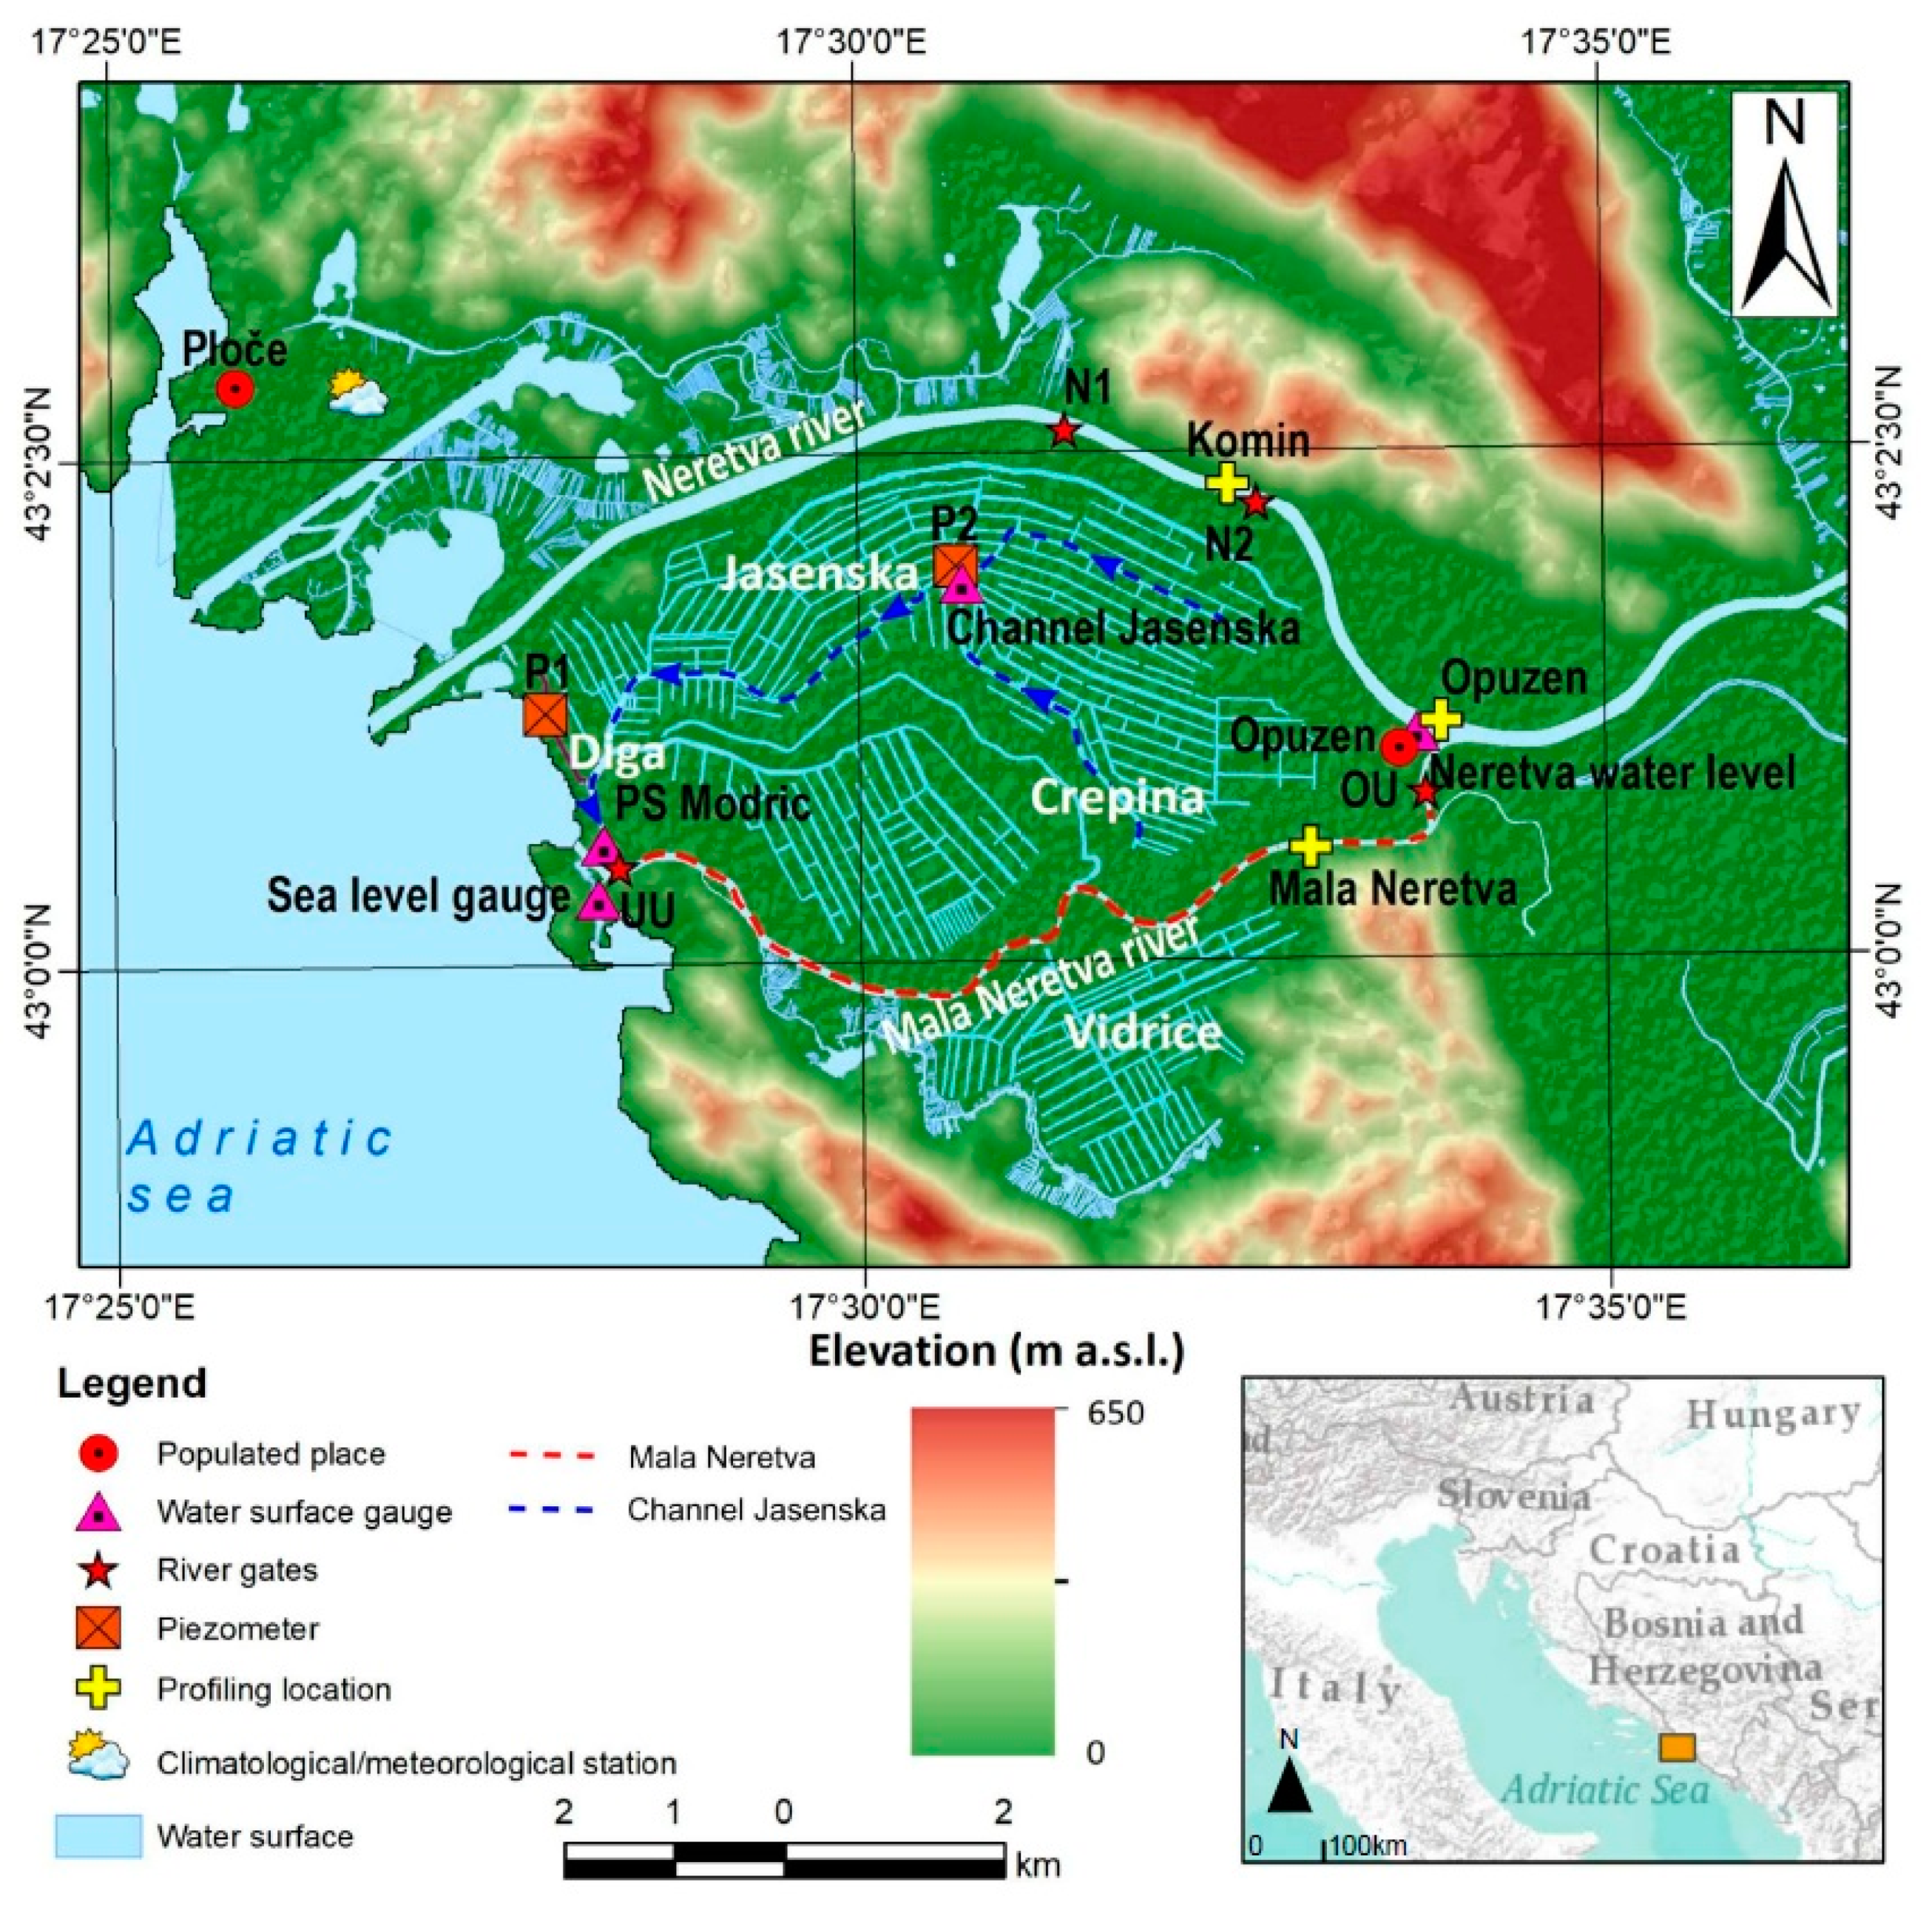
2.1. Study Area

The Neretva Valley is located between the Neretva and Mala Neretva rivers in the southeastern part of Croatia, as shown in Figure 1, produced within the ArcMap 10.8 environment [35]. In its present form, the study area comprises about 5000 ha of arable land and represents the largest cultivated area on the Croatian coast. The region is characterized by hot and dry summer and wet and mild winter periods, with an average total annual precipitation of 1200.78 mm year−1 for the period 2009–2018, as observed at the climatological-meteorological station in Ploce [17].
The hydrological regime of the river Neretva is mainly divided into two characteristic periods, a dry and a rain period. The discharge of the Neretva river fits to seasonal precipitation variations and usually ranges from 40 m3 s−1 to 1800 m3 s−1 [17]. During the dry period, discharge is mainly influenced by the operative regime of the hydro power plant Mostar, located 40 km upstream from the national border with Bosnia and Herzegovina. The period from November to April corresponds to the rain period where discharge is influenced by the water balance at the basin scale and precipitation occurrence.
The Mala Neretva river is separated from both the Neretva river and the sea by gates OU and UU (Figure 1). During the dry period, the Mala Neretva river is the only source of fresh water in the valley [17]. The water of the Mala Neretva is distributed in the valley through a system of irrigation channels and partially feed Jasenska channel by fresh water.
The area of interest is characterized by the channel system which works as both an irrigation and melioration system. Due to the high salinity in the area, during the dry period, fresh water is introduced from Mala Neretva and from river Neretva [36], through the gates located at the left river Neretva bank. After the water is introduced into system, it flows downstream to the PS Modric intake basin. The pumping station (PS) Modric is responsible for maintaining the water level beneath the pedological layer in the Jasenska, Crepina and Diga areas (Figure 1). PS Modric usually operates between 10 p.m. and 7 a.m., except when precipitation is expected. The terrain elevation along the valley has been mostly found below the mean sea level [17,33], which in combination with PS Modric operative regime leads to active seawater intrusion along the study area [37,38].
The Neretva Valley consists of three main hydrogeological layers: (i) a sandy, unconfined aquifer in the upper part; (ii) a confining layer of clay under the unconfined aquifer; (iii) a gravelly, confined aquifer in the lower part. The clay layer extends over the entire area with a thickness of 10 to 25 m and it was found that the clay layer extends from the coast towards the sea for a total of 1400 m [33]. By applying the tidal method to the appropriate conceptual aquifer system model, it has been determined that the leakage between the unconfined and confined aquifers is negligible [33]. The latter has been additionally supported by the spectral analysis of the piezometric heads observed within the confined aquifer, following the procedure by Rahi and Halihan [39].

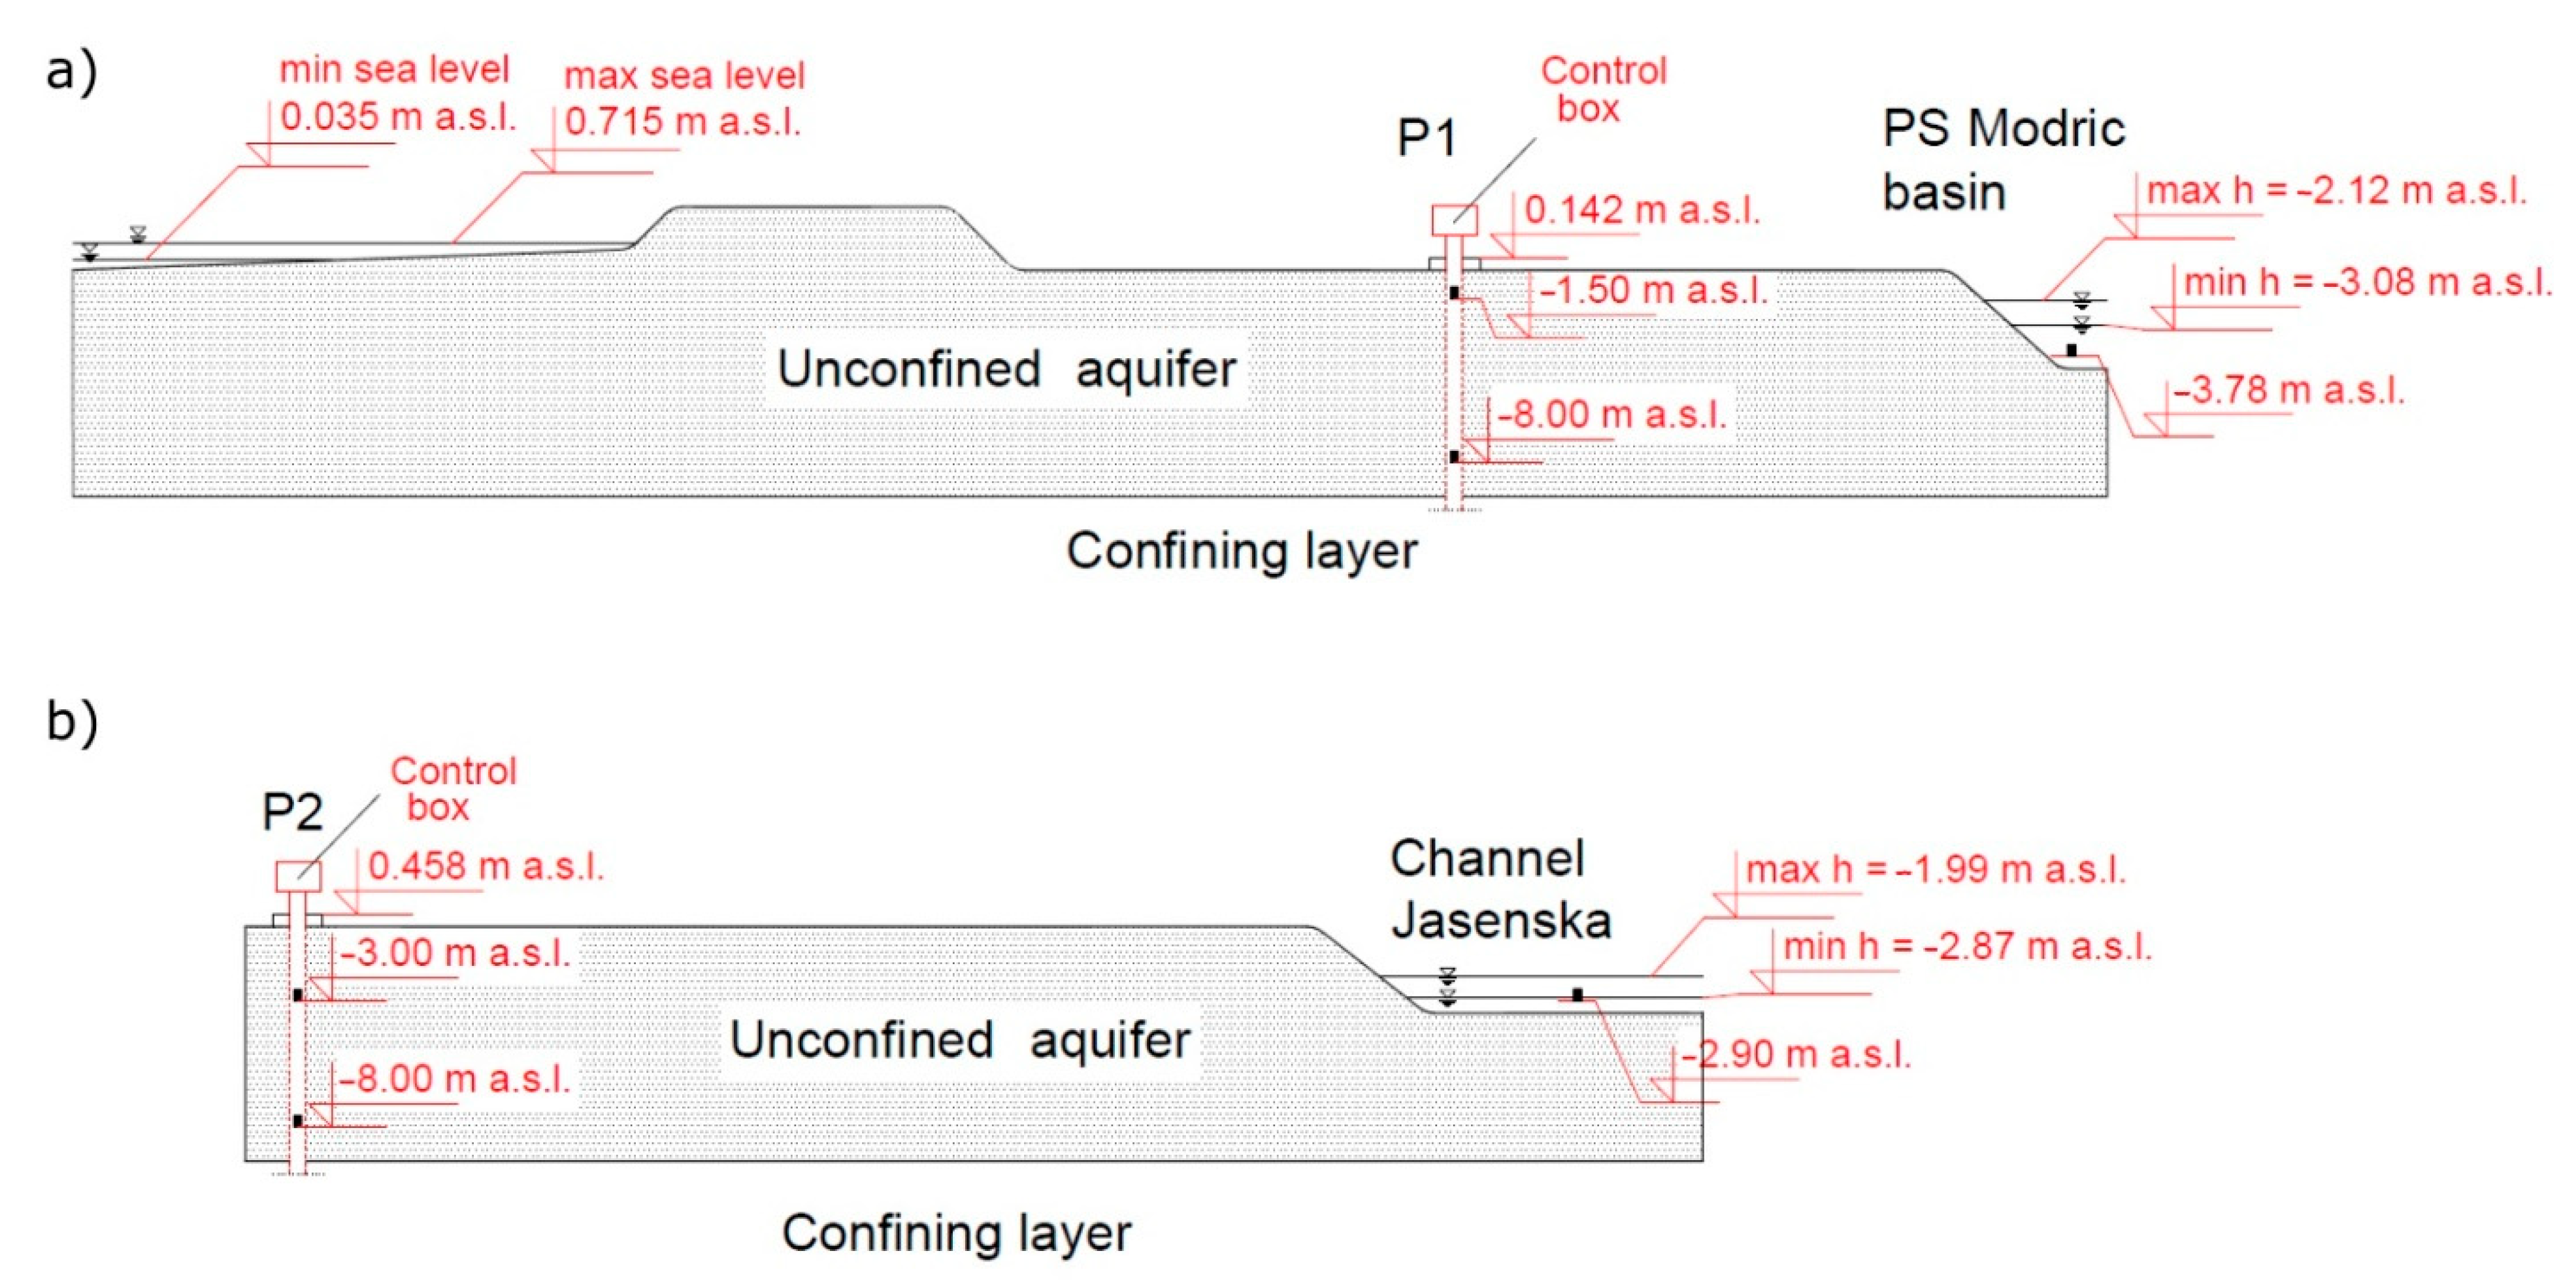
2.2. Monitoring System and Profiling

For the purpose of this study, the existing monitoring system used to monitor parameters of seawater intrusion in the Neretva Valley has been upgraded during the period of April-June 2021. In its newest form, the system enables both ground and surface water parameters to be monitored. Groundwater monitoring covers for groundwater regimes at locations Diga (P1 piezometer) and Jasenska (P2 piezometer), as shown in Figure 1. In each piezometer, groundwater level, EC and T are continuously monitored at two different depths. Both piezometers have been 10 m deep and perforated along whole depth since the geological settings obtained from the borehole inspection imply the presence of a unique sandy made layer. The upper probe has been identified in the results section with the letter G while the lower probe is denoted with the letter D. The vertical definition of G probe locations relies on the insight to past groundwater level time series to ensure probe positioning beneath the lowest observed level. Figure 2a enables the insight to the positioning of P1 probes while Figure 2b defines the vertical identification of P2 probes.
In both piezometers, G probe is TruBlue CTD 585 with the ability to monitor groundwater level, EC and T with accuracy of ±0.05% of the total error band for water level in the range of 0–10.5 m water column, accuracy of 1% or 0.02 mS cm−1 for EC in the range of 0.005–100 mS cm−1 and an accuracy of ±0.2 °C for T in the range of 0–50 °C. The D probe in both piezometers is the Manta2 +40 with the ability to monitor EC and T. The Manta2 +40 possess a range of 0–100 mS cm−1 for EC and 0–50 °C for T with an accuracy of ±1% of reading for EC and the temperature of ±0.1 °C. Both probes are set up to a sampling frequency of 2 h−1 with emphasis on the EC reading in both probes standardized to 25 °C.
In addition to groundwater parameters monitoring, surface water parameters are also measured at two locations separately, Jasenska channel and PS Modric intake basin. Hereby, same TrueBLue CTD 585 has been installed at these locations with the same sampling frequency. For sea level and Neretva river water level monitoring, the THALIMEDES OTT gauge was installed with a sampling frequency of 2 h−1. The measuring range of the instrument is ±19.999 m with an accuracy of ±0.002 m. All variables covered by the monitoring system have been temporarily synchronized while the reference vertical datum used for the height and depth elevation corresponds to “Nula Trsta”.
For the purpose of this study specifically, time series for the period 15 August 2021 00:00 h–15 October 2021 23:30 h have been obtained from all monitoring covered probes in the area of interest. Time series of hourly precipitation have been obtained from the meteorological station Ploce, operated by the Croatian Hydrometeorological Institute. During the analyzed period, several sensor malfunctions occurred in different probes due to the absence of energy supply or other technical issues. These malfunctions are shown as a gap in the time series and do not cause any deviations from the results and findings presented within the Results section.
To enable the insight to relevant vertical stratification in EC and T in situ profiling was carried out during the dry season at five locations: (i) P1, (ii) P2, (iii) Mala Neretva-bridge, (iv) Neretva river–Opuzen profile and (v) Neretva river Komin profile. Profiling was conducted three times during the period: (i) 19 July 2021, (ii) 24 August 2021 and (iii) 20 September 2021, with the SEBA KLL-Q-2 multiparameter probe and the values. SEBA KLL-Q-2 has a measurement range from −5 to 50 °C for T and 0–200 mS cm−1 for EC.

2.3. Wavelet Analysis

2.3.1. The Continuous Wavelet Transform (CWT)

In this study, CWT was applied to time series to evaluate periodic and non-periodic variations in time and frequency domain. A function localized in time and frequency with a mean of zero is called a wavelet. The wavelet type can be chosen to best match the characteristics of the observed signals. The Morlet wavelet has been shown to be most suitable for geophysical time series [32,40,41,42]. The Morlet wavelet function is defined as:
ψ 0 η = π 1 / 4 e i ω 0 η e 1 2 η 2
where ψ 0 is the mother wavelet or in this case the Morlet wavelet, ω 0 is the dimensionless frequency and η is the dimensionless time. ω 0 is responsible for the tradeoff between time and frequency. Lower values of ω 0 provide higher time resolution but lower frequency resolution and vice versa. A value of 6 for ω 0 has been shown to be a good tradeoff between frequency and time resolution [42]. CWT of a time series X n : n = 1 , , N can be calculated as follows:
W n X = δ t s n = 1 N x n ψ 0 n n δ t s
where xn is the n-th value in the time series, t is the uniform time step and s is the scale of the wavelet. In Equation (2), the wavelet is stretched with s and translated with the localized time index n along the time series to produce an image called scalogram in which the dominant frequencies of the signal can be seen over time. The wavelet rectified power is defined as 2 j × W n X 2 where j is scale level and the multiplication is conducted to correct the bias in the frequencies with higher period in wavelet power spectrum [43,44]. Since the wavelet transform behaves like a sliding bandpass filter, edge effects become important due to the lack of information [42,45]. Therefore, the edge effects are marked with the cone of influence (COI) and the results of CWT, which are shaded outside the COI, should not be considered. Finally, the areas of high power are surrounded by black lines representing areas tested against AR1 red noise (95% confidence level) [42,46].

2.3.2. Wavelet Coherence (WTC)

The functional relationship between two signals in both frequency and time domains was analyzed using wavelet coherence (WTC). WTC is similar to the cross-correlation coefficient, except that WTC is localized in time and frequency space. WTC takes values from 0 to 1, where 1 represents complete coherence and 0 represents no coherence. WTC can be calculated as follows:
R n 2 s = S s 1 W n X Y s 2 S s 1 W n X s 2 · S s 1 W n Y s 2
where R n 2 represents magnitude square coherence, S is a smoothing operator and W n X Y is a cross-wavelet transform. From the cross-wavelet transform, the relative phase between equal frequencies in two signals can be determined [42]. These phases are shown as arrows in the coherence results when the coherence exceeds the value of 0.6. An arrow pointing to the right means that two frequencies are in phase, while an arrow pointing to the left means that they are maximum out of phase (anti-phase). The direction of the arrow can also be interpreted as a time delay, e.g., an arrow pointing to the left for the frequencies with a period of 12 h means a time delay of 6 h between them. The WTC significance tests were performed using the method proposed by Grinsted et al. [42] in which the WTC results are compared with the coherence results of data sets created with the same AR1 coefficient as in the input time series.
Respectively, the period from 00:00 h 15 August 2021–23:00 h 15 October 2021 was analyzed in the frequency domain. To establish coherence between the time series of groundwater level and EC observed in the piezometers and the precipitation, the time series of groundwater level and EC are sparse to match the sampling frequency of the precipitation. Wavelet transform analysis of time series has been conducted in Matlab by using procedures presented by Grinsted et al. [42] and Ng and Chan [44].

3. Results

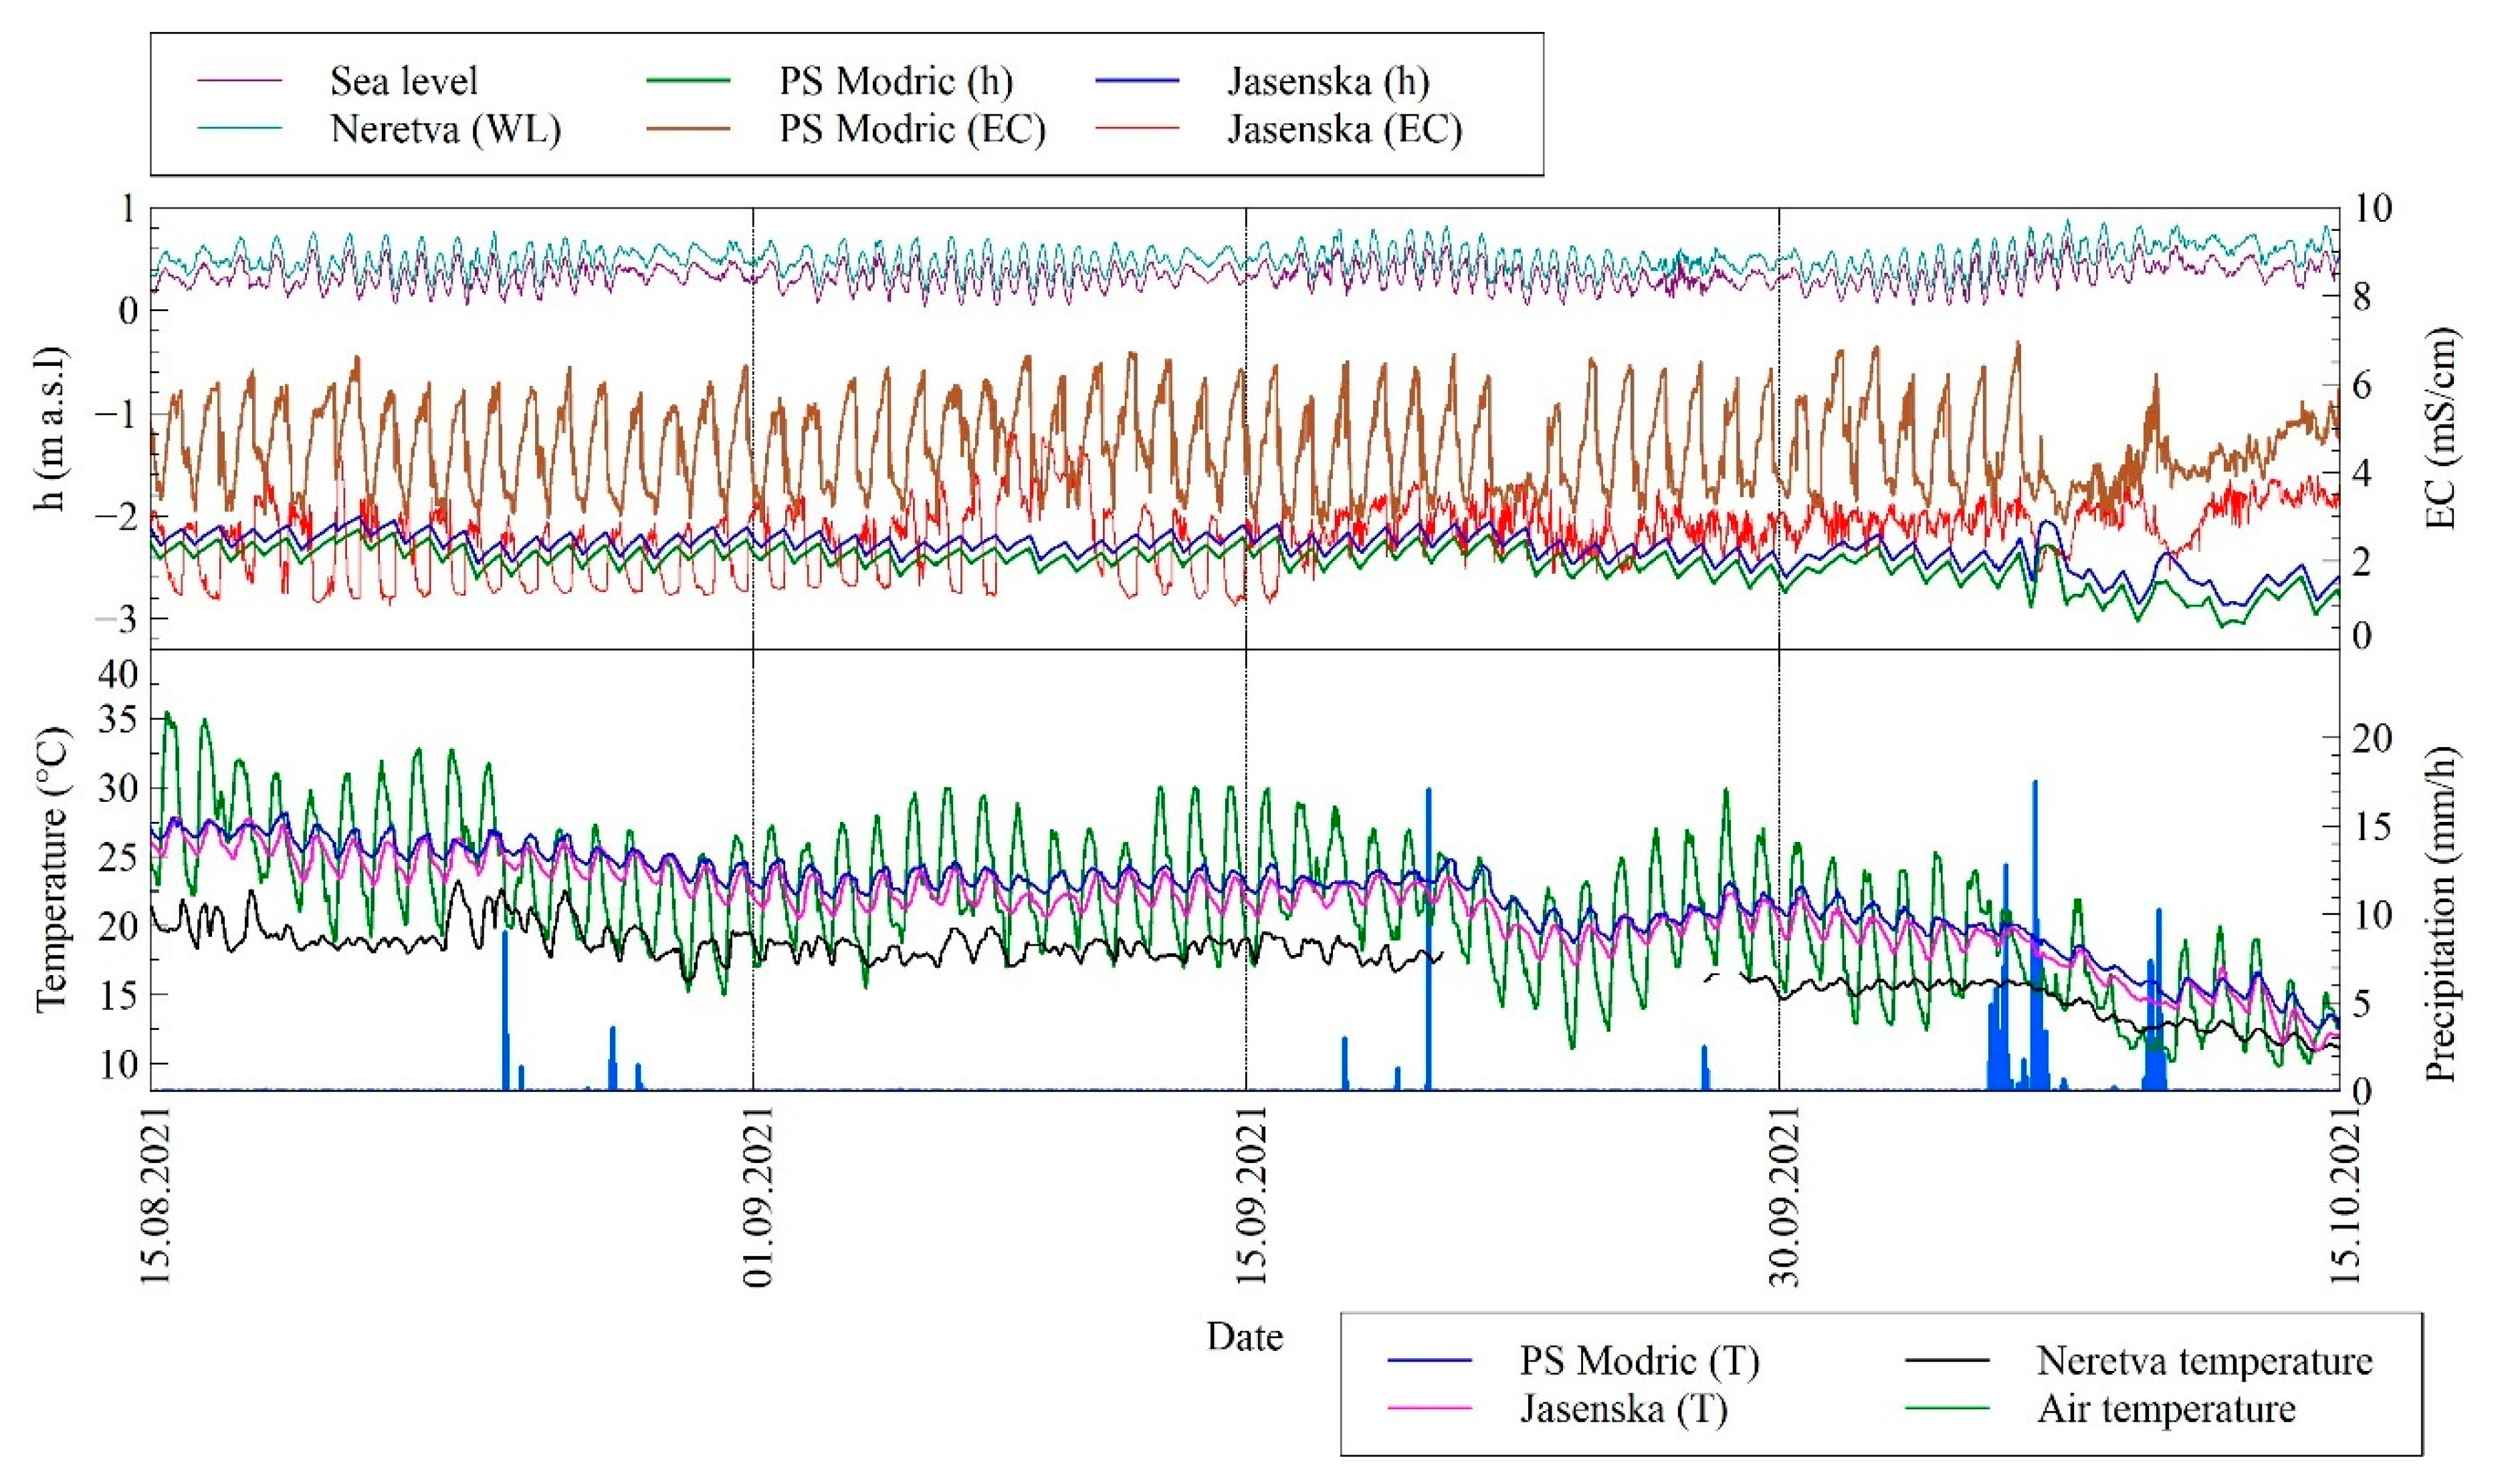
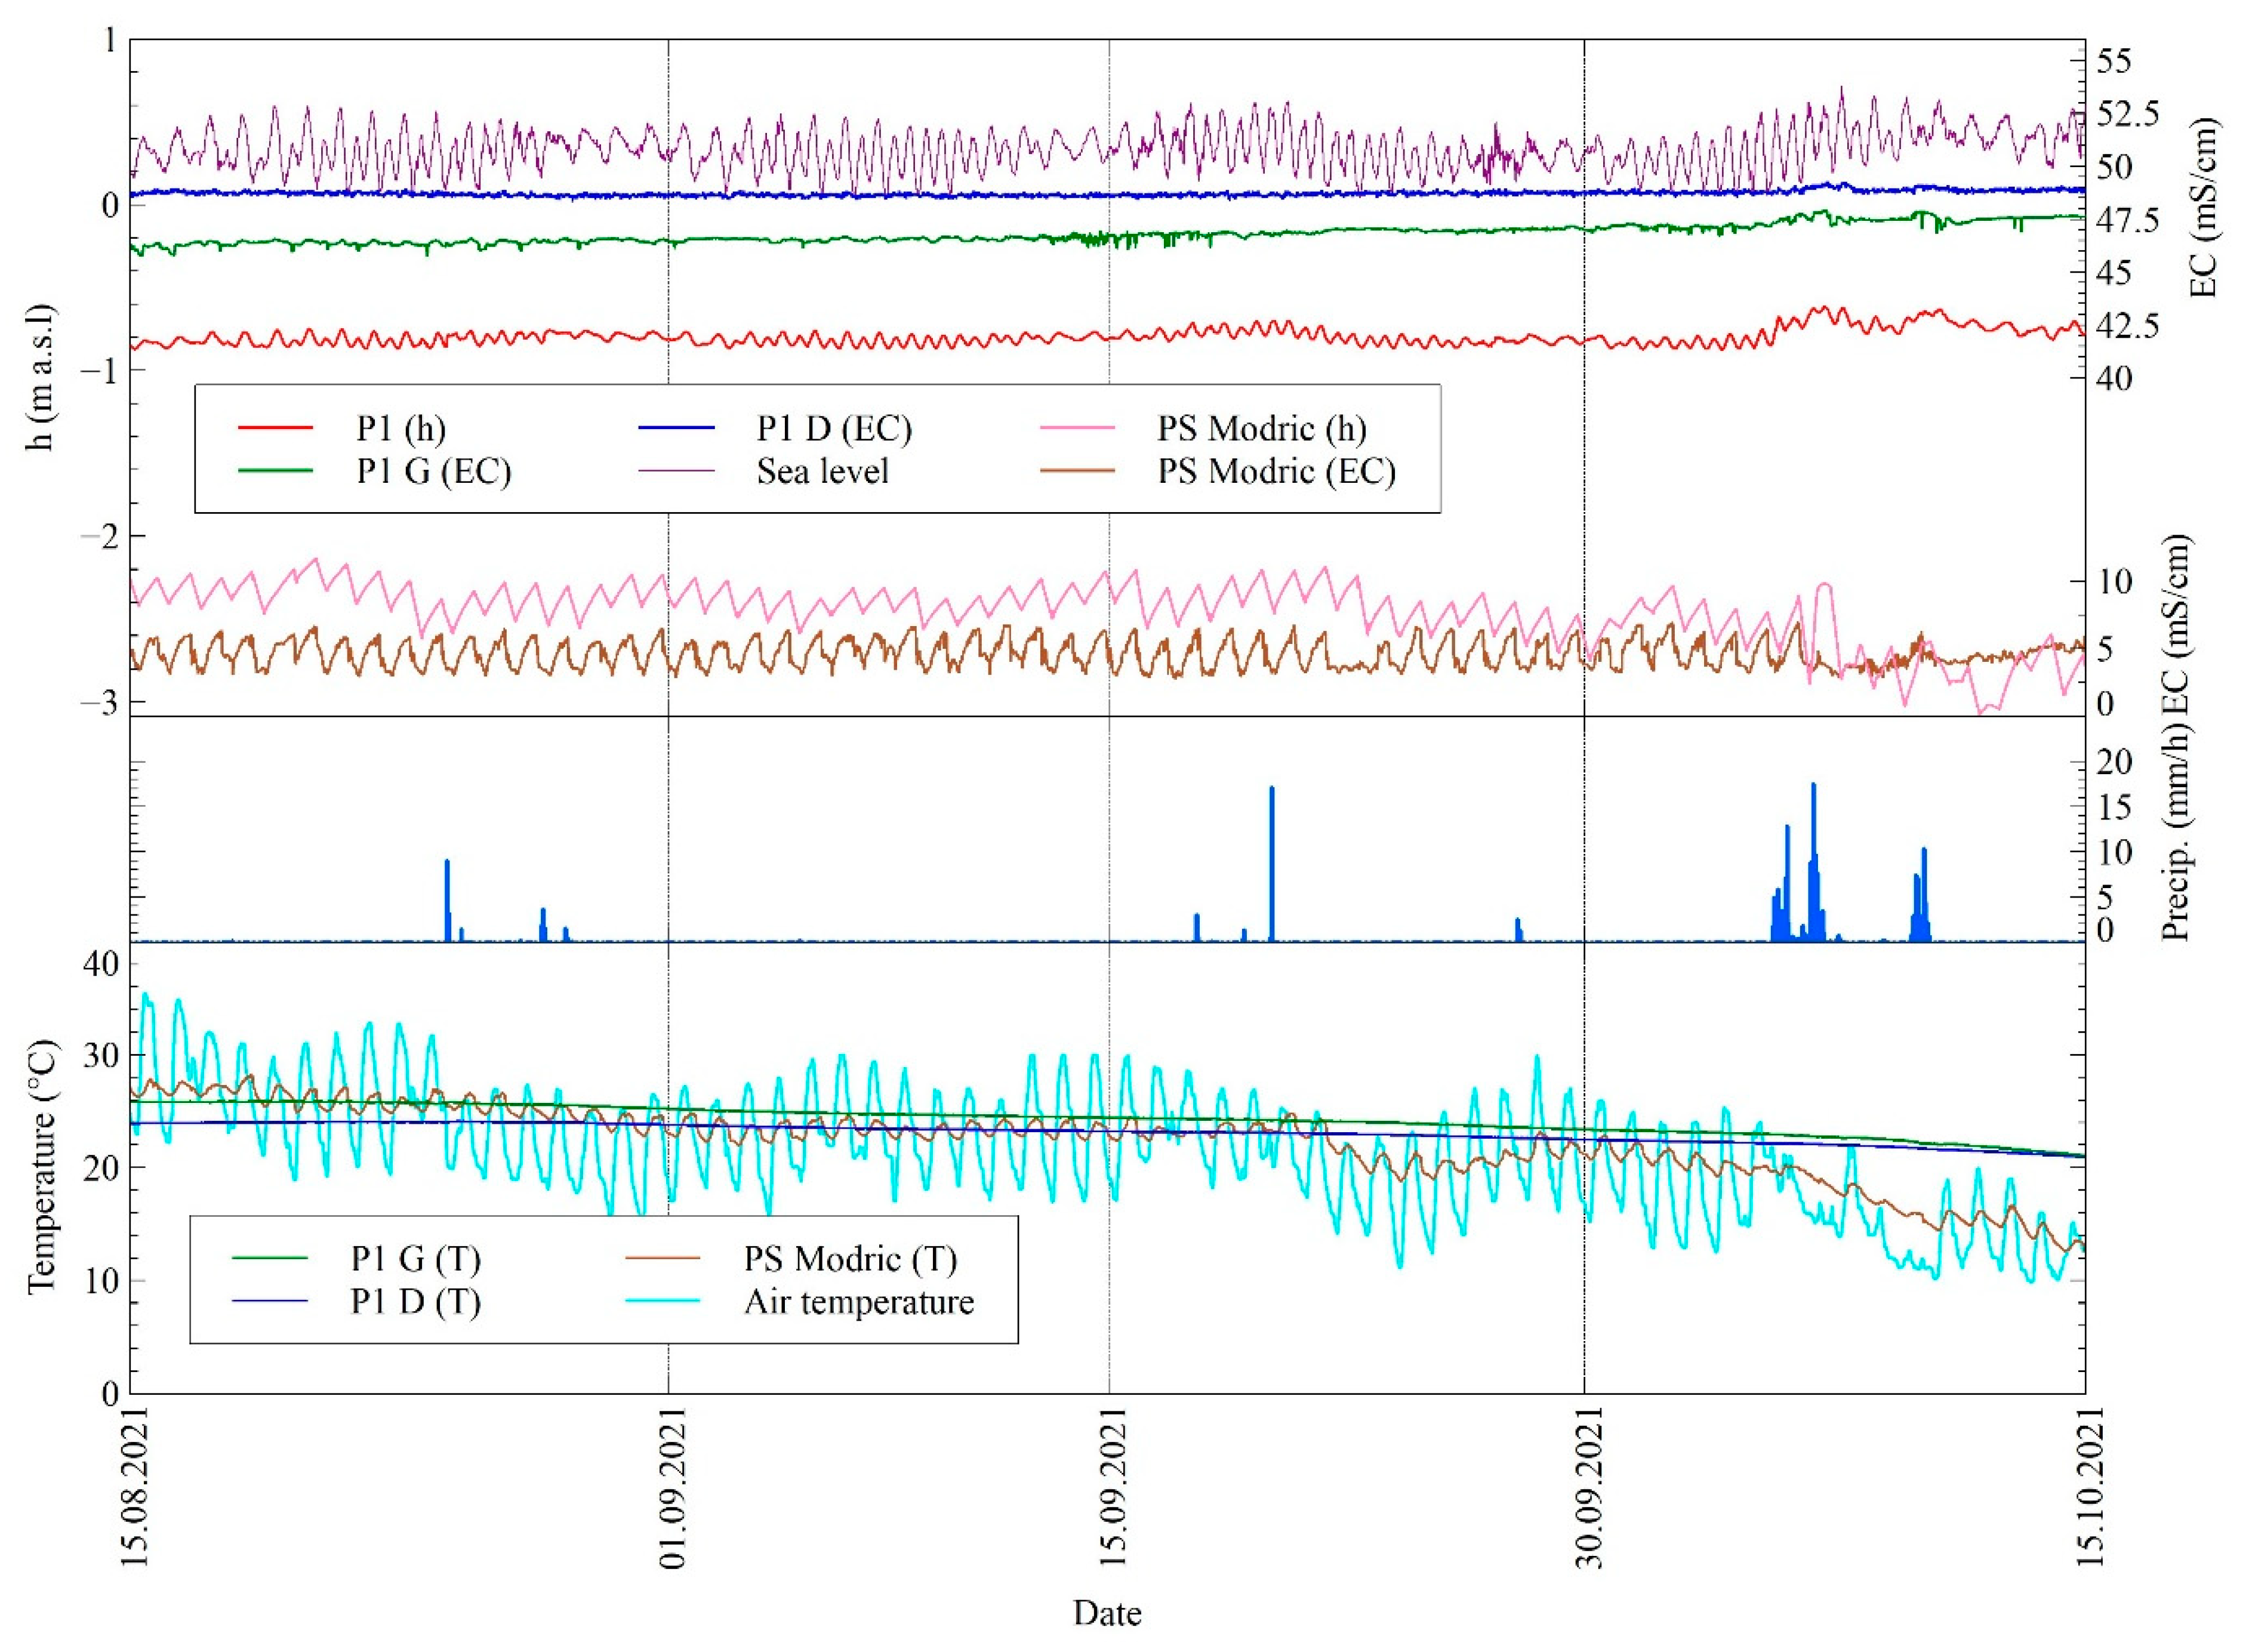
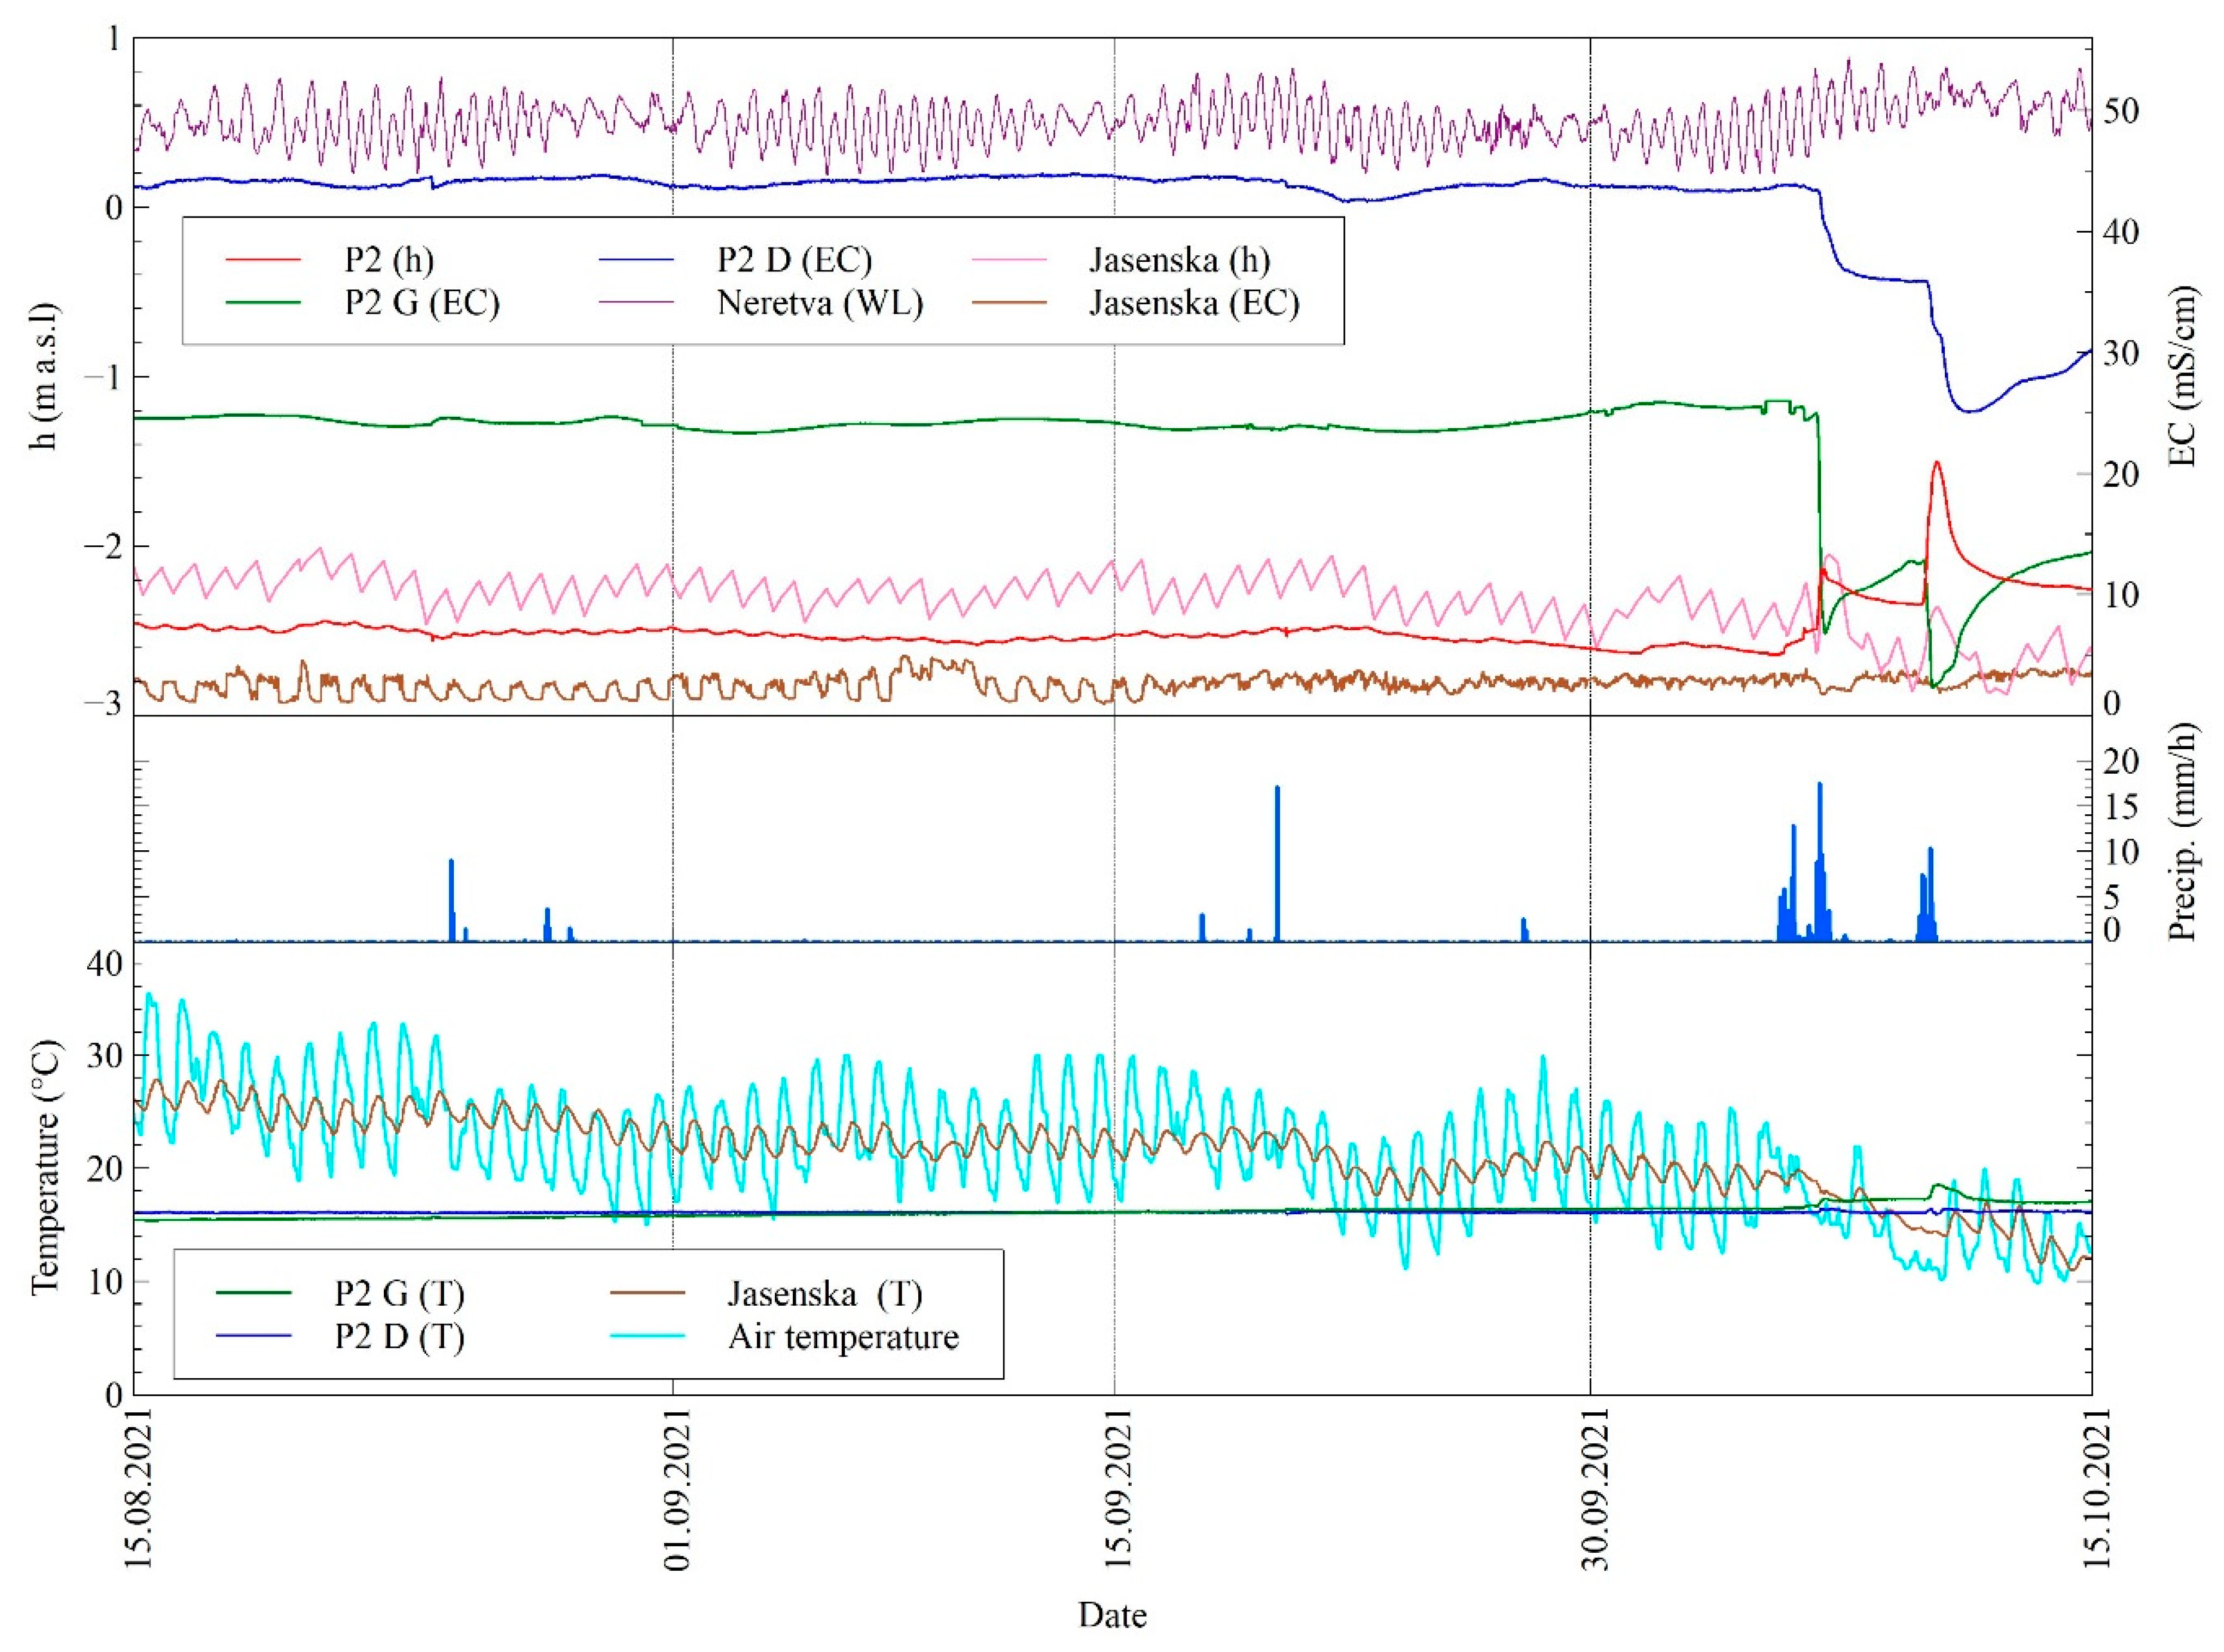
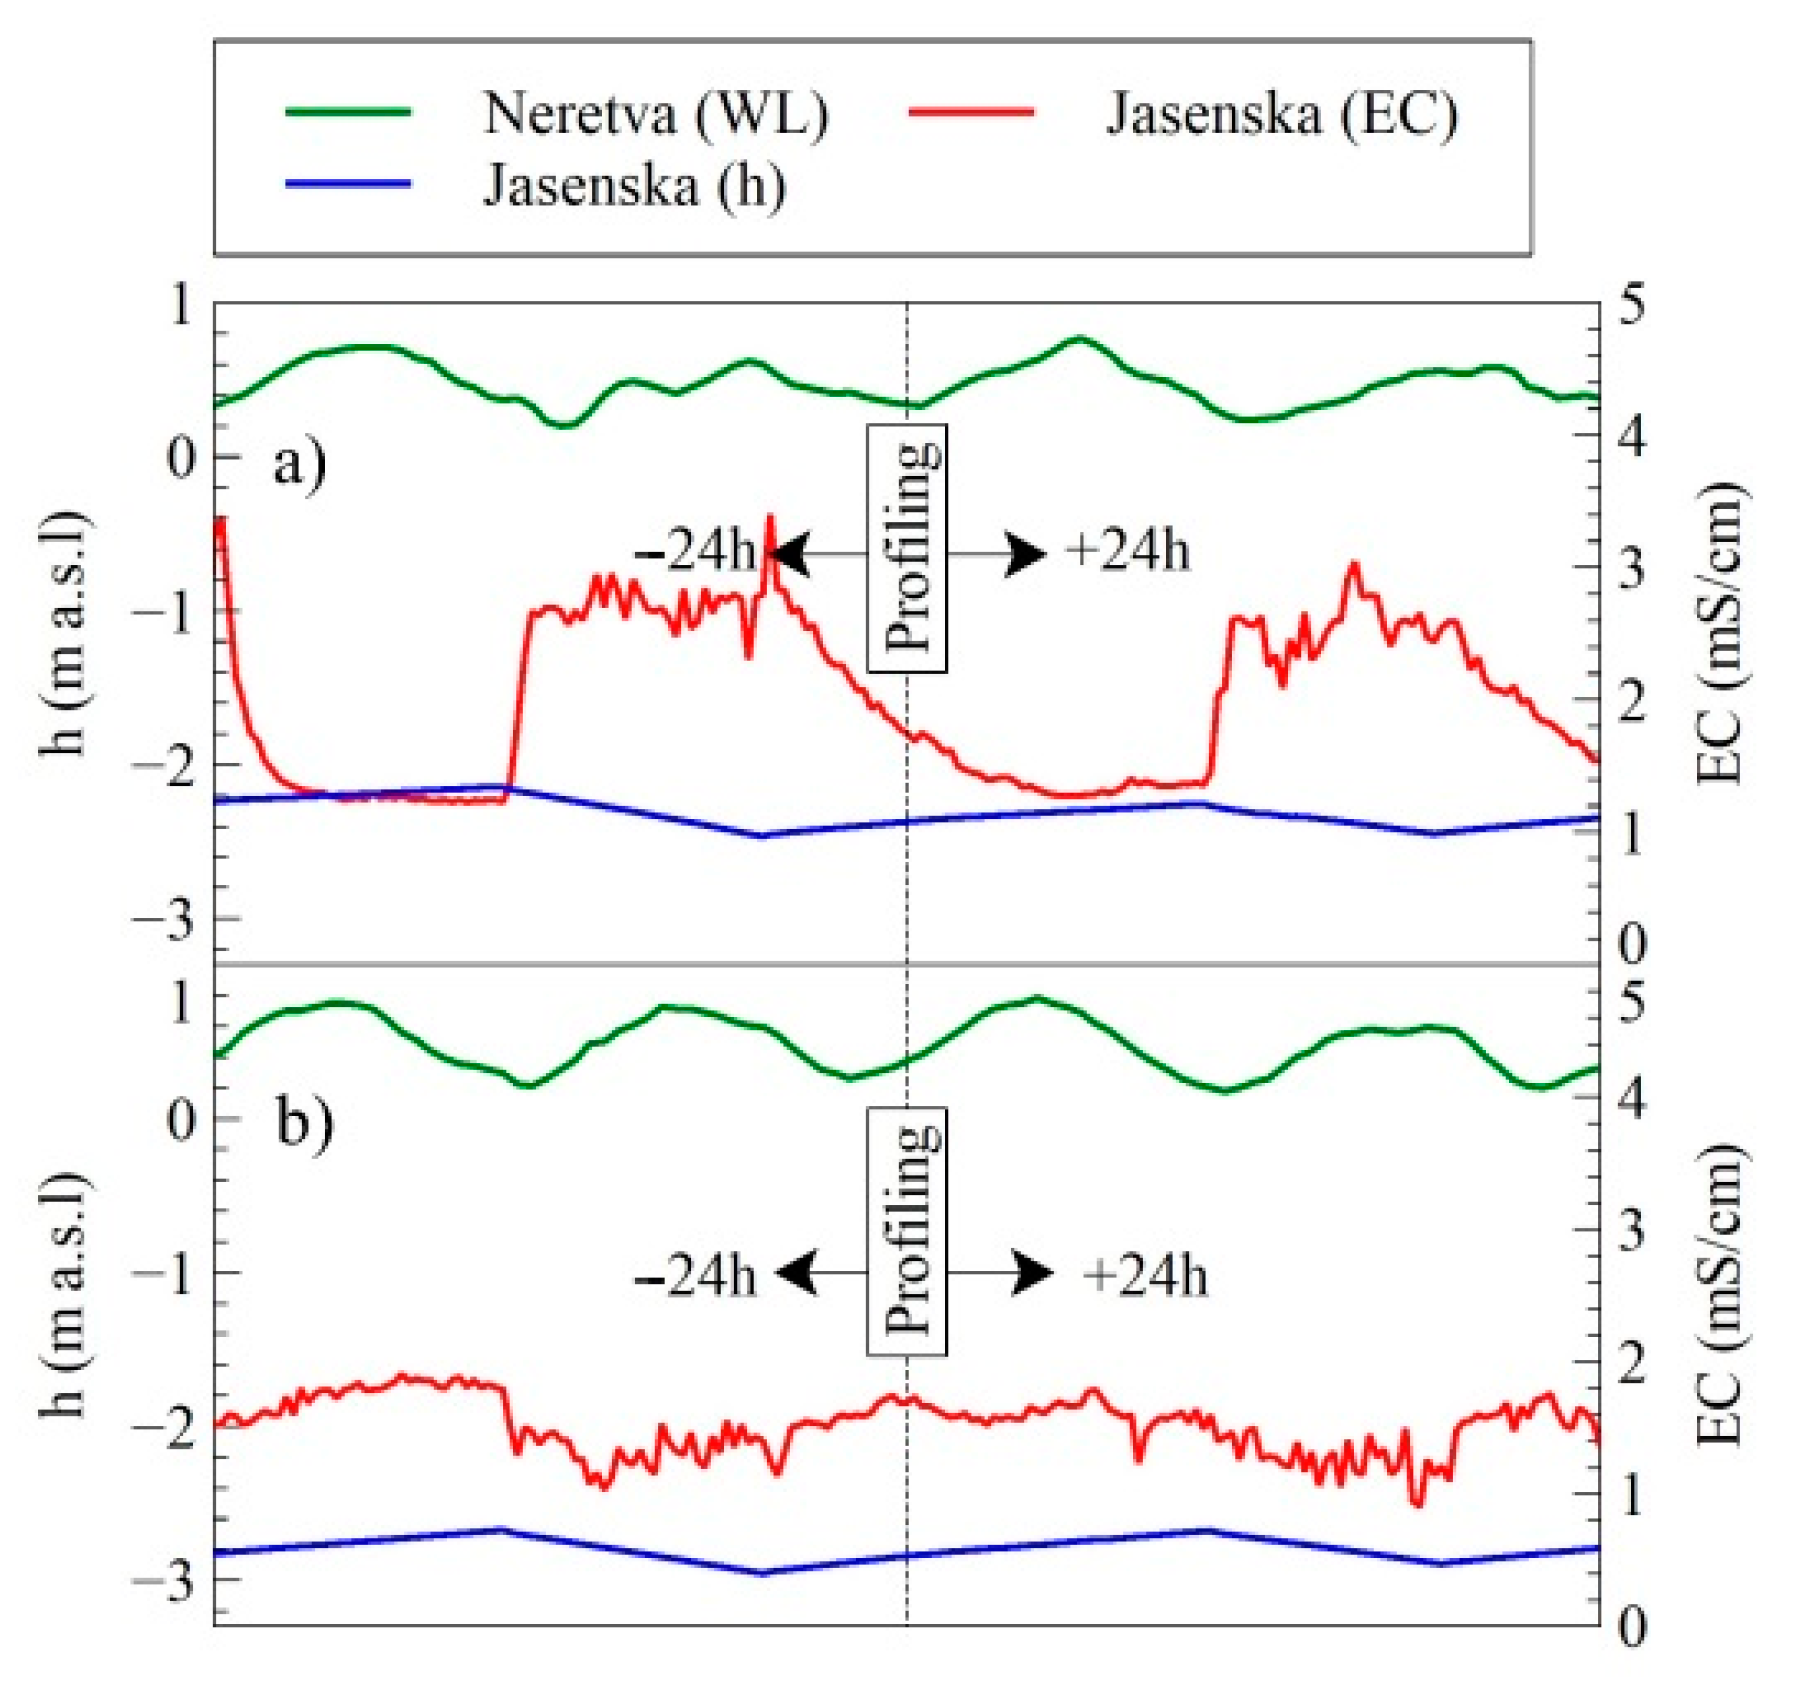
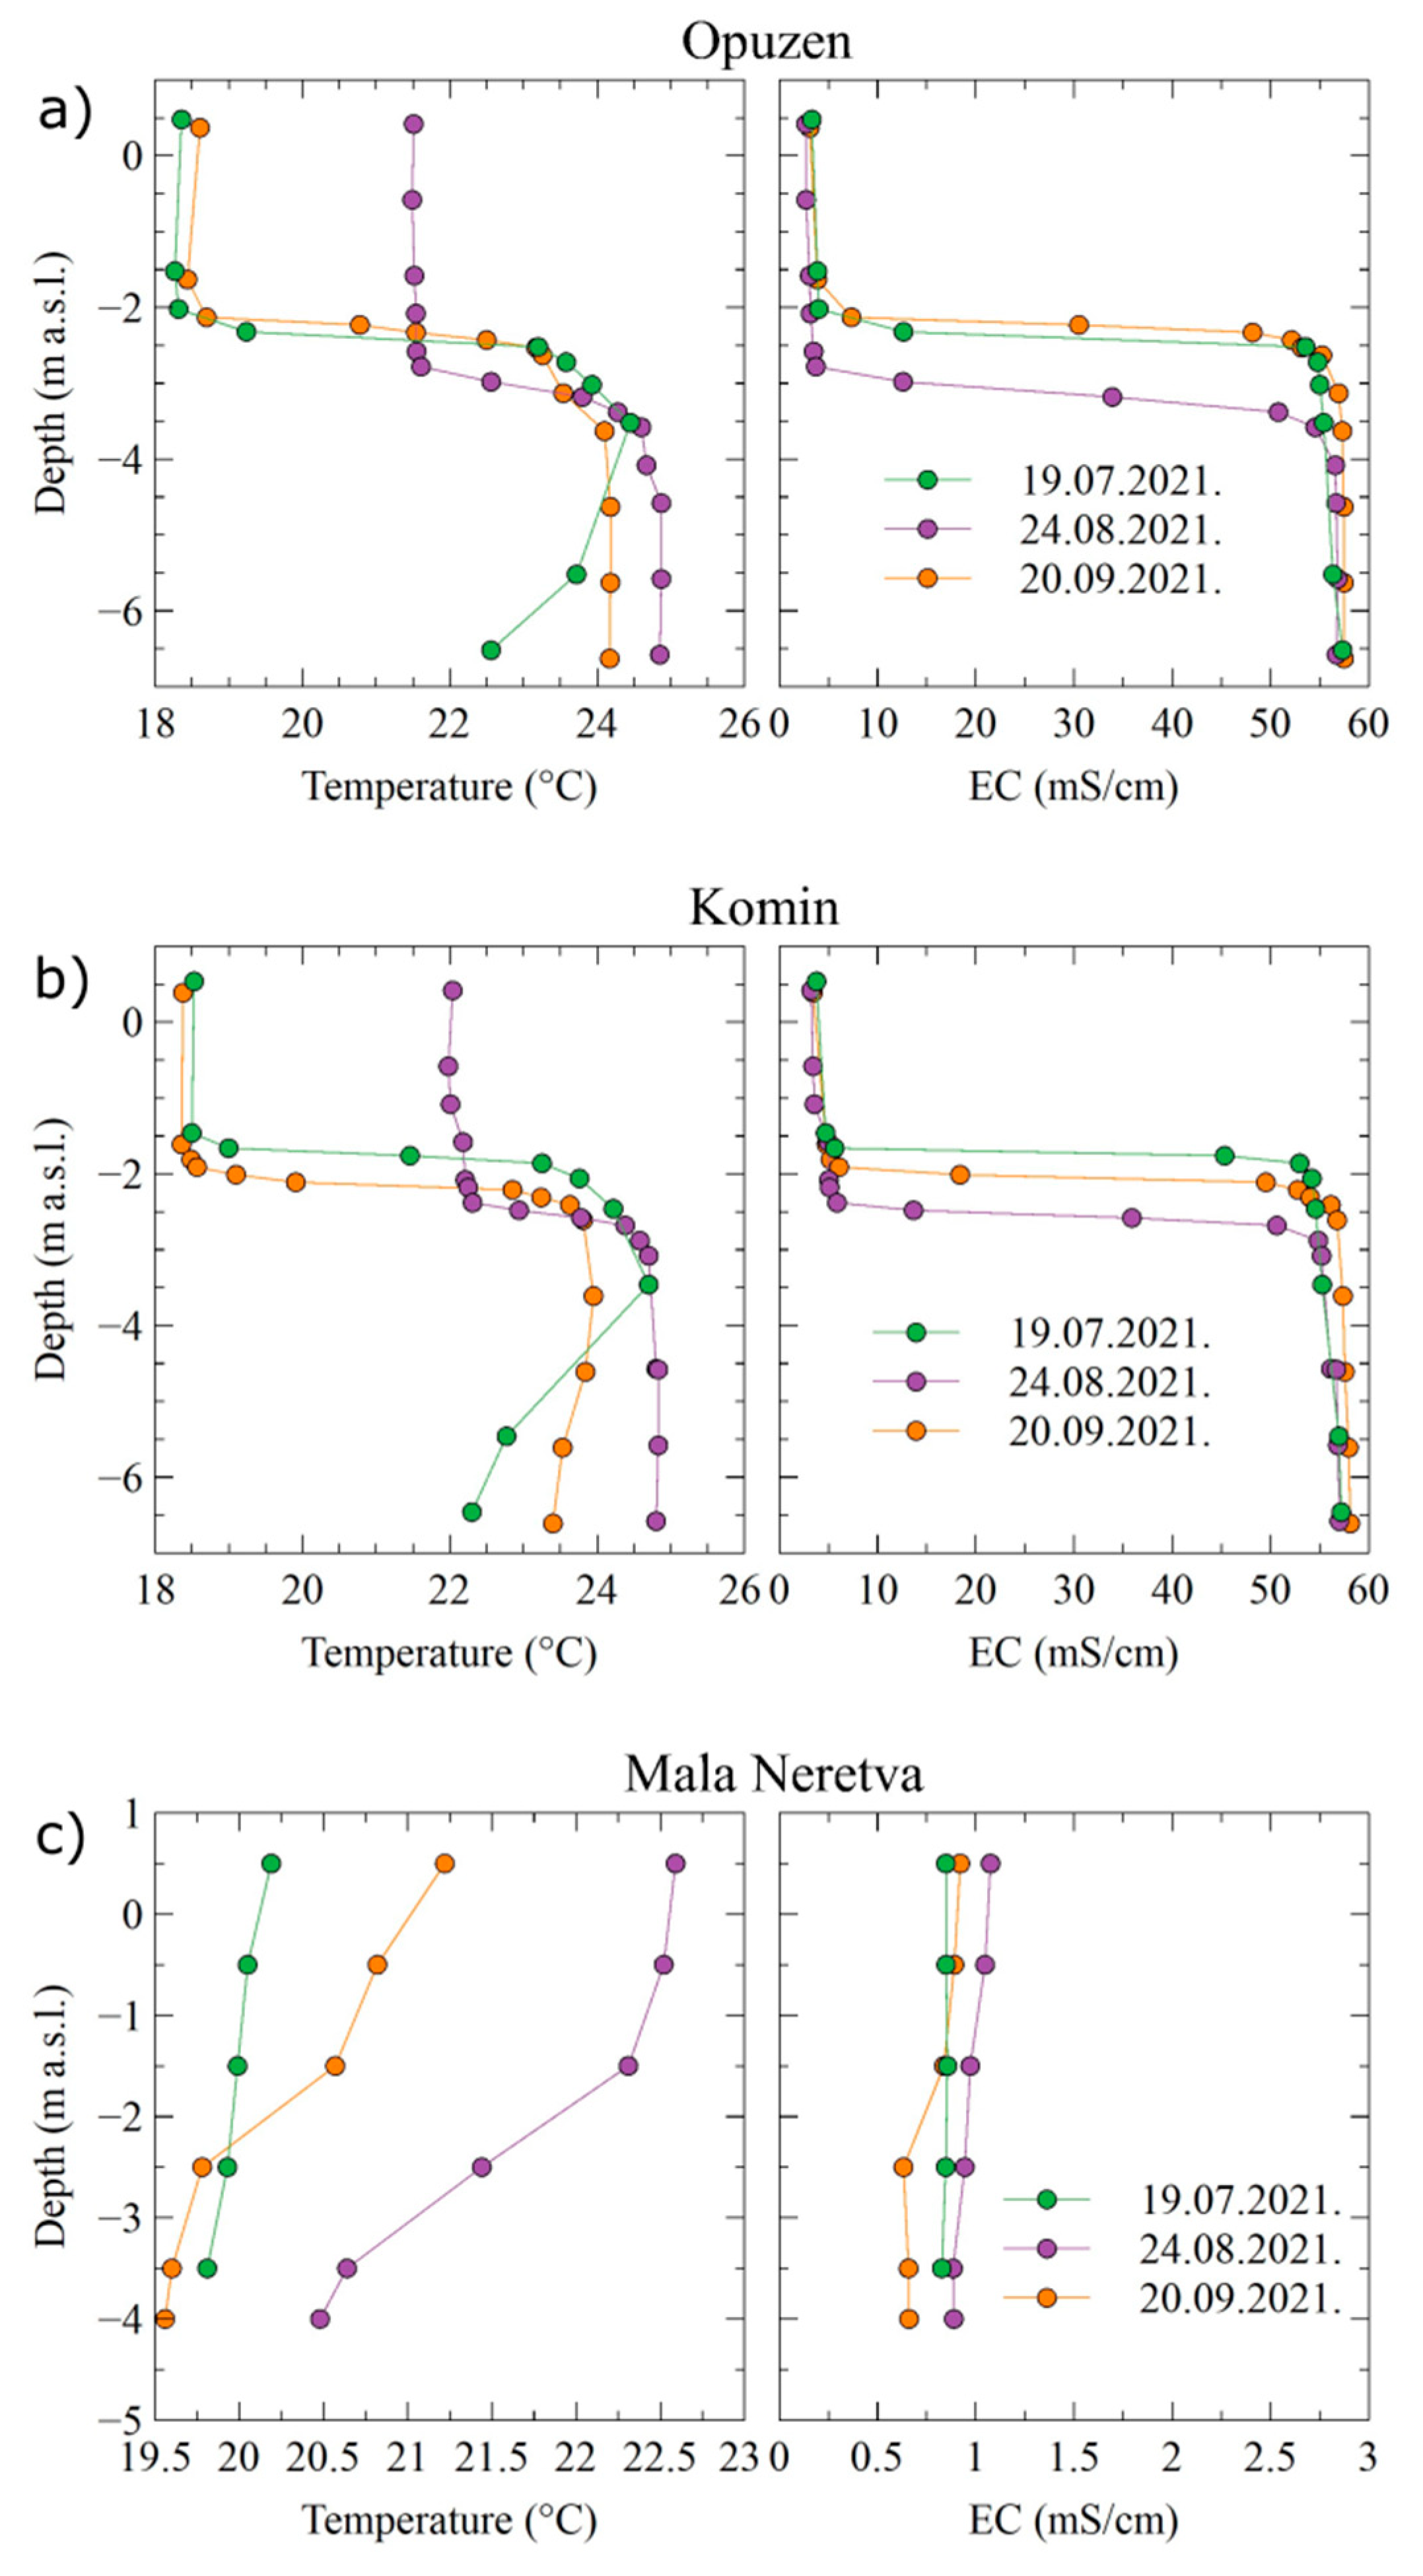
3.1. Surface Water Dynamics

The surface water monitoring system is planned and implemented to capture channel system dynamics used as a melioration and irrigation in the same time. At the left river Neretva bank, several gates are constructed to enable the inflow of river Neretva surface layer water to ensure appropriate water quality for irrigation. Gates are kept opened during the dry season, from April to October, so the Neretva river water enters the area and cause a refreshment of the water volume found inside the channel network. Due to the fact that terrain elevation has been found mostly below the mean sea level, the melioration system keeps the groundwater beneath the pedological layer. This is fully performed by the operation of PS Modric which operates mostly during the night, being put into operation at 10 p.m. and being stopped at 7 a.m., as previously explained. In this way, the system is prepared to accept daily water volume entering the Neretva valley. The deflection from the above mentioned operational regime can happen prior to the precipitation to ensure the volumetric reserve to accept expected precipitation. This is visible during the period from 5 October till 15 October in Figure 3. PS Modric intake basin water level shows a daily periodicity chainsaw feature due to the turn on/off regime. Inspection of Figure 3 also reveals significant influence of PS Modric regime to water level transience along the melioration and irrigation channels system. After the PS Modric has been put into operation, water volume found inside the intake basin is lowered unless pumps are not turned off. In the period after the PS Modric is turned off, the system is fed by water from river Neretva and from Mala Neretva, which causes the increase in water elevation until the next pumps start, explaining the chainsaw feature in surface water elevation present in Figure 3. Although located 6 km upstream from the channel, Jasenska surface water elevation time series shows significant dependence on the PS Modric. Inflow from river Neretva and Mala Neretva has been continuously enabled, but due to the limited volume of water being stored in channel network, Jasenska surface water elevation is instantaneously lowered after the pumps have been put into operation. The influence of PS Modric operational regime to surface water elevation transience at Jasenska channel has been evidenced through the coherence analysis between those two time series (Figure 4a). Significant coherence has been identified for a wide range of constituents demonstrating the effect of the PS Modric operation in the channel network surface water elevation regime. Besides the significant coherence values, Figure 4a shows an almost sudden response of the Jasenska water elevation to PS Modric operation. The above statements are based on the following facts: (i) the channel Jasenska is in direct contact with the PS Modric intake; (ii) the study area is a flat terrain without significant elevations and depressions thus enhancing the PS Modric caused effects and fastening response to PS Modric operation along the channel network; (iii) the amplitudes of water level variations in the channel Jasenska correspond to amplitudes of water level variations in the PS Modric intake (Figure 3).
Inspection of the surface water temperature features fits the explained functionality of the irrigation and melioration system (Figure 3). The main intake of fresh water is enabled through the gates at the river Neretva left bank. Neretva surface water temperature during the analyzed period has been observed 12 km upstream from Opuzen, at Metkovic bridge profile. After entering the channel system, water temperature increases due to the effect of heating from atmosphere and the fact that channels are pretty shallow. The fact that maximum temperature has been observed between 1 and 3 p.m. everyday corresponds to daily induced air temperature changes caused by solar radiation. The increase in surface water temperature is higher as the water retention time in channel network is increased. This is especially noticed in the detection of maximum peak temperature values in Figure 3. Water temperature observed at PS Modric intake shows highest values ranging between 23 and 28.23 °C.
Figure 4b shows daily induced oscillations of water temperatures having an almost in-phase evolution of the diurnal cycle. Both water temperature time series show common long-time trends corresponding to the same meteorological/climatological conditions found over the study area during the analyzed period.
Coherence features shown in Figure 4c show that the EC values of Jasenska channel and Modric intake are out of phase indicating a time lag equal to half of the period. The exception is the period of the first half of October, reflecting the precipitation occurrence.
Due to the presence of moderate salinity-induced stratification in the PS Modric intake basin [36] and pump intake elevation being set up close to the basin bottom, the very first effect of pump operation is visible through the sudden decrease in EC characterizing the intake basin water (Figure 2a,b). It is important to notice that the probe is positioned 0.50 m above the intake basin bottom, so the pumps evacuate the water found at the bottom while the surface water column with lower EC reduces observed EC at the probe as the water level is decreased. The reduction in PS Modric EC is noticed during the operation of the pumps. After pumps have been stopped, further transience in EC as observed at the PS Modric intake has been determined by the inflow from the channel system. As the water level in the basin is reduced, the water found within the channel network supply the intake with water by gravity inertia and cause the increase in EC. Following the EC values observed at Jasenska channel, which are lower than those of Modric intake, it is obvious that the residual salt contamination found along the channel downstream from Jasenska contributes to the increase of the Modric intake EC.
The lowest observed EC value at Jasenska does not fall below 0.97 mS cm−1. After the PS Modric has been put into operation, Jasenska EC is characterized by a sudden increase up to 2.2–3.5 mS cm−1. After being put into operation, PS Modric leads to the reduction in the surface water elevation at Jasenska channel thus creating a gradient and ensuring the inflow from the gravity area. After the PS Modric pumps are out of operation, the decrease phenomena in EC are noticed.

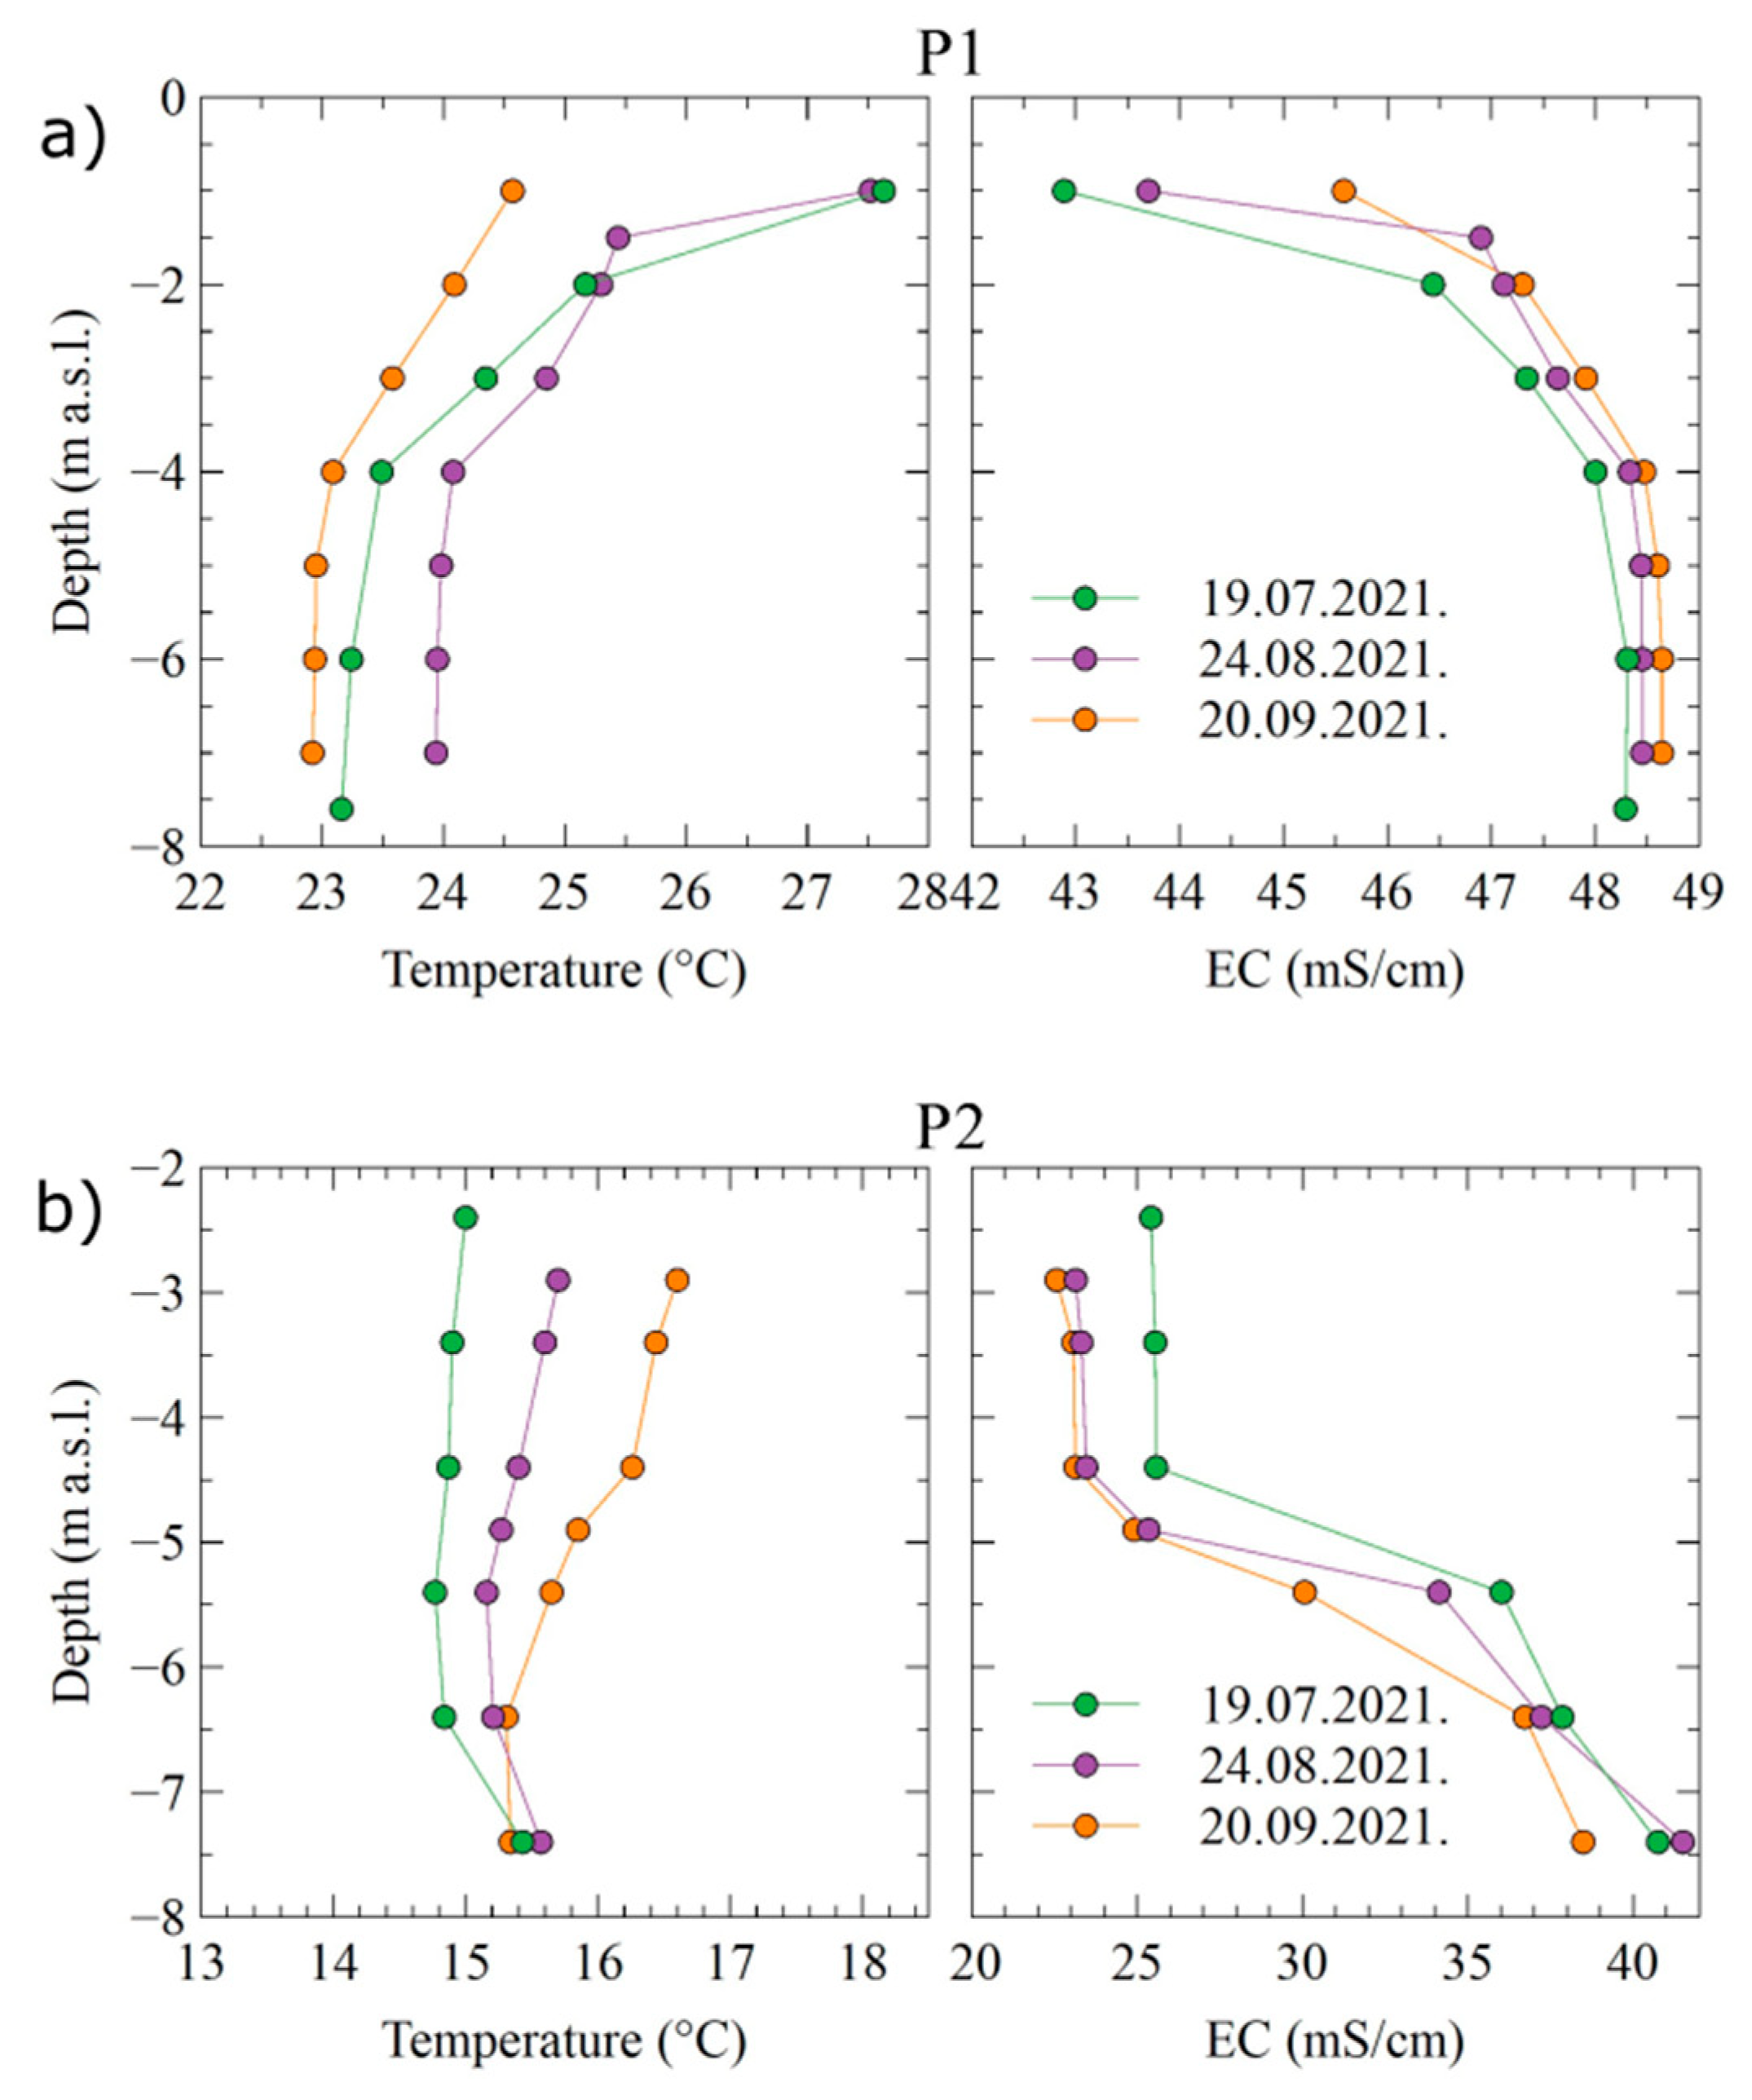
3.2. Groundwater Dynamics

Sea level oscillations in the area of interest are of mixed semidiurnal type, mainly represented by the presence two lunar and two solar components O1, K1, M2 and S2 [33], with obvious periodic transfers from neap to spring tide and vice versa. Insight to Figure 5 emphasizes the occurrence of active seawater intrusion as identified by the lower P1 groundwater level compared to the sea level. The latter has been caused by the effect of the operative regime of PS Modric which is a 20 m3 s−1 capacity pumping station with a main purpose to collect water from Crepina, Jasenska and Diga areas, ensuring the ground water level is kept beneath the pedological layer. Due to P1 location, features of the groundwater level as observed within the piezometer are influenced by both sea level oscillations and PS Modric operation. While the mean groundwater level is defined by the predominant influence of the PS Modric, the presence of tidal constituents within the observed sea level time series implies the influence of the sea level at Diga area groundwater.
P1 groundwater EC and T have been observed at two probes, G and D, respectively, installed at different depths as explained in Materials and methods section. While the EC characterizing deeper groundwater column (probe D) shows a stable nature with values ranging between 48.31 and 49.27 mS cm−1, the upper probe (probe G) shows a slight increase in trend from 45.71 to 47.93 mS cm−1. Precipitation occurrence reflects stress in both EC signals. Groundwater temperature at probe D shows lower T values compared to G probe which recalls the effects of the air temperature and its influence on groundwater. Compared to PS Modric intake water T, groundwater T observed at P1 seems stable at both probes. Obvious similarities in both temperature trend and daily changes imply the constraint in PS Modric intake basin depth which leads to a faster response to solar radiation.
Groundwater level regime in P2 is significantly influenced by the PS Modric regime since the Jasenska channel is located only 80 m away from the piezometer and the fact that Jasenska water surface elevation is higher than P2 groundwater level for 20 cm on average during the dry period. Precipitation occurrence results in the increase of groundwater level not only at P2 but also within the Jasenska channel (Figure 6).
Temperature within the P2 shows stability during the analyzed period, without significant stratification along the groundwater column. Slight changes in T have been noticed in correspondence with precipitation occurrence between 5 October and 15 October 2021, especially as observed at the G probe. Precipitation during this period contributes to a decrease in EC as observed on both probes. EC observed at G probe shows a faster response to precipitation as well as a faster reduction in observed EC value. During the dry period, significant stratification in P2 groundwater EC is present, with G probe EC ranging between 23.31 and 25.86 mS cm−1, and D probe EC ranging between 42.43 and 44.81 mS cm−1.

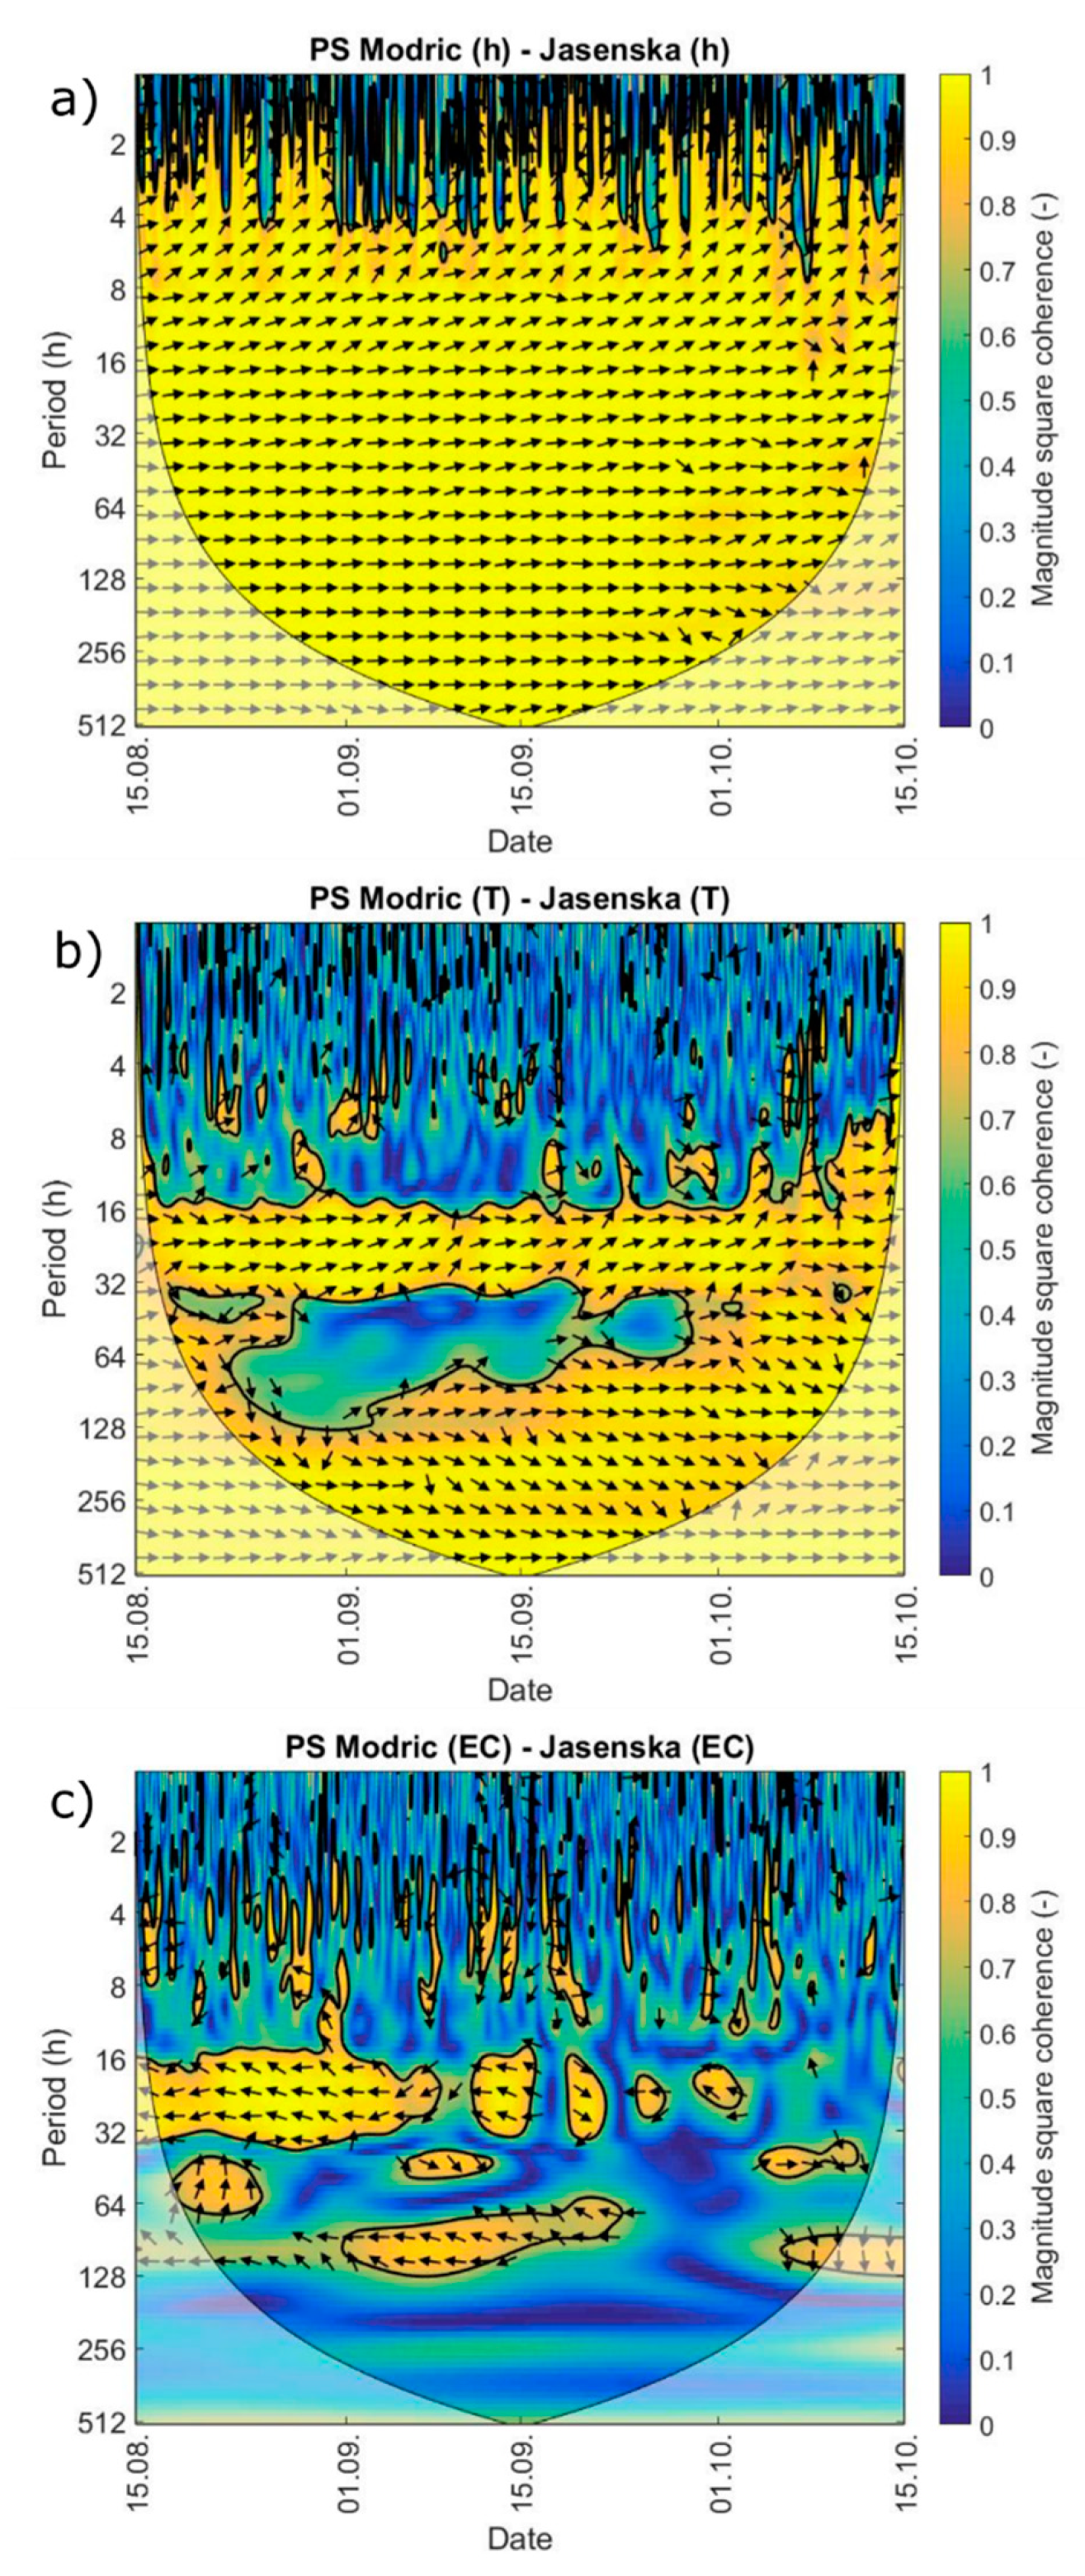
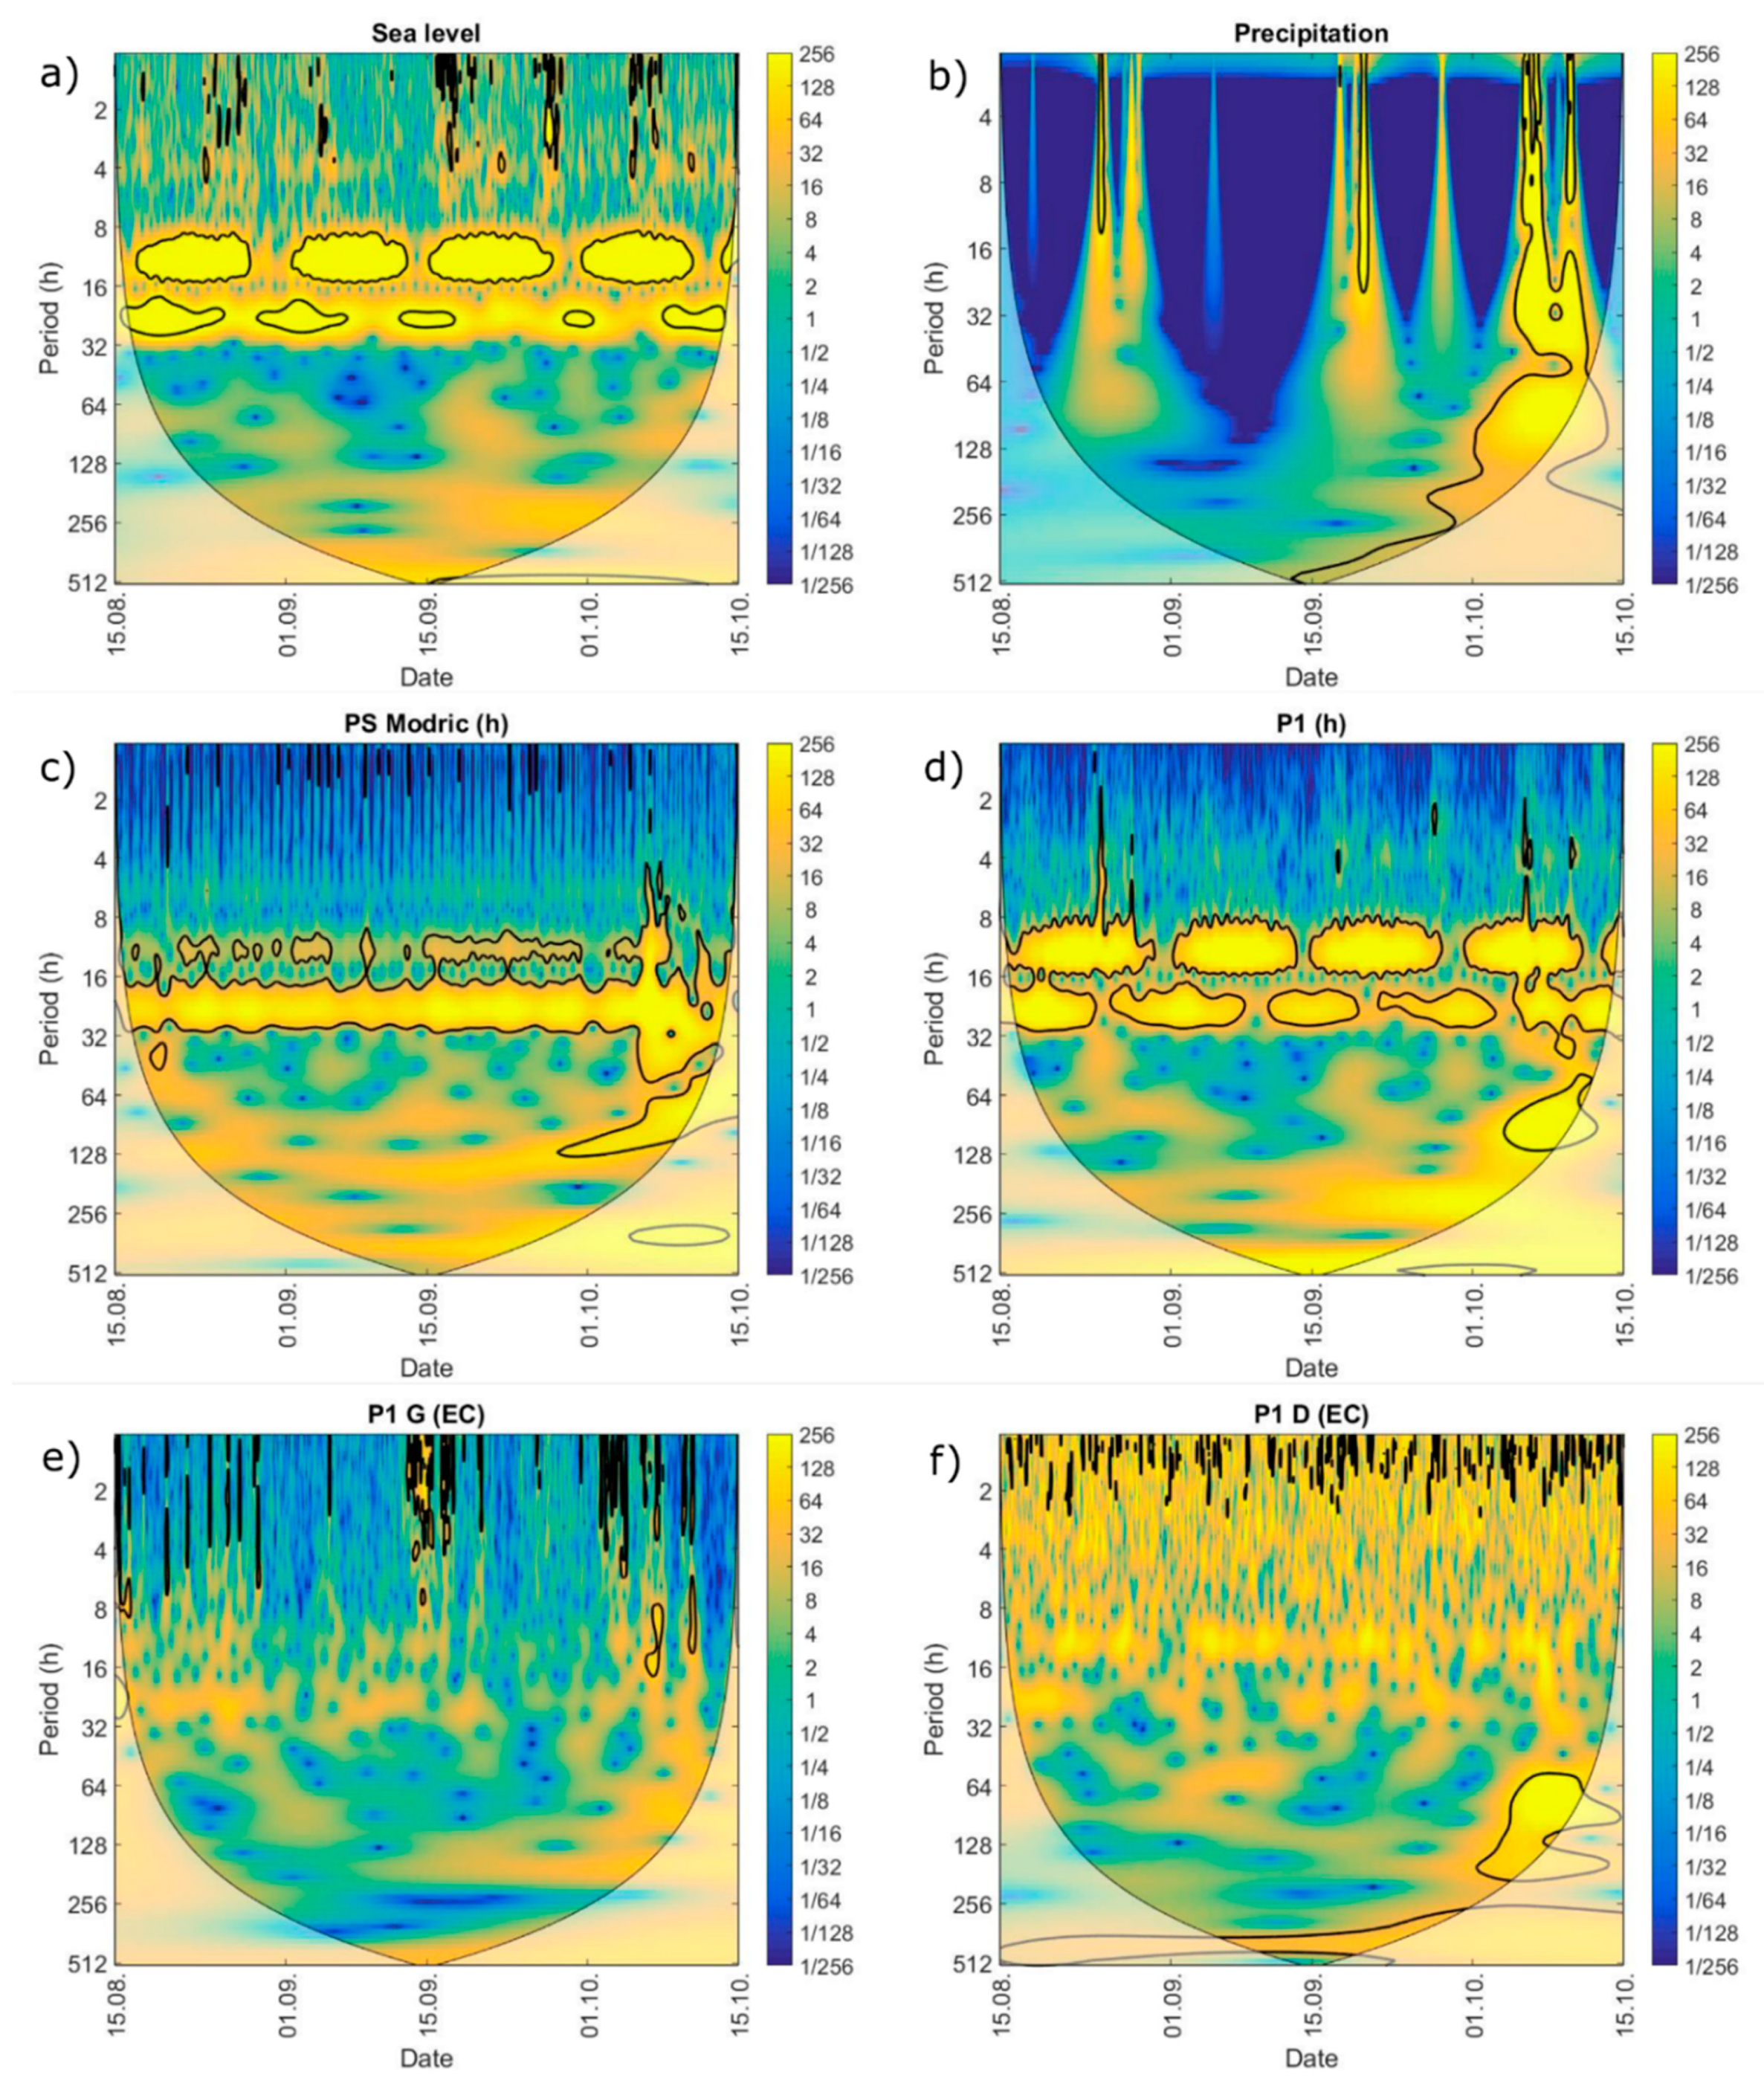
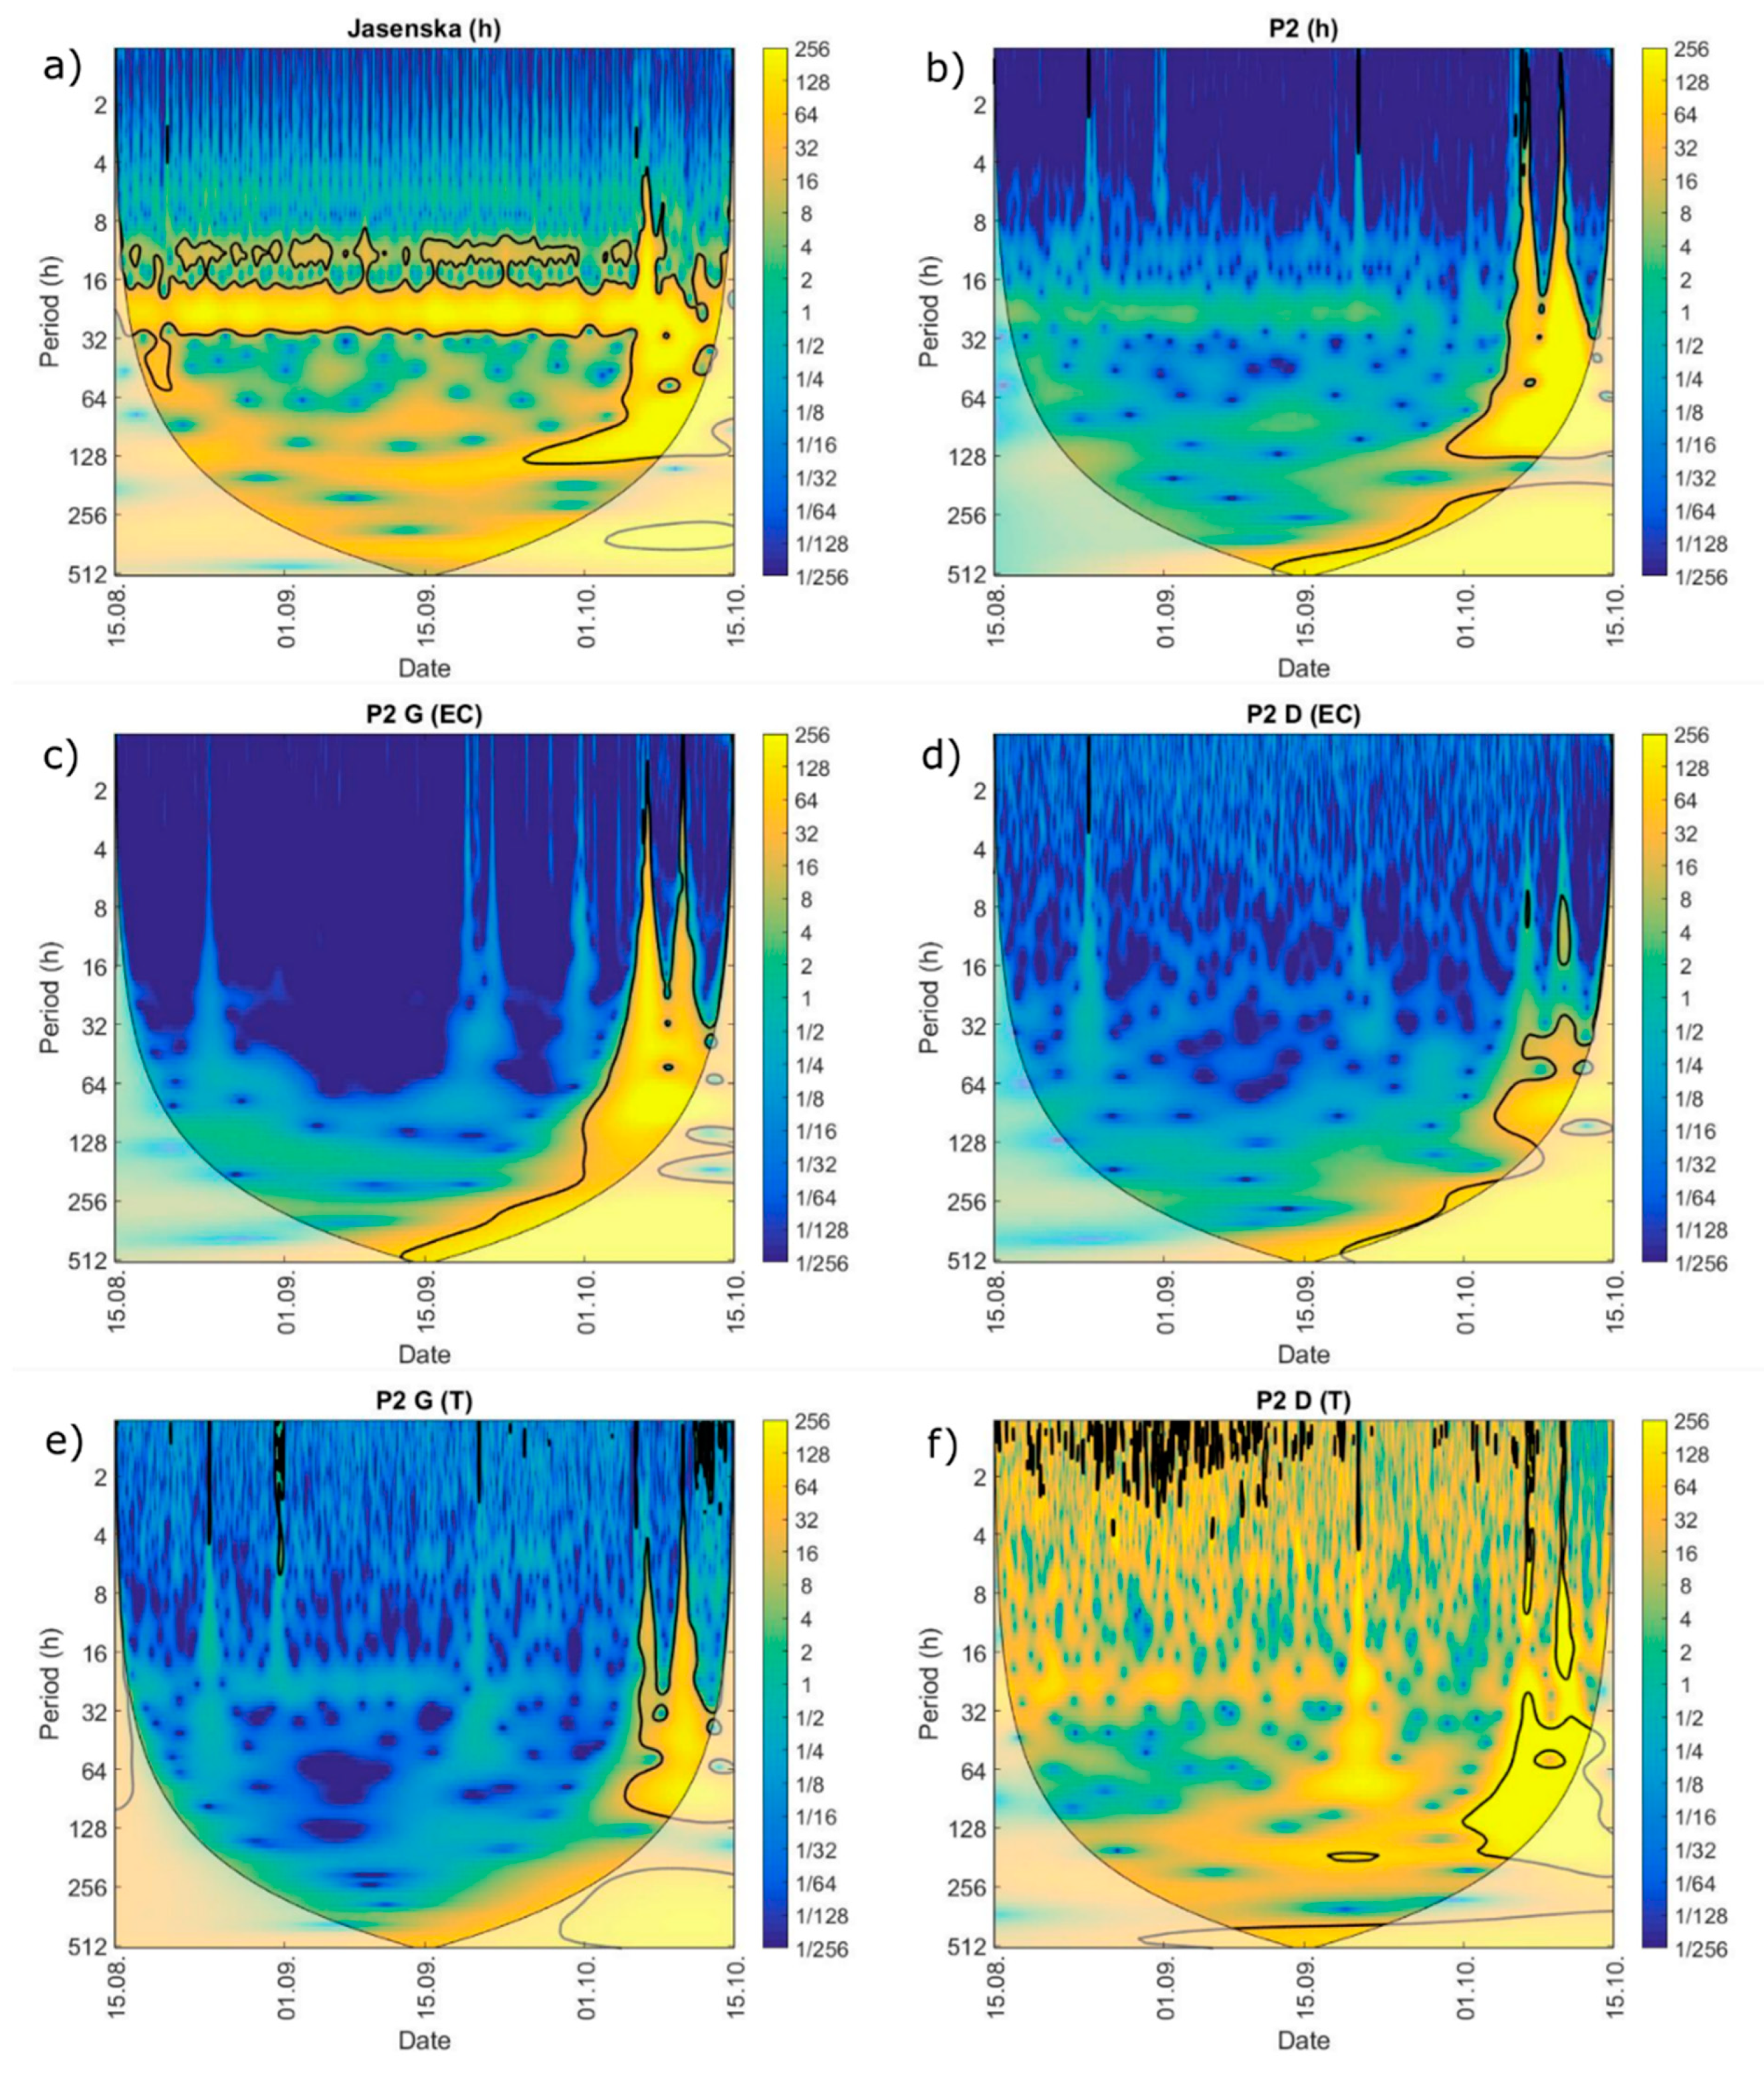
3.3. Periodicity Features

Scalogram is a useful way to express periodicity features of time series with reference to characteristic frequencies or periods [40,41]. Hereby, we select and present six scalograms respectively, seawater level, precipitation, PS Modric intake water level, P1 groundwater level, EC G probe as observed in P1 and EC D probe as observed in P1 (Figure 7a–f).
Seawater level signal shows the energy peak at periods corresponding to 12 and 24 h, referring to mixed semidiurnal tidal features (Figure 7a). Same spectral signature is observed for P1 groundwater level signal (Figure 7d) emphasizing the influence of the sea level in the spectral signature of groundwater level regime at Diga area. Besides the similarity to sea level constituents, P1 groundwater scalogram shows temporally local sensitivity to precipitation. Figure 7b shows the concentration of the signal energy corresponding to the precipitation occurrence (late August, mid September, first half of December as visible in Figure 4). By comparing Figure 7b,d it is obvious precipitation defines the Diga area groundwater level regime differently than tidal induced constituents. A similar feature has been observed for the PS Modric intake water level (Figure 7c) during precipitation occurrence in October 2021. Taking into consideration previously explained daily operative regime of PS Modric, scalogram shows significance of the intake water level frequencies corresponding to 24 h.
EC nature as observed at the probes in P1 highlights the difference in energy concentration for observed time series (Figure 7e,f). D probe EC series shows clear presence of tidal constituents which implies the connection to the sea (Figure 7f). Due to the fact that this area is characterized by active seawater intrusion because of local hydrogeological conditions induced mainly by PS Modric regime, whole aquifer profile is contaminated by the seawater. In this way, scalogram of the EC observed at G probe also shows tidal characteristics, but with smaller energy concentration found within tidal periods. Besides the tidal induced EC variabilities, upper water column layer energy signal is not dispersed only along the dates and frequencies corresponding to external loadings, primary precipitation, but also shows a trend presence (Figure 7e), visible also in Figure 5. Figure 7f shows higher energy of the EC observed in the D probe corresponding to the precipitation periods (54–128 h), although the upper layer is more sensitive to external loadings from the surface. This is an artefact of the noise presence within the observed EC signal. Due to the enhanced loadings from the surface, G probe EC time series suffers from the noise (Figure 5), which disperses signal energy all over the frequency covered by the scalogram presentation. Contrary, the evidence of the precipitation at D probe whose EC signal shows less presence of noise, is within the observed signal (Figure 7f).
While channel Jasenska surface water fluctuation scalogram shows the presence of daily fluctuations caused by PS Modric operative regime (Figure 8a), P2 groundwater level is characterized by the energy of the signal being found during the precipitation occurrence period (Figure 8b). P2 temperature shows similar scalogram features, being more pronounced for G probe (Figure 8e,f). The difference in scalograms for the T time series observed at G and D probes in P2 stems from significant external influence on the temperature in upper layer, so more concentration of the signal energy corresponding to precipitation has been detected at the deeper groundwater layer of P2. A similar influence of precipitation has been observed in EC scalograms observed at P2 probes (Figure 8c,d).

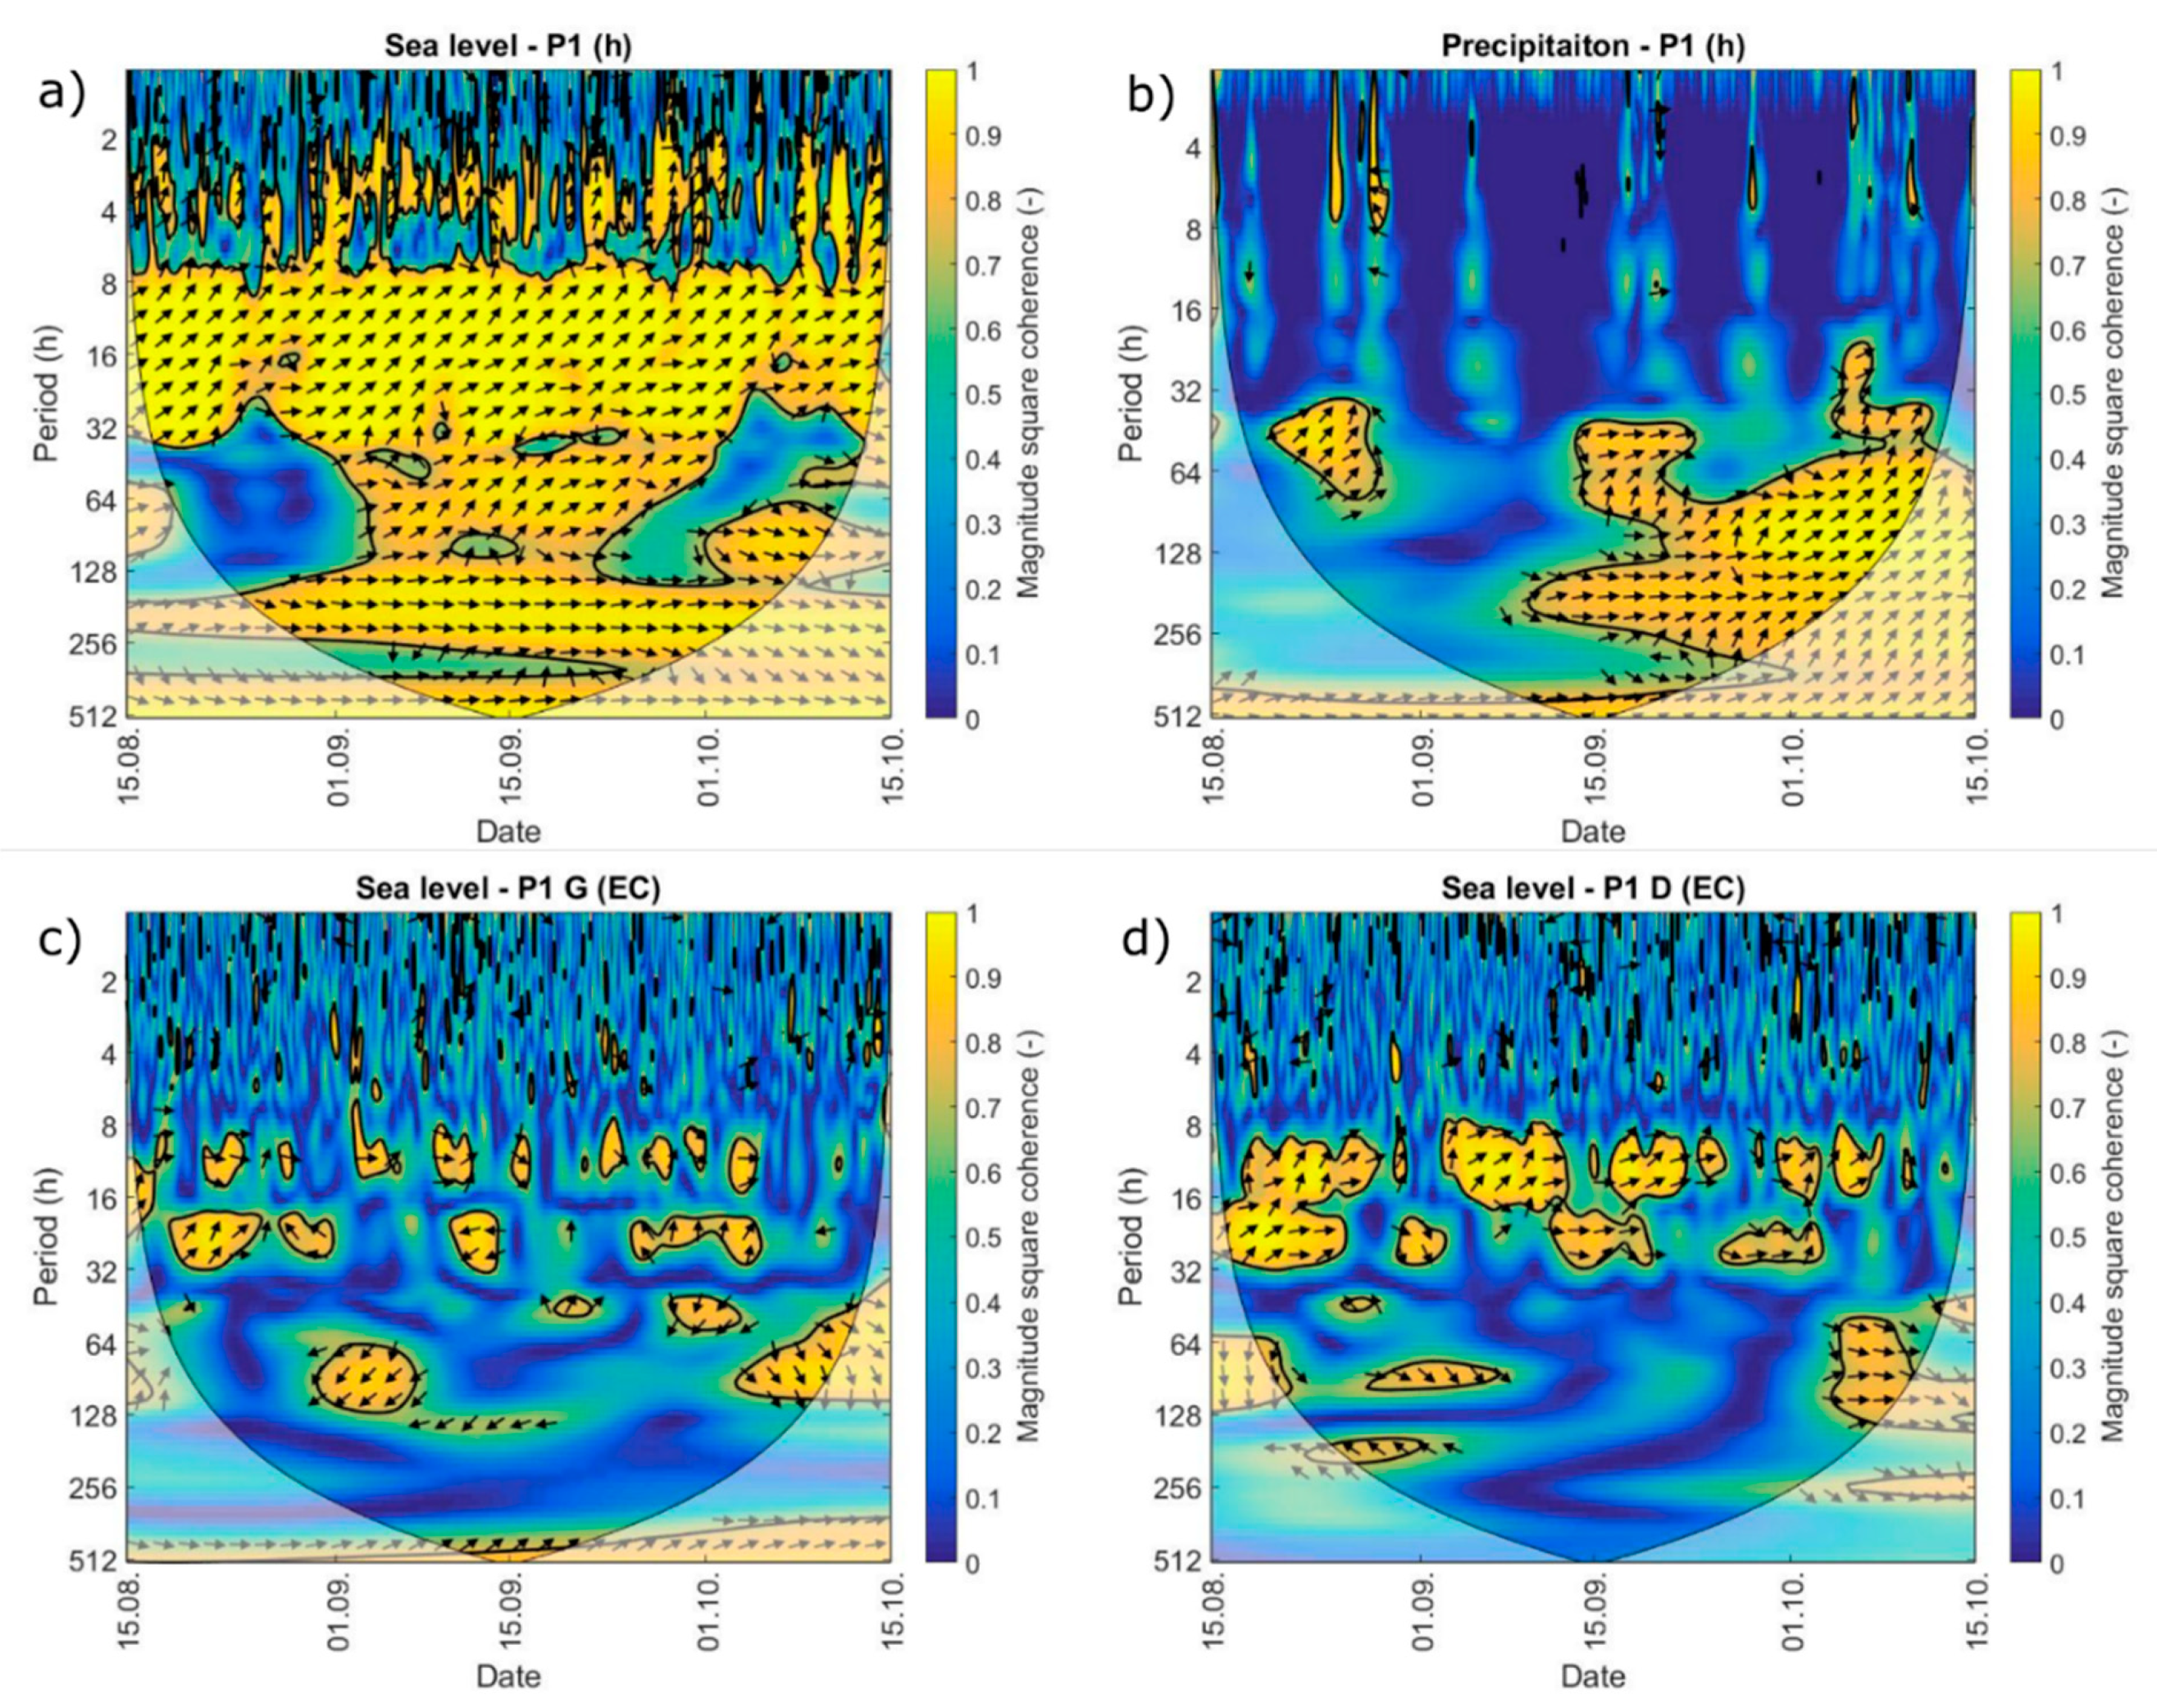
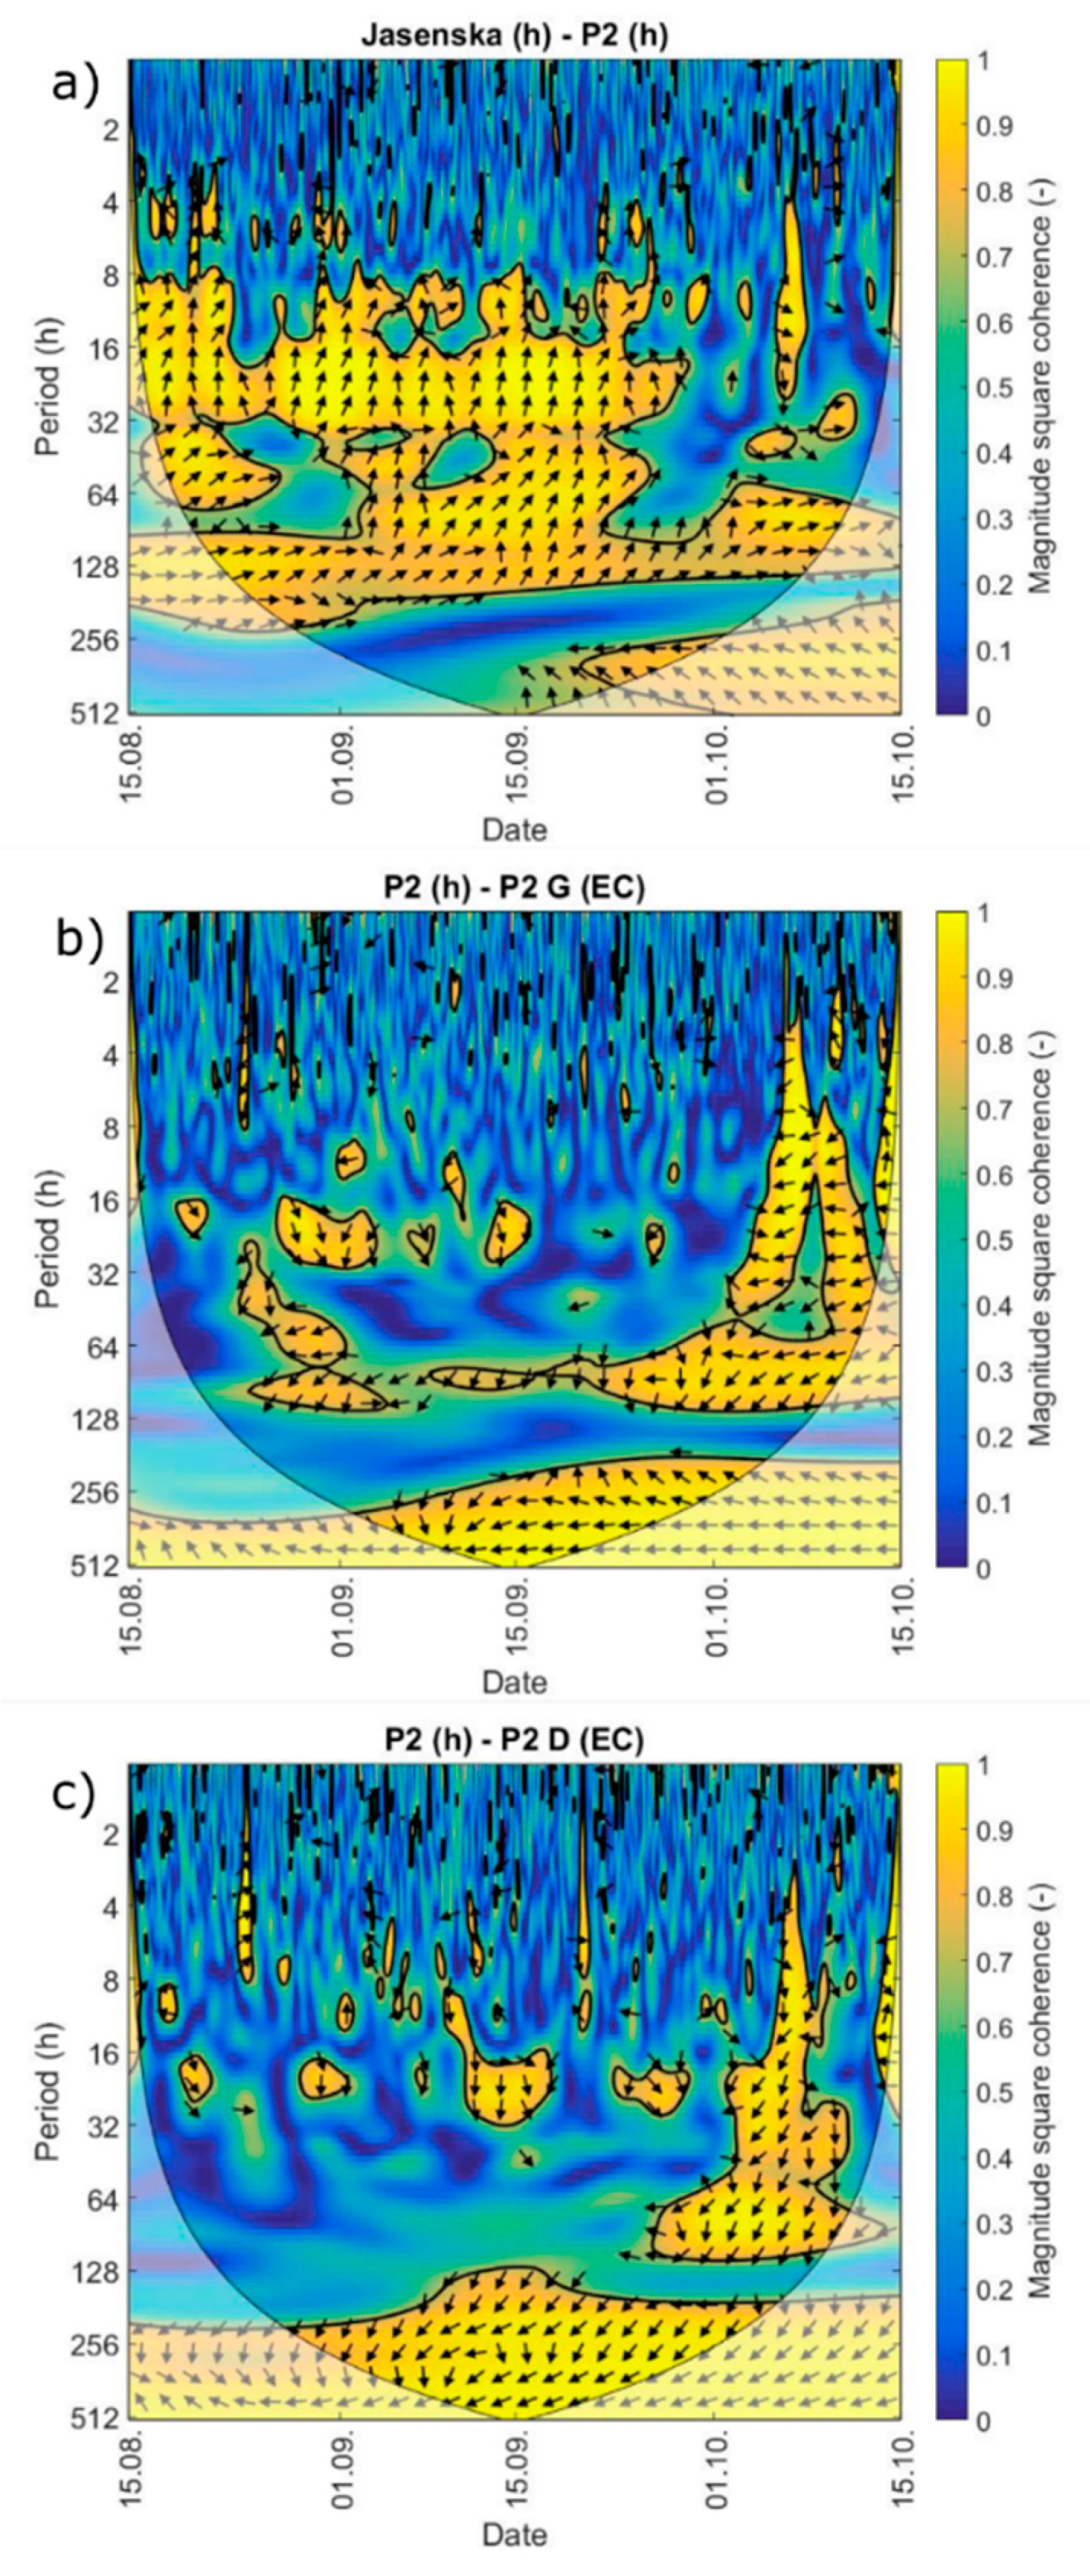
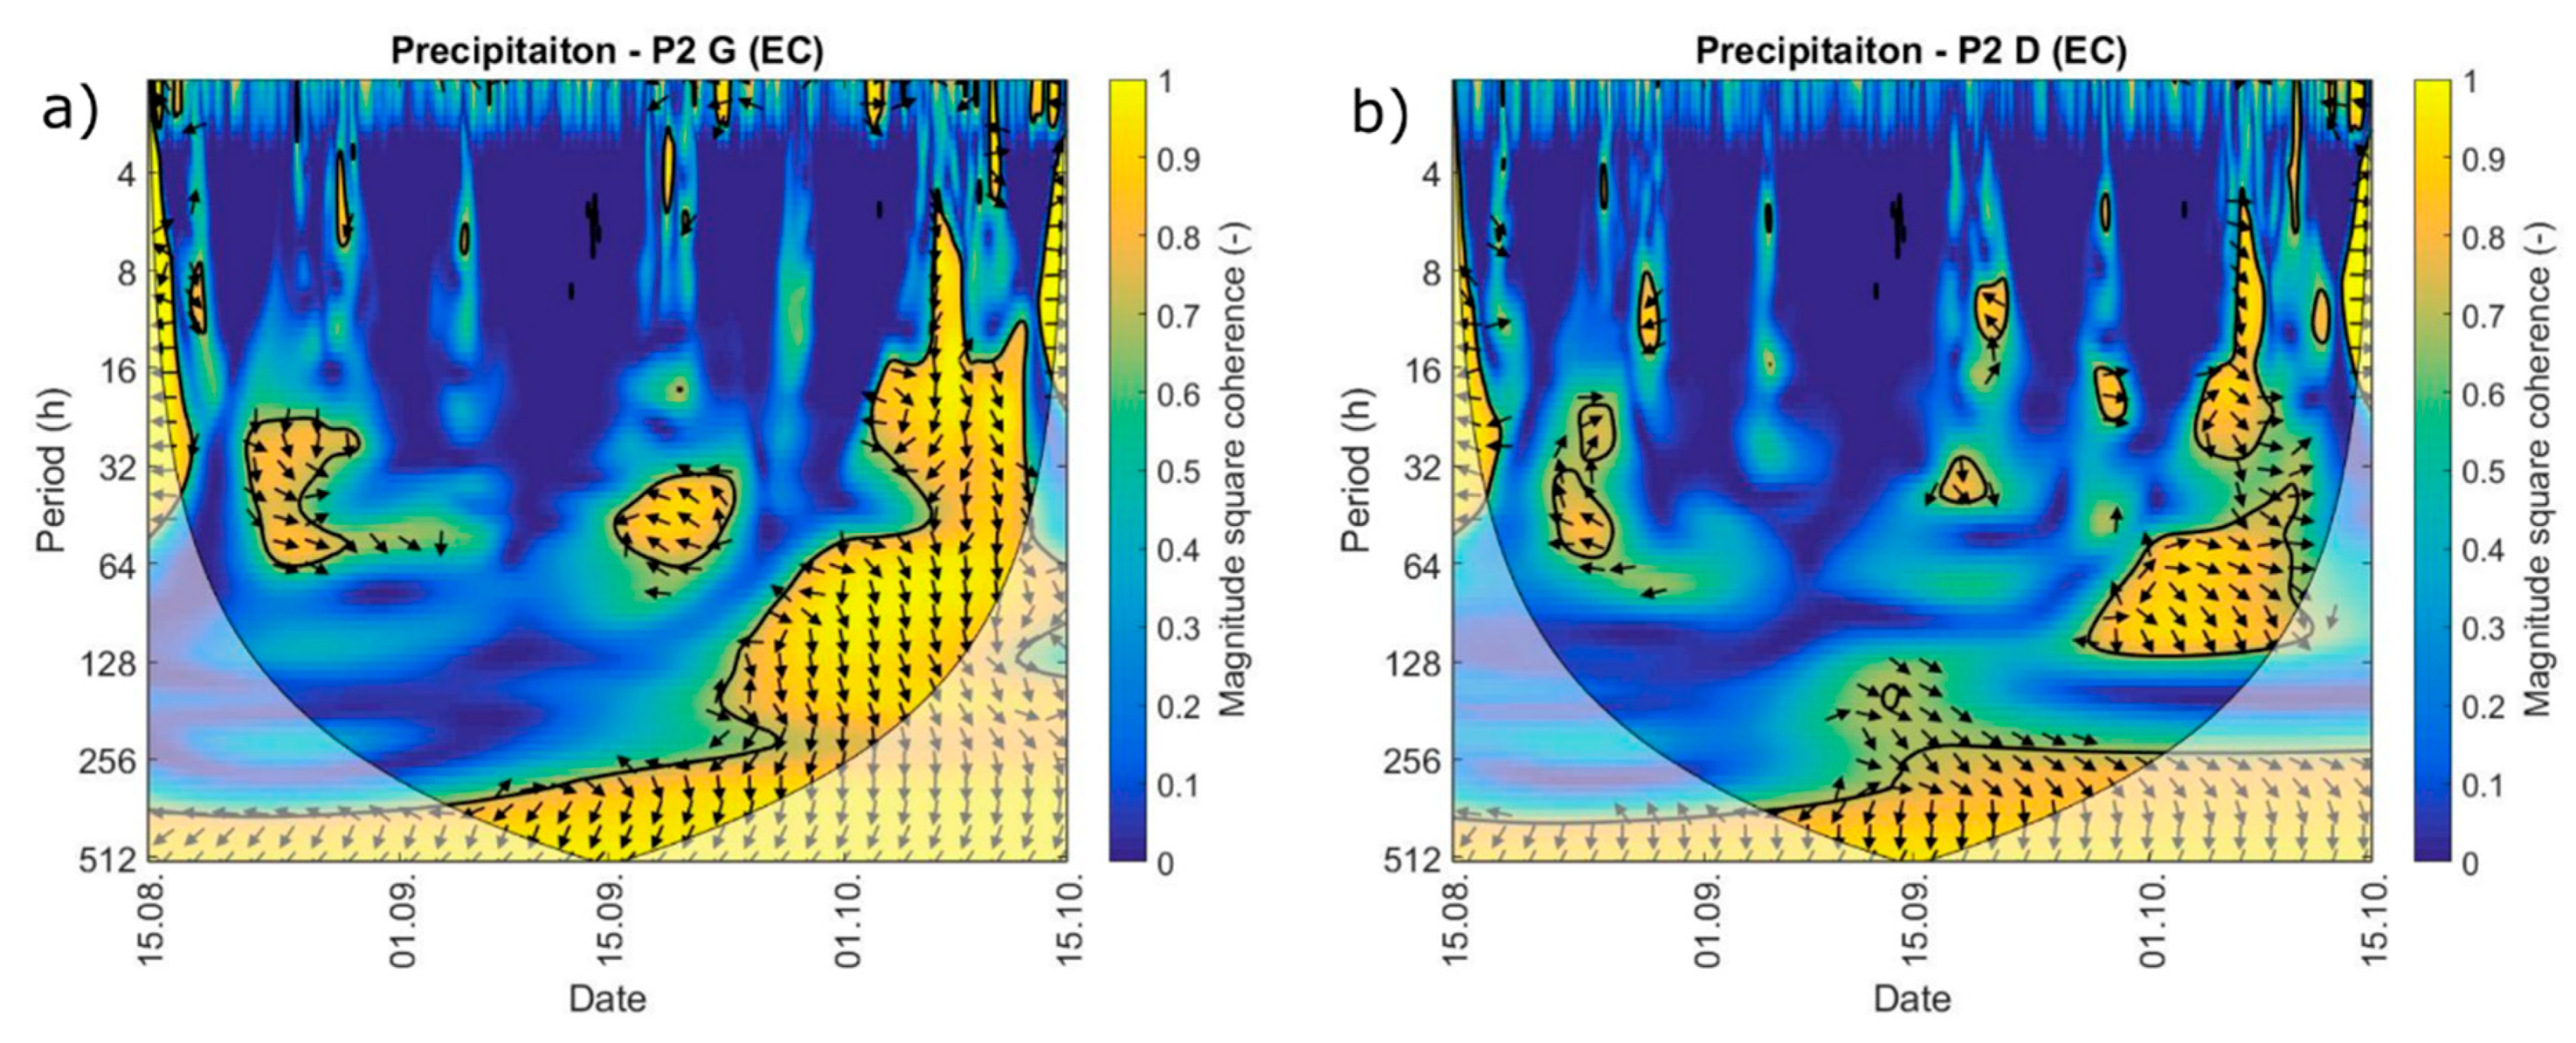
3.4. Coherence Analysis

Compared to the scalogram, coherence enables the insight to functional interdependence of two variables with emphasis on the phase lag in between. Below, we show coherence results for various combinations of variables with emphasis on the first variable which represents reference one while the second variable is shown as a relative compared to the first one.
Sea level and P1 groundwater level coherence demonstrates the influence of the sea level to the P1 groundwater level. Inspection of Figure 9a enables insight to the time lag between observed sea level and groundwater level constituents. P1 groundwater level diurnal component shows on average 2–3 h time lag, while the corresponding value of the semidiurnal component equals to 1.5 h relative from the sea level (Figure 9a). The coherence determined between precipitation and groundwater level in P1 (Figure 9b) shows precipitation effects of the groundwater level as observed in P1, in addition to sea level tidal oscillations.
Although the scalogram features of the EC time series observed at G and D probes show the presence of tidal constituents, the features arising from the coherence analysis are not straightforward (Figure 9c,d). The EC observed at P1 D probe shows the time lag relative to the sea level ranges between 1.5 and 2 h characterizing semidiurnal component, which is greater than the groundwater level response (Figure 9d). This issue has been of interest for various research groups [9,47] in the past, and has been explained through different mechanisms. While the tidally induced stress transfer through the aquifer is observed quickly, the increase in the EC is a consequence of the salt water volumetric inflow towards inland, which, due to the limited hydraulic conductivity features and usually low hydraulic gradient, needs more time to be observed.
Inspection of temporal correspondence of the diurnal sea level component and P1 EC time series implies the deviation from the explanation for the semidiurnal component above. The presence of the noise in EC time series observed at G probe and its influence to sea level phase lag determination via coherence application is shown in Figure 9c. Although the coherence shows the interdependence of the EC observed at G probe and the sea level, noise does not ensure the consistency of the results in this case separately. This is visible through the interpretation of the time lags. In this way, both diurnal and semidiurnal EC constituent occurs prior and later compared to sea level, which is physically not reliably interpretative.
P2 groundwater level regime in the dry period is shown to be influenced by Jasenska channel water fluctuations. The presence of daily fluctuations combined by the P2 groundwater level being late for app. 6 h compared to Jasenska water level implies the connection between the channel and piezometer (Figure 10a). The latter is visible by the inspection of time series of P2 groundwater level and Jasenska channel water elevation and is supported by the relative difference in water surface elevations. Besides the daily fluctuations, time series also show the matching in trend features (Figure 6). Precipitation reduces the time lag between the peaks observed for those two variables and results in a unique reaction to precipitation with zero time lag (Figure 10a).
EC reacts to the groundwater level regime at Jasenska region. The upper layer EC reacts to the increase in groundwater level by drastical reduction, from 25.00 to 6.73 mS cm−1. This opposite reaction to groundwater level (increase of the groundwater level and decrease of EC) is clearly visible in coherence of those variables shown in Figure 10b in the time period corresponding to precipitation occurrence (5 October–15 October). The time lag observed here equals the half of the period which corresponds to the rise–fall relationship. Inspection of Figure 10c enables insight of the features of EC observed at D probe, relatively to P2 groundwater level. Hereby, the reduction of EC has been observed later compared to EC in the G probe but still shows the rise–fall relationship. The same features are visible by the inspection of time series in Figure 6. This is expected due to the increased infiltration and percolation time of the precipitation and consequently the decrease of the EC caused by fresh water from precipitation at probe installed in the deeper water column.
Although the response of P2 EC has been evidenced in response to groundwater level, hereby we extend the analysis with the inspection of precipitation influence to P2 EC (Figure 11a,b). Reduction of the EC in the upper probe caused by precipitation is visible after the quarter of the period. The lower probe EC shows higher time lag compared to the upper one, which is already noticed through the response of EC to P2 groundwater level. The available time series reveal the increase in P2 groundwater level as a consequence of precipitation, so the initial stress which causes the sensitivity of P2 EC to external loadings is fundamentally precipitation. This is supported by the comparison of time lags of P2 groundwater level and P2 EC relative to precipitation occurrence time. Slightly after precipitation occurrence on 8 October, the increase in P2 groundwater level is observed (Figure 6). Afterwards, the decrease in G probe EC is evidenced and at the latest, EC drop in P2 D probe is noticed.
The comparison of time lags between precipitation and EC (Figure 11a,b) and P2 groundwater level and EC (Figure 10b,c) demonstrates higher time lag values of the EC relative to precipitation. This holds for EC time series observed on both upper and lower probes.

4. Discussion

In this paper, we presented a successful way of implementing a multilevel monitoring system capable of capturing the combination of seawater intrusion and external loadings effects to ground and surface water parameter transience in our findings. Relying on the datasets observed through the monitoring system implemented in Neretva valley coastal system, we performed analysis to understand the transient nature of EC and T characterizing Diga and Jasenska subareas. Additionally, we elaborate several issues which empower the significance of the presented work, as follows: (i) the interconnection of channel Jasenska, river Neretva and river Mala Neretva by using in situ profiling results; (ii) Diga area active seawater intrusion dominance; (iii) Jasenska area EC stratification; (iv) influence of the vertical flow component in piezometers; (v) the generality of the findings based on two months of continuous monitoring.
To additionally strengthen the mechanisms creating daily EC regime in Jasenska channel, Figure 12a,b show detailed time series of Jasenska EC, Jasenska water level and Neretva water level observed at Opuzen limnigraph (Figure 1). River Neretva EC and T profiling have been performed two times during the period of interest from 15 August 2021 00:00 h to 15 October 2021 23:30 h, respectively, on 24 August and 20 September 2021 at profiles Opuzen and Komin (Figure 13a,b). Insight to EC values as observed within the Neretva surface layer where the water is taken from for the irrigation system discovers a very narrow EC interval between 2.727 and 3.1 mS cm−1 (Opuzen profile) and 3.24 to 3.435 mS cm−1 (Komin profile). By comparing profiling results with Jasenska EC time series in Figure 12a,b, it is obvious the Jasenska EC corresponds to the Neretva river surface layer EC. On 24 August 2021, EC in Jasenska channel does not exceed 3.30 mS cm−1 while on 20 September 2021 it goes up to 2.0 mS cm−1. Taking into consideration the water inside channel Jasenska during the CS Modric standby origins from river Neretva, the observed datasets are in correspondence.
Due to the connection of the Jasenska channel southern branch with the Mala Neretva lateral channel to the south (Figure 1), and the distance app. 2–2.5 times longer compared to left river Neretva bank, water from Mala Neretva causes refreshment of the Jasenska channel water through the branch intake located 100 m upstream from the probe. To support this, we use EC and T profiling data of Mala Neretva, performed at the same dates as for river Neretva (Figure 13c). For both relevant dates, we observe profiling results in mala Neretva surface layer range between 0.84–1.02 mS cm−1, while Jasenska EC does not fall below those values (Figure 12a,b). Similar correspondence has been observed from the river Neretva T time series and profiling results.
Additional explanations on the interpretation of the groundwater regime as found at P1 piezometer representing Diga area reveals significant influence of active seawater intrusion conditions [38,48]. Besides the water table salinization presence (Figure 14a), EC stratification shows a minor effect on the surface water from the irrigation channel located 30 m to the inland. T profile enhances the difference between seawater temperature and air temperature characterizing the area of interest. Groundwater T ranging between 23.3 and 23.96 °C confirms the connection to the seawater, while higher temperatures observed in surface layer corresponds to heating caused by the air temperature as measured in a period prior to the profiling (Figure 14a).
Opposite to the dry period, when sea level is recognized as a main driving force influencing Diga groundwater regime, precipitation leads to a moderate increase in EC observed at P1 G probe (Figure 15). The cause should be found in Figure 16 which emphasizes the presence of sodium chloride crystals at the surface (white matter visible on the photo). The occurrence of first precipitation after the dry period dissolves the sodium chloride crystal and by percolation contaminates the upper groundwater layer, thus increasing the EC.
Long perforated piezometers have been shown to give unrealistic results when penetrating through more than one geological unit characterized by different hydraulic heads [49]. While the chemical properties of the water will always match the properties of the water in the aquifer with the highest hydraulic head [49], the water table in the piezometer will reflect the zone of highest transmissivity regardless of hydraulic head [49]. Monitoring of the transition zone driven by the tidal oscillations in long perforated piezometers has been of interest in a study by Levanon et al. [9,14,48], who showed that the movement of the freshwater–seawater interface (FSI) is significantly larger compared to sea water elevation tidal oscillations, thus leading to unreliable results. Those studies also commented on the influence of capillary fringe (“capillary effect”) on tide-induced volumetric flow, resulting in a nearly simultaneous movement of the FSI and the groundwater level. Both processes, movement of FSI and groundwater level, have been found to be slower compared to hydraulic head (stress) transfer. Additionally, the time lag observed between groundwater level and hydraulic stress cannot be observed in long perforated piezometers because hydraulic stress is equivalent to the groundwater level in piezometer.
Monitoring piezometers in this study have been perforated throughout the whole penetration depth, as shown in Figure 2a,b. Both piezometers penetrate the same shallow unconfined aquifer (geological unit) with an approximate thickness of 10 m in both areas with the bottom of the piezometers at the top of the confining clay layer. The shallow unconfined aquifer is mostly a fine sandy one with minimal heterogeneity around the observed piezometers [50,51]. Therefore, vertical flow in the wells is expected to be minimal due to the unique piezometric head in the radius of influence of the piezometer. The time series of EC, obtained from both probes in P1 and P2, showed minor variations with tidal variations in sea level and daily variations in the irrigation system regime in the Jasenska channel (Figure 5 and Figure 6). However, both probes at both subareas of interest showed different responses to EC and T when confronted with precipitation, sea level and Jasenska channel variations in the WTC model, indicating multilevel monitoring in long perforated wells offers the insight to the processes in the system when properly applied.
While the Diga area groundwater column shows vertical features being influenced by active seawater intrusion, the Jasenska area groundwater is characterized by significant stratification in EC. Surface layer EC ranges between 22 and 24.60 mS cm−1, as obtained from profiling performed on 17 July, 24 August and 20 September 2021. EC results characterizing deeper groundwater layer ranges between 38.20 and 41.90 mS cm−1. Due to the very small distance (80 m) to the Jasenska channel and the explained interconnection between ground and surface water at this subarea within the Results section, increased EC in bottom groundwater layer should be potentially found in river Neretva or the sea water as a main source of salt water during the dry period [17].
Although this study is based on a two month period of continuous multilevel monitoring, it represents reliable insight into the EC and T nature along the Diga and Jasenska area which are of general meaning. To support this, we recall back to Figure 13 and Figure 14. Stable conditions evident within the Neretva River, Mala Neretva and P1 and P2 piezometers are found for the profiling results taken outside the primary interest two month period (profiling performed on 19 July 2021). The area of interest is mainly recognized through two regimes, the dry and the rain one [17]. The dry regime corresponds to the period from late April to late October, while the rest of the year corresponds usually to the rain period. In our analysis, we cover both the dry and the rain period. The latter one has been identified during precipitation occurrence in October 2021.

5. Conclusions

This paper offers a comprehensive interpretation of the processes influencing ground and surface water level, EC and T along the Diga and Jasenka subareas within the Neretva river coastal system. Special emphasis has been given to external loadings, such as sea water intrusion, precipitation and PS Modric operative regime and their simultaneous influence to the variables of interest. To our best knowledge, this is the first paper dealing with the combined approach of using a multilevel monitoring supported by wavelet-based analysis when applied to Neretva coastal aquifer system. Below, we summarize the highlights that arose from the study:
  • The transient regime of surface water in the Jasenska channel is significantly influenced by the operative regime of the PS Modric. This is especially seen in water level, while the water temperature is evidently driven by the solar radiation since the limited channel depth. EC in the Jasenska channel is shown to be under the simultaneous influence of the river Neretva surface layer and Mala Neretva water, which is introduced into the system via the Crepina channel;
  • The Diga area is characterized by the active sea water intrusion influence, which is the main driving force in the definition of the Diga groundwater EC. Although the small distance and previously shown impact of the PS Modric to irrigation channels and consequently to average groundwater level, the influence of PS Modric to P1 groundwater EC fluctuations has been characterized as minor;
  • Compared to the Diga area, the Jasenska area groundwater EC features imply an equilibrium of the Jasenska channel and sea water intrusion, thus creating significant stratification of the salinity regime as found in groundwater. Although the small distance from the Jasenska channel, the upper layer of the P2 groundwater does not seem suitable for irrigation use following FAO standards [52];
  • The implemented monitoring system demonstrated a capacity to capture for the consequences of sea water intrusion, precipitation and PS Modric operative regime to both ground and surface water features within the area of interest. A similar system, when adapted to specific circumstances found at the site, can be applied to monitor the water ecosystem features in coastal systems of interest.

Author Contributions

Conceptualization, I.L. and V.S.; methodology, I.L. and V.S.; software, I.L.; validation, I.L.; formal analysis, I.L. and V.S.; investigation, I.L.; resources I.L. and V.S.; data curation, I.L., I.M. and M.B.; writing—original draft preparation, I.L. and V.S.; writing—review and editing, I.L. and V.S.; visualization, I.L., I.M. and M.B.; supervision, V.S.; project administration, I.L. and V.S.; funding acquisition, V.S. All authors have read and agreed to the published version of the manuscript.

Funding

This research is funded by the contribution from the EU co-financing and the Interreg Italy-Croatia CBC Programme 2014–2020 (Priority Axes: Safety and Resilience) through the European Regional Development Fund as a part of project Monitoring Sea-water intrusion in coastal aquifers and Testing pilot projects for its mitigation (MoST) (AID: 10047742).
This research is partially supported through project KK.01.1.1.02.0027, a project co-financed by the 571 Croatian Government and the European Union through the European Regional Development Fund–the Competitiveness and Cohesion Operational Programme, contract number: KK.01.1.1.02.0027.

Institutional Review Board Statement

Not applicable.

Informed Consent Statement

Not applicable.

Data Availability Statement

Data sets available on request.

Acknowledgments

Authors are grateful to Marin Milin from Higra LTD for his valuable input and expertise in monitoring system.

Conflicts of Interest

The authors declare no conflict of interest. The funders had no role in the design of the study; in the collection, analyses, or interpretation of data; in the writing of the manuscript, or in the decision to publish the results.

References

  1. Essink, G.H.P.O.; Van Baaren, E.S.; De Louw, P.G.B. Effects of climate change on coastal groundwater systems: A modeling study in The Netherlands. Water Resour. Res. 2010, 46. [Google Scholar] [CrossRef]
  2. Custodio, E. Coastal aquifers of Europe: An overview. Appl. Hydrogeol. 2009, 18, 269–280. [Google Scholar] [CrossRef]
  3. Werner, A.D.; Bakker, M.; Post, V.E.; Vandenbohede, A.; Lu, C.; Ataie-Ashtiani, B.; Simmons, C.T.; Barry, D. Seawater intrusion processes, investigation and management: Recent advances and future challenges. Adv. Water Resour. 2012, 51, 3–26. [Google Scholar] [CrossRef]
  4. Ketabchi, H.; Mahmoodzadeh, D.; Ataie-Ashtiani, B.; Simmons, C.T. Sea-level rise impacts on seawater intrusion in coastal aquifers: Review and integration. J. Hydrol. 2016, 535, 235–255. [Google Scholar] [CrossRef]
  5. Racetin, I.; Krtalic, A.; Srzic, V.; Zovko, M. Characterization of short-term salinity fluctuations in the Neretva River Delta situated in the southern Adriatic Croatia using Landsat-5 TM. Ecol. Indic. 2019, 110, 105924. [Google Scholar] [CrossRef]
  6. Mastrocicco, M.; Colombani, N. The Issue of Groundwater Salinization in Coastal Areas of the Mediterranean Region: A Review. Water 2021, 13, 90. [Google Scholar] [CrossRef]
  7. Paldor, A.; Shalev, E.; Katz, O.; Aharonov, E. Dynamics of saltwater intrusion and submarine groundwater discharge in confined coastal aquifers: A case study in northern Israel. Appl. Hydrogeol. 2019, 27, 1611–1625. [Google Scholar] [CrossRef]
  8. Vallejos, A.; Solá, F.; Pulido-Bosch, A. Processes Influencing Groundwater Level and the Freshwater-Saltwater Interface in a Coastal Aquifer. Water Resour. Manag. 2014, 29, 679–697. [Google Scholar] [CrossRef]
  9. Levanon, E.; Yechieli, Y.; Gvirtzman, H.; Shalev, E. Tide-induced fluctuations of salinity and groundwater level in unconfined aquifers—Field measurements and numerical model. J. Hydrol. 2017, 551, 665–675. [Google Scholar] [CrossRef]
  10. Yang, H.; Shimada, J.; Shibata, T.; Okumura, A.; Pinti, D. Freshwater lens oscillation induced by sea tides and variable rainfall at the uplifted atoll island of Minami-Daito, Japan. Appl. Hydrogeol. 2020, 28, 2105–2114. [Google Scholar] [CrossRef]
  11. Mancuso, M.; Carol, E.; Kruse, E.; Rodrigues, F.M. Coastal aquifer hydrodynamics and salinity in response to the tide: Case study in Lisbon, Portugal. Water Policy 2016, 48, 240–252. [Google Scholar] [CrossRef]
  12. Wood, C.; Harrington, G.A. Influence of Seasonal Variations in Sea Level on the Salinity Regime of a Coastal Groundwater-Fed Wetland. Groundwater 2014, 53, 90–98. [Google Scholar] [CrossRef]
  13. Zeng, X.; Wu, J.; Wang, D.; Zhu, X. Assessing the pollution risk of a groundwater source field at western Laizhou Bay under seawater intrusion. Environ. Res. 2016, 148, 586–594. [Google Scholar] [CrossRef]
  14. Levanon, E.; Yechieli, Y.; Shalev, E.; Friedman, V.; Gvirtzman, H. Reliable Monitoring of the Transition Zone Between Fresh and Saline Waters in Coastal Aquifers. Ground Water Monit. Remediat. 2013, 33, 101–110. [Google Scholar] [CrossRef]
  15. Kim, K.-Y.; Chon, C.-M.; Park, K.-H.; Park, Y.-S.; Woo, N.-C. Multi-depth monitoring of electrical conductivity and temperature of groundwater at a multilayered coastal aquifer: Jeju Island, Korea. Hydrol. Process. 2008, 22, 3724–3733. [Google Scholar] [CrossRef]
  16. Yang, H.; Kagabu, M.; Okumura, A.; Shimada, J.; Shibata, T.; Pinti, D.L. Hydrogeochemical processes and long-term effects of sea-level rise in an uplifted atoll island of Minami-Daito, Japan. J. Hydrol. Reg. Stud. 2020, 31, 100716. [Google Scholar] [CrossRef]
  17. Lovrinović, I.; Bergamasco, A.; Srzić, V.; Cavallina, C.; Holjević, D.; Donnici, S.; Erceg, J.; Zaggia, L.; Tosi, L. Groundwater Monitoring Systems to Understand Sea Water Intrusion Dynamics in the Mediterranean: The Neretva Valley and the Southern Venice Coastal Aquifers Case Studies. Water 2021, 13, 561. [Google Scholar] [CrossRef]
  18. Ratner-Narovlansky, Y.; Weinstein, Y.; Yechieli, Y. Tidal fluctuations in a multi-unit coastal aquifer. J. Hydrol. 2019, 580, 124222. [Google Scholar] [CrossRef]
  19. de Oliveira Gomes, O.V.; Marques, E.D.; Kütter, V.T.; Aires, J.R.; Travi, Y.; Silva-Filho, E.V. Origin of salinity and hydrogeochemical features of porous aquifers from northeastern Guanabara Bay, Rio de Janeiro, SE-Brazil. J. Hydrol. Reg. Stud. 2019, 22, 100601. [Google Scholar] [CrossRef]
  20. Sunkari, E.D.; Seidu, J.; Ewusi, A. Hydrogeochemical evolution and assessment of groundwater quality in the Togo and Dahomeyan aquifers, Greater Accra Region, Ghana. Environ. Res. 2022, 208, 112679. [Google Scholar] [CrossRef]
  21. Bakker, M. Analytic Solutions for Tidal Propagation in Multilayer Coastal Aquifers. Water Resour. Res. 2019, 55, 3452–3464. [Google Scholar] [CrossRef]
  22. Erskine, A.D. The Effect of Tidal Fluctuation on a Coastal Aquifer in the UK. Groundwater 1991, 29, 556–562. [Google Scholar] [CrossRef]
  23. Bear, J.; Cheng, A.H.-D.; Sorek, S.; Ouazar, D.; Herrera, I. Seawater Intrusion in Coastal Aquifers: Concepts, Methods and Practices; Springer: Dordrecht, The Netherlands, 1999; ISBN 978-0-7923-5573-1. [Google Scholar]
  24. Guarracino, L.; Carrera, J.; Vázquez-Suñé, E. Analytical study of hydraulic and mechanical effects on tide-induced head fluctuation in a coastal aquifer system that extends under the sea. J. Hydrol. 2012, 450-451, 150–158. [Google Scholar] [CrossRef]
  25. Xia, Y.; Li, H.; Boufadel, M.C.; Guo, Q.; Li, G. Tidal wave propagation in a coastal aquifer: Effects of leakages through its submarine outlet-capping and offshore roof. J. Hydrol. 2007, 337, 249–257. [Google Scholar] [CrossRef]
  26. Abarca, E.; Karam, H.; Hemond, H.F.; Harvey, C.F. Transient groundwater dynamics in a coastal aquifer: The effects of tides, the lunar cycle, and the beach profile. Water Resour. Res. 2013, 49, 2473–2488. [Google Scholar] [CrossRef]
  27. Shalem, Y.; Weinstein, Y.; Levi, E.; Herut, B.; Goldman, M.; Yechieli, Y. The extent of aquifer salinization next to an estuarine river: An example from the eastern Mediterranean. Appl. Hydrogeol. 2014, 23, 69–79. [Google Scholar] [CrossRef]
  28. Kim, K.-Y.; Seong, H.; Kim, T.; Park, K.-H.; Woo, N.; Park, Y.-S.; Koh, G.-W.; Park, W.-B. Tidal effects on variations of fresh–saltwater interface and groundwater flow in a multilayered coastal aquifer on a volcanic island (Jeju Island, Korea). J. Hydrol. 2006, 330, 525–542. [Google Scholar] [CrossRef]
  29. Fadili, A.; Malaurent, P.; Najib, S.; Mehdi, K.; Riss, J.; Makan, A. Groundwater hydrodynamics and salinity response to oceanic tide in coastal aquifers: Case study of Sahel Doukkala, Morocco. Appl. Hydrogeol. 2018, 26, 2459–2473. [Google Scholar] [CrossRef]
  30. Heiss, J.W.; Michael, H.A. Saltwater-freshwater mixing dynamics in a sandy beach aquifer over tidal, spring-neap, and seasonal cycles. Water Resour. Res. 2014, 50, 6747–6766. [Google Scholar] [CrossRef]
  31. Kim, K.-Y.; Park, Y.-S.; Kim, G.-P.; Park, K.-H. Dynamic freshwater–saline water interaction in the coastal zone of Jeju Island, South Korea. Appl. Hydrogeol. 2008, 17, 617–629. [Google Scholar] [CrossRef]
  32. Zhang, X.; Dong, F.; Dai, H.; Hu, B.X.; Qin, G.; Li, D.; Lv, X.; Dai, Z.; Soltanian, M.R. Influence of lunar semidiurnal tides on groundwater dynamics in estuarine aquifers. Appl. Hydrogeol. 2020, 28, 1419–1429. [Google Scholar] [CrossRef]
  33. Srzić, V.; Lovrinović, I.; Racetin, I.; Pletikosić, F. Hydrogeological Characterization of Coastal Aquifer on the Basis of Observed Sea Level and Groundwater Level Fluctuations: Neretva Valley Aquifer, Croatia. Water 2020, 12, 348. [Google Scholar] [CrossRef] [Green Version]
  34. Krvavica, N.; Ružić, I. Assessment of sea-level rise impacts on salt-wedge intrusion in idealized and Neretva River Estuary. Estuarine, Coast. Shelf Sci. 2020, 234, 106638. [Google Scholar] [CrossRef] [Green Version]
  35. ESRI. ArcMap 10.8; Environmental Systems Research Institute: Redlands, CA, USA, 2021. [Google Scholar]
  36. Faculty of Civil Engineering; Geodesy and Architecture; University of Split. Salinity Monitoring at Lower Neretva Area—Report for The Year 2021; University of Split: Split, Croatia, 2021. [Google Scholar]
  37. Badaruddin, S.; Werner, A.D.; Morgan, L.K. Water table salinization due to seawater intrusion. Water Resour. Res. 2015, 51, 8397–8408. [Google Scholar] [CrossRef]
  38. Badaruddin, S.; Werner, A.D.; Morgan, L.K. Characteristics of active seawater intrusion. J. Hydrol. 2017, 551, 632–647. [Google Scholar] [CrossRef] [Green Version]
  39. Rahi, K.A.; Halihan, T. Identifying Aquifer Type in Fractured Rock Aquifers using Harmonic Analysis. Ground Water 2012, 51, 76–82. [Google Scholar] [CrossRef]
  40. Briciu, A.-E. Changes in Physical Properties of Inland Streamwaters Induced by Earth and Atmospheric Tides. Water 2019, 11, 2533. [Google Scholar] [CrossRef] [Green Version]
  41. Cheng, V.Y.; Saber, A.; Arnillas, C.A.; Javed, A.; Richards, A.; Arhonditsis, G.B. Effects of hydrological forcing on short- and long-term water level fluctuations in Lake Huron-Michigan: A continuous wavelet analysis. J. Hydrol. 2021, 603, 127164. [Google Scholar] [CrossRef]
  42. Grinsted, A.; Moore, J.C.; Jevrejeva, S. Application of the cross wavelet transform and wavelet coherence to geophysical time series. Nonlinear Process. Geophys. 2004, 11, 561–566. [Google Scholar] [CrossRef]
  43. Liu, Y.; Liang, X.S.; Weisberg, R.H. Rectification of the Bias in the Wavelet Power Spectrum. J. Atmos. Ocean. Technol. 2007, 24, 2093–2102. [Google Scholar] [CrossRef]
  44. Ng, E.K.W.; Chan, J.C.L. Geophysical Applications of Partial Wavelet Coherence and Multiple Wavelet Coherence. J. Atmos. Ocean. Technol. 2012, 29, 1845–1853. [Google Scholar] [CrossRef]
  45. Torrence, C.; Compo, G.P. A Practical Guide to Wavelet Analysis. Bull. Am. Meteorol. Soc. 1998, 79, 61–78. [Google Scholar] [CrossRef] [Green Version]
  46. Allen, M.R.; Smith, L.A. Monte Carlo SSA: Detecting irregular oscillations in the Presence of Colored Noise. J. Clim. 1996, 9, 3373–3404. [Google Scholar] [CrossRef]
  47. Levanon, E.; Shalev, E.; Yechieli, Y.; Gvirtzman, H. Fluctuations of fresh-saline water interface and of water table induced by sea tides in unconfined aquifers. Adv. Water Resour. 2016, 96, 34–42. [Google Scholar] [CrossRef]
  48. Werner, A. On the classification of seawater intrusion. J. Hydrol. 2017, 551, 619–631. [Google Scholar] [CrossRef]
  49. McIlvride, W.; Rector, B. Comparison of Short- and Long-Screen Monitoring Wells in Alluvial Sediments. In Proceedings of the Second National Outdoor Action Conference on Aquifer Restoration; Ground Water Monitoring and Geophysical Methods, Las Vegas, NV, USA, 23–26 May 1988; pp. 375–390. [Google Scholar]
  50. GEOKON Zagreb PLC. Drilling Report of Two Pairs of Piezometers Downstream of the Neretva River; GEOKON Zagreb PLC: Zagreb, Croatia, 2005. [Google Scholar]
  51. GEOKON Zagreb PLC. Geotechnical Investigation Works for Irrigation System Conceptual Design Downstream of the Neretva River; GEOKON Zagreb PLC: Zagreb, Croatia, 2008. [Google Scholar]
  52. Ayers, R.S.; Westcot, D.W. “Water Quality for Agriculture”, FAO Irrigation and Drainage Paper No. 29; FAO: Rome, Italy, 1994. [Google Scholar]
Figure 1. Location of the study area with definition of the monitoring system, operational infrastructure elements, climatological/meteorological station, subareas of interest Jasenska and Diga, profiling locations.
Water 14 00656 g001
Figure 2. Cross section of (a) location P1 with depth position of probes and obtained minimum and maximum values of sea level and water level in PS Modric for the observed period, and (b) location P2 with depth position of probes and obtained minimum and maximum values of water level in Canal Jasenska for the observed period.
Water 14 00656 g002
Figure 3. Time series characterizing surface water along the irrigation/melioration system covering Jasenska and Diga areas of interest–observed for the period from 00:00 h 15 August 2021–23:00 h 15 October 2021.
Water 14 00656 g003
Figure 4. Coherence analysis for surface water along the Jasenska channels and Modric intake for the period from 00:00 h 15 August 2021–23:00 h 15 October 2021: (a) Modric water elevation–Jasenska water elevation; (b) Modric water T–Jasenska water T and (c) Modric water EC–Jasenska water EC.
Water 14 00656 g004
Figure 5. Time series data relevant for Diga location and P1 piezometer as observed during the period 15 August 2021–15 October 2021.
Water 14 00656 g005
Figure 6. Time series data relevant for Jasenska location and P2 piezometer as observed during the period 15 August 2021–15 October 2021.
Water 14 00656 g006
Figure 7. Scalogram analysis results for the period from 00:00 h 15 August 2021–23:00 h 15 October 2021: (a) sea level time series; (b) precipitation; (c) PS Modric surface water level; (d) P1 groundwater level; (e) EC observed at G probe in P1 and (f) EC observed at D probe in P1.
Water 14 00656 g007
Figure 8. Scalogram analysis results for the period from 00:00 h 15 August 2021–23:00 h 15 October 2021: (a) Jasenska water level time series; (b) P2 groundwater level; (c) EC observed at G probe in P2; (d) EC observed at D probe in P2; (e) T observed at G probe in P2; (f) T observed at D probe in P2.
Water 14 00656 g008
Figure 9. Coherence analysis results for the period from 15 August 2021. 00:00 h–15 October 2021. 23:00 h: (a) sea level and P1 groundwater level time series; (b) precipitation and P1 groundwater level time series; (c) sea level and P1 groundwater EC observed at G probe time series; (d) sea level and P1 groundwater EC observed at D probe time series.
Water 14 00656 g009
Figure 10. Coherence analysis results for the period from 00:00 h 15 August 2021–23:00 h 15 October 2021: (a) Jasenska channel water level and P2 groundwater level time series; (b) P2 groundwater level and P2 groundwater EC observed at G probe time series; (c) P2 groundwater level and P2 groundwater EC observed at D probe time series.
Water 14 00656 g010
Figure 11. Coherence analysis results for the period from 00:00 h 15 August 2021–23:00 h 15 October 2021: (a) precipitation and P2 groundwater EC observed at G probe time series; (b) precipitation and P2 groundwater EC observed at D probe time series.
Water 14 00656 g011
Figure 12. Time series of Jasenska surface water level, Neretva surface water level and Jasenska EC as observed: (a) 11:30 h 23 August 2021–11:30 h 25 August 2021 and (b) 11:30 h 19 September 2021–11:30 h 21 September 2021.
Water 14 00656 g012
Figure 13. Vertical profiling of surface water EC and T on 17 July, 24 August and 20 September 2021. at: (a) Opuzen Profile; (b) Komin profile and (c) Mala Neretva bridge profile.
Water 14 00656 g013
Figure 14. Vertical profiling of groundwater EC and T on 17 July, 24 August and 20 September 2021. At: (a) P1 piezometer at Diga area; (b) P2 piezometer at Jasenska area.
Water 14 00656 g014
Figure 15. Precipitation and EC observed at P1 probe from 00:00 h 3 October 2021–23:00 h 13 October 2021.
Water 14 00656 g015
Figure 16. Diga area natural conditions photo (taken by the author on 24 August 2021).
Water 14 00656 g016
Publisher’s Note: MDPI stays neutral with regard to jurisdictional claims in published maps and institutional affiliations.

