Next Issue
Volume 14, June-2
Previous Issue
Volume 14, May-2


Water, Volume 14, Issue 11 (June-1 2022) – 158 articles

Cover Story (view full-size image): 
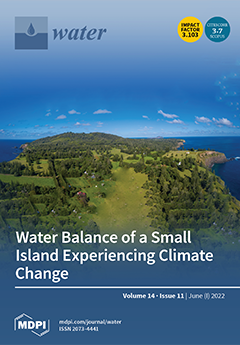
This is an image of Norfolk Island taken from the northern end of the island looking southeast, with Mount Pitt and Mount Bates on the middle ground and Phillip Island visible to the south. View this paper
  • Issues are regarded as officially published after their release is announced to the table of contents alert mailing list.
  • You may sign up for e-mail alerts to receive table of contents of newly released issues.
  • PDF is the official format for papers published in both, html and pdf forms. To view the papers in pdf format, click on the "PDF Full-text" link, and use the free Adobe Reader to open them.
Order results
Result details
Section
Select all
Export citation of selected articles as:
26 pages, 6662 KiB  
Article
Multi-Variables-Driven Model Based on Random Forest and Gaussian Process Regression for Monthly Streamflow Forecasting
by Na Sun, Shuai Zhang, Tian Peng, Nan Zhang, Jianzhong Zhou and Hairong Zhang
Water 2022, 14(11), 1828; https://doi.org/10.3390/w14111828 - 06 Jun 2022
Cited by 8 | Viewed by 2442
Abstract
Due to the inherent non-stationary and nonlinear characteristics of original streamflow and the complicated relationship between multi-scale predictors and streamflow, accurate and reliable monthly streamflow forecasting is quite difficult. In this paper, a multi-scale-variables-driven streamflow forecasting (MVDSF) framework was proposed to improve the [...] Read more.
Due to the inherent non-stationary and nonlinear characteristics of original streamflow and the complicated relationship between multi-scale predictors and streamflow, accurate and reliable monthly streamflow forecasting is quite difficult. In this paper, a multi-scale-variables-driven streamflow forecasting (MVDSF) framework was proposed to improve the runoff forecasting accuracy and provide more information for decision-making. This framework was realized by integrating random forest (RF) and Gaussian process regression (GPR) with multi-scale variables (hydrometeorological and climate predictors) as inputs and is referred to as RF-GPR-MV. To validate the effectiveness and superiority of the RF-GPR-MV model, it was implemented for multi-step-ahead monthly streamflow forecasts with horizons of 1 to 12 months for two key hydrological stations in the Jinsha River basin, Southwest China. Other MVDSF models based on the Pearson correlation coefficient (PCC) and GPR with/without multi-scale variables or the PCC and a backpropagation neural network (BP) or general regression neural network (GRNN), with only previous streamflow and precipitation, namely, PCC-GPR-MV, PCC-GPR-QP, PCC-BP-QP, and PCC-GRNN-QP, respectively, were selected as benchmarks. Experimental results indicated that the proposed model was superior to the other benchmark models in terms of the Nash–Sutcliffe efficiency (NSE) for almost all forecasting scenarios, especially for forecasting with longer lead times. Additionally, the results also confirmed that the addition of large-scale climate and circulation factors was beneficial for promoting the streamflow forecasting ability, with an average contribution rate of about 15%. The RF in the MVDSF framework improved the forecasting performance, with an average contribution rate of about 25%. This improvement was more pronounced when the lead time exceeded 3 months. Moreover, the proposed model could also provide prediction intervals (PIs) to characterize forecast uncertainty, as supplementary information to further help decision makers in relevant departments to avoid risks in water resources management. Full article
(This article belongs to the Section Hydrology)
Show Figures

Figure 1

21 pages, 7169 KiB  
Article
An Improved Empirical Model for Estimating the Geometry of the Soil Wetting Front with Surface Drip Irrigation
by Irouri Cristóbal-Muñoz, Jorge Víctor Prado-Hernández, Antonio Martínez-Ruiz, Fermín Pascual-Ramírez, David Cristóbal-Acevedo and David Cristóbal-Muñoz
Water 2022, 14(11), 1827; https://doi.org/10.3390/w14111827 - 06 Jun 2022
Cited by 5 | Viewed by 2780
Abstract
Wetting pattern geometry is useful in determining the spacing between emitters and the irrigation time in drip irrigation systems. This research aimed to generate an empirical model to estimate the width and depth of the wetting front in surface drip irrigation based on [...] Read more.
Wetting pattern geometry is useful in determining the spacing between emitters and the irrigation time in drip irrigation systems. This research aimed to generate an empirical model to estimate the width and depth of the wetting front in surface drip irrigation based on experimental tests in a cube-shaped container with transparent walls in soils with a sandy clay loam texture, with hydraulic conductivities from 2.316 to 3.945 cm h−1, and organic matter contents from 1.7 to 2.8%, and different irrigation conditions: discharge rates of 1.44, 2.90, 3.00, 3.75, and 4.00 L h−1, initial moisture levels between permanent wilting point and field capacity, and irrigation times from 0.58 to 9.50 h. The experimental conditions and the strategy for measuring the wetting front and soil moisture are detailed so the experiment is verifiable. The proposed model performed better than five other empirical models, with average values of 3 cm for the root mean square error and 0.88 for the Nash and Sutcliffe efficiency coefficient. The generated model is efficient and simple and can be a very useful tool for the design and operation of surface drip irrigation systems in soils with conditions similar to those of this study. Full article
(This article belongs to the Special Issue Research on Irrigation Strategies for Sustainable Water Management)
Show Figures

Figure 1

15 pages, 5936 KiB  
Article
The Modified Method of Reanalysis Wind Data in Estuarine Areas
by Zhengjin Tao, Yongping Chen, Ao Chu, Shunqi Pan, Min Gan, Yuhang Chen, Zhumei Che and Ye Zhu
Water 2022, 14(11), 1826; https://doi.org/10.3390/w14111826 - 06 Jun 2022
Viewed by 2064
Abstract
High-quality wind field data are key to improving the accuracy of storm surge simulations in coastal and estuarine water. These data are also of great significance in studying the dynamic processes in coastal areas and safeguarding human engineering structures. A directional correction method [...] Read more.
High-quality wind field data are key to improving the accuracy of storm surge simulations in coastal and estuarine water. These data are also of great significance in studying the dynamic processes in coastal areas and safeguarding human engineering structures. A directional correction method for ECMWF reanalysis wind data was proposed in this paper based on the correlation with the measured wind speed and direction. The results show that the accuracies of wind speed and direction were improved after being modified by the correction method proposed in this paper. The modified wind data were applied to drive the storm surge model of the Yangtze Estuary for typhoon events, which resulted in a significant improvement to the accuracy of hindcasted water levels. The error of the hindcasted highest water levels was reduced by 16–19 cm. Full article
(This article belongs to the Special Issue Large Rivers in a Changing Environment)
Show Figures

Figure 1

16 pages, 1969 KiB  
Article
National-Scale Assessment of Climate Change Impacts on Two Native Freshwater Fish Using a Habitat Suitability Model
by Taeyong Shim, Zhonghyun Kim, Dongil Seo and Jinho Jung
Water 2022, 14(11), 1825; https://doi.org/10.3390/w14111825 - 06 Jun 2022
Cited by 2 | Viewed by 2322
Abstract
Climate change, which has the potential to alter water flow and temperature in aquatic environments, can influence the freshwater fish habitat. This study used an ecological habitat suitability model (EHSM), which integrates hydraulic (water depth and velocity) and physiologic (water temperature) suitability, to [...] Read more.
Climate change, which has the potential to alter water flow and temperature in aquatic environments, can influence the freshwater fish habitat. This study used an ecological habitat suitability model (EHSM), which integrates hydraulic (water depth and velocity) and physiologic (water temperature) suitability, to investigate the impact of climate change on two native freshwater fish species (Zacco platypus and Nipponocypris koreanus) in South Korea. The model predicted that in 2080 (2076–2085), the decrease in average ecological habitat suitability (EHS) will be higher for N. koreanus (19.2%) than for Z. platypus (9.87%) under the representative concentration pathway (RCP) 8.5 scenario. Under the same condition, EHS for Z. platypus and N. koreanus at 36.5% and 44.4% of 115 sites, respectively, were expected to degrade significantly (p < 0.05). However, the habitat degradation for Z. platypus and N. koreanus was much lower (7.8% and 10.4%, respectively) under the RCP 4.5 scenario, suggesting a preventive measure for carbon dioxide emission. Partial correlation analysis indicated that the number of hot days (i.e., days on which the temperature exceeds the heat stress threshold) is the variable most significantly (p < 0.05) related to EHS changes for both species. This study suggests that the EHSM incorporating the effect of water temperature on the growth and heat stress of fish can be a promising model for the assessment of climate change impacts on habitat suitability for freshwater fish. Full article
(This article belongs to the Section Biodiversity and Functionality of Aquatic Ecosystems)
Show Figures

Figure 1

30 pages, 3553 KiB  
Article
Delineating Groundwater Recharge Potential through Remote Sensing and Geographical Information Systems
by Ahsen Maqsoom, Bilal Aslam, Nauman Khalid, Fahim Ullah, Hubert Anysz, Abdulrazak H. Almaliki, Abdulrhman A. Almaliki and Enas E. Hussein
Water 2022, 14(11), 1824; https://doi.org/10.3390/w14111824 - 06 Jun 2022
Cited by 12 | Viewed by 4573
Abstract
Owing to the extensive global dependency on groundwater and associated increasing water demand, the global groundwater level is declining rapidly. In the case of Islamabad, Pakistan, the groundwater level has lowered five times over the past five years due to extensive pumping by [...] Read more.
Owing to the extensive global dependency on groundwater and associated increasing water demand, the global groundwater level is declining rapidly. In the case of Islamabad, Pakistan, the groundwater level has lowered five times over the past five years due to extensive pumping by various departments and residents to meet the local water requirements. To address this, water reservoirs and sources need to be delineated, and potential recharge zones are highlighted to assess the recharge potential. Therefore, the current study utilizes an integrated approach based on remote sensing (RS) and GIS using the influence factor (IF) technique to delineate potential groundwater recharge zones in Islamabad, Pakistan. Soil map of Pakistan, Landsat 8TM satellite data, digital elevation model (ASTER DEM), and local geological map were used in the study for the preparation of thematic maps of 15 key contributing factors considered in this study. To generate a combined groundwater recharge map, rate and weightage values were assigned to each factor representing their mutual influence and recharge capabilities. To analyze the final combined recharge map, five different assessment analogies were used in the study: poor, low, medium, high, and best. The final recharge potential map for Islamabad classifies 15% (136.8 km2) of the region as the “best” zone for extracting groundwater. Furthermore, high, medium, low, and poor ranks were assigned to 21%, 24%, 27%, and 13% of the region with respective areas of 191.52 km2, 218.88 km2, 246.24 km2, and 118.56 km2. Overall, this research outlines the best to least favorable zones in Islamabad regarding groundwater recharge potentials. This can help the authorities devise mitigation strategies and preserve the natural terrain in the regions with the best groundwater recharge potential. This is aligned with the aims of the interior ministry of Pakistan for constructing small reservoirs and ponds in the existing natural streams and installing recharging wells to maintain the groundwater level in cities. Other countries can expand upon and adapt this study to delineate local groundwater recharge potentials. Full article
(This article belongs to the Special Issue Advanced Hydrologic Modeling in Watershed Scales)
Show Figures

Figure 1

14 pages, 1775 KiB  
Article
An Advanced PMF Model Based on Degradation Process for Pollutant Apportionment in Coastal Areas
by Pu Li, Xiayu Chen, Haibo Niu, Zhenhua Lu, Zekun Zhang, Ge Lin and Ke Yuan
Water 2022, 14(11), 1823; https://doi.org/10.3390/w14111823 - 06 Jun 2022
Viewed by 1910
Abstract
With increasing stress posed to the marine ecosystem and coastal communities, prevention and control of coastal pollution becomes urgent and important, in which the identification of pollution sources is essential. Currently, the pollutant source apportionment in coastal areas is mainly based on receptor [...] Read more.
With increasing stress posed to the marine ecosystem and coastal communities, prevention and control of coastal pollution becomes urgent and important, in which the identification of pollution sources is essential. Currently, the pollutant source apportionment in coastal areas is mainly based on receptor models, such as the positive matrix factorization (PMF) model. Nevertheless, these models still lack consideration of the changes of pollutant behaviors (e.g., the degradation of pollutants) which cause the differences in pollutant compositions. Subsequently, the source apportionment via receptor models only based on the monitoring data may not be consistent with the one in pollution sources. To fill this gap, a pollutant degradation model was firstly developed in this study. Accordingly, the degradation model was inversed to estimate the pollutant concentrations at their emitting sources, based on the monitoring concentration in the coastal area. Finally, the estimated concentrations were fed to the PMF model for pollutant source apportionment, advancing the PMF model with degradation process. To demonstrate the feasibility and accuracy of the developed model, a case study of source appointment was carried out based on the polycyclic aromatic hydrocarbons (PAHs) in the sediments of the Pearl River Estuary. The results indicated the same types of emission source identified by the original and advanced PMF models, which were oil spill, biomass and coal combustion, and traffic emission. Nevertheless, the contributions of sources were significantly varied between the two models. According to the analyses based on emission inventory, the offsets of the results from the original PMF model were −55.4%, 22.7%, and 42.2% for the emission sources of oil spill, biomass and coal combustion, and traffic emission, respectively. Comparatively, the offsets for the advanced PMF model narrowed down to −27.5%, 18.4%, and −4.4%. Therefore, the advanced PMF model is able to provide satisfactory source apportionment for organic pollutants in coastal areas, and thus further provide a scientific basis for marine pollution prevention and control. Full article
(This article belongs to the Section Oceans and Coastal Zones)
Show Figures

Figure 1

4 pages, 181 KiB  
Editorial
Relative Sea-Level Changes and Their Impact on Coastal Zones: Past and Future Scenarios from Cases Studies around the World
by Pietro P. C. Aucelli, Giuseppe Mastronuzzi and Gaia Mattei
Water 2022, 14(11), 1822; https://doi.org/10.3390/w14111822 - 06 Jun 2022
Viewed by 1531
Abstract
In recent decades, the study of sea-level changes as recorded along entire coastlines around the world has been a primary scientific focus in climate change studies; it allows the exploration of past landscape evolution, geomorphological processes, human impact, and system response to develop [...] Read more.
In recent decades, the study of sea-level changes as recorded along entire coastlines around the world has been a primary scientific focus in climate change studies; it allows the exploration of past landscape evolution, geomorphological processes, human impact, and system response to develop future perspectives [...] Full article
(This article belongs to the Special Issue Relative Sea-Level Changes and their Impact on Coastal Zones)
9 pages, 1217 KiB  
Article
Analysis of the Effect of Sludge Reduction and Energy Production from Introducing Anaerobic Digest Plant into a Sewage Treatment Plant
by Dowan Kim and Chaegun Phae
Water 2022, 14(11), 1821; https://doi.org/10.3390/w14111821 - 06 Jun 2022
Cited by 2 | Viewed by 2303
Abstract
As the amount of sewage sludge (SS) is increasing worldwide, anaerobic digesters (ADP) are being distributed to reduce it and treat it in an environmentally friendly way. In Korea, 20 years have passed since the introduction of ADP, but the number of sewage [...] Read more.
As the amount of sewage sludge (SS) is increasing worldwide, anaerobic digesters (ADP) are being distributed to reduce it and treat it in an environmentally friendly way. In Korea, 20 years have passed since the introduction of ADP, but the number of sewage treatment plants (STP) installed with ADP is only about 10% of the total STP. Accordingly, problems and improvements were examined through material flow analysis targeting STP, and the effect of introducing anaerobic digestion (AD) was analyzed as a way to solve them. As a result of the analysis, the amount of SS generated by the STP (SS-ADP + Co-ADP) installed and operated by an AD was 0.54 kg/m3, and the facility without it was 0.77 kg/m3, showing a reduction effect of about 31%. The SS reduction effect of the facility that only used SS-AD was found to be reduced by 21–24% TOE (Ton Of Equivalent))/day, which has the effect of reducing 794,867 kg-CO2/day of greenhouse gas. In terms of energy efficiency, Co-AD was 86% higher than SS-AD, and biogas production yield was 90% higher than that of SS-AD. Therefore, it is necessary to introduce Co-AD into STP in terms of reducing SS, energy production, and greenhouse gas reduction. Full article
Show Figures

Figure 1

18 pages, 2807 KiB  
Article
Parametric Study on Abutment Scour under Unsteady Flow
by Rajkumar V. Raikar, Jian-Hao Hong, Anandrao R. Deshmukh and Wen-Dar Guo
Water 2022, 14(11), 1820; https://doi.org/10.3390/w14111820 - 06 Jun 2022
Cited by 3 | Viewed by 1941
Abstract
Experimental results on scour at abutments under unsteady clear water flow condition are presented. Three shapes of short abutments (abutment length/upstream flow depth < 1) were tested, namely, rectangular/vertical wall, semi-circular, and trapezoidal/45° wing-wall abutments embedded in uniform sands of two sizes having [...] Read more.
Experimental results on scour at abutments under unsteady clear water flow condition are presented. Three shapes of short abutments (abutment length/upstream flow depth < 1) were tested, namely, rectangular/vertical wall, semi-circular, and trapezoidal/45° wing-wall abutments embedded in uniform sands of two sizes having d50 = 0.52 mm and 0.712 mm. The unsteadiness of the flow is considered in the form flood hydrographs of three forms, namely: advanced flood hydrograph (Type I), symmetrical flood hydrograph (Type II), and delayed flood hydrograph (Type III) with the flow maintained at clear water condition in all cases. The experimental findings are used to represent the influence of various parameters on scour depth at bridge abutments. It was observed that the scour depth at rectangular abutments is greater than that at trapezoidal and semi-circular abutments. The scour depths at abutments embedded in finer sediments are greater than those in coarser sediments. In addition, based on the study of effect of three flood hydrographs, it was noticed that the delayed flood hydrograph yields greater scour depth as compared to the other two cases. Further, based on the method of superposition and the correction of shape factor, a semi-empirical model using dimensionless parameters is proposed to compute the temporal evolution of scour depth at abutments under unsteady clear water conditions. The parameters used in this model include flow shallowness, flow intensity, sediment coarseness, and time factor. It was found that the proposed model corresponds well with the data of time-dependent scour depth in uniform sediments obtained from the present experiments (unsteady flows) and reported by different investigators (steady flows). Full article
(This article belongs to the Special Issue Advances in Experimental Hydraulics, Coast and Ocean Hydrodynamics)
Show Figures

Figure 1

4 pages, 161 KiB  
Editorial
Urban Hydrogeology Studies
by Constantin Radu Gogu
Water 2022, 14(11), 1819; https://doi.org/10.3390/w14111819 - 06 Jun 2022
Cited by 1 | Viewed by 1569
Abstract
Urbanization is a pervasive phenomenon of our time, and sustainable urban development is one of the greatest challenges faced by the contemporary world [...] Full article
(This article belongs to the Special Issue Urban Hydrogeology Studies)
22 pages, 3400 KiB  
Article
Load Frequency Control of Microgrid System by Battery and Pumped-Hydro Energy Storage
by Hasan Huseyin Coban, Aysha Rehman and Mohamed Mousa
Water 2022, 14(11), 1818; https://doi.org/10.3390/w14111818 - 06 Jun 2022
Cited by 23 | Viewed by 3427
Abstract
Energy security is one of the main factors in the development and diffusion of microgrid applications. In networks operating without storage, the operation of their systems is greatly affected by sudden load demand and intermittent generation fluctuations. The main purposes of using energy [...] Read more.
Energy security is one of the main factors in the development and diffusion of microgrid applications. In networks operating without storage, the operation of their systems is greatly affected by sudden load demand and intermittent generation fluctuations. The main purposes of using energy storage systems in microgrids are stabilizing the intermittent generation of renewable energy sources locally, to ensure that energy production matches energy demands, participating in the frequency regulation process, maintaining the energy balance between generation and demand in renewable energy microgrids, and increasing energy reliability. This study investigates the frequency and power balance of an isolated microgrid system, by including storage systems (battery and pump-hydro). Realistic data for wind and solar sources are used for the optimal tuning of the proportional-integral controller, using the integral of the absolute error criterion multiplied by time, with a Quasi-Newton method. Simulation studies have been carried out, to investigate the performance of the microgrid system, by including the hydroelectric power plant system with pump storage for 24 h, under various operating conditions. The results reveal that by including the storage units in the system, it exhibits a more consistent and smooth dynamic performance, using renewable energy efficiently. Full article
(This article belongs to the Special Issue Pumped-Storage Hydropower: Flexible Giants for the Energy Transition)
Show Figures

Figure 1

3 pages, 167 KiB  
Editorial
Current and Future Trends in Environmental Electrochemistry for Wastewater Treatment
by Zacharias Frontistis
Water 2022, 14(11), 1817; https://doi.org/10.3390/w14111817 - 06 Jun 2022
Cited by 4 | Viewed by 1595
Abstract
In recent years, the demand for high-quality water has constantly been increasing, while at the same time, the legislations regarding wastewater reuse are becoming stricter [...] Full article
(This article belongs to the Special Issue Application of Electrochemistry in Wastewater Treatment)
12 pages, 8419 KiB  
Article
Determination of Glufosinate-P-Ammonium in Soil Using Precolumn Derivation and Reversed-Phase High-Performance Liquid Chromatography
by Lin Chen, Shun Kong, Guodong Wang, Xiaoju Yan, Xuemei Zhang, Xiangji Kong and Yuanqing Bu
Water 2022, 14(11), 1816; https://doi.org/10.3390/w14111816 - 06 Jun 2022
Viewed by 3182
Abstract
This study developed an analytical method to quantify glufosinate-P-ammonium (GLUF-P) in farmland soil using a reversed-phase high-performance liquid chromatography (HPLC) system with a fluorescence detector after derivatization. GLUF-P in farmland soil was extracted with a mixed alkaline solution and was further derivatized with [...] Read more.
This study developed an analytical method to quantify glufosinate-P-ammonium (GLUF-P) in farmland soil using a reversed-phase high-performance liquid chromatography (HPLC) system with a fluorescence detector after derivatization. GLUF-P in farmland soil was extracted with a mixed alkaline solution and was further derivatized with 9-fluorenyl methyl chloroformate (FMOC) at 25 °C for 1 h. The derivatives were separated with an ACE-C18 column, gradient eluted with a mobile phase A of acetonitrile and a mobile phase B of 0.2% phosphoric acid solution, and finally determined by high-performance liquid chromatography (HPLC) with fluorescence detection at an excitation wavelength of 254 nm and an emission wavelength of 279.8 nm. The limits of detection (LODs) in the four types of soil ranged from 0.004 to 0.015 mg/kg, and the limits of quantification (LOQs) ranged from 0.0125 to 0.05 mg/kg. The mean recoveries of GLUF-P ranged from 94% to 119.8%, and the relative standard deviations (RSDs) varied between 2.8% and 9.0% when the spiked concentrations of GLUF-P were 0.1 mg/kg and 1.0 mg/kg, respectively. The coefficients of regression for the linearity equation were more than 0.99. The proposed method had high sensitivity and could be used for the determination of GLUF-P residues in farmland soil. Full article
Show Figures

Figure 1

18 pages, 3970 KiB  
Article
Using Stable Water Isotopes to Analyze Spatiotemporal Variability and Hydrometeorological Forcing in Mountain Valley Wetlands
by Julia M. Hathaway, Richard M. Petrone, Cherie J. Westbrook, Rebecca C. Rooney and Lindsey E. Langs
Water 2022, 14(11), 1815; https://doi.org/10.3390/w14111815 - 05 Jun 2022
Cited by 1 | Viewed by 2054
Abstract
Wetlands in Montane and Subalpine Subregions are increasingly recognized as important hydrologic features that support ecosystem function. However, it is currently not clear how climate trends will impact wetland hydrological processes (e.g., evaporative fluxes) across spatiotemporal scales. Therefore, identifying the factors that influence [...] Read more.
Wetlands in Montane and Subalpine Subregions are increasingly recognized as important hydrologic features that support ecosystem function. However, it is currently not clear how climate trends will impact wetland hydrological processes (e.g., evaporative fluxes) across spatiotemporal scales. Therefore, identifying the factors that influence wetland hydrologic response to climate change is an important step in understanding the sensitivity of these ecosystems to environmental change. We used stable water isotopes of hydrogen and oxygen (δ2H and δ18O), coupled with climate data, to determine the spatiotemporal variability in isotopic signatures of wetland source waters and understand the influence of evaporative fluxes on wetlands in the Kananaskis Valley. Our results show that the primary runoff generation mechanism changes throughout the growing season resulting in considerable mixing in wetland surface waters. We found that evaporative fluxes increased with decreasing elevation and that isotopic values became further removed from meteoric water lines during the late peak- and into the post-growing seasons. These findings suggest that a change in the water balance in favor of enhanced evaporation (due to a warmer and longer summer season than present) will not only lead to greater water loss from the wetlands themselves but may also reduce the water inputs from their catchments. Full article
(This article belongs to the Section Hydrology)
Show Figures

Figure 1

27 pages, 7259 KiB  
Article
Three-Dimensional Model of Soil Water and Heat Transfer in Orchard Root Zone under Water Storage Pit Irrigation
by Yuanyuan Su, Xianghong Guo, Tao Lei, Lijian Zheng, Juanjuan Ma, Xihuan Sun, Linru Hao and Feipeng Hu
Water 2022, 14(11), 1813; https://doi.org/10.3390/w14111813 - 05 Jun 2022
Cited by 2 | Viewed by 2048
Abstract
To reveal the water and heat transfer characteristics of the orchard soil under water storage pit irrigation and to regulate the distribution of soil water and heat for improving apple quality and increasing yield, a 3D soil water and heat transfer model of [...] Read more.
To reveal the water and heat transfer characteristics of the orchard soil under water storage pit irrigation and to regulate the distribution of soil water and heat for improving apple quality and increasing yield, a 3D soil water and heat transfer model of orchards under water storage pit irrigation was established. The model not only considered the influences of root water uptake, precipitation, evaporation, and irrigation, but also simulated the infiltration process of the variable water head in the pit according to the principle of mass conservation and introduced the pit coefficient to simulate the difference in radiation in the pit to describe the influence of the pit on the model. Verify and analyze the simulation results. Results showed that the variation trend of simulated soil moisture and heat was consistent with that of measured data. The mean absolute percentage error, root mean square error, and mean absolute deviation were 3.23%, 0.9460, and 0.6984 for soil temperature and 10.05%, 0.0269, and 0.0214 for water content after irrigation, respectively. The simulation results have high accuracy and show that the soil moisture content centers on the pit with an ellipsoid distribution and tends to be uniform over time. The soil temperature was higher in the 4–5 cm area near the soil surface and the wall of pit, and it remarkably changed with time. The intraday variation of soil temperature was mainly affected by atmospheric temperature, but a certain lag was observed compared with the change of atmospheric temperature. With the increase of the irrigation amount, the distribution range of soil moisture content and water high value area increased, while the average and maximum soil temperature decreased. With the increase of irrigation water temperature to 18–24 h after irrigation, the soil temperature in the ellipsoidal area around the pit remarkably increased. The model established in this paper can be used to simulate the hydrothermal status of the soil in the field under water storage pit irrigation. The results prove that the water storage pit irrigation can effectively improve the hydrothermal status of the middle-deep soil and promote the root system of fruit trees to absorb water. Full article
(This article belongs to the Section Water, Agriculture and Aquaculture)
Show Figures

Figure 1

14 pages, 2707 KiB  
Article
Study on Soil Water Infiltration Process and Model Applicability of Check Dams
by Heng Wu, Shengdong Cheng, Zhanbin Li, Ganggang Ke and Hangyu Liu
Water 2022, 14(11), 1814; https://doi.org/10.3390/w14111814 - 04 Jun 2022
Cited by 4 | Viewed by 3344
Abstract
As the primary ecological construction measure on the Loess Plateau, check dams play an essential role in developing agricultural production, improving people’s production and life, and replenishing groundwater. Soil water infiltration is the most important way to replenish groundwater in the dam land. [...] Read more.
As the primary ecological construction measure on the Loess Plateau, check dams play an essential role in developing agricultural production, improving people’s production and life, and replenishing groundwater. Soil water infiltration is the most important way to replenish groundwater in the dam land. In order to investigate the water infiltration process of check dams, an empirical model suitable for the simulation of the dam land infiltration process was selected. The soil water infiltration process of the check dam was studied by a field test and a model simulation. The results showed that there were few macropores in the dam, and the water mainly moved downwards in the form of matrix flow. Moreover, the stable infiltration rate of the dam site was low, and its infiltration process could be divided into three stages: rapid infiltration, fluctuating infiltration, and stable infiltration. In addition, the infiltration rate of a non-silted dense layer was 2.4~5 times that of a silted dense layer. The Horton model had a good fitting effect on the water infiltration process of the check dam and thus was suitable for the simulation and prediction of the water infiltration process of the dam. The results can provide a theoretical basis for efficient soil water utilization and infiltration simulation of check dam land. Full article
(This article belongs to the Special Issue Water and Crops)
Show Figures

Figure 1

20 pages, 85180 KiB  
Article
Estimating Canopy-Scale Evapotranspiration from Localized Sap Flow Measurements
by James Solum and Bwalya Malama
Water 2022, 14(11), 1812; https://doi.org/10.3390/w14111812 - 04 Jun 2022
Cited by 1 | Viewed by 1887
Abstract
The results reported in this work are based in part on measurements of sap flow in a few select trees on a representative riparian forest plot coupled with a forest-wide randomized sampling of tree sapwood area in a watershed located along the Pacific [...] Read more.
The results reported in this work are based in part on measurements of sap flow in a few select trees on a representative riparian forest plot coupled with a forest-wide randomized sampling of tree sapwood area in a watershed located along the Pacific coast in Santa Cruz County, California. These measurements were upscaled to estimate evapotranspiration (ET) across the forest and to quantify groundwater usage by dominant phreatophyte vegetation. Canopy cover in the study area is dominated by red alder (Alnus rubra) and arroyo willow (Salix lasiolepis), deciduous phreatophyte trees from which a small sample was selected for instrumentation with sap flow sensors on a single forest plot. These localized sap flow measurements were then upscaled to the entire riparian forest to estimate forest ET using data from a survey of sapwood area on six plots scattered randomly across the entire forest. The estimated canopy-scale ET was compared to reference ET and NDVI based estimates. The results show positive correlation between sap flow based estimates and those of the other two methods, though over the winter months, sap flow-based ET values were found to significantly underestimate ET as predicted by the other two methods. The results illustrate the importance of ground-based measurements of sap flow for calibrating satellite based methods and for providing site-specific estimates and to better characterize the ET forcing in groundwater flow models. Full article
(This article belongs to the Topic Water Management in the Era of Climatic Change)
Show Figures

Figure 1

15 pages, 8478 KiB  
Article
Quantitative Land-Use and Landslide Assessment: A Case Study in Rize, Türkiye
by Natsuki Kasahara, Yutaka Gonda and Nejan Huvaj
Water 2022, 14(11), 1811; https://doi.org/10.3390/w14111811 - 04 Jun 2022
Cited by 2 | Viewed by 2284
Abstract
Currently, many studies have reported that many landslides occur in tea or rubber plantation areas. In these areas, it is important to make a landslide susceptibility map and to take necessary measures to mitigate landslide damage. However, since historical landslide distribution data and [...] Read more.
Currently, many studies have reported that many landslides occur in tea or rubber plantation areas. In these areas, it is important to make a landslide susceptibility map and to take necessary measures to mitigate landslide damage. However, since historical landslide distribution data and land use data are not available, quantitative landslide assessment measurements have not been made in many countries. Therefore, in this study, landslide distribution maps and land use maps are created with worldwide available satellite imagery and Google Earth imagery, and the relationship between landslides and land use is analyzed in Rize, Türkiye. The results show that landslides are 1.75 to 5 times more likely to occur in tea gardens than in forests. It was also found that land use has the highest contribution to landslides among the landslide conditioning factors. The landslide assessment, using a simple landslide detection method and land use classification method with worldwide available data, enabled us to quantitatively reveal the characteristics of landslides. The results of this study reveal that quantitative landslide assessments can be applied in any location, where relatively high resolution satellite imagery and Google Earth imagery, or its alternatives, are available. Full article
Show Figures

Figure 1

18 pages, 4246 KiB  
Article
Transition Indices of Sediment-Transport Modes on a Debris Flow Resulting from Changing Streambed Gradients
by Takashi Wada, Hirotada Mishima, Jin Takemura, Kazuki Kobayashi and Hiroshi Miwa
Water 2022, 14(11), 1810; https://doi.org/10.3390/w14111810 - 04 Jun 2022
Viewed by 1911
Abstract
We conducted experiments using an experimental flume with two variable streambed gradients in the upstream and downstream parts with various debris flows, composition sizes, and supply flow rates. We investigated the transition processes of sediment transport modes along the longitudinal distances from the [...] Read more.
We conducted experiments using an experimental flume with two variable streambed gradients in the upstream and downstream parts with various debris flows, composition sizes, and supply flow rates. We investigated the transition processes of sediment transport modes along the longitudinal distances from the gradient change point using the transition mode indices, ICs¯x, Ih¯x, and IU¯x; these indices were calculated based on measurements of sediment transport concentrations, flow depths, and gravel migration velocities in the debris flow’s front in the downstream part. Using these indices, we postulated that after the debris flow passed the gradient change point, the transition of the sediment transport modes progressed by changing the measured parameters to those in the steady-state condition on the gradient of the downstream parts. In addition, these indices suggested that the gravel migration velocities in the flow front interior changed most rapidly after passing the gradient change point, and that flow depths tended to change most slowly. Finally, the indices suggested that as the debris flow material became finer and the supplied flow rates became larger, the longitudinal transition sections tended to be longer because the momentum needed to transport the material was less than the total debris flow momentum. Full article
Show Figures

Figure 1

18 pages, 341 KiB  
Review
An Overview of Microbial Source Tracking Using Host-Specific Genetic Markers to Identify Origins of Fecal Contamination in Different Water Environments
by Lisa Paruch and Adam M. Paruch
Water 2022, 14(11), 1809; https://doi.org/10.3390/w14111809 - 04 Jun 2022
Cited by 7 | Viewed by 4426
Abstract
Fecal contamination of water constitutes a serious health risk to humans and environmental ecosystems. This is mainly due to the fact that fecal material carries a variety of enteropathogens, which can enter and circulate in water bodies through fecal pollution. In this respect, [...] Read more.
Fecal contamination of water constitutes a serious health risk to humans and environmental ecosystems. This is mainly due to the fact that fecal material carries a variety of enteropathogens, which can enter and circulate in water bodies through fecal pollution. In this respect, the prompt identification of the polluting source(s) is pivotal to guiding appropriate target-specific remediation actions. Notably, microbial source tracking (MST) is widely applied to determine the host origin(s) contributing to fecal water pollution through the identification of zoogenic and/or anthropogenic sources of fecal environmental DNA (eDNA). A wide array of host-associated molecular markers have been developed and exploited for polluting source attribution in various aquatic ecosystems. This review is intended to provide the most up-to-date overview of genetic marker-based MST studies carried out in different water types, such as freshwaters (including surface and groundwaters) and seawaters (from coasts, beaches, lagoons, and estuaries), as well as drinking water systems. Focusing on the latest scientific progress/achievements, this work aims to gain updated knowledge on the applicability and robustness of using MST for water quality surveillance. Moreover, it also provides a future perspective on advancing MST applications for environmental research. Full article
25 pages, 6876 KiB  
Article
Trends in Groundwater Levels in Alluvial Aquifers of the Murray–Darling Basin and Their Attributions
by Guobin Fu, Rodrigo Rojas and Dennis Gonzalez
Water 2022, 14(11), 1808; https://doi.org/10.3390/w14111808 - 04 Jun 2022
Cited by 8 | Viewed by 3398
Abstract
Groundwater levels represent the aggregation of different hydrological processes acting at multiple spatial and temporal scales within aquifer systems. Analyzing trends in groundwater levels is therefore essential to quantify available groundwater resources for beneficial use, and to devise plans/policies to better manage these [...] Read more.
Groundwater levels represent the aggregation of different hydrological processes acting at multiple spatial and temporal scales within aquifer systems. Analyzing trends in groundwater levels is therefore essential to quantify available groundwater resources for beneficial use, and to devise plans/policies to better manage these resources. In this work, three trend analysis methods are employed to detect long-term (1971–2021) trends in annual mean/minimum/maximum depth to water table (DTW) at 910 bores. This analysis is performed in eight main alluvial systems in the Murray–Darling Basin (MDB), Australia, which concentrate nearly 75% of groundwater use. The results show: (a) an overall increasing trend in DTW across alluvial aquifers attributable to changes in recharge from rainfall and groundwater extraction; (b) the analysis methods employed show similar statistical significances and magnitudes, but differences exist; (c) the annual minimum DTW has a smaller trend magnitude than annual mean DTW, and the annual maximum DTW has a larger trend magnitude than mean DTW; (d) trends in annual rainfall and potential evaporation, and cumulative number of production bores, are consistent with the groundwater trends; (e) irrigation is responsible for some of the decreasing trend in groundwater level. These results could be used to target further research and monitoring programs, and inform groundwater resource management decisions in the MDB. Full article
Show Figures

Figure 1

17 pages, 2916 KiB  
Article
Removal of METH through Tertiary or Advanced Treatment in a WWTP
by Mariuxi Ponce-Arguello, Viviana Abad-Sarango, Tania Crisanto-Perrazo and Theofilos Toulkeridis
Water 2022, 14(11), 1807; https://doi.org/10.3390/w14111807 - 03 Jun 2022
Cited by 3 | Viewed by 3353
Abstract
METHs are drugs that enter wastewater through the feces and urine of users. Conventional wastewater treatment plants are not capable of removing this type of emerging contaminant, but, in recent years, techniques have been developed to abate drugs of abuse. The present investigation [...] Read more.
METHs are drugs that enter wastewater through the feces and urine of users. Conventional wastewater treatment plants are not capable of removing this type of emerging contaminant, but, in recent years, techniques have been developed to abate drugs of abuse. The present investigation focused on obtaining the technique that keeps the best balance between the comparison criteria considered: efficiency; costs; development stage; and waste generation. That is why a bibliographic review was carried out in the scientific databases of the last eight years, concluding that the six most popular techniques are: SBR, Fenton reaction, mixed-flow bioreactor, ozonation, photocatalysis, and UV disinfection. Subsequently, the Saaty and Modified Saaty methods were applied, obtaining a polynomial equation containing the four comparison criteria for the evaluation of the techniques. It is concluded that the UV disinfection method is the one with the best relationship between the analyzed criteria, reaching a score of 0.8591/1, followed by the Fenton method with a score of 0.6925/1. This research work constitutes a practical and easy-to-use tool for decision-makers, since it allows finding an optimal treatment for the abatement of METHs. Full article
(This article belongs to the Section Wastewater Treatment and Reuse)
Show Figures

Figure 1

3 pages, 199 KiB  
Editorial
Special Issue “Salinization of Water Resources: Ongoing and Future Trends”
by Nicolò Colombani
Water 2022, 14(11), 1806; https://doi.org/10.3390/w14111806 - 03 Jun 2022
Cited by 2 | Viewed by 1173
Abstract
All over the Earth, more and more studies have shown the effects of climate changes generated by anthropic release of greenhouse gasses on the hydrological cycle [...] Full article
(This article belongs to the Special Issue Salinization of Water Resources: Ongoing and Future Trends)
24 pages, 5583 KiB  
Article
Trend Detection in Annual Streamflow Extremes in Brazil
by Saulo A. de Souza and Dirceu S. Reis, Jr.
Water 2022, 14(11), 1805; https://doi.org/10.3390/w14111805 - 03 Jun 2022
Cited by 2 | Viewed by 2673
Abstract
Changes in streamflow extremes can affect the economy and are likely to impact the most vulnerable in society. Estimating these changes is crucial to develop rational adaptation strategies and to protect society. Streamflow data from 1106 gauges were used to provide a comprehensive [...] Read more.
Changes in streamflow extremes can affect the economy and are likely to impact the most vulnerable in society. Estimating these changes is crucial to develop rational adaptation strategies and to protect society. Streamflow data from 1106 gauges were used to provide a comprehensive analysis of change in eight different extreme indices. The modified trend-free prewhitening and the false discovery rate were used to account for serial correlation and multiplicity in regional analysis, issues shown here to distort the results if not properly addressed. The estimated proportion of gauges with significant trends in low and high flows was about 23% and 15%, respectively. Half of these significant gauges had more than 60 years of data and were associated with changes greater than 5% per decade. A clear spatial pattern was identified, where most increasing trends in both low and high flows were observed in Southern Brazil, and decreasing trends in the remaining regions, except for the Amazon, where a pattern is not clear, and the proportion of significant gauges is low. Results based only on gauges unaffected by reservoirs suggest that reservoirs alone do not explain the increasing trends of low flows in the southern regions nor the decreasing trends in high flows in the remaining hydrographic regions. Full article
(This article belongs to the Section Hydrology)
Show Figures

Figure 1

15 pages, 2527 KiB  
Article
Predictors of Variations in Residential Water Consumption in Central Texas
by Lloyd B. Potter, Darrel M. Tremaine and Jay L. Banner
Water 2022, 14(11), 1804; https://doi.org/10.3390/w14111804 - 03 Jun 2022
Viewed by 3441
Abstract
Background: The 100th Meridian in Texas aligns with a corridor of large and rapidly growing urban areas with a growing water demand and limited supply. Understanding the variations in residential water consumption may assist with identifying the characteristics associated with disproportionate water consumption [...] Read more.
Background: The 100th Meridian in Texas aligns with a corridor of large and rapidly growing urban areas with a growing water demand and limited supply. Understanding the variations in residential water consumption may assist with identifying the characteristics associated with disproportionate water consumption that may be responsive to policy changes and enforcement. Methods: Data from the San Antonio Water System, the Bexar County Appraisal District, and the American Community Survey were utilized. The average daily water consumption was estimated for the seasons and a total year for more than 300,000 single-family residences between 2009 and 2015. The presence of a swimming pool, residential parcel hectares, size of the living space, and per capita income were examined as predictors of the variations in residential water consumption using hierarchal modeling. Results: The presence of swimming pools and a residential property’s value were the strongest predictors of water consumption. Parcel hectares and household income were positively associated with water consumption. A quartile analysis of select independent variables identified the disproportionate variations of water consumption of units with large yards, swimming pools, and high values. Conclusions: The findings indicate a strong association between variations in residential water consumption and both irrigation and swimming pool water used, which emphasize a need to focus conservation efforts on higher-valued housing and residences with swimming pools and the consideration of tiered pricing. Full article
(This article belongs to the Section Urban Water Management)
Show Figures

Figure 1

15 pages, 3574 KiB  
Article
Effect of Shelterbelt Construction on Soil Water Characteristic Curves in an Extreme Arid Shifting Desert
by Chuanyu Ma, Luobin Tang, Wenqian Chang, Muhammad Tauseef Jaffar, Jianguo Zhang, Xiong Li, Qing Chang and Jinglong Fan
Water 2022, 14(11), 1803; https://doi.org/10.3390/w14111803 - 02 Jun 2022
Cited by 3 | Viewed by 2112
Abstract
To explore the impact of artificial shelterbelt construction with saline irrigation on the soil water characteristic curve (SWCC) of shifting sandy soil in extreme arid desert areas, three treatments including under the shelterbelt (US), bare land in the shelterbelt (BL) and shifting sandy [...] Read more.
To explore the impact of artificial shelterbelt construction with saline irrigation on the soil water characteristic curve (SWCC) of shifting sandy soil in extreme arid desert areas, three treatments including under the shelterbelt (US), bare land in the shelterbelt (BL) and shifting sandy land (CK) in the hinterland of the Taklimakan Desert were selected. The age of the shelterbelt is 16, and the vegetation cover is mainly Calligonum mongolicum. The soils from different depths of 0–30 cm were taken keeping in view the objective of the study. The SWCCs were determined by the centrifugal method and fitting was performed using various models such as the Gardner (G) model, Brooks–Corey (BC) model and Van Genuchten (VG) model. Then, the most suitable SWCC model was selected. The results showed that electrical conductivity (EC) and organic matter content of BL and US decreased with the increasing soil depth, while the EC and organic matter content of CK increased with the soil depth. The changes in soil bulk density, EC and organic matter of 0–5 cm soil were mostly significant (p < 0.05) for different treatments, and the differences in SWCCs were also significant among different treatments. Moreover, the construction of an artificial shelterbelt improved soil water-holding capacity and had the most significant impacts on the surface soil. The increase in soil water-holding capacity decreased with increasing soil depth, and the available soil water existed in the form of readily available water. The BC model and VG model were found to be better than the G model in fitting results, and the BC model had the best fitting result on CK, while the VG Model had the best fitting result on BL with higher organic matter and salt contents. Comparing the fitting results of the three models, we concluded that although the fitting accuracy of the VG model tended to decrease with increasing organic matter and salinity, the VG model had the highest fitting accuracy when comparing with BC and G models for the BL treatment with high organic matter and salinity. Therefore, the influence of organic matter and salinity should be considered when establishing soil water transfer function. Full article
(This article belongs to the Special Issue Soil Hydrological Processes in Desert Regions)
Show Figures

Figure 1

18 pages, 8056 KiB  
Article
Numerical Investigation of Sediment Flushing and Morphological Changes in Tamsui River Estuary through Monsoons and Typhoons
by Tung-Chou Hsieh, Yan Ding, Keh-Chia Yeh and Ren-Kai Jhong
Water 2022, 14(11), 1802; https://doi.org/10.3390/w14111802 - 02 Jun 2022
Cited by 1 | Viewed by 1919
Abstract
The removal of reservoir silt and the restoration of existing reservoir capacities through land excavation and hydraulic sediment flushing have become necessary. Hydraulic sediment flushing discharge changes flow and sediment conditions of the downstream river channel. In the Tamsui River estuary in Taiwan, [...] Read more.
The removal of reservoir silt and the restoration of existing reservoir capacities through land excavation and hydraulic sediment flushing have become necessary. Hydraulic sediment flushing discharge changes flow and sediment conditions of the downstream river channel. In the Tamsui River estuary in Taiwan, sediment flushing from the Shihmen reservoir upstream has potential impacts on the morphology of the navigation channels and the adjacent coasts. This study employed a validated coastal and estuarine processes model to investigate: (1) the influence of sediment flushing and tidal levels on morphological changes during flood and flushing-discharge operations of the reservoir, and (2) the differences in morphological changes on the estuary between monsoon and typhoon seasons. The prediction of the morphological changes was carried out by simulating hydrodynamic and morphodynamic processes under multi-year synthetic conditions combined by northeast monsoon and three historical typhoon events. The simulation results reveal that during the operation of sediment flushing when the peak discharge of river flood flow reaches the estuary section at ebb tides, more sediment can be transported to the open sea than that at flood tides. Additionally, the nature reserve area on the left bank of the estuary is eroded during monsoon and silted in typhoon seasons. Full article
(This article belongs to the Special Issue Hydrodynamics in Ocean Environment: Experiment and Simulation)
Show Figures

Figure 1

20 pages, 1942 KiB  
Article
Ecotoxicological Consequences of the Abatement of Contaminants of Emerging Concern by Ozonation—Does Mixture Complexity Matter?
by Fátima Jesus, Carla Bernardo, Rui C. Martins, João Gomes and Joana Luísa Pereira
Water 2022, 14(11), 1801; https://doi.org/10.3390/w14111801 - 02 Jun 2022
Cited by 2 | Viewed by 2081
Abstract
Ozonation has been used to degrade persistent water contaminants, namely, pharmaceuticals and personal care products (PPCPs). However, ozonation can lead to by-products that can be more toxic than the parent compounds. This work aims to assess whether the ecotoxicological effects of ozonation are [...] Read more.
Ozonation has been used to degrade persistent water contaminants, namely, pharmaceuticals and personal care products (PPCPs). However, ozonation can lead to by-products that can be more toxic than the parent compounds. This work aims to assess whether the ecotoxicological effects of ozonation are modified as the initial matrix being treated increases in complexity, considering mixtures of 2, 3, 4 and 5 PPCPs. The following PPCPs were used: two parabens (metylparaben (MP) and propylparaben (PP)), paracetamol (PCT), sulfamethoxazole (SMX) and carbamazepine (CBZ). The following model species were used to assess toxicity: the crustacean Daphnia magna, the microalgae Raphidocelis subcapitata, the macrophyte Lemna minor and the watercress Lepidium sativum. There was a trend of increased toxicity with increasing mixture complexity of the untreated samples, except for D. magna. The same was observed after ozonation with the exception of the mixture MP+PP, which showed high toxicity to all the tested species, namely 100% immobilization of D. magna. The toxicity of SMX to the primary producers decreased pronouncedly after ozonation, except for L. minor. This study highlights the importance of considering the complexity of the matrix being treated and of using an ecotoxicological test battery with a wide diversity of species for assessing ozonation efficiency. Full article
Show Figures

Graphical abstract

13 pages, 3951 KiB  
Article
Effective Removal of Humic Acid by Zr-MOFs with Surface Modification
by Yuankang Jiang, Zhenggang Wang, Zhiping Zhu, Mingpeng He and Pan Zhou
Water 2022, 14(11), 1800; https://doi.org/10.3390/w14111800 - 02 Jun 2022
Cited by 3 | Viewed by 2066
Abstract
Humic acid (HA) in makeup water is one of the important safety issues of high-parameter power plants. Herein, the Zr-based metal organic frameworks (Zr-MOFs) were applied to remove humic acid in water. The mesoporous and active sites of Zr-MOFs were controlled by different [...] Read more.
Humic acid (HA) in makeup water is one of the important safety issues of high-parameter power plants. Herein, the Zr-based metal organic frameworks (Zr-MOFs) were applied to remove humic acid in water. The mesoporous and active sites of Zr-MOFs were controlled by different ratios of ligands to increase the adsorption of HA. The maximum adsorption capacity was 150.15 mg g−1. The morphology and adsorption properties of the Zr-MOFs were characterized using scanning electron microscopy (SEM), X-ray diffraction (XRD), surface charge, Fourier Transform infrared (FT-IR), N2 adsorption-desorption and adsorption test. The adsorption process of HA accorded with the pseudo-second-order kinetics, while the adsorption isotherm conformed to the Langmuir model and the adsorption was proved to be a spontaneous and endothermic process. Physical adsorption by the mesoporous materials and the hydrogen bonding interactions between the Zr-MOFs and HA were the driving forces of HA adsorption. These results provided useful information for the effective removal of HA and enhanced our understanding of the adsorption mechanism of HA on Zr-MOFs. Full article
Show Figures

Figure 1

23 pages, 5104 KiB  
Article
Filling Gaps in Daily Precipitation Series Using Regression and Machine Learning in Inter-Andean Watersheds
by Marcelo Portuguez-Maurtua, José Luis Arumi, Octavio Lagos, Alejandra Stehr and Nestor Montalvo Arquiñigo
Water 2022, 14(11), 1799; https://doi.org/10.3390/w14111799 - 02 Jun 2022
Cited by 11 | Viewed by 4435
Abstract
As precipitation is a fundamental component of the global hydrological cycle that governs water resource distribution, the understanding of its temporal and spatial behavior is of great interest, and exact estimates of it are crucial in multiple lines of research. Meteorological data provide [...] Read more.
As precipitation is a fundamental component of the global hydrological cycle that governs water resource distribution, the understanding of its temporal and spatial behavior is of great interest, and exact estimates of it are crucial in multiple lines of research. Meteorological data provide input for hydroclimatic models and predictions, which generally lack complete series. Many studies have addressed techniques to fill gaps in precipitation series at annual and monthly scales, but few have provided results at a daily scale due to the complexity of orographic characteristics and in some cases the non-linearity of precipitation. The objective of this study was to assess different methods of filling gaps in daily precipitation data using regression model (RM) and machine learning (ML) techniques. RM included linear regression (LRM) and multiple regression (MRM) algorithms, while ML included multiple regression algorithms (ML-MRM), K-nearest neighbors (ML-KNN), gradient boosting trees (ML-GBT), and random forest (ML-RF). This study covered the Malas, Omas, and Cañete River (MOC) watersheds, which are located on the Pacific Slope of central Peru, and a nineteen-year period of records (2001–2019). To assess model performance, different statistical metrics were applied. The results showed that the optimized machine learning (OML) models presented the least variability in estimation errors and the best approximation of the actual data from the study zone. In addition, this investigation shows that ML interprets and analyzes non-linear relationships between rain gauges at a daily scale and can be used as an efficient method of filling gaps in daily precipitation series. Full article
(This article belongs to the Section Hydrology)
Show Figures

Figure 1

Previous Issue
Next Issue
Back to TopTop