Article

Atmospheric Distribution of PAHs and Quinones in the Gas and PM1 Phases in the Guadalajara Metropolitan Area, Mexico: Sources and Health Risk

by
Valeria Ojeda-Castillo
1,2,
Alberto López-López
1,†,
Leonel Hernández-Mena
1,
Mario Alfonso Murillo-Tovar
3,
José De Jesús Díaz-Torres
1,
Iván Y. Hernández-Paniagua
4,5,
Jorge Del Real-Olvera
1 and
Elizabeth León-Becerril
1,*
1
Centro de Investigación y Asistencia en Tecnología y Diseño del Estado de Jalisco A.C. (CIATEJ), Unidad de Tecnología Ambiental, Av. Normalistas No. 800, Col. Colinas de la Normal, Guadalajara-Jalisco C.P. 44270, Mexico
2
Posgrado Interinstitucional en Ciencia y Tecnología (PICYT), Sede CIATEJ, Av. Normalistas No. 800, Col. Colinas de la Normal, Guadalajara-Jalisco C.P. 44270, Mexico
3
CONACYT-Centro de Investigaciones Químicas-IICBA, Universidad Autónoma del Estado de Morelos, Av. Universidad 1001, Col. Chamilpa, Cuernavaca C.P. 62209, Morelos, Mexico
4
CONACYT-Consorcio CENTROMET, Camino a Los Olvera 44, Los Olvera, Corregidora, Querétaro 76904, Mexico
5
Centro de Ciencias de la Atmósfera, Universidad Nacional Autónoma de Mexico, Circuito de la Investigación Científica S/N, Ciudad Universitaria, Coyoacán 04510, Ciudad de Mexico, Mexico
*
Author to whom correspondence should be addressed.
Deceased.
Atmosphere 2018, 9(4), 137; https://doi.org/10.3390/atmos9040137
Submission received: 27 January 2018 / Revised: 1 April 2018 / Accepted: 3 April 2018 / Published: 5 April 2018
(This article belongs to the Special Issue Urban Particulate Matters: Composition, Sources, and Exposure)

Abstract

:
Polycyclic aromatic hydrocarbons (PAHs) and quinones in the gas phase and as submicron particles raise concerns due to their potentially carcinogenic and mutagenic properties. The majority of existing studies have investigated the formation of quinones, but it is also important to consider both the primary and secondary sources to estimate their contributions. The objectives of this study were to characterize PAHs and quinones in the gas and particulate matter (PM1) phases in order to identify phase distributions, sources, and cancer risk at two urban monitoring sites in the Guadalajara Metropolitan Area (GMA) in Mexico. The simultaneous gas and PM1 phases samples were analyzed using a gas chromatography–mass spectrometer. The lifetime lung cancer risk (LCR) due to PAH exposure was calculated to be 1.7 × 10⁻³, higher than the recommended risk value of 10−6, indicating a potential health hazard. Correlations between parent PAHs, criteria pollutants, and meteorological parameters suggest that primary sources are the main contributors to the Σ8 Quinones concentrations in PM1, while the secondary formation of 5,12-naphthacenequinone and 9,10-anthraquinone may contribute less to the observed concentration of quinones. Additionally, naphthalene, acenaphthene, fluorene, phenanthrene, and anthracene in PM1, suggest photochemical degradation into unidentified species. Further research is needed to determine how these compounds are formed.

1. Introduction

There is growing concern over breathable particle-bound polycyclic aromatic hydrocarbons (PAHs) due to their potential carcinogenic, mutagenic and immunosuppressant effects on human health [1,2]. The PAHs are produced by the incomplete combustion and thermal alteration of organic matter [3]. The ambient levels, phase, and molecular structures of the PAHs depend directly on the type of fuel and combustion technology [4]. For instance, PAHs of low molecular weight (LMW) of two to four rings predominate in the gas phase and may condense in the particle phase after emission [5]. In contrast, PAHs of high molecular weight (HMW) of more than five rings in the structure are typically emitted and found in the particle phase [1,6].
The PAHs may undergo photochemical reactions producing more toxic compounds, such as oxygenated PAHs, which are direct mutagens [7,8]. The major derivative compounds observed in the ambient air samples include quinones. Quinones are currently not considered in the international regulations despite their mutagenic properties, which highlights the importance of monitoring their ambient levels [7]. The quinones are potent redox active compounds upon deposition within the lung and can undergo enzymatically (e.g., P450/P450 reductase) and non-enzymatically redox cycling, generating superoxide anion radicals. Under biological conditions, they may be converted to hydroxyl radicals (OH), which are potent oxidizing agents that may damage essential macromolecules, cause oxidative stress and allergic diseases [9,10]. Furthermore, PM1 bound-PAHs+quinones (BPQ) represent a significant inhalation health hazard to humans as they can penetrate into the bronchial and pulmonary regions of the respiratory system. The PM1 BPQ deposition has been correlated positively with major damage in mitochondrial DNA replication, protein synthesis and cellular metabolism, which eventually may lead to mutations and cancer [11,12,13].
In urban areas, typical high ambient levels of quinones have been reported for 1,2-naphthoquinone (1,2-NQ), 1,4-naphthoquinone (1,4-NQ), 9,10-phenanthrenequinone (9,10-PQ), and 9,10-anthraquinone (9,10-AQ) [14,15,16,17]. Quinones can be either emitted from gasoline and diesel vehicle combustion and formed as a product of gas phase LMW photochemical reactions with atmospheric oxidant species, such as hydroxyl radicals (OH), nitrate radicals (NO3) and heterogeneous reactions between particulate PAHs and ozone [18]. A detailed characterization of quinones and PAHs may help to identify emission sources and quantify population exposure in view of reducing public health risks. However, to date, source apportionment of quinones has been frequently hindered by the lack of simultaneous measurements of quinones and their parents in the gas and particulate matter (PM) phases. Combining monitoring of such phases can help to identify their primary emissions and secondary formation processes. For instance, ultrafine and submicron breathable particles have been used as robust indicators for identifying sources of PAHs and quinones, and pathways for secondary aerosol formation [19,20].
Gas and particle phase PAHs have been studied extensively, while quinones in the gas phase or as PM have received less consideration. Moreover, few studies have monitored simultaneously quinones and PAHs ambient levels in the gas and particle phases [16,21,22], while most of the existing studies have focused on quinones formation excluding the source apportionment. To date, no study has addressed PAHs and quinones sources by monitoring simultaneously the gas and PM1 phases. Therefore, the identification of PAHs secondary oxidation processes and their behavior in the atmosphere under different meteorological can help to uncover possible reaction pathways and clarify the mechanisms for PAHs reactions and their quinones products. In the Guadalajara Metropolitan Area (GMA), Mexico, only the presence of quinones in PM2.5 has been addressed to date [23], which highlights the importance of generating information that contributes to the knowledge of the PAHs’ and quinones’ ambient levels and behavior in the gas and submicron phases [16]. In order to establish phase distributions, identify the influence of primary and secondary sources, and estimate cancer risk from the occurrence of PAHs and quinones, we characterized simultaneously PAHs and quinones in the gas and PM1 phases at two urban monitoring sites in the GMA.

2. Experiments

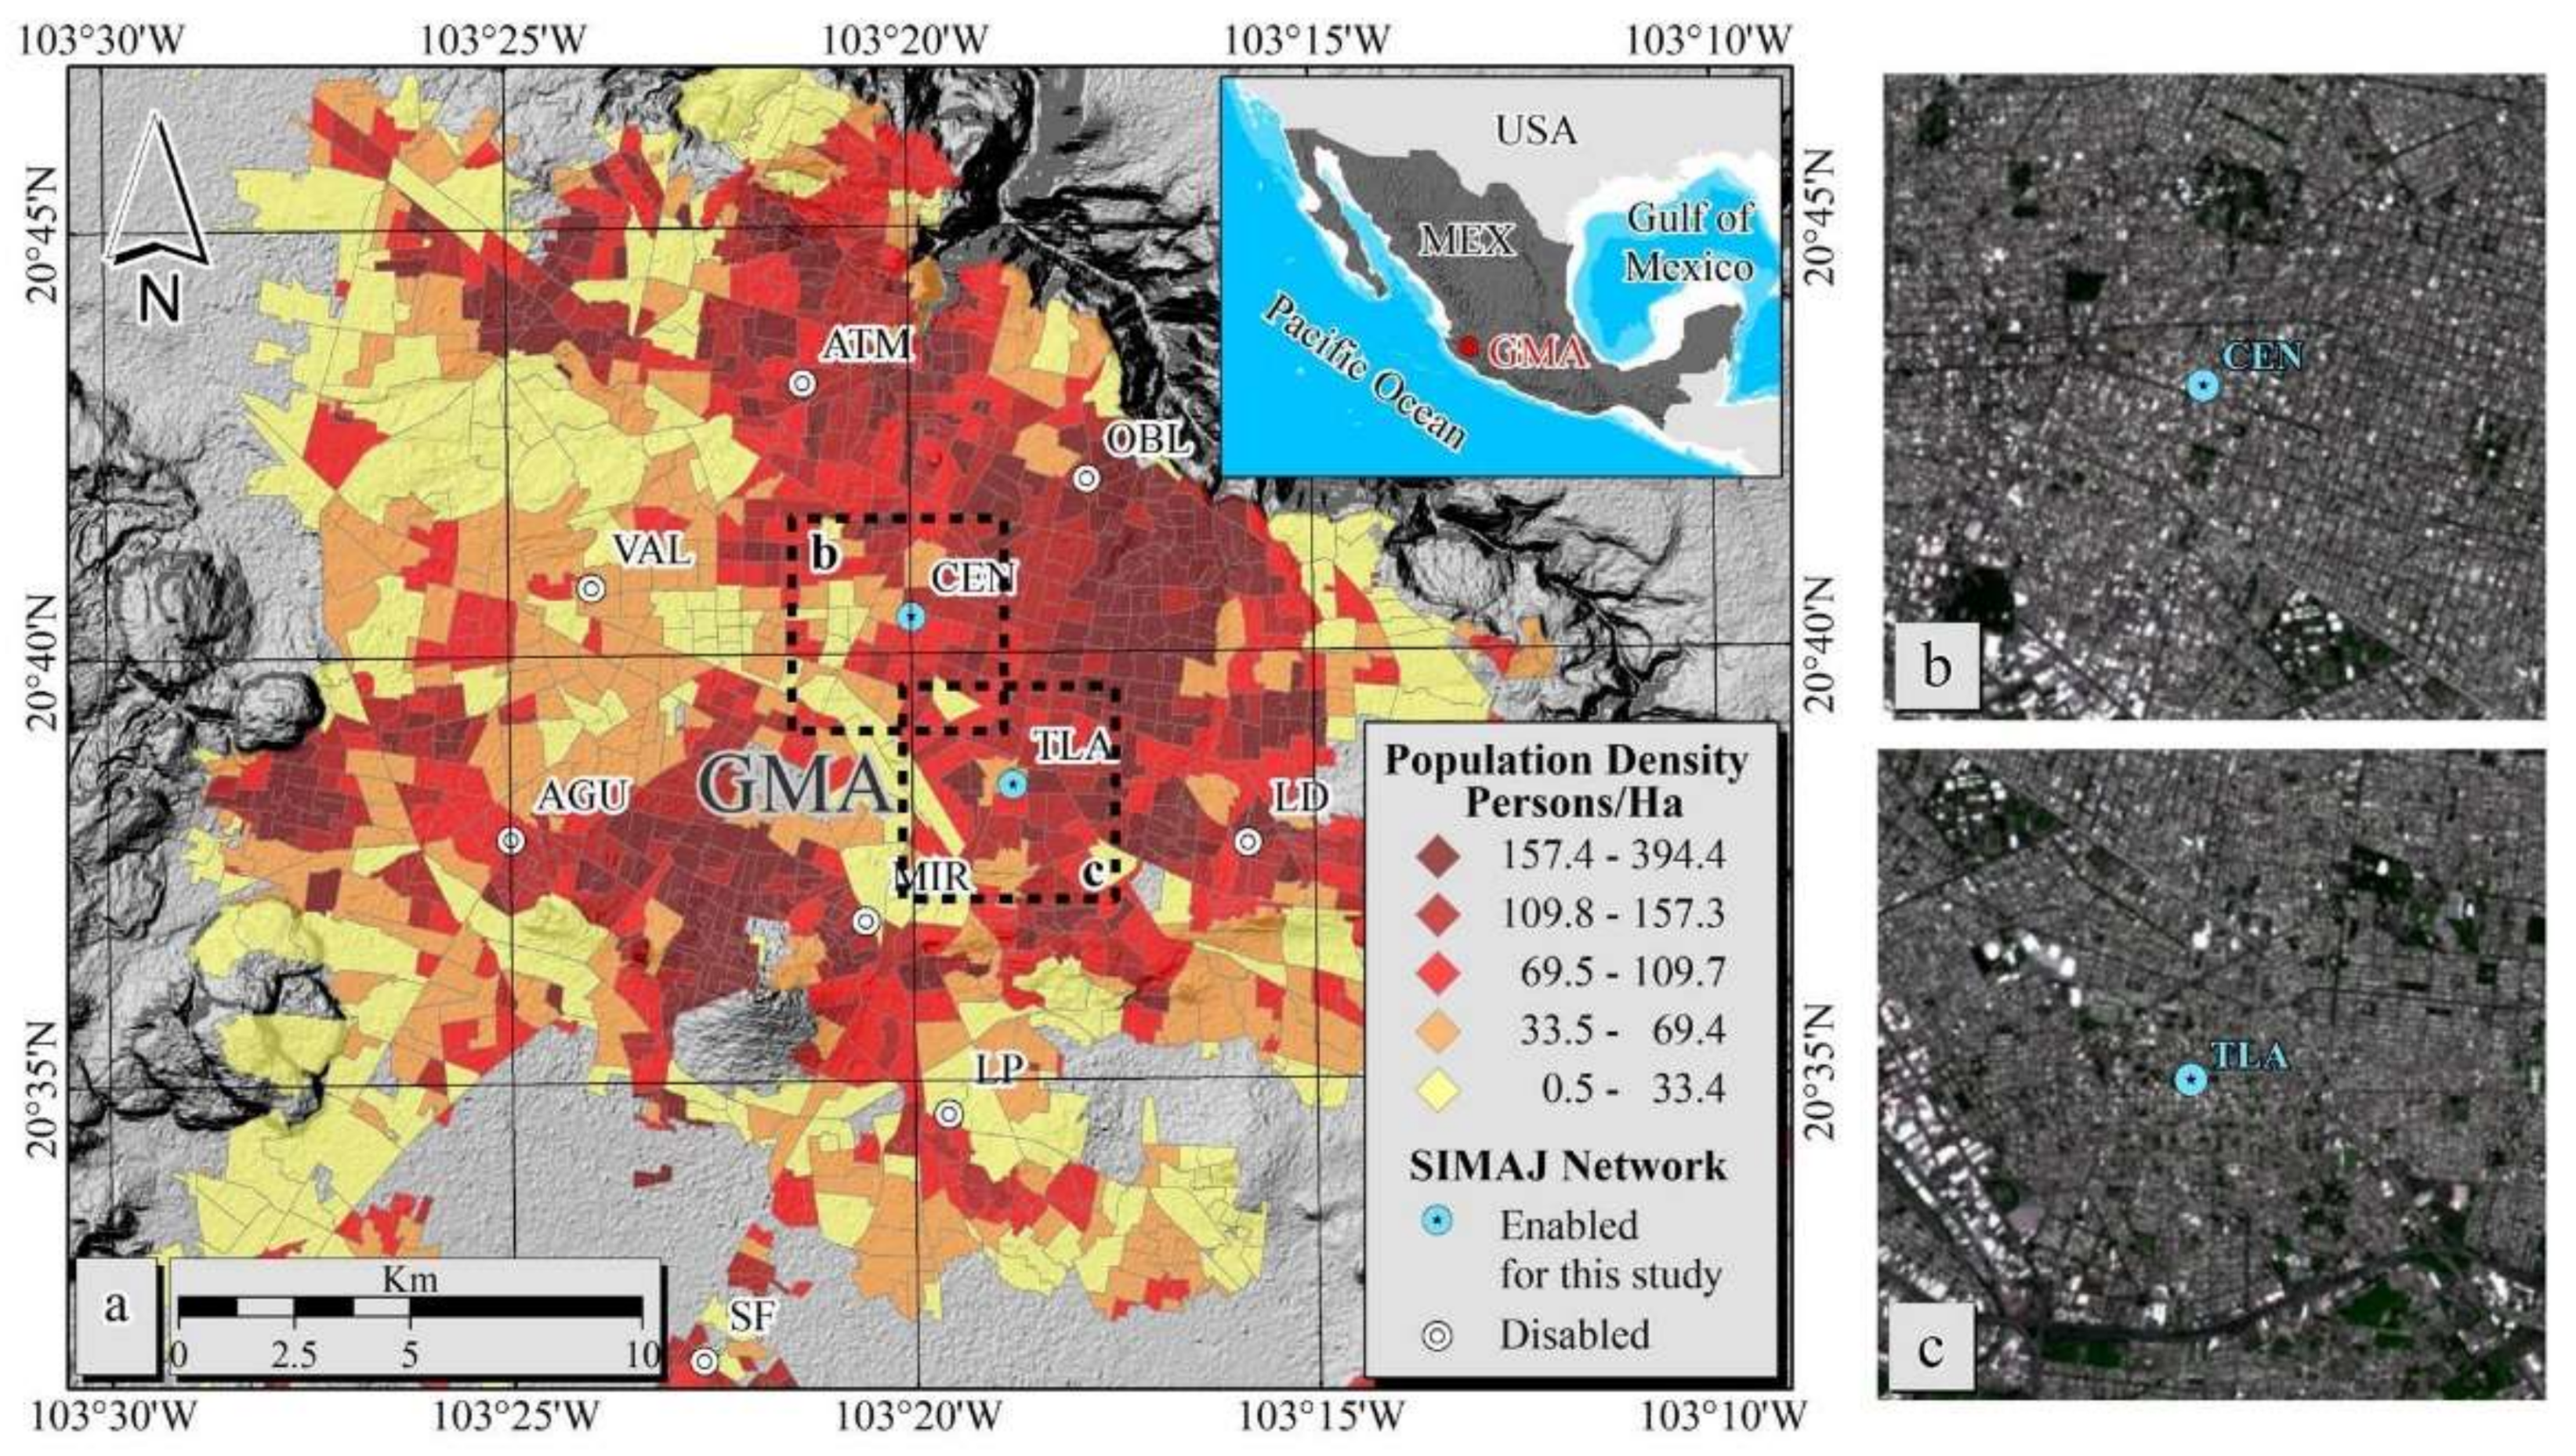
2.1. The Guadalajara Metropolitan Area (GMA)

The GMA is the second most populous City in Mexico with about 4.5 million inhabitants and covers an approximate surface area of 2239 km2. It is located around 500 km W of Mexico City (20°39′54′′ N, 103°18′42′′ W), and lies at an average altitude of 1540 m a.s.l. in the Atemajac Valley and the Tonala Plain, surrounded to the north-east by the Rio Grande Santiago Canyon. A volcanic range located south of the GMA constitutes a natural physical barrier preventing wind circulation, which causes air masses’ stagnation [24,25]. Due to the GMA latitude, solar radiation (SR) generates a highly photoreactive atmosphere [26].

2.2. Sampling Sites

PAHs and quinones in the gas and PM1 phases were sampled in a densely populated area at the Centro (CEN) and Tlaquepaque (TLA) monitoring sites, which form part of the air-quality monitoring network of the Jalisco State Government (SIMAJ) (Figure 1a). The CEN site is located in downtown GMA (Figure 1b) (20°40′25′′ N, 103°19′59′′ W, 1582 m a.s.l.), and is strongly influenced by emissions from light- and heavy-duty vehicles during most of the day, with industrial emissions having a negligible influence on the sampled air. The TLA site is located some 4 km SE of the GMA downtown (Figure 1c, 20°38′27′′ N, 103°18′45′′ W, 1622 m a.s.l.), and is surrounded by schools, restaurants, and large residential areas. Measurements of CO, SO2, O3, NOx, PM10 and PM2.5 (criteria air pollutants for Mexican legislation), and meteorological parameters (temperature, relative humidity, wind speed, wind direction, precipitation and solar radiation) have been carried at both sites continuously since January 1996 (available online: http://siga.jalisco.gob.mx).

2.3. Samples Collection

Samples of ambient air were collected at the CEN and TLA monitoring sites between April and June 2015 during the warm–dry season, which is characterized by high temperatures and SR due to clear sky conditions [27,28]. Air was sampled during 24 h (from 00:00 to 23:59 CDT) of each sampling day (Supplementary Material, Table S1) using partisol speciation 2300 samplers (Rupprecht and Patashnick Co., Albany, NY, USA), that were placed 6 m above ground level near to the air inlets of the SIMAJ instrumentation and operated at a flow rate of 16.7 liters per minute (lpm). In total, 15 duplicated samples of gas phase and 15 duplicated samples of PM1 were collected at each site. The sampling train was integrated by an anodized inlet with a PM1 impactor (ChemComb 3500, Franklin, MA, USA), equipped with a quartz filter (Ø 47 mm, GE Whatman, Amersham, Buckinghamshire, UK) for PM1 collection. For the gas-phase sampling, a cartridge of 17 mm polyurethane foam (PUF)/2 g of XAD-4 resin was used (Sigma-Aldrich Co., St. Louis, MI, USA)/PUF sandwich (PXP). Each quartz filter was baked for 12 h at 550 °C before use. The PUF and XAD-4 were pre-cleaned by sonication with a mixture of n-hexane: methylene chloride (1:1 v/v) over two periods of 30 min, the PUF was dried inside an oven at 40 °C and the XAD-4 resin was dried under a stream of nitrogen. The collected samples were transported at 4 °C and stored in a freezer at −20 °C until extraction and analysis.

2.4. Chemical Analyses

Four PAHs (fluorene-d10, fluoranthene-d10, pyrene-d10, benzo[a]pyrene-d10) and two quinones (1,4-naphthoquinone-d6, anthraquinone-d8) were added to the samples prior to extraction as surrogates [23]. Then, the PXP and filters were ultrasonically extracted using methylene chloride for 30 min twice at 45 °C; the organic extracts were concentrated on a rotary evaporator to approximately 1 mL, followed by filtration through 0.45 μm PTFE membrane filters. The samples were reduced to dryness under a stream of nitrogen. Five internal standards (naphthalene-d8, acenaphthene-d10, phenanthrene-d10, chrysene-d12, perylene-d12) were added to the concentrate extracted from the samples and the volume was adjusted to 90 μL using methylene chloride. The extracts were analyzed for PAHs and quinones using a gas chromatography–mass spectrometer (Agilent Technologies, Santa Clara, CA, USA, 6890N GC, 5975 MS), equipped with a 5% phenyl methyl siloxane column (30 m, 0.25 mm × 0.25 μm; HP5MS, Agilent J&W), with helium as carrier gas (1.1 mL min−1, constant flow). The initial oven temperature was 40 °C and was raised to 110 °C at 20 °C min−1, 300 °C at 5 °C min−1, 310 °C at 20 °C min−1, and then maintained for 10 min. One μL of extract was injected in splitless mode and quantified using single ion monitoring mode (SIM). The mass spectrums were obtained using electron impact (EI) mode (70 eV).
Overall, 16 US Environmental Protection Agency (EPA) priority PAHs were monitored: naphthalene (Nap); acenaphthylene (Ace); acenaphthene (Acy); fluorene (Fl); phenanthrene (Phe); anthracene (Ant); fluoranthene (Flu); pyrene (Pyr); benzo[a]anthracene (BaA); chrysene (Chr); benzo[b]fluoranthene (BbF); benzo[k]fluoranthene (BkF); benzo[a]pyrene (BaP); dibenz[a,h]anthracene (Dib); benzo[g,h,i]perylene (BghiP) and indeno[1,2,3–c,d]pyrene (Ind) [29]. Additionally, eight quinones were monitored: 1,4-naphthoquinone (1,4-NQ); 1,4-phenanthrenequinone (1,4-PQ); 9,10-anthraquinone (9,10-AQ); 1,4-anthraquinone (1,4-AQ); 9,10-phenanthrenequinone (9,10-PQ); 1,2-benzanthraquinone (1,2-BAQ); 1,4-chrysenequinone (1,4-CQ) and 5,12-naphthacenequinone (5,12-NAQ).

2.5. Samples’ Quality Control

Field blanks, laboratory blanks, and method blanks were used to monitor the sampling and analytical procedures. PAHs and quinones signals were not observed in the blanks. Quantification of each compound was performed using the relative response to the structural homolog as internal standard. All reported atmospheric concentrations for PAHs and quinones were corrected for the recovery of surrogates. Surrogates and average recovery (expressed in % ± standard deviation (SD)) were for 1,4-NQ-d6 of 85.2 ± 35.0; for Fl-d10 of 85.8 ± 27.1; for AQ-d8 of 103.2 ± 29.5; for Flu-d10 of 96.9 ± 25.5; for Pyr-d10 of 94.3 ± 21.3 and for BaP-d12 of 105.4 ± 25.2. The analytical methodology can be found in detail in the Supplementary Material (Tables S2–S5).

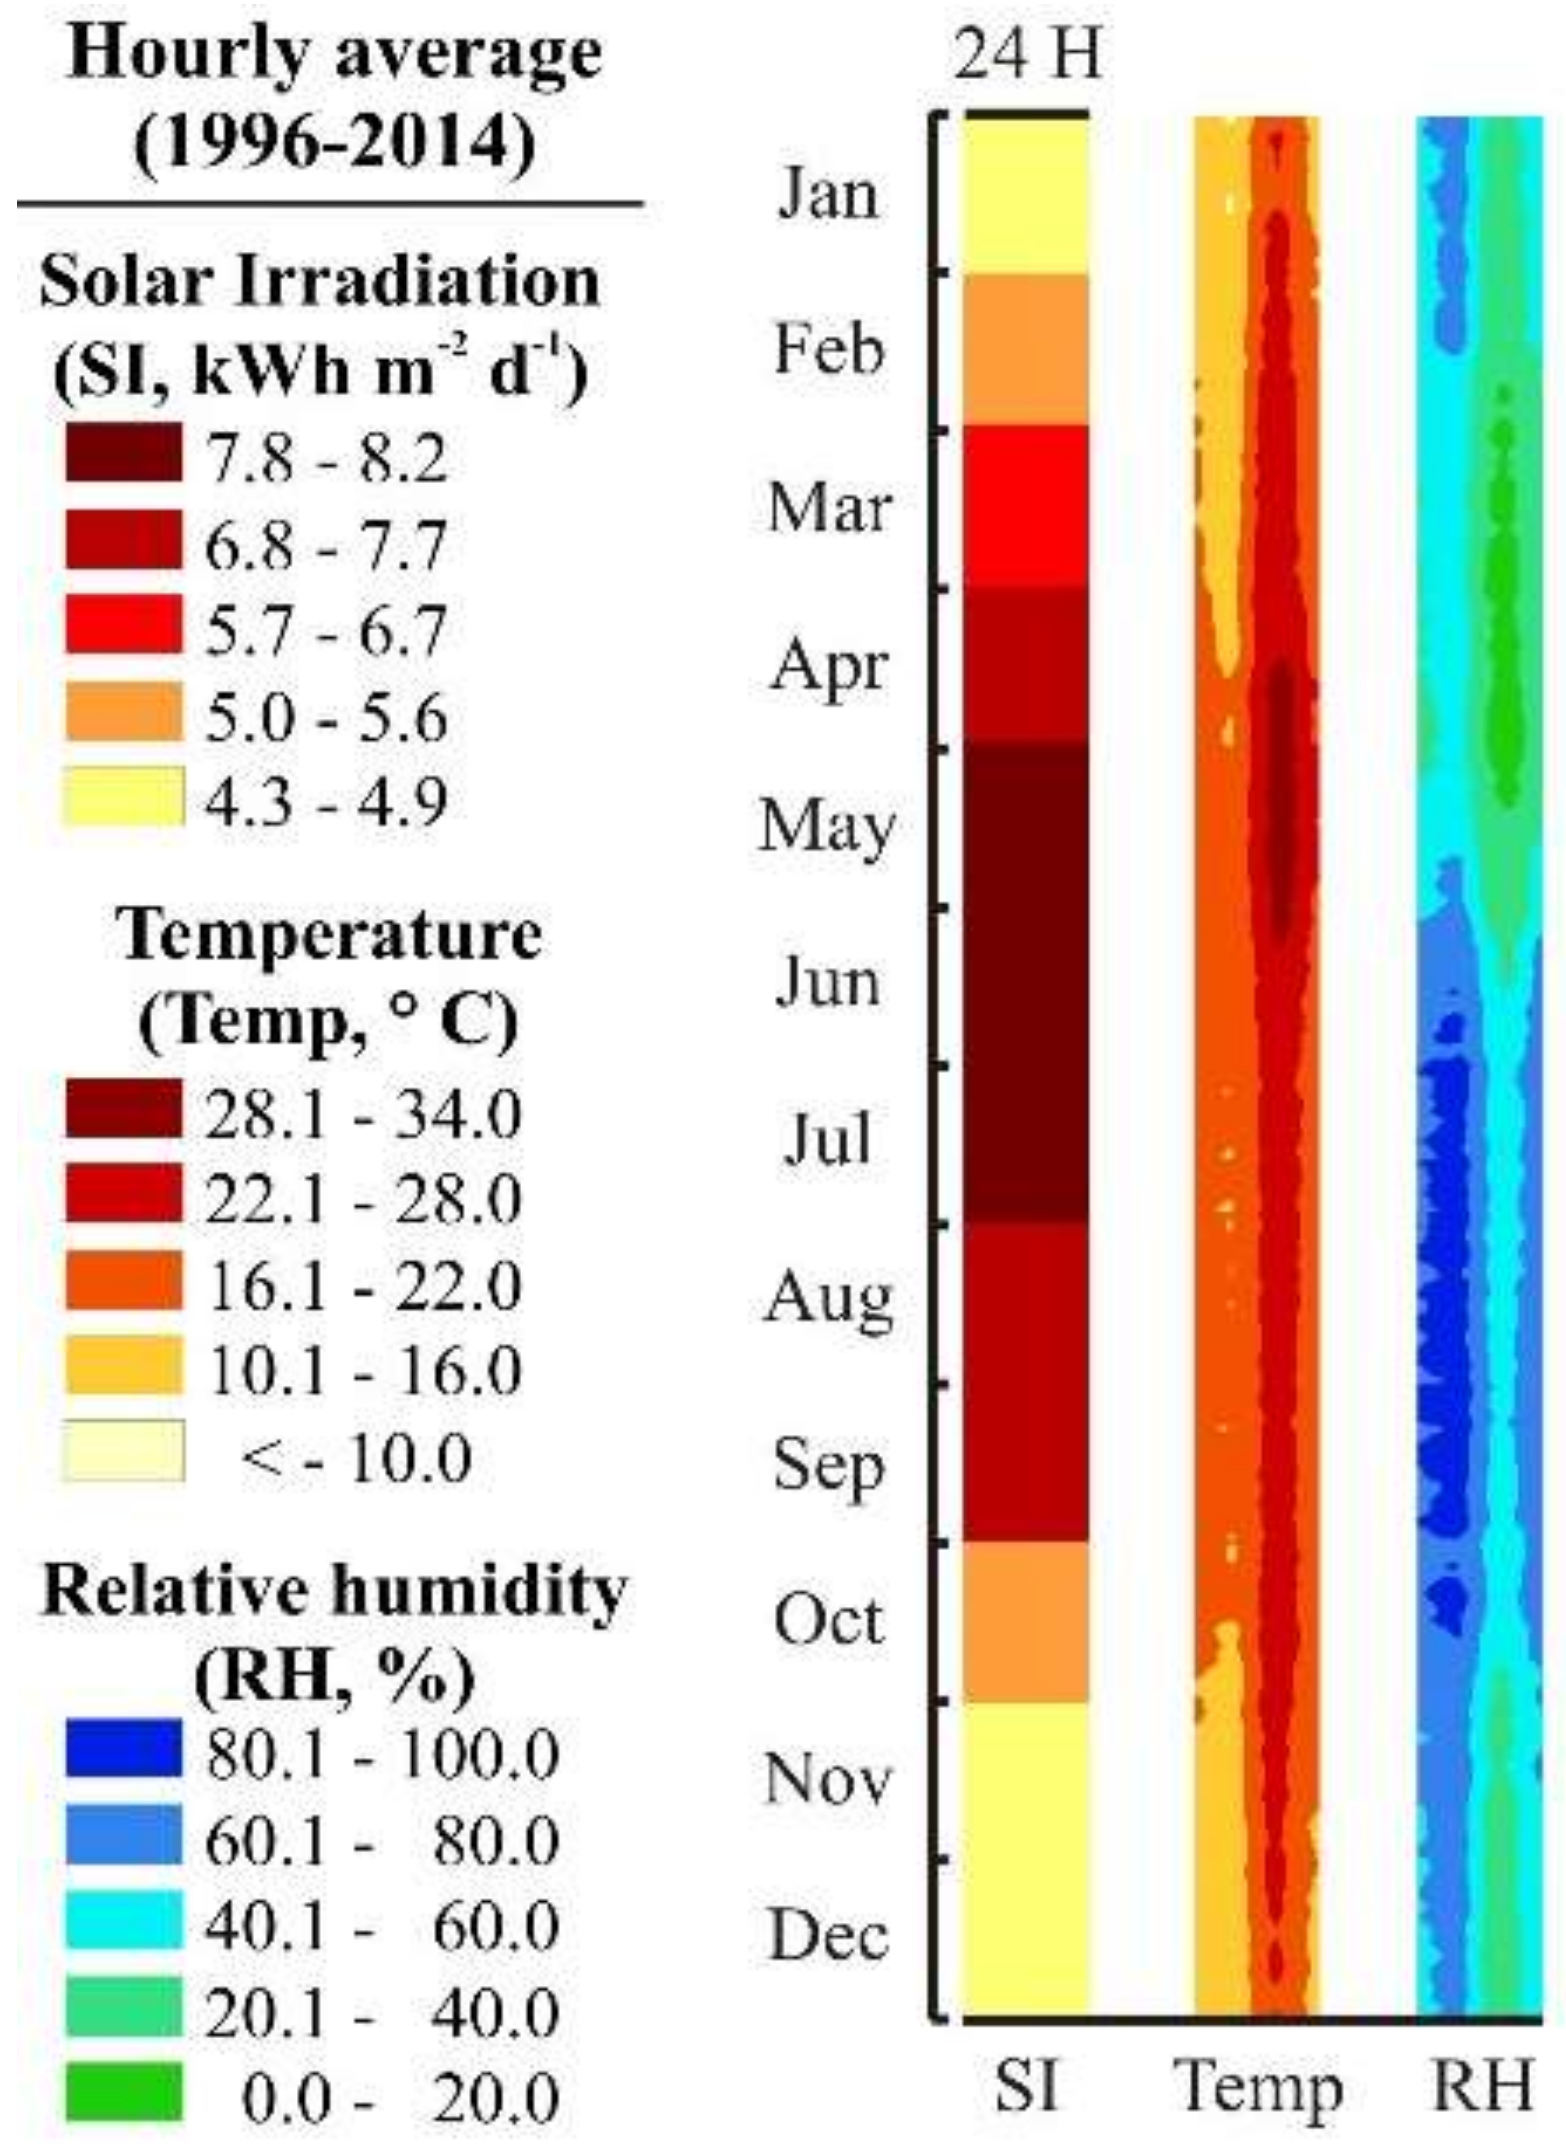
2.6. Meteorology at the GMA

The climate of the GMA is wet/dry tropical climate, with annual averages for temperature and precipitation of 19 °C and 900 mm yr−1, respectively [30,31]. Figure 2 shows the annual average profiles for temperature (Temp.), relative humidity (RH) and solar irradiation (SI), calculated from SIMAJ continuous records during 1996–2014 in the GMA, with the highest temperatures and SI being observed between May and July.
Temperature, RH, wind speed (WS), and solar radiation during the sampling campaign were recorded every 10 min at each sampling site using a Davis Vantage Pro2 weather station. Table 1 lists the summary of meteorological parameters recorded during the sampling campaign, typical of conditions in the GMA during the warm-dry season [32].

2.7. Statistical Analysis

Statistical analyzes were carried out using Minitab 16 and OriginPro 8, with the Mann–Whitney test used for comparing two groups of data and the Kruskal–Wallis test for >2 groups of data. To perform statistical analyses, averages were selected for temperature, RH and WS, and the maximum value for SR. The Spearman rank correlation was used to test relationships between quinones and PAHs with meteorological parameters (Temp, RH, WS, and SR) and criteria pollutants (PM10, O3, NO2, CO, and SO2). Statistical significance was defined for a threshold of p < 0.05 for all tests.

2.8. Source Apportionment

The concentrations of PAHs are usually standardized into ratios which allow a specific source to be distinguished and to retain reliably the signature of the original fossil combustion source (refractory) [33]. This allows identification and assessment of multiple pollution sources in a particular monitoring site [34]. The use of these ratios is based on the assumption that the isomers of PAHs have a relative thermodynamic stability or similar physical and chemical properties and, therefore, will transform and degrade at the same rate, preserving the relationship that is present in the emission; and it is expressed with Equation (1) where S is the stable isomer and U the most unstable isomer. Usually, existing studies report this relationship in the range of 0–1 [35,36]:
S S + U = S / U 1 + S / U = ( 1 + 1 S / U ) 1

2.9. Health-Risk Assessment

2.9.1. Benzo[a]pyrene (BaP) Equivalency

The benzo[a]pyrene equivalent (BaPeq) has been used commonly to calculate the risk of cancer due to recurrent exposure to PAHs [37]. To calculate the BaPeq for each PAH identified in the GMA, the relative potency factor (RPF) was used to denote the specific power of each PAH relative to that of benzo[a]pyrene (RPF = 1). BaP equivalents (BaPeq, ng m−3) were calculated as the product of each PAH concentration CPAHi with its corresponding RPFi (Equation (2)). Briefly, the C PAH i cancer potencies relative to BaP for each PAH were based on (i) tumor bioassay data with their associated range and relative confidence ratings; and (ii) an overview of the tumor bioassay database (total number of studies, exposure routes tested, species tested, sexes tested, and number of RPFs derived from benchmark dose (BMD) modeling) [38]. Here, we calculated the BaPeq and the sum of the total BaP equivalents (BaPTeq, Equation (3)) considering the RPF values in Table 2 as follows [39]:
B a P e q   =   C P A H i × R P F i
B a P T e q Σ 9 P A H = [ F l u ] × 0.08 + [ B a A ] × 0.2 + [ C h r ] × 0.1 + [ B b F ] × 0.8 + [ B k F ] × 0.03 + [ B a P ] × 1 [ I n d ] × 0.07 + [ D i b ] × 10 + [ B g h i P ] × 0.009

2.9.2. Exposure Concentrations for Assessing Cancer Risks

Exposure concentrations were calculated according to Equation (4), as proposed by the US EPA [40]:
E C = ( C A × E T × E F × E D ) / A T
where EC (ng m−3) is the exposure concentration; CA (ng m−3) is the concentration of the individual PAH in the air; ET (h d−1) is the exposure time; EF (d yr−1) is the exposure frequency; ED (yr) is the exposure duration; and AT (lifetime in yr × 365 d yr−1 × 24 h d−1) is the averaging time. Assuming exposures over a lifetime and following the recommendations of the Agency for Toxic Substances and Disease Registry (ATSDR) [41], the values used were ET = 24 h, EF = 365 days, and ED = 70 years.

2.9.3. Cancer Risk Characterized by an Inhalation Unit Risk

The excess of lifetime lung cancer risk (LCR) for a receptor can be described by the Equation (5):
L C R = I U R × E C
where IUR is the inhalation unit risk of exposure to BaP; with a selected value of 8.7 cases per 100,000 people (8.7 × 10⁻⁵ per ng m−3). Such a value is based on epidemiological data from studies of coke-oven workers with chronic inhalation exposure to 1 ng m−3 BaP over a lifetime of 70 years [42]. Finally, EC was defined as the exposure concentration (ng m−3).

3. Results and Discussion

3.1. Polycyclic Aromatic Hydrocarbons (PAHs)

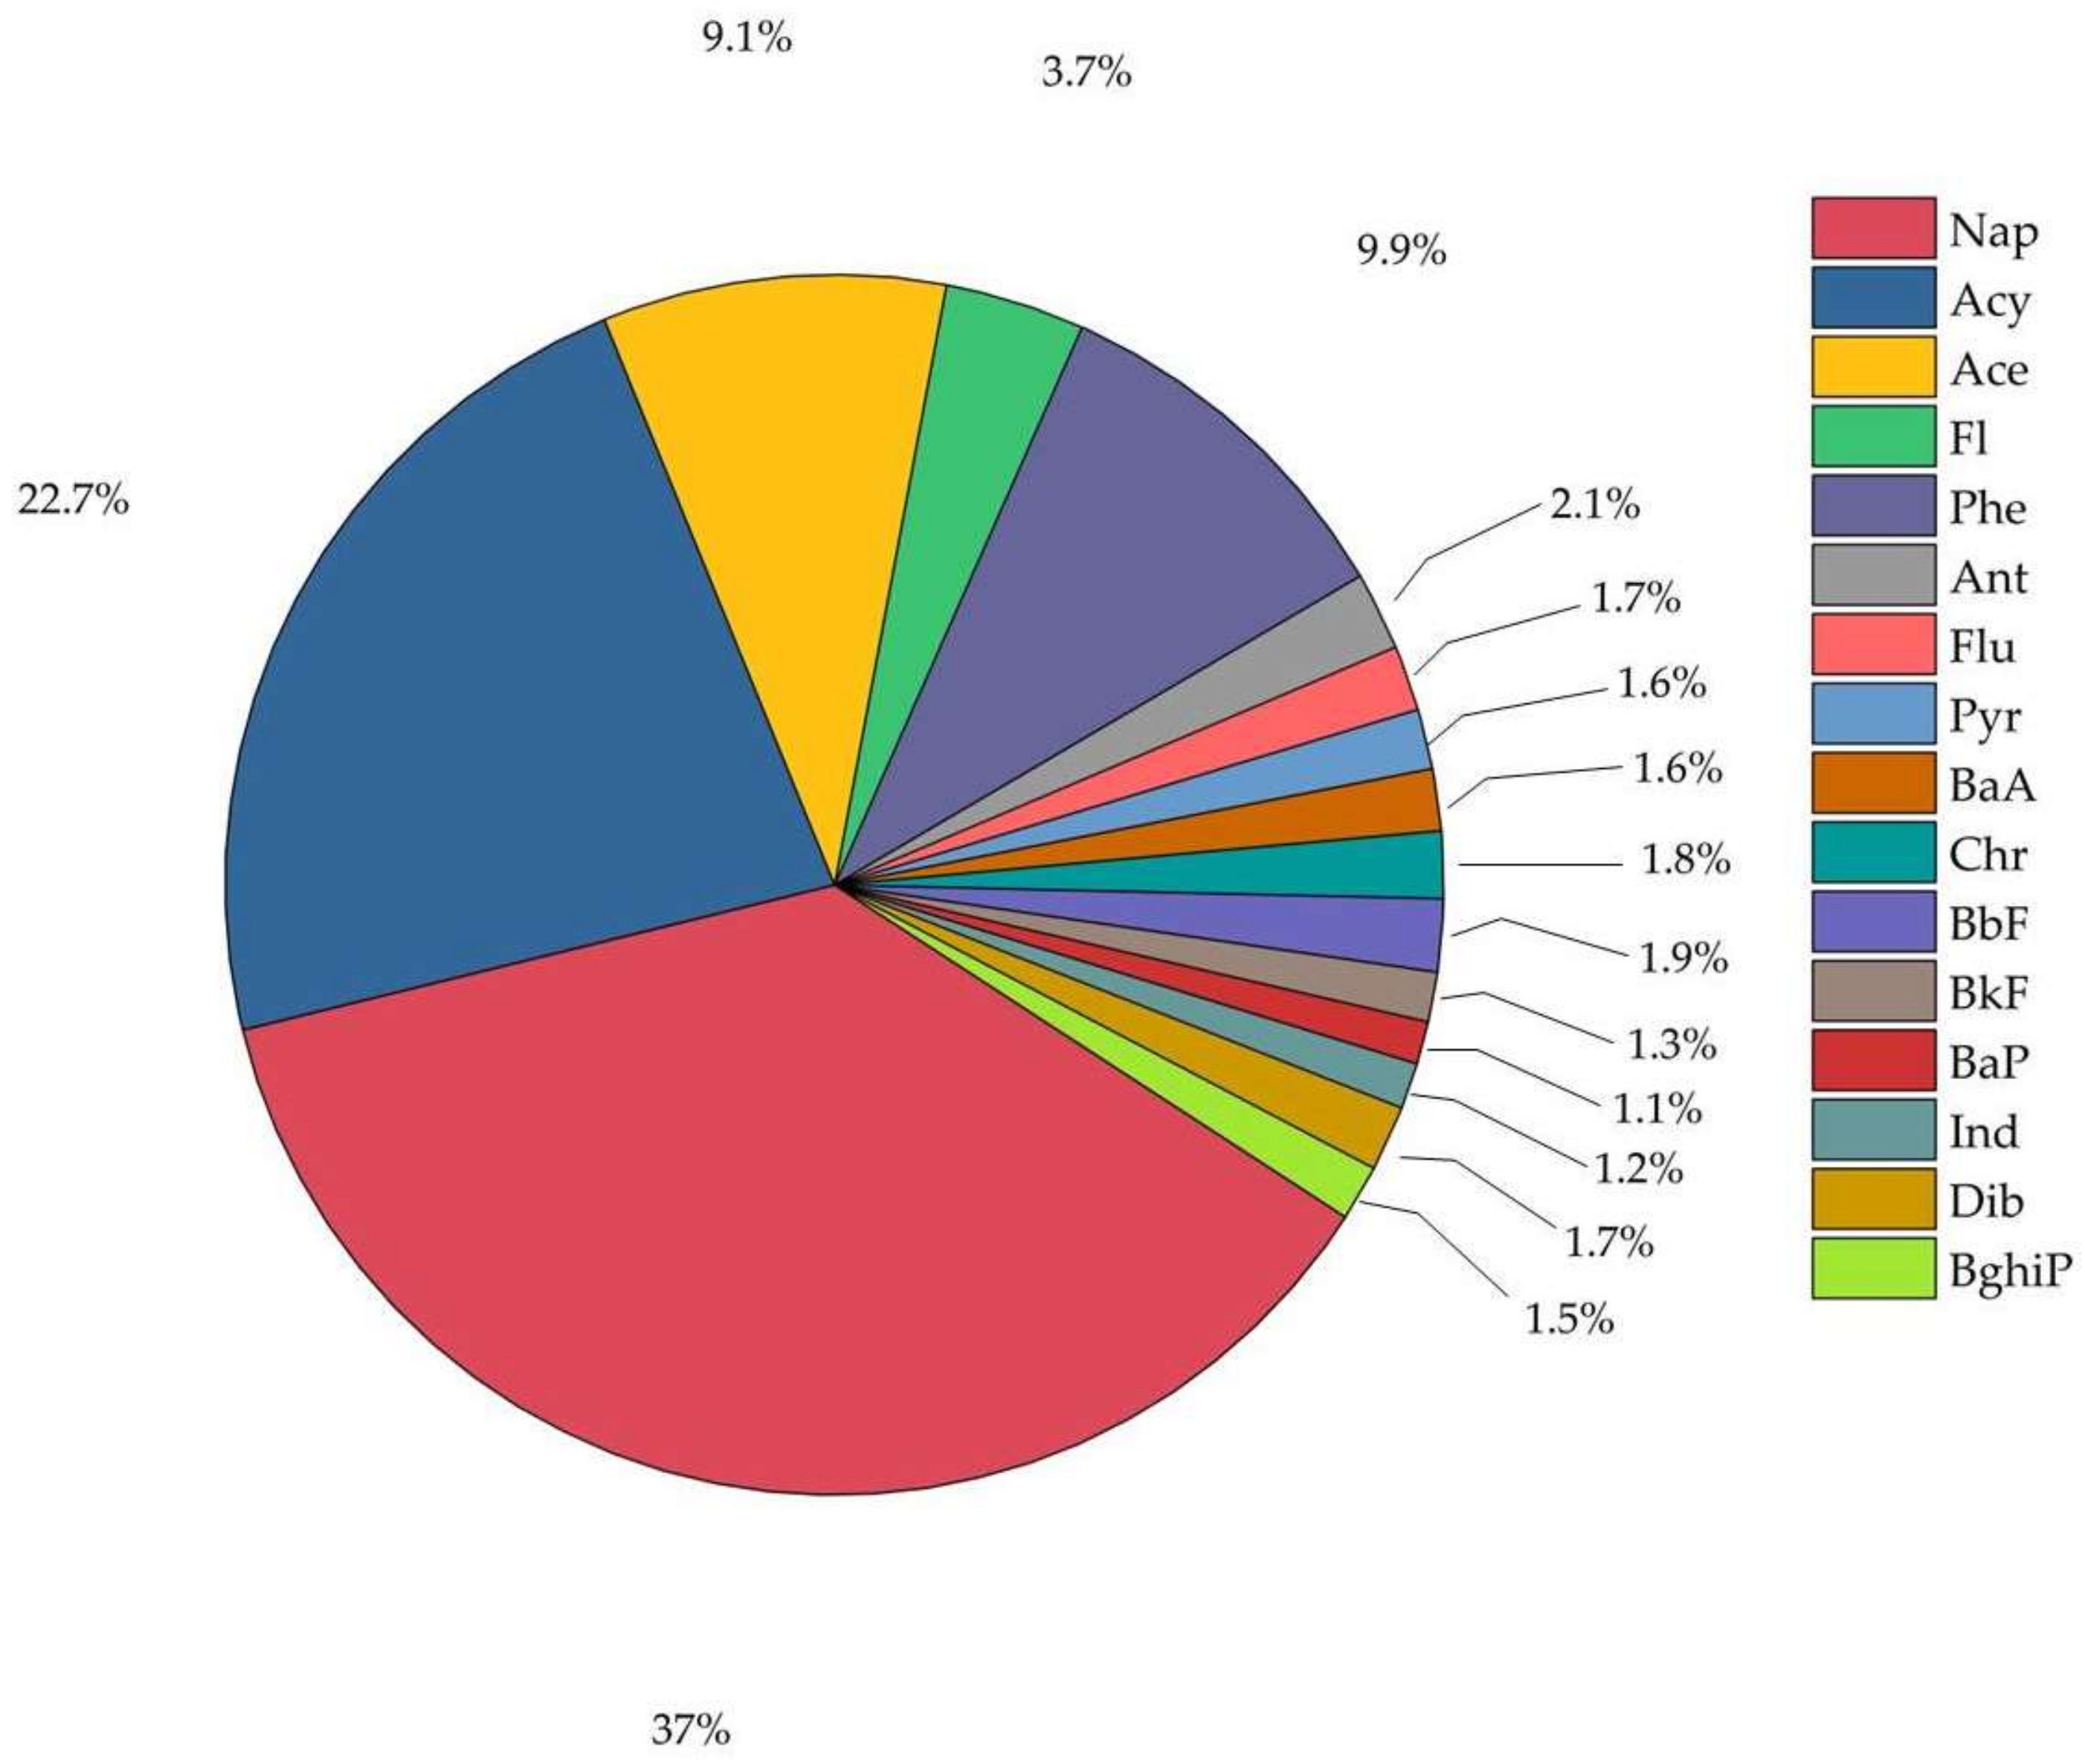
3.1.1. Ambient Levels

Overall, 16 PAHs were detected in the gas + PM1 samples collected at the CEN and TLA monitoring sites in the GMA. Table 3 lists descriptive statistics for the PAHs observed. PAH concentrations at CEN ranged from 0.00739 ng m−3 for BaP to 103.4 ng m−3 for Nap, while at TLA ranged from 0.00163 ng m−3 for Pyr to 83.2 ng m−3 for Nap. The highest average concentrations of 61.5 ng m−3 and 50.3 ng m−3 were determined for Nap at CEN and TLA, respectively, whereas the lowest were observed for BkF at CEN (2.08 ng m−3) and for Ind at TLA (1.39 ng m−3). Although higher average concentrations were observed at CEN than at TLA for most of the PAHs, no significant differences (p > 0.05) were observed between concentrations at the two sites for all PAHs, apart from Acy and Phe. The total ambient levels of PAHs measured in the GMA (Σ16PAH; the sum of concentrations of all PAHs in the gas and PM1 phases) ranged from 69.3 to 210.0 ng m−3, with an average of 140.0 ± 39.1 ng m−3 for the two sites. The highest total concentration by PAH was 52.1 ng m−3 for Nap and the lowest of 1.59 ng m−3 for BaP. Figure 3 shows relative contributions for each PAH to the Σ16PAH. Overall, Nap accounted for 37.01% to the Σ16PAH, while BaP accounted only for 1.13%.
The ΣPAH reported here for the GMA is lower than that of around 900 ng m−3 reported by Possanzini et al. [43] for the urban area of Rome, Italy. This could be due to a shorter sampling period of 6 h made in Rome, because it has been reported that prolonged sampling may result in loss of compounds [44], together with differences between sources and sites characteristics. The ΣPAH for the GMA is within the range of 60.9 to 602 ng m−3 determined by Li et al. [45] in Guangzhou, China, although their reported average of 337 ± 137 ng m−3 is around 2.4-fold that for the GMA. This could arise from differences in the population of both urban areas (around 10 million for Guangzhou) and in the local industrial activities. In contrast, Vasilakos et al. [46] reported lower ΣPAH of 5.6–127.6 ng m−3 and 7.44–109 ng m−3 in Athens, Greece, for two suburban monitoring sites, with the differences observed likely due to the different surrounding environments.
The 16 PAHs observed in the gas+PM1 phases were classified into compounds of LMW (<228) and HMW (>228). The total PAHs distribution was dominated by compounds of LMW, with an average of 128.0 ± 36.6 ng m−3. Overall, Nap accounted for 40%, Ace 25%, and Phe 11% of the LMW species, whereas for the HMW species the BbF apportionment was 22%, Dib 20%, BghiP 17%, and BaP 13%. The contribution by PAH was similar to those reported in Strasbourg, France, of Nap 38%, Ace 18%, Phe 21% for LMW compounds, and for HMW of BbF 14%, BaP 21%, BghiP 19% [47]. The differences in the contributions observed could arise from the influence of coal-combustion emissions in Strasbourg, which are negligible in the GMA. In Guangzhou, China, Li et al. [45] reported contributions for LMW compounds of 62% (Phe), 11% (Flu) and 9% (Ant), while for a BghiP (HMW) was of 16%. Although in Guangzhou and Strasbourg compounds in the gas phase and PM > 1.0 μm were considered, higher PAHs concentrations than in the GMA were reported for the gas phases.

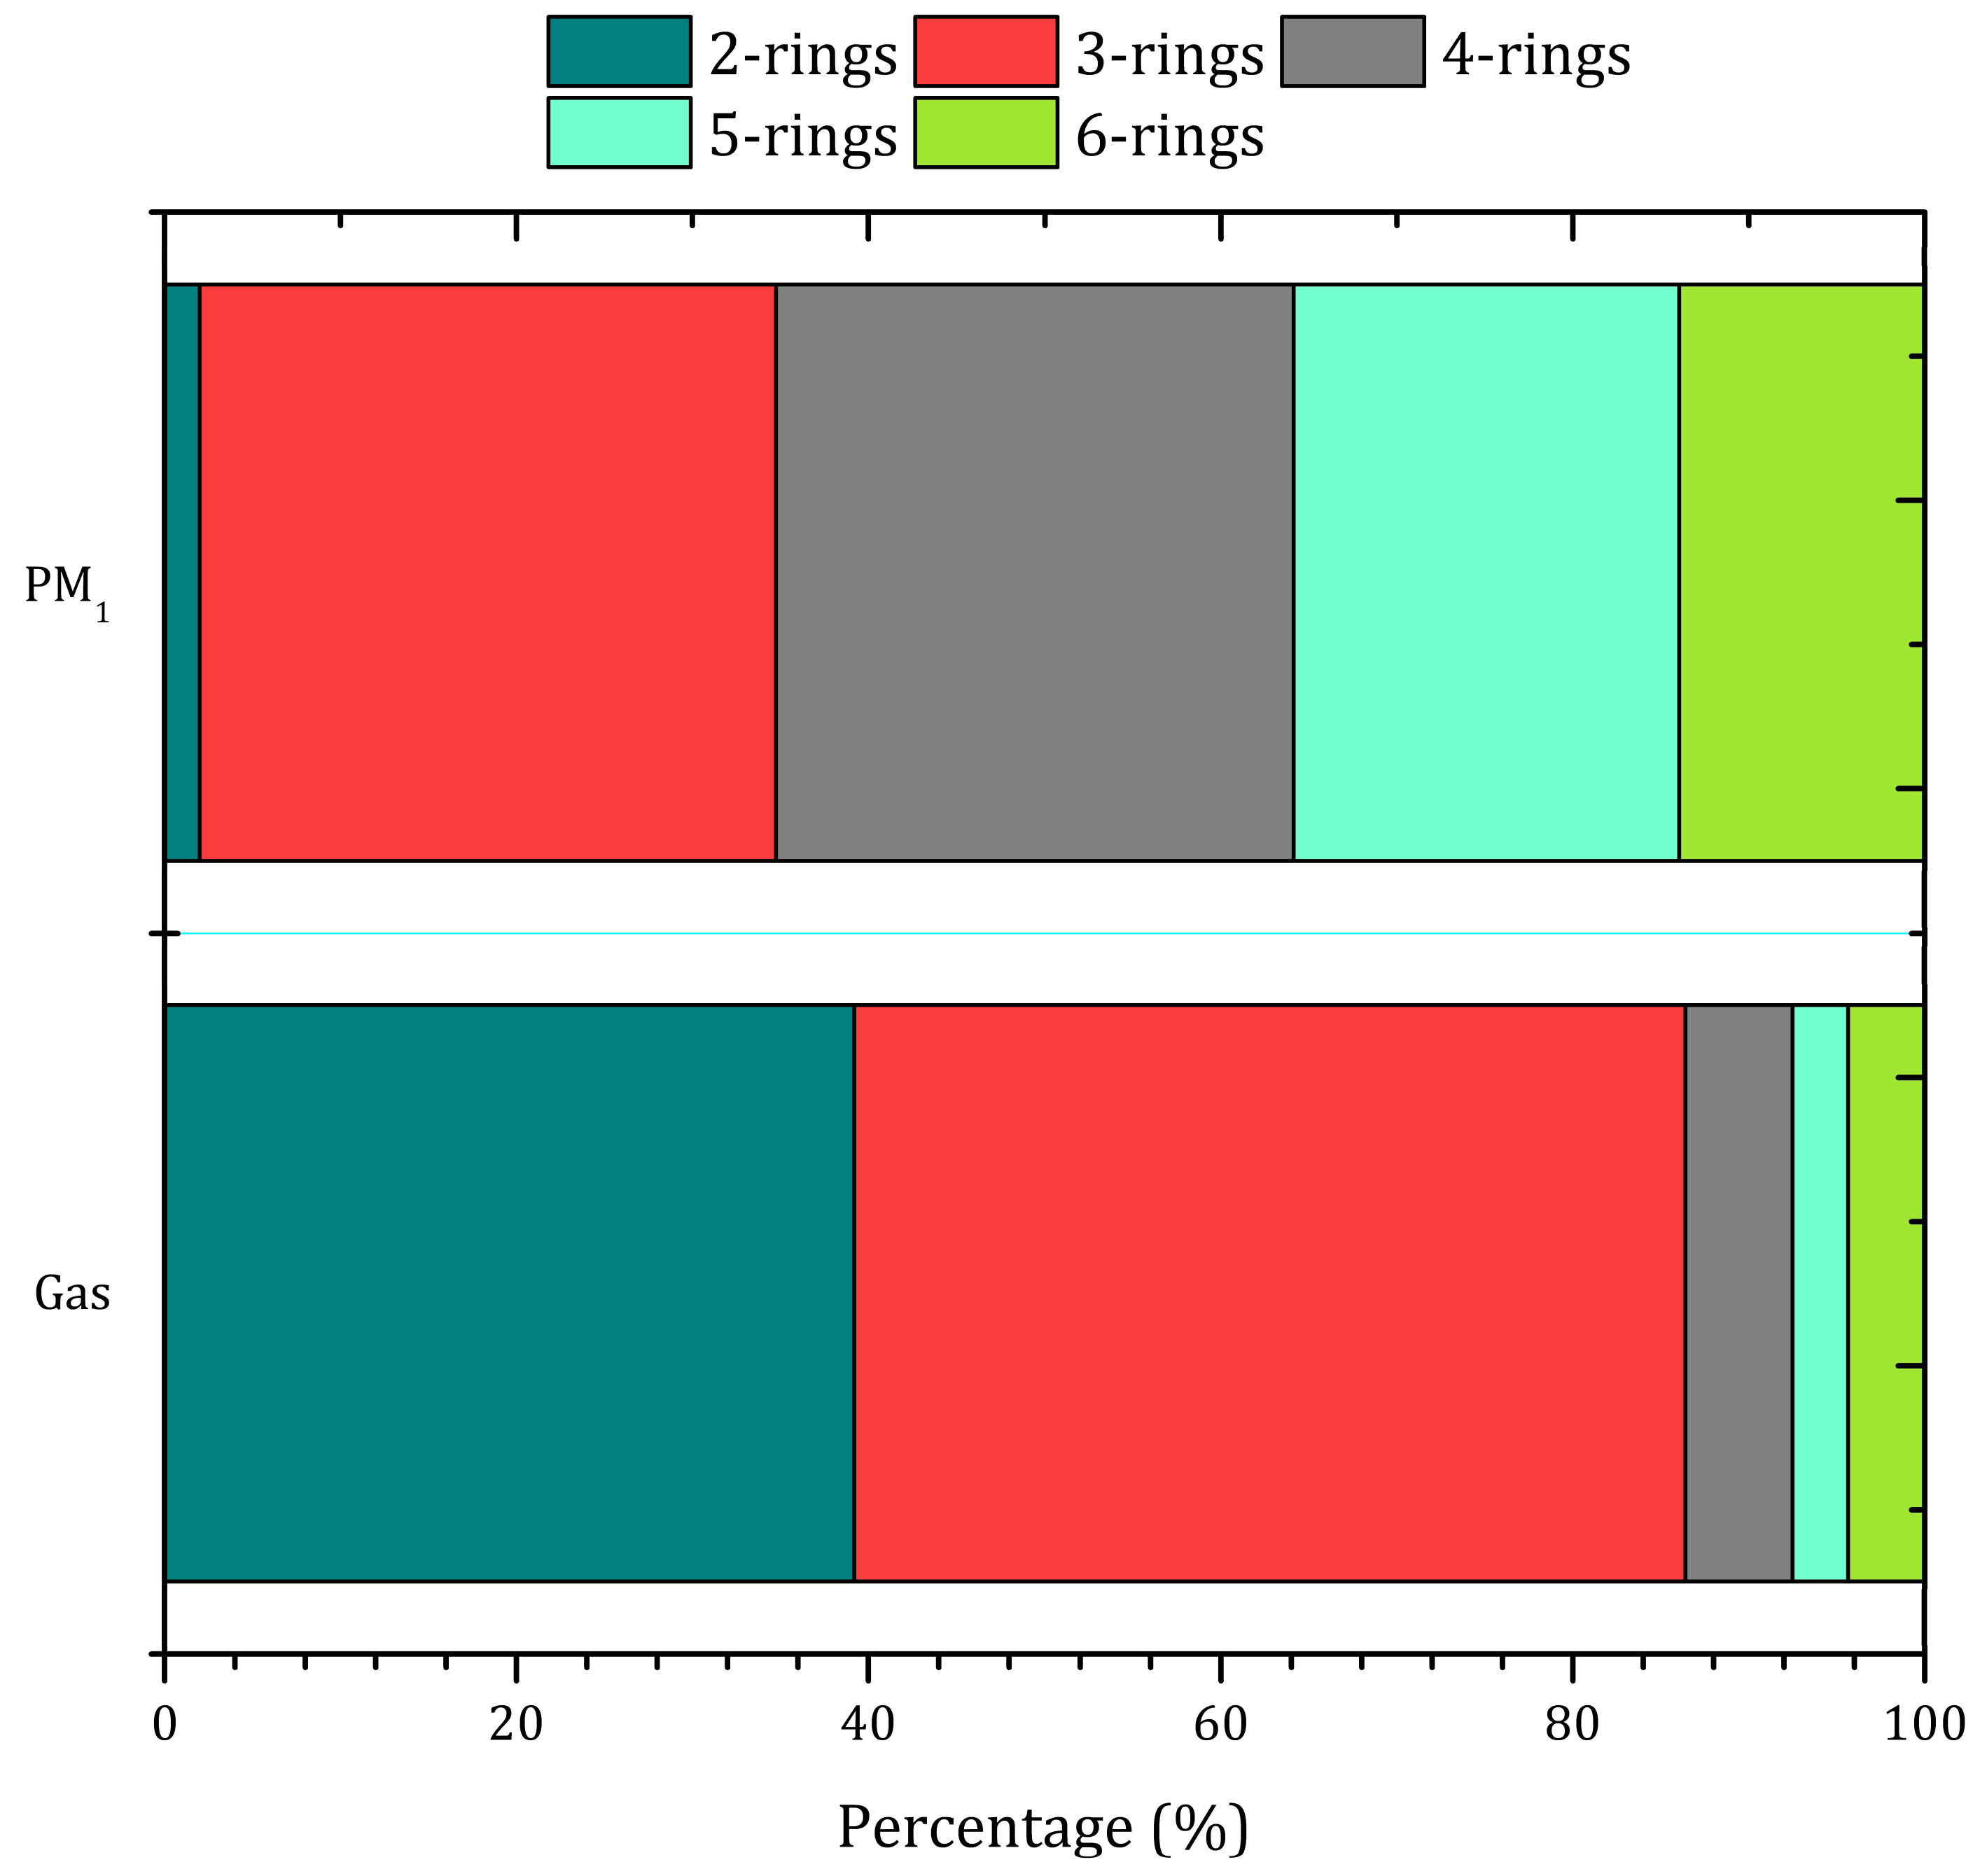
3.1.2. Gas-particulate matter (PM1) Distribution

Table 4 presents the summary of concentrations by PAH observed in the gas and PM1 phases in the GMA. For the gas phase, the Σ16PAH ranged from 68.9 to 208.0 ng m−3 with an average of 137.0 ± 37.7 ng m−3, while for PM1 it ranged from 0.365 to 23.9 ng m−3, with an average of 7.25 ± 8.34 ng m−3. Individual PAHs ranged from 0.003 (BaP) to 93.3 (Nap) ng m−3 in the gas phase and from 0.000539 (Pyr) to 9.49 (BbF) ng m−3 for PM1. To perform statistical analyses, the PAHs were classified according to their number of aromatic rings as follows: 2-rings (Nap); 3-rings (Acy, Ace, Fl, Phe and Ant); 4-rings (Flu, Pyr, BaA and Chr); 5-rings (BbF, BkF, BaP) and 6-ring (Ind, Dib and BghiP). A Spearman analysis revealed that only PAHs with 2- and 3-rings were correlated positively (p < 0.05) with temperature, which suggests that at ambient temperature the lightest PAHs predominate in the gas phase [48]. According to such classification (Figure 4), in the GMA the gas phase is dominated by PAHs of 3-rings (47%), followed by compounds of 2-rings (39%) and 4-rings (6%). In Birmingham, UK, Delgado-Saborit et al. [21] reported a similar distribution of 3- (60%) and 4-ring compounds (38%), however, they did not consider 2-ring compounds. The PM1 showed a distribution of PAHs mainly between 3 (32%), 4 (29%) and 5 rings (22%), which is similar to that reported in Kanpur, India, by Singh and Gupta [49] for PM1 (3 rings 28%, 4 rings 42% and 5 rings 18%). Similarly, the percentage of ∑PAHHMW reported in Kanpur of 70% is consistent with that of 65% observed in the GMA.
PAHs with HMW were expected to occur mostly as particles. However, in the GMA, compounds of HMW were also observed in the gas phase, while PAHs of LMWs were observed similarly in PM1. This behavior was likely caused by the adsorption of LMW PAHs upon particles during sampling, since the aging time (for fine particles) was not long enough for allowing PAHs to condense onto particles in the atmosphere. Moreover, submicron particles smaller in size than the pore size of the quartz filter used for sampling may have penetrated also the filter and entered into the PXP cartridge, contributing to the gas-PAHs mass [50].

3.1.3. Source Apportionment

PAH ratios may change depending on the environmental fates of these compounds. To date, most of the existing studies have focused on the calculation of ratios based on the concentrations of PAHs only in the particulate phase. However, this approach assumes that PAHs emitted in the gaseous or particulate-bound form remain in the emitted phases and does not take into account subsequent changes of phase [34]. In this study, in order to reduce the overestimation or underestimation of concentrations by partitioning the compounds in phases, ratios of PAHs were calculated for the total sample (gas + PM1). Because some PAHs react faster than others in atmospheric chemical processes, the ratios of PAHs in the atmosphere often will depart from those seen in source emissions [51]. The lifetime of the PAHs was considered in order to select the ratios to determine a reliable source.
Table 5 lists ratios for concentrations of PAHs observed in the GMA. Overall, the observed PAH ratios were consistent with those reported in Oporto, Portugal, by Slezakova et al. [52] for vehicular sources. For instance, the ratio of Phe/Phe + Ant was 0.83, while the averages for Flu/Flu + Pyr and Ind/Ind + BghiP exhibited values of 0.53 and 0.42, respectively, which have been reported as typical for PAHs emitted from diesel combustion [5]. This is supported by the BbF/BkF and BaP/BaP + Chr ratios of 1.5 and 0.37, respectively, that are within the range of PAHs originating from diesel combustion [53]. Although, the calculated Phe/Phe + Ant and BaP/BaP + Chr ratios could be biased by the short atmospheric lifetimes of Ant and BaP (2.9 and 4.7 hours, respectively) [34], Nap was the most abundant species in the GMA airshed. In urban areas, Nap represents typically a significant fraction of emissions from gasoline-powered cars and light trucks [54,55]. This is in agreement with the PAHs of LMW that dominate the GMA airshed and could be emitted mostly from light-duty vehicles. This also agrees with De Abrantes et al. [56] who reported that vehicles represent a significant source of naphthalene in urban areas.

3.1.4. Health-Risk Assessment
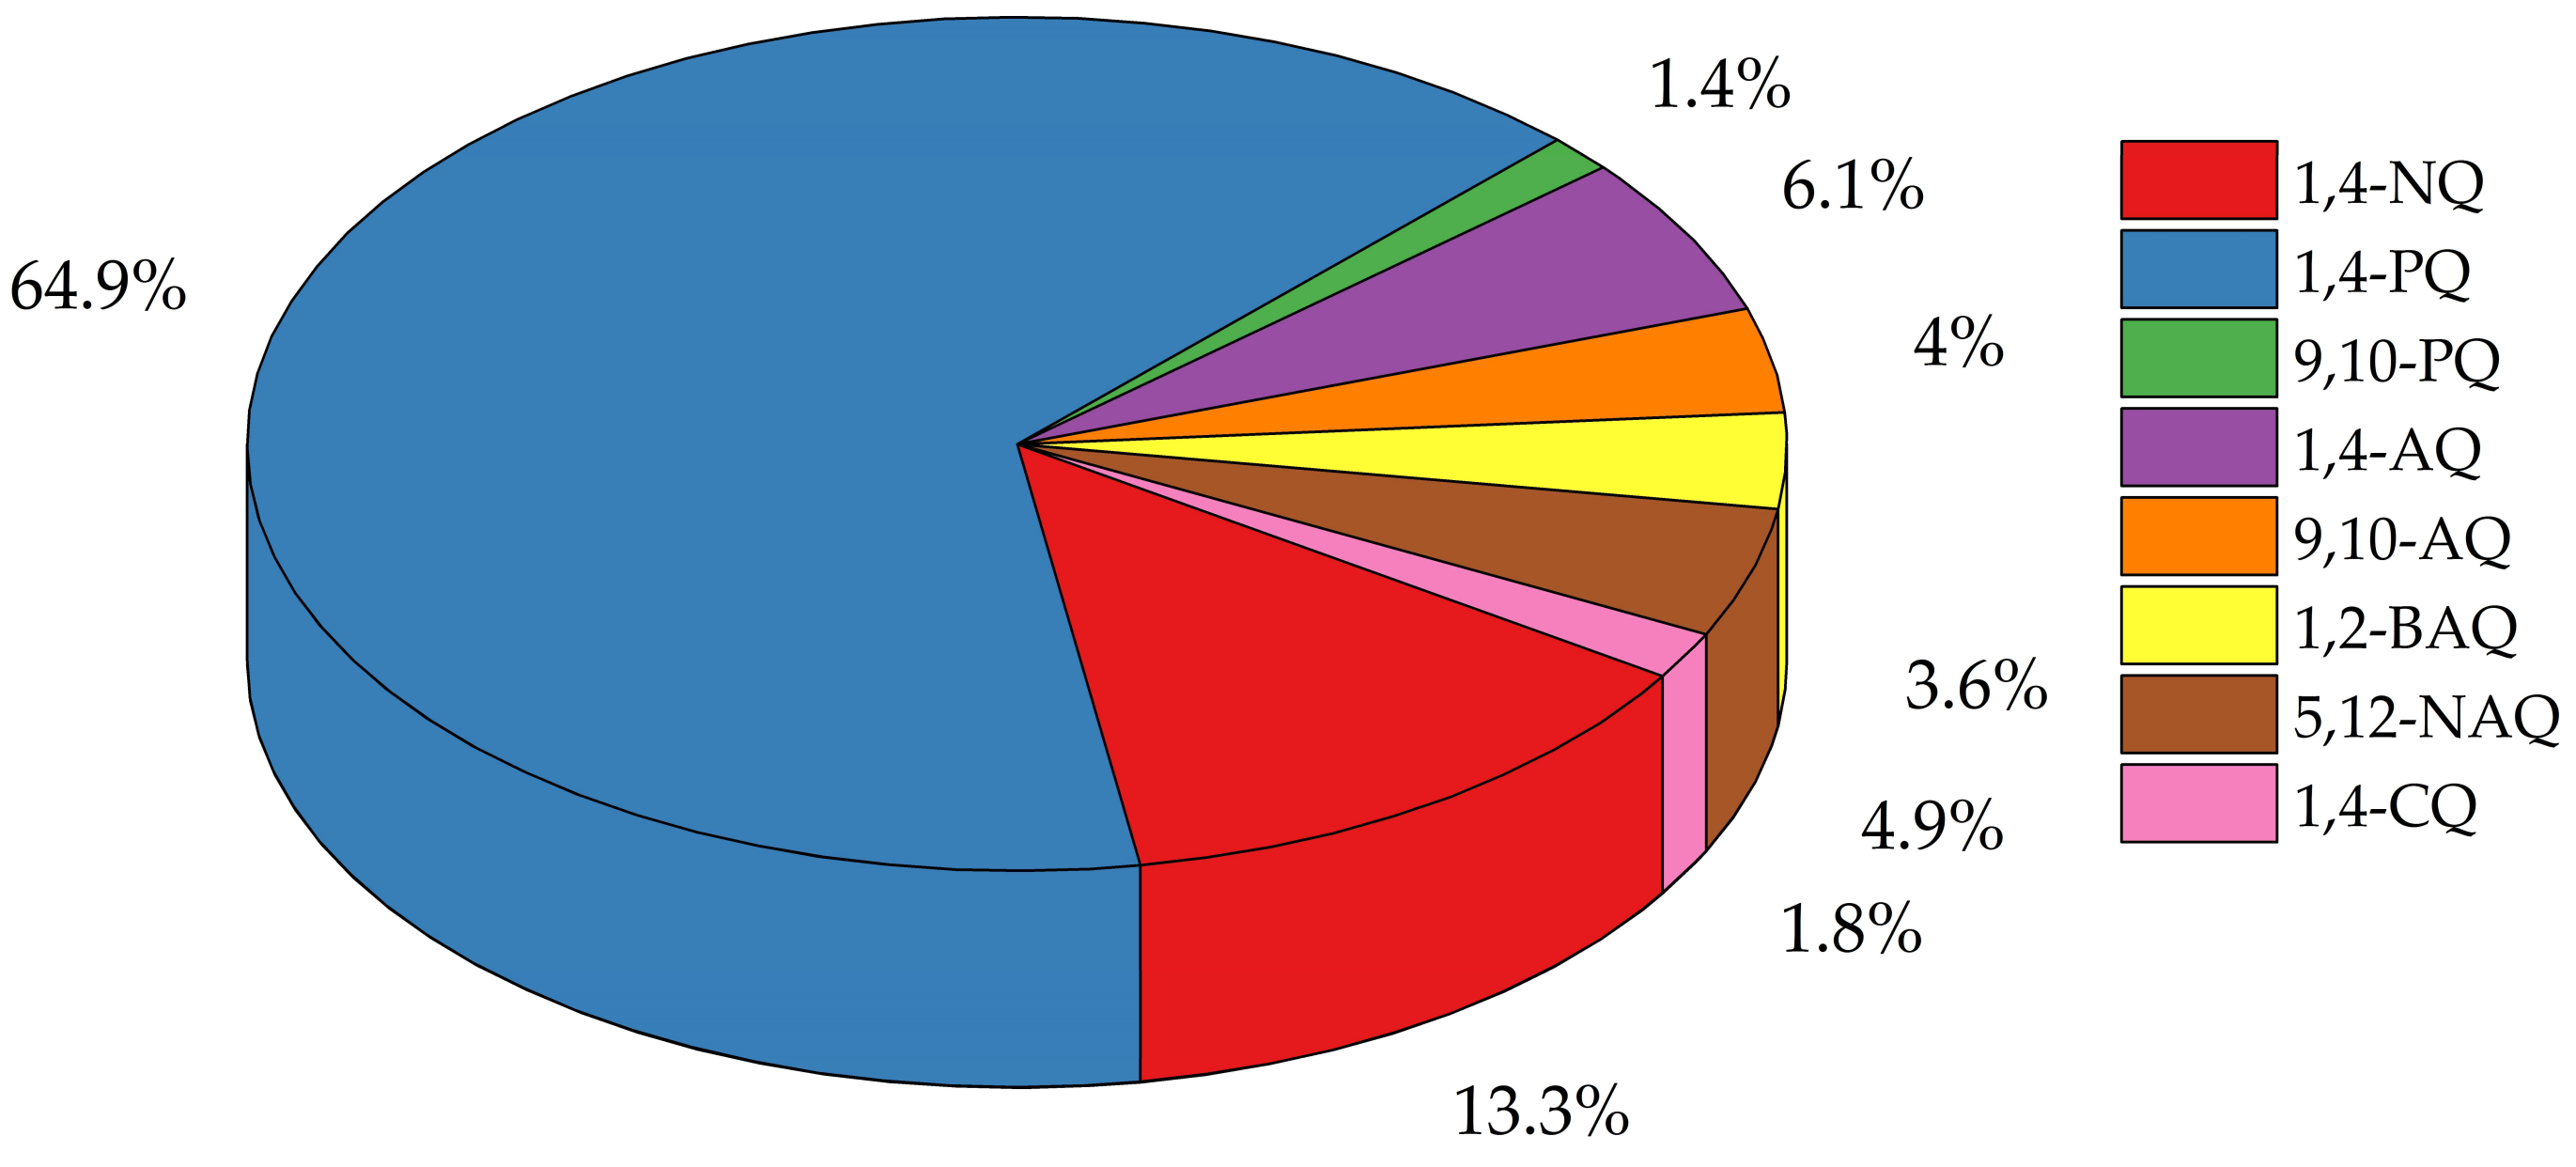
The total BaPeq concentration (the sum of PAHs in the gas phase and PM1) of PAHs was 17.7 ng m−3 (Table 6), with the gas phase accounting for 89.4% due to the presence of heavy PAHs with high RPFs. Dib was the major contributor of individual PAHs to the BaPTeqΣ9PAH (77.3%), followed by BaP (8.97%) and BbF (7.62%). Although Dib has an RPF 10 times higher than that for BaP [38], it was in the same order of magnitude as the reference PAH in terms of concentration. These results emphasize the importance of analyzing and evaluating this potent carcinogen as a possible biomarker, since it could be used to monitor the exposure and uptake of high-potency PAHs [57]. On the other hand, Nap showed the largest contribution to the total levels of PAHs observed in the GMA. Further research is required to determine the RPF of PAHs not considered here such as naphthalene, phenanthrene and pyrene, which have been associated with chronic respiratory diseases such as asthma, severe bronchitis, lung cancer, etc. and [11,58,59,60].
The risk value calculated here expressed as the sum of lifetime lung cancer risks was estimated in 1.7 × 10⁻³, which raises significant concerns for the public health of the GMA inhabitants. It suggests that the ambient levels of PAHs represent a potential health hazard, since the recommended level for population exposure to PAHs is lower than 10−6 [61,62]. However, further monitoring must be carried out to confirm such estimates, since risk estimates are commonly highly uncertain [63]. The Jalisco Cancer Register reported in 2010 an occurrence of 5.94 cases of pulmonary cancer per 100,000 inhabitants, a ratio of 5.94 × 10⁻⁵ [64]. This value approached the tolerance limit of 10−6; however, such data are not sufficient to correlate with lung cancer despite the fact that it has been well documented that high ambient levels of PAHs increase the risk of developing such a disease [57,65].

3.2. Quinones

3.2.1. Ambient levels

The ambient levels of quinones (Σ8Quinones; the sum of the concentrations for all quinones in the gas phase and as PM1) in the GMA ranged from 1.36 to 12.20 ng m−3, with an average of 7.46 ± 2.88 ng m−3. The quinones’ individual levels ranged from 0.0185 (9,10-PQ) to 10.5 (1,4-PQ) ng m−3. Table 7 shows the summary of descriptive statistics for the quinones’ concentrations in the gas and PM1 phases. Overall, the concentrations of quinones observed in the GMA were of similar magnitude, apart from the 1,4-PQ. Such concentrations are lower, except for 9,10-PQ, than those reported in Birmingham, UK, by Alam et al. [66] with averages of 5.3 (9,10-PQ), 1.4 (1,4-NQ), 0.8 (AQ), 0.4 (1,2-BAQ) and 0.5 ng m−3 (5,12-NAQ). It is also important to note that comparisons from city to city must account for seasonal variability, meteorological factors, emission sources and other factors that influence the ambient concentrations of quinones. Figure 5 shows the individual relative contributions by quinone to the total ambient concentration. Overall, the 1,4-PQ was the most abundant compound and represented about 65.9% of the total mass, followed by the 1,4-NQ (13.1%), while the other quinones exhibited contributions lower than 10%.

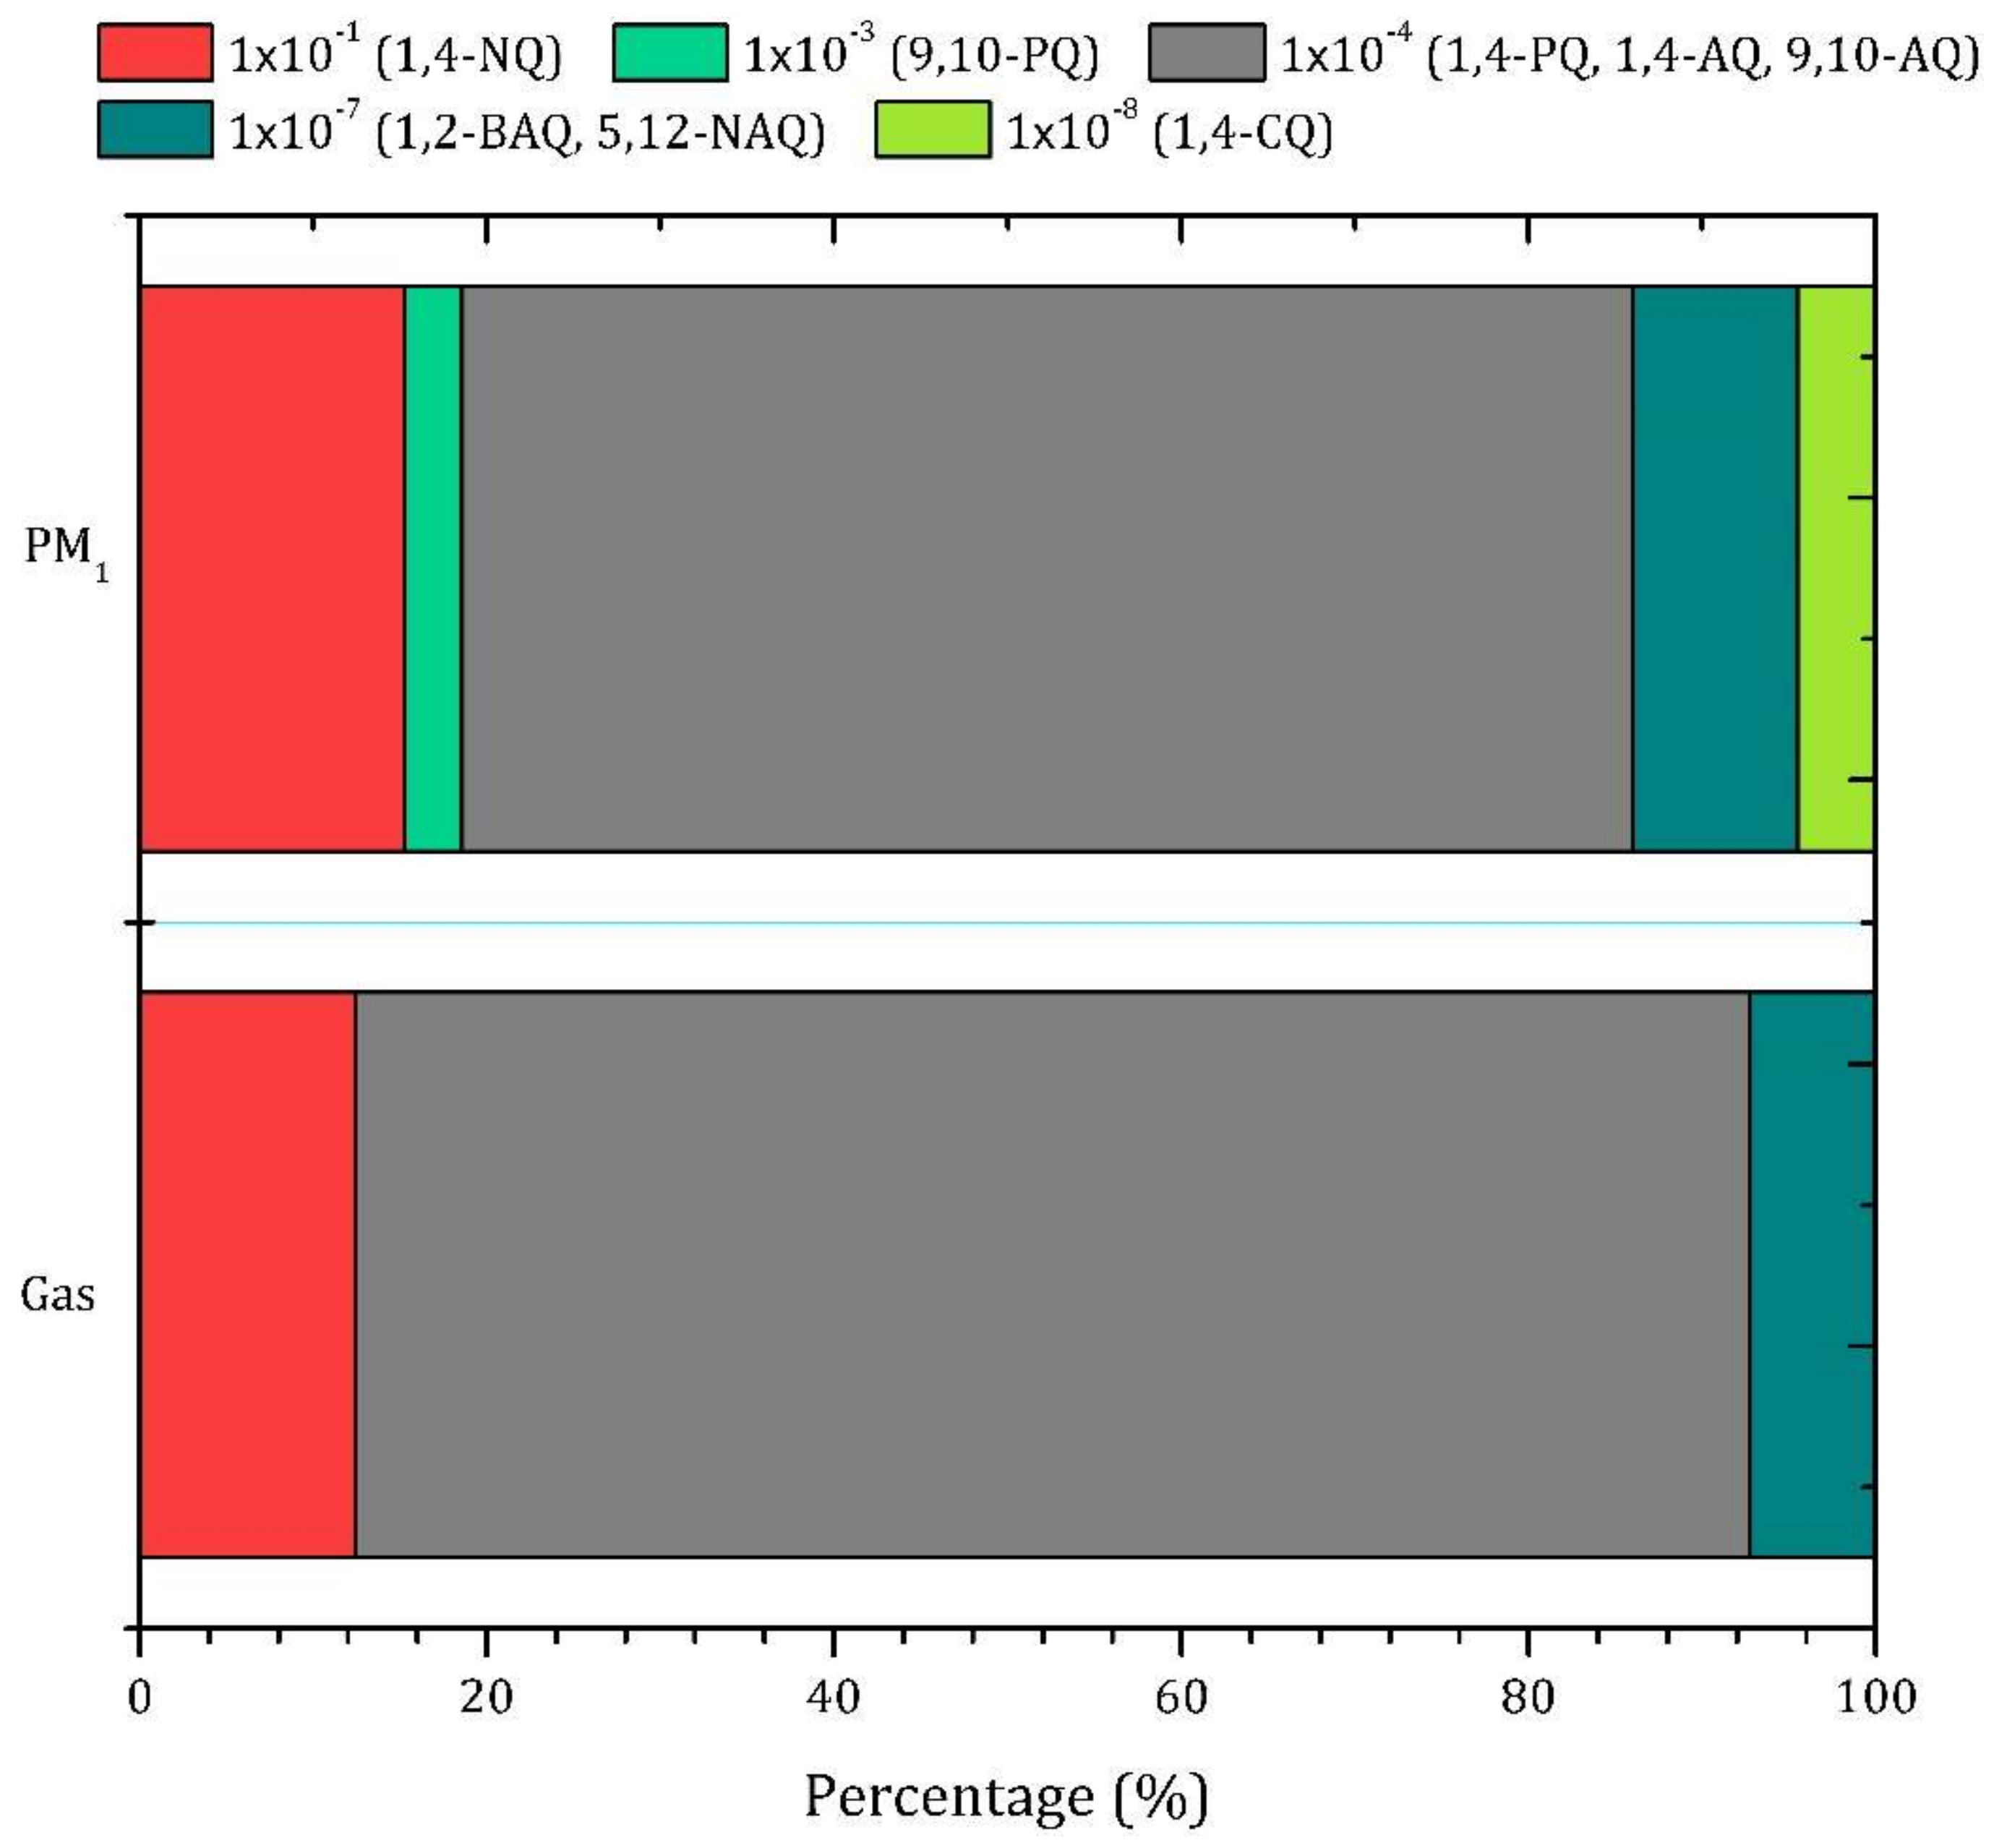
3.2.2. Gas-PM1 Distribution

Table 8 shows the summary of the individual quinones’ concentrations in the gas and PM1 phases. The Σ8Quinones concentrations ranged from 1.14 to 12.20 ng m−3, with an average of 5.44 ± 3.44 ng m−3 for compounds in the gas phase, and from 0.22 to 3.65 ng m−3, with an average of 2.32 ± 1.16 ng m−3 for PM1. The quinones’ individual concentrations ranged from 0.00770 (1,2-BAQ) to 10.50 (1,4-PQ) ng m−3 for compounds in the gas phase, and from 0.00349 (1,2-BAQ) to 3.16 (1,4-NQ) ng m−3 for PM1. No statistically significant differences (p > 0.05) were observed between sampling sites for all quinones, which may arise from similar meteorological conditions and emissions contributions due to the relatively short distance between the sampling sites.
Simultaneous quantifications of quinones in the gas and particle phases remain scarce, and therefore there is little information to date regarding their phase-distribution [21]. The equilibrium between the gas and particle phases is directly related to the vapor pressure of the quinones and varies from season to season [67]. Here, the vapor pressure criterion (p°L, Pa at 298 K) was used for quinones, which were separated as follows: 1 × 10⁻¹ (1,4-NQ); 1 × 10⁻³ (9,10-PQ); 1 × 10⁻⁴ (1,4-PQ, 1,4-AQ, 9,10-AQ); 1 × 10⁻⁷ (1,2-BAQ, 5,12-NAQ) and 1 × 10⁻⁸ (1,4-CQ). Overall, the most abundant compounds for both phases were in the group of 1 × 10⁻⁴ (Figure 6), where it is possible to observe quinones in both phases [17,22,68].
The 1,4-NQ accounted for 52% of the total compounds in the gas phase. However, this has been commonly observed in particulate matter from vehicle emissions [69,70]. Such a percentage difference of about ±25% to other existing studies is likely due to sampling artifacts and different source contributions [17,22]. For instance, in Southern California, Eiguren-Fernandez et al. [16] reported quinone levels from 0.42 ± 0.36 to 1.74 ± 1.63 ng m−3, similar to those reported here for the gas phase, and from 0.01 ± 0.02 to 0.15 ± 0.88 ng m−3 for PM2.5, which are in the range of those reported in this study. In contrast, in the GMA the 1,4-PQ accounted for 72% in the gas phase. Lee et al. [14] reported for the 1,4-PQ a partition range of 40–50% in the gaseous phase in a laboratory reaction chamber, although such values cannot be compared to those reported here since such a quinone was a product of a reaction and primary emissions were not considered.
The anthraquinones accounted for 100% of PM1, with a higher contribution for the 1,4-AQ than for the 9,10-AQ. This is consistent with the anthraquinones phases’ distribution observed in Paris by Ringuet et al. [71], where the 1,4-AQ was the most abundant species in the fine and ultrafine particles, and the 9,10-AQ predominated in the coarse particles. The concentrations observed in the GMA for the 5,12-NAQ in PM1 are similar to those reported in Boston by Allen et al. [72], where the 1,2-BAQ ranged from 0.00770 to 0.564 ng m−3, and from 0.00349 to 0.682 ng m−3 in the gas and PM1 phases, respectively. Overall, the quinones in the gas phase represented 58% of the samples collected, which is lower than the contributions of 69% and 84% reported by Jakober et al. [70] for quinones in the gas phase from gasoline and diesel emissions, respectively. Such a difference could be explained by the quinones’ lifetime and the compounds’ volatility versus sampling duration [17,73].

3.2.3. Source Attribution

Correlations between gas(g)–particle(p) quinones and PAHs, meteorological parameters and criteria pollutants (CO, SO2, NOX and O3) were calculated with the Spearman test. Table 9 lists the Spearman coefficients for PAHs and quinones in both phases. Significant correlations were observed between Nap(p) and 1,4-NQ(p) (r = 0.83), and Phe(p) and 1,4-PQ(p) (r = 0.77), which suggests common emission sources. In Kabul and Mazar-e Sharif, Afghanistan, Wingfors et al. [74] observed that some PAHs and quinones may share emission sources such as coal- and biomass-burning, and vehicle combustion. Lee and Lane [75] suggested that vehicles can emit more NQ in the gas phase than those formed during the reaction of Nap with OH radicals, which may lead to detection of the greatest NQ contributions in primary emissions. Barradas-Gimate et al. [23] reported that in the GMA the 1,4-PQ in PM2.5 is emitted mostly as product of diesel combustion, and is in good agreement with the observations in Grenoble, France, for primary emissions reported by Tomaz et al. [22]. Furthermore, the correlation between ΣQuinones(p) and SO2 of r = 0.77 may confirm that quinones have a primary origin, and suggests that submicron particles can be a better indicator for primary emissions than PM2.5 [76].
The 1,4-NQ was correlated positively with the 5,12-NAQ in the particle phase (r = 0.75), which may arise from the role of the NQ as an intermediary in the formation of 5,12-NAQ through the Diels–Alder reaction [77]. Additionally, the 5,12-NAQ(p) exhibited a significant relationship with O3 (r = 0.79), likely due to the ozonation process of the parent PAH [78]. Nevertheless, further information of the photochemical processes in the GMA airshed can be obtained from the statistical analysis between PM and PAH. For example, SR exhibited negative correlations with Nap(p) (r = −0.70), Ace(p) (r = −0.69), Fl(p) (r = −0.83), Phe(p) (r = −0.75) and Ant(p) (r = −0.66). This may indicate photolysis and chemical processing even if the products cannot be completely identified, as reported elsewhere in [79]. A lower correlation of r = −0.47 was observed between the 1,4-NQ(g) and SR, that could be attributed to high vapor pressure, photochemical loss through photolysis (lifetime of approximately 2 h) [80], and transformation into other species such as benzoic acid and phthalic anhydride [81]. The latter has been identified as a product of the oxidation of phthaldialdehyde [82], and in emissions from diesel combustion [83].
The 9,10-AQ has been detected both in primary emissions and as a secondary air pollutant [84]. In this study, the 9,10-AQ showed a strong correlation with NO2 (r = 0.82), and the latter with RH (r = 0.71). Chen and Zhu [85] suggested that the heterogeneous reaction between NO2 and Ant adsorbed on NaCl particles may derive in the formation of 9,10-AQ and increase with RH, although the reaction mechanism is not well understood to date. No significant correlations (p > 0.05) were observed among other species, likely due to photodecomposition, different lifetimes and high solar incidence [86]. Overall, the quinones in the gas phase may experience chemical processing on a scale of few hours compared with a more stable form in PM, which increases with their molecular weight [17,18,87]. We calculated ratios of quinone/PAHparent for the 1,2-BAQ/BaA and 1,4-CQ/Chr, which have MW > 228 and have been reported as stable compounds [66]. The 1,2-BAQ/BaA and 1,4-CQ/Chr calculated ratios of 0.10 and 0.11, respectively, suggest a primary origin. This is consistent with existing reports that have detected the 1,2-BAQ in emissions from local sources [88] and have considered it as a marker for local traffic emissions [89] because of its resistance to photodecomposition [86]. However, more research is needed to determine the feasibility of using the 1,2-BAQ as a marker for traffic emissions.

4. Conclusions

The ambient levels of PAHs and quinones were measured in the gas and PM1 phases during the warm–dry season at two urban monitoring sites in the GMA. The cancer risk calculated for gas + PM1 phases suggests a potential hazard to public health. Diagnostic ratios of PAHs suggest a significant contribution to the total ambient levels of emissions from vehicles and diesel combustion. The correlation between quinones and PAHs indicates that primary emissions are the major contributor to total ambient concentrations, whereas correlations between the 5,12-NAQ and 9,10-AQ with SR, O3 and NOX show that atmospheric transformations may be a secondary source for such compounds. In addition, the correlations between SR and PAHs and quinones indicate processes of loss or degradation during sampling due to the lifetime of such compounds. Further studies are required to establish accurately the role of photochemical and chemical transformations from PAHs to quinones in the GMA airshed. The simultaneous measurements of quinones and their parents in the gas and PM1 phases reported here permit a better understanding of the behavior of the occurrence, distribution and sources of such compounds. Additional factors such as the sampling period must be taken into account to reduce uncertainty over the ambient levels and origin of the PAHs and quinones observed.

Supplementary Materials

The following are available online at https://www.mdpi.com/2073-4433/9/4/137/s1, Table S1: Sampling schedule, Table S2: Single ion monitoring mode (SIM) ions used in the analysis of PAHs by gas chromatography–mass spectrometry (GC–MS), Table S3: Linearity, precision, detection and quantification limits, and sensitivity from PAHs’ standard solutions, Table S4: SIM ions used in the analysis of quinones by gas chromatography–mass spectrometry (GC–MS), Table S5: Linearity, precision, detection and quantification limits, and sensitivity from quinones standard solutions.

Acknowledgments

This research was financially supported by SEP-CONACYT No. 183444. We dedicate this work to the memory of Alberto López-López. Thanks to Winston Smith of the Peace Corps by the editorial revision of this paper.

Author Contributions

Valeria Ojeda-Castillo: conducted literature research and sampling, performed the experiments, analyzed the data and drafted the manuscript. Alberto López-López (R.I.P.): conceiving the idea of the study. Leonel Hernández-Mena: contributed to the sampling, statistical analysis, and revision of the manuscript. Mario Alfonso Murillo-Tovar: designed the study and contributed to the interpretation of results. José de Jesús Díaz-Torres: acquisition of data and validation of meteorological parameters. Iván Y. Hernández-Paniagua: interpretation, edition and revision of the manuscript. Jorge del Real-Olvera: revision of the manuscript. Elizabeth León-Becerril: revision of the manuscript.

Conflicts of Interest

The authors declare no conflict of interest.

References

  1. Kim, K.-H.; Jahan, S.A.; Kabir, E.; Brown, R.J.C. A review of airborne polycyclic aromatic hydrocarbons (PAHs) and their human health effects. Environ. Int. 2013, 60, 71–80. [Google Scholar] [CrossRef] [PubMed]
  2. Rajendran, P.; Jayakumar, T.; Nishigaki, I.; Nishigaki, Y.; Vetriselvi, J.; Sakthisekaran, D. Immunomodulatory Effect of Mangiferin in Experimental Animals with Benzo(a) Pyrene-induced Lung Carcinogenesis. Int. J. Biomed. Sci. 2013, 9, 61–67. [Google Scholar]
  3. Wenger, D.; Gerecke, A.C.; Heeb, N.V.; Hueglin, C.; Seiler, C.; Haag, R.; Naegeli, H.; Zenobi, R. Aryl hydrocarbon receptor-mediated activity of atmospheric particulate matter from an urban and a rural site in Switzerland. Atmos. Environ. 2009, 43, 3556–3562. [Google Scholar] [CrossRef]
  4. Boström, C.-E.; Gerde, P.; Hanberg, A.; Jernström, B.; Johansson, C.; Kyrklund, T.; Rannug, A.; Törnqvist, M.; Victorin, K.; Westerholm, R. Cancer risk assessment, indicators, and guidelines for polycyclic aromatic hydrocarbons in the ambient air. Environ. Health Perspect. 2002, 110, 451–488. [Google Scholar] [CrossRef] [PubMed]
  5. Cuadras, A.; Rovira, E.; Marcé, R.M.; Marcé, R.M. Lung cancer risk by polycyclic aromatic hydrocarbons in a Mediterranean industrialized area. Environ. Sci. Pollut. Res. 2016. [Google Scholar] [CrossRef] [PubMed]
  6. World Health Organization; International Programme on Chemical Safety. Selected Non-Heterocyclic Polycyclic Aromatic Hydrocarbon; World Health Organization; International Programme on Chemical Safety: Geneva, Switzerland, 1998. [Google Scholar]
  7. Karavalakis, G.; Fontaras, G.; Ampatzoglou, D.; Kousoulidou, M.; Stournas, S.; Samaras, Z.; Bakeas, E. Effects of low concentration biodiesel blends application on modern passenger cars. Part 3: Impact on PAH, nitro-PAH, and oxy-PAH emissions. Environ. Pollut. 2010, 158, 1584–1594. [Google Scholar] [CrossRef] [PubMed]
  8. Ringuet, J.; Albinet, A.; Leoz-Garziandia, E.; Budzinski, H.; Villenave, E. Reactivity of polycyclic aromatic compounds (PAHs, NPAHs and OPAHs) adsorbed on natural aerosol particles exposed to atmospheric oxidants. Atmos. Environ. 2012, 61, 15–22. [Google Scholar] [CrossRef]
  9. Monks, T.J.; Hanzlik, R.P.; Cohen, G.M.; Ross, D.; Graham, D.G. Quinone Chemistry and Toxicity. Toxicol. Appl. Pharmacol. 1992, 6, 2–16. [Google Scholar] [CrossRef]
  10. Bolton, J.L.; Trush, M.A.; Penning, T.M.; Dryhurst, G.; Monks, T.J. Role of quinones in toxicology. Chem. Res. Toxicol. 2000, 13, 135–160. [Google Scholar] [CrossRef] [PubMed]
  11. Gurbani, D.; Bharti, S.K.; Kumar, A.; Pandey, A.K.; Ana, G.R.E.E.; Verma, A.; Khan, A.H.; Patel, D.K.; Mudiam, M.K.R.; Jain, S.K.; et al. Polycyclic aromatic hydrocarbons and their quinones modulate the metabolic profile and induce DNA damage in human alveolar and bronchiolar cells. Int. J. Hyg. Environ. Health 2013, 216, 553–565. [Google Scholar] [CrossRef] [PubMed]
  12. Li, N.; Sioutas, C.; Cho, A.; Schmitz, D.; Misra, C.; Sempf, J.; Wang, M.; Oberley, T.; Froines, J.; Nel, A. Ultrafine particulate pollutants induce oxidative stress and mitochondrial damage. Environ. Health Perspect. 2003, 111, 455–460. [Google Scholar] [CrossRef] [PubMed]
  13. Pope, C.A.; Burnett, R.T.; Thun, M.J.; Calle, E.E.; Krewski, D.; Ito, K.; Thurston, G.D. Lung cancer, cardiopulmonary mortality, and long-term exposure to fine particulate air pollution. JAMA 2002, 287, 1132–1141. [Google Scholar] [CrossRef] [PubMed]
  14. Lee, J.Y.; Douglas, A.L.; Yong, P.K. Formation of polyaromatic hydrocarbon (PAH)-quinones during the gas phase reactions of PAHs with the OH radical in the atmosphere. Environ. Chem. 2015, 12, 307–315. [Google Scholar] [CrossRef]
  15. Eiguren-Fernandez, A.; Miguel, A.H.; Lu, R.; Purvis, K.; Grant, B.; Mayo, P.; Di Stefano, E.; Cho, A.K.; Froines, J. Atmospheric formation of 9,10-phenanthraquinone in the Los Angeles air basin. Atmos. Environ. 2008, 42, 2312–2319. [Google Scholar] [CrossRef]
  16. Eiguren-Fernandez, A.; Miguel, A.H.; Di Stefano, E.; Schmitz, D.A.; Cho, A.K.; Thurairatnam, S.; Avol, E.L.; Froines, J.R. Atmospheric Distribution of Gas- and Particle-Phase Quinones in Southern California. Aerosol Sci. Technol. 2008, 42, 854–861. [Google Scholar] [CrossRef]
  17. Wnorowski, A.; Charland, J.-P. Profiling quinones in ambient air samples collected from the Athabasca region (Canada). Chemosphere 2017. [Google Scholar] [CrossRef] [PubMed]
  18. Tsapakis, M.; Stephanou, E.G. Diurnal Cycle of PAHs, Nitro-PAHs, and Oxy-PAHs in a high Oxidation Capacity Marine Background Atmosphere. Environ. Sci. Technol. 2007, 41, 8011–8017. [Google Scholar] [CrossRef]
  19. Lee, S.C.; Cheng, Y.; Ho, K.F.; Cao, J.J.; Louie, P.K.-K.; Chow, J.C.; Watson, J.G. PM1.0 and PM2.5 Characteristics in the Roadside Environment of Hong Kong. Aerosol Sci. Technol. 2006, 40, 157–165. [Google Scholar] [CrossRef]
  20. Perrone, M.R.; Becagli, S.; Garcia Orza, J.A.; Vecchi, R.; Dinoi, A.; Udisti, R.; Cabello, M. The impact of long-range-transport on PM1 and PM2.5 at a Central Mediterranean site. Atmos. Environ. 2013, 71, 176–186. [Google Scholar] [CrossRef]
  21. Delgado-Saborit, J.M.; Alam, M.S.; Godri Pollitt, K.J.; Stark, C.; Harrison, R.M. Analysis of atmospheric concentrations of quinones and polycyclic aromatic hydrocarbons in vapour and particulate phases. Atmos. Environ. 2013, 77, 974–982. [Google Scholar] [CrossRef]
  22. Tomaz, S.; Jaffrezo, J.L.; Favez, O.; Perraudin, E.; Villenave, E.; Albinet, A. Sources and atmospheric chemistry of oxy- and nitro-PAHs in the ambient air of Grenoble (France). Atmos. Environ. 2017, 161, 144–154. [Google Scholar] [CrossRef]
  23. Barradas-Gimate, A.; Murillo-Tovar, M.; Díaz-Torres, J.; Hernández-Mena, L.; Saldarriaga-Noreña, H.; Delgado-Saborit, J.; López-López, A. Occurrence and Potential Sources of Quinones Associated with PM2.5 in Guadalajara, Mexico. Atmosphere 2017, 8, 140. [Google Scholar] [CrossRef]
  24. Sánchez, H.U.R.; García, M.D.A.; Bejaran, R.; Guadalupe, M.E.G.; Vázquez, A.W.; Toledano, A.C.P.; Villasenor, O.D.L.T. The spatial-temporal distribution of the atmospheric polluting agents during the period 2000–2005 in the Urban Area of Guadalajara, Jalisco, Mexico. J. Hazard. Mater. 2009, 165, 1128–1141. [Google Scholar] [CrossRef] [PubMed]
  25. Escarela, G. Extreme value modeling for the analysis and prediction of time series of extreme tropospheric ozone levels: A case study. J. Air Waste Manag. Assoc. 2012, 62, 651–661. [Google Scholar] [CrossRef] [PubMed]
  26. Nájera-Cedillo, M.; Márquez-Azúa, B.; Sánchez-Gómez, R.; Corona, J.P. Los sistemas de información geográfica como herramienta para observar el comportamiento del ozono en la Zona Metropolitana de Guadalajara. GEOS 2005, 25, 368–376. [Google Scholar]
  27. Tereshchenko, I.E.; Filonov, A.E. Acerca de las causas de las elevadas concentraciones de ozono en la atmósfera de la Zona Metropolitana de Guadalajara, en octubre de 1996. GEOS 1997, 2, 54–59. [Google Scholar]
  28. Davydova-Belitskaya, V.; Skiba, Y.N. Climate of Guadalajara City (Mexico), Its Variation and Change within Latest 120 Years. World Resour. Rev. 1999, 11, 258–270. [Google Scholar]
  29. US EPA. Evaluation and Estimation of Potential Carcinogenic Risks of Polynuclear Aromatic Hydrocarbons; US EPA: Washington, DC, USA, 1985. [Google Scholar]
  30. Jauregui, E.; Godinez, L.; Cruz, F. Aspects of heat-island development in Guadalajara, Mexico. Atmos. Environ. Part B Urban Atmos. 1992, 26, 391–396. [Google Scholar] [CrossRef]
  31. Tereshchenko, I.E.; Filonov, A.E. Air temperature fluctuations in Guadalajara, Mexico, from 1926 to 1994 in relation to urban growth. Int. J. Climatol. 2001, 21, 483–494. [Google Scholar] [CrossRef]
  32. Ulloa, H.; García, M.; Pérez, A.; Meulenert, A.; Ávila, D. Clima y radiación solar en las grandes ciudades: zona metropolitana de guadalajara (estado de Jalisco, Mexico). Investig. Geogr. 2011, 56, 165–175. [Google Scholar]
  33. Kim, M.; Kennicutt, M.C.; Qian, Y. Source characterization using compound composition and stable carbon isotope ratio of PAHs in sediments from lakes, harbor, and shipping waterway. Sci. Total Environ. 2008, 389, 367–377. [Google Scholar] [CrossRef] [PubMed]
  34. Tobiszewski, M.; Namieśnik, J. PAH diagnostic ratios for the identification of pollution emission sources. Environ. Pollut. 2012, 162, 110–119. [Google Scholar] [CrossRef] [PubMed]
  35. Stout, S.A.; Wang, Z. Chemical Fingerprinting Methods and Factors Affecting Petroleum Fingerprints in the Environment. In Standard Handbook Oil Spill Environmental Forensics: Fingerprinting and Source Identification, 2nd ed.; Academic Press: Cambridge, MA, USA, 2007; pp. 61–129. ISBN 9780128096598. [Google Scholar]
  36. Stogiannidis, E.; Laane, R. Source Characterization of Polycyclic Aromatic Hydrocarbons by Using Their Molecular Indices: An Overview of Possibilities. In Reviews of Environmental Contamination and Toxicology; Springer International Publishing: Cham, Switzerland, 2013; Volume 234, pp. 49–133. ISBN 978-3-642-45397-7. [Google Scholar]
  37. Li, P.; Kong, S.; Geng, C.; Han, B.; Lu, B.; Sun, R.; Zhao, R.; Bai, Z. Health risk assessment for vehicle inspection workers exposed to airborne polycyclic aromatic hydrocarbons (PAHs) in their work place. Environ. Sci. Process. Impacts 2013, 15, 623. [Google Scholar] [CrossRef] [PubMed]
  38. US EPA. Development of a relative Potency Factor (RPF) Approach for Polycyclic Aromatic Hydrocarbon (PAH) Mixtures (External Review Draft); US EPA: Washington, DC, USA, 2010. [Google Scholar]
  39. Yang, T.T.; Lin, S.T.; Hung, H.F.; Shie, R.H.; Wu, J.J. Effect of Relative Humidity on Polycyclic Aromatic Hydrocarbon Emissions from Smoldering Incense. Aerosol Air Qual. Res. 2013, 13, 662–671. [Google Scholar] [CrossRef]
  40. US EPA. Risk Assessment Guidance for Superfund Volume I: Human Health Evaluation Manual (Part F, Supplemental Guidance for Inhalation Risk Assessment); Official Superfund Remediation Technology Innovation Environmental Protection Agency: Washington, DC, USA, 2009; Volume I, pp. 1–68.
  41. Agency for Toxic Substances and Disease Registry. Public Health Assessment Guidance Manual (Update); Agency for Toxic Substances and Disease Registry: Atlanta, GA, USA, 2005.
  42. World Health Organization. Polycyclic Aromatic Hydrocarbons; World Health Organization: Copenhagen, Denmark, 2010; ISBN 978-92-890-0213-4. [Google Scholar]
  43. Possanzini, M.; Di Palo, V.; Gigliucci, P.; Tomasi Scianò, M.C.; Cecinato, A. Determination of phase-distributed PAH in Rome ambient air by denuder/GC-MS method. Atmos. Environ. 2004, 38, 1727–1734. [Google Scholar] [CrossRef]
  44. Melymuk, L.; Bohlin, P.; Pozo, K.; Sáňka, O.; Klánová, J. Current Challenges in Air Sampling of Semivolatile Organic Contaminants: Sampling Artifacts and Their Influence on Data Comparability. Environ. Sci. Technol. 2014, 48, 14077–14091. [Google Scholar] [CrossRef] [PubMed]
  45. Li, J.; Zhang, G.; Li, X.D.; Qi, S.H.; Liu, G.Q.; Peng, X.Z. Source seasonality of polycyclic aromatic hydrocarbons (PAHs) in a subtropical city, Guangzhou, South China. Sci. Total Environ. 2006, 355, 145–155. [Google Scholar] [CrossRef] [PubMed]
  46. Vasilakos, C.; Levi, N.; Maggos, T.; Hatzianestis, J.; Michopoulos, J.; Helmis, C. Gas-particle concentration and characterization of sources of PAHs in the atmosphere of a suburban area in Athens, Greece. J. Hazard. Mater. 2007, 140, 45–51. [Google Scholar] [CrossRef] [PubMed]
  47. Morville, S.; Delhomme, O.; Millet, M. Seasonal and diurnal variations of atmospheric PAH concentrations between rural, suburban and urban areas. Atmos. Pollut. Res. 2011, 2, 366–373. [Google Scholar] [CrossRef]
  48. Hytonen, K.; Yli-Pirila, P.; Tissari, J.; Grohn, A.; Riipinen, I.; Lehtinen, K.E.J.; Jokiniemi, J. Gas-Particle Distribution of PAHs in Wood Combustion Emission Determined with Annular Denuders, Filter, and Polyurethane Foam Adsorbent. Aerosol Sci. Technol. 2009, 43, 442–454. [Google Scholar] [CrossRef]
  49. Singh, D.K.; Gupta, T. Effect through inhalation on human health of PM1 bound polycyclic aromatic hydrocarbons collected from foggy days in northern part of India. J. Hazard. Mater. 2016, 306, 257–268. [Google Scholar] [CrossRef] [PubMed]
  50. Lee, W.-J.; Wang, Y.-F.; Lin, T.-C.; Chen, Y.-Y.; Lin, W.-C.; Ku, C.-C.; Cheng, J.-T. PAH characteristics in the ambient air of traffic-source. Sci. Total Environ. 1995, 159, 185–200. [Google Scholar] [CrossRef]
  51. Yunker, M.B.; Macdonald, R.W.; Vingarzan, R.; Mitchell, R.H.; Goyette, D.; Sylvestre, S. PAHs in the Fraser River basin: A critical appraisal of PAH ratios as indicators of PAH source and composition. Org. Geochem. 2002, 33, 489–515. [Google Scholar] [CrossRef]
  52. Slezakova, K.; Pires, J.C.M.; Castro, D.; Alvim-Ferraz, M.C.M.; Delerue-Matos, C.; Morais, S.; Pereira, M.C. PAH air pollution at a Portuguese urban area: Carcinogenic risks and sources identification. Environ. Sci. Pollut. Res. 2013, 20, 3932–3945. [Google Scholar] [CrossRef] [PubMed]
  53. Lakhani, A. Source Apportionment of Particle Bound Polycyclic Aromatic Hydrocarbons at an Industrial Location in Agra, India. Sci. World J. 2012, 2012, 1–10. [Google Scholar] [CrossRef] [PubMed]
  54. Jia, C.; Batterman, S. A critical review of naphthalene sources and exposures relevant to indoor and outdoor air. Int. J. Environ. Res. Public Health 2010, 7, 2903–2939. [Google Scholar] [CrossRef] [PubMed]
  55. Ravindra, K.; Sokhi, R.; Van Grieken, R. Atmospheric polycyclic aromatic hydrocarbons: Source attribution, emission factors and regulation. Atmos. Environ. 2008, 42, 2895–2921. [Google Scholar] [CrossRef] [Green Version]
  56. De Abrantes, R.; De Assunção, J.V.; Pesquero, C.R. Emission of polycyclic aromatic hydrocarbons from light-duty diesel vehicles exhaust. Atmos. Environ. 2004, 38, 1631–1640. [Google Scholar] [CrossRef]
  57. Okona-Mensah, K.B.; Battershill, J.; Boobis, A.; Fielder, R. An approach to investigating the importance of high potency polycyclic aromatic hydrocarbons (PAHs) in the induction of lung cancer by air pollution. Food Chem. Toxicol. 2005, 43, 1103–1116. [Google Scholar] [CrossRef] [PubMed]
  58. Oliveira, M.; Slezakova, K.; Delerue-Matos, C.; Pereira Mdo, C.; Morais, S. Exposure to polycyclic aromatic hydrocarbons and assessment of potential risks in preschool children. Environ. Sci. Pollut. Res. Int. 2015, 22, 13892–13902. [Google Scholar] [CrossRef] [PubMed]
  59. Preuss, R.; Angerer, J.; Drexler, H. Naphthalene—An environmental and occupational toxicant. Int. Arch. Occup. Environ. Health 2003, 76, 556–576. [Google Scholar] [CrossRef] [PubMed]
  60. Samburova, V.; Zielinska, B.; Khlystov, A. Do 16 Polycyclic Aromatic Hydrocarbons Represent PAH Air Toxicity? Toxics 2017, 5, 17. [Google Scholar] [CrossRef] [PubMed]
  61. Robson, M.G.; Toscano, W.A. Risk Assessment for Environmental Health; John Wiley & Sons, Inc.: San Francisco, CA, USA, 2007; ISBN 9780787983192. [Google Scholar]
  62. Agency for Toxic Substances and Disease Registry. Guidance Manual for the Assessment of Joint Toxic Action of Chemical Mixtures; Agency for Toxic Substances and Disease Registry: Atlanta, GA, USA, 2004.
  63. Bruce, E.D.; Abusalih, A.A.; McDonald, T.J.; Autenrieth, R.L. Comparing deterministic and probabilistic risk assessments for sites contaminated by polycyclic aromatic hydrocarbons (PAHs). J. Environ. Sci. Health Part A Toxic Hazard. Subst. Environ. Eng. 2007, 42, 697–706. [Google Scholar] [CrossRef] [PubMed]
  64. Muñoz Serrano, J.; Carranco Ortiz, B.; Salmón Muñóz, J.; Amador González, S. Registro Estatal de Cáncer; Guadalajara, Mexico, 2010. Available online: https://ssj.jalisco.gob.mx/registros/51 (accessed on 20 January 2018).
  65. Chen, H.; Goldberg, M.S. The effects of outdoor air pollution on chronic illnesses. McGill J. Med. MJM 2009, 12, 58–64. [Google Scholar] [PubMed]
  66. Alam, M.S.; Delgado-Saborit, J.M.; Stark, C.; Harrison, R.M. Using atmospheric measurements of PAH and quinone compounds at roadside and urban background sites to assess sources and reactivity. Atmos. Environ. 2013, 77, 24–35. [Google Scholar] [CrossRef]
  67. Sousa, E.T.; Lopes, W.A.; de Andrade, J.B. Fontes, Formação, Reatividade E Determinação De Quinonas Na Atmosfera. Quim. Nova 2016, 39, 486–495. [Google Scholar] [CrossRef]
  68. Wnorowski, A. Characterization of the ambient air content of parent polycyclic aromatic hydrocarbons in the Fort McKay region (Canada). Chemosphere 2017, 174, 371–379. [Google Scholar] [CrossRef] [PubMed]
  69. Cho, A.K.; Di Stefano, E.; You, Y.; Rodriguez, C.E.; Schmitz, D.A.; Kumagai, Y.; Miguel, A.H.; Eiguren-Fernandez, A.; Kobayashi, T.; Avol, E.; et al. Determination of Four Quinones in Diesel Exhaust Particles, SRM 1649a, and Atmospheric PM2.5 Special Issue of Aerosol Science and Technology on Findings from the Fine Particulate Matter Supersites Program. Aerosol Sci. Technol. 2004, 38, 68–81. [Google Scholar] [CrossRef]
  70. Jakober, C.A.; Riddle, S.G.; Robert, M.A.; Destaillats, H.; Charles, M.J.; Green, P.G.; Kleeman, M.J. Quinone emissions from gasoline and diesel motor vehicles. Environ. Sci. Technol. 2007, 41, 4548–4554. [Google Scholar] [CrossRef] [PubMed]
  71. Ringuet, J.; Leoz-Garziandia, E.; Budzinski, H.; Villenave, E.; Albinet, A. Particle size distribution of nitrated and oxygenated polycyclic aromatic hydrocarbons (NPAHs and OPAHs) on traffic and suburban sites of a European megacity: Paris (France). Atmos. Chem. Phys. 2012, 12, 8877–8887. [Google Scholar] [CrossRef] [Green Version]
  72. Allen, J.O.; Durant, J.L.; Dookeran, N.M.; Taghizadeh, K.; Plummer, E.F.; Lafleur, A.L.; Sarofim, A.F.; Smith, K.A. Measurement of Oxygenated Polycyclic Aromatic Hydrocarbons associated with a size-segregated urban aerosol. Environ. Sci. Technol. 1997, 31, 2064–2070. [Google Scholar] [CrossRef]
  73. Turpin, B.J.; Huntzicker, J.J.; Hering, S.V. Investigation of organic aerosol sampling artifacts in the Los Angeles basin. Atmos. Environ. 1994, 28, 3061–3071. [Google Scholar] [CrossRef]
  74. Wingfors, H.; Hägglund, L.; Magnusson, R. Characterization of the size-distribution of aerosols and particle-bound content of oxygenated PAHs, PAHs, and n-alkanes in urban environments in Afghanistan. Atmos. Environ. 2011, 45, 4360–4369. [Google Scholar] [CrossRef]
  75. Lee, J.Y.; Lane, D.A. Unique products from the reaction of naphthalene with the hydroxyl radical. Atmos. Environ. 2009, 43, 4886–4893. [Google Scholar] [CrossRef]
  76. Jian, L.; Zhu, Y.P.; Zhao, Y. Monitoring fine and ultrafine particles in the atmosphere of a Southeast Chinese city. J. Environ. Monit. 2011, 13, 2623–2629. [Google Scholar] [CrossRef] [PubMed]
  77. Patai, S. The Chemistry of the Quinonoid Compounds—Part 1; John Wiley & Sons, Inc.: New York, NY, USA, 1974; ISBN 0471669296. [Google Scholar]
  78. Moriconi, E.J.; O’Connor, W.F.; Taranko, L.B. Ozonolysis of Polycyclic Aromatics. V. Naphthacene and 5,12-Naphthacenequinone. Arch. Biochem. Biophys. 1959, 83, 283–290. [Google Scholar] [CrossRef]
  79. Agudelo-Castañeda, D.M.; Teixeira, E.C. Seasonal changes, identification and source apportionment of PAH in PM1.0. Atmos. Environ. 2014, 96, 186–200. [Google Scholar] [CrossRef]
  80. Atkinson, R.; Aschmann, S.M.; Arey, J.; Zielinska, B. Gas-phase atmospheric chemistry of 1-and 2-nitronaphthalene and 1,4-naphthoquinone. Atmos. Environ. 1989, 23, 2679–2690. [Google Scholar] [CrossRef]
  81. Guillard, C.; Delprat, H.; Hoang-Van, C.; Pichat, P. Laboratory Study of the Rates and Products of the Phototransformations of Naphthalene Adsorbed on Samples of Titanium Dioxide, Ferric Oxide, Muscovite, and Fly Ash. J. Atmos. Chem. 1993, 16, 47–59. [Google Scholar] [CrossRef]
  82. Wang, L.; Arey, J.; Atkinson, R. Kinetics and Products of Photolysis and Reaction with OH Radicals of a Series of Aromatic Carbonyl Compounds. Environ. Sci. Technol. 2006, 40, 5465–5471. [Google Scholar] [CrossRef] [PubMed]
  83. Bayona, J.M.; Maekides, K.E.; Lee, M.L. Characterization of Polar Polycyclic Aromatic Compounds in a Heavy-Duty Diesel Exhaust Particulate by Capillary Column Gas Chromatography and High-Resolution Mass Spectrometry. Environ. Sci. Technol. 1988, 22, 1440–1447. [Google Scholar] [CrossRef] [PubMed]
  84. Souza, K.F.; Carvalho, L.R.F.; Allen, A.G.; Cardoso, A.A. Diurnal and nocturnal measurements of PAH, nitro-PAH, and oxy-PAH compounds in atmospheric particulate matter of a sugar cane burning region. Atmos. Environ. 2014, 83, 193–201. [Google Scholar] [CrossRef]
  85. Chen, W.; Zhu, T. Formation of nitroanthracene and anthraquinone from the heterogeneous reaction between NO2 and anthracene adsorbed on NaCl particles. Environ. Sci. Technol. 2014, 48, 8671–8678. [Google Scholar] [CrossRef] [PubMed]
  86. Kameda, T. Atmospheric Chemistry of Polycyclic Aromatic Hydrocarbons and Related Compounds. J. Health Sci. 2011, 57, 504–511. [Google Scholar] [CrossRef]
  87. Keyte, I.J.; Harrison, R.M.; Lammel, G. Chemical reactivity and long-range transport potential of polycyclic aromatic hydrocarbons—A review. Chem. Soc. Rev. 2013, 42, 9333. [Google Scholar] [CrossRef] [PubMed]
  88. Wang, W.; Jariyasopit, N.; Schrlau, J.; Jia, Y.; Tao, S.; Yu, T.W.; Dashwood, R.H.; Zhang, W.; Wang, X.; Simonich, S.L.M. Concentration and photochemistry of PAHs, NPAHs, and OPAHs and toxicity of PM2.5 during the beijing olympic games. Environ. Sci. Technol. 2011, 45, 6887–6895. [Google Scholar] [CrossRef] [PubMed]
  89. Janhäll, S.; Jonsson, Å.M.; Molnár, P.; Svensson, E.A.; Hallquist, M. Size resolved traffic emission factors of submicrometer particles. Atmos. Environ. 2004, 38, 4331–4340. [Google Scholar] [CrossRef]
Figure 1. (a) Map of population density and monitoring sites located in Guadalajara metropolitan area (GMA). Blue circles show sampling sites location. (b) The Centro (CEN) and (c) Tlaquepaque (TLA) monitoring sites in the local context.
Atmosphere 09 00137 g001
Figure 2. Annual average profile for solar irradiation, temperature and relative humidity in GMA.
Atmosphere 09 00137 g002
Figure 3. Relative contributions by PAH to the Σ16PAH observed in gas + PM1 phases in the GMA expressed in percentage.
Atmosphere 09 00137 g003
Figure 4. Distribution of PAHs in the gas phase and as PM1 according to the number of aromatic rings.
Atmosphere 09 00137 g004
Figure 5. Relative individual contributions by quinone to the total determined concentration (gas + PM1).
Atmosphere 09 00137 g005
Figure 6. Distribution of quinones in the gas phase and PM1 according to vapor pressure (Pa).
Atmosphere 09 00137 g006
Table 1. Meteorological conditions in the GMA during the warm-dry season.
ParameterMinimumAverageMaximum
Temperature (°C)16.124.332.4
Relative humidity (%)14.046.091.0
Wind speed (m s−1)0.01.86.7
Solar radiation (W m−2) **1.0255.01111.0
** During daytime.
Table 2. Relative potency factor (RPF) values of individual polycyclic aromatic hydrocarbons (PAHs) included in the inhalation cancer risk assessment [38].
CompoundRPF
Flu0.08
BaA0.2
Chr0.1
BbF0.8
BkF0.03
BaP1
Ind0.07
Dib10
BghiP0.009
Table 3. Total ambient levels of PAHs in the gas and PM1 phases determined in the GMA.
GAS + PM1
PAHCEN (ng m−3)TLA (ng m−3)Average of CEN and TLA (ng m−3)
Ave. *SDMinMaxMedAve. *SDMinMaxMedAve. *SDMinMaxMed
Nap61.518.336.6103.459.950.322.49.1283.249.652.118.530.193.352.6
Ace34.215.412.267.130.633.815.74.0572.932.831.912.515.256.928.4
Acy16.04.610.324.215.111.64.832.0522.713.112.84.096.8518.713.2
Fl7.725.330.71114.848.495.483.840.50611.63.515.223.051.2612.95.26
Phe17.14.1810.924.417.412.94.252.4819.513.313.94.166.3120.115.4
Ant3.162.210.4756.681.963.062.610.30310.31.852.911.680.5767.562.93
Flu2.732.070.2546.782.032.672.140.02278.972.242.451.340.2745.572.36
Pyr2.252.160.01376.691.712.482.250.001638.341.992.221.260.06335.132.12
BaA4.672.221.157.175.002.492.610.01456.551.782.311.230.01423.862.49
Chr3.522.470.02618.303.883.733.760.097110.03.792.492.040.08126.942.29
BbF3.763.530.03099.853.412.123.160.037812.00.4932.712.720.038110.92.19
BkF2.082.540.02817.860.7141.883.230.068812.80.5221.851.750.04846.741.62
BaP2.252.440.007396.351.491.612.180.006586.280.2071.591.170.1073.191.71
Ind2.332.520.02987.591.201.392.240.02117.280.4351.711.280.01053.911.61
Dib4.503.390.03838.994.712.523.270.06368.760.2282.441.550.03794.522.71
BghiP3.013.300.1129.991.902.022.540.02848.100.5822.071.470.01834.991.96
Σ16PAH170.047.5---140.053.4---140.039.1---
* Ave.: Average.
Table 4. Average ambient levels of PAHs observed in the gas and PM1 phases at the CEN and TLA monitoring sites in the GMA.
PAHsGas (ng m−3)PM1 (ng m−3)
Ave. *SDMinMaxMedAve. *SDMinMaxMed
Nap54.217.930.193.353.20.2070.1840.005920.4790.231
Ace31.912.415.256.727.90.2110.2170.01870.7260.113
Acy12.84.016.8518.712.80.2290.2370.008210.6650.202
Fl5.192.961.2612.95.080.9430.5200.3551.751.01
Phe12.94.026.3119.813.51.411.710.03944.340.259
Ant2.501.180.5764.292.720.5721.390.005334.910.0471
Flu2.471.340.2505.562.510.01140.008390.005650.02390.00813
Pyr2.221.260.004995.122.110.01710.02070.0005390.05830.00827
BaA1.851.160.01423.582.271.471.510.007263.591.03
Chr1.890.9990.04612.822.331.531.870.02834.310.668
BbF1.391.230.006483.681.571.622.900.1349.490.288
BkF1.411.460.01154.451.480.5410.599 0.1602.290.271
BaP1.551.190.003003.171.720.09470.06710.004060.2140.0968
Ind1.401.320.01003.731.340.4980.260.1740.9780.409
Dib2.631.350.04154.492.890.3540.5440.03181.290.0436
BghiP1.951.130.01234.051.980.5840.8630.09683.010.337
Σ16PAH137.037.7---7.258.34---
* Ave.: Average.
Table 5. Total sample diagnostic ratios [52].
PAH RatioValueReported RangeSource
Phe/Phe + Ant0.83>0.70Vehicular
Flu/Flu + Pyr0.53>0.50Diesel
Ind/Ind + BghiP0.420.35–0.70Diesel
BbF/BkF1.5>0.50Diesel
BaP/BaP + Chr0.370.50Diesel
Table 6. Benzo[a]pyrene toxic equivalent concentration and lung cancer risk (total sample).
CompoundBaPeqLCR
Flu0.1952.15 × 10−4
BaA0.4331.89 × 10−4
Chr0.2492.17 × 10−4
BbF1.352.36 × 10−4
BkF0.05551.61 × 10−4
BaP1.591.39 × 10−4
Ind0.1191.49 × 10−4
Dib13.72.13 × 10−4
BghiP0.01751.81 × 10−4
BaPTeqΣ9PAH17.71.7 × 10−3
Table 7. Total ambient levels of quinones in the gas and PM1 phases in the GMA.
GAS + PM1
QuinoneCEN (ng m−3)TLA (ng m−3)Average of CEN and TLA (ng m−3) *
Ave. *SDMinMaxMedAve. *SDMinMaxMedAve. *SDMinMaxMed
1,4-NQ1.311.250.05895.251.070.7821.070.06463.590.3670.9781.040.08493.990.780
1,4-PQ6.223.741.5815.65.754.603.521.0215.13.885.212.870.89110.55.07
9,10-PQ0.2240.1530.03710.4570.2150.2090.1810.05550.4860.1190.1270.1090.01850.3750.0828
1,4-AQ0.7760.1400.6450.9250.7591.120.5180.4911.751.120.5670.1850.3220.8720.561
9,10-AQ0.3120.1240.1730.5530.3230.7520.4450.3571.450.6250.3710.2380.1040.8120.398
1,2-BAQ0.3220.3240.03200.9500.1800.3280.3850.03531.160.1280.3050.2460.04660.8920.226
5,12-NAQ0.3900.3190.04241.060.4390.4780.4670.04501.480.2160.4210.3080.08380.9860.364
1,4-CQ0.4820.4740.06550.9980.3840.06870.06700.03820.1560.05920.1720.1930.01910.4990.0782
Σ8Quinones8.174.10---6.743.86---7.462.88---
* Ave.: Average.
Table 8. Average ambient levels of quinones in the gas and PM1 phases at the CEN and TLA sites in the GMA.
QuinonesGas (ng m−3)PM1 (ng m−3)
Ave. *SDMinMaxMedAve. *SDMinMaxMed
1,4-NQ0.6430.4090.03061.320.7610.5961.140.005863.160.0465
1,4-PQ4.373.060.89210.53.371.700.3201.072.021.79
9,10-PQ--<LOD **--0.1270.1090.01860.3750.0829
1,4-AQ--<LOD--0.5670.1850.3230.8720.561
9,10-AQ--<LOD--0.3710.2380.1040.8120.398
1,2-BAQ0.1790.1940.007700.5640.0680.1550.1980.003490.6820.0751
5,12-NAQ0.2470.2220.01210.6960.2190.2140.2400.04470.7950.0887
1,4-CQ--<LOD--0.1720.1930.01910.4990.0782
Σ8Quinones5.443.44 2.321.16
* Ave.: Average. ** LOD: Limit of detection.
Table 9. Spearman coefficients for quinones and PAH correlations.
PAHs-Quinonesr
Nap(p) vs. 1,4-NQ(p)0.83 *
Phe(p) vs. 1,4-PQ(p)0.77 *
Phe(p) vs. 9,10-PQ(p)0.57
Ant(p) vs. 1,4-AQ(p)0.40
1,4-NQ(p) vs. 5,12-NAQ(p)0.75 *
Nap(p) vs. 5,12-NAQ(p)0.75
BaA(g) vs. 1,2-BAQ(g)0.46
BaA(g) vs. 1,2-BAQ(p)−0.56
* Significant at p < 0.05.

