Article

Enhanced Global Monsoon in Present Warm Period Due to Natural and Anthropogenic Forcings

1
Earth System Modeling Center and Climate Dynamics Research Center, Nanjing University of Information Science and Technology, Nanjing 210044, China
2
Key Laboratory of Virtual Geographic Environment of Ministry of Education, School of Geography Science, Nanjing Normal University, Nanjing 210023, China
*
Author to whom correspondence should be addressed.
Atmosphere 2018, 9(4), 136; https://doi.org/10.3390/atmos9040136
Submission received: 28 February 2018 / Revised: 25 March 2018 / Accepted: 3 April 2018 / Published: 4 April 2018
(This article belongs to the Section Meteorology)

Abstract

:
In this study, we investigate global monsoon precipitation (GMP) changes between the Present Warm Period (PWP, 1900–2000) and the Little Ice Age (LIA, 1250–1850) by performing millennium sensitivity simulations using the Community Earth System Model version 1.0 (CESM1). Three millennium simulations are carried out under time-varying solar, volcanic and greenhouse gas (GHG) forcing, respectively, from 501 to 2000 AD. Compared to the global-mean surface temperature of the cold LIA, the global warming in the PWP caused by high GHG concentration is about 0.42 °C, by strong solar radiation is 0.14 °C, and by decreased volcanic activity is 0.07 °C. The GMP increases in these three types of global warming are comparable, being 0.12, 0.058, and 0.055 mm day−1, respectively. For one degree of global warming, the GMP increase induced by strong GHG forcing is 2.2% °C−1, by strong solar radiation is 2.8% °C−1, and by decreased volcanic forcing is 5.5% °C−1, which means that volcanic forcing is most effective in terms of changing the GMP among these three external forcing factors. Under volcanic inactivity-related global warming, both monsoon moisture and circulation are enhanced, and the enhanced circulation mainly occurs in the Northern Hemisphere (NH). The circulation, however, is weakened in the other two cases, and the GMP intensification is mainly caused by increased moisture. Due to large NH volcanic aerosol concentration in the LIA, the inter-hemispheric thermal contrast of PWP global warming tends to enhance NH monsoon circulation. Compared to the GHG forcing, solar radiation tends to warm low-latitude regions and cause a greater monsoon moisture increase, resulting in a stronger GMP increase. The finding in this study is important for predicting the GMP in future anthropogenic global warming when a change in natural solar or volcanic activity occurs.

1. Introduction

Prediction of global monsoon precipitation (GMP) change is important for our daily life and for the whole society due to its effect on about two-thirds of the world’s population. The global monsoon, viewed as a global-scale atmospheric overturning responding to annual variation of external solar forcing [1,2,3], can be separated into the Northern Hemisphere (NH) and Southern Hemisphere (SH) monsoon subsystems [4,5].
Change of the GMP is caused by both internal variability and external forcing. The GMP variability on the interannual to multidecadal time scales has been found to be driven by internal modes such as El Niño-Southern Oscillation (ENSO), mega-ENSO, the Pacific Decadal Oscillation (PDO), and the Atlantic multi-decadal oscillation (AMO) [5,6,7]. During the last three decades, the GMP experienced a significant increase trend, especially over the oceanic region [4,6,8]. This increase was mainly caused by the enhanced land–ocean and hemispheric thermal contrasts, and by the internal multi-decadal variability in tropical Pacific sea surface temperature (SST) [6]. The NH GMP intensity is found to be highly correlated to the internal mega-ENSO index covering the interannual to interdecadal time scales and to the AMO index since 1958. The intensification of NH GMP is primarily attributed to the mega-ENSO, AMO, and hemispheric asymmetric global warming [5,9]. These interannual to multidecadal variations in the climate system are usually induced via dynamic and thermodynamic feedbacks [10]. Current general circulation models (GCMs), however, have difficulties in simulating these internal modes [11,12,13,14,15]. In recent millennium simulations, the low-frequency variability of global-mean precipitation and temperature forced by external forcing was much larger than that forced by the internal mode [16]. To predict GMP change in the future, in this work we focus on the GMP change induced by individual external forcing, including natural solar forcing and volcanic forcing, and anthropogenic greenhouse gases (GHG) forcing.
Under the global warming induced by strong GHG concentration, the GMP was found to be enhanced from 2006 to 2100 under the Representative Concentration Pathway (RCP) 4.5 scenario in many GCMs [17]. This intensification is mainly caused by the increasing land–ocean and inter-hemispheric thermal contrast due to the GHG forcing [6,17,18]. The projected increase of the GMP was also found in ensemble model results of the Coupled Model Intercomparison Project Phase 5 (CMIP5), which is also under high RCP scenarios in the 21st century. This enhanced GMP can be attributed to increased surface evaporation [19,20]. Sensitivity experiments also showed that the GMP tends to be enhanced as CO2 concentration increases [21]. The increase of GMP was also observed during the last decades [6], and the enhanced GHG concentration was found to contribute to this intensification [22]. The GHG forcing has different effects on subcomponents of the global monsoon [23]. By analysing 17 sets of model outputs of the latest CMIP5, the East Asian summer monsoon circulation was found to be only slightly enhanced by the GHG forcing [24]. Moreover, by analysing the observation and CMIP5 model results, Polson et al. mentioned that the observed changes in NH summer monsoon precipitation over the second half the 20th century was mainly influenced by anthropogenic aerosols, not GHG or natural forcing [25].
The effects of natural forcing on the GMP have received relatively less attention compared to the effects of anthropogenic GHG forcing. Some simulation of the last millennium showed that the GMP experienced a minimum during the Little Ice Age (LIA) and a maximum during the Medieval Warm Period, which closely followed the natural variation of, say, the total amount of effective solar radiative forcing [22,26]. For the East Asian summer monsoon, the effect of natural forcing, however, was negligible during 1958–2001 [24].
Few studies have focused on the solar radiation effect. Over the past thousand years, the GMP had three weakest periods corresponding to three minimum periods of solar activity; by contrast, strong GMP occurred during 1030–1240 under a maximum solar activity [22]. The intensity of the Indian monsoon was also found to be weakened during these minimum periods of solar activity [27]. Both simulations and reconstructions showed that the NH summer monsoon over the African–Asian monsoon region was intensified by the enhanced summer insolation in the NH during the early- to mid-Holocene [28,29,30]. The enhanced solar radiation in the NH also weakened the SH monsoon [31].
Large volcanic eruptions mainly perturb the climate through the injection of large amount of SO2 gas into the stratosphere. This SO2 gas reacts with OH and H2O to form sulfur aerosols, resulting in surface cooling by reflecting shortwave radiation [32]. The GMP was found to be significantly reduced in the two years after an explosive volcanic eruption, while the NH monsoon was enhanced by a remote eruption in the SH [33]. This remote response in Sahal greening after the SH eruption was also reported by Haywood, et al. [34]. Model simulation showed that the volcanic forcing plays a primary role in weakening the NH land monsoon over the latter half of the 20th century [35]. Over the last 110 years, the Asian summer monsoon precipitation during the active volcanic eruption period was less than that during the inactive volcanic eruption period [36]. Model simulations also showed that the East Asian summer monsoon was significantly reduced during the last millennium [37]. In the years after the volcanic eruption, precipitation on mainland China was also reduced; and the more sulfate aerosol injected into the NH stratosphere, the more intense this drying trend [38]. Large NH eruptions can excite a multi-decadal AMO-like response [39]. Different El Niño responses can be found after explosive eruptions at different latitudes and different hemispheres [40]. These resulting east–west or south–north thermal contrasts should affect the GMP significantly [5].
It is not clear how differently the GMP responds to different individual external forcing. In this study, we examine GMP differences between the present warm period (PWP) and LIA caused by external solar, volcanic and GHG forcing, respectively, by performing millennium sensitivity experiments. In Section 2, we discuss model simulations and the calculation of GMP. In Section 3, we present the GMP responses to each individual external forcing in model simulations. The moisture and circulation changes controlling the GMP variation are also discussed in Section 3. Conclusions and a discussion of this study are given in Section 4.

2. Model Simulations and Methods

2.1. Model Simulations

To demonstrate the response of the GMP to various external forcings, three millennium sensitivity experiments are performed by using the Community Earth System Model version 1 (CESM1), as well as a control run. Based on a 2000-year pre-industrial run (the control run) in which the external forcing is specified to the year 1850 setting [41], three sensitivity experiments are carried out from 501 to 2000 AD. In the solar experiment, the only time-varying external forcing is the solar forcing, which is obtained from the reconstruction of Shapiro, et al. [42], and the other external forcing is kept the same as in the control run. In the volcanic and GHG experiments, the time-varying external forcing is the reconstructed volcanic forcing [43] and the GHG concentration [44], respectively. A full-forcing experiment is also carried out with all these three external forcing fields changed with time. To examine the role of solar forcing, the reconstruction of Shapiro et al. [42] is used, which has the strongest variability among existing reconstructions. For these millennium experiments, a coarse resolution of T31 (the horizontal resolution is about 3.75 ° × 3.75 ° ) is used. More details about this model can be found in Rosenbloom, Otto-Bliesner, Brady and Lawrence [41].

2.2. Calculation of the Global Monsoon Precipitation (GMP)

The simulated global monsoon domain reflects the model’s performance in simulating annual precipitation and seasonal distribution in each monsoon region [45,46]. To represent the seasonal variation, the annual range of precipitation is defined by local summer-minus-winter precipitation, and a region can be seen as a monsoon region when the precipitation annual range is large and its ratio to the annual-mean precipitation is also large [1]. This definition has been shown to be useful for evaluating the climate models’ performances in terms of global monsoon [1,17,47] and for studying the variation of GMP [22,26]. In this study, the global monsoon domain is delineated by the annual range of precipitation exceeding a threshold of 2.0 mm/day and the ratio of annual range to annual mean exceeding 55% [4,17,22]. Using this definition, we can capture the dominant mode of annual variation of the tropical precipitation and low-level winds [46]. In this study, the boreal summer denotes May through September, and the boreal winter covers November through March.

3. Results

3.1. Simulated GMP Responses

We use the simulated global-mean surface air temperature to define the cold LIA and warm PWP. In the full-forcing experiment (Figure 1a), the global-mean temperature shows both strong interannual and multi-decadal variabilities, and a significant global warming is simulated for the period of 1900–2000. A cold period from 1250 to 1850 AD is also simulated, with minimum values around 1250, 1450, 1700 and 1800. The global-mean precipitation follows the variation of global-mean temperature closely. Thus, we define the period of 1250–1850 as the LIA, and the warm period of 1900–2000 as the PWP. Figure 1b–d show the individual external forcing and its associated responses in these three experiments of GHG, solar and volcano, respectively. In the GHG experiment, continuous increases in both global-mean temperature and precipitation are simulated after the industrial revolution around 1850, which follow the increase of GHG concentration closely (Figure 1b). In the solar experiment (Figure 1c), strong centennial variation is simulated. The global-mean temperature and precipitation experienced low values around 1265–1338, 1396–1562, and 1617–1728, being consistent with the weak solar radiation during these periods, interrupted by high global-mean temperature and precipitation. In the volcano experiment (Figure 1d), both global-mean cooling and drying are simulated, mainly for the three periods of 1213–1292, 1452–1485, and 1809–1840, consistent with strong volcanic eruptions. The strongest cooling was simulated after the 1257 Samalas volcanic eruption, consistent with the results of Miller, et al. [48]. Compared to the fields during the LIA, it seems that the PWP is caused by large GHG concentration, large solar radiation, and weak volcanic activity. Before quantifying this contribution, we calculate the global monsoon domain and GMP first.
The GMP for PWP and LIA are shown in Figure 2. As shown above, the cold LIA has weak solar forcing and activity of volcanic eruptions but almost no GHG forcing; while the GHG forcing is the strongest during warm PWP. The GMP decreased in most monsoon regions during LIA (Figure 2a) and increased during PWP (Figure 2b). To further understand these different GMP responses, we explore how the GMP change was induced by different single external forcing during PWP and LIA.
The global monsoon domains for the LIA and PWP in all experiments are summarized in Figure 3. The monsoon domain in the last millennium based on precipitation was stable; however, the changes in global monsoon domain are sensitive to model resolution. Note that the model resolution we use is relatively coarse (T31) compared to state-of-the-art climate models. Consistent with previous work [33], the six sub-monsoon systems, i.e., South Asian, East Asian–western North Pacific, West Africa, North American, South African, Australian, and South American monsoons, are well captured except that both the western North Pacific monsoon and the east part of the Australian monsoon domain shrink into the central Pacific when comparing the observations [5]. In this work, the mean precipitation of these monsoon domains is used to calculate the GMP.
The simulated global-mean temperature and GMP (global-mean precipitation, GP) changes between PWP and LIA induced by the individual external forcing are listed in Table 1. Compared to the LIA, the global warming temperature change of the PWP induced by high GHG concentration is about 0.42 °C, by strong solar radiation is 0.14 °C, and by decreased volcanic activity is 0.07 °C; the global warming temperature change in the full-forcing experiment is 0.61 °C. These results indicate that the global warming of the PWP is mainly due to high GHG concentration, which contributes 68.9% of the global warming, while the strong solar radiation and weak volcanic activity only contribute 23.0% and 11.5%, respectively. Here, the sum of the temperature change in these individual experiments is quite close to, although not the same as, that in the full-forcing experiment, due to the non-linear processes under the full-forcing run.
The global hydrological sensitivity is variable to different external forcing. Previous studies show that the nature forcing is more efficient in changing the GP than the GHG forcing [49,50,51,52,53]. More specifically, Liu et al. investigated the global precipitation responses to different external forcing for a given global temperature change [16]. The results show that the volcanic forcing is the most efficient in changing GP, followed by the solar forcing and GHG forcing. The reason is that the GHG forcing reduces tropospheric cooling and increases atmospheric stability, which means the corresponding precipitation increase is much smaller than the temperature change. We obtained the same results for one degree of global-mean temperature change, whereby the GP increase is 0.051 mm day−1 °C−1 (1.9% °C−1) under the GHG forcing, while it is 0.072 mm day−1 °C−1 (2.6% °C−1) under the solar forcing and 0.090 mm day−1 °C−1 (3.3% °C−1) under weak volcanic activity.
The total GMP increase in the full-forcing case is 0.2 mm day−1, while it is 0.12 mm day−1 in the GHG experiment, 0.058 mm day−1 in the solar experiment, and 0.055 mm day−1 in the volcano experiment. By contrast with the global-mean temperature change that is dominated by the GHG forcing, all these three external forcing factors have comparable contributions to the GMP change. The GMP increase by the GHG forcing contributes 60% of the total GMP increase, while the solar radiation and volcanic activity contribute 29% and 27.5%, respectively.
These different responses in global-mean temperature and GMP indicate that these three external forcing factors have different effects on temperature and precipitation changes. For one degree of global-mean temperature change, the GMP increase is 0.29 mm day−1 °C−1 (2.2% °C−1) under the GHG forcing, while it is 0.41 mm day−1 °C−1 (2.8% °C−1) under the solar forcing and 0.79 mm day−1 °C−1 (5.5% °C−1) under weak volcanic activity. This means that these natural solar and volcanic forcing factors are more efficient at changing the GMP than the anthropogenic GHG forcing; and the volcanic forcing is the most efficient one.
Since the global monsoon includes both NH and SH monsoon subsystems, it is necessary to investigate which sub-monsoon system contributes more to these different responses of precipitation. For one degree of global-mean temperature change, the GMP change for each sub-monsoon system is listed in Table 2. In the full-forcing experiment, the GMP increase mainly comes from the NH. The NH GMP increase of 0.26 mm day−1 °C−1 is much bigger than the SH GMP increase of 0.06 mm day−1 °C−1. Under the GHG-induced global warming, the SH GMP increase is two times the NH GMP increase, while under the global warming caused by strong solar radiation, the GMP increase in the NH is three times that in the SH. The GMP increase in the volcano experiment mainly occurs in the NH, which is 0.86 mm day−1 °C−1, much bigger than the change in the other two experiments. The GMP change in the SH, however, is negative, of −0.064 mm day−1 °C−1. These results indicate that the volcanic eruption produces strong asymmetric responses about the equator and mainly increases the GMP in the NH.

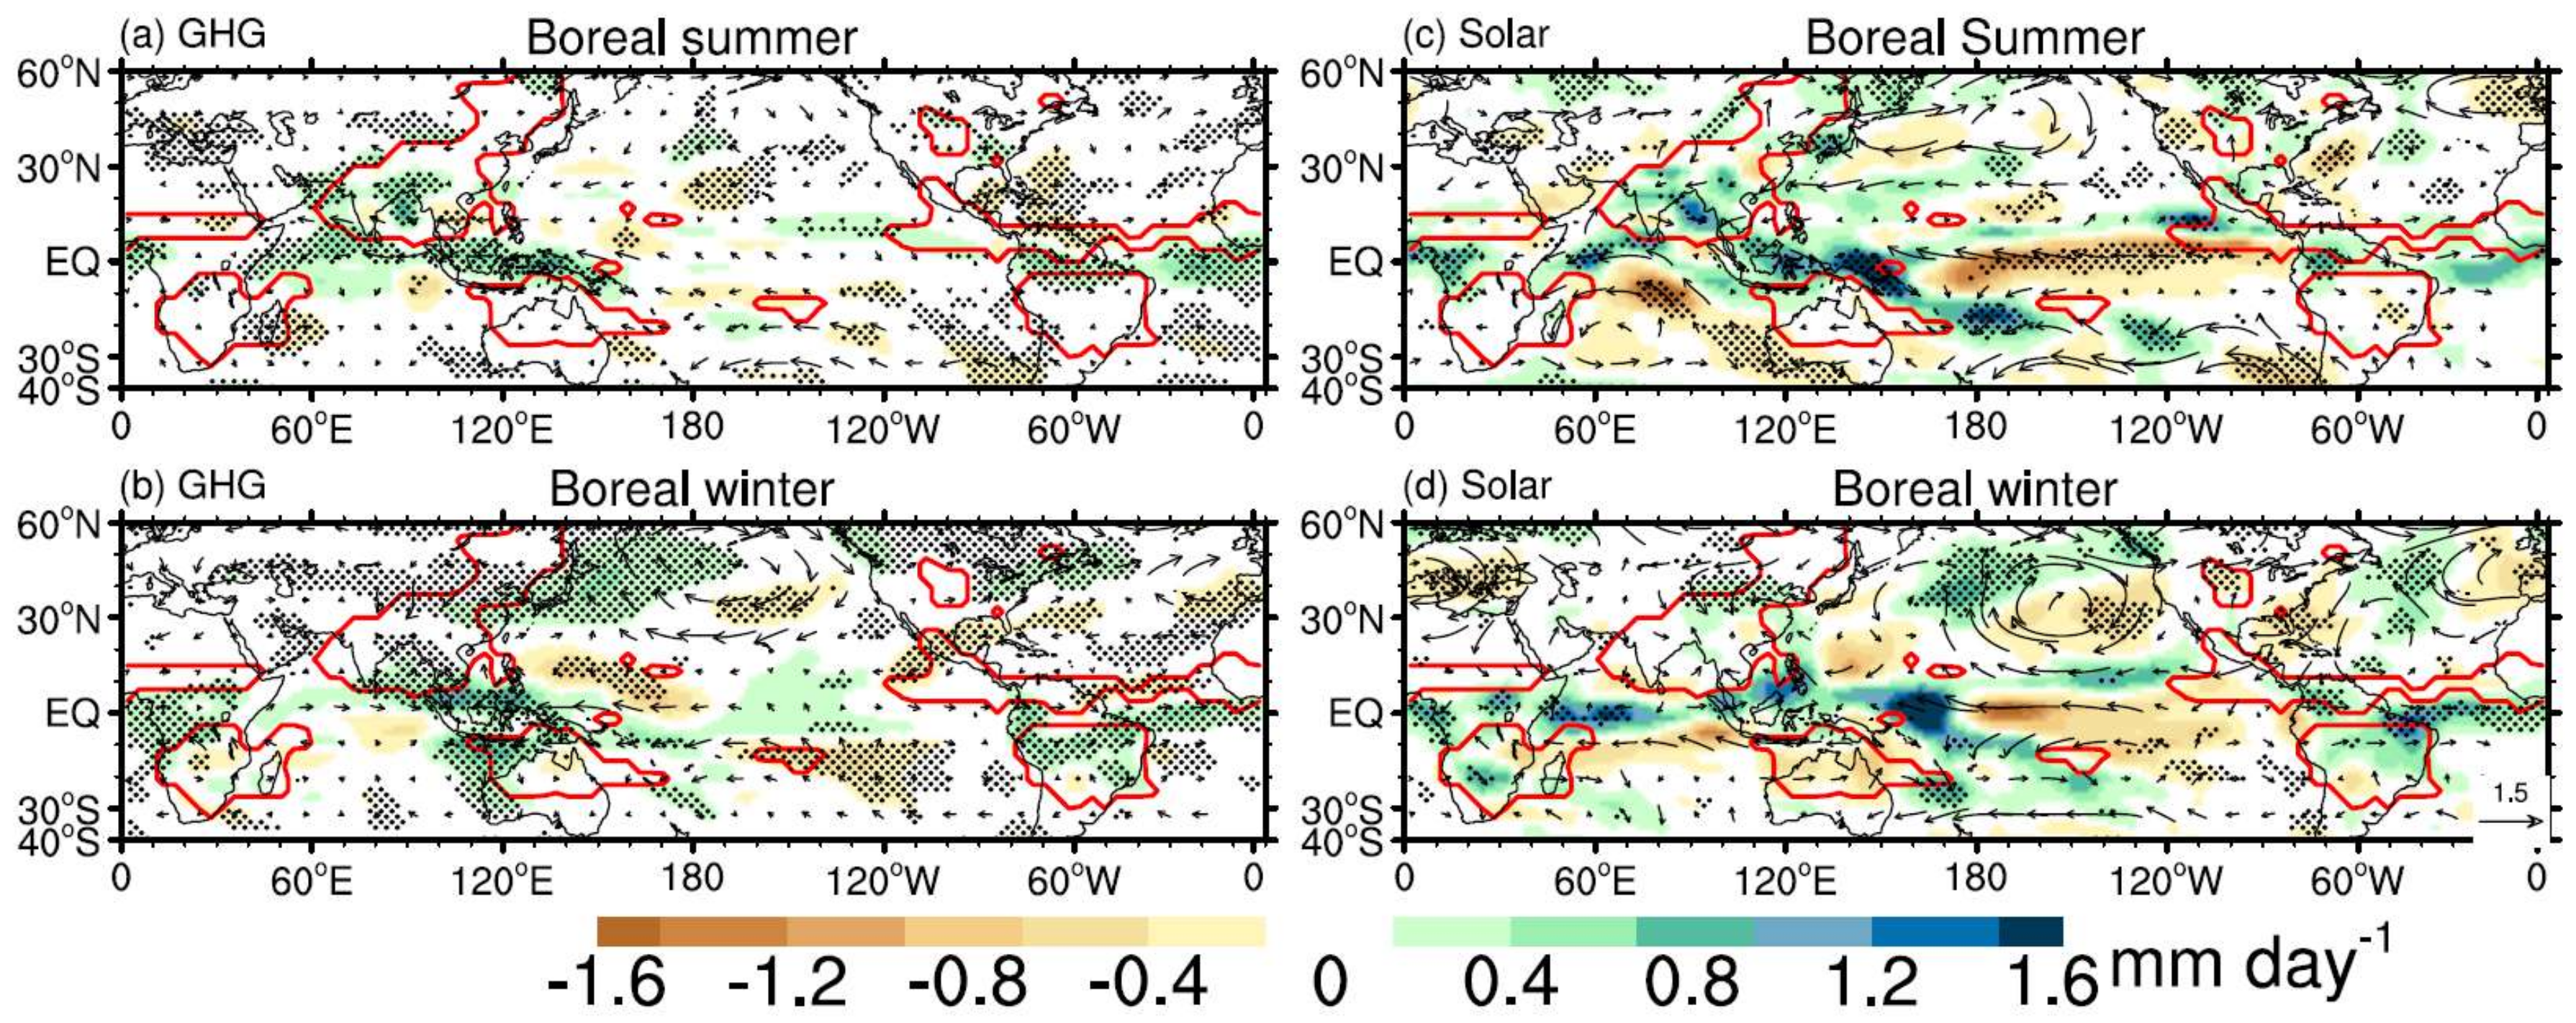
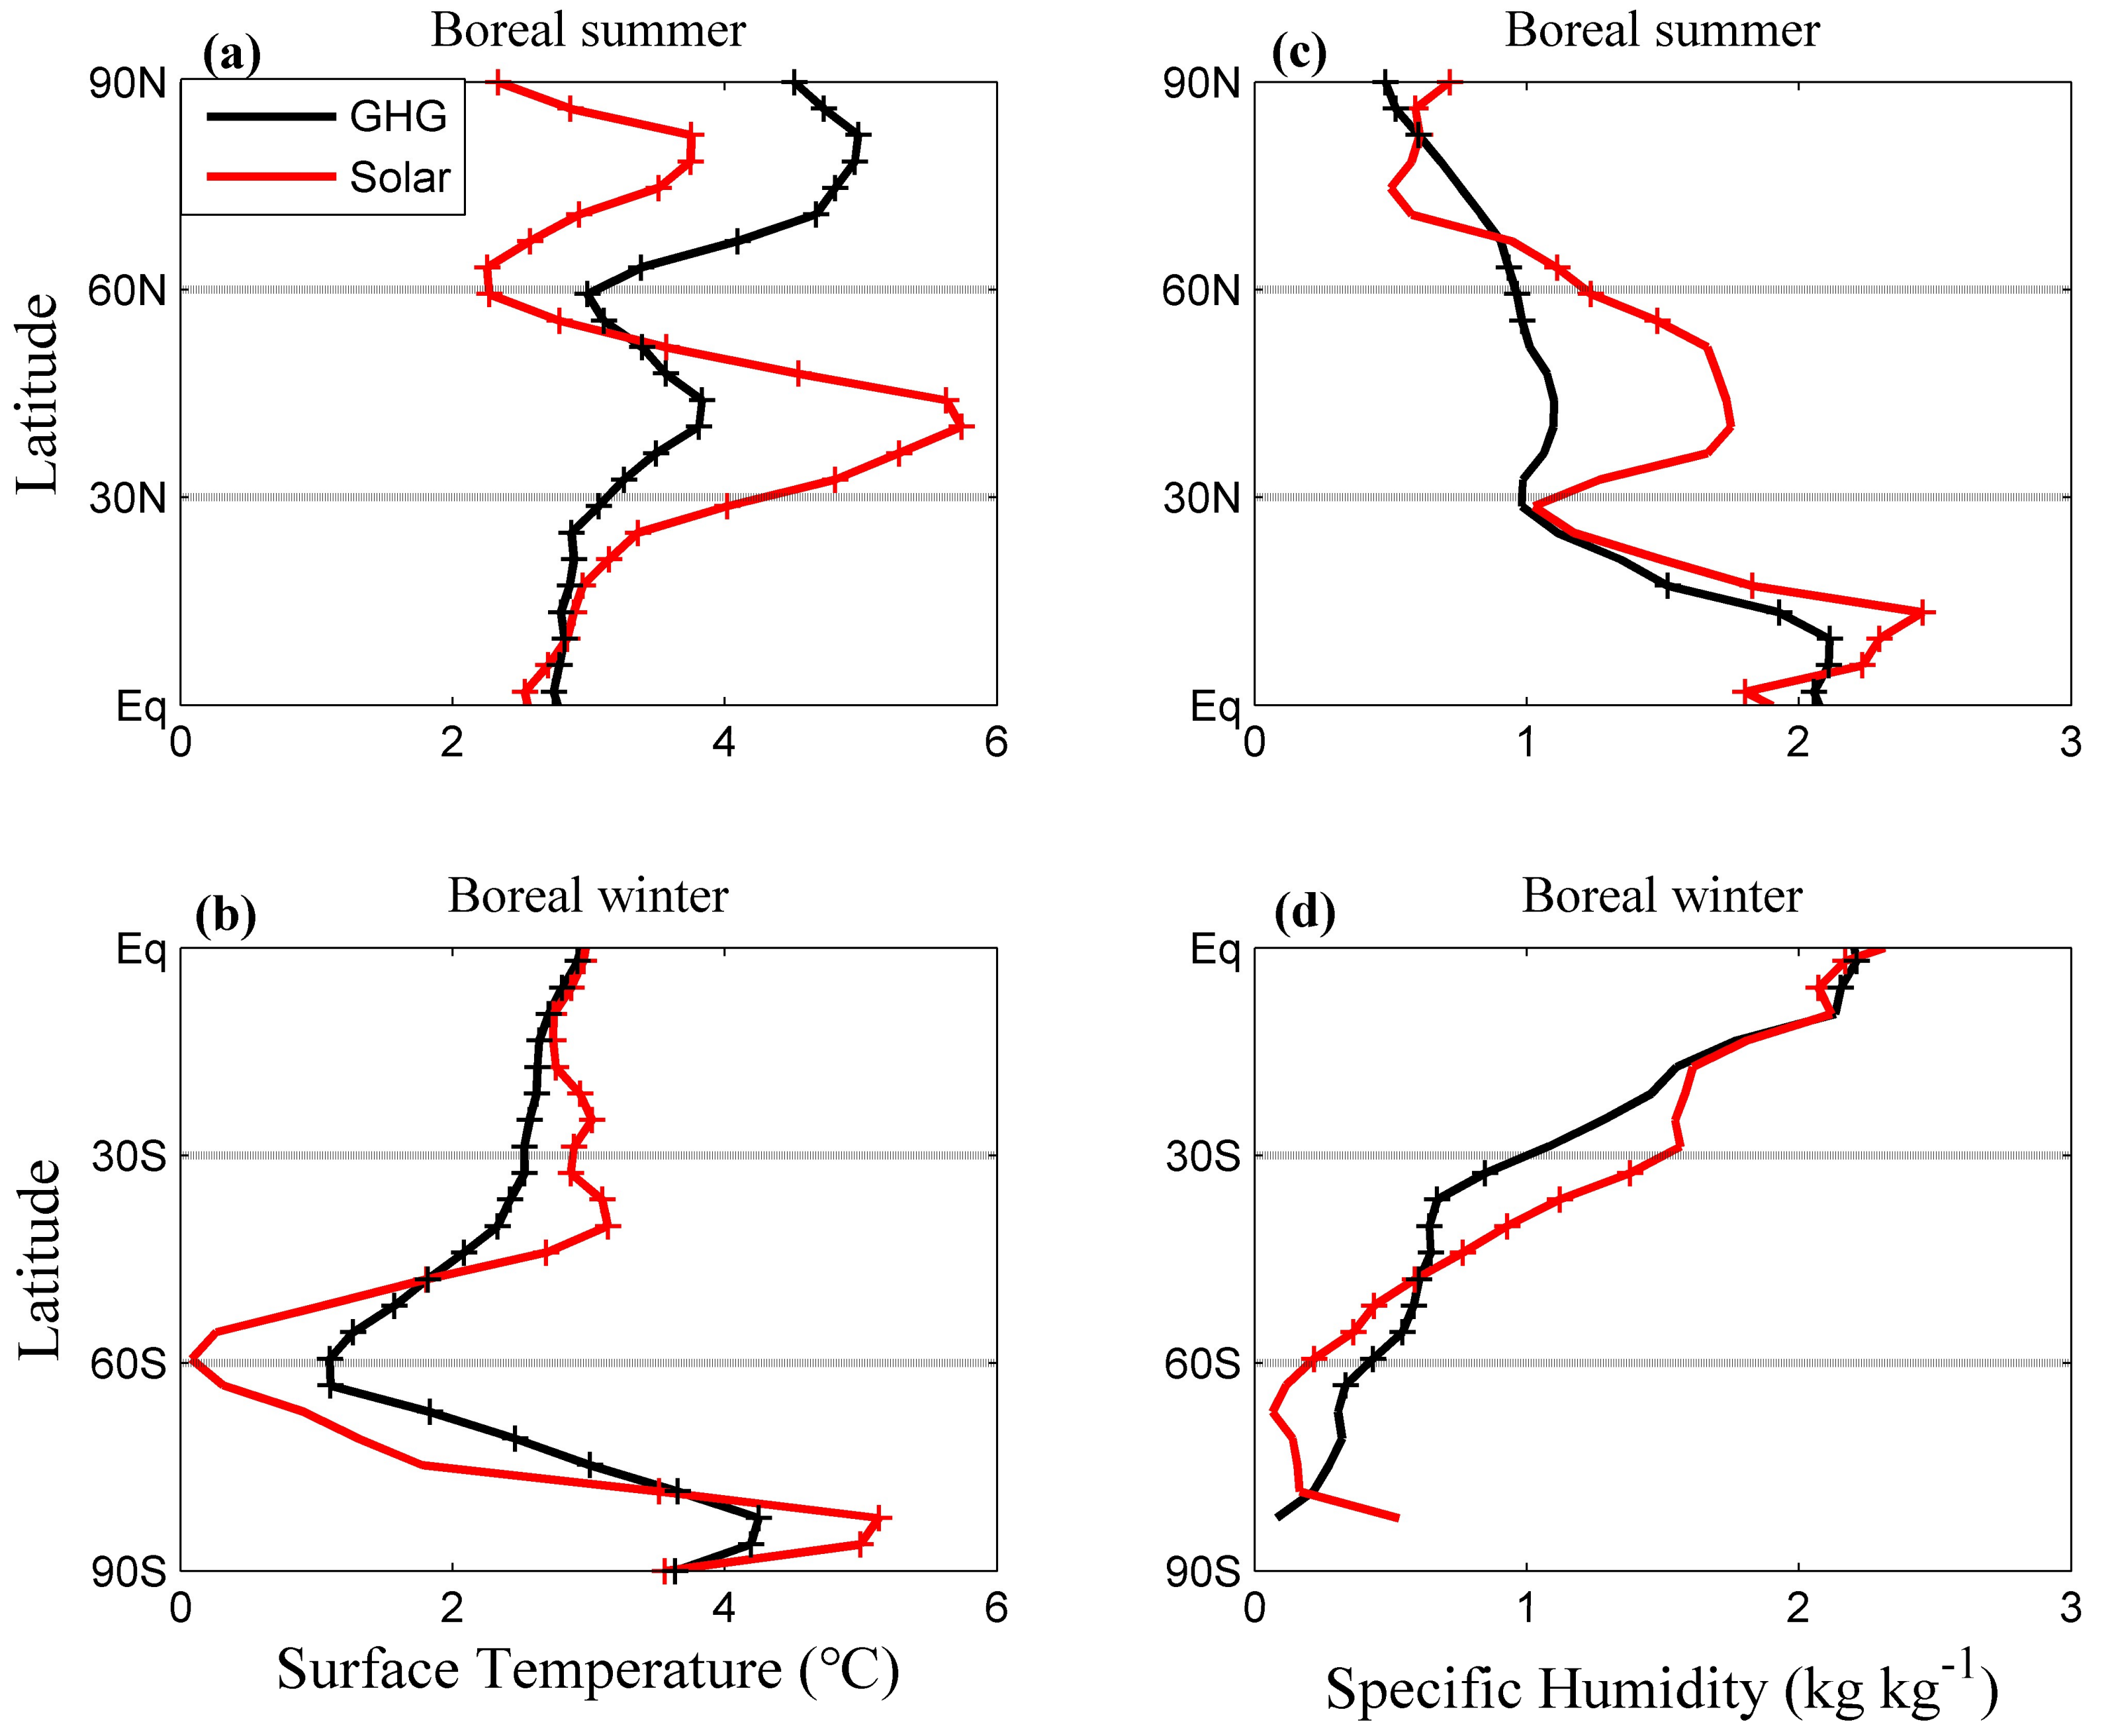
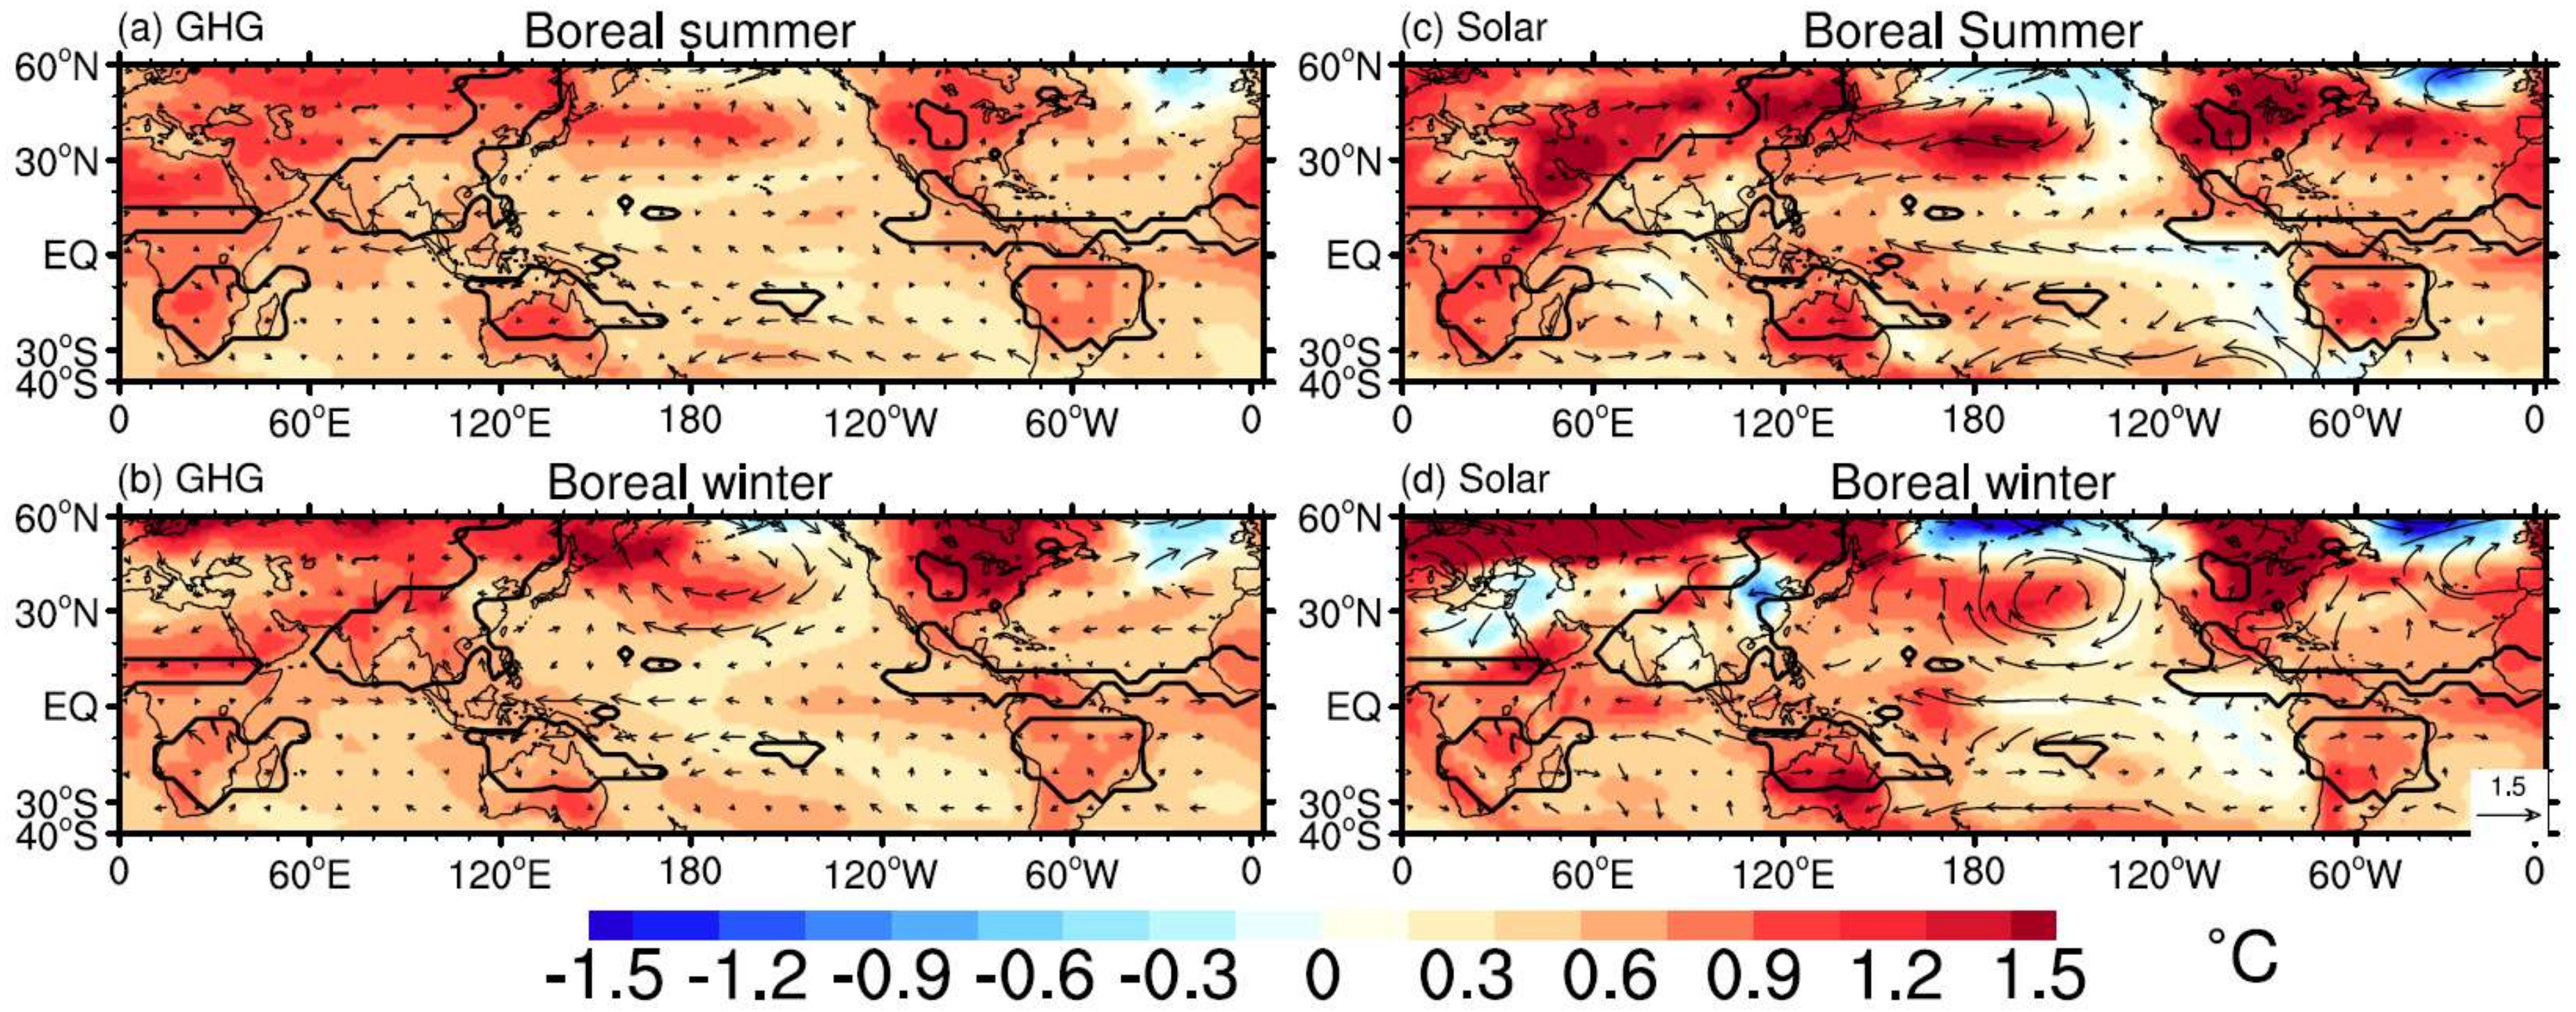
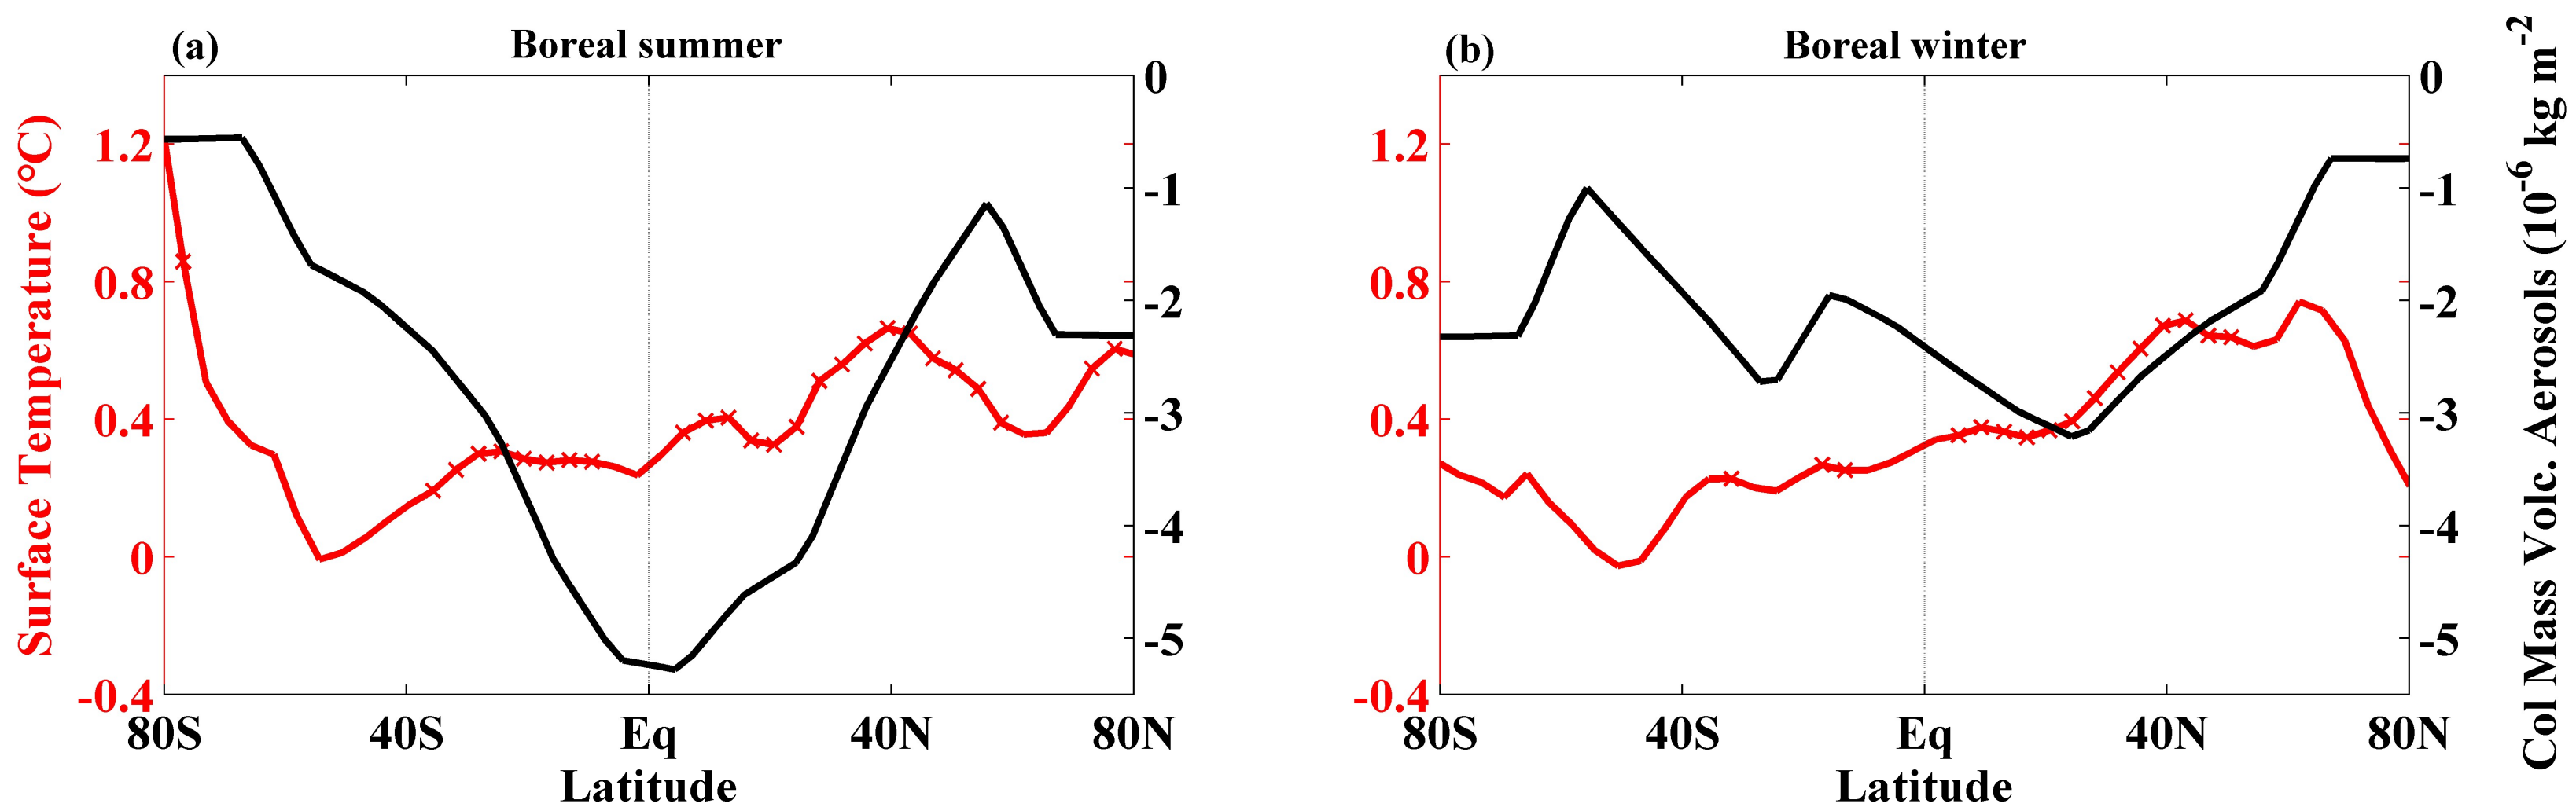
3.2. Simulated Moisture and Circulation Changes

GMP variability can be induced by moisture change and circulation change [33,54]. Following the method used for diagnosing tropical precipitation change [55], the GMP change P between the PWP and LIA can be written as
P = ( q ¯ ω + q ω ¯ + q ω )
where q denotes surface specific humidity, and ω is the pressure velocity at 500 hPa. The overbar denotes the mean state of the LIA, and the prime is the difference between the PWP and the LIA (PMP minus LIA). The first and second terms on the right-hand side of Equation (1) denote the GMP change induced by circulation and moisture anomalies, respectively. The third term denotes a non-linear process.
The GMP changes induced by circulation and moisture anomalies in these different experiments are shown in Figure 3a. The non-linear term in Equation (1) is one order of magnitude smaller than the other two terms on the right-hand side, and can be neglected. To compare the responses to each individual external forcing, the results are all normalized by respective global-mean temperature anomalies in each case. Under the full-forcing, the GMP increase is mainly caused by a moisture anomaly, while the circulation is weakened and tends to decrease the GMP (Figure 3a).
Under the GHG forcing (Figure 4a), the GMP intensification is induced by a moisture increase of 3.8 × 10⁻⁵ Pa s−1 °C−1, because the contribution of circulation change is negative (−1.3 × 10⁻⁵ Pa s−1 °C−1). This result is consistent with the finding in previous work by which under the GHG-induced global warming the GMP is enhanced by the wetter atmosphere, while the circulation is weakened [54]. Under solar-induced global warming, similar results are obtained; that is, the GMP increase is caused by a moisture anomaly rather than by a negative circulation anomaly. For one degree of global warming, the moisture-anomaly-induced GMP in the solar experiment is 4.5 × 10⁻⁵ Pa s−1 °C−1, which is stronger than that in the GHG experiment. In the volcano experiment (Figure 4a), the moisture anomaly also contributes greatly, by 83%, to the GMP increase. By contrast with the other two sensitivity experiments, the GMP change induced by the circulation anomaly is positive in the volcano experiment because the circulation is enhanced.
These results show that solar radiation is more efficient in increasing the GMP than the GHG, mainly by increasing moisture. Volcanic eruption is the most efficient forcing changing the GMP among the three external forcing experiments. The reason is that under the global warming induced by reduced volcanic eruptions, circulation is enhanced; however, the circulation is weakened by GHG and solar forcing.
Figure 4b,c show the moisture- and circulation-anomaly-induced GMP changes for the NH and SH subsystems. In the full-forcing experiment, the GMP increase mainly occurs in the NH. Although the moisture increase contributes to the GMP increase in both NH and SH subsystems, the GMP reduction induced by the divergent circulation is much stronger in the SH than in the NH. Under the GHG forcing, the stronger GMP increase in the SH than in the NH is caused by both a larger moisture anomaly and weaker divergent circulation in the SH than in the NH. Under the solar forcing, the stronger GMP increase in the NH than in the SH is caused by the circulation difference in these two subsystems, and the divergent circulation in the SH is much stronger than that in the NH. When the volcanic forcing is reduced, the NH GMP is increased because the circulation is convergent and the moisture is increased. In the SH, however, moisture is increased but the circulation is divergent. It seems that strong solar radiation and reduced volcanic eruptions tend to cause stronger divergent circulation in the SH to counter the SH GMP increase.
To further understand these different GMP responses, we want to answer the following questions: (1) Why is the solar radiation more efficient at enhancing tropical moisture than the GHG forcing? (2) What causes the strong convergent circulation anomaly in the NH and divergent circulation anomaly in the SH when volcanic forcing is reduced?

3.3. Mechanisms

First, we examine why the solar forcing is more efficient in increasing tropical moisture than the GHG forcing. The precipitation spatial distribution is shown in Figure 5. The increased GMP is more efficient under solar forcing (Figure 5c,d) than GHG forcing (Figure 5a,b) for both boreal summer and boreal winter. Figure 4a shows that this difference between the two experiments is mainly induced by the moisture difference.
Figure 6 shows the difference of zonal-mean surface temperature and moisture between the PWP and LIA in the GHG and solar experiments. The low-latitude warming caused by strong solar forcing is stronger than that caused by strong GHG forcing no matter for boreal summer or winter (Figure 6a,b), resulting in stronger moisture increase in the monsoon regions under the solar radiation-induced global warming than under the GHG-induced global warming (Figure 5c,d). We conjectured that the weaker polar amplification induced by solar forcing is mainly due to the Earth’s curvature, which lets the high latitude receive smaller amount of solar radiation than the tropical region. However, to further investigate this issue, sensitivity experiments on the Earth receiving uniform solar forcing are needed. These could confirm whether the polar amplification effect would be the same as it is now if the poles were exposed to the same amount of solar radiation. The GHG forcing excites strong high-latitude warming in the NH for both summer and winter seasons, and this Arctic amplification is robust, consistent with many previous works [56,57]. Thus, the GHG forcing tends to warm high-latitude regions where the mean moisture is low, while the solar forcing causes more warming of low-latitude regions, resulting in a large moisture increase in the monsoon regions.
The other question is why the GHG forcing produces less GMP increase in the NH than in the SH, while the solar forcing has the opposite responses. Under the global warming induced by the GHG forcing, there are El Niño-like SST responses in both boreal summer and winter (Figure 7a,b). La Niña-like SST responses, however, are excited by strong solar radiation in boreal summer and boreal winter (Figure 7c,d). Although the global water vapor is increased because of higher temperature, this east–west thermal contrast seems to have different responses on the NH and SH GMP changes, i.e., the La Niña-like SST response prefers to increase the NH GMP, while the El Niño-like response tends to enhance the SH GMP. In the observation, the La Niña-like SST pattern has been found to increase the NH GMP rather than to increase the SH GMP [5]. The NHSM circulation index during 1985–2011 is well correlated with the mega-ENSO index (r = 0.77). More specifically, the eastern Pacific cooling and the western Pacific warming are consistent with the strengthening of the Pacific subtropical highs in the Northern and Southern hemispheres and their associated trade winds (Figure 3 in their paper), causing moisture to converge into the Asian and African monsoon regions and thus contributing to the intensification of NHSM rainfall. These different SST responses to natural solar and anthropogenic GHG forcing are also simulated by the Hamburg atmosphere–ocean coupled circulation model ECHO-G [52]. More specifically, the GHG forcing increased atmospheric static stability and weakened Walker circulation, which were accompanied by weaker SST gradient; this weak zonal circulation hypothesis is supported by the Intergovernmental Panel on Climate Change (IPCC) model projection for the 21st century [58,59]. The solar forcing increased heating at the surface and warmed the SST in the west because the heating in the east was offset by the upwelling of cold water, via “ocean dynamic thermostat” [60,61,62]. A stronger Walker circulation was then induced by this strong SST gradient; in turn, this strong zonal atmospheric overturning circulation enhanced the SST gradient through the “Bjerknes feedback”.
Different responses in sub-monsoon systems may be caused by the meridional distribution of the volcanic aerosols in the stratosphere [33]. Figure 8 shows the zonally-averaged volcanic aerosols and surface temperature anomaly between PWP and LIA. In the volcanic dataset of [43], the aerosols of the frequent eruptions during the LIA were mainly located in the tropics, with the maximum value at 15° N. The most important feature of this aerosol distribution is that the aerosol concentration in the NH was higher than that in the SH for both boreal summer (Figure 8a) and boreal winter (Figure 8b), resulting in strong inter-hemispheric thermal contrast. Under the global warming induced by the reduction of volcanic eruption, the NH warming is much larger than the SH warming; thus, the equatorial southerly wind anomaly causes strong convergence anomaly in the NH monsoon region, while the divergence anomaly in the SH monsoon region results in GMP increase in the NH and decrease in the SH (Figure 8). Similar results were obtained on the interannual time scale: the NH eruptions tend to reduce the NH GMP while enhancing the SH GMP within a few years after the eruption, mainly through changing the circulation [33].
Figure 9 shows the horizontal distributions of surface temperature with wind, precipitation and circulation anomalies under the global warming induced by the reduction of volcanic eruptions. East–west asymmetric La Niña-like SST responses are excited by weak volcanic activity in both boreal summer and winter (Figure 9a,b). The clear warming spatial pattern in the NH compared with the SH (Figure 9a,b) and enhanced Asian and North American monsoon precipitation in response to La Niña SST (Figure 9c,d) are shown. During the boreal summer (Figure 9c), the Asian monsoon is enhanced, associated with strong westerly wind anomalies over the northern Indian Ocean. The strong anticyclone over south-eastern Asia and the western North Pacific reduces the precipitation over south-eastern Asia. Associated with this anticyclone, a strong Pacific–Japan (PJ) pattern [63,64] appears, and the south-easterly wind anomaly to the south of Japan transports moisture to enhance the precipitation over eastern and northern China. The North American monsoon is also enhanced, with strong wind convergence (Figure 9a,e). Associated with these enhanced North American and southern Asian monsoons, strong divergence occurs over the North African monsoon (Figure 9e), and precipitation is significantly decreased there (Figure 9c). During the boreal winter, the SH GMP change is location-dependent (Figure 9d). The Australian monsoon is strongly suppressed, except that its northern ocean part experiences enhanced precipitation. The precipitation over the inland part of South American and South African monsoons is slightly enhanced, surrounded by dry anomalies.

4. Summary and Discussion

We investigate GMP changes in response to individual GHG, solar and volcanic forcing in this study, by performing millennium experiments using CESM1. The cold LIA and warm PWP can be simulated in each experiment forced by individual external forcing (Figure 1), and the warm PWP’s major contribution comes from the GHG forcing. The results show that the global monsoon domain is quite stable for different periods under different forcings (Figure 3); thus, we can compare the GMP change between the PWP and LIA induced by different external forcings.
Knowing the ratio of GMP change to global-mean surface temperature change under different external forcings is important for our understanding of global monsoon dynamics and prediction. Our results show that solar radiation is more efficient at changing the GMP than the GHG forcing (Figure 4 and Figure 5), mainly because the former tends to warm low-latitude regions and moisten the troposphere, while the latter tends to warm the dry high-latitude region (Figure 6). The solar forcing also causes a stronger NH GMP increase than the SH GMP increase by exciting a La Niña-like SST response, while the GHG forcing excites the opposite response through exciting an El Niño-like SST response (Figure 7).
Volcanic eruption is found to be the most efficient forcing in changing the GMP among these three external forcing experiments, mainly through changing the NH GMP (Figure 4). The stronger aerosol reduction in the PWP happens in the NH rather than in the SH, resulting in strong inter-hemispheric thermal contrast. Thus, both enhanced moisture anomaly and convergent wind anomaly in the NH monsoon regions enhance the NH GMP (Figure 8 and Figure 9). Two other forcing factors enhance the GMP mainly through moistening the troposphere while inducing divergent circulation.
These results should give us a new perspective on global warming, which is mainly induced by anthropogenic GHG, while allowing this to be compared with future volcanic eruptions and solar radiation changes. In this work, we only consider symmetrical external forcing. The GHG forcing and volcanic forcing both have asymmetrical structures; the former will appear in the upcoming CMIP6 report, and the latter has been found to have a distinct impact on climate variability [33,40]. Due to this, further work is needed.

Acknowledgments

This research was supported by the National Natural Science Foundation of China (41420104002), the China National 973 Project (2015CB453200), and the Natural Science Foundation of Jiangsu (BK20150907, 14KJA170002). This paper is ESMC Contribution No. 210.

Author Contributions

F.L., J.C. and J.L. initiated the research. J.L. worked on experimental design and numerical integrations. All authors contributed to the research and wrote the manuscripts. All the figures are drawn by J.C.

Conflicts of Interest

The authors declare no conflict of interest.

References

  1. Wang, B.; Kim, H.J.; Kikuchi, K.; Kitoh, A. Diagnostic metrics for evaluation of annual and diurnal cycles. Clim. Dyn. 2011, 37, 941–955. [Google Scholar] [CrossRef]
  2. Trenberth, K.E.; Stepaniak, D.P.; Caron, J.M. The global monsoon as seen through the divergent atmospheric circulation. J. Clim. 2000, 13, 3969–3993. [Google Scholar] [CrossRef]
  3. Trenberth, K.E.; Stepaniak, D.P. The flow of energy through the Earth's climate system. Q. J. R. Meteorol. Soc. 2004, 130, 2677–2701. [Google Scholar] [CrossRef]
  4. Wang, B.; Ding, Q. Changes in global monsoon precipitation over the past 56 years. Geophys. Res. Lett. 2006, 33. [Google Scholar] [CrossRef]
  5. Wang, B.; Liu, J.; Kim, H.J.; Webster, P.J.; Yim, S.Y.; Xiang, B. Northern Hemisphere summer monsoon intensified by mega-El Niño/southern oscillation and Atlantic multidecadal oscillation. Proc. Natl. Acad. Sci. USA 2013, 110, 5347–5352. [Google Scholar] [CrossRef] [PubMed]
  6. Wang, B.; Liu, J.; Kim, H.-J.; Webster, P.J.; Yim, S.-Y. Recent change of the global monsoon precipitation (1979–2008). Clim. Dyn. 2012, 39, 1123–1135. [Google Scholar] [CrossRef]
  7. Wang, P.X.; Wang, B.; Cheng, H.; Fasullo, J.; Guo, Z.; Kiefer, T.; Liu, Z.Y. The global monsoon across time scales: Mechanisms and outstanding issues. Earth-Sci. Rev. 2017, 174, 84–121. [Google Scholar] [CrossRef]
  8. Hsu, P.C.; Li, T.; Tsou, C.H. Interactions between Boreal Summer Intraseasonal Oscillations and Synoptic-Scale Disturbances over the Western North Pacific. Part I: Energetics Diagnosis. J. Clim. 2011, 24, 927–941. [Google Scholar] [CrossRef]
  9. Kamae, Y.; Li, X.; Xie, S.P.; Ueda, H. Atlantic effects on recent decadal trends in global monsoon. Clim. Dyn. 2017, 49, 1–13. [Google Scholar] [CrossRef]
  10. Liu, Z. Dynamics of Interdecadal Climate Variability: A Historical Perspective. J. Clim. 2012, 25, 1963–1995. [Google Scholar] [CrossRef]
  11. Kosaka, Y.; Xie, S.-P. Recent global-warming hiatus tied to equatorial Pacific surface cooling. Nature 2013, 501, 403–407. [Google Scholar] [CrossRef] [PubMed]
  12. Dai, A. Increasing drought under global warming in observations and models. Nat. Clim. Chang. 2013, 3, 52–58. [Google Scholar] [CrossRef]
  13. Fyfe, J.C.; Gillett, N.P.; Zwiers, F.W. Overestimated global warming over the past 20 years. Nat. Clim. Chang. 2013, 3, 767–769. [Google Scholar] [CrossRef]
  14. Taylor, K.E.; Stouffer, R.J.; Meehl, G.A. An overview of CMIP5 and the experiment design. Bull. Am. Meteorol. Soc. 2011, 93, 485–498. [Google Scholar] [CrossRef]
  15. Hoerling, M.; Hurrell, J.; Eischeid, J.; Phillips, A. Detection and Attribution of Twentieth-Century Northern and Southern African Rainfall Change. J. Clim. 2014, 19, 3989–4008. [Google Scholar] [CrossRef]
  16. Liu, F.; Zhao, T.; Wang, B.; Liu, J.; Luo, W. Different global precipitation responses to solar, volcanic and greenhouse gas forcings. J. Geophys. Res. Atmos. 2017. under review. [Google Scholar]
  17. Lee, J.-Y.; Wang, B. Future change of global monsoon in the CMIP5. Clim. Dyn. 2014, 42, 101–119. [Google Scholar] [CrossRef]
  18. Chou, C.; Tu, J.Y.; Tan, P.H. Asymmetry of tropical precipitation change under global warming. Geophys. Res. Lett. 2007, 34. [Google Scholar] [CrossRef]
  19. Kitoh, A.; Endo, H.; Kumar, K.K.; Cavalcanti, I.F.A.; Goswami, P.; Zhou, T. Monsoons in a changing world: A regional perspective in a global context. J. Geophys. Res. Atmos. 2013, 118. [Google Scholar] [CrossRef]
  20. Endo, H.; Kitoh, A. Thermodynamic and dynamic effects on regional monsoon rainfall changes in a warmer climate. Geophys. Res. Lett. 2014, 41, 1704–1710. [Google Scholar] [CrossRef]
  21. Cherchi, A.; Alessandri, A.; Masina, S.; Navarra, A. Effects of increased CO2 levels on monsoons. Clim. Dyn. 2011, 37, 83–101. [Google Scholar] [CrossRef] [Green Version]
  22. Liu, J.; Wang, B.; Ding, Q.; Kuang, X.; Soon, W.; Zorita, E. Centennial variations of the global monsoon precipitation in the last millennium: Results from ECHO-G model. J. Clim. 2009, 22, 2356–2371. [Google Scholar] [CrossRef]
  23. Li, H.; Zhou, T.; Li, C. Decreasing trend in global land monsoon precipitation over the past 50 years simulated by a coupled climate model. Adv. Atmos. Sci. 2010, 27, 285–292. [Google Scholar] [CrossRef]
  24. Song, F.; Zhou, T.; Qian, Y. Responses of East Asian summer monsoon to natural and anthropogenic forcings in the 17 latest CMIP5 models. Geophys. Res. Lett. 2014, 41, 596–603. [Google Scholar] [CrossRef]
  25. Polson, D.; Bollasina, M.; Hegerl, G.C.; Wilcox, L.J. Decreased monsoon precipitation in the Northern Hemisphere due to anthropogenic aerosols. Geophys. Res. Lett. 2014, 41, 6023–6029. [Google Scholar] [CrossRef]
  26. Liu, J.; Wang, B.; Yim, S.-Y.; Lee, J.-Y.; Jhun, J.-G.; Ha, K.-J. What drives the global summer monsoon over the past millennium? Clim. Dyn. 2012, 39, 1063–1072. [Google Scholar] [CrossRef]
  27. Agnihotri, R.; Dutta, K.; Bhushan, R.; Somayajulu, B.L.K. Evidence for solar forcing on the Indian monsoon during the last millennium. Earth Planet. Sci. Lett. 2002, 198, 521–527. [Google Scholar] [CrossRef]
  28. Kutzbach, J.E.; Ottobliesner, B.L. The Sensitivity of the African-Asian Monsoonal Climate to Orbital Parameter Changes for 9000 Years B.P. in a Low-Resolution General Circulation Model. J. Atmos. Sci. 1982, 39, 1177–1188. [Google Scholar] [CrossRef]
  29. Liu, Z.; Ottobliesner, B.; Kutzbach, J.; Li, L.; Shields, C. Coupled climate simulation of the evolution of global monsoons in the Holocene. J. Clim. 2003, 16, 2472–2490. [Google Scholar] [CrossRef]
  30. Kutzbach, J.E. Monsoon climate of the early Holocene: Climate experiment with the Earth’s orbital parameters for 9000 years ago. Science 1981, 214, 59–61. [Google Scholar] [CrossRef] [PubMed]
  31. Liu, Z.; Harrison, S.P.; Kutzbach, J.; Otto-Bliesner, B. Global monsoons in the mid-Holocene and oceanic feedback. Clim. Dyn. 2004, 22, 157–182. [Google Scholar] [CrossRef]
  32. Robock, A. Volcanic eruptions and climate. Rev. Geophys. 2000, 38, 191–219. [Google Scholar] [CrossRef]
  33. Liu, F.; Chai, J.; Wang, B.; Liu, J.; Zhang, X.; Wang, Z. Global monsoon precipitation responses to large volcanic eruptions. Sci. Rep. 2016, 6, 24331. [Google Scholar] [CrossRef] [PubMed]
  34. Haywood, J.M.; Jones, A.; Bellouin, N.; Stephenson, D. Asymmetric forcing from stratospheric aerosols impacts Sahelian rainfall. Nat. Clim. Chang. 2013, 3, 660–665. [Google Scholar] [CrossRef]
  35. Kim, H.J.; Wang, B.; Ding, Q. The global monsoon variability simulated by CMIP3 coupled climate models. J. Clim. 2007, 21, 5271–5294. [Google Scholar] [CrossRef]
  36. Ning, L.; Liu, J.; Sun, W. Influences of volcano eruptions on Asian Summer Monsoon over the last 110 years. Sci. Rep. 2017, 7, 42626. [Google Scholar] [CrossRef] [PubMed]
  37. Man, W.; Zhou, T.; Jungclaus, J.H. Effects of large volcanic eruptions on global summer climate and East Asian monsoon changes during the last millennium: Analysis of MPI-ESM Simulations. J. Clim. 2014, 27, 7394–7409. [Google Scholar] [CrossRef]
  38. Zhuo, Z.; Gao, C.; Pan, Y. Proxy evidence for China’s monsoon precipitation response to volcanic aerosols over the past seven centuries. J. Geophys. Res. Atmos. 2014, 119, 6638–6652. [Google Scholar] [CrossRef]
  39. Pausata, F.S.; Chafik, L.; Caballero, R.; Battisti, D.S. Impacts of high-latitude volcanic eruptions on ENSO and AMOC. Proc. Natl. Acad. Sci. USA 2015, 112, 13784–13788. [Google Scholar] [CrossRef] [PubMed]
  40. Liu, F.; Li, J.; Wang, B.; Liu, J.; Li, T.; Huang, G.; Wang, Z. Divergent El Niño responses to volcanic eruptions at different latitudes over the past millennium. Clim. Dyn. 2017. [Google Scholar] [CrossRef]
  41. Rosenbloom, N.; Otto-Bliesner, B.; Brady, E.; Lawrence, P. Simulating the mid-Pliocene Warm Period with the CCSM4 model. Geosci. Model Dev. 2013, 6, 549–561. [Google Scholar] [CrossRef]
  42. Shapiro, A.I.; Schmutz, W.; Rozanov, E.; Schoell, M.; Haberreiter, M.; Shapiro, A.V.; Nyeki, S. A new approach to the long-term reconstruction of the solar irradiance leads to large historical solar forcing. Astron. Astrophys. 2011, 529, A69. [Google Scholar] [CrossRef]
  43. Gao, C.; Robock, A.; Ammann, C. Correction to “Volcanic forcing of climate over the past 1500 years: An improved ice core–based index for climate models&rdquo. J. Geophys. Res. Atmos. 2008, 113, 2036–2044. [Google Scholar]
  44. Meure, M.F.; Etheridge, D.; Trudinger, C.; Steele, P.; Langenfelds, R.; Ommen, T.V.; Smith, A.; Elkins, J. Law Dome CO2, CH4 and N2O ice core records extended to 2000 years BP. Geophys. Res. Lett. 2006, 33, 70–84. [Google Scholar]
  45. Wang, B. Climatic regimes of tropical convection and rainfall. J. Clim. 1994, 7, 1109–1130. [Google Scholar] [CrossRef]
  46. Wang, B.; Ding, Q. Global monsoon: Dominant mode of annual variation in the tropics. Dyn. Atmos. Oceans 2008, 44, 165–183. [Google Scholar] [CrossRef]
  47. Lee, J.Y.; Wang, B.; Kang, I.S.; Shukla, J.; Kumar, A.; Kug, J.S.; Schemm, J.K.E.; Luo, J.J.; Yamagata, T.; Fu, X. How are seasonal prediction skills related to models' performance on mean state and annual cycle? Clim. Dyn. 2010, 35, 267–283. [Google Scholar] [CrossRef]
  48. Miller, G.H.; Geirsdóttir, Á.; Zhong, Y.; Larsen, D.J.; Otto-Bliesner, B.L.; Holland, M.M.; Bailey, D.A.; Refsnider, K.A.; Lehman, S.J.; Southon, J.R. Abrupt onset of the Little Ice Age triggered by volcanism and sustained by sea-ice/ocean feedbacks. Geophys. Res. Lett. 2012, 39, 2708. [Google Scholar] [CrossRef]
  49. Andrews, T.; Forster, P.M.; Boucher, O.; Bellouin, N.; Jones, A. Precipitation, radiative forcing and global temperature change. Geophys. Res. Lett. 2010, 37, 227–235. [Google Scholar] [CrossRef]
  50. Cao, L.; Caldeira, K.; Bala, G. Fast adjustment of the climate system to changes in atmospheric CO2 and solar radiation. In Proceedings of the AGU Fall Meeting, San Francisco, CA, USA, 5–9 December 2011. [Google Scholar]
  51. Iles, C.E.; Hegerl, G.C.; Schurer, A.P.; Zhang, X. The effect of volcanic eruptions on global precipitation. J. Geophys. Res. Atmos. 2013, 118, 8770–8786. [Google Scholar] [CrossRef]
  52. Liu, J.; Wang, B.; Cane, M.A.; Yim, S.Y.; Lee, J.Y. Divergent global precipitation changes induced by natural versus anthropogenic forcing. Nature 2013, 493, 656–659. [Google Scholar] [CrossRef] [PubMed]
  53. Wu, P.; Christidis, N.; Stott, P. Anthropogenic impact on Earth's hydrological cycle. Nat. Clim. Chang. 2013, 3, 807–810. [Google Scholar] [CrossRef]
  54. Hsu, P.-C.; Li, T.; Luo, J.-J.; Murakami, H.; Kitoh, A.; Zhao, M. Increase of global monsoon area and precipitation under global warming: A robust signal? Geophys. Res. Lett. 2012, 39. [Google Scholar] [CrossRef]
  55. Huang, P.; Xie, S.-P.; Hu, K.; Huang, G.; Huang, R. Patterns of the seasonal response of tropical rainfall to global warming. Nat. Geosci. 2013, 6, 357–361. [Google Scholar] [CrossRef]
  56. Pithan, F.; Mauritsen, T. Arctic amplification dominated by temperature feedbacks in contemporary climate models. Nat. Geosci. 2014, 7, 181–184. [Google Scholar] [CrossRef]
  57. Zhang, L.; Li, T. A simple analytical model for understanding the formation of sea surface temperature patterns under global warming. J. Clim. 2014, 27, 8413–8421. [Google Scholar] [CrossRef]
  58. Vecchi, G.A.; Soden, B.J. Global warming and the weakening of the tropical circulation. J. Clim. 2006, 20, 1529–1530. [Google Scholar] [CrossRef]
  59. Vecchi, G.A.; Clement, A.; Soden, B.J. Examining the tropical Pacific's response to global warming. EOS Trans. Am. Geophys. Union 2008, 89, 81–83. [Google Scholar] [CrossRef]
  60. Clement, A.C.; Seager, R.; Cane, M.A.; Zebiak, S.E. An ocean dynamical thermostat. J. Clim. 1996, 9, 2190–2196. [Google Scholar] [CrossRef]
  61. Cane, M.A.; Clement, A.C.; Kaplan, A.; Kushnir, Y.; Pozdnyakov, D.; Seager, R.; Zebiak, S.E.; Murtugudde, R. Twentieth-century sea surface temperature trends. Science 1997, 275, 957–960. [Google Scholar] [CrossRef] [PubMed]
  62. Bauer, E.; Brovkin, V.; Claussen, M. Assessing climate forcings of the Earth system for the past millennium. Geophys. Res. Lett. 2003. [Google Scholar] [CrossRef]
  63. Nitta, T. Convective activities in the tropical western Pacific and their impact on the Northern Hemisphere summer circulation. J. Meteorol. Soc. Jpn. 1987, 65, 373–390. [Google Scholar] [CrossRef]
  64. Huang, R.H.; Sun, F.Y. Impacts of the tropical western Pacific on the East Asian summer monsoon. J. Meteorol. Soc. Jpn. 1992, 70, 243–256. [Google Scholar] [CrossRef]
Figure 1. Responses to different external forcing. Shown are the 31-year running-mean time series of external forcing (thick black curve in bd) and simulated global-mean surface temperature (thick red curve) and global-mean precipitation (thick blue curve) under (a) all-four forcing; (b) greenhouse gas (GHG) forcing; (c) solar forcing; and (d) volcanic forcing. The annual-mean global-mean surface temperature (thin red curve), global mean precipitation (thin blue curve) and two typical periods (1250–1850 for Little Ice Age (LIA), pale blue shade and 1900–2000 for Present Warm Period (PWP), lavender shade) are also shown.
Atmosphere 09 00136 g001
Figure 2. Global monsoon precipitation (GMP) domain and precipitation. Comparison of the GMP maps obtained by using (a) PWP (1900–2000) and (b) LIA (1250–1850) minus pre-industrial climatology (500–1850) in full forcing run. The monsoon domain is those regions where the annual range (local summer mean minus winter mean) of precipitation rate exceeds 2.0 mm/day and the local summer precipitation exceeds 55% of the annual total. Here, local summer is defined as May through September (MJJAS) for the NH and November through next March (NDJFM) for the SH. Stippling indicates statistical significance (10% significance level) based on t-test.
Atmosphere 09 00136 g002
Figure 3. GMP domain and annual reversal of precipitation. Global monsoon domain in different external forcing run during the LIA, PWP (thick black contours) and domain average (bold grey contour). Shading shows the climatological-mean MJJAS-minus-NDJFM precipitation. The GMP domain is defined by local summer-minus-winter precipitation rate exceeding 2.0 mm/d and the local summer precipitation exceeding 55% of the annual total.
Atmosphere 09 00136 g003
Figure 4. Decomposition of precipitation change in different external forcing run. The x-axis represents q ¯ ω , q ω ¯ , and their sum ( Δ P ) in all forcing (blue), GHG forcing (black), solar forcing (yellow), and volcanic forcing (red) for GM (a), NHSM (b) and SHSM (c) Each field is scaled to have the same global-mean temperature anomaly (PWP minus LIA) as the full forcing.
Atmosphere 09 00136 g004
Figure 5. Horizontal distribution of precipitation change. Shown are the spatial patterns of the change of precipitation (shading) and the change of 850-hPa wind (vector) in boreal summer (a,c) and boreal winter (b,d) under the GHG (a,b) or solar (c,d) forcing between PWP and LIA. Each field is scaled to have the same global-mean temperature anomaly (PWP minus LIA) as the full forcing. Stippling indicates statistical significance (10% significance level) based on t-test.
Atmosphere 09 00136 g005
Figure 6. Meridional distributions of temperature and moisture change. Shown are zonal-mean changes of surface temperature (left panel) and moisture (right panel) in boreal summer (a,c) and boreal winter (b,d) under GHG (black) or solar (red) forcing. Each curve is scaled to have the same global-mean temperature anomaly (PWP minus LIA) as the full forcing. Statistically significant (10% significance level) based on t-test are indicated by crosses.
Atmosphere 09 00136 g006
Figure 7. Horizontal distribution of temperature change. Shown are the spatial patterns of the change of surface temperature (shading) and the change of 850-hPa wind (vector) in boreal summer (a,c) and boreal winter (b,d) under the GHG (a,b) or solar (c,d) forcing between PWP and LIA. Each field is scaled to have the same global-mean temperature anomaly (PWP minus LIA) as the full forcing. Most of the temperature changes are significant; thus, we do not show the significance test.
Atmosphere 09 00136 g007
Figure 8. Meridional distributions of temperature and aerosols column density change. Shown are the difference between PWP and LIA of zonal-mean surface temperature (red line) and aerosols column density (black line) in the boreal summer (a) and boreal winter (b) under volcanic forcing. Statistical significance (10% significance level) based on t-test is indicated by red crosses.
Atmosphere 09 00136 g008
Figure 9. Horizontal distributions of surface temperature, precipitation and circulation changes. Shown are the spatial patterns of the change of surface temperature (shading) and the change of 850-hPa wind (vector) in (a) boreal summer and (b) boreal winter under the volcanic forcing (PWP minus LIA). Precipitation and circulation changes are also shown in (c,e) boreal summer and (d,f) boreal winter. Each field is scaled to have the same global-mean temperature anomaly (PWP minus LIA) as the full forcing. Statistical significance (10% significance level) based on t-test is indicated by black dots.
Atmosphere 09 00136 g009
Table 1. Simulated differences of monsoon-mean(global-mean) precipitation and global-mean temperature between PWP and LIA, and monsoon-mean(global-mean) precipitation rate versus global-mean temperature.
PWP-LIAMonsoon-Mean (Global-Mean) Precipitation (mm Day−1)Global-Mean Temperature (°C)mm day−1/°C
All0.20 (0.035)0.610.33 (0.057)
GHG0.12 (0.022)0.420.29 (0.051)
Solar0.058 (0.010)0.140.41 (0.072)
Volcanic0.055 (0.0063)0.070.79 (0.09)
Table 2. Simulated differences of monsoon-mean precipitation (including Northern Hemisphere summer monsoon and Southern Hemisphere summer monsoon) between PWP and LIA for per Celsius degree temperature change.
PWP-LIANHSM (mm day−1/°C)SHSM (mm day−1/°C)
All0.260.06
GHG0.0980.19
Solar0.310.11
Volcanic0.86−0.064

