Variation in Soil Properties Regulate Greenhouse Gas Fluxes and Global Warming Potential in Three Land Use Types on Tropical Peat


Abstract
:1. Introduction
2. Materials and Methods
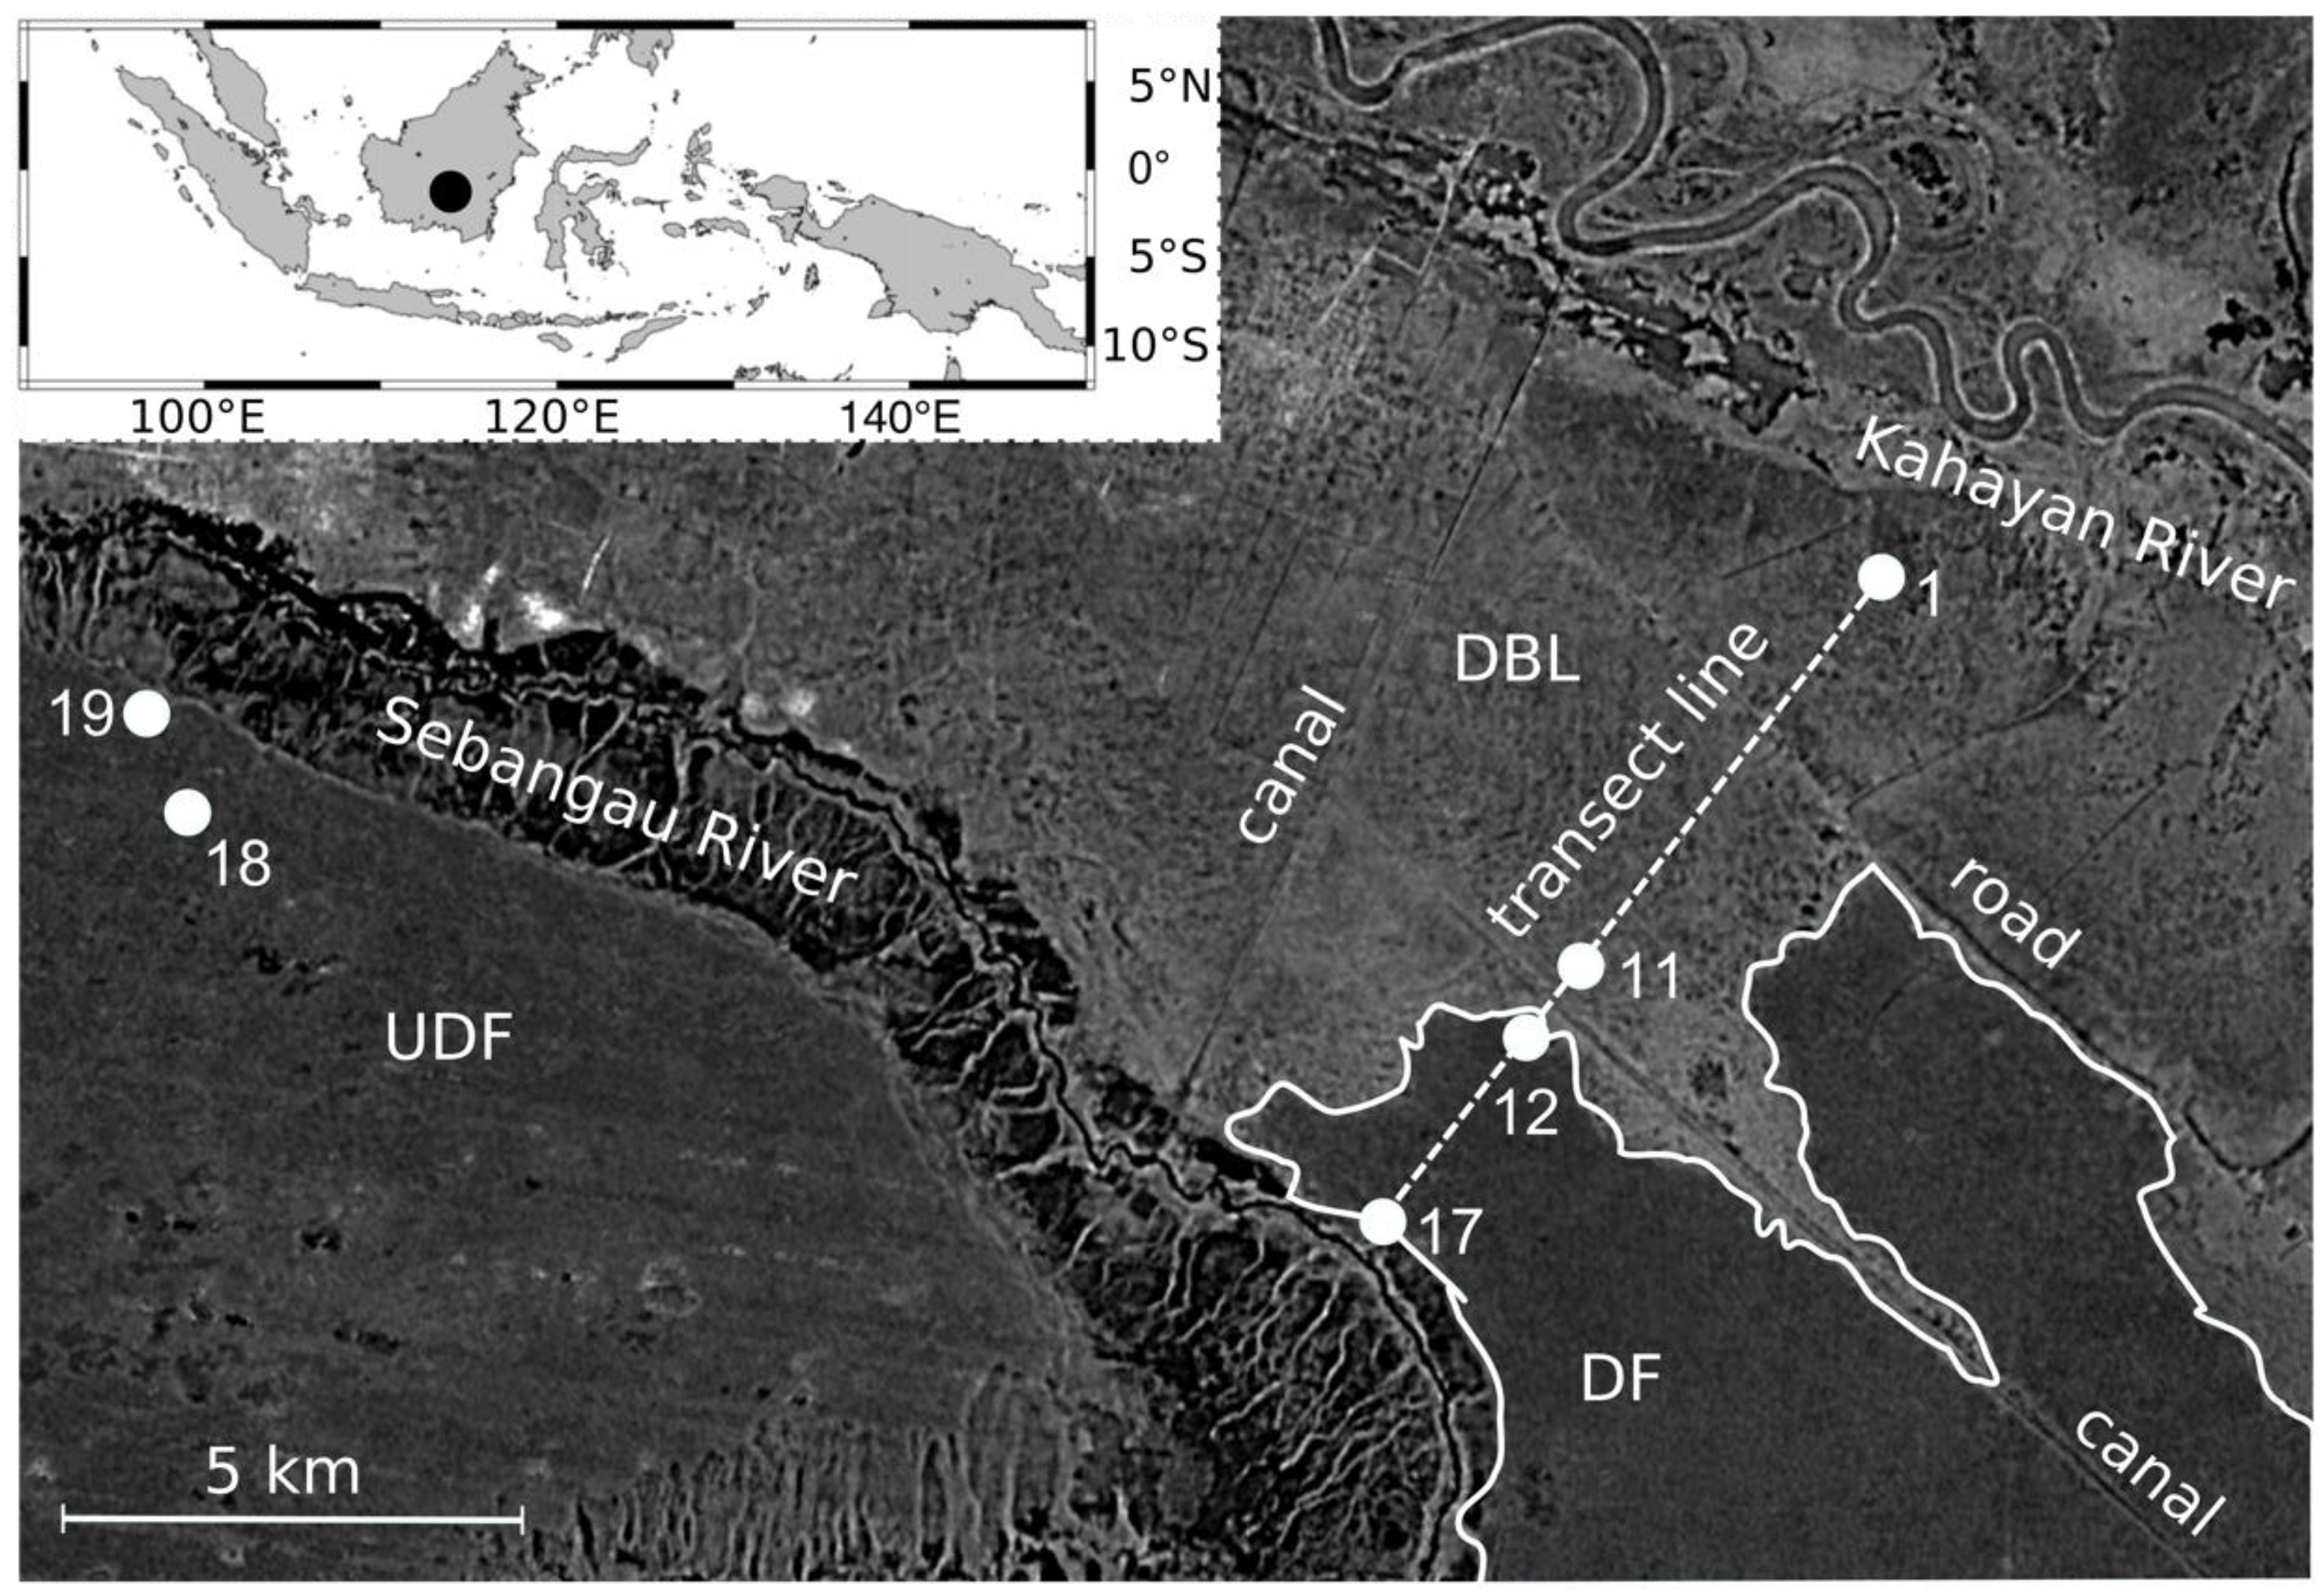
2.1. Site Description
2.2. Greenhouse Gas Flux and Environmental Variables
2.3. Statistical Analysis
3. Results
3.1. Environmental Variables
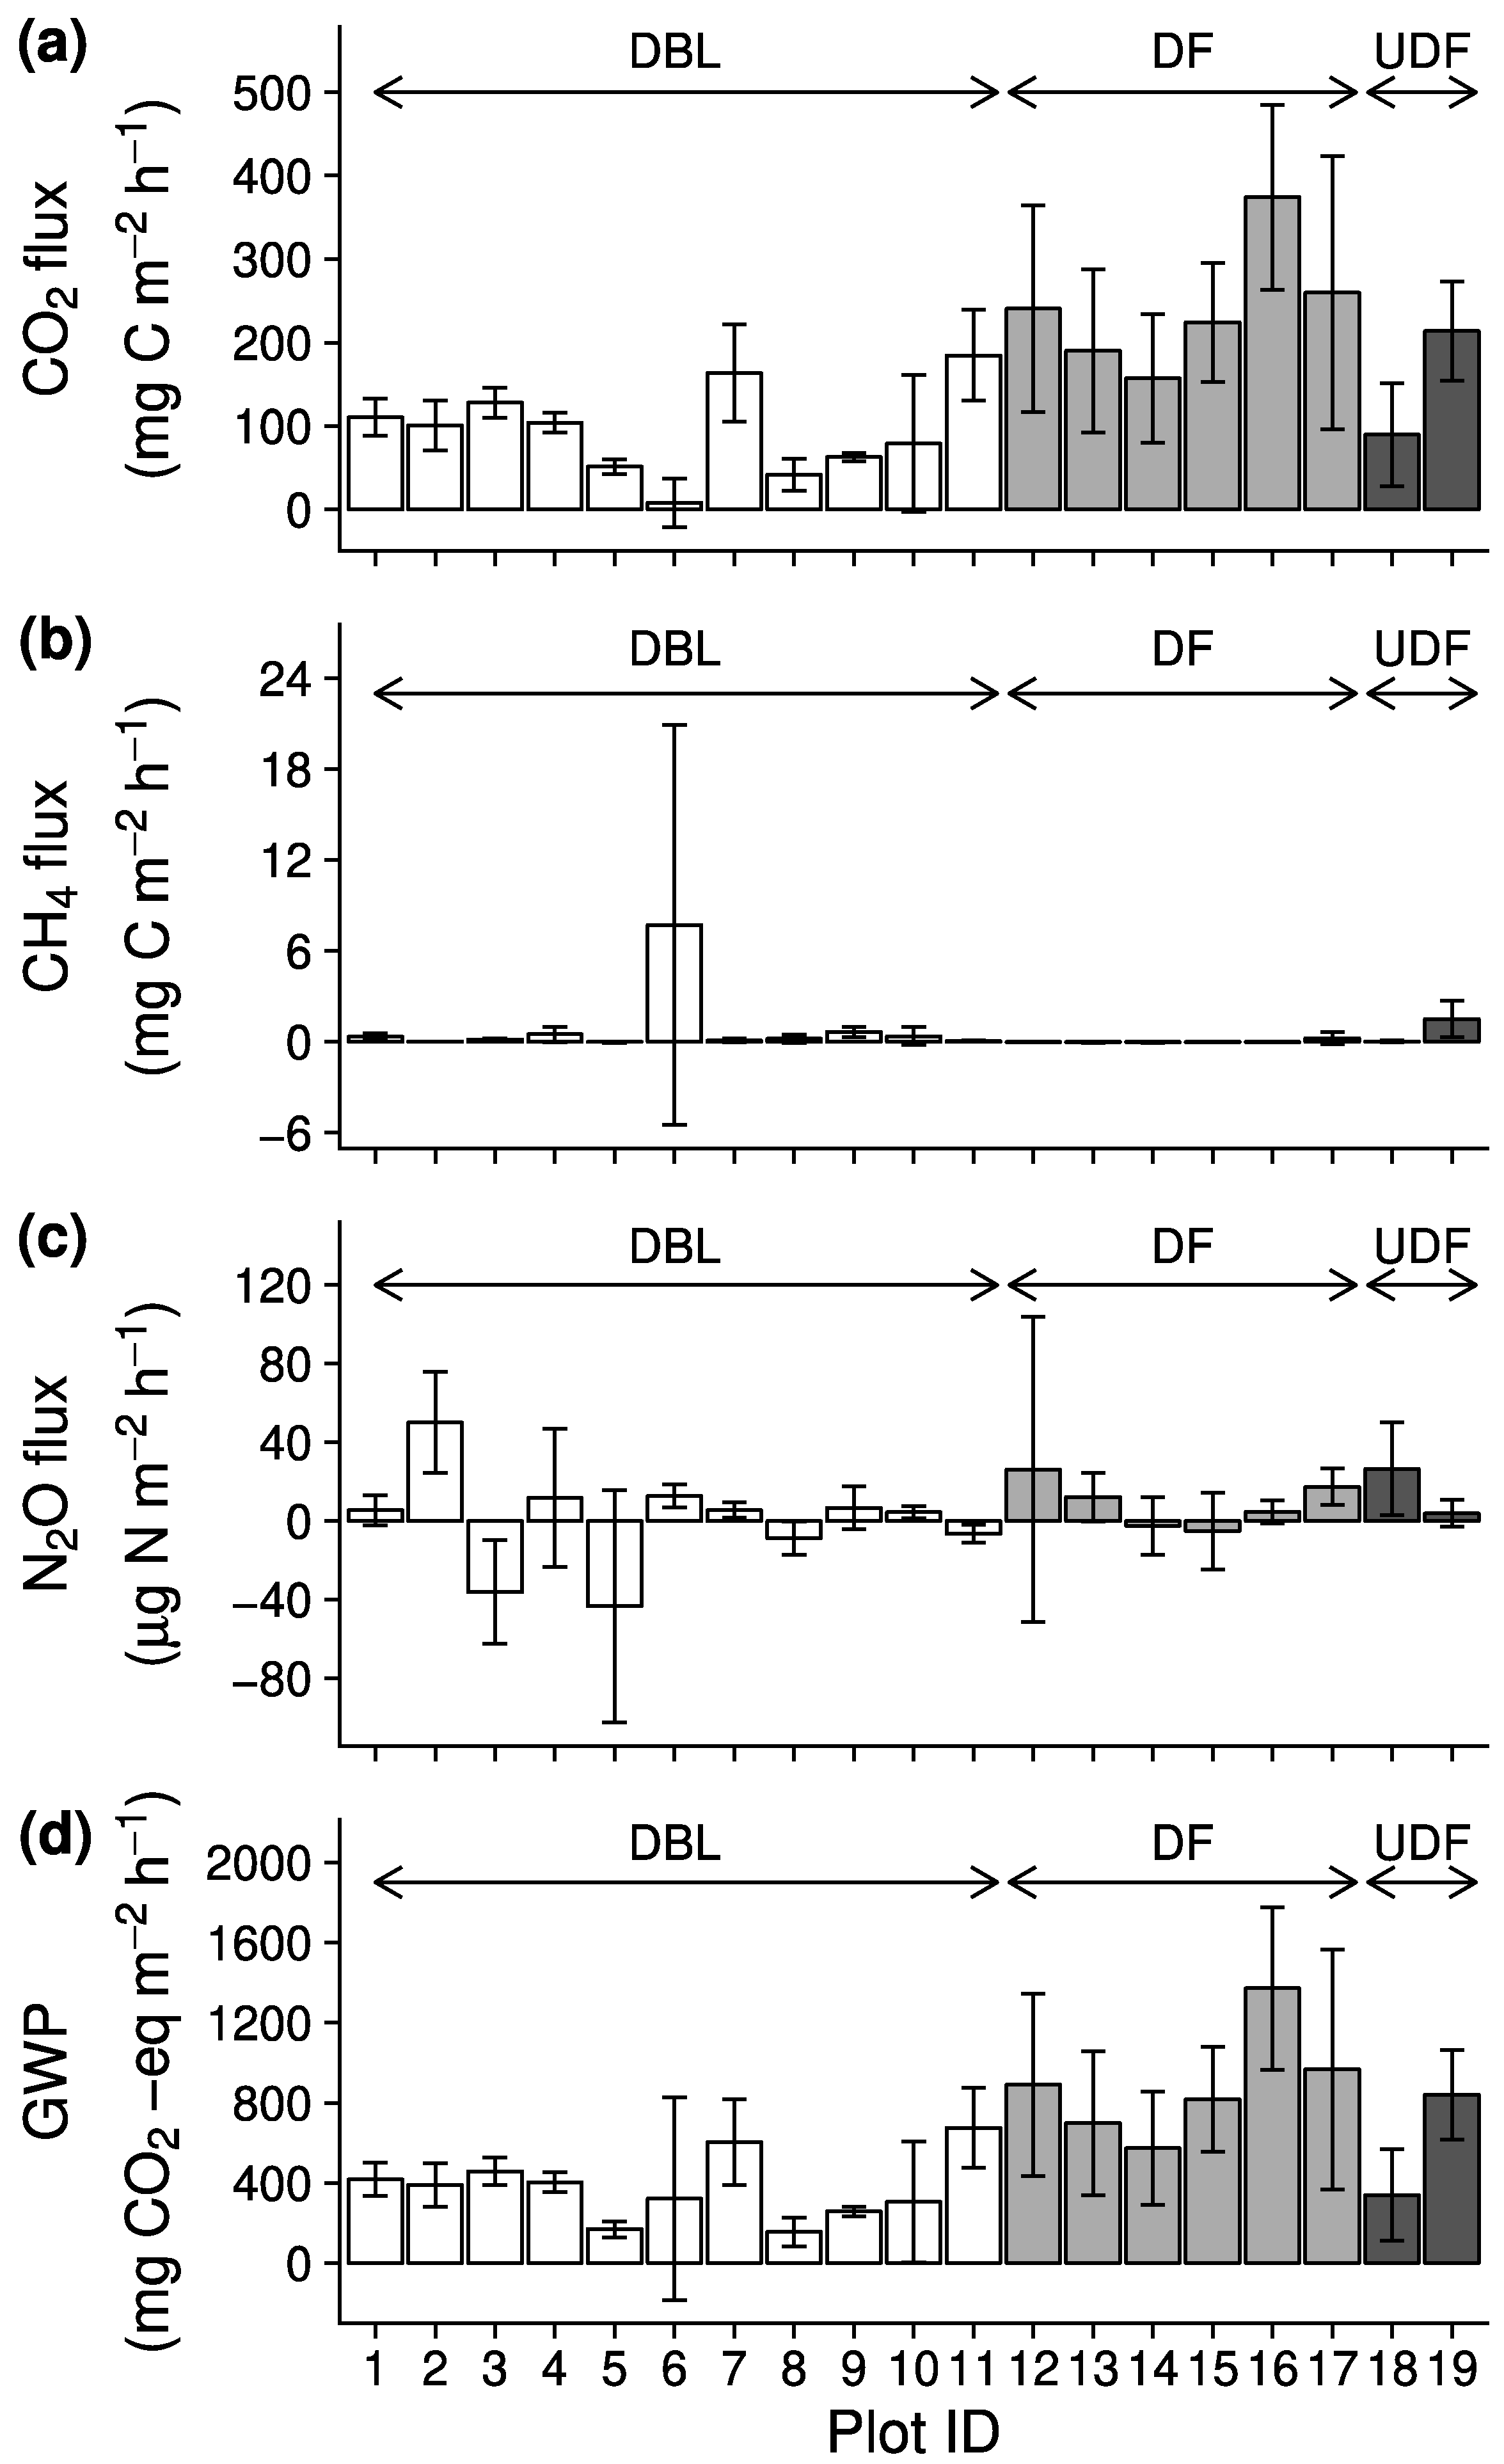
3.2. Greenhouse Gas Flux and Global Warming Potential
4. Discussion
4.1. Factors Controling Greenhouse Gas Fluxes
4.2. Effect of Different Land Use Types on Greenhouse Gas Fluxes
5. Conclusions
Author Contributions
Funding
Acknowledgments
Conflicts of Interest
References
- Page, S.E.; Wust, R.A.J.; Weiss, D.; Rieley, J.O.; Shotyk, W.; Limin, S.H. A record of Late Pleistocene and Holocene carbon accumulation and climate change from an equatorial peat bog (Kalimantan, Indonesia): Implications for past, present and future carbon dynamics. J. Quat. Sci. 2004, 19, 625–635. [Google Scholar] [CrossRef]
- Kurnianto, S.; Warren, M.; Talbot, J.; Kauffman, B.; Murdiyarso, D.; Frolking, S. Carbon accumulation of tropical peatlands over millennia: A modeling approach. Glob. Chang. Biol. 2015, 21, 431–444. [Google Scholar] [CrossRef] [PubMed]
- Maltby, E.; Immirzi, P. Carbon dynamics in peatlands and other wetland soils regional and global perspectives. Chemosphere 1993, 27, 999–1023. [Google Scholar] [CrossRef]
- Page, S.E.; Rieley, J.O.; Banks, C.J. Global and regional importance of the tropical peatland carbon pool. Glob. Chang. Biol. 2011, 17, 798–818. [Google Scholar] [CrossRef] [Green Version]
- Dargie, G.C.; Lewis, S.L.; Lawson, I.T.; Mitchard, E.T.A.; Page, S.E.; Bocko, Y.E.; Ifo, S.A. Age, extent and carbon storage of the central Congo Basin peatland complex. Nature 2017, 542, 86–90. [Google Scholar] [CrossRef] [PubMed] [Green Version]
- Page, S.E.; Siegert, F.; Rieley, J.O.; Boehm, H.D.V.; Jaya, A.; Limin, S. The amount of carbon released from peat and forest fires in Indonesia during 1997. Nature 2002, 420, 61–65. [Google Scholar] [CrossRef] [PubMed]
- Miettinen, J.; Shi, C.; Liew, S.C. Land cover distribution in the peatlands of Peninsular Malaysia, Sumatra and Borneo in 2015 with changes since 1990. Glob. Ecol. Conserv. 2016, 6, 67–78. [Google Scholar] [CrossRef]
- Miettinen, J.; Hooijer, A.; Vernimmen, R.; Liew, S.C.; Page, S.E. From carbon sink to carbon source: Extensive peat oxidation in insular Southeast Asia since 1990. Environ. Res. Lett. 2017, 12, 024014. [Google Scholar] [CrossRef]
- Page, S.E.; Baird, A.J. Peatlands and global change: Response and resilience. Annu. Rev. Environ. Resour. 2016, 41, 35–57. [Google Scholar] [CrossRef]
- van der Werf, G.R.; Morton, D.C.; DeFries, R.S.; Olivier, J.G.J.; Kasibhatla, P.S.; Jackson, R.B.; Collatz, G.J.; Randerson, J.T. CO2 emissions from forest loss. Nat. Geosci. 2009, 2, 737–738. [Google Scholar] [CrossRef]
- Ishikura, K.; Yamada, H.; Toma, Y.; Takakai, F.; Morishita, T.; Darung, U.; Limin, A.; Limin, S.H.; Hatano, R. Effect of groundwater level fluctuation on soil respiration rate of tropical peatland in Central Kalimantan, Indonesia. Soil Sci. Plant Nutr. 2017, 63, 1–13. [Google Scholar] [CrossRef]
- Ishikura, K.; Hirano, T.; Okimoto, Y.; Hirata, R.; Kiew, F.; Melling, L.; Aeries, E.B.; Lo, K.S.; Musin, K.K.; Waili, J.W.; et al. Soil carbon dioxide emissions due to oxidative peat decomposition in an oil palm plantation on tropical peat. Agric. Ecosyst. Environ. 2018, 254, 202–212. [Google Scholar] [CrossRef]
- Melling, L.; Hatano, R.; Goh, K.J. Soil CO2 flux from three ecosystems in tropical peatland of Sarawak, Malaysia. Tellus 2005, 57, 1–11. [Google Scholar]
- Itoh, M.; Okimoto, Y.; Hirano, T.; Kusin, K. Factors affecting oxidative peat decomposition due to land use in tropical peat swamp forests in Indonesia. Sci. Total Environ. 2017, 609, 906–915. [Google Scholar] [CrossRef] [PubMed]
- Wakhid, N.; Hirano, T.; Okimoto, Y.; Nurzakiah, S.; Nursyamsi, D. Soil carbon dioxide emissions from a rubber plantation on tropical peat. Sci. Total Environ. 2017, 581–582, 857–865. [Google Scholar] [CrossRef] [PubMed]
- Melling, L.; Yun Tan, C.S.; Goh, K.J.; Hatano, R. Soil microbial and root respirations from three ecosystems in tropical peatland of Sarawak, Malaysia. J. Oil Palm Res. 2013, 25, 44–57. [Google Scholar]
- Jauhiainen, J.; Hooijer, A.; Page, S.E. Carbon dioxide emissions from an Acacia plantation on peatland in Sumatra, Indonesia. Biogeosciences 2012, 9, 617–630. [Google Scholar] [CrossRef] [Green Version]
- Inubushi, K.; Furukawa, Y.; Hadi, A.; Purnomo, E.; Tsuruta, H. Seasonal changes of CO2, CH4 and N2O fluxes in relation to land-use change in tropical peatlands located in coastal area of South Kalimantan. Chemosphere 2003, 52, 603–608. [Google Scholar] [CrossRef]
- Adji, F.F.; Hamada, Y.; Darung, U.; Limin, S.H.; Hatano, R. Effect of plant-mediated oxygen supply and drainage on greenhouse gas emission from a tropical peatland in Central Kalimantan, Indonesia. Soil Sci. Plant Nutr. 2014, 60, 1–15. [Google Scholar] [CrossRef]
- Jauhiainen, J.; Limin, S.; Silvennoinen, H.; Vasander, H. Carbon dioxide and methane fluxes in drained tropical peat before and after hydrological restoration. Ecology 2008, 89, 3503–3514. [Google Scholar] [CrossRef] [PubMed]
- Jauhiainen, J.; Takahashi, H.; Heikkinen, J.E.P.; Martikainen, P.J.; Vasander, H. Carbon fluxes from a tropical peat swamp forest floor. Glob. Chang. Biol. 2005, 11, 1788–1797. [Google Scholar] [CrossRef]
- Sundari, S.; Hirano, T.; Yamada, H.; Kusin, K.; Limin, S. Effect of groundwater level on soil respiration in tropical peat swamp forests. J. Agric. Meteorol. 2012, 68, 121–134. [Google Scholar] [CrossRef] [Green Version]
- Girkin, N.T.; Turner, B.L.; Ostle, N.; Craigon, J.; Sjögersten, S. Root exudate analogues accelerate CO2 and CH4 production in tropical peat. Soil Biol. Biochem. 2018, 117, 48–55. [Google Scholar] [CrossRef]
- Tonks, A.J.; Aplin, P.; Beriro, D.J.; Cooper, H.; Evers, S.; Vane, C.H.; Sjögersten, S. Impacts of conversion of tropical peat swamp forest to oil palm plantation on peat organic chemistry, physical properties and carbon stocks. Geoderma 2017, 289, 36–45. [Google Scholar] [CrossRef] [Green Version]
- Upton, A.; Vane, C.H.; Girkin, N.; Turner, B.L.; Sjögersten, S. Does litter input determine carbon storage and peat organic chemistry in tropical peatlands? Geoderma 2018, 326, 76–87. [Google Scholar] [CrossRef]
- Toma, Y.; Takakai, F.; Darung, U.; Kuramochi, K.; Limin, S.H.; Dohong, S.; Hatano, R. Nitrous oxide emission derived from soil organic matter decomposition from tropical agricultural peat soil in central Kalimantan, Indonesia. Soil Sci. Plant Nutr. 2011, 57, 436–451. [Google Scholar] [CrossRef] [Green Version]
- Takakai, F.; Morishita, T.; Hashidoko, Y.; Darung, U.; Kuramochi, K.; Dohong, S.; Limin, S.H.; Hatano, R. Effects of agricultural land-use change and forest fire on N2O emission from tropical peatlands, Central Kalimantan, Indonesia. Soil Sci. Plant Nutr. 2006, 52, 662–674. [Google Scholar] [CrossRef]
- Kimura, S.D.; Melling, L.; Goh, K.J. Influence of soil aggregate size on greenhouse gas emission and uptake rate from tropical peat soil in forest and different oil palm development years. Geoderma 2012, 185, 1–5. [Google Scholar] [CrossRef]
- Couwenberg, J.; Dommain, R.; Joosten, H. Greenhouse gas fluxes from tropical peatlands in south-east Asia. Glob. Chang. Biol. 2010, 16, 1715–1732. [Google Scholar] [CrossRef]
- Lampela, M.; Jauhiainen, J.; Vasander, H. Surface peat structure and chemistry in a tropical peat swamp forest. Plant Soil 2014, 382, 329–347. [Google Scholar] [CrossRef]
- Sangok, F.E.; Maie, N.; Melling, L.; Watanabe, A. Evaluation on the decomposability of tropical forest peat soils after conversion to an oil palm plantation. Sci. Total Environ. 2017, 587–588, 381–388. [Google Scholar] [CrossRef] [PubMed]
- Inubushi, K.; Hadi, A.; Okazaki, M.; Yonebayashi, K. Effect of converting wetland forest to sage palm plantations on methane gas flux and organic carbon dynamics in tropical peat soil. Hydrol. Process. 1998, 12, 2073–2080. [Google Scholar] [CrossRef]
- 33. Hadi, A.; Fatah, L.; Syaifuddin; Abdullah; Affandi, D.N.; Bakar, R.A.; Inubushi, K. Greenhouse gas emissions from peat soils cultivated to rice field, oil palm and vegetable. J. Trop. Soils 2012, 17, 105–114. [Google Scholar]
- Murakami, M.; Furukawa, Y.; Inubushi, K. Methane production after liming to tropical acid peat soil. Soil Sci. Plant Nutr. 2005, 51, 697–699. [Google Scholar] [CrossRef]
- Linn, D.M.; Doran, J.W. Effect of water-filled pore space on carbon dioxide and nitrous oxide production in tilled and nontilled soils. Soil Sci. Soc. Am. J. 1984, 48, 1267. [Google Scholar] [CrossRef]
- Mukumbuta, I.; Uchida, Y.; Hatano, R. Evaluating the effect of liming on N2O fluxes from denitrification in an Andosol using the acetylene inhibition and 15N isotope tracer methods. Biol. Fertil. Soils 2018, 54, 71–81. [Google Scholar] [CrossRef]
- Jauhiainen, J.; Silvennoinen, H.; Hämäläinen, R.; Kusin, K.; Limin, S.; Raison, R.J.; Vasander, H. Nitrous oxide fluxes from tropical peat with different disturbance history and management. Biogeosciences 2012, 9, 1337–1350. [Google Scholar] [CrossRef] [Green Version]
- Miettinen, J.; Shi, C.; Liew, S.C. Deforestation rates in insular Southeast Asia between 2000 and 2010. Glob. Chang. Biol. 2011, 17, 2261–2270. [Google Scholar] [CrossRef]
- Miettinen, J.; Hooijer, A.; Shi, C.; Tollenaar, D.; Vernimmen, R.; Liew, S.C.; Malins, C.; Page, S.E. Extent of industrial plantations on Southeast Asian peatlands in 2010 with analysis of historical expansion and future projections. GCB Bioenergy 2012, 4, 908–918. [Google Scholar] [CrossRef] [Green Version]
- Hirano, T.; Jauhiainen, J.; Inoue, T.; Takahashi, H. Controls on the carbon balance of tropical peatlands. Ecosystems 2009, 12, 873–887. [Google Scholar] [CrossRef]
- Hooijer, A.; Page, S.; Jauhiainen, J.; Lee, W.A.; Lu, X.X.; Idris, A.; Anshari, G. Subsidence and carbon loss in drained tropical peatlands. Biogeosciences 2012, 9, 1053–1071. [Google Scholar] [CrossRef] [Green Version]
- Yulianti, N.; Hayasaka, H.; Usup, A. Recent forest and peat fire trends in Indonesia the latest decade by MODIS hotspot data. Glob. Environ. Res. 2012, 16, 105–116. [Google Scholar]
- Mackinnon, K.; Hatta, G.; Halim, H.; Mangalik, A. The ecology of Kalimantan; Periplus: Singapore, 1996; ISBN 0-945971-73-7. [Google Scholar]
- Hirano, T.; Segah, H.; Harada, T.; Limin, S.; June, T.; Hirata, R.; Osaki, M. Carbon dioxide balance of a tropical peat swamp forest in Kalimantan, Indonesia. Glob. Chang. Biol. 2007, 13, 412–425. [Google Scholar] [CrossRef]
- Soil Survey Staffs. Keys to Soil Taxonomy, 12th ed.; USDA-Natural Resources Conservation Service: Washington, DC, USA, 2014.
- Limin, S.H.; Jentha; Ermiasi, Y. History of the development of tropical peatland in Central Kalimantan, Indonesia. Tropics 2007, 16, 291–301. [Google Scholar] [CrossRef]
- Tuah, S.J.; Jamal, Y.M.; Limin, S.H. Nutritional characteristics in leaves of plants native to tropical peat swamps and heath forests of Central Kalimantan, Indonesia. Tropics 2003, 12, 221–245. [Google Scholar] [CrossRef] [Green Version]
- Page, S.E.; Rieley, J.O.; Shotyk, O.W.; Weiss, D. Interdependence of peat and vegetation in a tropical peat swamp forest. Philos. Trans. R. Soc. London Ser. B-Biol. Sci. 1999, 354, 1885–1897. [Google Scholar] [CrossRef] [PubMed]
- Mirmanto, E. Vegetation analyses of Sebangau peat swamp forest, Central Kalimantan. Biodiversitas 2010, 11, 82–88. [Google Scholar] [CrossRef]
- Nakano, T.; Sawamoto, T.; Morishita, T.; Inoue, G.; Hatano, R. A comparison of regression methods for estimating soil–atmosphere diffusion gas fluxes by a closed-chamber technique. Soil Biol. Biochem. 2004, 36, 107–113. [Google Scholar] [CrossRef]
- Mukumbuta, I.; Shimizu, M.; Jin, T.; Nagatake, A.; Hata, H.; Kondo, S.; Kawai, M.; Hatano, R. Nitrous and nitric oxide emissions from a cornfield and managed grassland: 11 years of continuous measurement with manure and fertilizer applications, and land-use change. Soil Sci. Plant Nutr. 2017, 63, 185–199. [Google Scholar] [CrossRef]
- IPCC. Climate Change 2013: The Physical Science Basis. Contribution of Working Group I to the Fifth Assessment Report of the Intergovernmental Panel on Climate Change; Stocker, T.F., Qin, D., Plattner, G.-K., Tignor, M., Allen, S.K., Boschung, J., Nauels, A., Xia, Y., Bex, V., Midgley, P.M., Eds.; Cambridge University Press: Cambridge, UK; New York, NY, USA, 2013. [Google Scholar]
- Akaike, H. Factor analysis and AIC. Psychometrika 1987, 52, 317–332. [Google Scholar] [CrossRef]
- R Core Team. R: A Language and Environment for Statistical Computing; R Foundation for Statistical Computing: Vienna, Austria, 2017. [Google Scholar]
- Hirano, T.; Kusin, K.; Limin, S.; Osaki, M. Carbon dioxide emissions through oxidative peat decomposition on a burnt tropical peatland. Glob. Chang. Biol. 2014, 20, 555–565. [Google Scholar] [CrossRef] [PubMed]
- Murayama, S.; Bakar, Z.A. Decomposition of tropical peat soils. 1. Decomposition kinetics of organic matter of peat soils. Jpn. Agric. Res. Q. 1996, 30, 145–151. [Google Scholar]
- Jauhiainen, J.; Kerojoki, O.; Silvennoinen, H.; Limin, S.; Vasander, H. Heterotrophic respiration in drained tropical peat is greatly affected by temperature—A passive ecosystem cooling experiment. Environ. Res. Lett. 2014, 9, 105013. [Google Scholar] [CrossRef]
- Inubushi, K.; Otake, S.; Furukawa, Y.; Shibasaki, N.; Ali, M.; Itang, A.M.; Tsuruta, H. Factors influencing methane emission from peat soils: Comparison of tropical and temperate wetlands. Nutr. Cycl. Agroecosyst. 2005, 71, 93–99. [Google Scholar] [CrossRef]
- Arai, H.; Hadi, A.; Darung, U.; Limin, S.H.; Hatano, R.; Inubushi, K. A methanotrophic community in a tropical peatland is unaffected by drainage and forest fires in a tropical peat soil. Soil Sci. Plant Nutr. 2014, 60, 577–585. [Google Scholar] [CrossRef] [Green Version]
- Šimek, M.; Cooper, J.E. The influence of soil pH on denitrification: Progress towards the understanding of this interaction over the last 50 years. Eur. J. Soil Sci. 2002, 53, 345–354. [Google Scholar] [CrossRef]
- Klemedtsson, L.; von Arnold, K.; Weslien, P.; Gundersen, P. Soil CN ratio as a scalar parameter to predict nitrous oxide emissions. Glob. Chang. Biol. 2005, 11, 1142–1147. [Google Scholar] [CrossRef]
- Aulakh, M.S.; Khera, T.S.; Doran, J.W. Mineralization and denitrification in upland, nearly saturated and flooded subtropical soil II. Effect of organic manures varying in N content and C:N ratio. Biol. Fert. Soils 2000, 31, 168–174. [Google Scholar] [CrossRef]
- Marwanto, S.; Watanabe, T.; Iskandar, W.; Sabiham, S.; Funakawa, S. Effects of seasonal rainfall and water table movement on the soil solution composition of tropical peatland. Soil Sci. Plant Nutr. 2018, 64, 386–395. [Google Scholar] [CrossRef]
- Hashidoko, Y.; Takakai, F.; Toma, Y.; Darung, U.; Melling, L.; Tahara, S.; Hatano, R. Emergence and behaviors of acid-tolerant Janthinobacterium sp. that evolves N2O from deforested tropical peatland. Soil Biol. Biochem. 2008, 40, 116–125. [Google Scholar] [CrossRef]
- Usup, A.; Hashimoto, Y.; Takahashi, H.; Hayasaka, H. Combustion and thermal characteristics of peat fire in tropical peatland in Central Kalimantan, Indonesia. Tropics 2004, 14, 1–19. [Google Scholar] [CrossRef] [Green Version]
- Ballhorn, U.W.E.; Siegert, F.; Mason, M.; Limin, S. Derivation of burn scar depths and estimation of carbon emissions with LIDAR in Indonesian peatlands. Proc. Natl. Acad. Sci. USA 2009, 106, 21213–21218. [Google Scholar] [CrossRef] [PubMed] [Green Version]
- Troxler, T.G.; Ikenaga, M.; Scinto, L.; Boyer, J.N.; Condit, R.; Perez, R.; Gann, G.D.; Childers, D.L. Patterns of soil bacteria and canopy community structure related to tropical peatland development. Wetlands 2012, 32, 769–782. [Google Scholar] [CrossRef]
- Bodelier, P.L.E.; Laanbroek, H.J. Nitrogen as a regulatory factor of methane oxidation in soils and sediments. FEMS Microbiol. Ecol. 2004, 47, 265–277. [Google Scholar] [CrossRef] [Green Version]
- Könönen, M.; Jauhiainen, J.; Straková, P.; Heinonsalo, J.; Laiho, R.; Kusin, K.; Limin, S.; Vasander, H. Deforested and drained tropical peatland sites show poorer peat substrate quality and lower microbial biomass and activity than unmanaged swamp forest. Soil Biol. Biochem. 2018, 123, 229–241. [Google Scholar] [CrossRef]
- Wright, E.L.; Black, C.R.; Turner, B.L.; Sjögersten, S. Environmental controls of temporal and spatial variability in CO2 and CH4 fluxes in a neotropical peatland. Glob. Chang. Biol. 2013, 19, 3775–3789. [Google Scholar] [CrossRef] [PubMed]
- Melling, L.; Hatano, R.; Goh, K.J. Global warming potential from soils in tropical peatland of Sarawak, Malaysia. Phyton-Ann. Rei Bot. 2005, 45, 275–284. [Google Scholar]
- Ritzema, H.; Limin, S.; Kusin, K.; Jauhiainen, J.; Wösten, H. Canal blocking strategies for hydrological restoration of degraded tropical peatlands in Central Kalimantan, Indonesia. Catena 2014, 114, 11–20. [Google Scholar] [CrossRef]
- Susilo, G.E.; Yamamoto, K.; Imai, T.; InoueE, T.; Takahashi, H.; Ishii, Y.; Fukami, H.; Koizumi, K.; Kusin, K. Effect of canal damming on the surface water level stability in the tropical peatland area. J. Water Environ. Technol. 2013, 11, 263–274. [Google Scholar] [CrossRef]
- Katimon, A.; Melling, L. Moisture Retention Curve of Tropical Sapric and Hemic Peat. Malaysian J. Civ. Eng. 2007, 19, 84–90. [Google Scholar]


| Property | DBL (n = 11) | DF (n = 6) | UDF (n = 2) |
|---|---|---|---|
| GWL (m) | −0.08 ± 0.07a | −0.44 ± 0.14b | −0.16 ± 0.07 |
| WFPS (m3 m−3) | 0.99 ± 0.02a | 0.60 ± 0.06b | 1.00 ± 0.00 |
| Soil temperature (°C) | 29.9 ± 1.6a | 26.7 ± 0.5b | 25.3 ± 0.7 |
| Peat thickness (m) | 3.9 ± 0.6 | 3.4 ± 1.6 | 2.9 ± 1.8 |
| Total C (g C kg−1) | 542 ± 26a | 513 ± 15b | 555 ± 8 |
| Total N (g N kg−1) | 17.8 ± 3.5b | 22.2 ± 1.3a | 18.6 ± 0.8 |
| C:N ratio † | 32 ± 11a | 23 ± 2b | 30 ± 1 |
| pH (H2O) | 3.8 ± 0.4 | 3.6 ± 0.1 | 3.9 ± 0.1 |
| EC (mS m−1) † | 5.7 ± 4.0 | 10.7 ± 5.1 | 1.9 ± 0.1 |
| NH4+ (mg N kg−1) † | 7.4 ± 4.4b | 40.7 ± 24.7a | 0.7 ± 0.3 |
| NO3− (mg N kg−1) † | 5.0 ± 8.5b | 23.2 ± 21.3a | 25.7 ± 7.7 |
| Greenhouse Gas Flux | DBL | DF | UDF |
|---|---|---|---|
| (n = 11) | (n = 6) | (n = 2) | |
| CO2 (mg C m−2 h−1) | 94 ± 53 (91)a | 241 ± 75 (100)b | 152 ± 88 (94) |
| CH4 (mg C m−2 h−1) † | 0.91 ± 2.26 (9)b | 0.01 ± 0.11 (0)a | 0.76 ± 1.03 (5) |
| N2O (µg N m−2 h−1) | 0.1 ± 25.0 (0) | 8.7 ± 12.1 (0) | 15.2 ± 16.0 (1) |
| GWP (mg CO2-eq m−2 h−1) | 378 ± 162a | 886 ± 275b | 590 ± 354 |
| Target | Land Use | Equation | p-Value | R2 | AIC |
|---|---|---|---|---|---|
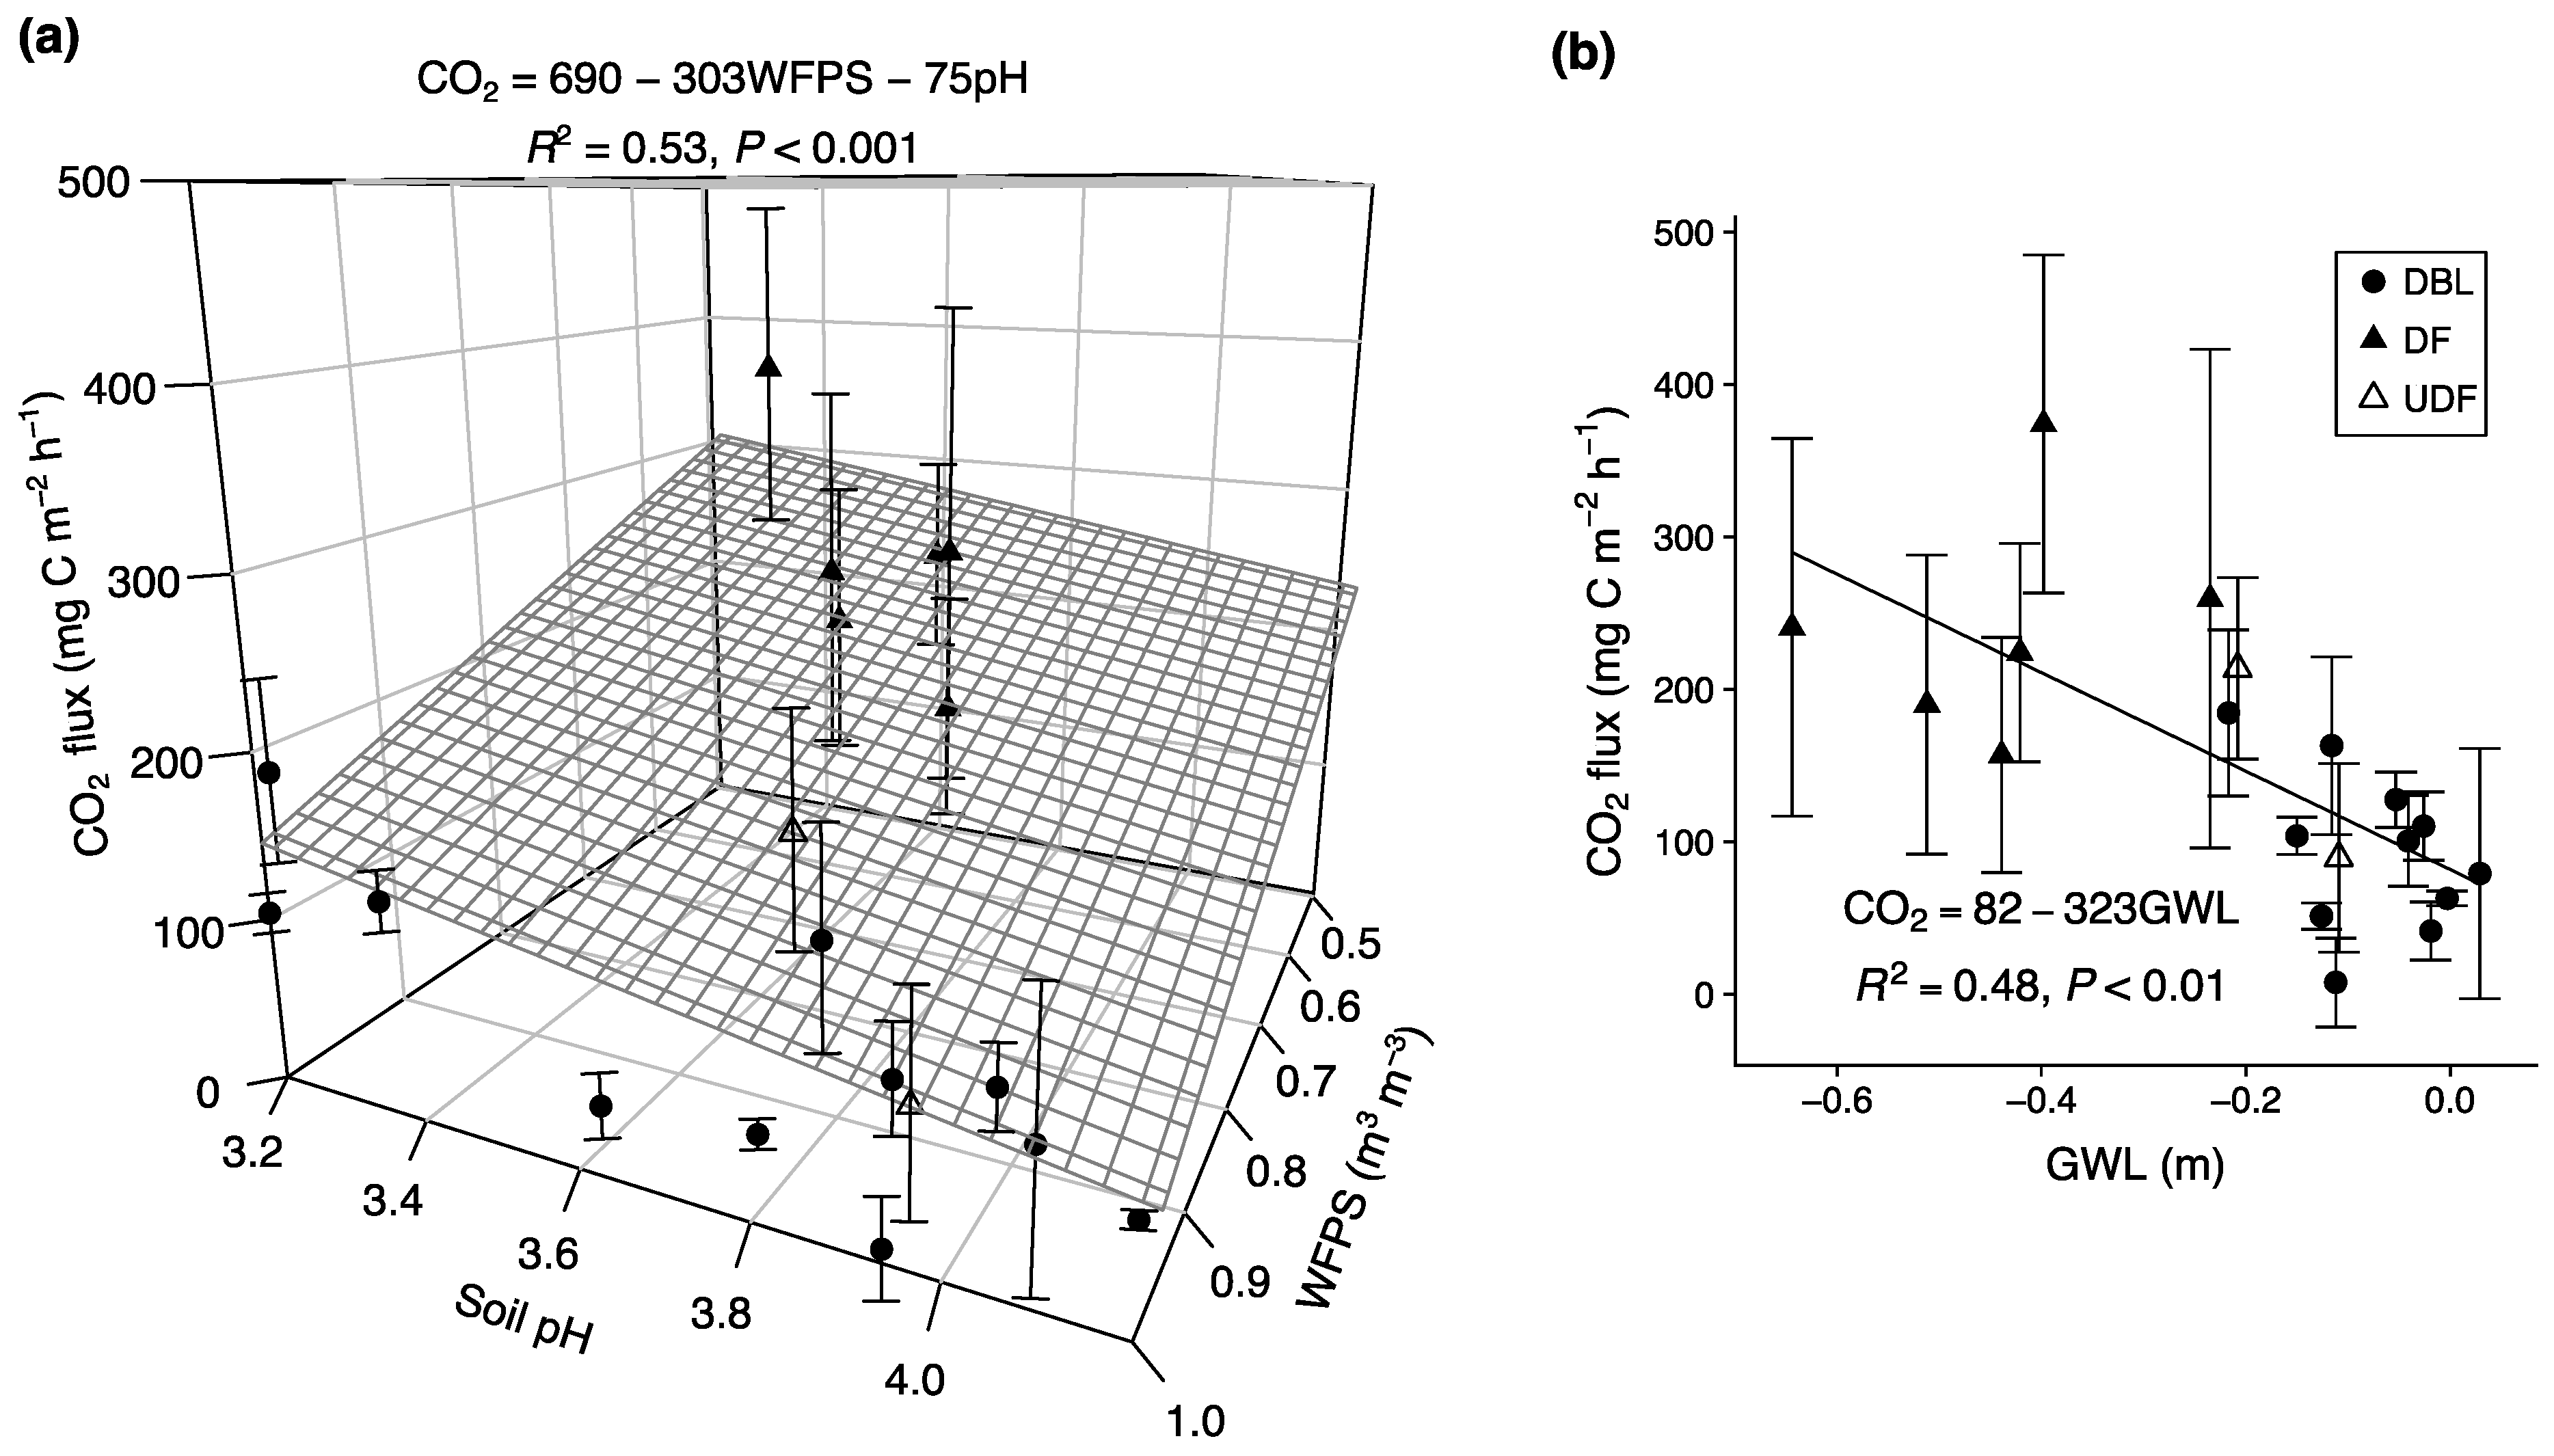
| CO2 flux | All | CO2 = 690 − 303 × WFPS − 75 × pH | <0.001 | 0.53 | 216 |
| All | CO2 = 82 − 323 × GWL | <0.01 | 0.45 | 218 | |
| All | Null model | 228 | |||
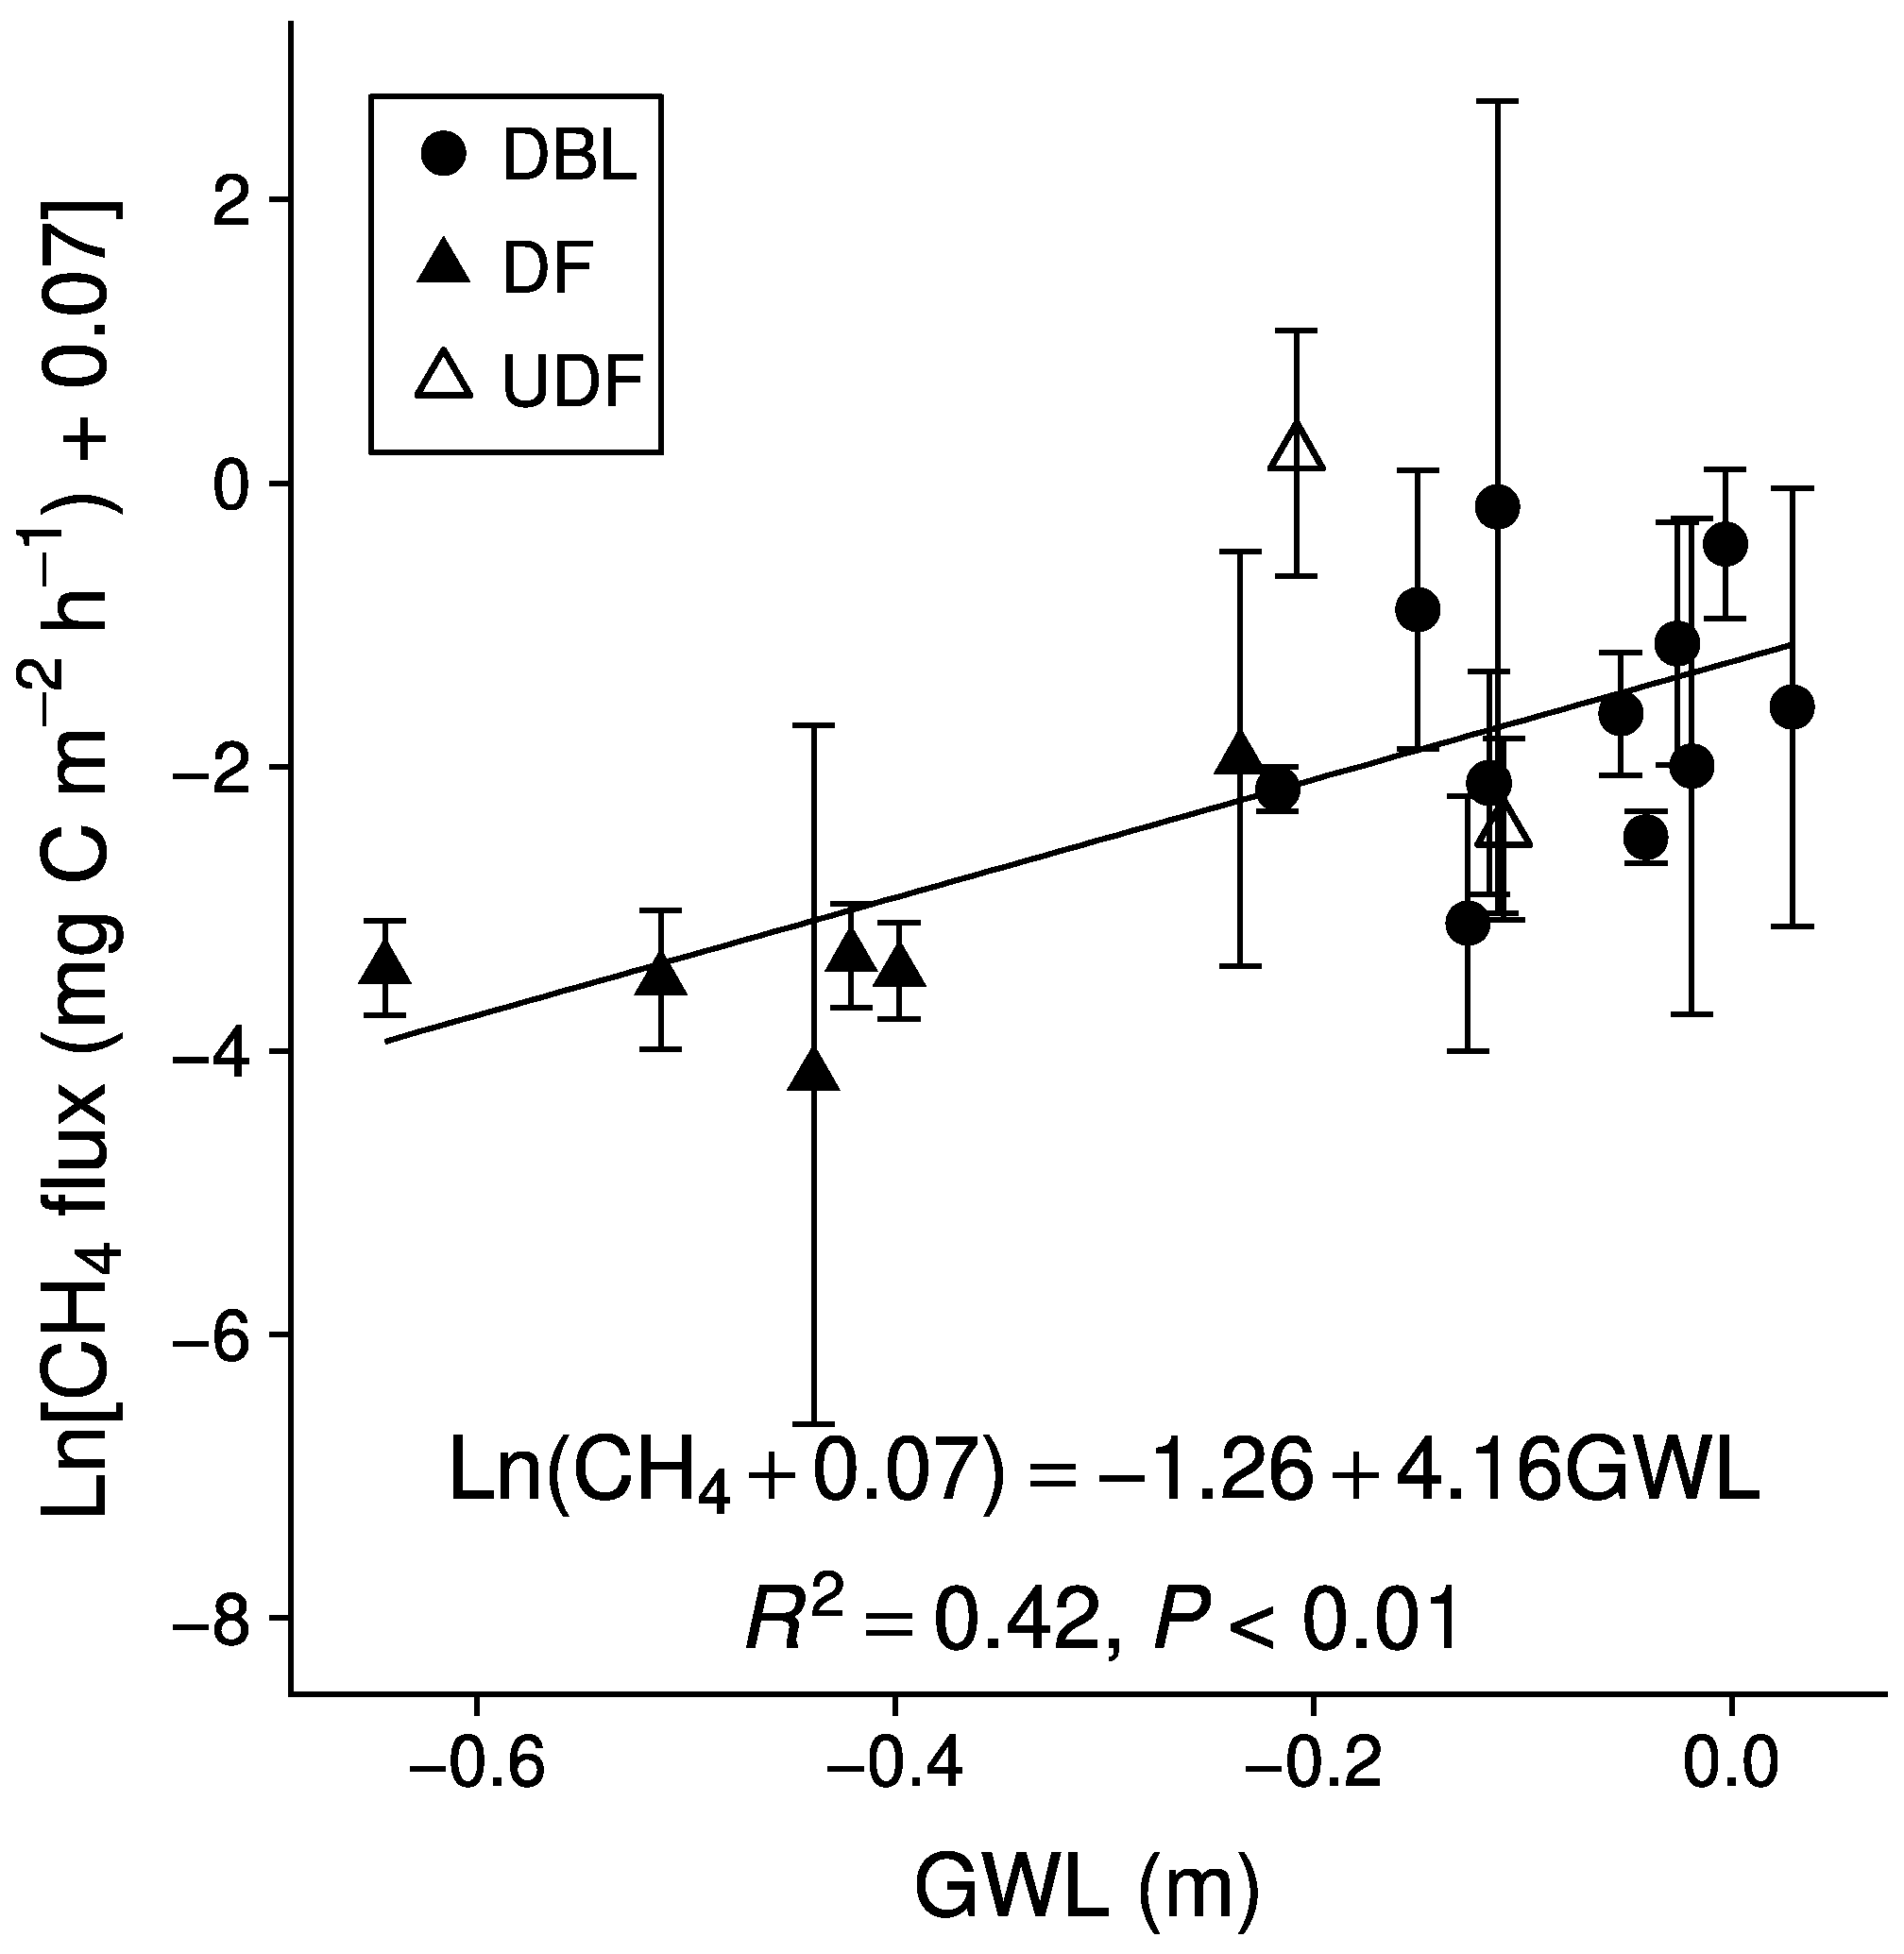
| CH4 flux | All | Ln[CH4 + 0.07] = −1.26 + 4.16 × GWL | <0.01 | 0.42 | 56 |
| All | Null model | 65 | |||
| N2O flux | All | N2O = −64.0 −1.37 × C:N + 29.2 × pH | <0.05 | 0.35 | 166 |
| All | Null model | 172 | |||
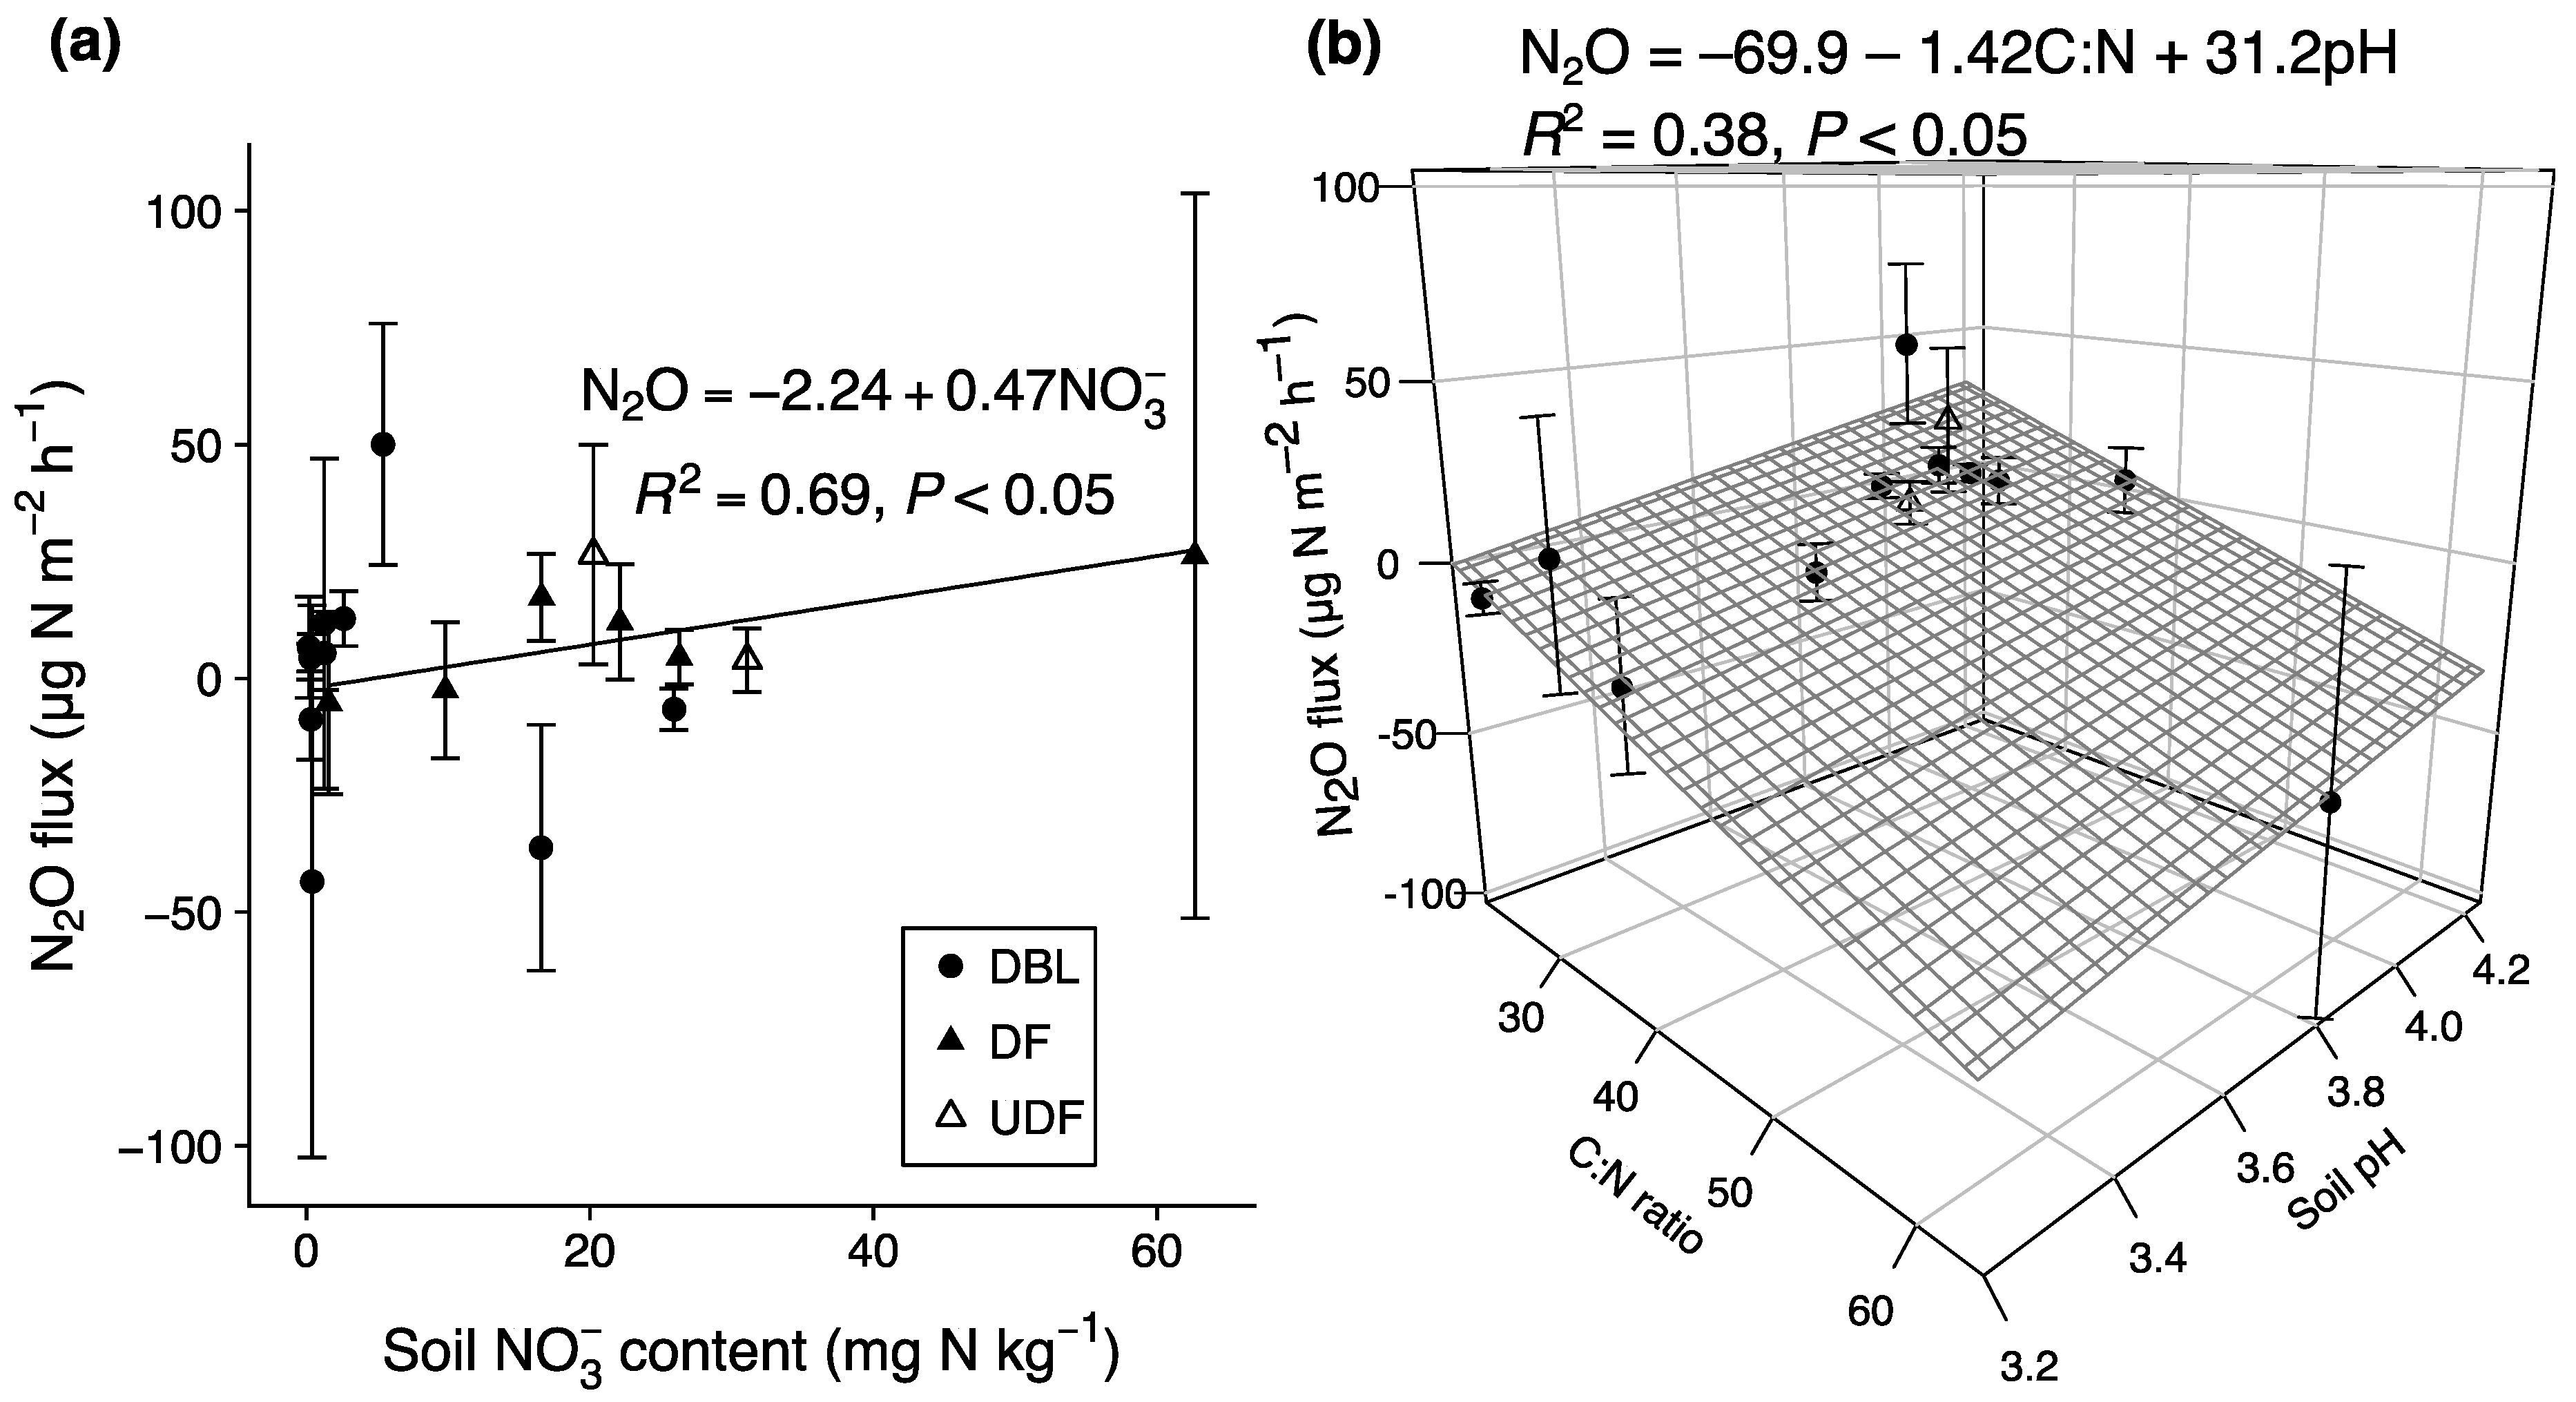
| DF | N2O = −2.24 + 0.47 × NO3− | <0.05 | 0.69 | 45 | |
| DF | Null model | 50 | |||
| UDF, DBL | N2O = −63.5 −1.37 × C:N + 28.8 × pH | <0.05 | 0.38 | 119 | |
| UDF, DBL | Null model | 122 |
© 2018 by the authors. Licensee MDPI, Basel, Switzerland. This article is an open access article distributed under the terms and conditions of the Creative Commons Attribution (CC BY) license (http://creativecommons.org/licenses/by/4.0/).
Share and Cite
Ishikura, K.; Darung, U.; Inoue, T.; Hatano, R. Variation in Soil Properties Regulate Greenhouse Gas Fluxes and Global Warming Potential in Three Land Use Types on Tropical Peat. Atmosphere 2018, 9, 465. https://doi.org/10.3390/atmos9120465
Ishikura K, Darung U, Inoue T, Hatano R. Variation in Soil Properties Regulate Greenhouse Gas Fluxes and Global Warming Potential in Three Land Use Types on Tropical Peat. Atmosphere. 2018; 9(12):465. https://doi.org/10.3390/atmos9120465
Chicago/Turabian StyleIshikura, Kiwamu, Untung Darung, Takashi Inoue, and Ryusuke Hatano. 2018. "Variation in Soil Properties Regulate Greenhouse Gas Fluxes and Global Warming Potential in Three Land Use Types on Tropical Peat" Atmosphere 9, no. 12: 465. https://doi.org/10.3390/atmos9120465