Next Issue
Volume 10, January
Previous Issue
Volume 9, November


Atmosphere, Volume 9, Issue 12 (December 2018) – 49 articles

Cover Story (view full-size image): 
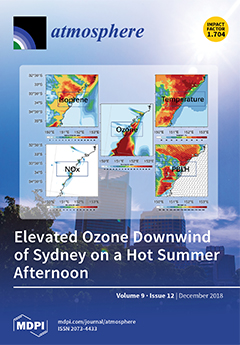
Hot summer conditions often lead to poor air quality. This picture shows simulated ozone (in the centre) at 3 pm on the 18th of January 2013 that is caused by reactions of volatile organic compounds (VOCs) such as isoprene in the presence of oxides of nitrogen (NOx). The warm temperatures exacerbate both the production of isoprene and the chemistry that leads to ozone production. This, combined with the meteorology (the wind speed and the direction, and the evolution of the planetary boundary layer (PBLH)), leads to elevated ozone concentrations in regions downwind. View this paper.
  • Issues are regarded as officially published after their release is announced to the table of contents alert mailing list.
  • You may sign up for e-mail alerts to receive table of contents of newly released issues.
  • PDF is the official format for papers published in both, html and pdf forms. To view the papers in pdf format, click on the "PDF Full-text" link, and use the free Adobe Reader to open them.
Order results
Result details
Section
Select all
Export citation of selected articles as:
25 pages, 7860 KiB  
Article
Performance Assessment of Dynamic Downscaling of WRF to Simulate Convective Conditions during Sagebrush Phase 1 Tracer Experiments
by Sudheer R. Bhimireddy and Kiran Bhaganagar
Atmosphere 2018, 9(12), 505; https://doi.org/10.3390/atmos9120505 - 19 Dec 2018
Cited by 9 | Viewed by 3595
Abstract
Large-Eddy Simulations (LES) corresponding to four convective intensive observation periods of Sagebrush Phase 1 tracer experiment were conducted with realistic boundary conditions using Weather Research and Forecast model (WRF). Multiple nested domains were used to dynamically downscale the conditions from domain with grid [...] Read more.
Large-Eddy Simulations (LES) corresponding to four convective intensive observation periods of Sagebrush Phase 1 tracer experiment were conducted with realistic boundary conditions using Weather Research and Forecast model (WRF). Multiple nested domains were used to dynamically downscale the conditions from domain with grid size of 24 km to local scales with grid size of 150 m. Sensitivity analysis of mesoscale model was conducted using three boundary layer, three surface layer and two micro-physics schemes. Model performance was evaluated by comparing the surface meteorological variables and boundary layer height from the mesoscale runs and observed values during tracer experiment. Output from mesoscale simulations was used to drive the LES domains. Effect of vertical resolution and sub-grid scale parameterizations were studied by comparing the wind speed and direction profiles along with turbulent kinetic energy at two different heights. Atmospheric stability estimated using the Richardson number and shear exponent evaluated between 8- and 60-m levels was found to vary between weakly unstable to unstable. Comparing the wind direction standard deviations coupled with the wind speeds showed that the WRF-LES underestimated the wind direction fluctuations for wind speeds smaller than 3-ms 1 . Based on the strengths of convection and shear, WRF-LES was able to simulate horizontal convection roll and convective cell type features. Full article
Show Figures

Figure 1

12 pages, 1153 KiB  
Article
Effects of Forage Rice Cultivation on Carbon and Greenhouse Gas Balances in a Rice Paddy Field
by Fumiaki Takakai, Masahiro Kobayashi, Takashi Sato, Kentaro Yasuda and Yoshihiro Kaneta
Atmosphere 2018, 9(12), 504; https://doi.org/10.3390/atmos9120504 - 19 Dec 2018
Cited by 3 | Viewed by 3660
Abstract
The effects of conversion from staple rice to forage rice on carbon and greenhouse gas (GHG) balances in a paddy field were evaluated. A staple rice plot without the application of livestock manure compost (LMC, S − M plot) and forage rice plots [...] Read more.
The effects of conversion from staple rice to forage rice on carbon and greenhouse gas (GHG) balances in a paddy field were evaluated. A staple rice plot without the application of livestock manure compost (LMC, S − M plot) and forage rice plots with and without the application of LMC, derived mainly from cattle (2 kg−FW m−2, F + M and F − M plots, respectively), were established. CH4 and N2O fluxes and CO2 flux from a bare soil plot for organic matter decomposition (OMD) were measured. The carbon budget was calculated by subtracting the OMD, CH4 emission, and harvested grain and straw (forage rice only) from the net primary production and LMC. The net GHG balance was calculated by integrating them as CO2 equivalents. There were no significant differences in GHG flux among the plots. Compared to the carbon loss in the S − M plot, the loss increased by harvesting straw and was mitigated by LMC application. The net GHG emission in the F + M plot was significantly lower than that in other plots (1.78 and 2.63−2.77 kg CO2-eq m−2 year−1, respectively). There is a possibility that GHG emissions could be suppressed by forage rice cultivation with the application of LMC. Full article
(This article belongs to the Special Issue C and N Cycling and Greenhouse Gases Emission in Agroecosystem)
Show Figures

Figure 1

16 pages, 1564 KiB  
Article
Collapse Mechanisms of Nascent and Aged Sea Spray Aerosol Proxy Films
by Kimberly A. Carter-Fenk and Heather C. Allen
Atmosphere 2018, 9(12), 503; https://doi.org/10.3390/atmos9120503 - 18 Dec 2018
Cited by 15 | Viewed by 5851
Abstract
Sea spray aerosol (SSA) is highly enriched in marine-derived organic compounds during seasons of high biological productivity, and saturated fatty acids comprise one of the most abundant classes of molecules. Fatty acids and other organic compounds form a film on SSA surfaces, and [...] Read more.
Sea spray aerosol (SSA) is highly enriched in marine-derived organic compounds during seasons of high biological productivity, and saturated fatty acids comprise one of the most abundant classes of molecules. Fatty acids and other organic compounds form a film on SSA surfaces, and SSA particle surface-area-to-volume ratios are altered during aging in the marine boundary layer (MBL). To understand SSA surface organization and its role during dynamic atmospheric conditions, an SSA proxy fatty acid film and its individual components stearic acid (SA), palmitic acid (PA), and myristic acid (MA) are studied separately using surface pressure–area ( Π A ) isotherms and Brewster angle microscopy (BAM). The films were spread on an aqueous NaCl subphase at pH 8.2, 5.6, and 2.0 to mimic nascent to aged SSA aqueous core composition in the MBL, respectively. We show that the individual fatty acid behavior differs from that of the SSA proxy film, and at nascent SSA pH the mixture yields a monolayer with intermediate rigidity that folds upon film compression to the collapse state. Acidification causes the SSA proxy film to become more rigid and form 3D nuclei. Our results reveal film morphology alterations, which are related to SSA reflectivity, throughout various stages of SSA aging and provide a better understanding of SSA impacts on climate. Full article
(This article belongs to the Special Issue Ocean Contributions to the Marine Boundary Layer Aerosol Budget)
Show Figures

Figure 1

17 pages, 3386 KiB  
Article
Transport Paths and Identification for Potential Sources of Haze Pollution in the Yangtze River Delta Urban Agglomeration from 2014 to 2017
by Linglong Zhu, Yonghong Zhang, Xi Kan and Jiangeng Wang
Atmosphere 2018, 9(12), 502; https://doi.org/10.3390/atmos9120502 - 17 Dec 2018
Cited by 11 | Viewed by 3352
Abstract
Besides local emissions, long-range transportation of polluted air masses also has a huge impact on haze pollution. In this study, the Hybrid Single-Particle Lagrangian Integrated Trajectory (HYSPLIT) model was used to determine the transport paths and potential sources of haze pollution in the [...] Read more.
Besides local emissions, long-range transportation of polluted air masses also has a huge impact on haze pollution. In this study, the Hybrid Single-Particle Lagrangian Integrated Trajectory (HYSPLIT) model was used to determine the transport paths and potential sources of haze pollution in the Yangtze River Delta Urban Agglomeration. Haze days were determined by setting the threshold of meteorological elements. Shanghai, Hangzhou, Nanjing and Hefei were selected as four representative cities to calculate the −72 h backward transport trajectory of haze air mass; thus, the main transport path was obtained after clustering. A potential source contribution function and concentration weighted field were used to identify potential pollution sources of the study. The results showed that the number of haze days in the northern Yangtze River Delta Urban Agglomeration is much higher than that in the south. Haze days and Fine particulate matter (PM2.5) concentration showed a downward trend. The transport paths could be summarized as long-range transports from the northwest and coastal direction during the dry season and short-distance transports from all directions. −72 h air flow trajectories come from the higher altitudes in dry season than these in wet season. The main sources of potential pollution are Hebei, Shandong, Anhui and northern Jiangsu. Full article
Show Figures

Figure 1

18 pages, 6333 KiB  
Article
Identifying Key Potential Source Areas for Ambient Methyl Mercaptan Pollution Based on Long-Term Environmental Monitoring Data in an Industrial Park
by Yujie Liu, Qi Yu, Zihan Huang, Weichun Ma and Yan Zhang
Atmosphere 2018, 9(12), 501; https://doi.org/10.3390/atmos9120501 - 17 Dec 2018
Cited by 6 | Viewed by 3230
Abstract
Precise source identification for ambient pollution incidents in industrial parks were often difficult due to limited measurements. Source area analysis method was one of the applicable source identification methods, which could provide potential source areas under these circumstances. However, a source area usually [...] Read more.
Precise source identification for ambient pollution incidents in industrial parks were often difficult due to limited measurements. Source area analysis method was one of the applicable source identification methods, which could provide potential source areas under these circumstances. However, a source area usually covered several sources and the method was unable to identify the real one. This article introduces a case study on the statistical source identification of methyl mercaptan based on the long-term measurements, in 2014, in an industrial park. A procedure for statistical source area analysis was established, which contains independent pollution episode extraction, source area calculation scenario definition, meteorological data selection, and source area statistical analysis. A total of 414 violation records were detected by five monitors inside the park. Three kinds of calculation scenarios were found and, finally, three key source areas were revealed. The typical scenarios of source area calculations were described in detail. The characteristics of the statistical source areas for all pollution episodes were examined. Finally, the applicability of the method, as well as the source of uncertainties, was discussed. This study shows that more concentrated source areas can be identified through the statistical source area method if several excessive emission sources exist in an industrial park. Full article
(This article belongs to the Section Air Quality)
Show Figures

Figure 1

22 pages, 3952 KiB  
Article
Urban Air Quality in a Coastal City: Wollongong during the MUMBA Campaign
by Clare Paton-Walsh, Élise-Andrée Guérette, Kathryn Emmerson, Martin Cope, Dagmar Kubistin, Ruhi Humphries, Stephen Wilson, Rebecca Buchholz, Nicholas B. Jones, David W. T. Griffith, Doreena Dominick, Ian Galbally, Melita Keywood, Sarah Lawson, James Harnwell, Jason Ward, Alan Griffiths and Scott Chambers
Atmosphere 2018, 9(12), 500; https://doi.org/10.3390/atmos9120500 - 17 Dec 2018
Cited by 24 | Viewed by 5278
Abstract
We present findings from the Measurements of Urban, Marine and Biogenic Air (MUMBA) campaign, which took place in the coastal city of Wollongong in New South Wales, Australia. We focus on a few key air quality indicators, along with a comparison to regional [...] Read more.
We present findings from the Measurements of Urban, Marine and Biogenic Air (MUMBA) campaign, which took place in the coastal city of Wollongong in New South Wales, Australia. We focus on a few key air quality indicators, along with a comparison to regional scale chemical transport model predictions at a spatial resolution of 1 km by 1 km. We find that the CSIRO chemical transport model provides accurate simulations of ozone concentrations at most times, but underestimates the ozone enhancements that occur during extreme temperature events. The model also meets previously published performance standards for fine particulate matter less than 2.5 microns in diameter (PM2.5), and the larger aerosol fraction (PM10). We explore the observed composition of the atmosphere within this urban air-shed during the MUMBA campaign and discuss the different influences on air quality in the city. Our findings suggest that further improvements to our ability to simulate air quality in this coastal city can be made through more accurate anthropogenic and biogenic emissions inventories and better understanding of the impact of extreme temperatures on air quality. The challenges in modelling air quality within the urban air-shed of Wollongong, including difficulties in accurate simulation of the local meteorology, are likely to be replicated in many other coastal cities in the Southern Hemisphere. Full article
(This article belongs to the Special Issue Air Quality in New South Wales, Australia)
Show Figures

Figure 1

31 pages, 8717 KiB  
Review
A Review of Ice Cloud Optical Property Models for Passive Satellite Remote Sensing
by Ping Yang, Souichiro Hioki, Masanori Saito, Chia-Pang Kuo, Bryan A. Baum and Kuo-Nan Liou
Atmosphere 2018, 9(12), 499; https://doi.org/10.3390/atmos9120499 - 17 Dec 2018
Cited by 41 | Viewed by 5883
Abstract
The current wealth of spaceborne passive and active measurements from ultraviolet to the infrared wavelengths provides an unprecedented opportunity to construct ice cloud bulk optical property models that lead to consistent ice cloud property retrievals across multiple sensors and platforms. To infer the [...] Read more.
The current wealth of spaceborne passive and active measurements from ultraviolet to the infrared wavelengths provides an unprecedented opportunity to construct ice cloud bulk optical property models that lead to consistent ice cloud property retrievals across multiple sensors and platforms. To infer the microphysical and radiative properties of ice clouds from these satellite measurements, the general approach is to assume an ice cloud optical property model that implicitly assumes the habit (shape) and size distributions of the ice particles in these clouds. The assumption is that this ice optical property model will be adequate for global retrievals. In this review paper, we first summarize the key optical properties of individual particles and then the bulk radiative properties of their ensemble, followed by a review of the ice cloud models developed for application to satellite remote sensing. We illustrate that the random orientation condition assumed for ice particles is arguably justified for passive remote sensing applications based on radiometric measurements. The focus of the present discussion is on the ice models used by the Moderate Resolution Imaging Spectroradiometer (MODIS) and the Clouds and Earth’s Radiant Energy System (CERES) science teams. In addition, we briefly review the ice cloud models adopted by the Polarization and Directionality of the Earth’s Reflectance (POLDER) and the Himawari-8 Advanced Himawari Imager (AHI) for ice cloud retrievals. We find that both the MODIS Collection 6 ice model and the CERES two-habit model result in spectrally consistent retrievals. Full article
(This article belongs to the Special Issue Radiative Transfer in the Earth Atmosphere)
Show Figures

Figure 1

16 pages, 5319 KiB  
Article
Temporal Patterns and Vertical Temperature Gradients in Micro-Scale Drainage Flow Observed Using Thermal Imaging
by Anja Martina Grudzielanek and Jan Cermak
Atmosphere 2018, 9(12), 498; https://doi.org/10.3390/atmos9120498 - 14 Dec 2018
Cited by 8 | Viewed by 4523
Abstract
Micro-scale cold-air flow along a gentle slope was analyzed using thermal infrared imaging (TIR), focusing exclusively on the lowermost 2 m above ground. Cold-air pulses were analyzed with regard to their vertical temperature stratification as well as flow characteristics, such as flow speed. [...] Read more.
Micro-scale cold-air flow along a gentle slope was analyzed using thermal infrared imaging (TIR), focusing exclusively on the lowermost 2 m above ground. Cold-air pulses were analyzed with regard to their vertical temperature stratification as well as flow characteristics, such as flow speed. Analyses on the transition zone between the near-surface very stable inversion layer and the less stable, warmer air above highlight turbulent situations and detrainment effects at the cold-air inversion top. Using thermal imaging in a high spatiotemporal resolution with up to 90 vertical data points and TIR pixels for 1.5 m cold-air depth, a high-precision cold-air flow analysis was realized. Full article
(This article belongs to the Section Biosphere/Hydrosphere/Land–Atmosphere Interactions)
Show Figures

Figure 1

24 pages, 5748 KiB  
Article
Projected Changes in Intra-Season Rainfall Characteristics in the Niger River Basin, West Africa
by Uvirkaa Akumaga and Aondover Tarhule
Atmosphere 2018, 9(12), 497; https://doi.org/10.3390/atmos9120497 - 14 Dec 2018
Cited by 15 | Viewed by 5399
Abstract
The magnitude and timing of seasonal rainfall is vitally important to the health and vitality of key agro-ecological and social-economic systems of the Niger River Basin. Given this unique context, knowledge concerning how climate change is likely to impact future rainfall characteristics and [...] Read more.
The magnitude and timing of seasonal rainfall is vitally important to the health and vitality of key agro-ecological and social-economic systems of the Niger River Basin. Given this unique context, knowledge concerning how climate change is likely to impact future rainfall characteristics and patterns is critically needed for adaptation and mitigation planning. Using nine ensemble bias-corrected climate model projection results under RCP4.5 and RCP8.5 (RCP—Representative Concentration Pathway) emissions scenarios at the mid-future time period, 2021/2025-2050 from the Coordinated Regional Climate Downscaling Experiments (CORDEX) dataset; this study provides a comprehensive analysis of the projected changes in rainfall characteristics in three agro-ecological zones of the Niger River Basin. The results show an increase in the average rainfall of about 5%, 10–20% and 10–15% for the Southern Guinea, Northern Guinea and Sahelian zones, respectively, relative to the baseline, 1981/1985–2005. On the other hand, the change in future rainfall intensities are largely significant and the frequency of rainfall at the low, heavy and extreme rainfall events in the future decrease at most locations in the Niger River Basin. The results also showed an increase in the frequency of moderate rainfall events at all locations in the basin. However, in the Northern Guinea and Sahel locations, there is an increase in the frequency of projected heavy and extreme rainfall events. The results reveal a shift in the future onset/cessation and a shortening of the duration of the rainy season in the basin. Specifically, the mean date of rainfall onset will be delayed by between 10 and 32 days. The mean onset of cessation will also be delayed by between 10 and 21 days. It is posited that the projected rainfall changes pose serious risks for food security of the region and may require changes in the cropping patterns and management. Full article
(This article belongs to the Special Issue African Rainfall Variability: Science and Society)
Show Figures

Figure 1

22 pages, 2258 KiB  
Article
Geostatistical Merging of a Single-Polarized X-Band Weather Radar and a Sparse Rain Gauge Network over an Urban Catchment
by Ibrahim Seck and Joël Van Baelen
Atmosphere 2018, 9(12), 496; https://doi.org/10.3390/atmos9120496 - 14 Dec 2018
Cited by 7 | Viewed by 3360
Abstract
Optimal Quantitative Precipitation Estimation (QPE) of rainfall is crucial to the accuracy of hydrological models, especially over urban catchments. Small-to-medium size towns are often equipped with sparse rain gauge networks that struggle to capture the variability in rainfall over high spatiotemporal resolutions. X-band [...] Read more.
Optimal Quantitative Precipitation Estimation (QPE) of rainfall is crucial to the accuracy of hydrological models, especially over urban catchments. Small-to-medium size towns are often equipped with sparse rain gauge networks that struggle to capture the variability in rainfall over high spatiotemporal resolutions. X-band Local Area Weather Radars (LAWRs) provide a cost-effective solution to meet this challenge. The Clermont Auvergne metropolis monitors precipitation through a network of 13 rain gauges with a temporal resolution of 5 min. 5 additional rain gauges with a 6-minute temporal resolution are available in the region, and are operated by the national weather service Météo-France. The LaMP (Laboratoire de Météorologie Physique) laboratory’s X-band single-polarized weather radar monitors precipitation as well in the region. In this study, three geostatistical interpolation techniques—Ordinary kriging (OK), which was applied to rain gauge data with a variogram inferred from radar data, conditional merging (CM), and kriging with an external drift (KED)—are evaluated and compared through cross-validation. The performance of the inverse distance weighting interpolation technique (IDW), which was applied to rain gauge data only, was investigated as well, in order to evaluate the effect of incorporating radar data on the QPE’s quality. The dataset is comprised of rainfall events that occurred during the seasons of summer 2013 and winter 2015, and is exploited at three temporal resolutions: 5, 30, and 60 min. The investigation of the interpolation techniques performances is carried out for both seasons and for the three temporal resolutions using raw radar data, radar data corrected from attenuation, and the mean field bias, successively. The superiority of the geostatistical techniques compared to the inverse distance weighting method was verified with an average relative improvement of 54% and 31% in terms of bias reduction for kriging with an external drift and conditional merging, respectively (cross-validation). KED and OK performed similarly well, while CM lagged behind in terms of point measurement QPE accuracy, but was the best method in terms of preserving the observations’ variance. The correction schemes had mixed effects on the multivariate geostatistical methods. Indeed, while the attenuation correction improved KED across the board, the mean field bias correction effects were marginal. Both radar data correction schemes resulted in a decrease of the ability of CM to preserve the observations variance, while slightly improving its point measurement QPE accuracy. Full article
(This article belongs to the Section Meteorology)
Show Figures

Figure 1

14 pages, 5048 KiB  
Article
A Novel Bandpass Filter for the Analysis of Carbon Monoxide Using a Non-Dispersive Infrared Technique
by Trieu-Vuong Dinh, Ji-Won Ahn, In-Young Choi and Jo-Chun Kim
Atmosphere 2018, 9(12), 495; https://doi.org/10.3390/atmos9120495 - 14 Dec 2018
Cited by 4 | Viewed by 6027
Abstract
In this study, two novel narrow bandpass filters (BPF) obtained from the high-resolution transmission molecular absorption (HITRAN) data for a carbon monoxide (CO) non-dispersive infrared (NDIR) analyzer were investigated and compared with a commercial BPF (4.64 µm). The new BPF was made using [...] Read more.
In this study, two novel narrow bandpass filters (BPF) obtained from the high-resolution transmission molecular absorption (HITRAN) data for a carbon monoxide (CO) non-dispersive infrared (NDIR) analyzer were investigated and compared with a commercial BPF (4.64 µm). The new BPF was made using a two-cavity filter method with different center wavelengths and bandwidths from the commercial BPF. The wavelengths of the two BPFs were 4.5 µm and 4.65 µm. The gas emission pattern of a coal-fired power plant was used as a case study. Various concentrations of target gases were used to theoretically estimate the interference, and to practically determine it. It was found that although the transmittances of the two new BPFs were lower than that of the commercial BPF, the signal-to-noise ratio caused by two novel BPFs was approximately 20. In terms of interference effect, carbon dioxide (CO2) was found as a strong interfering gas on the commercial BPF at 4.64 µm and the new BPF at 4.65 µm. In contrast, the new BPF at 4.5 µm cut off the interference effect of all target gases. The measurement error of the NDIR analyzer applying the BPF at 4.5 µm was similar to that of gas filter correlation (GFC) NDIR and was less than 1%. This indicates that the novel BPF at 4.5 µm can be used instead of a GFC for a CO NDIR analyzer, thus overcoming the limitations of using a GFC. Full article
(This article belongs to the Section Air Quality)
Show Figures

Graphical abstract

35 pages, 13061 KiB  
Article
Application of Integrated Artificial Neural Networks Based on Decomposition Methods to Predict Streamflow at Upper Indus Basin, Pakistan
by Muhammad Tayyab, Ijaz Ahmad, Na Sun, Jianzhong Zhou and Xiaohua Dong
Atmosphere 2018, 9(12), 494; https://doi.org/10.3390/atmos9120494 - 13 Dec 2018
Cited by 22 | Viewed by 5274
Abstract
Consistent streamflow forecasts play a fundamental part in flood risk mitigation. Population increase and water cycle intensification are extending not only globally but also among Pakistan’s water resources. The frequency of floods has increased in the last few decades in the country, which [...] Read more.
Consistent streamflow forecasts play a fundamental part in flood risk mitigation. Population increase and water cycle intensification are extending not only globally but also among Pakistan’s water resources. The frequency of floods has increased in the last few decades in the country, which emphasizes the importance of efficient practices needed to adopt for various aspects of water resource management such as reservoir scheduling, water sustainability, and water supply. The purpose of this study is to develop a novel hybrid model for streamflow forecasting and validate its efficiency at the upper Indus basin (UIB), Pakistan. Maximum streamflow in the River Indus from its upper mountain basin results from melting snow or glaciers and climatic unevenness of both precipitation and temperature inputs, which will, therefore, affect rural livelihoods at both a local and a regional scale through effects on runoff in the Upper Indus basin (UIB). This indicates that basins receive the bulk of snowfall input to sustain the glacier system. The present study will help find the runoff from high altitude catchments and estimated flood occurrence for the proposed and constructed hydropower projects of the Upper Indus basin (UIB). Due to climate variability, the upper Indus basin (UIB) was further divided into three zone named as sub-zones, zone one (z1), zone two (z2), and zone three (z3). The hybrid models are designed by incorporating artificial intelligence (AI) models, which includes Feedforward backpropagation (FFBP) and Radial basis function (RBF) with decomposition methods. This includes a discrete wavelet transform (DWT) and ensemble empirical mode decomposition (EEMD). On the basis of the autocorrelation function and the cross-correlation function of streamflow, precipitation and temperature inputs are selected for all developed models. Data have been analyzed by comparing the simulation outputs of the models with a correlation coefficient (R), root mean square errors (RMSE), Nash-Sutcliffe Efficiency (NSE), mean absolute percentage error (MAPE), and mean absolute errors (MAE). The proposed hybrid models have been applied to monthly streamflow observations from three hydrological stations and 17 meteorological stations in the UIB. The results show that the prediction accuracy of the decomposition-based models is usually better than those of AI-based models. Among the DWT and EEMD based hybrid model, EEMD has performed significantly well when compared to all other hybrid and individual AI models. The peak value analysis is also performed to confirm the results’ precision rate during the flood season (May-October). The detailed comparative analysis showed that the RBFNN integrated with EEMD has better forecasting capabilities as compared to other developed models and EEMD-RBF can capture the nonlinear characteristics of the streamflow time series during the flood season with more precision. Full article
Show Figures

Figure 1

13 pages, 4611 KiB  
Article
Downscaling Atmosphere-Ocean Global Climate Model Precipitation Simulations over Africa Using Bias-Corrected Lateral and Lower Boundary Conditions
by Leonard M. Druyan and Matthew Fulakeza
Atmosphere 2018, 9(12), 493; https://doi.org/10.3390/atmos9120493 - 12 Dec 2018
Cited by 3 | Viewed by 3202
Abstract
A prequel study showed that dynamic downscaling using a regional climate model (RCM) over Africa improved the Goddard Institute for Space Studies Atmosphere-Ocean Global Climate Model (GISS AOGCM: ModelE) simulation of June–September rainfall patterns over Africa. The current study applies bias corrections to [...] Read more.
A prequel study showed that dynamic downscaling using a regional climate model (RCM) over Africa improved the Goddard Institute for Space Studies Atmosphere-Ocean Global Climate Model (GISS AOGCM: ModelE) simulation of June–September rainfall patterns over Africa. The current study applies bias corrections to the lateral and lower boundary data from the AOGCM driving the RCM, based on the comparison of a 30-year simulation to the actual climate. The analysis examines the horizontal pattern of June–September total accumulated precipitation, the time versus latitude evolution of zonal mean West Africa (WA) precipitation (showing monsoon onset timing), and the latitude versus altitude cross-section of zonal winds over WA (showing the African Easterly Jet and the Tropical Easterly Jet). The study shows that correcting for excessively warm AOGCM Atlantic sea-surface temperatures (SSTs) improves the simulation of key features, whereas applying 30-year mean bias corrections to atmospheric variables driving the RCM at the lateral boundaries does not improve the RCM simulations. We suggest that AOGCM climate projections for Africa should benefit from downscaling by nesting an RCM that has demonstrated skill in simulating African climate, driven with bias-corrected SST. Full article
(This article belongs to the Special Issue African Rainfall Variability: Science and Society)
Show Figures

Figure 1

18 pages, 1081 KiB  
Article
The Effect of Cover Crops on Soil Water Balance in Rain-Fed Conditions
by Đorđe Krstić, Svetlana Vujić, Goran Jaćimović, Paride D’Ottavio, Zoran Radanović, Pero Erić and Branko Ćupina
Atmosphere 2018, 9(12), 492; https://doi.org/10.3390/atmos9120492 - 11 Dec 2018
Cited by 23 | Viewed by 7079
Abstract
Soil and water conservation benefits of cover crops have been hypothesized as a way to mitigate and adapt to changing climatic conditions, but they can also have detrimental effects if rainfall is limited. Our objective was to quantify effects of winter cover crops [...] Read more.
Soil and water conservation benefits of cover crops have been hypothesized as a way to mitigate and adapt to changing climatic conditions, but they can also have detrimental effects if rainfall is limited. Our objective was to quantify effects of winter cover crops on soil water storage and yield of silage maize under the agro-ecological conditions within Vojvodina Province in Serbia. The experiment was conducted under rain-fed conditions at three locations and included a control (bare fallow) plus three cover crop and two N rate treatments. The cover crop treatments were common vetch (Vicia sativa L.), triticale (x Triticosecale Wittm. ex A. Camus) and a mixture of the two species. All were managed as green manure and subsequently fertilized with either 120 or 160 kg N ha−1 before planting silage maize (Zea mays L.). Cover crop effects on soil water storage were calculated for two periods, March–May and May–September/October. A Standardized Precipitation Index (SPI) used to characterize drought severity for 2011/2012 and 2012/2013, showed values of 3 and 9, respectively, for the two periods. Soil water storage was reduced by all cover crop treatments, with the greatest deficiency occurring during the extremely dry year of 2012. Previous studies have shown cover crop growth reduced by soil water depletion during their growing season and negative effects on early-season growth and development of subsequent cash crops such as silage maize, but if rainfall is extremely low it can also reduce cash crop yield. This detrimental effect of cover crops on soil water balance was confirmed by correlations between soil water storage and maize silage yield. Full article
Show Figures

Figure 1

3 pages, 825 KiB  
Correction
Correction: Teixeira, M.A.C. Diagnosing Lee Wave Rotor Onset Using a Linear Model Including a Boundary Layer. Atmosphere 2017, 8, 5
by Miguel A. C. Teixeira
Atmosphere 2018, 9(12), 491; https://doi.org/10.3390/atmos9120491 - 11 Dec 2018
Viewed by 2234
Abstract
The author would like to correct a published article by Teixeira [1], in which there is a factor of 2 missing from his Equation (24).[...] Full article
(This article belongs to the Special Issue Atmospheric Gravity Waves)
Show Figures

Figure 1

15 pages, 2348 KiB  
Article
Characteristics of Carbonaceous PM2.5 in a Small Residential City in Korea
by Jong-Min Park, Young-Ji Han, Sung-Hwan Cho and Hyun-Woong Kim
Atmosphere 2018, 9(12), 490; https://doi.org/10.3390/atmos9120490 - 11 Dec 2018
Cited by 7 | Viewed by 3467
Abstract
PM2.5 has been a serious issue in South Korea not only in urban and industrial areas but also in rural and background areas. In this study, PM2.5 and its carbonaceous compounds including organic carbon (OC), elemental carbon (EC), water-soluble organic carbon [...] Read more.
PM2.5 has been a serious issue in South Korea not only in urban and industrial areas but also in rural and background areas. In this study, PM2.5 and its carbonaceous compounds including organic carbon (OC), elemental carbon (EC), water-soluble organic carbon (WSOC), and polycyclic aromatic hydrocarbons (PAHs) were collected and analyzed in a small residential city. The PM2.5 concentration frequently exceeded the national ambient air quality standard during the spring and the winter, which often occurred concurrently with fog and mist events. Over the whole sampling period, both OC and the OC/EC ratio were considerably higher than the ratios in other cities in Korea, which suggests that sources other than vehicular emissions were important. The top 10% of OC/EC ratio samples could be explained by regional and long-range transport because there was a strong correlation between primary and secondary organic carbon. However, biomass combustion was likely to account for the consistently high OC concentration due to a strong correlation between WSOC and primary OC as well as the diagnostic ratio results of PAHs. Full article
(This article belongs to the Special Issue Air Quality in the Asia-Pacific Region)
Show Figures

Figure 1

14 pages, 2827 KiB  
Article
A Case Study of the Stratospheric and Mesospheric Concentric Gravity Waves Excited by Thunderstorm in Northern China
by Ying Wen, Qilin Zhang, Haiyang Gao, Jiyao Xu and Qinzeng Li
Atmosphere 2018, 9(12), 489; https://doi.org/10.3390/atmos9120489 - 10 Dec 2018
Cited by 7 | Viewed by 3096
Abstract
In this paper, the complete process in which a concentric gravity wave (CGW), excited by a tropospheric thunderstorm, propagated into the stratosphere and mesosphere in Northern China is investigated. A strong thunderstorm developed in the middle of the Inner Mongolia autonomous region on [...] Read more.
In this paper, the complete process in which a concentric gravity wave (CGW), excited by a tropospheric thunderstorm, propagated into the stratosphere and mesosphere in Northern China is investigated. A strong thunderstorm developed in the middle of the Inner Mongolia autonomous region on the night of 10th August 2013. The stratospheric temperature perturbation, caused by the CGW, was observed by the Atmospheric Infrared Sounder (AIRS) at 02:11 LT 11th August 2013. An all-sky OH imager at the Shuozhou station (39.8° N, 112.1° E), supported by the Meridian Space Weather Monitoring Project, measured the mesospheric CGW between 22:00 LT to 23:00 LT on the night. It was certified that both the stratospheric and mesospheric CGWs were triggered by the aforementioned thunderstorm, and the excitation source was calculated to be located at (40.59° N, 108.67° E) by employing the dispersion relation. The CGWs were excited in the initial stage of the thunderstorm. The temperature and wind field data obtained by SABER and meteoric radar, respectively, were used to evaluate the background properties of the respective propagation regions. The result shows that an obvious thermal duct structure, with a positive squared vertical wavenumber (m2) existed around the OH layer. Full article
Show Figures

Figure 1

17 pages, 6336 KiB  
Article
Model Performance Differences in Sulfate Aerosol in Winter over Japan Based on Regional Chemical Transport Models of CMAQ and CAMx
by Syuichi Itahashi, Kazuyo Yamaji, Satoru Chatani, Kunihiro Hisatsune, Shinji Saito and Hiroshi Hayami
Atmosphere 2018, 9(12), 488; https://doi.org/10.3390/atmos9120488 - 10 Dec 2018
Cited by 12 | Viewed by 5169
Abstract
Sulfate aerosol (SO42−) is a major component of particulate matter in Japan. The Japanese model intercomparison study, J-STREAM, found that although SO42− is well captured by models, it is underestimated during winter. In the first phase of J-STREAM, [...] Read more.
Sulfate aerosol (SO42−) is a major component of particulate matter in Japan. The Japanese model intercomparison study, J-STREAM, found that although SO42− is well captured by models, it is underestimated during winter. In the first phase of J-STREAM, we refined the Fe- and Mn-catalyzed oxidation and partly improved the underestimation. The winter haze in December 2016 was a target period in the second phase. The results from the Community Multiscale Air Quality (CMAQ) and Comprehensive Air quality Model with eXtentions (CAMx) regional chemical transport models were compared with observations from the network over Japan and intensive observations at Nagoya and Tokyo. Statistical analysis showed both models satisfied the suggested model performance criteria. CMAQ sensitivity simulations explained the improvements in model performance. CMAQ modeled lower SO42− concentrations than CAMx, despite increased aqueous oxidation via the metal catalysis pathway and NO2 reaction in CMAQ. Deposition explained this difference. A scatter plot demonstrated that the lower SO42− concentration in CMAQ than in CAMx arose from the lower SO2 concentration and higher SO42− wet deposition in CMAQ. The dry deposition velocity caused the difference in SO2 concentration. These results suggest the importance of deposition in improving our understanding of ambient concentration behavior. Full article
(This article belongs to the Section Aerosols)
Show Figures

Figure 1

19 pages, 5509 KiB  
Article
Improving Seasonal Prediction of East Asian Summer Rainfall Using NESM3.0: Preliminary Results
by Young-Min Yang, Bin Wang and Juan Li
Atmosphere 2018, 9(12), 487; https://doi.org/10.3390/atmos9120487 - 08 Dec 2018
Cited by 10 | Viewed by 4292
Abstract
It has been an outstanding challenge for global climate models to simulate and predict East Asia summer monsoon (EASM) rainfall. This study evaluated the dynamical hindcast skills with the newly developed Nanjing University of Information Science and Technology Earth System Model version 3.0 [...] Read more.
It has been an outstanding challenge for global climate models to simulate and predict East Asia summer monsoon (EASM) rainfall. This study evaluated the dynamical hindcast skills with the newly developed Nanjing University of Information Science and Technology Earth System Model version 3.0 (NESM3.0). To improve the poor prediction of an earlier version of NESM3.0, we modified convective parameterization schemes to suppress excessive deep convection and enhance insufficient shallow and stratiform clouds. The new version of NESM3.0 with modified parameterizations (MOD hereafter) yields improved rainfall prediction in the northern and southern China but not over the Yangtze River Valley. The improved prediction is primarily attributed to the improvements in the predicted climatological summer mean rainfall and circulations, Nino 3.4 SST anomaly, and the rainfall anomalies associated with the development and decay of El Nino events. However, the MOD still has biases in the predicted leading mode of interannual variability of precipitation. The leading mode captures the dry (wet) anomalies over the South China Sea (northern East Asia) but misplaces precipitation anomalies over the Yangtze River Valley. The model can capture the interannual variation of the circulation indices very well. The results here suggest that, over East Asia land regions, the skillful rainfall prediction relies on not only model’s capability in predicting better summer mean and ENSO teleconnection with EASM, but also accurate prediction of the leading modes of interannual variability. Full article
(This article belongs to the Special Issue Monsoons)
Show Figures

Figure 1

31 pages, 16536 KiB  
Article
Performance Evaluation of CCAM-CTM Regional Airshed Modelling for the New South Wales Greater Metropolitan Region
by Lisa T.-C. Chang, Hiep Nguyen Duc, Yvonne Scorgie, Toan Trieu, Khalia Monk and Ningbo Jiang
Atmosphere 2018, 9(12), 486; https://doi.org/10.3390/atmos9120486 - 08 Dec 2018
Cited by 11 | Viewed by 4332
Abstract
A comprehensive evaluation of the performance of the coupled Conformal Cubic Atmospheric Model (CCAM) and Chemical Transport Model (CTM) (CCAM-CTM) for the New South Wales Greater Metropolitan Region (NSW GMR) was conducted based on modelling results for two periods coinciding with measurement campaigns [...] Read more.
A comprehensive evaluation of the performance of the coupled Conformal Cubic Atmospheric Model (CCAM) and Chemical Transport Model (CTM) (CCAM-CTM) for the New South Wales Greater Metropolitan Region (NSW GMR) was conducted based on modelling results for two periods coinciding with measurement campaigns undertaken during the Sydney Particle Study (SPS), namely the summer in 2011 (SPS1) and the autumn in 2012 (SPS2). The model performance was evaluated for fine particulate matter (PM2.5), ozone (O3) and nitrogen dioxide (NO2) against air quality data from the NSW Government’s air quality monitoring network, and PM2.5 components were compared with speciated PM measurements from the Sydney Particle Study’s Westmead sampling site. The model tends to overpredict PM2.5 with normalised mean bias (NMB) less than 20%, however, moderate underpredictions of the daily peak are found on high PM2.5 days. The PM2.5 predictions at all sites comply with performance criteria for mean fractional bias (MFB) of ±60%, but only PM2.5 predictions at Earlwood further comply with the performance goal for MFB of ±30% during both periods. The model generally captures the diurnal variations in ozone with a slight underestimation. The model also tends to underpredict daily maximum hourly ozone. Ozone predictions across regions in SPS1, as well as in Sydney East, Sydney Northwest and Illawarra regions in SPS2 comply with the benchmark of MFB of ±15%, however, none of the regions comply with the benchmark for mean fractional error (MFE) of 35%. The model reproduces the diurnal variations and magnitudes of NO2 well, with a slightly underestimating tendency across the regions. The MFE and normalised mean error (NME) for NO2 predictions fall well within the ranges inferred from other studies. Model results are within a factor of two of measured averages for sulphate, nitrate, sodium and organic matter, with elemental carbon, chloride, magnesium and ammonium being underpredicted. The overall performance of CCAM-CTM modelling system for the NSW GMR is comparable to similar model predictions by other regional airshed models documented in the literature. The performance of the modelling system is found to be variable according to benchmark criteria and depend on the location of the sites, as well as the time of the year. The benchmarking of CCAM-CTM modelling system supports the application of this model for air quality impact assessment and policy scenario modelling to inform air quality management in NSW. Full article
(This article belongs to the Special Issue Air Quality in New South Wales, Australia)
Show Figures

Figure 1

16 pages, 1418 KiB  
Article
Temporal Dynamics of Nitrous Oxide Emission and Nitrate Leaching in Renovated Grassland with Repeated Application of Manure and/or Chemical Fertilizer
by Arata Nagatake, Ikabongo Mukumbuta, Kaho Yasuda, Mariko Shimizu, Masahito Kawai and Ryusuke Hatano
Atmosphere 2018, 9(12), 485; https://doi.org/10.3390/atmos9120485 - 07 Dec 2018
Cited by 4 | Viewed by 3247
Abstract
Managed grassland is occasionally renovated to maintain plant productivity by killing old vegetation, ploughing, and reseeding. This study aimed to investigate the combined effect of grassland renovation and long-term manure application on the temporal dynamics of nitrous oxide (N2O) emission and [...] Read more.
Managed grassland is occasionally renovated to maintain plant productivity by killing old vegetation, ploughing, and reseeding. This study aimed to investigate the combined effect of grassland renovation and long-term manure application on the temporal dynamics of nitrous oxide (N2O) emission and nitrate nitrogen (NO3–N) leaching. The study was conducted from September 2013 to September 2016 in a managed grassland renovated in September 2013. In this grassland, two treatments were managed—chemical fertilizer application (F treatment) and the combined application of chemical fertilizer and beef cattle manure (MF treatment)—for eight years before the renovation. The control treatment without fertilization (CT) was newly established in the F treatment. The soil N2O flux was measured using a closed chamber method. A leachate sample was collected using a tension-free lysimeter that was installed at the bottom of the Ap horizon (25 cm deep), and total NO3–N leaching was calculated from leachate NO3–N concentration and drainage volume was estimated by the water balance method. In the first year after renovation, the absence of plant nitrogen uptake triggered NO3–N leaching following rainfall during renovation and increased drainage water after thawing. NO3–N movement from topsoil to deeper soil enhanced N2O production and emission from the soil. N2O emission in MF treatment was 1.6–2.0 times larger than those of CT and F treatments, and NO3–N leaching in MF treatment was 2.3–2.6 times larger than those of CT and F treatments in the first year. Mineral nitrogen release derived from long-term manure application increased NO3–N leaching and N2O emission. In the second year, N2O emission and NO3–N leaching significantly decreased from the first year because of increased plant N uptake and decreased mineral nitrogen surplus, and no significant differences in N2O emission and NO3–N leaching were observed among the treatments. In the second and third years, NO3–N leaching was regulated by plant nitrogen uptake. There were no significant differences in NO3–N leaching among the treatments, but N2O emission in MF treatment was significantly smaller than in the F treatment. Long-term manure application could be a possible option to mitigate N2O emission in permanent grassland; however, the risk of increased NO3–N leaching and N2O emission in the renovation year induced by manure nitrogen release should be noted. Full article
(This article belongs to the Special Issue C and N Cycling and Greenhouse Gases Emission in Agroecosystem)
Show Figures

Figure 1

17 pages, 3876 KiB  
Article
Toward a Weather-Based Forecasting System for Fire Blight and Downy Mildew
by Ana Firanj Sremac, Branislava Lalić, Milena Marčić and Ljiljana Dekić
Atmosphere 2018, 9(12), 484; https://doi.org/10.3390/atmos9120484 - 07 Dec 2018
Cited by 2 | Viewed by 4411
Abstract
The aim of this research is to present a weather-based forecasting system for apple fire blight (Erwinia amylovora) and downy mildew of grapevine (Plasmopara viticola) under Serbian agroecological conditions and test its efficacy. The weather-based forecasting system contains Numerical [...] Read more.
The aim of this research is to present a weather-based forecasting system for apple fire blight (Erwinia amylovora) and downy mildew of grapevine (Plasmopara viticola) under Serbian agroecological conditions and test its efficacy. The weather-based forecasting system contains Numerical Weather Prediction (NWP) model outputs and a disease occurrence model. The weather forecast used is a product of the high-resolution forecast (HRES) atmospheric model by the European Centre for Medium-Range Weather Forecasts (ECMWF). For disease modelling, we selected a biometeorological system for messages on the occurrence of diseases in fruits and vines (BAHUS) because it contains both diseases with well-known and tested algorithms. Several comparisons were made: (1) forecasted variables for the fifth day are compared against measurements from the agrometeorological network at seven locations for three months (March, April, and May) in the period 2012–2018 to determine forecast efficacy; (2) BAHUS runs driven with observed and forecast meteorology were compared to test the impact of forecasted meteorological data; and (3) BAHUS runs were compared with field disease observations to estimate system efficacy in plant disease forecasts. The BAHUS runs with forecasted and observed meteorology were in good agreement. The results obtained encourage further development, with the goal of fully utilizing this weather-based forecasting system. Full article
Show Figures

Figure 1

21 pages, 13881 KiB  
Article
Comparison of Simulated Tropical Cyclone Intensity and Structures Using the WRF with Hydrostatic and Nonhydrostatic Dynamical Cores
by Fujun Qi, Jianfang Fei, Zhanhong Ma, Jinrong Chen, Xiaogang Huang and Xiaoping Cheng
Atmosphere 2018, 9(12), 483; https://doi.org/10.3390/atmos9120483 - 07 Dec 2018
Cited by 5 | Viewed by 3980
Abstract
This study explored the influence of choosing a nonhydrostatic dynamical core or a hydrostatic dynamical core in the weather research and forecasting (WRF) model on the intensity and structure of simulated tropical cyclones (TCs). A comparison of cloud-resolving simulations using each core revealed [...] Read more.
This study explored the influence of choosing a nonhydrostatic dynamical core or a hydrostatic dynamical core in the weather research and forecasting (WRF) model on the intensity and structure of simulated tropical cyclones (TCs). A comparison of cloud-resolving simulations using each core revealed significant differences in the TC simulations. In comparison with the nonhydrostatic simulation, the hydrostatic simulation produced a stronger and larger TC, associated with stronger convective activity. A budget analysis of the vertical momentum equation was conducted to investigate the underlying mechanisms. Although the hydrostatic dynamical core was used, the vertical motion was not in strict hydrostatic balance because of the existence of the vertical perturbation pressure gradient force, local buoyancy force, water loading, and sum of the Coriolis and diffusion effects. The contribution of the enhanced vertical perturbation pressure gradient force was found to be more important for stronger upward acceleration in the eyewall in the hydrostatic simulation than in the nonhydrostatic simulation. This is because it leads to intensified convection in the eyewall that releases more latent heat, which induces a larger low-level radial pressure gradient and inflow motion, and eventually leads to a stronger storm. Full article
(This article belongs to the Section Meteorology)
Show Figures

Figure 1

12 pages, 2912 KiB  
Article
Space-Time Variability of the Rainfall over Sahel: Observation of a Latitudinal Sharp Transition of the Statistical Properties
by Abdoulaye Sy, Christophe Duroure, Jean-Luc Baray, Yahya Gour, Joël Van Baelen and Bouya Diop
Atmosphere 2018, 9(12), 482; https://doi.org/10.3390/atmos9120482 - 07 Dec 2018
Cited by 2 | Viewed by 2803
Abstract
The rain statistics of 0–45° N area including equatorial, Sahelian, and mid-latitude regions, are studied using the probability distributions of the duration of rainy and dry events. Long time daily data set from ground measurements and satellite observations of rain fields are used. [...] Read more.
The rain statistics of 0–45° N area including equatorial, Sahelian, and mid-latitude regions, are studied using the probability distributions of the duration of rainy and dry events. Long time daily data set from ground measurements and satellite observations of rain fields are used. This technique highlights a sharp latitudinal transition of the statistics between equatorial and all other regions (Sahel, mid-latitude). The probability distribution of the 8° S to 8° N latitude band shows a large-scale organization with a slow decreasing (power law decrease) distributions for the time and space size of rain events. This observation is in agreement with a scaling, or macro turbulent, behavior of the equatorial regions rain fields. For the Sahelian and mid-latitude regions, our observations are clearly not in agreement with this behavior. They show that the largest rain systems have a limited time and space size (well described with a decreasing exponential distribution). For these non-equatorial regions it is possible to define a local characteristic duration and a characteristic horizontal size of the large rain events. These characteristics time and space scales of observed mesoscale convective systems could be a sensible indicator for the detection of the possible trend of rain distribution properties due to anthropogenic influence. Full article
(This article belongs to the Special Issue African Rainfall Variability: Science and Society)
Show Figures

Figure 1

12 pages, 2238 KiB  
Article
A Novel Method for the Recognition of Air Visibility Level Based on the Optimal Binary Tree Support Vector Machine
by Naishan Zheng, Manman Luo, Xiuguo Zou, Xinfa Qiu, Jingxia Lu, Jiaqi Han, Siyu Wang, Yuning Wei, Shikai Zhang and Heyang Yao
Atmosphere 2018, 9(12), 481; https://doi.org/10.3390/atmos9120481 - 06 Dec 2018
Cited by 6 | Viewed by 2895
Abstract
As the traditional methods for the recognition of air visibility level have the disadvantages of high cost, complicated operation, and the need to set markers, this paper proposes a novel method for the recognition of air visibility level based on an optimal binary [...] Read more.
As the traditional methods for the recognition of air visibility level have the disadvantages of high cost, complicated operation, and the need to set markers, this paper proposes a novel method for the recognition of air visibility level based on an optimal binary tree support vector machine (SVM) using image processing techniques. Firstly, morphological processing is performed on the image. Then, whether the region of interest (ROI) is extracted is determined by the extracted feature values, that is, the contrast features and edge features are extracted in the ROI. After that, the transmittance features of red, green and blue channels (RGB) are extracted throughout the whole image. These feature values are used to construct the visibility level recognition model based on optimal binary tree SVM. The experiments are carried out to verify the proposed method. The experimental results show that the recognition accuracies of the proposed method for four levels of visibility, i.e., good air quality, mild pollution, moderate pollution, and heavy pollution, are 92.00%, 92%, 88.00%, and 100.00%, respectively, with an average recognition accuracy of 93.00%. The proposed method is compared with one-to-one SVM and one-to-many SVM in terms of training time and recognition accuracy. The experimental results show that the proposed method can distinguish four levels of visibility at a relatively satisfactory level, and it performs better than the other two methods in terms of training time and recognition accuracy. This proposed method provides an effective solution for the recognition of air visibility level. Full article
(This article belongs to the Section Air Quality)
Show Figures

Figure 1

13 pages, 1259 KiB  
Article
Combination of Warming and Vegetation Composition Change Strengthens the Environmental Controls on N2O Fluxes in a Boreal Peatland
by Yu Gong, Jianghua Wu, Judith Vogt, Thuong Ba Le and Tao Yuan
Atmosphere 2018, 9(12), 480; https://doi.org/10.3390/atmos9120480 - 06 Dec 2018
Cited by 7 | Viewed by 3007
Abstract
Climate warming and vegetation composition change are expected to influence greenhouse gas emissions from boreal peatlands. However, the interactive effects of warming and different vegetation compositions on N2O dynamics are poorly known, although N2O is a very potent greenhouse [...] Read more.
Climate warming and vegetation composition change are expected to influence greenhouse gas emissions from boreal peatlands. However, the interactive effects of warming and different vegetation compositions on N2O dynamics are poorly known, although N2O is a very potent greenhouse gas. In this study, manipulated warming and vegetation composition change were conducted in a boreal peatland to investigate the effects on N2O fluxes during the growing seasons in 2015 and 2016. We did not find a significant effect of warming treatment and combination treatments of warming and vegetation composition change on N2O fluxes. However, sedge removal treatment significantly increased N2O emissions by three-fold. Compared with the treatment of shrub and sedge removal, the combined treatment of warming and shrub and sedge removal significantly increased N2O consumption by five-fold. Similar to N2O fluxes, the cumulative N2O flux increased by ~3.5 times under sedge removal treatment, but this effect was not significant. In addition, the results showed that total soil nitrogen was the main control for N2O fluxes under combinative treatments of warming and sedge/shrub removal, while soil temperature and dissolved organic carbon were the main controls for N2O release under warming combined with the removal of all vascular plants. Our results indicate that boreal peatlands have a negligible effect on N2O fluxes in the short-term under climate change, and environmental controls on N2O fluxes become increasingly important under the condition of warming and vegetation composition change. Full article
(This article belongs to the Special Issue Surface-Atmosphere Exchange: Impact on Biogeochemistry)
Show Figures

Figure 1

12 pages, 1793 KiB  
Article
Quantifying Thermal Stress for Sport Events—The Case of the Olympic Games 2020 in Tokyo
by Andreas Matzarakis, Dominik Fröhlich, Stéphane Bermon and Paolo Emilio Adami
Atmosphere 2018, 9(12), 479; https://doi.org/10.3390/atmos9120479 - 05 Dec 2018
Cited by 22 | Viewed by 6615
Abstract
The effect of weather on sport events is largely discussed in the sports medicine and exercise physiology context. It is important, both for event organizers and for medical staff, to know whether the competition is happening at a time and place with extreme [...] Read more.
The effect of weather on sport events is largely discussed in the sports medicine and exercise physiology context. It is important, both for event organizers and for medical staff, to know whether the competition is happening at a time and place with extreme weather or in general not appropriate weather and climatic conditions. In order to find out, whether a place or time is appropriate, two factors should be included when establishing the effect of atmospheric conditions on visitors and athletes. These are the main climatic conditions, based on long term data, and the quantification of extreme events, like heat waves. The present analysis aims at determining what kind of data are required for an appropriate quantification of weather and climate thermal stress. For the analysis, indices like Physiologically Equivalent Temperature (PET) and mPET (modified PET) are applied. The advantage of these indices is the consideration of both, thermo-physiological and meteorological factors to provide results and information that can be used for decision making. In this paper, we analyzed the Tokyo area with regards to the upcoming Tokyo 2020 Summer Olympic Games. The results show that this kind of event may not be appropriate for visitors, if it is placed during months with extreme conditions. For Tokyo, this is the period from May to September, when conditions cause strong heat stress to the visitors for the vast majority of hours of the day. A more appropriate time would be the months from November to February or the early morning and the late afternoon hours, when thermally comfortable conditions are much more frequent. The methods that are applied here can quantify the thermal conditions and show limitations and possibilities for specific events and locations. Should the organizers still want to have these competitions organized during these months with extreme conditions, they should promote and propose all possible countermeasures for the spectators, workforce, and athletes. Full article
(This article belongs to the Section Biometeorology)
Show Figures

Figure 1

15 pages, 4879 KiB  
Article
Contrasting Impacts of ENSO on the Interannual Variations of Summer Runoff between the Upper and Mid-Lower Reaches of the Yangtze River
by Xiaochen Ye and Zhiwei Wu
Atmosphere 2018, 9(12), 478; https://doi.org/10.3390/atmos9120478 - 05 Dec 2018
Cited by 16 | Viewed by 4023
Abstract
The Yangtze River Basin is an El Niño–Southern Oscillation (ENSO)-sensitive region, prone to floods and droughts. Hydrological records were collected to examine the temporal and spatial distribution of runoff in this drainage basin. An apparent difference in runoff variations between the upper and [...] Read more.
The Yangtze River Basin is an El Niño–Southern Oscillation (ENSO)-sensitive region, prone to floods and droughts. Hydrological records were collected to examine the temporal and spatial distribution of runoff in this drainage basin. An apparent difference in runoff variations between the upper and mid-lower Yangtze reaches was detected in response to ENSO. The upper basin usually experiences floods or droughts during the summer of ENSO developing years, while the mid-lower runoff variations tend to coincide with ENSO decaying phases. Composite analysis is employed to investigate the underlying mechanism for the teleconnection between the specific phases of the ENSO cycle and Yangtze runoff variation. Results show that the Western Pacific Subtropical High (WPSH) exhibits large variability on its western side in summer with different ENSO phases, thus resulting in a contrasting influence between the upper and mid-lower Yangtze floods and droughts. During the central Pacific-La Niña developing summers, the WPSH is significantly enhanced with its westward extension over the Yangtze upper basin. Anomalous water vapor converges in its northwest edge thus favoring upper-basin flooding. Meanwhile, the mid-lower reaches are controlled by the WPSH, and the local rainfall is not obvious. In addition, when the El Niño decaying phases occur, the WPSH denotes a westward extending trend and the position of its ridge line shifts to the mid-lower Yangtze reaches. The southwest moisture cannot extend to the upper basin but converges in the mid-lower basin. Accompanied by the anomalous 100 hPa South Asia High and lower-tropospheric Philippines anticyclone movements, this upper–middle–lower configuration acts as a key bridge linking ENSO and Yangtze floods and droughts. Full article
Show Figures

Figure 1

21 pages, 102168 KiB  
Article
Observed Trends and Changes in Temperature and Precipitation Extreme Indices over Myanmar
by Kyu Kyu Sein, Amnat Chidthaisong and Kyaw Lwin Oo
Atmosphere 2018, 9(12), 477; https://doi.org/10.3390/atmos9120477 - 04 Dec 2018
Cited by 38 | Viewed by 8027
Abstract
Projected increase in frequency and severity of extreme events are important threat brought by climate change. Thus, there is a need to understand the dynamics and magnitude of climate extreme at local and regional level. This study examines the patterns of annual trends [...] Read more.
Projected increase in frequency and severity of extreme events are important threat brought by climate change. Thus, there is a need to understand the dynamics and magnitude of climate extreme at local and regional level. This study examines the patterns of annual trends and changes of extreme daily temperature and precipitation in Myanmar for the period of 1981 to 2015 using the RClimDex 1.1 software. The trends of maximum and minimum temperature show significant warming trends (p < 0.001) across Myanmar. From 2009 to 2015, the maximum temperature anomaly has continuously increased by 0.5 °C for all years except 2011. The larger rise in both maximum and minimum temperature observed after 2000 suggests that, overall, days and nights are becoming hotter for the entirety of Myanmar over this recent period. Furthermore, our works also show that the temperature extreme indices of warm days and warm nights have increased, whereas the frequency of cool days and cool nights have decreased. Our analysis also reveals that increasing trends in precipitation anomaly were not significant during 1981–2015. On the contrary, slight increasing trends towards wetter conditions were observed with a rate of 76.52 mm/decade during the study period. The other precipitation extreme indicators—namely, annual total precipitation (PRCPTOT), heavy precipitation days (R20mm), extreme wet days precipitation (R99p), and consecutive wet days (CWD)—are consistent with warming trends. Additionally, the relationship between inter-annual variability in the climate extremes indices and Oceanic Niño Index (ONI) patterns was also examined with a focus on the influence of the El Niño-Southern Oscillation (ENSO) phenomenon. Full article
(This article belongs to the Section Meteorology)
Show Figures

Figure 1

17 pages, 1872 KiB  
Article
The Impact of Divalent Cations on the Enrichment of Soluble Saccharides in Primary Sea Spray Aerosol
by Steven R. Schill, Susannah M. Burrows, Elias S. Hasenecz, Elizabeth A. Stone and Timothy H. Bertram
Atmosphere 2018, 9(12), 476; https://doi.org/10.3390/atmos9120476 - 04 Dec 2018
Cited by 19 | Viewed by 5380
Abstract
Field measurements have shown that sub-micrometer sea spray aerosol (SSA) is significantly enriched in organic material, of which a large fraction has been attributed to soluble saccharides. Existing mechanistic models of SSA production struggle to replicate the observed enhancement of soluble organic material. [...] Read more.
Field measurements have shown that sub-micrometer sea spray aerosol (SSA) is significantly enriched in organic material, of which a large fraction has been attributed to soluble saccharides. Existing mechanistic models of SSA production struggle to replicate the observed enhancement of soluble organic material. Here, we assess the role for divalent cation mediated co-adsorption of charged surfactants and saccharides in the enrichment of soluble organic material in SSA. Using measurements of particle supersaturated hygroscopicity, we calculate organic volume fractions for molecular mimics of SSA generated from a Marine Aerosol Reference Tank. Large enhancements in SSA organic volume fractions (Xorg > 0.2) were observed for 50 nm dry diameter (dp) particles in experiments where cooperative ionic interactions were favorable (e.g., palmitic acid, Mg2+, and glucuronic acid) at seawater total organic carbon concentrations (<1.15 mM C) and ocean pH. Significantly smaller SSA organic volume fractions (Xorg < 1.5 × 10⁻³) were derived from direct measurements of soluble saccharide concentrations in collected SSA with dry diameters <250 nm, suggesting that organic enrichment is strongly size dependent. The results presented here indicate that divalent cation mediated co-adsorption of soluble organics to insoluble surfactants at the ocean surface may contribute to the enrichment of soluble saccharides in SSA. The extent to which this mechanism explains the observed enhancement of saccharides in nascent SSA depends strongly on the concentration, speciation, and charge of surfactants and saccharides in the sea surface microlayer. Full article
(This article belongs to the Special Issue Ocean Contributions to the Marine Boundary Layer Aerosol Budget)
Show Figures

Figure 1

Previous Issue
Next Issue
Back to TopTop