1. Introduction
Almost all aspects of any society are controlled and affected by climate, as it dominantly influences agriculture, economy, transportation, telecommunication, air pollution, and even political relations between countries. During the last half century, the world has faced intense changes in climate the impact of which can be seen in global average precipitation and temperature variations leading to large floods or droughts in different parts of the world. According to recent analyses, the global dry areas have increased 1.74% per decade since 1950 [
1] mainly in highly populated semi-arid regions in the Middle East, Africa, and the south of the USA. Although climate change is hot scientific topic and many investigations have been done in this subject, its influence on components of water cycle particularly precipitation needs further investigations. According to a past paper [
2], among the many challenges related to the hydrological cycle, those concerned with the atmospheric transport of moisture must receive special attention because of their importance within the atmospheric sciences. The moisture for precipitation is mainly provided by local evaporation or is transported by the wind from other regions [
3]. The moisture responsible for heavy and moderate precipitations in semi-arid and arid regions is mainly transported into the region and is not related to local evaporation [
4]. Three principle methods are normally used for the identification of moisture sources: numerical water vapour tracers, analytical or box models, and physical water vapour tracers (isotopes) [
5]. Although it is obvious that analytical and numerical models are powerful tools for atmospheric investigations, they should be validated by physical methods.
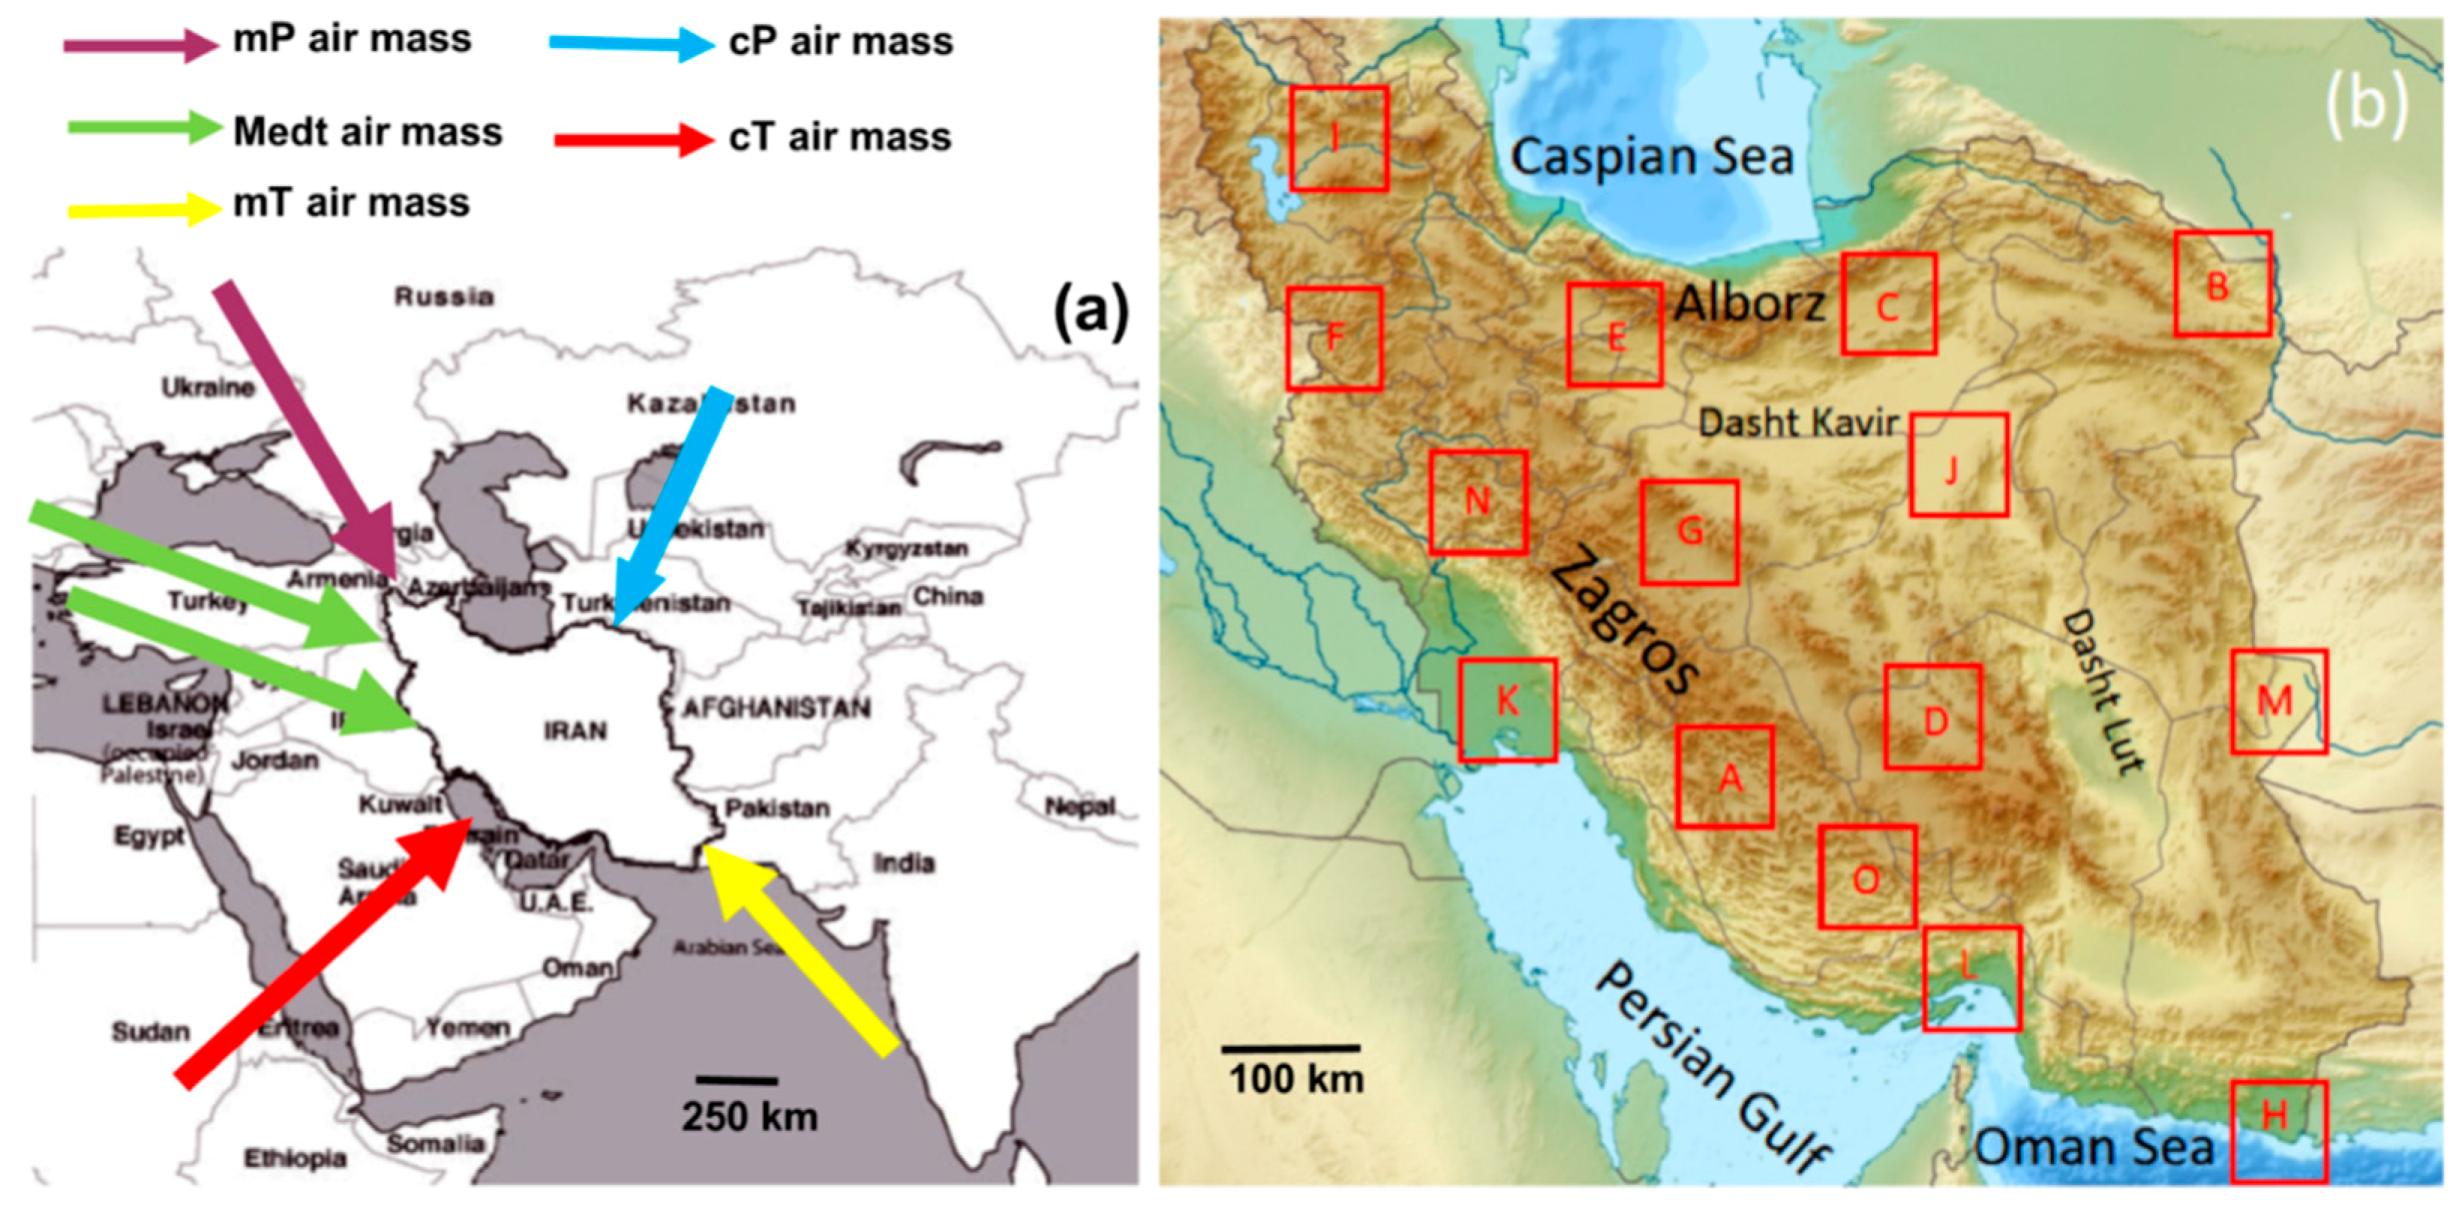
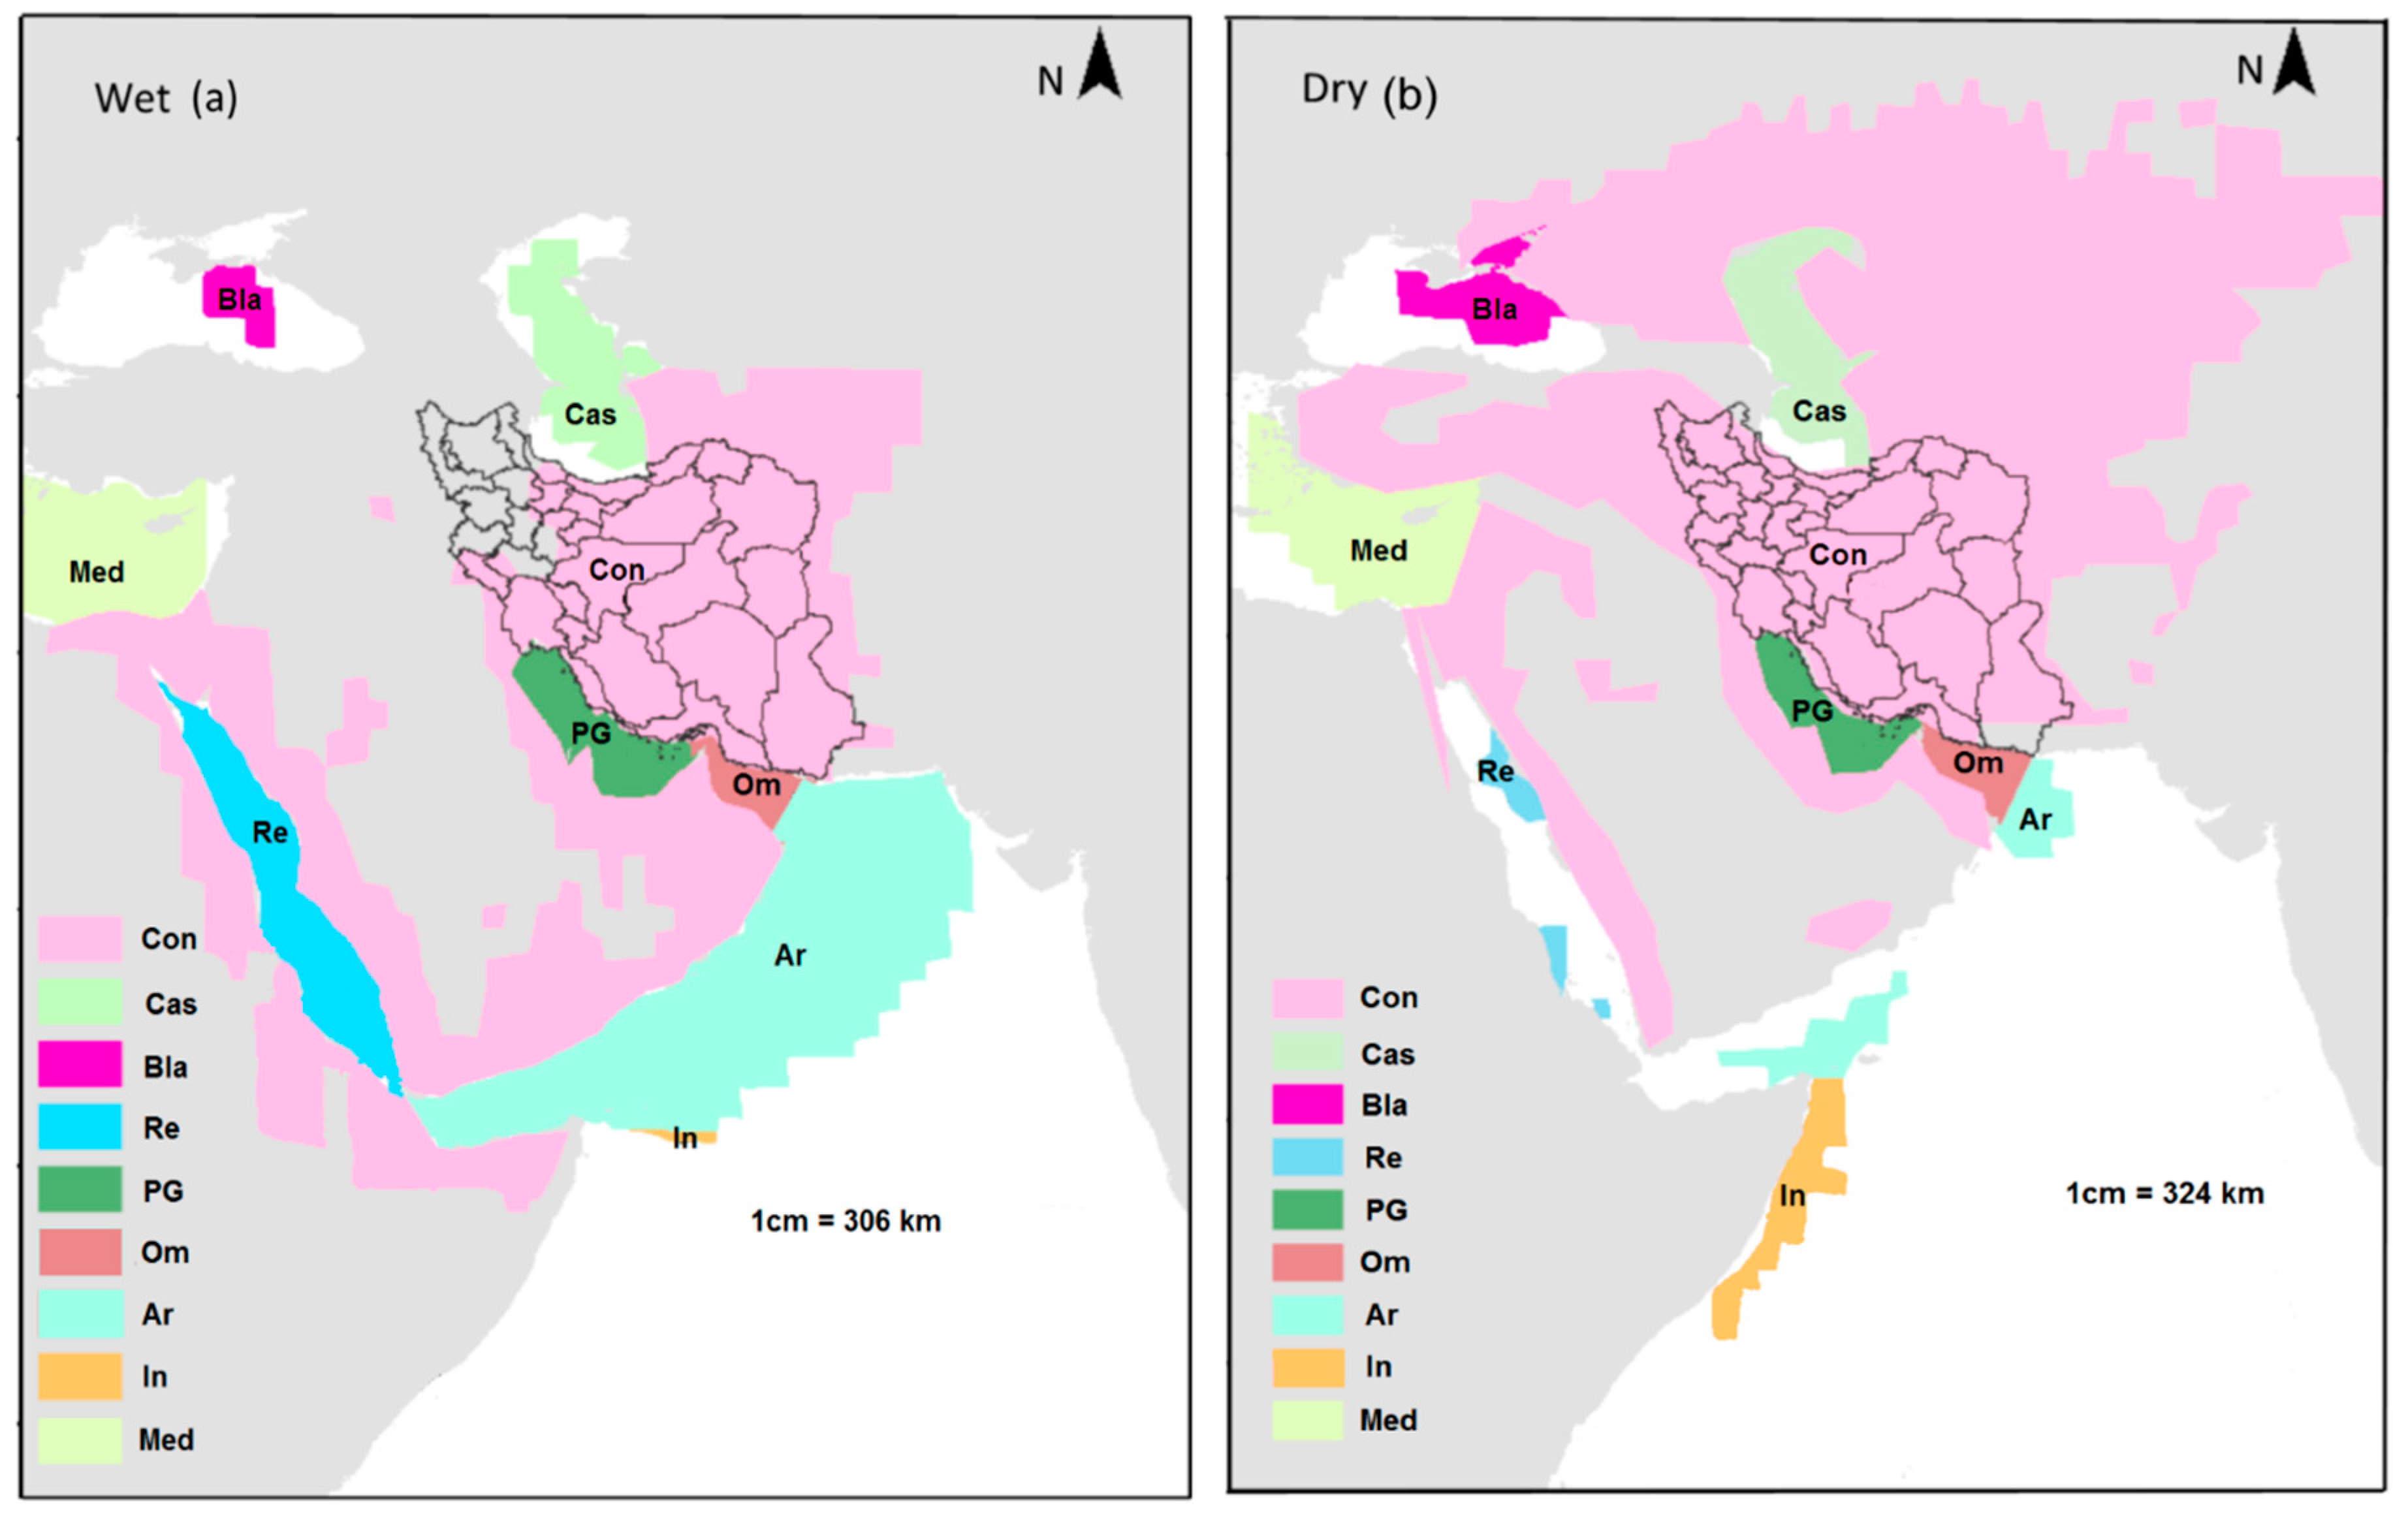
Iran is located in the southwest of Asia with an area of 1,648,195 km
2 and is limited between latitudes 25° N to 40° N and longitudes 44° E to 64° E. Iran’s topography is very complicated as two large mountain ranges (the Alborz mountain range with maximum elevation of 5670 m on Damavand’s peak extending in the east–west direction and the Zagros mountain range with maximum elevation of 4409 m on Dena’s peak extending in the north–west and south–east directions) border two large deserts of Dasht-e Lut and Dasht-e Kavir in central Iran. Iran is bordered by three large waterbodies: the Persian Gulf (with 1400 km length of coastline), the Oman Sea (with 637 km length of coastline) in the south, and the Caspian Sea (with 922 km length of coastline) in the north (
Figure 1). Alborz and Zagros mountain ranges influence Iran’s climatology dominantly, as they prevent air masses from bringing moisture toward the internal part of Iran plateau (central Iran) which results in low amounts of annual precipitation in central Iran [
6]. Iran is located in a semi-arid and arid part of the world with an annual precipitation average of 252 mm. For the purpose of this study we distinguish two seasons: wet (November to April) and dry (May to October), based on previous climatological studies in Iran [
7,
8,
9]. Iran’s weather is influenced by various air masses arrive from the north, west, southwest, and southeast directions. Siberian cold continental air mass (known as (cP) air mass) enters from the north and is blocked by the Alborz mountain range causing huge precipitation (more than 1300 mm per year) along the coastal area of the Caspian Sea and the northern slope of the Alborz mountain range. This air mass brings moisture from the Caspian Sea to Iran. The Sudan air mass influences the south and southwest of Iran and mainly brings moisture from the Arabian Sea, the Red Sea, the Persian Gulf, and the Oman Sea [
6]. Occasionally, Sudan air mass merges with the Mediterranean system and causes heavy rainfalls and floods in the south and southwest of Iran [
10]. The systems which influence the western and northwestern parts of Iran are the Mediterranean, north Atlantic, and Black Sea cyclones which are rich in humidity and have a dominant role in the precipitation and cloudiness of this region [
6,
10]. In addition to the mentioned systems which influence Iran during the wet season, Iran is also influenced by the Indian summer monsoon from the southeast direction which brings warm humid air, strong winds, and heavy rainfalls during the dry season [
10]. Iran’s spatial and temporal precipitation distribution is variable due to its vast area, large latitude variations, complex topography, large nearby waterbodies and various humidity sources, and air masses influencing it [
7]. The maximum annual precipitation occurs in the west coast of the Caspian Sea (over 1300 mm) and to a lower extent in some parts of Zagros mountain range (~700 mm) [
10], while the lowest amount of precipitation occurs in the centre and southeast of Iran (less than 100 mm) [
11]. Numerous studies have been done on spatial and temporal variations of precipitation in Iran including [
6,
7,
9,
12,
13,
14,
15,
16,
17]. But few of these studies [
6,
18] focus on the moisture sources of Iran’s precipitation due to the complexity of moisture sources identification, the lack of precise equipment and monitoring systems, and reliable sets of data.
During the last few decades, new types of models such as HYSPLIT (U.S. National Atmospheric and Oceanic Administration (NOAA) Air resources Laboratory (ARL), Maryland, USA) and FLEXPART (Norsk Institutt for luftforskning (NILU), Norway) which consider climatological parameters on a daily or even hourly basis have improved climatological studies of the hydrological cycle dominantly.
FLEXPART v9.0 developed previously [
19,
20] is a Lagrangian Particle Dispersion Model. The main advantage of using FLEXPART is its robustness to obtain the budget of (E-P) along air parcel trajectories tracked backward and forward in time and numerous and successful projects have been implemented by this method in the Sahel region [
21], Iceland [
22], Orinoco river basin [
23], Central Brazil [
24], Central America [
25], China [
26], the Danub River Basin [
27], and the Niger River Basin [
28]. In this study, the goal is to identify Iran’s sources of moisture during the dry (May to October) and wet (November to April) seasons and to calculate the moisture uptake from these sources. Achieving this goal enables us to determine and investigate Iran’s main seasonal sources of moisture. Likewise, the correlations between the (E-P) values of continental and oceanic moisture sources with Standard Precipitation Index (SPI) of 1, 6, and 12 months have been studied using multicomponent regression models.
2. Materials and Methods
In this study, the FLEXible PARTicle dispersion model (FLEXPART) v9.0 model [
19,
20] has been used to track 10 days backward in time (the average residence time of water vapour in the atmosphere [
29]) the air particles residing over Iran and also over 15 studied locations of Shiraz, Mashhad, Shahrood, Rafsanjan, Hashtgerd, Marivan, Isfahan, Chabahar, Tabriz, Tabas, Ahvaz, Bandar Abbas, Zabol, Khoram Abad, and Darab with 1° in longitude and latitude over Iran during the dry and wet season in period from 1981 to 2015 (
Figure 1).
As input data to run FLEXPART model we used ERA-Interim reanalysis datasets from the European Centre for Medium-Range Weather Forecast (ECMWF) [
30] at a 1° horizontal resolution on 61 vertical levels from 0.1 to 1000 hPa. In a global experiment, FLEXPART v9.0 divides the atmosphere into approximately 2,000,000 uniformly distributed particles with the same mass, and then moving these particles with time through a 3-dimensional wind field (two horizontal dimensions and one vertical dimension) [
31,
32,
33]. Along the trajectories, for each parcel the evaporation is
e and the precipitation is
p. The balance of evaporation (
e) minus precipitation (
p) is calculated considering the changes of specific humidity (
q) in each air particle within time (t), keeping constant the mass of the parcels, which is described by Equation (1):
The summation of (
e − p) values of all particles in the atmospheric column over an area results in the net fresh water flux (E-P) of the related particles, where (E) represents evaporation and (P) represents precipitation per unit area. Along the backward trajectories, the (E-P) > 0 values indicate regions where evaporation exceeds precipitation, allowing one to identify where the air masses gain their moisture. On the contrary, (E-P) < 0 values demonstrate regions where precipitation dominates evaporation and are considered as moisture sinks [
19,
20]. As the aim of this study is to determine the moisture sources, only positive values of (E-P) have been considered. The (E-P) > 0 values have been calculated for both continental and oceanic moisture sources. The moisture uptake from each oceanic sources has been calculated by masking each waterbodies area from the oceanic (E-P) > 0 map. Then, using each waterbody’s (E-P) > 0 map and amassing (e-p) for all the particles residing in the atmospheric column over an area, (E-P) values for each oceanic source have been calculated. As the locations of the continental moisture sources cover a vast area in both the dry and wet periods, the roles of each land use in providing moisture have been considered using a global land use map (1 × 1 degree) from The Global Land Cover Facility [
34]. For continental sources, calculating (E-P) values for each source has been the same as oceanic sources. The area of continental (E-P) > 0 map has been masked from the global land use map. Then, using each land use (E-P) > 0 map and adding (e-p) for all the particles in the atmospheric column over an area, continental (E-P) value for each land use has been determined.
Although this method has numerous advantages, it has some limitations as evaporation (E) and precipitation (P) cannot be calculated separately and the quality of input data has a great influence on the reliability of the method. However, due to the large number of air particles in this method, it is hoped that the errors omit the effects of each other [
27,
35].
Finally, the linear relationship between (E-P) > 0 values (oceanic and continental) and SPI values [
36] at the time scales of 1, 6, and 12 months have also been investigated by a multiregression model. Precipitation data sets of Climatic Research Unit (CRU3.23TS) constructed from monthly precipitation data of global meteorological stations [
37] were used to calculate SPI values for Iran. The negative SPI values indicate less than median precipitation in long-term precipitation time series and drought conditions, while positive SPI values indicate greater than median precipitation and wet conditions. If the amount of precipitation is null, it will cause non-normal distribution in data sets and distorted SPI values [
38,
39]. Two normality tests of Shapiro–Wilk and Kolmogorov–Smirnov have been carried out to determine the normality of data. Non-normal series were normalized using Johnson’s transformation.
3. Results and Discussion
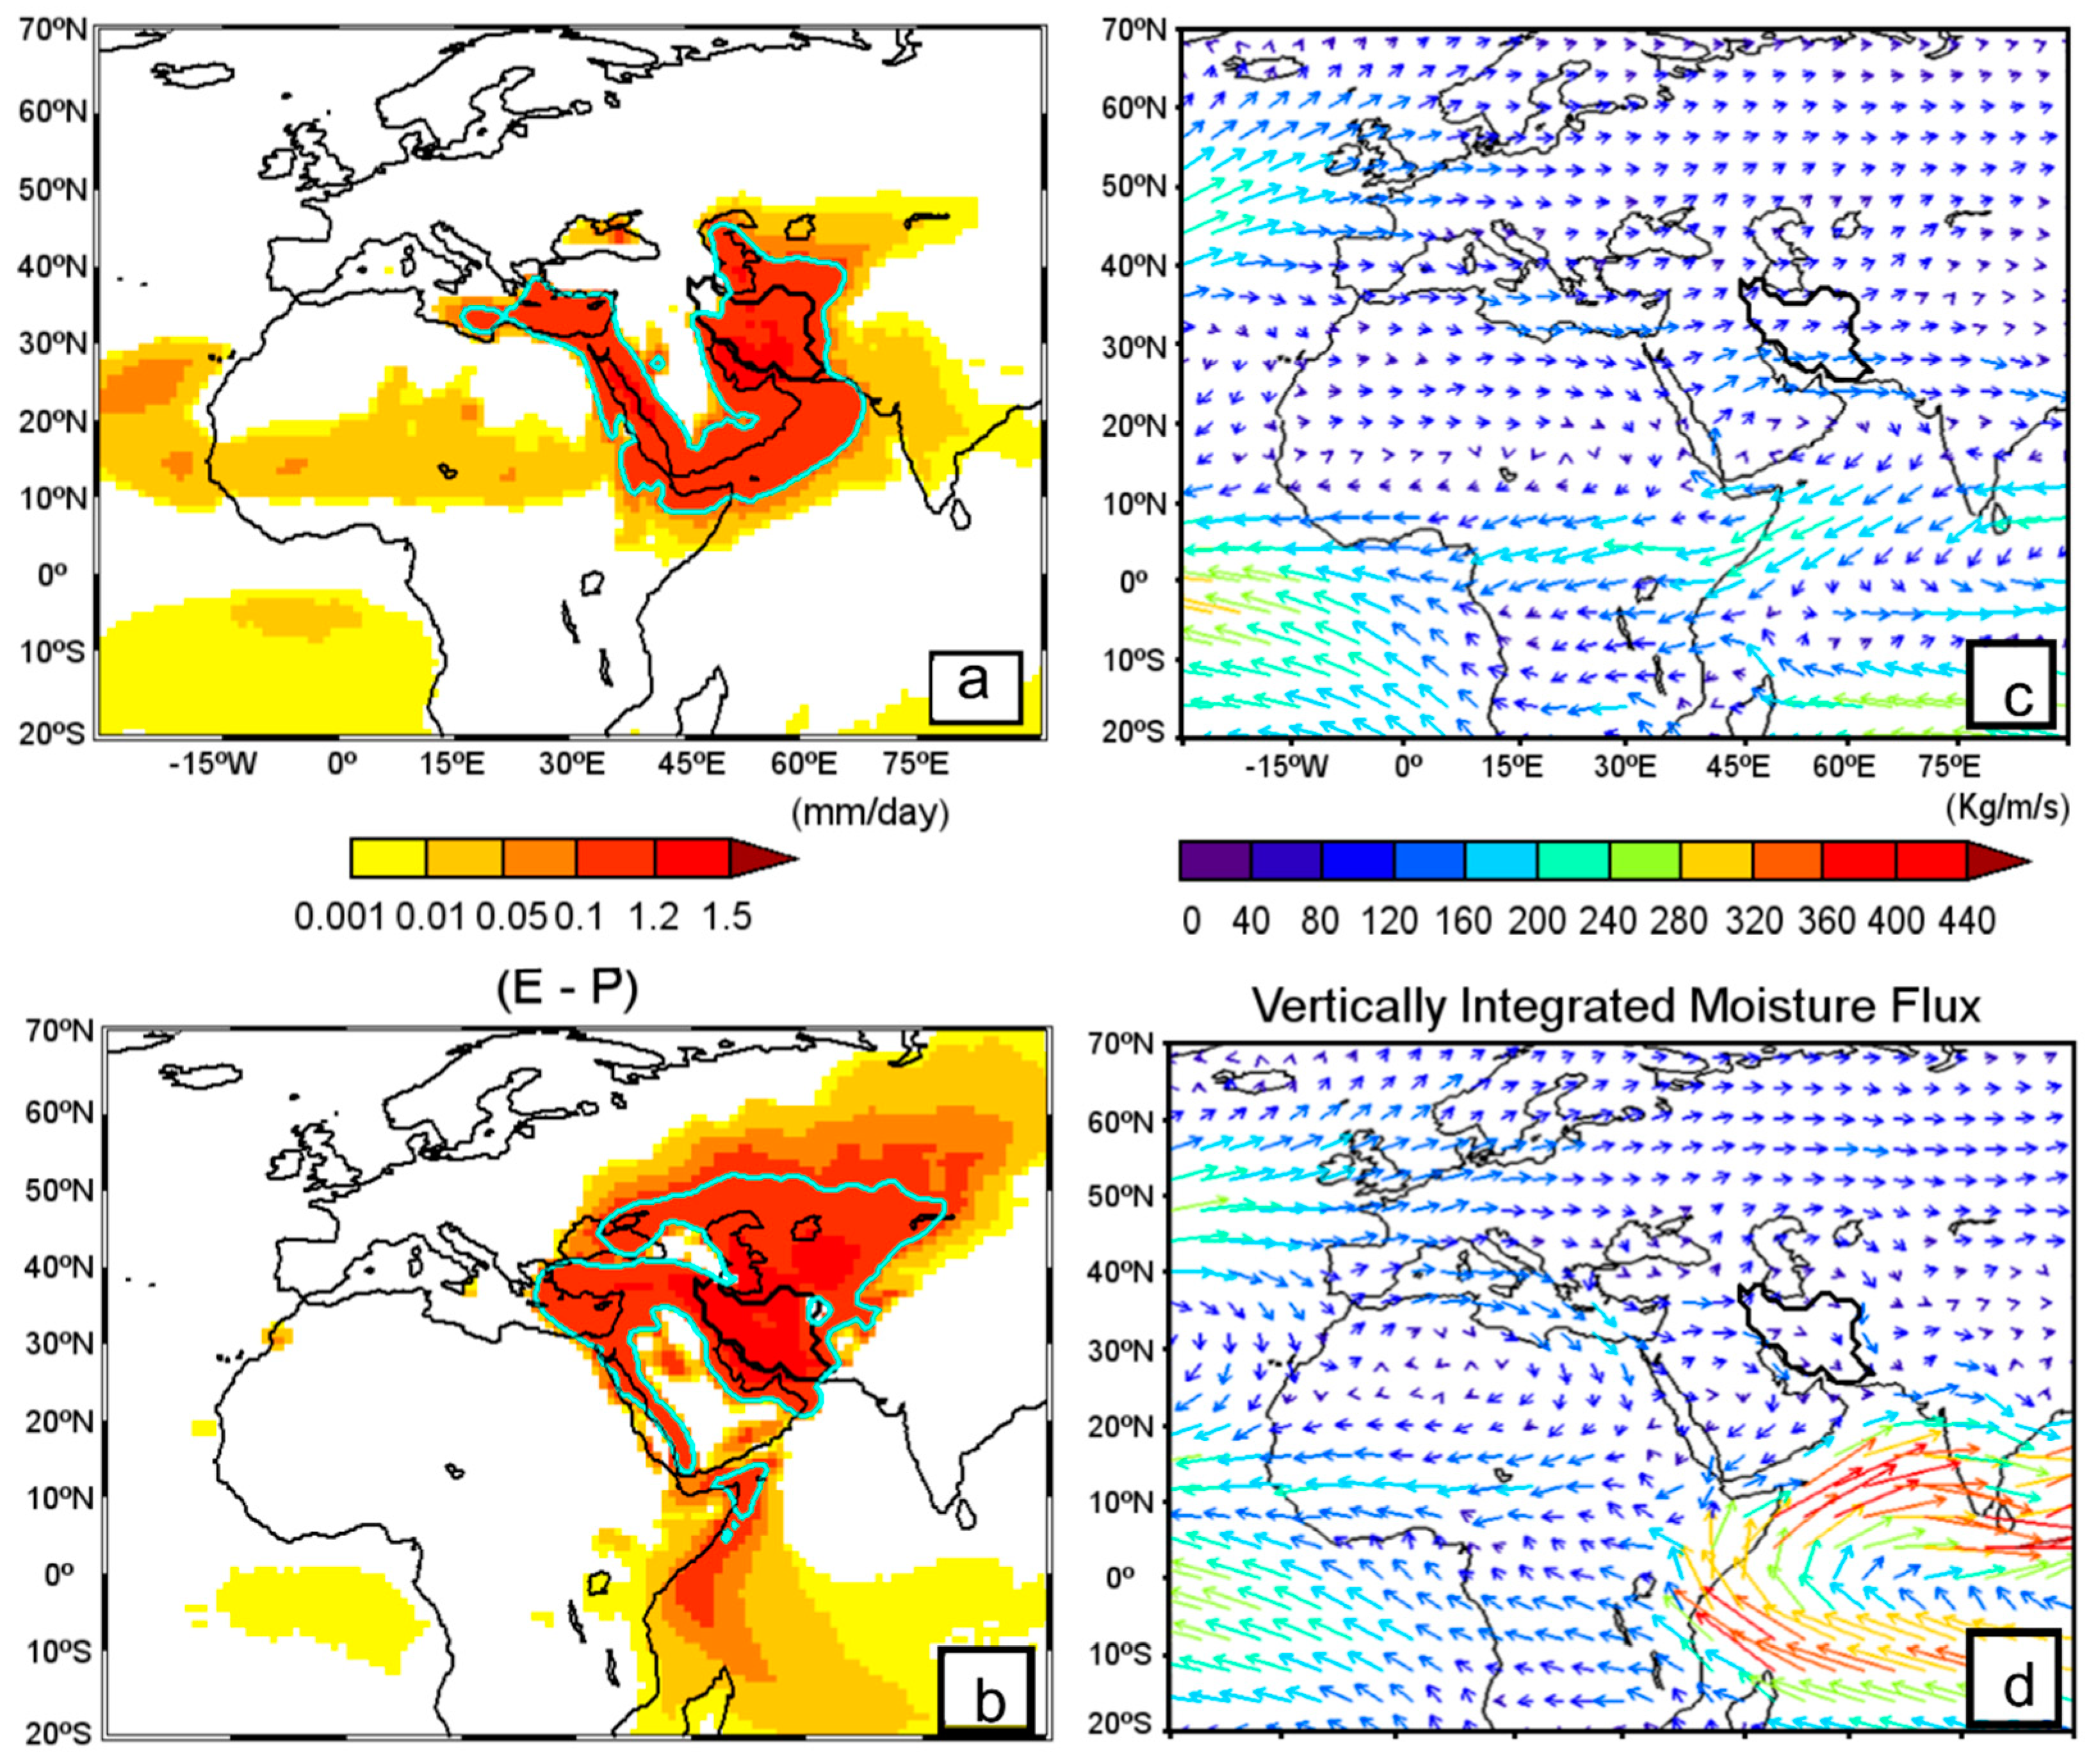
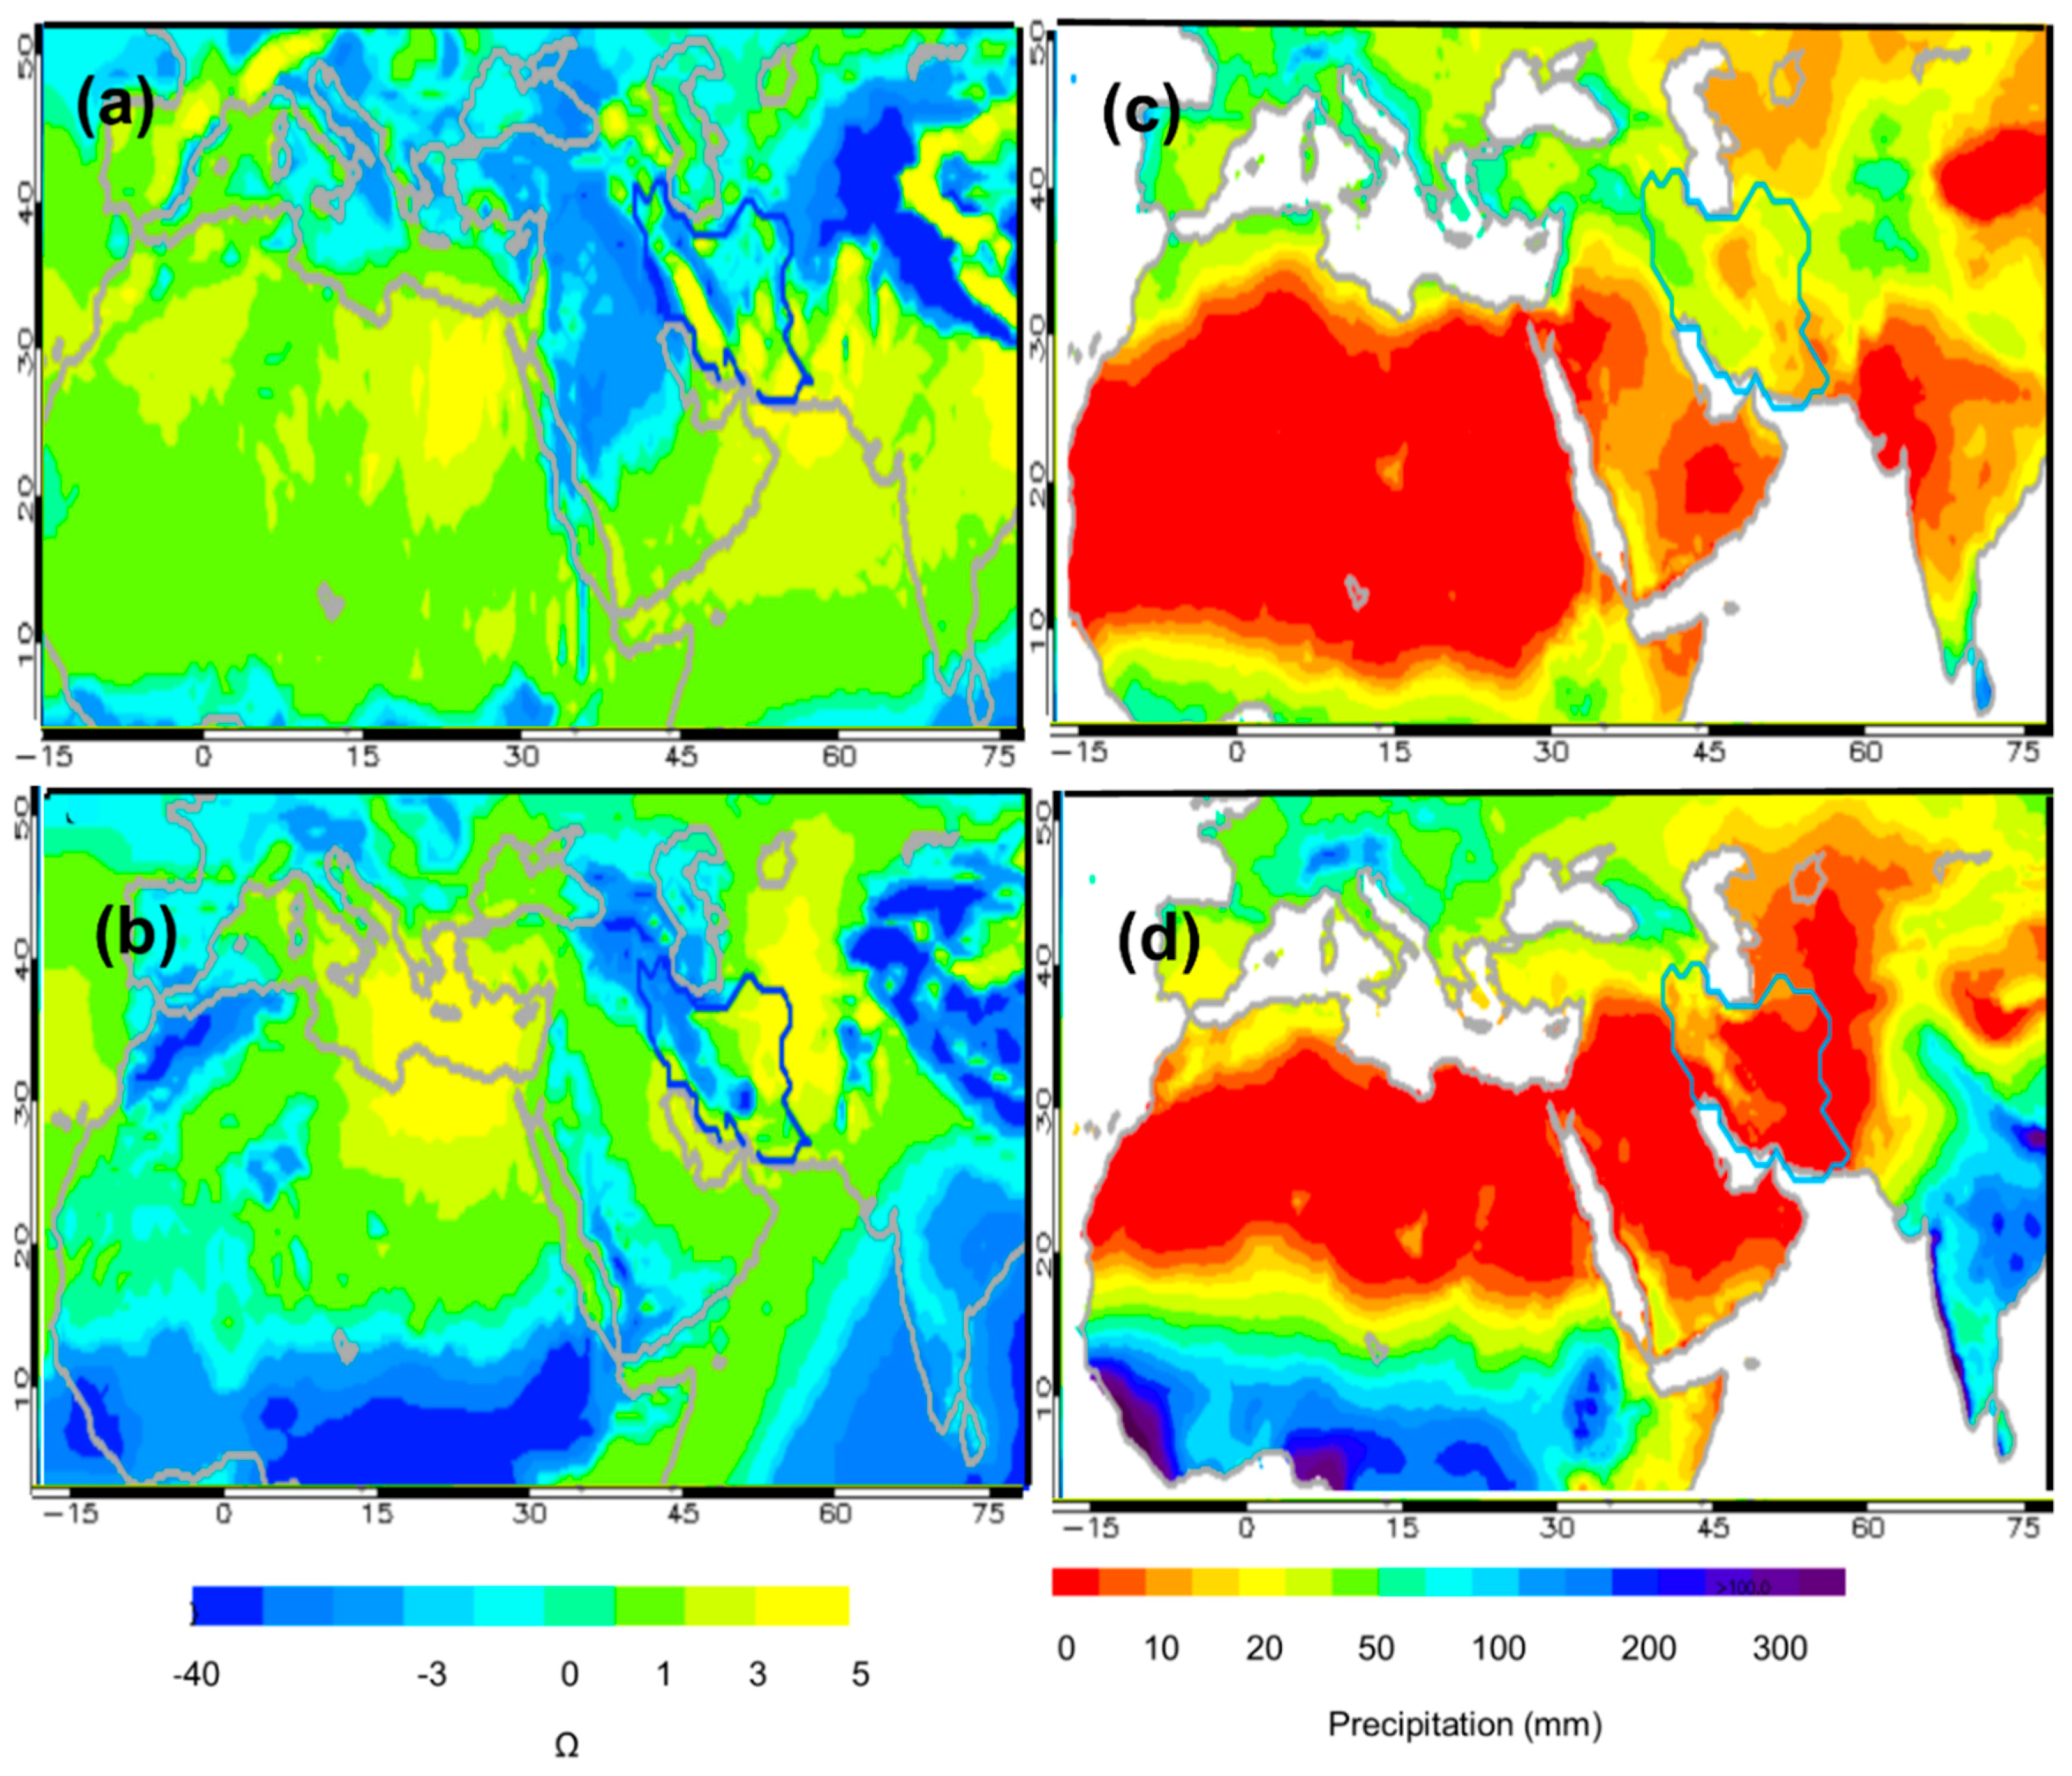
The climatological field of (E-P) > 0 obtained by the analysis of backward trajectories of air masses arriving over Iran for the wet and dry seasons from 1981 to 2015 (
Figure 2a,b) shows the locations of the main moisture sources and spatial extension changes between the two seasons. Moisture uptake mainly occurs in the south, southwest, and west of Iran in the wet season (
Figure 2a) and in the west and northeast in the dry season (
Figure 2b). In
Figure 2a,b, light blue line represents the 95% percentile (p95) of annual (E-P) > 0 values; within the line are the 5% of grid points with the highest (E-P) > 0 values of the map which correspond to the (E-P) > 0 values of 0.12 mm/day and 0.15 mm/day for the wet and dry seasons, respectively. Although choosing a contour line is arbitrary, it should not be so large as to include regions with minor effects on precipitation or so small as not to include regions which have a notable effect on precipitation [
28,
35].
According to the threshold of 0.95% of (E-P) > 0 (
Figure 2a,b), it can be observed that Iran receives moisture from different oceanic sources including the Persian Gulf, the Mediterranean Sea, the Black Sea, the Caspian Sea, the Oman Sea, the Red Sea, the Arabian Sea, and the Indian Ocean and also from continental sources. Studying the moisture sources in the seasonal scale shows that in the wet season the (E-P) > 0 pattern is more intense over the Red Sea, the Arabian Sea, the Mediterranean Sea, the Persian Gulf, and the Oman Sea (
Figure 2a), while in the dry season, the roles of the Black Sea and the Indian Ocean increase and that of the Arabian Sea decreases (
Figure 2b). In
Figure 2a,b, the role of continental sources increases in the dry season compared to the wet season. Comparison of the obtained results with those of Vertically Integrated Moisture Flux (VIMF) for the period of 1980 to 2014 (
Figure 2c,d) shows the most important regions of divergence (where evaporation exceeds precipitation). In the wet season, areas of divergence over the Arabian Sea, the Atlantic Ocean, the Persian Gulf, and the Oman Sea and to a lower extent the Indian Ocean are observed which is in accordance with moisture uptake sources during the wet season (
Figure 2c). These moisture sources provide the main part of Iran’s precipitation during the wet season. In the dry season, the huge divergence observed in the Indian Ocean which is responsible for Indian monsoon precipitations influences the southeast of Iran (
Figure 2d).
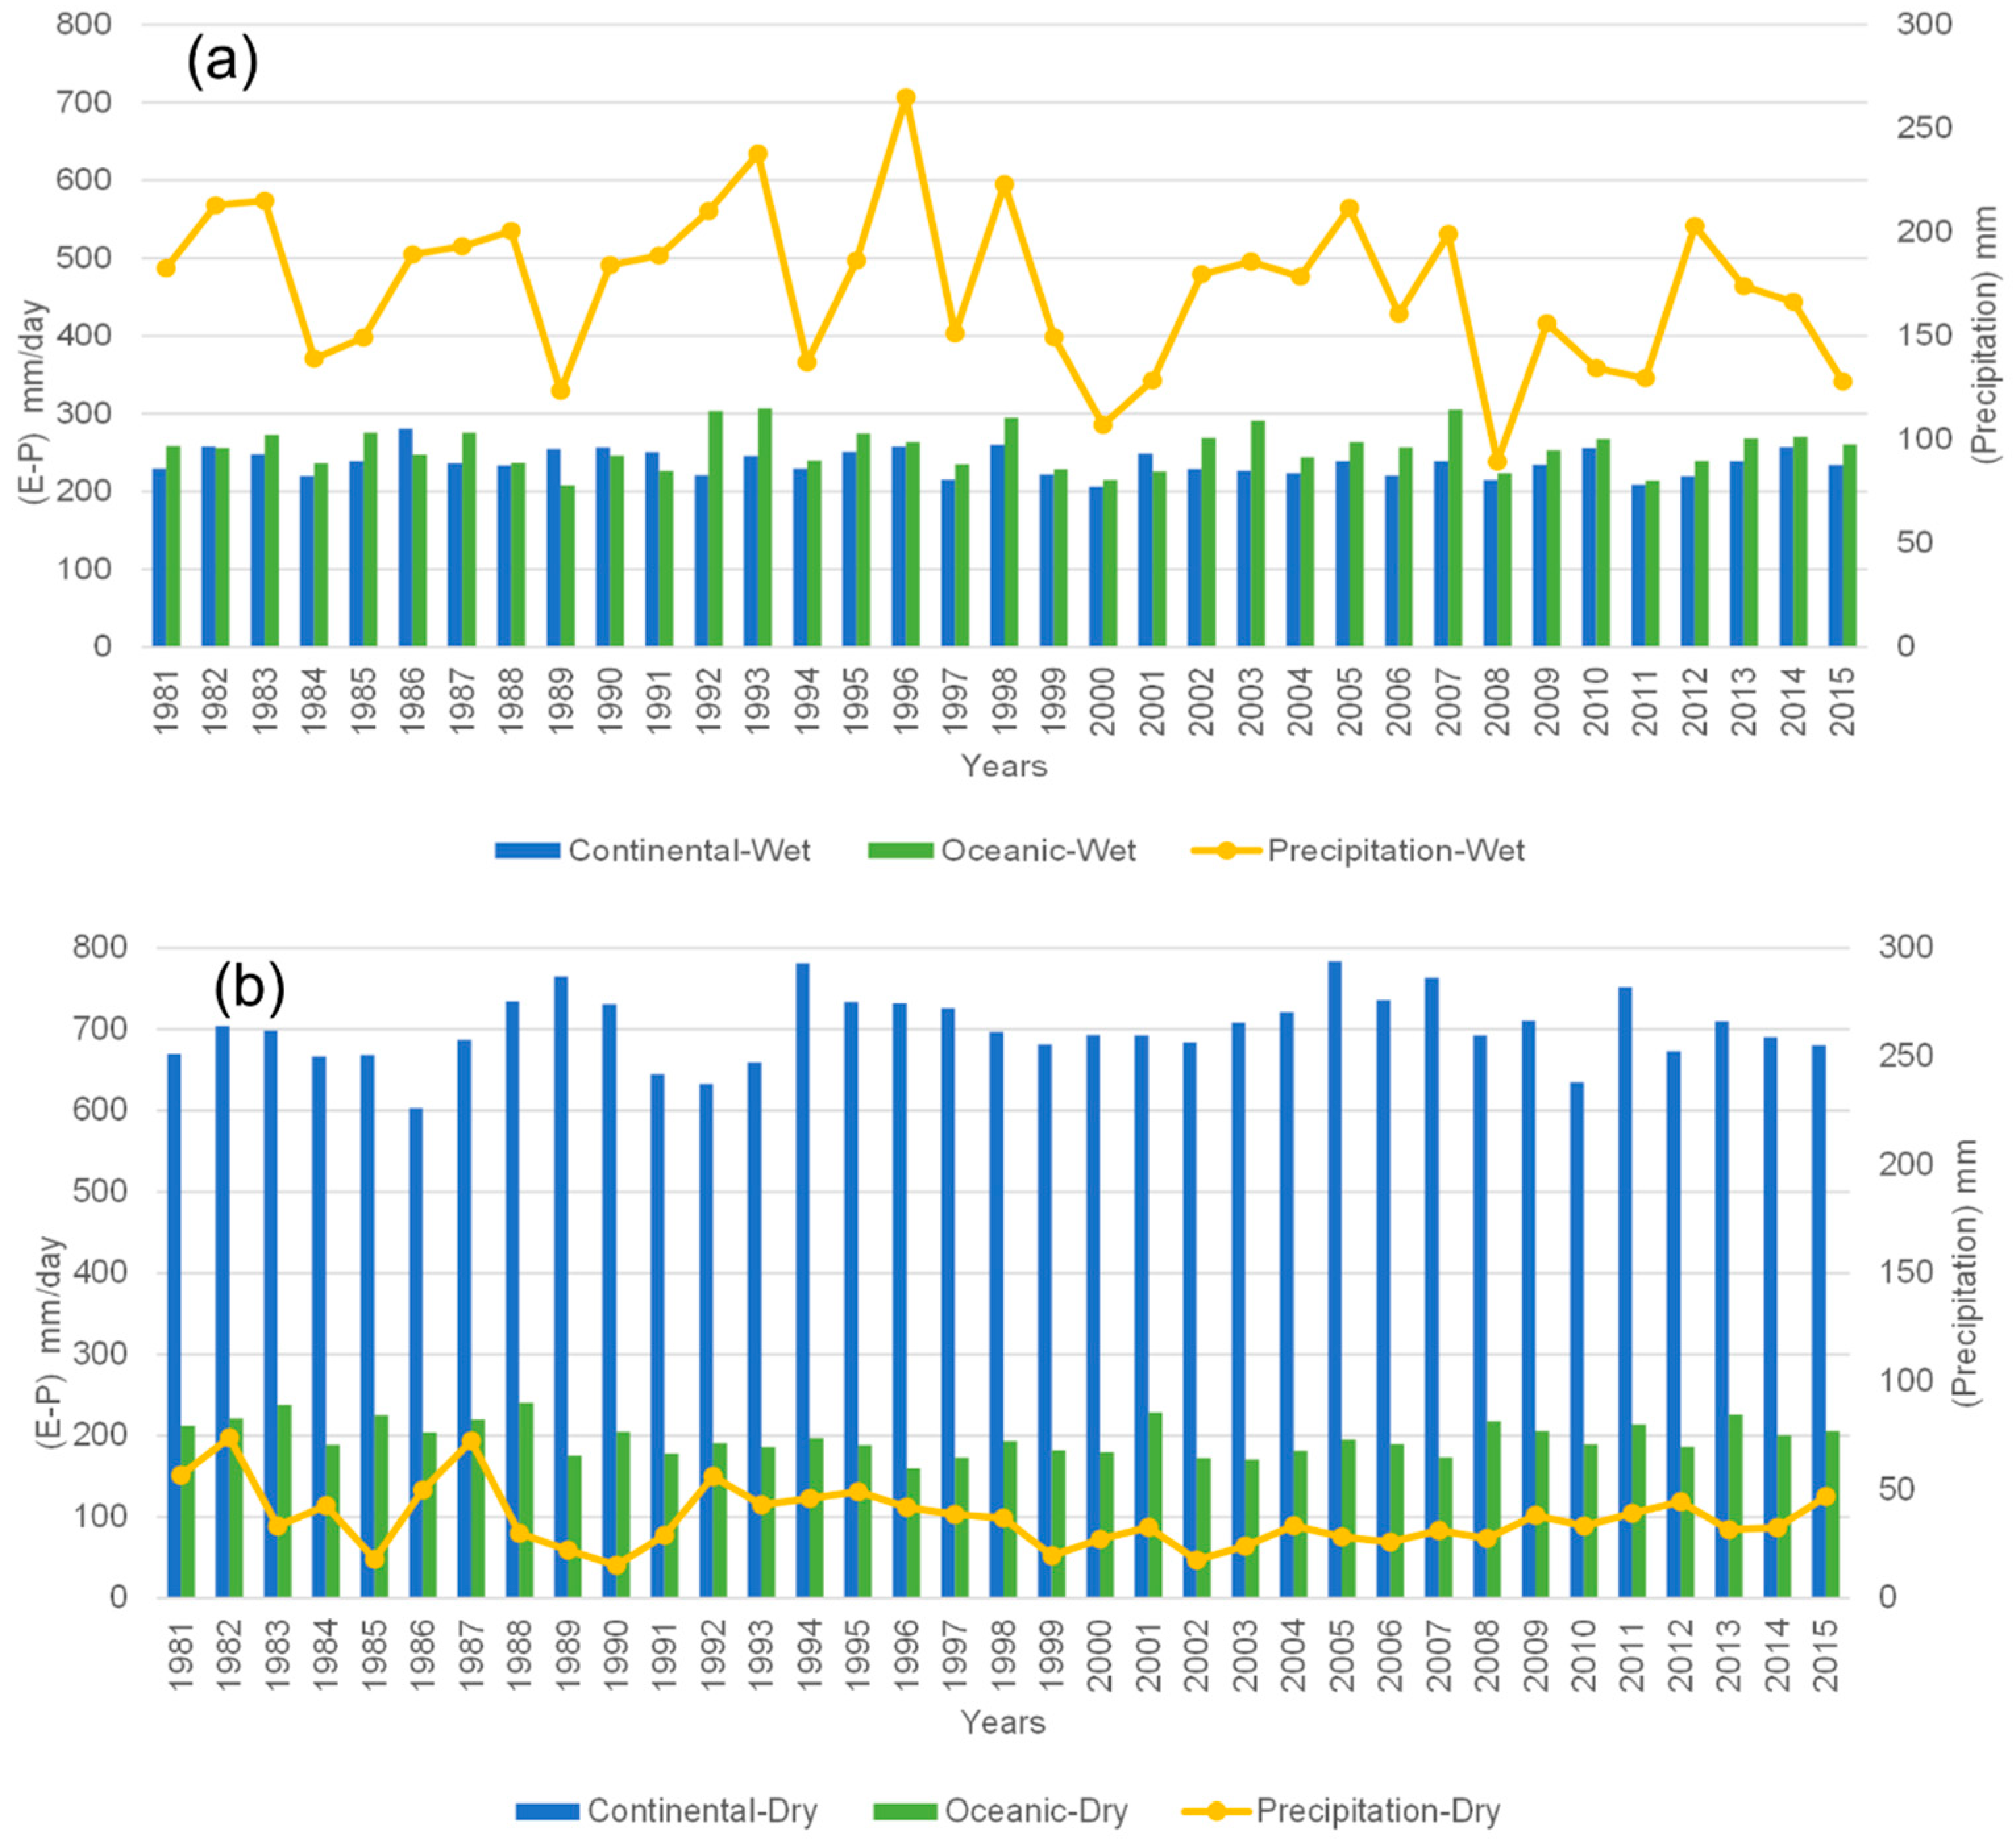
Studying continental and oceanic (E-P) values with precipitation amounts in the wet season demonstrates that in most cases precipitation increased when oceanic and continental (E-P) values increased and it decreased when oceanic and continental (E-P) values decreased (
Figure 3a). In the dry season, continental (E-P) values increased intensively compare to wet season and no obvious correlation was observed between (E-P) values and precipitation amount (
Figure 3b). During this season, the Earth’s surface temperature increases intensively and stable atmospheric conditions dominate in Iran. These conditions prevent air uplifting mechanism and prevent precipitation from taking place. Low precipitation amounts in the dry season do not show a meaningful correlation with (E-P) values and are influenced by local parameters (
Supplementary Figure S1).
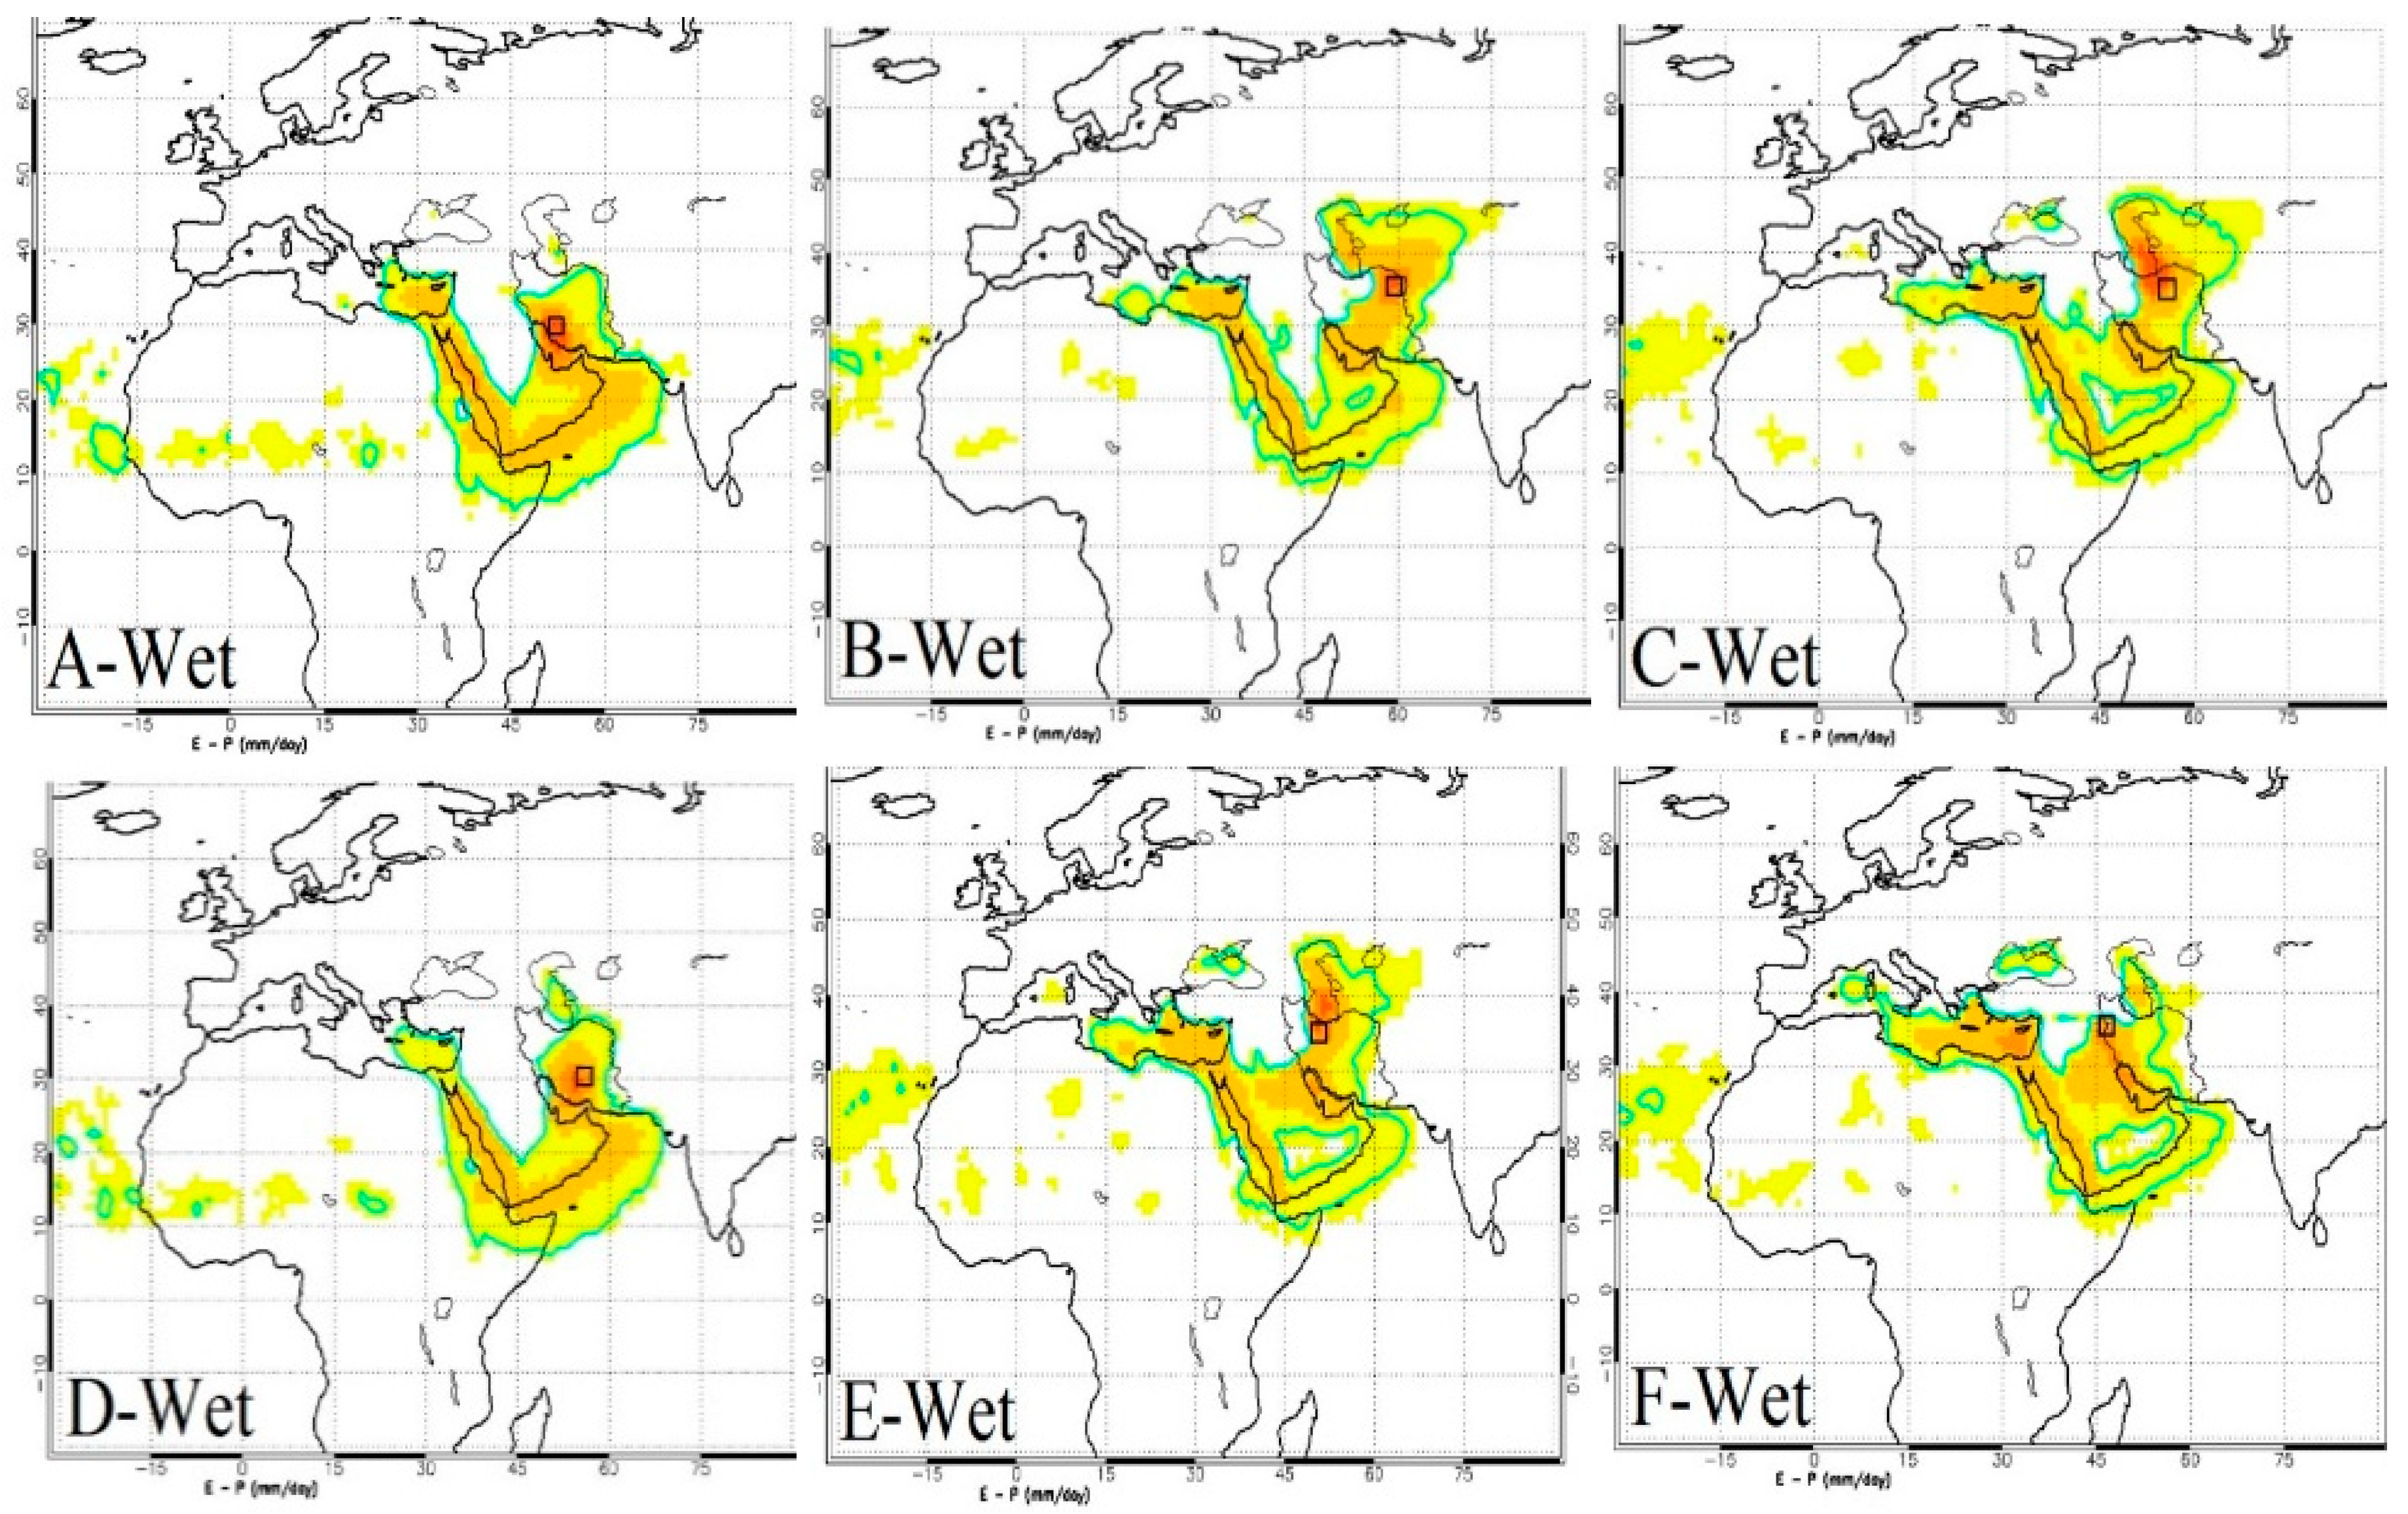
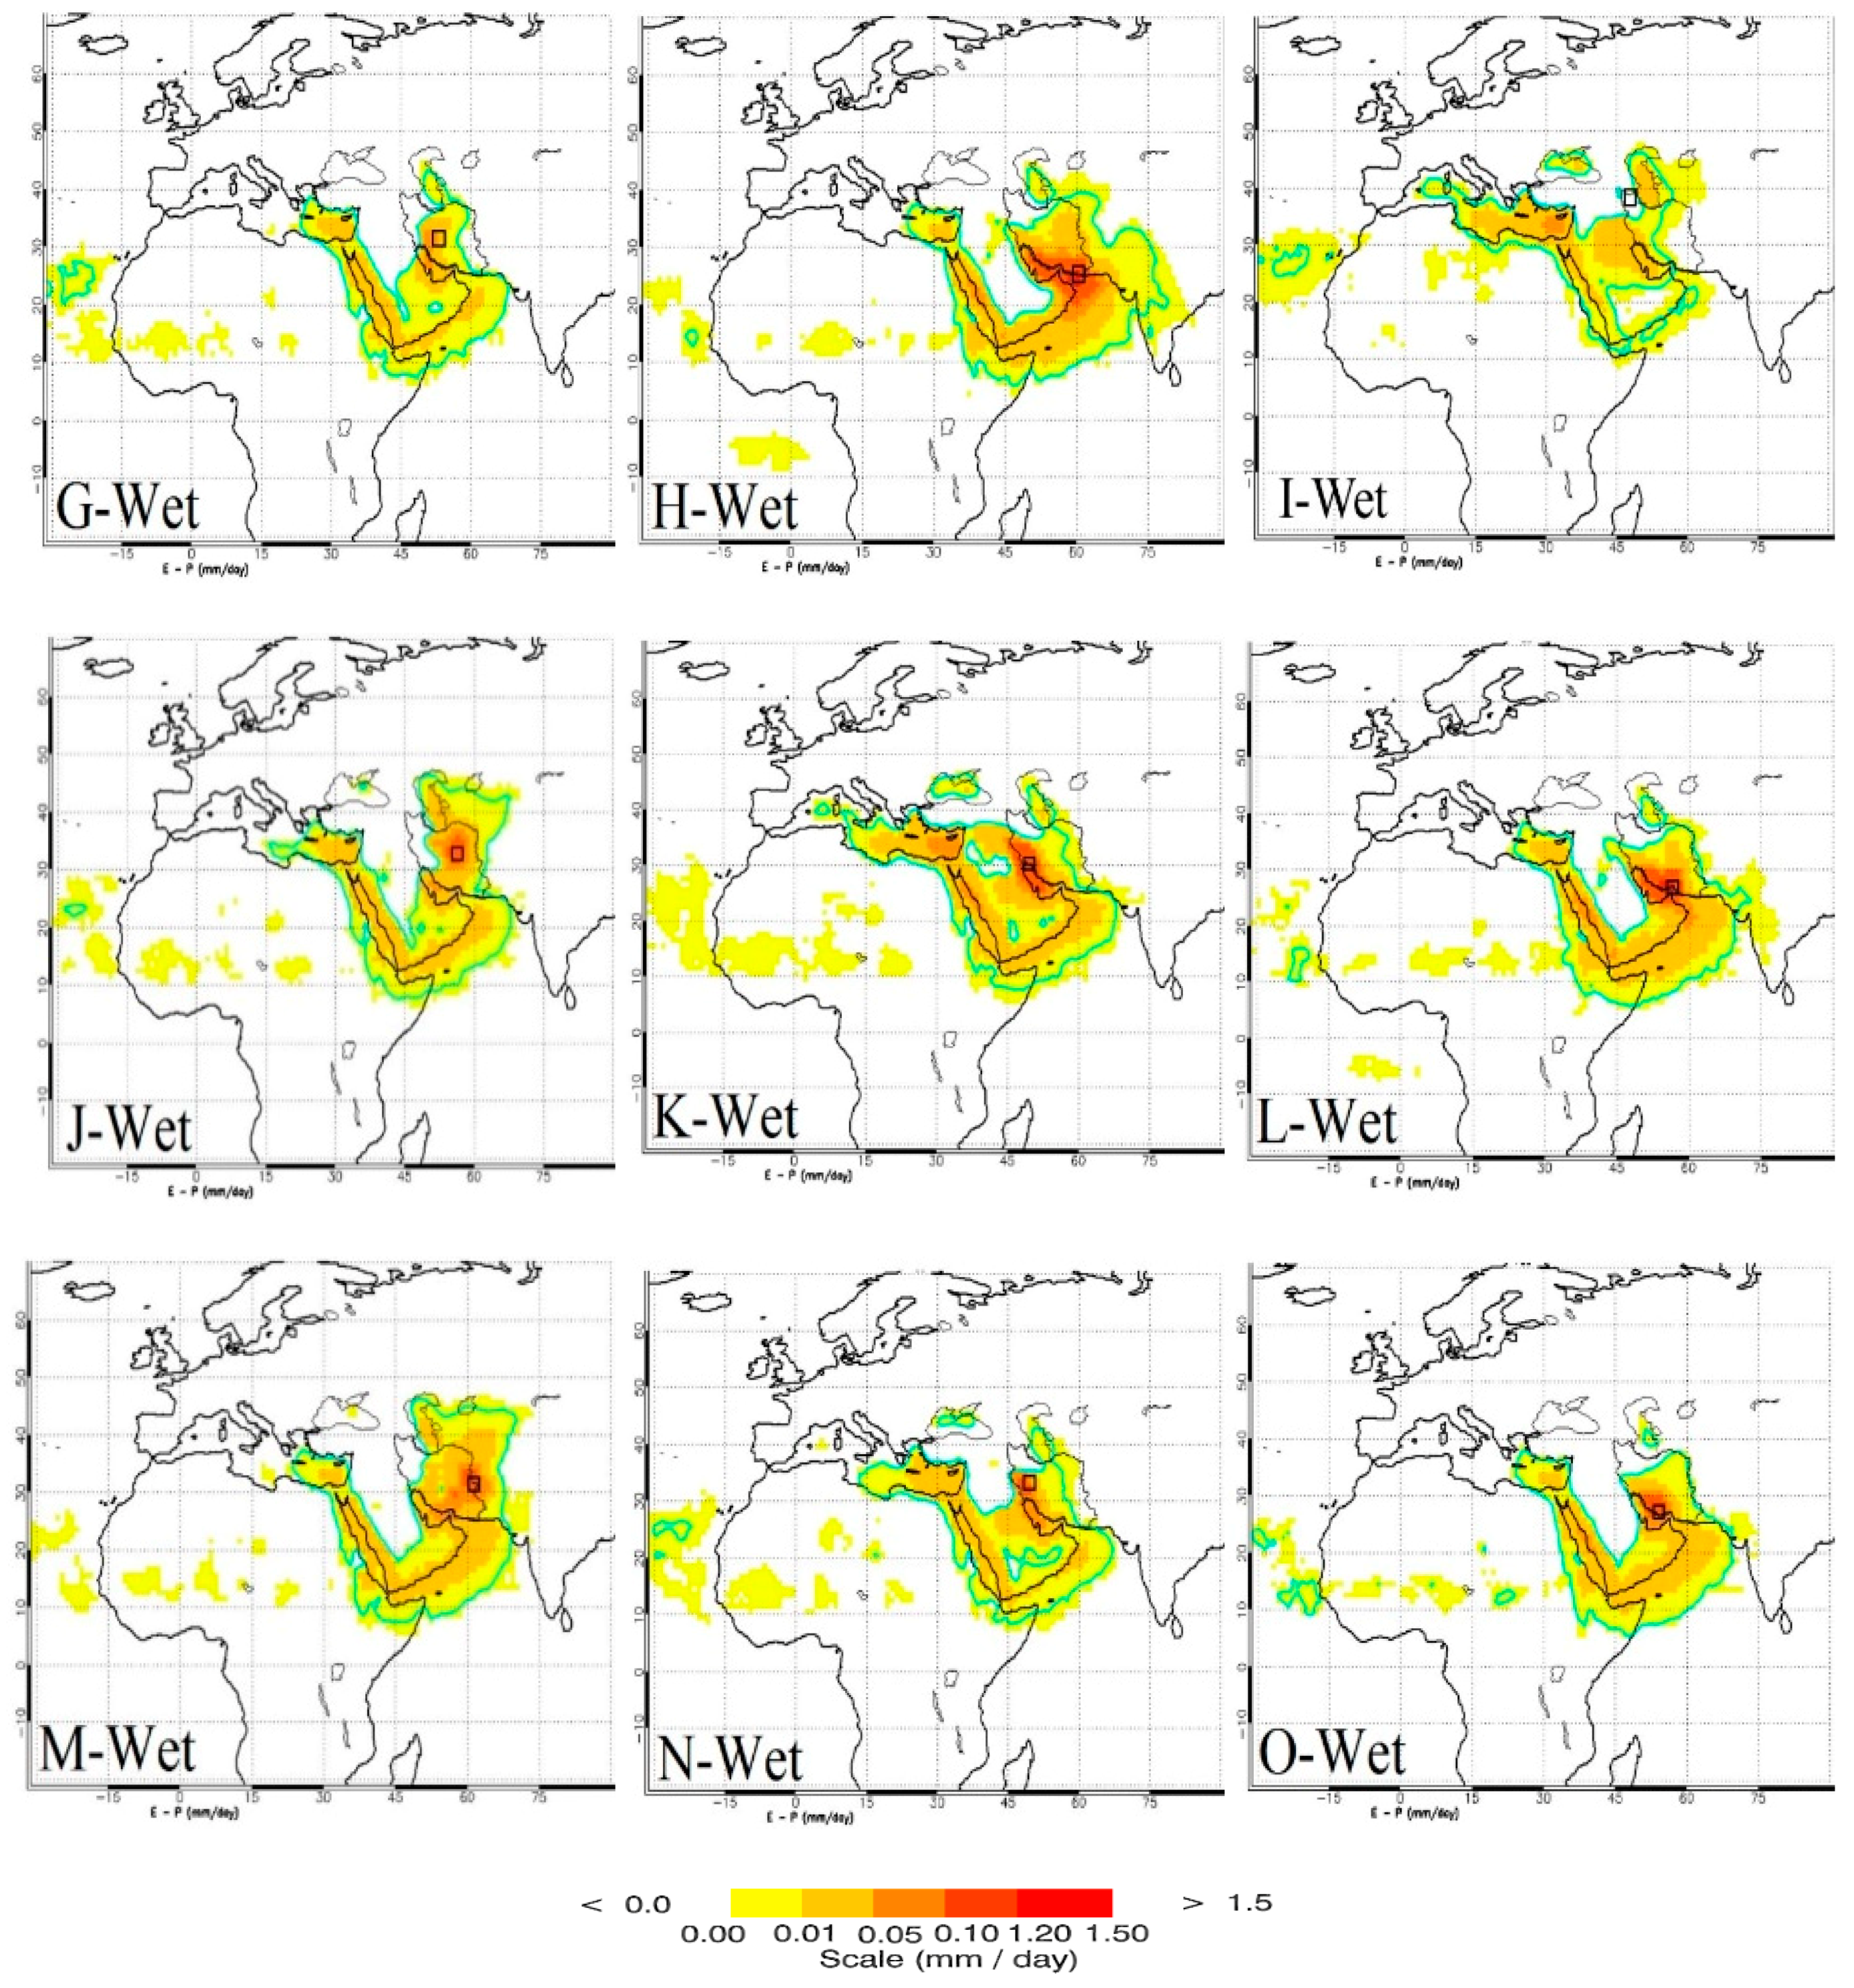
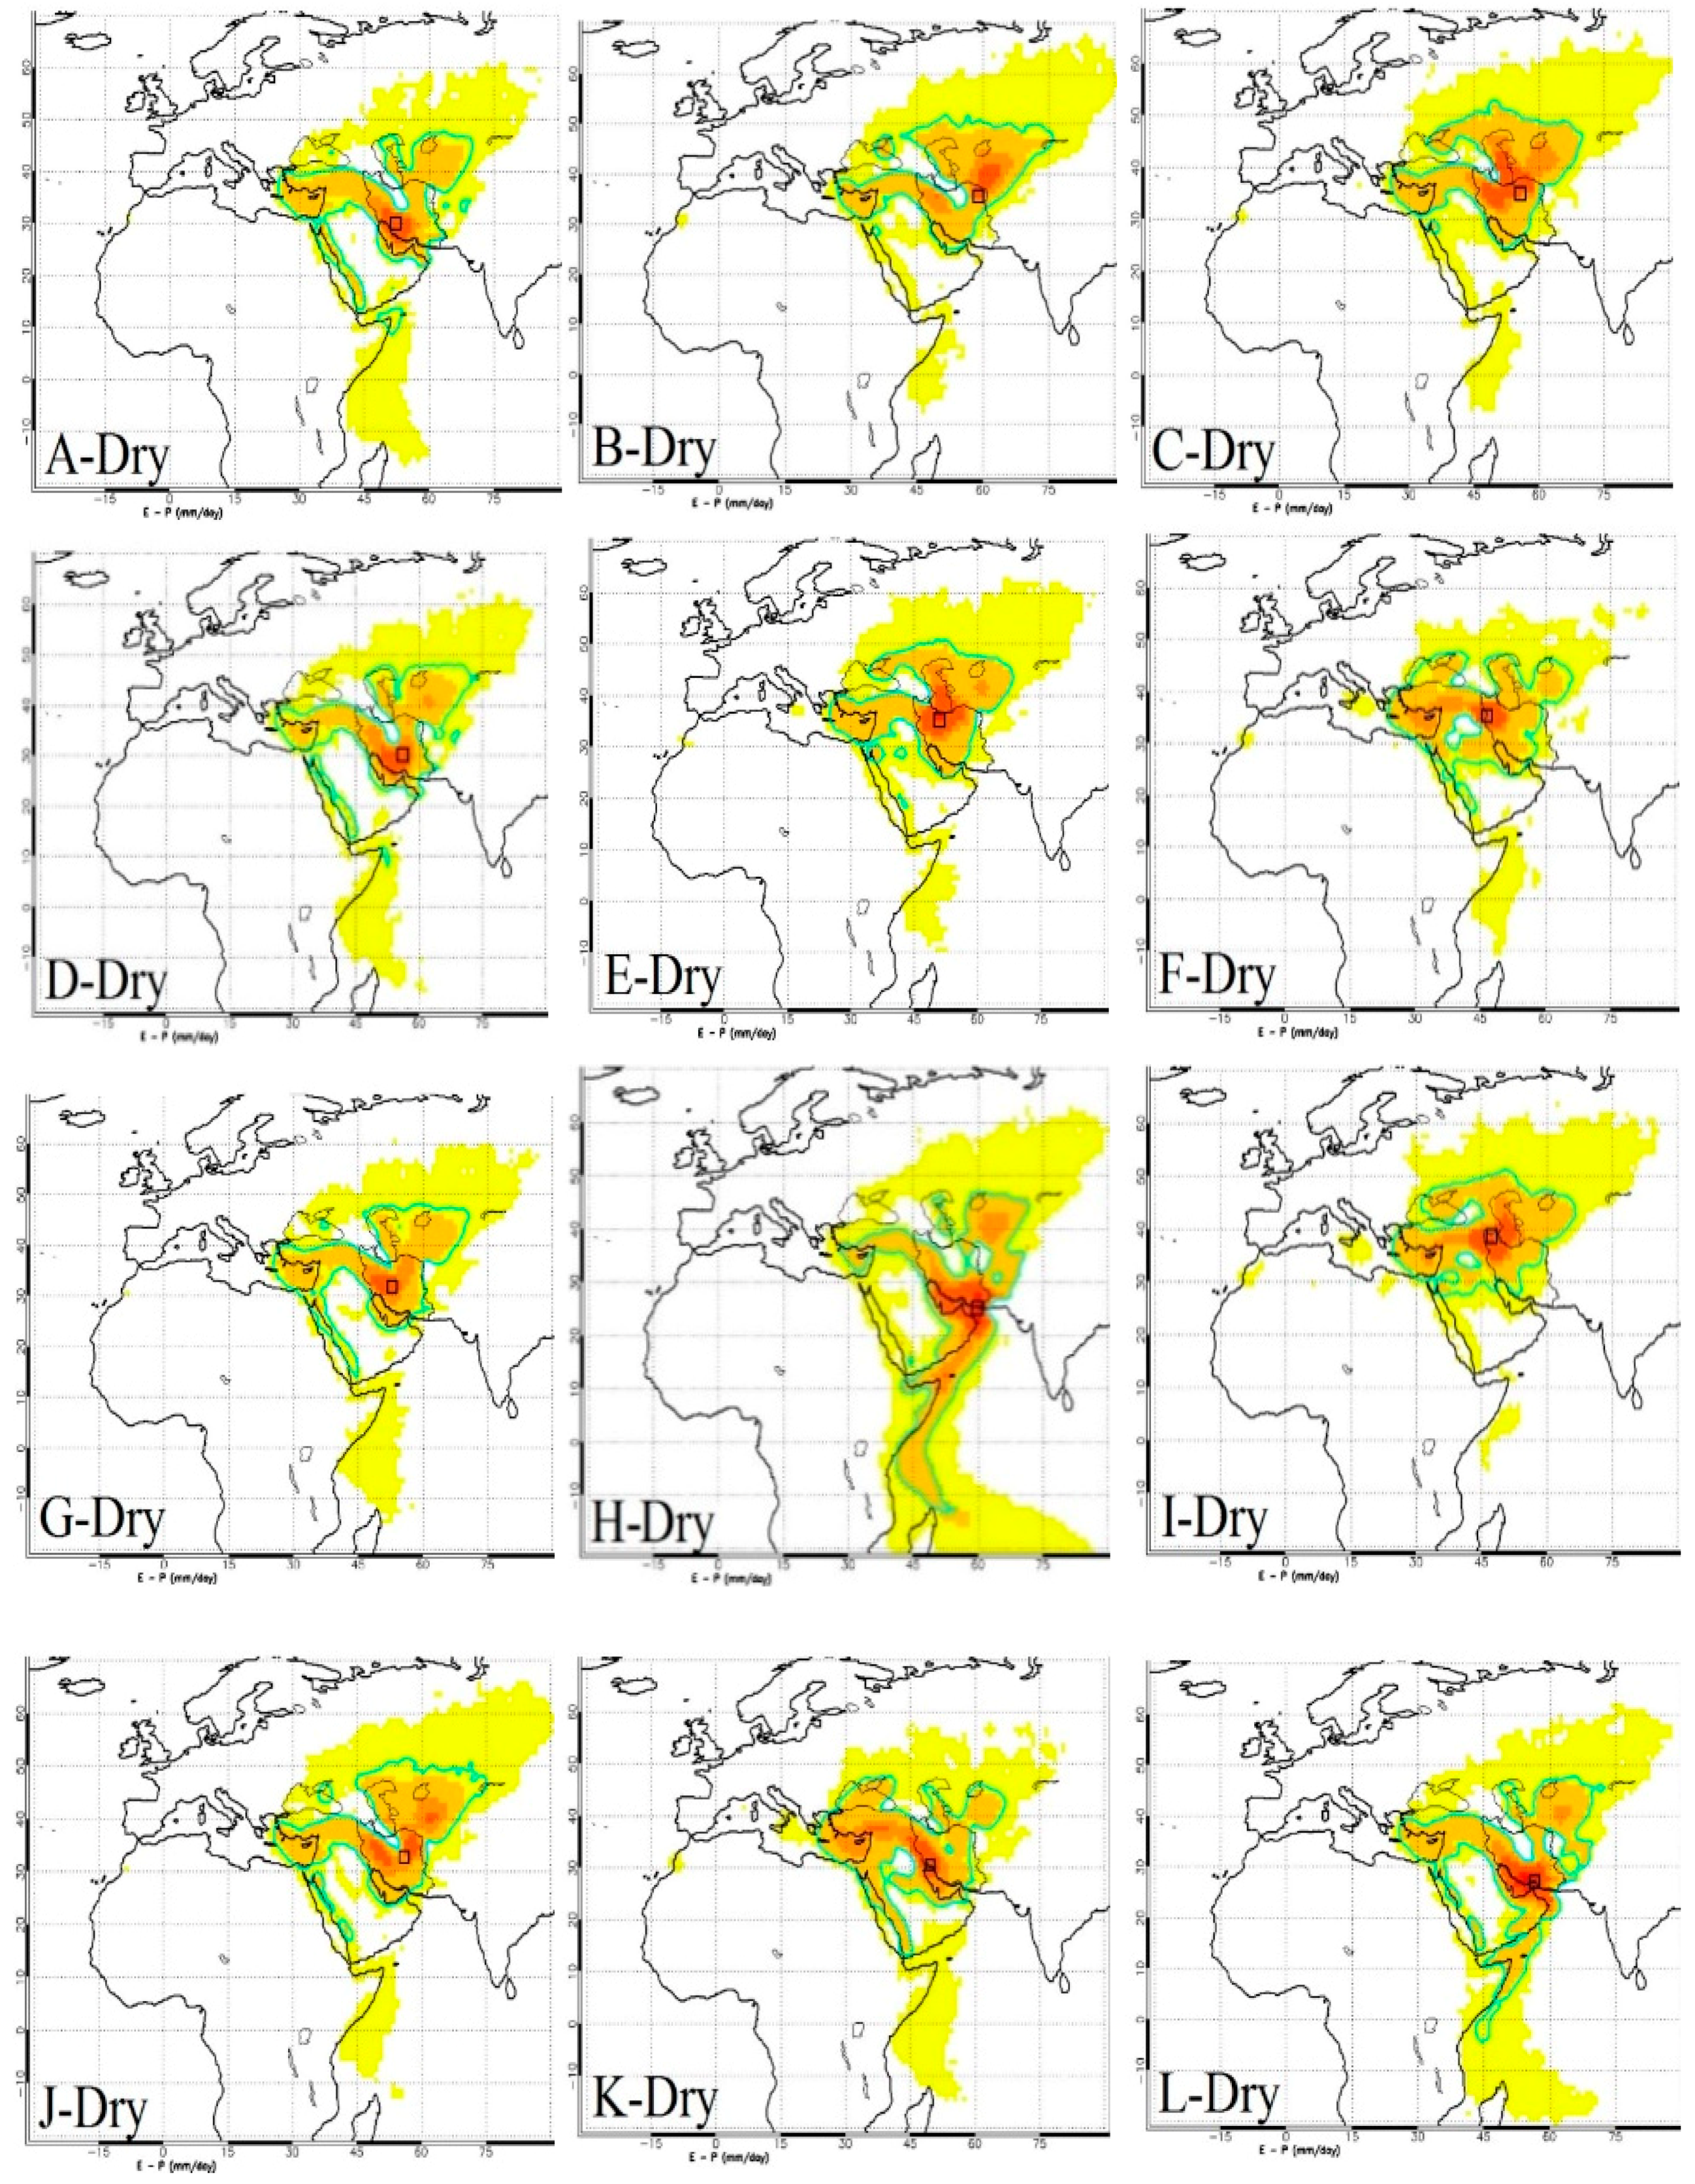
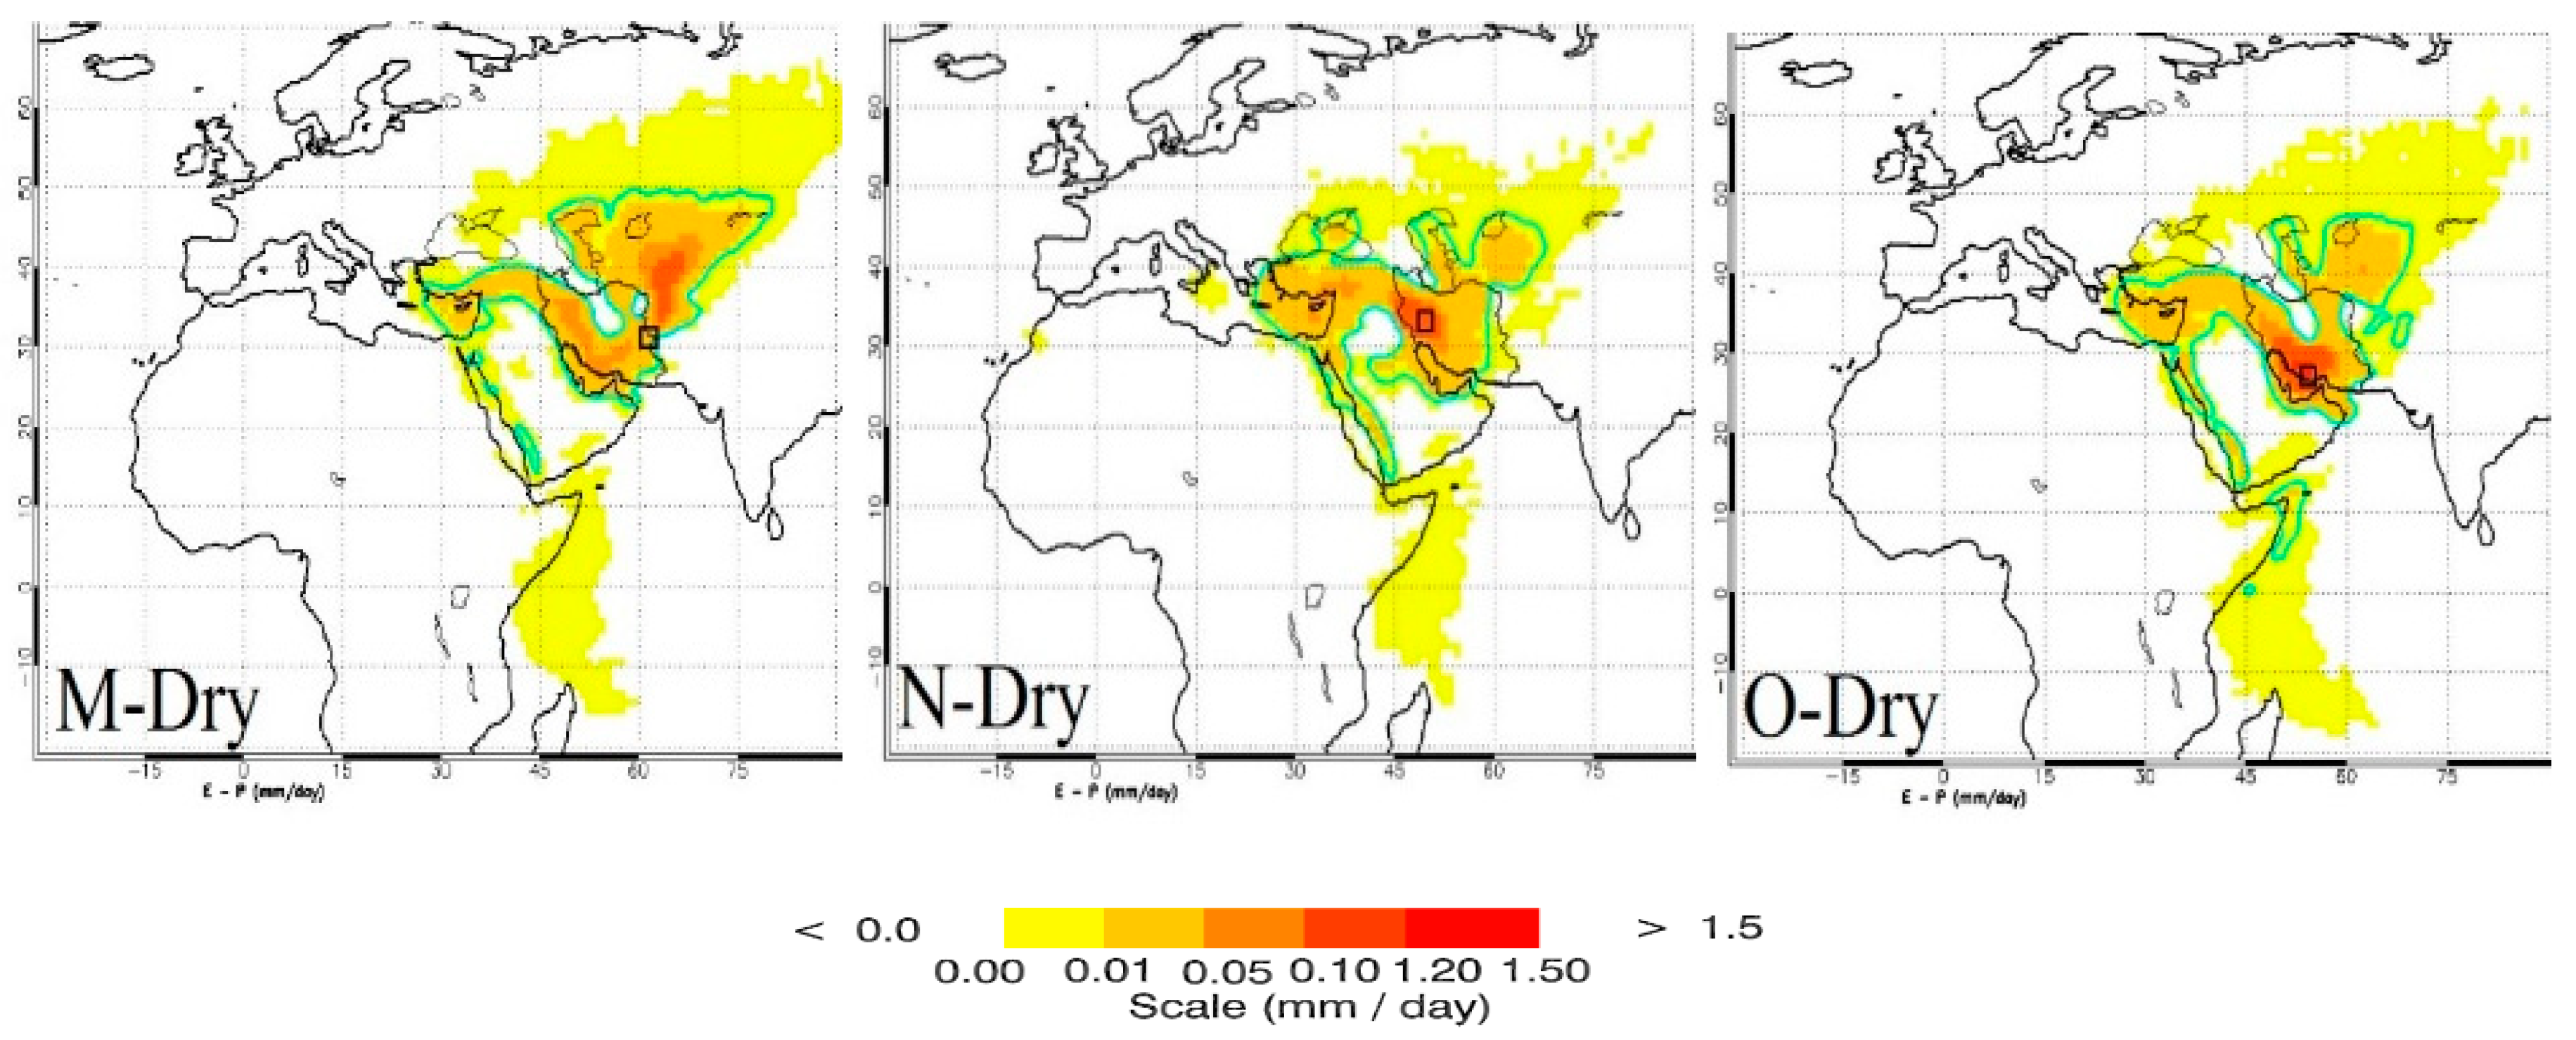
To study more accurately the moisture sources influencing Iran, the (E-P) values have also been calculated for 15 locations of 1° degree in longitude and latitude including Shiraz (A), Mashhad (B), Shahrood (C), Rafsanjan (D), Hashtgerd (E), Marivan (F), Isfahan (G), Chabahar (H), Tabriz (I), Tabas (J), Ahvaz (K), Bandar Abbas (L), Zabol (M), Khoram Abad (N), and Darab (O) for both wet (
Figure 4) and dry seasons (
Figure 5) and (
Supplementary Table S1) from 1981 to 2015.
For the air masses arriving over studied locations, the spatial distribution of moisture sources in the wet season is limited to the zone which covers the Red Sea, the Arabian Sea, the Persian Gulf, the Oman Sea, and the Mediterranean Sea. The studied locations in the western slope of Zagros mountain range including Shiraz (A), Marivan (F), Darab (O), and Khoram Abad (N) receive more precipitation compared to the studied locations in the eastern slope of Zagros mountain range including Rafsanjan (D) and Isfahan (G) due to the shadow effect of Zagros mountain range which prevents air masses and moisture from passing it most of the times. On the other hand, air masses bring higher latitude waterbodies moisture such as the Mediterranean Sea, the Black Sea, and the Caspian Sea are also blocked by Alborz mountains and only influence the locations in the north of Iran including Mashhad (B), Shahrood (C), Hashtgerd (E), and Tabriz (I). Tabas (J) and Zabol (M) studied locations near Iran’s central deserts (Dasht-e Lut and Dasht-e Kavir) receive less precipitation compared to the other locations. Studied locations in the coastal areas of the Persian Gulf including Chabahar (H), Bandar Abbas (L), and Ahvaz (K) have both the highest oceanic and continental (E-P) values but moderate precipitation amounts. In these locations, although oceanic and continental (E-P) values are high, the parameters responsible for precipitation are not strong and active enough. During the dry season, the roles of the Arabian Sea, the Red Sea, and the Oman Sea decrease, while the roles of the Black Sea, the Caspian Sea, and also continental sources intensify. Higher weather temperature in the dry season results in much higher continental (E-P) values than oceanic (E-P) values. Atmospheric stability which governs most parts of Iran prevents precipitation in most studied locations except for Tabriz (I), Marivan (F), Khoram Abad (N), Bandar Abbas (L), and Chabahar (H) (
Figure 5 and
Supplementary Table S1).
In stable atmospheric conditions, if an air parcel is lifted over a mountain or blown upward by an updraft, the lifted air will sink back down to the ground as this air parcel is cooler than air particles around it which prevents precipitation from taking place. Atmospheric stability is studied using the omega equation ω which is a partial differential equation for the vertical velocity Equation (2).
where
d/dt represents a material derivative. Negative values of ω correspond to ascending motion and instability, while positive ω values represent descending motion and stable atmospheric conditions [
40]. Simultaneous studies of precipitation and ω values over Iran demonstrate that during the wet season the most negative ω values and atmospheric instability are observed over Zagros mountain range and the coastal areas of the Caspian Sea due to air parcel lifting mechanism over Zagros and Alborz mountain ranges. During the dry season, atmospheric stability dominates a large part of Iran which results in dry conditions although oceanic and continental E-P values are high. Atmospheric instability which exists in a small part of Iran in the west and northwest causes precipitation in Tabriz (I) and Marivan (F) studied locations due to local parameters. Atmospheric instability has also been observed in rare cases in the south and south-east of Iran due to the monsoon effect in Bandar Abbas (l) and Chabahar (H) locations (
Figure 6).
3.1. The Contribution Rate of Continental and Oceanic Moisture Sources and Their Role in Moisture Uptake in Wet and Dry Seasons
The oceanic and continental moisture uptake sources have been determined for the wet and dry seasons from 1981 to 2015 (
Figure 7a,b).
The contribution percentage of oceanic and continental moisture sources in the dry and wet season is presented in
Table 1. The results are in agreement with some previous studies [
6,
18] using old and traditional meteorological methods. Alijani [
6] believed that the Mediterranean Sea is the dominant moisture source of Iran’s precipitation. In contrast, Karimi and Farajzadeh [
18] believed that the Arabian Sea with a share of 39% and the Mediterranean Sea with a share of 38% are the dominant providers of Iran’s total moisture, while the Red Sea (6.8%), the Oman Sea (4.8%), the Caspian Sea (4.4%), the Persian Gulf (3.7%), and the Black Sea (3.3%) have a minor contribution.
In continental sources during the wet season, the higher moisture uptake from bare grounds is due to evaporation from snow surfaces and temporary lakes in bare grounds which are under the direct influence of sunlight. However during the dry season, grasslands are the dominant source of moisture, followed by shrubs and bare grounds, and bare grounds.
In addition to study the variations of moisture uptake ratios in the north and south parts of Iran, the moisture uptake from oceanic sources in Shiraz station (A) in the south of Iran and in Mashhad station (B) in the north of Iran has been studied (
Figure 8).
During the wet season, strong air masses can transfer huge amounts of moisture mainly from low latitude waterbodies to most parts of Iran and cause notable precipitations. However, during the dry season, although moisture uptake from oceanic and continental sources is high this moisture cannot be transferred deeply to Iran plateau. This is due to the intense atmospheric stability of Iran plateau which prevents air masses from transferring moisture which in turn prevents precipitation and thus moisture only increases air moisture content in the regions near waterbodies.
3.2. The Role of Continental and Oceanic Moisture Sources during Drought Conditions in Iran
In the wet season during 2008, a large drought happened with the lowest precipitation amount of 89.3 mm and resulted in large negative values of −1.24, −1.64, and −0.61 for 1-month, 6-month, and 12-month SPIs. However, the maximum precipitation amount of 265 mm and humid conditions occurred in 1996 with positive values of 0.76 in 1-month, 0.87 in 6-month, and 1.27 in 12-month SPIs. During the dry season in 1990, precipitation was reduced to a minimum of 15.04 mm and 1-month, 6-month, and 12-month SPI values were −1.085, −0.77, and −0.14, respectively, while in 1982 the maximum precipitation amount of 74.01 mm occurred and 1-month, 6-month, and 12-month SPI values were 0.7, 1.41, and 1.09, respectively (
Supplementary spreadsheet S1).
In addition, SPI values for the two studied locations of Shiraz (A) and Mashhad (B) have also been calculated (using the precipitation data provided by Iran Meteorological Organization) to determine the differences that exist in the drought conditions of the locations in the north and south of Iran (
Supplementary spreadsheet S1). Both of these locations demonstrated large variations in SPI values and precipitation amounts during the study period. This is due to the large continental effect in most parts of the country except for a small coastal area near the Caspian Sea. The continental effect results in large temperature variations between day and night and summer and winter measurements in most climatological locations especially deep inside the Iranian plateau. Although the dominant moisture sources for the wet season are the same for these two locations, the moisture sources in the dry season, dominant moisture uptake ratios, precipitation amount variations, and drought conditions are different in these two locations. This confirms the results of previous studies [
6,
10,
12,
18] which emphasized climatological differences in different parts of Iran.
The correlations between oceanic and continental (E-P) values over Iran have been compared with 1 month, 6 months, and 12 months SPI values. To study the simultaneous effect of oceanic (including the Arabian Sea, the Black Sea, the Caspian Sea, the Indian Ocean, the Mediterranean Sea, the Oman Sea, and the Persian Gulf) and continental moisture sources on drought conditions, their (E-P) values on 1, 6, and 12 months SPI values have been correlated using multiregression models. In the model developed for the 1-month SPI in the wet season, only the Arabian Sea, the Indian Ocean, and the Persian Gulf have a direct influence on SPI values (sig < 0.05). In the 6-month SPI model, the Arabian Sea and the Mediterranean Sea and for the 12-month SPI model only the Arabian Sea influence SPI values (
Supplementary Table S2).
The Arabian Sea, which has a dominant role in providing moisture for Iran, also has a crucial influence on SPI values and drought conditions. However, the Persian Gulf and the Mediterranean Sea which are the second and the third dominant moisture sources of Iran’s precipitation only influence 1-month and 6-month SPI values. Other moisture sources such as the Red Sea, the Caspian Sea, the Oman Sea, and the Black Sea do not have a direct influence on SPI values and drought conditions according to developed regression models (Sig > 0.05). On the other hand, although the Indian Ocean has a very weak contribution in providing Iran’s moisture affects 1-month SPI values. Because the main moisture sources influencing drought conditions in Iran, i.e., the Arabian Sea, the Red Sea, the Persian Gulf, and even the Indian Ocean are located in the south of Iran and north of Africa, any meteorological changes in this area may have a great influence on Iran’s precipitation variations.
In continental moisture sources, moisture originating from bare grounds only influences 1-month and 6-month SPI values, while moisture coming from cultivated crop lands influences 12-month SPI values. Moisture originating from other land uses has no influence on the developed regression models (Sig > 0.05). In the dry season, although high values of (E-P)>0 were observed in both continental and oceanic moisture sources, the developed models demonstrated no correlation between (E-P) and SPI values (
Supplementary Table S2). This is because atmospheric stability influences large parts of Iran and prevents precipitation from taking place, while rare precipitation events are caused by local parameters.


