Article

Possible Causes for Spatial and Temporal Variation of Warm Season Precipitation in Xinjiang from 1960–2014

1
State Key Laboratory of Desert and Oasis Ecology, Xinjiang Institute of Ecology and Geography, Chinese Academy of Sciences, Urumqi 830011, China
2
College of Resource and Environment Sciences, Xinjiang University, Urumqi 830046, China
3
University of Chinese Academy of Sciences, Beijing 100049, China
*
Author to whom correspondence should be addressed.
Atmosphere 2017, 8(1), 20; https://doi.org/10.3390/atmos8010020
Submission received: 14 December 2016 / Accepted: 16 January 2017 / Published: 20 January 2017

Abstract

:
In this work, rain totals from 1960–2014, obtained during the warm season (May to October) from 52 meteorological stations, over Xinjiang, China were classified as either light, moderate, or heavy rain in two sub-regions (northern and southern). Spatial and temporal trends for rain amounts and days for the three rain classes were determined. All light, moderate, and heavy rain amounts displayed increasing trends over the two sub-regions. Furthermore, heavy rain amounts contributed the most to changes in total rain amounts. Light rain days in northern Xinjiang significantly decreased, in contrast to increasing light rain days in southern Xinjiang and moderate and heavy rain days within two sub-regions. Results obtained from correlation and relative weights analyses implied that lower-tropospheric specific humidity was the main factor responsible for light rain day trends in Xinjiang. Increasing temperatures were not found to have a significant effect.

1. Introduction

In Xinjiang, the most arid region in China, precipitation is a critical water source for both human livelihoods and ecosystems. Tremendous significance has been imparted to the study of precipitation variations. In recent decades, global mean annual precipitation has exhibited increasing trends that are thought to be related to global warming [1,2,3,4]. In the context of global warming, a good understanding of precipitation variations over Xinjiang is essential for hydrology, climatology, and ecology research.
In recent years, a significant increasing trend in annual precipitation, with rates of 0.4–0.5 mm·year−1 across Xinjiang, have been documented [5,6,7,8,9]. Furthermore, studies have noted variations in extreme precipitation that may lead to local flooding over short periods of time, resulting in tremendous economic loss. In general, extreme precipitation is defined as annual total precipitation with daily precipitation > 95th percentile, named P95, which is one of the thirteen extreme precipitation indices introduced by the ETCCDI (the Expert Team on Climate Change Detection and Indices) [10,11]. Recent research indicates that extreme precipitation in Xinjiang also exhibits increasing trends [12,13,14,15,16], consistent with regional and global studies [17,18,19]. Global warming has been projected to lead to large increases in extreme precipitation [20,21,22,23,24]. Such increases are based on the Clausius-Clapeyron (C-C) equation that roughly describes a 7% increase in atmospheric moisture storage potential per degree Kelvin [2,18,25,26,27].
To date, few studies have explored changes in light precipitation over Xinjiang. Light precipitation requires additional time to soak into soils, leaving less water for surface runoff [2], and this characteristic of light precipitation is important for abating droughts in the arid region of Xinjiang. In the past, studies have focused on decreasing light precipitation days over eastern China [28,29,30,31,32,33]. Of all of the potential causes for decreases in light precipitation, an increase in lower-tropospheric temperatures is considered to be the main factor. Lower-tropospheric temperature increases the dew-point temperature, causes a rise in the condensation height of precipitable clouds, and reduces cloudiness, weakens atmospheric stability, and strengthens upward motion [28,29,32,34]. A study by Wu et al. [33] for eastern China indicated that both lower-tropospheric warming and specific humidity were responsible for variations in light rain days during the warm season. The main factor influencing the trend for light rain days over Xinjiang is still unknown.
For the purpose of this study, in order to comprehensively analyze trends for classified precipitation amounts and days, especially light rain, precipitation was divided into three classes: light, moderate, and heavy precipitation. Additionally, to be consistent with previous studies that have analyzed factors for changes in rain amounts and types during summer, this work only analyzed the features of rain during the half of the year containing the summer season, also referred to as the ‘warm season’, from May to October.
The objectives of this study were, as follows: (1) to divide summer rain in Xinjiang into three classes; (2) to detect spatial and temporal variations in summer rain amounts and days for the three classes; (3) to calculate the contributions of light, moderate, and heavy rain to changes in total rain amounts; and (4) to explore the causes for changes in light rain over Xinjiang.

2. Material and Methods

2.1. Study Area

Xinjiang is located in northwest China between 34° N–48° N and 73° E–96° E and comprises an area of 1.66 × 10⁶ km2. The topography of Xinjiang is shaped by three mountain ranges (the Altai Mountains, the TianShan Mountains, and the Kunlun Mountains) and two basins (the Junggar Basin and the Tarim Basin) with altitudes ranging from −154 m and 7260 m. Xinjiang is divided into two sub-regions, northern Xinjiang and southern Xinjiang (Figure 1), by the TianShan Mountains. Climate in the region is typically continental, with mean annual precipitation of 155 mm and mean annual temperatures ranging from less than 10–13 °C.

2.2. Data

Daily precipitation data from 1960–2014 was obtained from the China Meteorological Administration (CMA) (http://data.cma.cn/). These data were examined prior to the release from the CMA in order to ensure consistent observation and standardized instrumentation. According to the method introduced by Zhai et al. [35], stations with too many missing values were deleted. A year is considered to be missing if data for more than 5% of the days in the year (18 days) are missing. A station was retained only if it had more than 45 years of intact data. Then data from 52 meteorological stations were selected. Station distribution is provided in Figure 1.
Lower-tropospheric specific humidity (SH) and temperature, required for analyzing the factors influencing rain changes in Xinjiang, were obtained from the ERA-Interim. The ERA-Interim is the latest global atmospheric reanalysis produced by the European Centre for Medium-Range Weather Forecasts (ECMWF) [36,37]. Due to the high accuracy and good suitability of ERA-Interim data for China, this dataset has been utilized in the past for studying scientific issues in meteorology and climatology over China [38,39]. SH and temperature from the ERA-Interim are available monthly from 1979–2015 at 16 pressure levels (from 1000 to 500 hPa), with a spatial resolution of 0.75° × 0.75°. All of the data used for this work were obtained for the warm season that includes May to October. In Xinjiang, rain that occurs during the warm season contributes to approximately 72.6% of the annual precipitation.

2.3. Methodology

The definition of precipitation intensity is key when determining spatial and temporal variations for classified precipitation. For this study, the method introduced by Song et al. [40] was employed for classifying precipitation. Daily precipitation at each station from 1960–2014 was first sorted from smallest to largest. The sums for precipitation amounts were then equally divided into three fractions and two threshold values were determined. Precipitation less than the first threshold was defined as light precipitation, precipitation greater than the first threshold and less than the second threshold was defined as moderate precipitation, and precipitation greater than the second threshold was defined as heavy precipitation [40]. The approach can be used to determine different thresholds in dissimilar regions. However, many studies have used fixed threshold values for classifying precipitation. For example, the widely used China Meteorological Administration standards divide daily precipitation into five groups: light (0.1–10 mm per day), moderate (10–25 mm), heavy (25–50 mm), storm (50–100 mm), and downpour (>100 mm). Such a fixed threshold approach may not be suitable for the Xinjiang region because annual average precipitation in this region can vary dramatically from the TianShan Mountains to the Tarim Basin.
Lower-tropospheric elements (specific humidity and temperature) from the surface to 500 hPa were averaged according to the mass-weighted average equation:
e = ps 500 e   Δ p / ps 500 Δ p
where e indicates lower-tropospheric elements.
The relative weights calculation method ‘rlw’ in the R package ‘yhat’ was employed for comparing influencing factors in regards to light rain day changes. The relative weights approach can eliminate correlations between independent variables [41,42].
The Mann-Kendall test was employed to test the significance of trends (at the 95% confidence interval). Trend rates were calculated using the Sen-Thiel method. In addition, we have tested and found no auto-correlation in the series of trend.

3. Results and Discussion

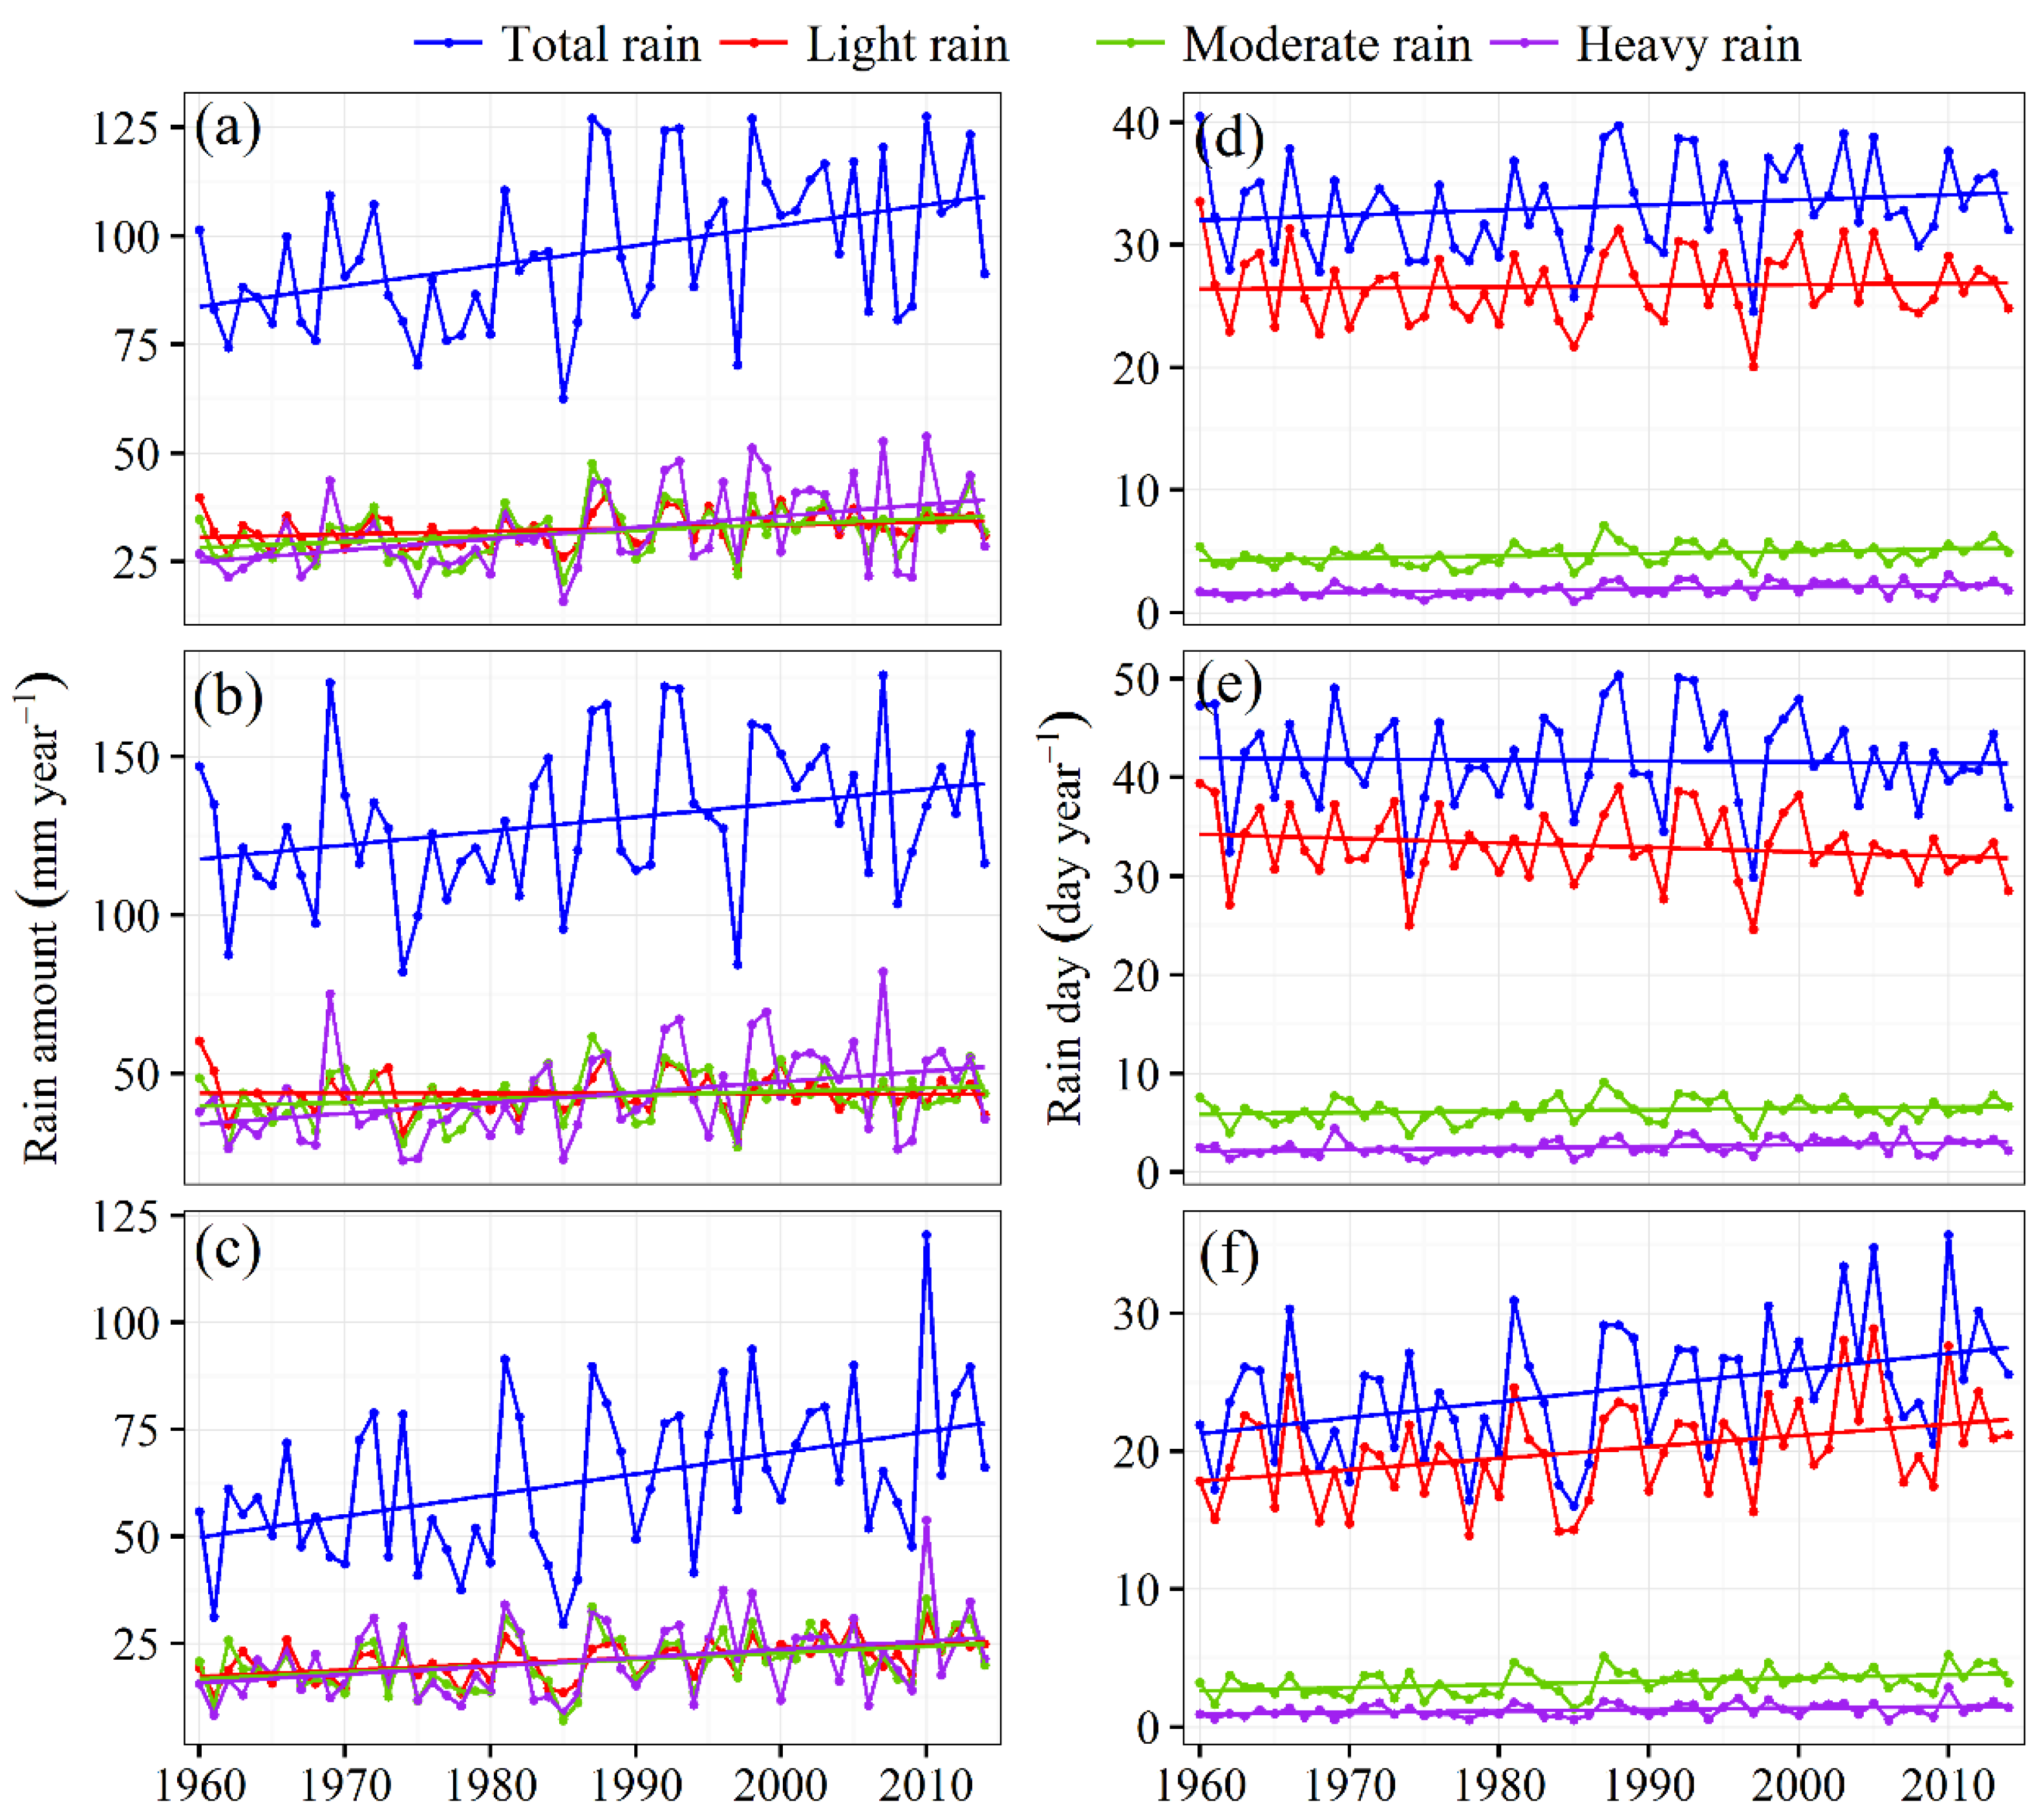
3.1. Spatial and Temporal Variations for Classified Summer Rain Amounts

From 1960 to 2014, daily rain from 52 stations in Xinjiang was classified as either light, moderate, or heavy rain based on the method proposed by Song et al. [40]. Spatial and temporal trends for rain amounts in these three groups were determined using the Mann-Kendall test and Sen-Thiel method.
As shown in Figure 2, total rain amounts for the 49 stations exhibited increasing trends ranging from 0.1 to 2 mm per year, and were statistically significant (p < 0.05) at 17 stations. Only three stations displayed a slight decreasing trend with no significance. On a regional scale, Xinjiang, northern Xinjiang, and southern Xinjiang all displayed significant (p < 0.05) increasing trends for rain amounts, with rates of 0.47, 0.45, and 0.48 mm·year−1, respectively. Spatial trends for heavy and moderate rain amounts were similar to the distribution of total rain. Heavy rain amounts in Xinjiang, northern Xinjiang, and southern Xinjiang all displayed significant (p < 0.05) increasing trends, with rates of 0.26, 0.35, and 0.19 mm·year−1, respectively. Significant increasing rates for moderate rain were 0.13, 0.11, and 0.15 mm·year−1, respectively, for Xinjiang, northern Xinjiang, and southern Xinjiang. For light rain amounts, 38 stations exhibited an increasing trend and significance (p < 0.05) was determined for 14 stations. Fourteen stations exhibited decreases, while only one station displayed a significant increasing trend (p < 0.05). Thirteen of the fourteen stations displaying trends were located in northern Xinjiang. On a regional scale, light rain amounts for northern Xinjiang slightly decreased by 0.007 mm·year−1 but displayed no significance. Amounts significantly increased in Xinjiang and southern Xinjiang, with rates of 0.08 and 0.14 mm·year−1 (Figure 2 and Figure 3; Table 1), respectively.

3.2. Spatial and Temporal Variation for Classified Summer Rain Days

In this section, spatial and temporal trends of rain days for the three classes were determined. As shown in Figure 2, heavy rain days for all stations increased by 0.1 to 0.9 day per year and were significant (p < 0.05) for 11 stations. Temporal trends in Xinjiang, northern Xinjiang, and southern Xinjiang for heavy rain days significantly decreased by 0.016, 0.019, and 0.01 day·year−1, respectively. Similar to heavy rain days, moderate rain at most stations increased and temporal trends in all of the regions significantly increased (Figure 2 and Figure 3; Table 1).
For light rain days, different trends were noted between northern and southern Xinjiang. Most of the stations located in northern Xinjiang decreased from 0.1 to 0.2 days per year and values were significant (p < 0.05) for 10 stations, with a temporal trend of −0.064 day·year−1 (p < 0.05). Light rain days significantly increased by 0.08 days per year in southern Xinjiang (Figure 2 and Figure 3; Table 1). The results indicate that light rain days in northern Xinjiang significantly decreased. The result was different from that of increasing light rain days in southern Xinjiang, and moderate and heavy rain days in the two sub-regions.

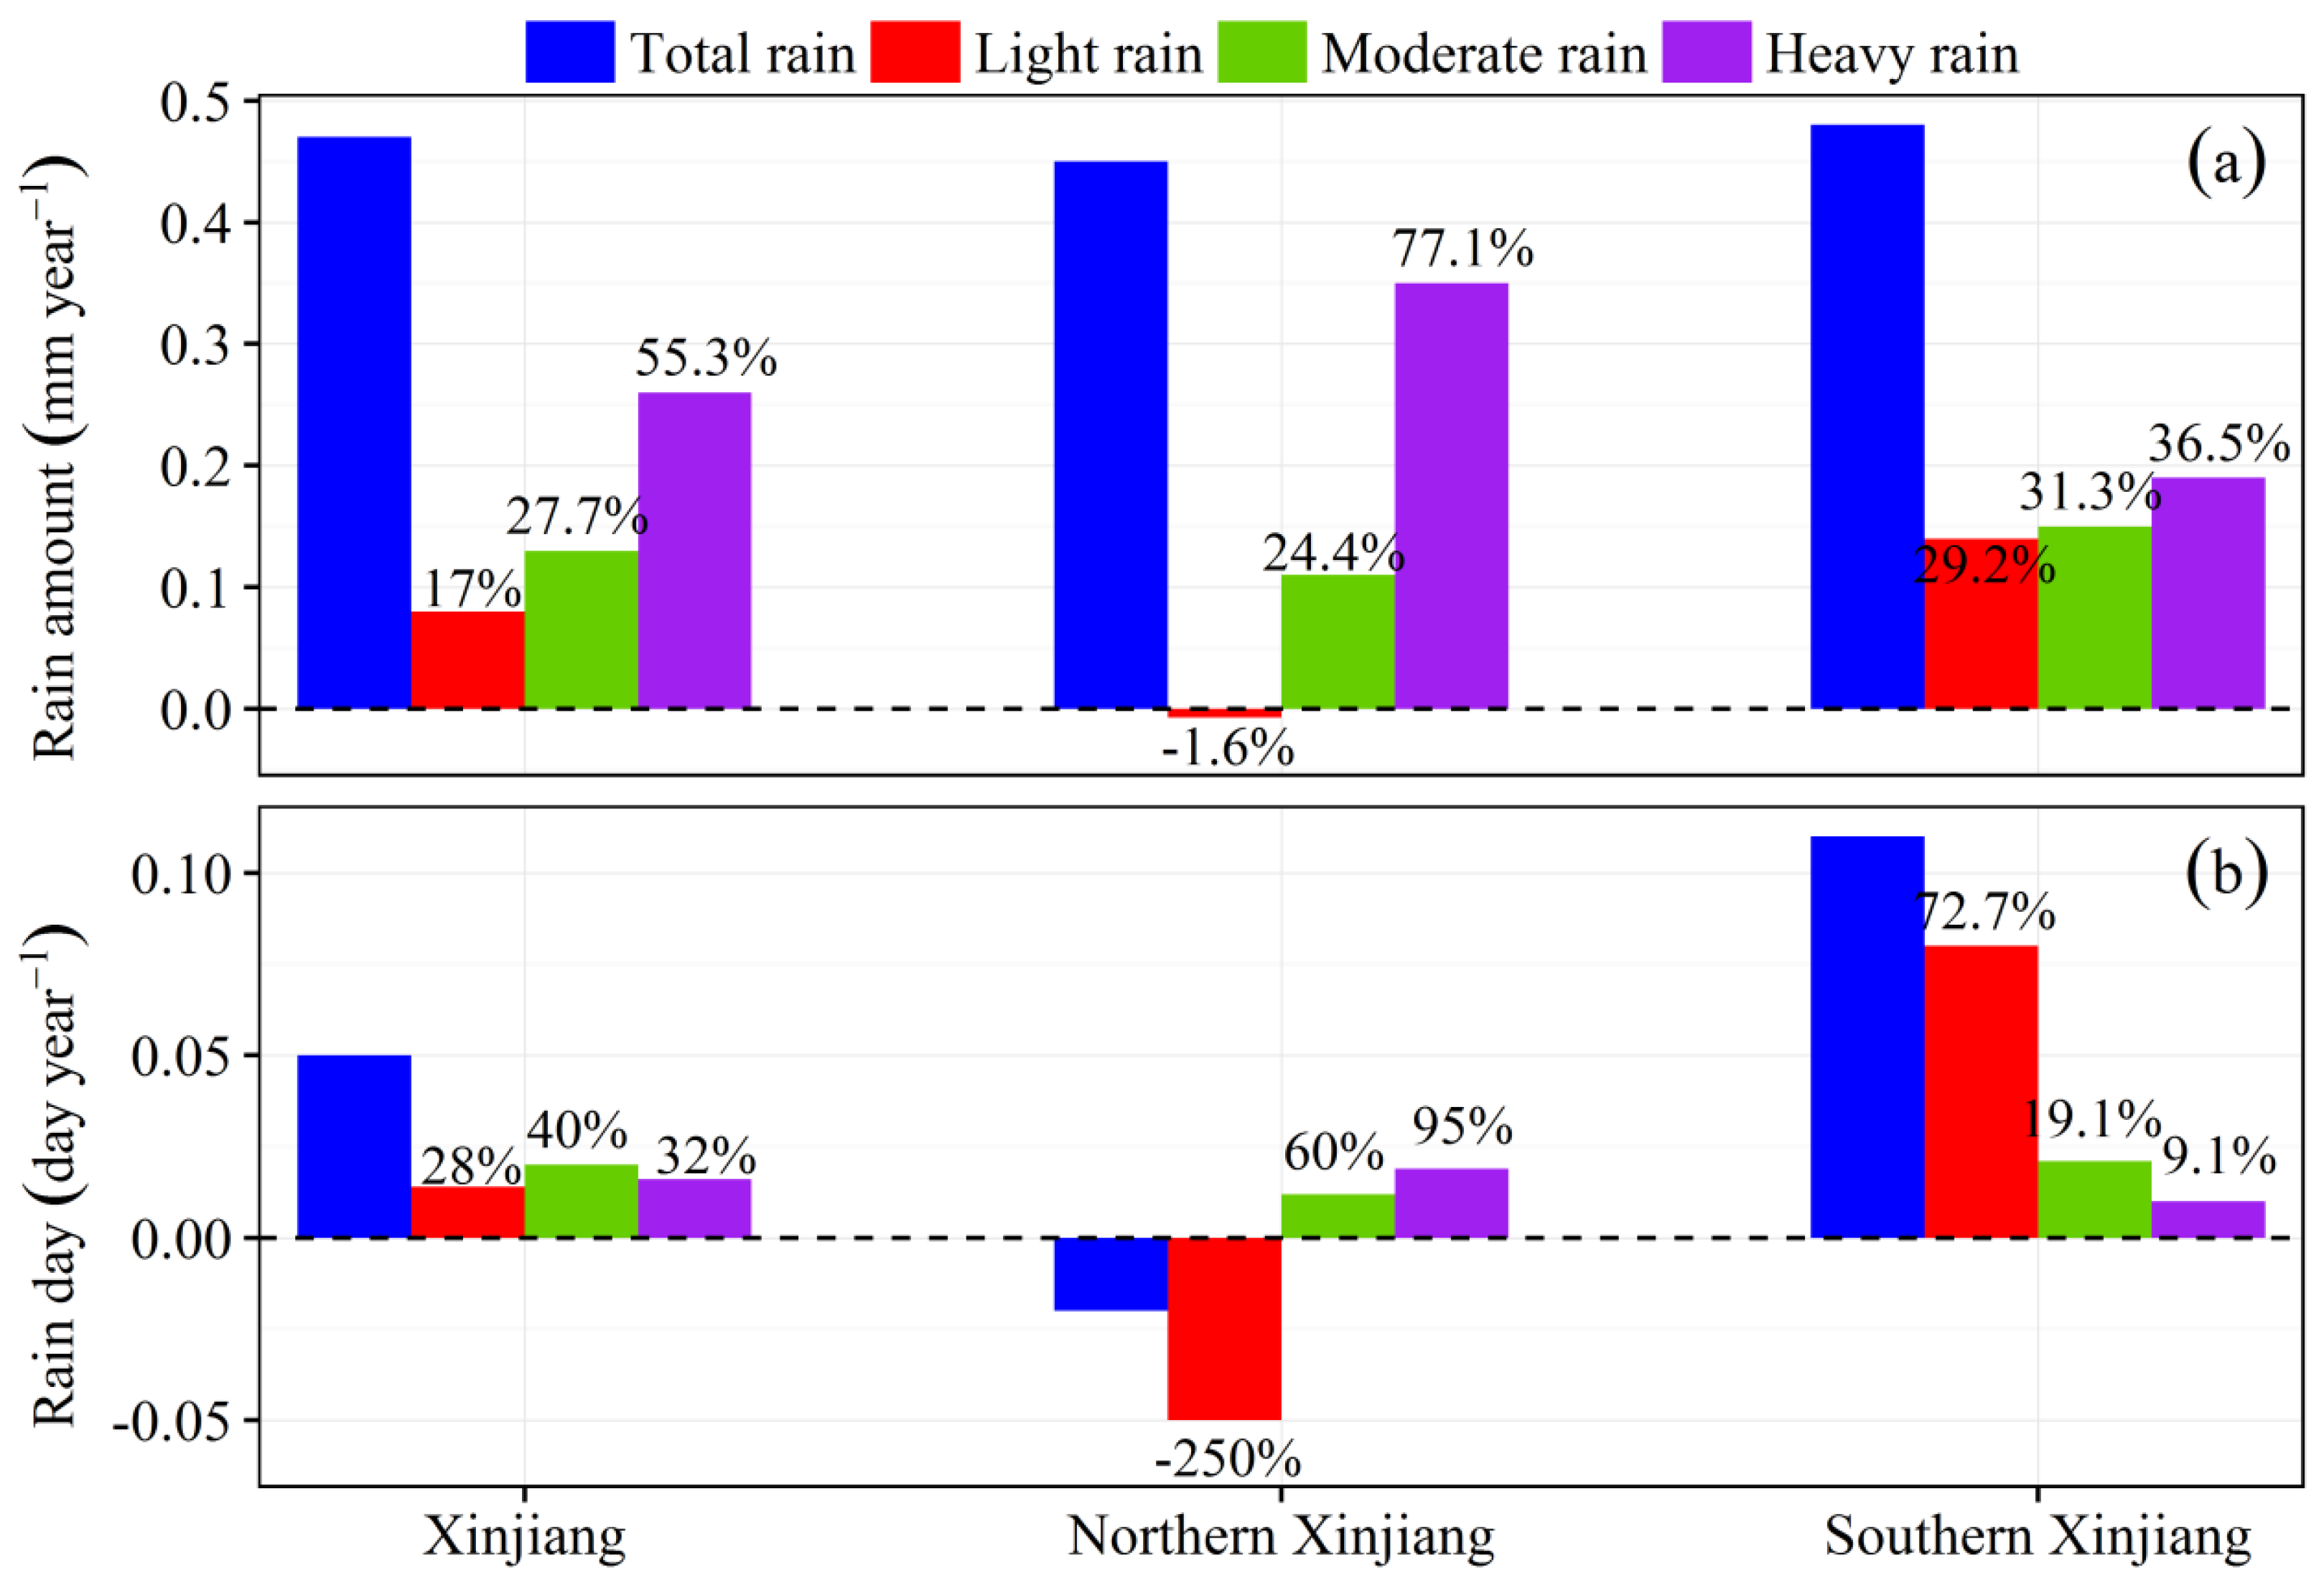
3.3. The Contribution of Light, Moderate, and Heavy Rain to Changes in Total Rain

Temporal trends for rain totals and rain days for the three classes of rain intensity (i.e., light, moderate, and heavy) in Xinjiang were determined according to the above results. Based on trend rates from Table 1, the contributing proportions of light, moderate, and heavy rain to changes in rain total amounts and days were analyzed. The results are discussed in this section.
For rain amounts, contributing proportions of light, moderate, and heavy rain were 17%, 27.7%, and 55.3%, respectively, for the entire region of Xinjiang. For northern Xinjiang, the contributing proportions were −1.6%, 24.4%, and 77.1%, respectively. In southern Xinjiang, the contributing proportions were 29.2%, 31.3%, and 36.5%, respectively (Figure 4a). Contributing proportions increased with rain intensity, and heavy rain amounts contributed the most to changes in total rain amounts within all regions. In general, this finding is consistent with the work of Song et al. [40] for all of the regions of northwest China, including Xinjiang. Heavy precipitation contributed the most to changes in total rain amounts.
Figure 4b provides rain day contributions. Over the entire region of Xinjiang, the contributing proportion of moderate rain was 40%, and this class contributed the most to changes in rain days. In southern Xinjiang, the increase in light rain days contributed the most to increases in total rain days, with a contribution of 72.7%. In northern Xinjiang, decreasing light rain days contributed −250% to the change in total rain days, counteracting increasing contributions of 60% and 95% from moderate and heavy rain days that resulted in a decrease in total rain days by −0.02 day·year−1 (p = 0.46).

3.4. The Relationships of Lower-Tropospheric Specific Humidity and Temperature to Light Rain Days

The results presented above indicate that from 1960–2014, light rain days in northern Xinjiang significantly decreased, a finding that is different from that of increasing light rain days in southern Xinjiang and moderate and heavy rain days within the two sub-regions. The study by Wu et al. [33] determined that both lower-tropospheric temperature and specific humidity (SH) were responsible for light rain day variations. In their study, light rain days were determined to decrease when temperatures increased, while light rain days increased when SH decreased, and vice versa.
As indicated in Figure 5a,b, lower-tropospheric temperatures increased over the entire region of Xinjiang, with significance (p < 0.05) for the southeastern portion of Xinjiang. On a regional scale, lower-tropospheric temperatures in Xinjiang, northern Xinjiang, and southern Xinjiang all displayed insignificant increasing trends of 0.01 K·year−1. The spatial pattern of trends in lower-tropospheric SHs displayed clear regional differences. SH over northern Xinjiang decreased, with a regional averaged rate of −0.002 g/g·year−1 (p < 0.05), while an increase, with a rate of 0.002 g/g·year−1, was determined for southern Xinjiang (p < 0.05). Furthermore, changes in SH were similar to patterns for light rain days that decreased over northern Xinjiang while increasing over southern Xinjiang. As for the change of temperature, increasing temperature is a universal phenomenon in the world due to the greenhouse gas emissions [43]. Th local increasing temperature of Xinjiang was consistent with global change. SH over northern Xinjiang decreased, while SH increased in southern Xinjiang. As for the change of SH, local water vapor in the atmosphere is from local evaporation and transportation from other regions. A study by Hong et al. [44] reported that the change of the annual evaporation in both northern and southern Xinjiang followed a decreasing trend because the humidity in the air increased due to more precipitation in recent years. This indicted that the increase in water vapor in southern Xinjiang was due to it being transported from other regions.
To further detect the relationship between lower-tropospheric temperatures and SHs and light rain days, a correlation analysis was performed. To match ERA-Interim data, station data was interpolated into gridded data with a spatial resolution of 0.75° × 0.75° using the IDW (Inverse Distance Weighted) method. Lower-tropospheric temperature was determined to be negatively correlated with light rain days in the northeastern and southwestern areas of Xinjiang, with correlation coefficients ranging from 0 to −0.5. The correlation was 0.2 for the central area (Figure 6a). Lower-tropospheric SH were, however, determined to be positively correlated with light rain days over the entire region of Xinjiang, with correlation coefficients ranging from 0 to 0.8, and significance over most of the region of Xinjiang (Figure 6c). These results indicated a close relationship between SH and light rain days.
It is important to separate the interaction between SH and temperature, because the two are treated as independent variables. The increasing temperature may increase local evaporation and then impact SH in the atmosphere. However, the study by Hong et al. [44] reported that the change of the annual evaporation in both northern and southern Xinjiang followed a decreasing trend because the humidity in the air increases due to increases in precipitation. The impact of increased temperature on SH may be eliminated according to this study. A relative weights analysis was also conducted in order to explore the effects of lower-tropospheric temperatures and SH on light rain days. Figure 6b indicates that the relative weight of temperatures to light rain days was a mean of 0.13 and a maximum of 0.23. As for the relative weight of SH, the value ranged from 0 to 0.52, with a mean value of 0.41 (Figure 6d). These results also indicated that the effect of SH was greater than that of temperature.
Light rain days have been determined to decrease when temperatures increase, while light rain days have been determined to increase when temperatures decreases [33]. As a result, universal increases in lower-tropospheric temperatures cannot explain increasing trends in light rain events over northern Xinjiang. Over northern Xinjiang, both light rain days and lower-tropospheric SH decreased, while they increased over southern Xinjiang. A correlation analysis indicated that SH was highly correlated with light rain days over the entire region of Xinjiang. Additionally, a close relationship between SH and light rain days was identified using relative weights analysis.
In conclusion, lower-tropospheric SH levels were determined to be the main factor responsible for trends in light rain days in Xinjiang, and temperatures did not display a statistically significant effect. In general, this finding is in conflict with the work of Wu et al. [33] who indicated that both warming and water vapor content are responsible for light rain reductions and that warming is the primary cause for this phenomenon in eastern China. In dry regions such as Xinjiang, lower-tropospheric SH may be the primary cause for trends in light rain days, while lower-tropospheric temperatures are considered to be the dominant factor in humid regions such as eastern China.

4. Conclusions

Spatial and temporal trends for amounts and days of classified summer rain (light, moderate, and heavy rain) in Xinjiang from 1960–2014 were determined in this work. The main conclusions can be summarized as follows:
(1) In Xinjiang, all light, moderate, and heavy rain amounts displayed significant (p < 0.05) increasing trends, with rates of 0.47, 0.44, and 0.49 mm·year−1, respectively. The contributing proportions of light, moderate, and heavy rain to changes in total rain amounts were 14.9%, 28.5%, and 56.6%, respectively. The contributing proportions increased with rain intensity and heavy rain amounts contributed most to the recorded changes.
(2) In northern Xinjiang, light rain days exhibited a significant decreasing trend of −0.064 day·year−1 (p < 0.05), with a contribution of −193.9% to the change in total rain days. This finding was different from that of increasing light rain days in southern Xinjiang, and moderate and heavy rain days in the two sub-regions.
(3) Lower-tropospheric SH levels displayed similar patterns to those of light rain days that decreased over northern Xinjiang while increasing over southern Xinjiang. Results obtained from correlation and relative weights analyses indicated that lower-tropospheric SH was the main factor responsible for light rain day trends in Xinjiang. Increasing temperatures did not result in a significant effect.
Overall, this work may be helpful for understanding rain intensity trends in Xinjiang, and responses to regional climate change and global warming.

Acknowledgments

This research was supported by by the International Partnership Program of Chinese Academy of Sciences (Grant No.131965KYSB20160004).

Author Contributions

Shikai Song, Jianli Ding, Geping Luo and Aixia Yang provided datasets, performed the experiments, and wrote the paper; Zhaolei Zong designed the experiments.

Conflicts of Interest

The authors declare no conflict of interest in this manuscript. The founding sponsors had no role in the design of the study; in the collection, analyses, or interpretation of data; in the writing of the manuscript, and in the decision to publish the results.

References

  1. Jones, P.; Trenberth, K.; Ambenje, P.; Bojariu, R.; Easterling, D.; Klein, T.; Parker, D.; Renwick, J.; Rusticucci, M.; Soden, B. Observations: Surface and atmospheric climate change. In Climate Change 2007: The Physical Science Basis. Contribution of Working Group I to the Fourth Assessment Report of the Intergovernmental Panel on Climate Change; IPCC: Geneva, Switzerland, 2007; pp. 235–336. [Google Scholar]
  2. Trenberth, K.E.; Dai, A.; Rasmussen, R.M.; Parsons, D.B. The changing character of precipitation. Bull. Am. Meteorol. Soc. 2003, 84, 1205–1217. [Google Scholar] [CrossRef]
  3. Wentz, F.J.; Ricciardulli, L.; Hilburn, K.; Mears, C. How much more rain will global warming bring? Science 2007, 317, 233–235. [Google Scholar] [CrossRef] [PubMed]
  4. Wang, B.; Ding, Q.H. Changes in global monsoon precipitation over the past 56 years. Geophys. Res. Lett. 2006. [Google Scholar] [CrossRef]
  5. Han, X.; Yang, Q.; Yao, J. Spatiotemporal distribution characteristics of precipitation in Tianshan Mountain of Xinjiang during the last 51 years. Res.Soil Water Conserv. 2013, 20, 139–144. [Google Scholar]
  6. Li, B.F.; Chen, Y.N.; Chen, Z.S.; Xiong, H.G.; Lian, L.S. Why does precipitation in Northwest China show a significant increasing trend from 1960 to 2010? Atmos. Res. 2016, 167, 275–284. [Google Scholar] [CrossRef]
  7. Tan, X.Z.; Shao, D.G. Precipitation trends and teleconnections identified using quantile regressions over Xinjiang, China. Int. J. Climatol. 2016. [Google Scholar] [CrossRef]
  8. Xu, J.H.; Chen, Y.N.; Li, W.H.; Liu, Z.H.; Tang, J.; Wei, C.M. Understanding temporal and spatial complexity of precipitation distribution in Xinjiang, China. Theor. Appl. Climatol. 2015, 123, 1–13. [Google Scholar] [CrossRef]
  9. Zhang, Q.; Li, J.F.; Singh, V.P.; Xu, C.Y.; Bai, Y.G. Changing structure of the precipitation process during 1960–2005 in Xinjiang, China. Theor Appl. Climatol. 2012, 110, 229–244. [Google Scholar] [CrossRef]
  10. Liang, K.; Liu, S.; Bai, P.; Nie, R. The yellow river basin becomes wetter or drier? The case as indicated by mean precipitation and extremes during 1961–2012. Theor. Appl. Climatol. 2015, 119, 701–722. [Google Scholar] [CrossRef]
  11. Ren, Z.G.; Zhang, M.J.; Wang, S.J.; Qiang, F.; Zhu, X.F.; Dong, L. Changes in daily extreme precipitation events in South China from 1961 to 2011. J. Geogr. Sci. 2015, 25, 58–68. [Google Scholar] [CrossRef]
  12. Jiang, F.Q.; Hu, R.J.; Wang, S.P.; Zhang, Y.W.; Tong, L. Trends of precipitation extremes during 1960–2008 in xinjiang, the Northwest China. Theor. Appl. Climatol. 2012, 111, 133–148. [Google Scholar] [CrossRef]
  13. Wang, B.L.; Zhang, M.J.; Wei, J.L.; Wang, S.J.; Li, S.S.; Ma, Q.; Li, X.F.; Pan, S.K. Changes in extreme events of temperature and precipitation over Xinjiang, Northwest China, during 1960–2009. Quat. Int. 2013, 298, 141–151. [Google Scholar] [CrossRef]
  14. Zhang, Q.; Singh, V.P.; Li, J.; Jiang, F.; Bai, Y. Spatio-temporal variations of precipitation extremes in Xinjiang, China. J. Hydrol. 2012, 434, 7–18. [Google Scholar] [CrossRef]
  15. Zhang, Y.W.; Wei, W.S.; Jiang, F.Q.; Liu, M.Z.; Wang, W.W. Trends of extreme precipitation events over Xinjiang during 1961–2008. J. Mt. Sci. 2012, 30, 417–424. [Google Scholar]
  16. Zhang, Y.W.; Jiang, F.Q.; Wei, W.S.; Wang, W.W.; Liu, M.Z.; Han, X.; Hong, W.; Lu, H. Probability distribution of precipitation extremes over Xinjiang during 1961–2004. J. Desert Res. 2012, 32, 503–508. [Google Scholar]
  17. Allan, R.; Soden, B. Atmospheric warming and the amplification of precipitation extremes. Science 2008, 321, 1481–1484. [Google Scholar] [CrossRef] [PubMed]
  18. Lehmann, J.; Coumou, D.; Frieler, K. Increased record-breaking precipitation events under global warming. Clim. Chang. 2015, 132, 501–515. [Google Scholar] [CrossRef]
  19. Wasko, C.; Sharma, A. Quantile regression for investigating scaling of extreme precipitation with temperature. Water Resour. Res. 2014, 50, 3608–3614. [Google Scholar] [CrossRef]
  20. Goswami, B.N.; Venugopal, V.; Sengupta, D.; Madhusoodanan, M.S.; Xavier, P.K. Increasing trend of extreme rain events over India in a warming environment. Science 2006, 314, 1442–1445. [Google Scholar] [CrossRef] [PubMed]
  21. Rahmstorf, S.; Coumou, D. Increase of extreme events in a warming world. Proc. Natl. Acad. Sci. USA 2011, 108, 17905–17909. [Google Scholar] [CrossRef] [PubMed]
  22. Alexander, L.V.; Zhang, X.; Peterson, T.C.; Caesar, J.; Gleason, B.; Tank, A.; Haylock, M.; Collins, D.; Trewin, B.; Rahimzadeh, F.; et al. Global observed changes in daily climate extremes of temperature and precipitation. J. Geophys. Res. Atmos. 2006. [Google Scholar] [CrossRef]
  23. Tank, A.; Konnen, G.P. Trends in indices of daily temperature and precipitation extremes in Europe, 1946–1999. J. Clim. 2003, 16, 3665–3680. [Google Scholar] [CrossRef]
  24. Kharin, V.V.; Zwiers, F.W.; Zhang, X.B.; Hegerl, G.C. Changes in temperature and precipitation extremes in the IPCC ensemble of global coupled model simulations. J. Clim. 2007, 20, 1419–1444. [Google Scholar] [CrossRef]
  25. Jones, R.H.; Westra, S.; Sharma, A. Observed relationships between extreme sub-daily precipitation, surface temperature, and relative humidity. Geophys. Res. Lett. 2010, 37, 22805–22810. [Google Scholar]
  26. Wasko, C.; Sharma, A. Steeper temporal distribution of rain intensity at higher temperatures within Australian Storms. Nat. Geosci. 2015, 8, 527–529. [Google Scholar] [CrossRef]
  27. Pall, P.; Allen, M.R.; Stone, D.A. Testing the clausius-clapeyron constraint on changes in extreme precipitation under CO2 warming. Clim. Dyn. 2007, 28, 351–363. [Google Scholar] [CrossRef]
  28. Qian, W.H.; Fu, J.K.; Yan, Z.W. Decrease of light rain events in summer associated with a warming environment in China during 1961–2005. Geophys. Res. Lett. 2007. [Google Scholar] [CrossRef]
  29. Fu, J.; Qian, W.; Lin, X.; Chen, D. Trends in graded precipitation in china from 1961 to 2000. Adv. Atmos. Sci. 2008, 25, 267–278. [Google Scholar] [CrossRef]
  30. Yun, Q.; Gong, D.; Fan, J.; Ruby, L.L.; Ralf, B.; Chen, D.; Wang, W. Heavy pollution suppresses light rain in china: Observations and modeling. J. Geophys. Res. 2009, 114, 4427–4433. [Google Scholar]
  31. Liu, B.; Xu, M.; Henderson, M. Where have all the showers gone? Regional declines in light precipitation events in China, 1960–2000. Int. J. Climatol. 2011, 31, 1177–1191. [Google Scholar] [CrossRef]
  32. Huang, G.; Wen, G. Spatial and temporal variations of light rain events over china and the mid-high latitudes of the Northern Hemisphere. Chin. Sci. Bull. 2013, 58, 1402–1411. [Google Scholar] [CrossRef]
  33. Wu, J.; Zhang, L.; Zhao, D.; Tang, J. Impacts of warming and water vapor content on the decrease in light rain days during the warm season over Eastern China. Clim. Dyn. 2014, 45, 1841–1857. [Google Scholar] [CrossRef]
  34. Liu, R.; Liu, S.C.; Cicerone, R.J.; Shiu, C.J.; Li, J.; Wang, J.L.; Zhang, Y.H. Trends of extreme precipitation in eastern china and their possible causes. Adv. Atmos. Sci. 2015, 32, 1027–1037. [Google Scholar] [CrossRef]
  35. Zhai, P.M.; Zhang, X.B.; Wan, H.; Pan, X.H. Trends in total precipitation and frequency of daily precipitation extremes over China. J. Clim. 2005, 18, 1096–1108. [Google Scholar] [CrossRef]
  36. Dee, D.P.; Uppala, S.M.; Simmons, A.J.; Berrisford, P.; Poli, P.; Kobayashi, S.; Andrae, U.; Balmaseda, M.A.; Balsamo, G.; Bauer, P.; et al. The era-interim reanalysis: Configuration and performance of the data assimilation system. Q. J. R. Meteorol. Soc. 2011, 137, 553–597. [Google Scholar] [CrossRef]
  37. Berrisford, P.; Dee, D.P.; Fielding, K.; Fuentes, M.; Kållberg, P.W.; Kobayashi, S.; Uppala, S.M. The ERA-Interim Archive; European Centre for Medium-Range Weather Forecasts: Shinfield, UK, 2009. [Google Scholar]
  38. Su, T.; Feng, G.L. The characteristics of the summer atmospheric water cycle over china and comparison of ERA-Interim and merra reanalysis. Acta Phys. Sin. 2014, 63, 249201. [Google Scholar]
  39. Zhou, J.; Wu, Y.P.; Feng, G.L.; Hu, J.G. Spatial and temporal characteristics of moisture cycle factors over china analyzed with Era-Interim reanalysis data. Acta Phys. Sin. 2013, 62, 199202. [Google Scholar]
  40. Song, S.K.; Li, L.H.; Chen, X.; Bai, J. The dominant role of heavy precipitation in precipitation change despite opposite trends in west and east of Northern China. Int. J. Clim. 2015, 35, 4329–4336. [Google Scholar] [CrossRef]
  41. Nimon, K.F.; Oswald, F.L. Understanding the results of multiple linear regression beyond standardized regression coefficients. Organ. Res. Method. 2013, 16, 650–674. [Google Scholar] [CrossRef] [Green Version]
  42. Johnson, J.W. A heuristic method for estimating the relative weight of predictor variables in multiple regression. Multivar. Behav. Res. 2000, 35, 1–19. [Google Scholar] [CrossRef] [PubMed]
  43. Stocker, T.F.; Qin, D.; Plattner, G.K.; Tignor, M.; Allen, S.K.; Boschung, J.; Nauels, A.; Xia, Y.; Bex, V.; Midgley, P.M. Climate Change 2013: The Physical Science Basis. Contribution of Working Group I to the Fifth Assessment Report of the Intergovernmental Panel on Climate Change; Cambridge University Press: Cambridge, UK, 2013. [Google Scholar]
  44. Hong, S.U.; Wei, W.; Han, P. Changes in air temperature and evaporation in Xinjiang during recent 50 years. J. Glaciol. Geocryol. 2003, 25, 174–178. [Google Scholar]
Figure 1. The geographical distribution of the 52 weather stations in Xinjiang, as well as the sub-regions (northern and southern Xinjiang).
Atmosphere 08 00020 g001
Figure 2. Spatial trends for rain amounts (mm/year) and days (day/year) for total rain and for the three rain classes (light, moderate, and heavy rain) in Xinjiang during the warm season (May to October) from 1960–2014. Total rain amounts; (b) light rain amounts; (c) moderate rain amounts; (d) heavy rain days; (e) total rain days; (f) light rain days; (g) moderate rain days; and (h) heavy rain days. Solid dots at stations indicate significance at the 0.05 level.
Atmosphere 08 00020 g002
Figure 3. Temporal trends in rain amounts (mm/year) and days (day/year) for total rain and the three classes (light, moderate, and heavy rain) in Xinjiang, northern Xinjiang, and southern Xinjiang during the warm season from 1960–2014. (a) Rain amounts in Xinjiang; (b) Rain amounts in northern Xinjiang; (c) Rain amounts in southern Xinjiang; (d) Rain days in Xinjiang; (e) Rain days in northern Xinjiang; and (f) Rain days in southern Xinjiang.
Atmosphere 08 00020 g003
Figure 4. The proportions of light, moderate, and heavy rain contributing to changes in rain amounts and days during the warm season from 1960–2014. (a) Rain amounts; and (b) rain days.
Atmosphere 08 00020 g004
Figure 5. Spatial and temporal trends in lower-tropospheric temperatures and SHs from 1960–2014 over Xinjiang. (a) The spatial distribution for trends in temperature; (b) Temporal trends in temperature over Xinjiang, northern Xinjiang, and southern Xinjiang; (c) The spatial distribution for trends in SH; (d) The temporal trends for SH over Xinjiang, northern Xinjiang, and southern Xinjiang. Black dots in the pixels represent significance at the 0.05 level.
Atmosphere 08 00020 g005
Figure 6. The spatial distribution of results obtained from the correlation and relative weights analyses during the warm season from 1960–2014 over Xinjiang. (a) A correlation between lower-tropospheric temperature and light rain days; (b) A correlation between lower-tropospheric SH and light rain days; (c) The relative weights of lower-tropospheric temperatures to light rain days; (d) The relative weights of lower-tropospheric SH to light rain days.
Atmosphere 08 00020 g006
Table 1. Trends in rain amounts (mm/year) and days (day/year) for Xinjiang, northern Xinjiang, and southern Xinjiang during the warm season from 1960–2014. “Slope” and “p” indicate the slope and the statistical p value, respectively. The symbols *, **, and *** represent significance at the 0.05, 0.01, and 0.001 levels, respectively. NS indicates “not significant”.
TypeRegionTotal RainLight RainModerate RainHeavy Rain
SlopepSlopepSlopepSlopep
AmountXinjiang0.47***0.08*0.13**0.26***
Northern Xinjiang0.45*−0.007NS0.11*0.35***
Southern Xinjiang0.48***0.14***0.15**0.19**
DayXinjiang0.05NS0.014NS0.02**0.016***
Northern Xinjiang−0.02NS−0.05*0.012NS0.019***
Southern Xinjiang0.11***0.08***0.021**0.01***

