Next Issue
Volume 8, February
Previous Issue
Volume 7, December


Atmosphere, Volume 8, Issue 1 (January 2017) – 22 articles

Cover Story (view full-size image): 
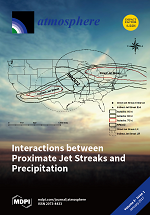
An example of a Rossby Radius of Deformation Overlap Zone (RRDOZ) region, as a result of intersecting Rossby Radius buffers around the entrance (direct buffer black circle with vertical ticks), and exit (indirect buffer black dashed circle) regions of potentially coupled jet streaks at 250 hPa. This map was created using the Aeronautical Reconnaissance Coverage Geographical Information System (ArcGIS) software package (Version 10.1) licensed to the University of Missouri. By Anthony R. Lupo. View the paper
  • Issues are regarded as officially published after their release is announced to the table of contents alert mailing list.
  • You may sign up for e-mail alerts to receive table of contents of newly released issues.
  • PDF is the official format for papers published in both, html and pdf forms. To view the papers in pdf format, click on the "PDF Full-text" link, and use the free Adobe Reader to open them.
Order results
Result details
Section
Select all
Export citation of selected articles as:
6833 KiB  
Article
Mountain Waves in High Resolution Forecast Models: Automated Diagnostics of Wave Severity and Impact on Surface Winds
by Peter Sheridan, Simon Vosper and Philip Brown
Atmosphere 2017, 8(1), 24; https://doi.org/10.3390/atmos8010024 - 23 Jan 2017
Cited by 8 | Viewed by 6294
Abstract
An automated method producing a diagnostic of the severity of lee waves and their impacts on surface winds as represented in output from a high resolution linear numerical model (3D velocities over mountains (3DVOM)) covering several areas of the U.K. is discussed. Lee [...] Read more.
An automated method producing a diagnostic of the severity of lee waves and their impacts on surface winds as represented in output from a high resolution linear numerical model (3D velocities over mountains (3DVOM)) covering several areas of the U.K. is discussed. Lee waves involving turbulent rotor activity or downslope windstorms represent a hazard to aviation and ground transport, and summary information of this kind is highly valuable as an efficient ‘heads-up’ for forecasters, for automated products or to feed into impact models. Automated diagnosis of lee wave surface effects presents a particular challenge due to the complexity of turbulent zones in the lee of irregular terrain. The method proposed quantifies modelled wind perturbations relative to those that would occur in the absence of lee waves for a given background wind, and diagnoses using it are found to be quite consistent between cases and for different ranges of U.K. hills. A recent upgrade of the operational U.K. limited area model, the U.K. Variable Resolution Model (UKV) used for general forecasting at the Met Office means that it now resolves lee waves, and its performance is here demonstrated using comparisons with aircraft- and surface-based observations and the linear model. In the future, automated diagnostics may be adapted to use its output to routinely produce contiguous mesoscale maps of lee wave activity and surface impacts over the whole U.K. Full article
(This article belongs to the Special Issue Atmospheric Gravity Waves)
Show Figures

Figure 1

2531 KiB  
Article
Numerical Study on an Airflow Field of a Reticle Stocker with a Moving Crane in a Mini-Environment
by Shao-Shu Chu, Ben-Ran Fu, Shih-Cheng Hu and Shih-Jie Jhou
Atmosphere 2017, 8(1), 23; https://doi.org/10.3390/atmos8010023 - 21 Jan 2017
Cited by 2 | Viewed by 4436
Abstract
This study numerically investigates the effects of a moving crane and airflow on contaminant removal efficiency of various reticle box coverage sequences in a stocker. The analyzed characteristics of flow patterns are used to protect the reticles from contaminants, without altering their internal [...] Read more.
This study numerically investigates the effects of a moving crane and airflow on contaminant removal efficiency of various reticle box coverage sequences in a stocker. The analyzed characteristics of flow patterns are used to protect the reticles from contaminants, without altering their internal component configuration in conjunction with the aim of cost-savings. A finite volume method was applied in a numerical analysis using computational fluid dynamics software, ANSYS Fluent. To simulate actual operating conditions, the effects of inlet velocity of clean air and crane movement speed on contaminant removal efficiency (CRE) are considered, and a particle release technique is analyzed to determine contaminant concentrations in the stocker. The results show that a higher airflow rate leads to a better contaminant removal efficiency in the stocker. For the various arrangements of reticle boxes in the stocker, the symmetric coverage sequence provides the most satisfactory contaminant removal rate. An optimal inlet airflow velocity of 0.12 m/s is obtained based on the CRE distribution. In addition, the airflow distributions indicate that a vortex is induced by the air flow through a solid boundary; thus, a higher inlet airflow velocity results in a small vortex that also benefits the CRE. The results also demonstrate that a high crane movement speed causes a large reverse flow region at the bottom that also induces a long wake behind the crane, into which particles are easily drawn. Full article
Show Figures

Figure 1

2838 KiB  
Article
Possible Causes for Spatial and Temporal Variation of Warm Season Precipitation in Xinjiang from 1960–2014
by Shikai Song, Jianli Ding, Zhaolei Zong, Aixia Yang and Geping Luo
Atmosphere 2017, 8(1), 20; https://doi.org/10.3390/atmos8010020 - 20 Jan 2017
Cited by 4 | Viewed by 4061
Abstract
In this work, rain totals from 1960–2014, obtained during the warm season (May to October) from 52 meteorological stations, over Xinjiang, China were classified as either light, moderate, or heavy rain in two sub-regions (northern and southern). Spatial and temporal trends for rain [...] Read more.
In this work, rain totals from 1960–2014, obtained during the warm season (May to October) from 52 meteorological stations, over Xinjiang, China were classified as either light, moderate, or heavy rain in two sub-regions (northern and southern). Spatial and temporal trends for rain amounts and days for the three rain classes were determined. All light, moderate, and heavy rain amounts displayed increasing trends over the two sub-regions. Furthermore, heavy rain amounts contributed the most to changes in total rain amounts. Light rain days in northern Xinjiang significantly decreased, in contrast to increasing light rain days in southern Xinjiang and moderate and heavy rain days within two sub-regions. Results obtained from correlation and relative weights analyses implied that lower-tropospheric specific humidity was the main factor responsible for light rain day trends in Xinjiang. Increasing temperatures were not found to have a significant effect. Full article
Show Figures

Figure 1

432 KiB  
Editorial
Announcing the Atmosphere 2017 Travel Award for Young Investigators
by Atmosphere Editorial Office
Atmosphere 2017, 8(1), 21; https://doi.org/10.3390/atmos8010021 - 19 Jan 2017
Viewed by 2661
Abstract
With the goal of recognizing outstanding contributions to the field of atmosphere sciences by early-career investigators, including postdoctoral fellows, assistant professors, or equivalent, and assisting them in attending international conferences in 2017, last year the journal Atmosphere accepted nominations for the 2017 Travel [...] Read more.
With the goal of recognizing outstanding contributions to the field of atmosphere sciences by early-career investigators, including postdoctoral fellows, assistant professors, or equivalent, and assisting them in attending international conferences in 2017, last year the journal Atmosphere accepted nominations for the 2017 Travel Award for Young Investigators.[...] Full article
Show Figures

Figure 1

573 KiB  
Article
Tracheobronchial and Alveolar Particle Surface Area Doses in Smokers
by Fernanda Carmen Fuoco, Luca Stabile, Giorgio Buonanno, Mauro Scungio, Maurizio Manigrasso and Andrea Frattolillo
Atmosphere 2017, 8(1), 19; https://doi.org/10.3390/atmos8010019 - 19 Jan 2017
Cited by 15 | Viewed by 4532
Abstract
Cigarette smoke is the main cause of lung cancer events. Mainstream cigarette smoke (MSS) is a direct concern for smokers, but also the secondhand smoke (SHS) contributes to the smoker exposure. In addition, smoker exposure is affected by the “free-smoke” particle exposure (B), [...] Read more.
Cigarette smoke is the main cause of lung cancer events. Mainstream cigarette smoke (MSS) is a direct concern for smokers, but also the secondhand smoke (SHS) contributes to the smoker exposure. In addition, smoker exposure is affected by the “free-smoke” particle exposure (B), related to the micro-environments where smokers spend time. The aim of this paper is to evaluate the daily alveolar and tracheobronchial deposited fractions of airborne particles for smokers as the sum of these three contributions: MSS, SHS, and B. Measurements of particle surface area distributions in the MSS were performed through a Scanning Mobility Particle Sizer, an Aerodynamic Particle Sizer, and a Thermo-dilution system on five types of conventional cigarettes. A Monte Carlo method was then applied to evaluate the most probable value of dose received during the inhalation of MSS by smokers. Measurements of particle concentrations in SHS and at the “free-smoke” particle background (B) were performed through 24-h monitoring at a personal scale of adult smoker through hand-held devices. This paper found that the total daily deposited dose for typical smokers was 1.03 × 105 mm2·day−1. The main contribution of such a huge daily dose was addressable to the MSS (98%) while SHS contributed 1.1%, increasing up to 2% for people smoking only while traveling in a car. Full article
(This article belongs to the Special Issue Ultrafine Particles: Determination, Behavior and Human Health Effects)
Show Figures

Figure 1

959 KiB  
Article
Inhomogeneous Radiative Forcing of NF3
by Peng Lu, Hua Zhang and Jinxiu Wu
Atmosphere 2017, 8(1), 17; https://doi.org/10.3390/atmos8010017 - 18 Jan 2017
Cited by 3 | Viewed by 3857
Abstract
Nitrogen trifluoride (NF3) has the potential to make a growing contribution to the Earth’s radiative budget. In this study, the global mean radiative efficiency of NF3 is calculated as 0.188 W·m−2·ppb−1 by line-by-line method. Global warming potentials [...] Read more.
Nitrogen trifluoride (NF3) has the potential to make a growing contribution to the Earth’s radiative budget. In this study, the global mean radiative efficiency of NF3 is calculated as 0.188 W·m−2·ppb−1 by line-by-line method. Global warming potentials of 14,700 for 100 years and global temperature potentials of 16,600 for 100 years are calculated. At the same time, inhomogeneous instantaneous radiative forcing of NF3 at the top of the atmosphere and its relationship to other atmospheric and surface variables are studied. A total of 42 atmospheric profiles are used. The results show NF3 instantaneous radiative efficiency range from 0.07 W·m−2·ppb−1 to 0.50 W·m−2·ppb−1 in clear sky conditions. The mean value is 0.25 W·m−2·ppb−1. In clear sky conditions, the correlation coefficient between surface temperature and NF3 instantaneous radiative forcing is 0.94 and the partial correlation coefficient is −0.88 between integrated water content and NF3 instantaneous radiative forcing. A regression model is constructed for NF3 instantaneous radiative forcing based on surface temperature and integrated water content. The average value of the relative error is 6.17% based on LBLRTM (Line-by-Line Radiative Transfer Model) results. The correlation coefficient is 0.985 between cloud radiative forcing and the difference of NF3 instantaneous radiative forcing between clear sky and all cloudy sky conditions. A regression model is constructed for NF3 instantaneous radiative forcing in all cloudy sky. The average relative error is 5.9% based on LBLRTM results. Full article
Show Figures

Figure 1

3235 KiB  
Article
Lidar and Ceilometer Observations and Comparisons of Atmospheric Cloud Structure at Nagqu of Tibetan Plateau in 2014 Summer
by Xiaoquan Song, Xiaochun Zhai, Liping Liu and Songhua Wu
Atmosphere 2017, 8(1), 9; https://doi.org/10.3390/atmos8010009 - 17 Jan 2017
Cited by 13 | Viewed by 4825
Abstract
In the project of the Third Tibetan Plateau Experiment of Atmospheric Science (TIPEX III), the intensive observation of cloud and precipitation in Nagqu was conducted from 1 July to 31 August 2014. The CL31 ceilometer and a WAter vapor, Cloud and Aerosol Lidar [...] Read more.
In the project of the Third Tibetan Plateau Experiment of Atmospheric Science (TIPEX III), the intensive observation of cloud and precipitation in Nagqu was conducted from 1 July to 31 August 2014. The CL31 ceilometer and a WAter vapor, Cloud and Aerosol Lidar (WACAL) were deployed and focused on studying the cloud macroscopic characteristics and vertical distribution. The statistical result of CL31 ceilometer in continuous operation mode shows that the cloud occurrence is about 81% with a majority of simple one-layer cloud. The cloud base and top height are retrieved by improved differential zero-crossing method using lidar data. The results of cloud base height (CBH) are compared with CL31 ceilometer, showing a good consistency with each other, however, in some cases, the CL31 ceilometer overestimates the CBH and is also validated by synchronous radiosonde data. The time snippet comparisons of cloud property between CL31 ceilometer and lidar imply that the cloud properties have obvious diurnal variations with “U” shape distribution. The cloud development including the time-spatial distribution features also has distinct diurnal variations based on the lidar measurement. The detection range of lidar goes beyond the maximum height of CL31 ceilometer, offering substantial observations to the analysis of cirrus cloud radiation characteristics and formation mechanism. Full article
Show Figures

Figure 1

4434 KiB  
Article
Evaluating the Relationship between Field Aerodynamic Roughness and the MODIS BRDF, NDVI, and Wind Speed over Grassland
by Qiang Xing, Bingfang Wu, Nana Yan, Mingzhao Yu and Weiwei Zhu
Atmosphere 2017, 8(1), 16; https://doi.org/10.3390/atmos8010016 - 17 Jan 2017
Cited by 6 | Viewed by 4070
Abstract
Aerodynamic roughness (AR) is an important parameter that influences the momentum and energy exchange between the earth’s surface and the atmosphere. In this study, profile wind data observed during the vegetation growing period (April–September) in 2013 and 2014 at the A’rou grassland station, [...] Read more.
Aerodynamic roughness (AR) is an important parameter that influences the momentum and energy exchange between the earth’s surface and the atmosphere. In this study, profile wind data observed during the vegetation growing period (April–September) in 2013 and 2014 at the A’rou grassland station, which is in the upstream of the Heihe River Basin (HRB), were used to determine the relationship between the field AR and the Moderate-resolution Imaging Spectroradiometer (MODIS) near-infrared (NIR) bi-directional reflectance distribution function (BRDF) R index, the normalized difference vegetation index (NDVI), and a combination of these indices. In addition, the relationship between the average wind speed at a height of 1 m and the field AR is also presented. The results indicate that the MODIS NIR BRDF_R index and the NDVI are both sensitive indicators of the AR over grassland (R2: 0.5228 for NIR BRDF_R; R2: 0.579 for NDVI). Moreover, the combined index shows a significantly increased R2 value of 0.721, which is close to the result inferred from the wind speed (R2: 0.7411). The proposed remote sensing-based combination index (CI) has the potential for use in evaluations of the AR over grasslands during growing season and its sensitivity can reach levels that are comparable to considering the effects of wind speed, which usually requires ground-based observations. Full article
Show Figures

Figure 1

6524 KiB  
Article
Projected Changes in Temperature Extremes in China Using PRECIS
by Yujing Zhang, Liang Fu, Jie Pan and Yinlong Xu
Atmosphere 2017, 8(1), 15; https://doi.org/10.3390/atmos8010015 - 17 Jan 2017
Cited by 18 | Viewed by 5430
Abstract
Temperature extremes can cause disastrous impacts on ecological and social economic systems. China is very sensitive to climate change, as its warming rate exceeds that of the global mean level. This paper focused on the spatial and temporal changes of the temperature extremes [...] Read more.
Temperature extremes can cause disastrous impacts on ecological and social economic systems. China is very sensitive to climate change, as its warming rate exceeds that of the global mean level. This paper focused on the spatial and temporal changes of the temperature extremes characterized by the 95th percentile of maximum temperature (TX95), the 5th percentile of the minimum temperature (TN5), high-temperature days (HTD) and low-temperature days (LTD). The daily maximum and minimum temperatures generated by PRECIS under different Representative Concentration Pathways (RCPs) are used in the research. The results show that: (1) Model simulation data can reproduce the spatial distribution features of the maximum temperature (Tmax) and minimum temperature (Tmin) as well as that of the extreme temperature indices; (2) By the end of the 21st century (2070–2099), both the Tmax and Tmin are warmer than the baseline level (1961–1990) in China and the eight sub-regions. However, there are regional differences in the asymmetrical warming features, as the Tmin warms more than the Tmax in the northern part of China and the Tibetan Plateau, while the Tmax warms more than the Tmin in the southern part of China; (3) The frequency of the warm extremes would become more usual, as the HTD characterized by the present-day threshold would increase by 106%, 196% and 346%, under RCP2.6, RCP4.5 and RCP8.5, respectively, while the cold extremes characterized by the LTD would become less frequent by the end of the 21st century, decreasing by 75%, 90% and 98% under RCP2.6, RCP4.5 and RCP8.5, respectively. The southern and eastern parts of the Tibetan Plateau respond sensitively to changes in both the hot and cold extremes, suggesting its higher likelihood to suffer from climate warming; (4) The intensity of the warm (cold) extremes would increase (decrease) significantly, characterized by the changes in the TX95 (TN5) by the end of the 21st century, and the magnitude of the increase in the TN5 is larger than that of the TX95 in the national mean value. The changes in both the TX95 and TN5 are larger under the higher versus weaker emission scenario, indicating that it is essential to reduce the GHG emissions and take adaptation measures in the future. Full article
(This article belongs to the Special Issue Temperature Extremes and Heat/Cold Waves)
Show Figures

Figure 1

2459 KiB  
Article
Evaluation of Surface Clutter for Future Geostationary Spaceborne Weather Radar
by Xuehua Li, Jianxin He, Chuanzhi Wang, Shunxian Tang and Xiaoyu Hou
Atmosphere 2017, 8(1), 14; https://doi.org/10.3390/atmos8010014 - 17 Jan 2017
Cited by 7 | Viewed by 5663
Abstract
Surface clutter interference will be one of the important problems for the future of geostationary spaceborne weather radar (GSWR). The aim of this work is to provide some numerical analyses on surface clutter interference and part of the performance evaluation for the future [...] Read more.
Surface clutter interference will be one of the important problems for the future of geostationary spaceborne weather radar (GSWR). The aim of this work is to provide some numerical analyses on surface clutter interference and part of the performance evaluation for the future implementation of GSWR. The received powers of rain echoes, land and sea surfaces from a radar scattering volume are calculated numerically based on the derived radar equations, assuming a uniform rain layer and appropriate land and sea surface scattering models. An antenna pattern function based on a Bessel curve and Taylor weighting is considered to approximate the realistic spherical antenna of a GSWR. The power ratio of the rain echo signal to clutter (SCR) is then used to evaluate the extension of surface clutter interference. The study demonstrates that the entire region of surface clutter interference in GSWR will be wider than those in tropical rainfall measuring mission precipitation radar (TRMM PR). Most strong surface clutter comes from the antenna mainlobe, and the decrease of clutter contamination through reducing the level of the antenna sidelobe and range sidelobe are not obvious. In addition, the clutter interference is easily affected by rain attenuation in the Ka-band. When rain intensity is greater than 10 mm/h, most of rain echoes at off-nadir scanning angles will not be interfered by surface clutter. Full article
(This article belongs to the Special Issue Radar Meteorology)
Show Figures

Figure 1

7318 KiB  
Article
Water Tank Experiments on Stratified Flow over Double Mountain-Shaped Obstacles at High-Reynolds Number
by Ivana Stiperski, Stefano Serafin, Alexandre Paci, Hálfdán Ágústsson, Anne Belleudy, Radiance Calmer, Kristian Horvath, Christoph Knigge, Johannes Sachsperger, Lukas Strauss and Vanda Grubišić
Atmosphere 2017, 8(1), 13; https://doi.org/10.3390/atmos8010013 - 13 Jan 2017
Cited by 8 | Viewed by 7712
Abstract
In this article, we present an overview of the HyIV-CNRS-SecORo (Hydralab IV-CNRS-Secondary Orography and Rotors Experiments) laboratory experiments carried out in the CNRM (Centre National de Recherches Météorologiques) large stratified water flume. The experiments were designed to systematically study the influence of double [...] Read more.
In this article, we present an overview of the HyIV-CNRS-SecORo (Hydralab IV-CNRS-Secondary Orography and Rotors Experiments) laboratory experiments carried out in the CNRM (Centre National de Recherches Météorologiques) large stratified water flume. The experiments were designed to systematically study the influence of double obstacles on stably stratified flow. The experimental set-up consists of a two-layer flow in the water tank, with a lower neutral and an upper stable layer separated by a sharp density discontinuity. This type of layering over terrain is known to be conducive to a variety of possible responses in the atmosphere, from hydraulic jumps to lee waves and highly turbulent rotors. In each experiment, obstacles were towed through the tank at a constant speed. The towing speed and the size of the tank allowed high Reynolds-number flow similar to the atmosphere. Here, we present the experimental design, together with an overview of laboratory experiments conducted and their results. We develop a regime diagram for flow over single and double obstacles and examine the parameter space where the secondary obstacle has the largest influence on the flow. Trapped lee waves, rotors, hydraulic jumps, lee-wave interference and flushing of the valley atmosphere are successfully reproduced in the stratified water tank. Obstacle height and ridge separation distance are shown to control lee-wave interference. Results, however, differ partially from previous findings on the flow over double ridges reported in the literature due to the presence of nonlinearities and possible differences in the boundary layer structure. The secondary obstacle also influences the transition between different flow regimes and makes trapped lee waves possible for higher Froude numbers than expected for an isolated obstacle. Full article
(This article belongs to the Special Issue Atmospheric Gravity Waves)
Show Figures

Figure 1

3260 KiB  
Article
Contemporary Temperature Fluctuation in Urban Areas of Pakistan
by Raheel Anjum, Xiubin He, Javed Iqbal Tanoli and Syed Turab Raza
Atmosphere 2017, 8(1), 12; https://doi.org/10.3390/atmos8010012 - 13 Jan 2017
Cited by 9 | Viewed by 6938
Abstract
Annual temperature data from thirty meteorological stations in Pakistan’s major urban areas were selected to investigate trends in annual average and maximum temperature during 1970–2009. A combination of parametric and non-parametric tests including linear regression, the Mann-Kendall trend test and Sen’s slope estimator [...] Read more.
Annual temperature data from thirty meteorological stations in Pakistan’s major urban areas were selected to investigate trends in annual average and maximum temperature during 1970–2009. A combination of parametric and non-parametric tests including linear regression, the Mann-Kendall trend test and Sen’s slope estimator was used for the analysis. Annual average and maximum temperature series showed an overall increasing trend for 90% of the stations and a decreasing trend for 10% of the stations in the study area. The highest significant increment of annual average temperature was observed at Gilgit, Hyderabad, Quetta and Lasbela stations at the rate of 0.49 °C per decade. The highest increment of annual maximum temperature was obtained at Chitral, Gilgit, Nawabshah and Quetta at the rate of 0.31 °C per decade. According to simple linear regression and the Mann-Kendall test, the annual average temperature showed a significant increasing trend for 43% of the stations (at a 0.001 level of significance) and 23% of the stations (at the 0.05 level). Annual maximum temperature showed a significant increasing trend for 26% of the stations (at the 0.001 level of significance) and 23% of the stations (at the 0.05 level). In general, the results showed increasing trends for the considered parameters, although annual average temperature showed a higher increasing rate than annual maximum temperature during the study period. Full article
Show Figures

Figure 1

2820 KiB  
Article
Ensemble Classification for Anomalous Propagation Echo Detection with Clustering-Based Subset-Selection Method
by Hansoo Lee and Sungshin Kim
Atmosphere 2017, 8(1), 11; https://doi.org/10.3390/atmos8010011 - 13 Jan 2017
Cited by 5 | Viewed by 4287
Abstract
Several types of non-precipitation echoes appear in radar images and disrupt the weather forecasting process. An anomalous propagation echo is an unwanted observation result similar to a precipitation echo. It occurs through radar-beam ducting because of the temperature, humidity distribution, and other complicated [...] Read more.
Several types of non-precipitation echoes appear in radar images and disrupt the weather forecasting process. An anomalous propagation echo is an unwanted observation result similar to a precipitation echo. It occurs through radar-beam ducting because of the temperature, humidity distribution, and other complicated atmospheric conditions. Anomalous propagation echoes should be removed because they make weather forecasting difficult. In this paper, we suggest an ensemble classification method based on an artificial neural network and a clustering-based subset-selection method. This method allows us to implement an efficient classification method when a feature space has complicated distributions. By separating the input data into atomic and non-atomic clusters, each derived cluster will receive its own base classifier. In the experiments, we compared our method with a standalone artificial neural network classifier. The suggested ensemble classifier showed 84.14% performance, which was about 2% higher than that of the k-means clustering-based ensemble classifier and about 4% higher than the standalone artificial neural network classifier. Full article
(This article belongs to the Special Issue Radar Meteorology)
Show Figures

Figure 1

3507 KiB  
Article
Predicting PM2.5 Concentrations at a Regional Background Station Using Second Order Self-Organizing Fuzzy Neural Network
by Junfei Qiao, Jie Cai, Honggui Han and Jianxian Cai
Atmosphere 2017, 8(1), 10; https://doi.org/10.3390/atmos8010010 - 12 Jan 2017
Cited by 18 | Viewed by 4168
Abstract
This study aims to develop a second order self-organizing fuzzy neural network (SOFNN) to predict the hourly concentrations of fine particulate matter (PM2.5) for the next 24 h at a regional background station called Shangdianzi (SDZ) in China from 14 to [...] Read more.
This study aims to develop a second order self-organizing fuzzy neural network (SOFNN) to predict the hourly concentrations of fine particulate matter (PM2.5) for the next 24 h at a regional background station called Shangdianzi (SDZ) in China from 14 to 23 January 2010. The structure of the SOFNN was automatically adjusted according to the sensitivity analysis (SA) of model output and the parameter-learning phase was performed applying a second order gradient (SOG) algorithm. Principal component analysis (PCA) was employed to select the dominating factors for PM2.5 concentrations as the input variables for the SOFNN. It was found that the dominating variables (relative humidity (RH), pressure (Pre), aerosol optical depth (AOD), wind speed (WS) and wind direction (WD)) extracted by PCA agreed well with the characteristics of PM2.5 at SDZ where the PM2.5 concentrations were heavily affected by meteorological parameters and were closely related to AOD. The forecasting results showed that the proposed SOG-SASOFNN performed better than other models with higher coefficient of determination (R2) during both training phase and test phase (0.89 and 0.84, respectively) in predicting PM2.5 concentrations at SDZ. In conclusion, the developed SOG-SASOFNN provided satisfying results for modeling the hourly distribution of PM2.5 at SDZ during the studied period. Full article
Show Figures

Figure 1

6751 KiB  
Article
Properties of the Long-Term Oscillations in the Middle Atmosphere Based on Observations from TIMED/SABER Instrument and FPI over Kelan
by Yiyao Zhang, Zheng Sheng, Hanqing Shi, Shudao Zhou, Weilai Shi, Huadong Du and Zhiqiang Fan
Atmosphere 2017, 8(1), 7; https://doi.org/10.3390/atmos8010007 - 11 Jan 2017
Cited by 14 | Viewed by 4476
Abstract
The properties of the long-term oscillations in the middle atmosphere have been investigated using the Sounding of the Atmosphere using Broadband Emission Radiometry (SABER) temperature data and Fabry–Perot interferometer (FPI) data. Results for SABER temperature show that the semiannual oscillation (SAO) has three [...] Read more.
The properties of the long-term oscillations in the middle atmosphere have been investigated using the Sounding of the Atmosphere using Broadband Emission Radiometry (SABER) temperature data and Fabry–Perot interferometer (FPI) data. Results for SABER temperature show that the semiannual oscillation (SAO) has three amplitude maxima at altitudes of 45, 75, and 85 km, respectively, and shows prominent seasonal asymmetries there. The SAOs in the upper mesosphere (75 km) are out of phase with those in the mesopause (85 km) in the tropical regions, which can generate an enhancement of 11 K on average at each equinox, contributing to the lower mesospheric inversion layer (MIL). It is shown that stronger enhancement can be found at the spring equinox than at the autumn equinox. The triennial oscillation (TO) is significant in the tropical region. The spectral peak of the TO is probably a sub-peak of the quasi-biennial oscillation (QBO) and is due to modulation of QBO. In addition, there may be potential interaction of the TO with SAO at 85 km at the equator. The relation between ENSO and TO has also been discussed. The ENSO signal may modulate the amplitude of the TO, mainly in the lower stratosphere. The annual oscillation (AO) and SAO are analyzed over Kelan by FPI data. Generally, the amplitudes of FPI wind are smaller than those of the Horizontal Wind Model (HWM07). The comparison between FPI and TIMED Doppler Interferometer (TIDI) winds shows relatively large discrepancy. This may be due to the tidal aliasing in the nighttime results derived from the FPI data. Results also show that the algorithm to derive FPI temperature needs improvements. Full article
Show Figures

Figure 1

209 KiB  
Editorial
Acknowledgement to Reviewers of Atmosphere in 2016
by Atmosphere Editorial Office
Atmosphere 2017, 8(1), 8; https://doi.org/10.3390/atmos8010008 - 10 Jan 2017
Viewed by 3159
Abstract
The editors of Atmosphere would like to express their sincere gratitude to the following reviewers for assessing manuscripts in 2016.[...] Full article
6383 KiB  
Article
A Geostatistics-Based Method to Determine the Pixel Distance in a Structure Function Model for Aerosol Optical Depth Inversion
by Guanhua Zhou, Yue Zhang, Zhongqi Ma, Wujian Xu, Kai Zhang, Junhui Liu and Yumin Tan
Atmosphere 2017, 8(1), 6; https://doi.org/10.3390/atmos8010006 - 10 Jan 2017
Cited by 9 | Viewed by 4254
Abstract
Inversion of aerosol optical depth (AOD) over bright land surface by optical remote sensing is particularly challenging because surface reflectance dominates the satellite signal. A structure function method is suitable and can effectively solve aerosol optical depth inversion in high reflectance areas. How [...] Read more.
Inversion of aerosol optical depth (AOD) over bright land surface by optical remote sensing is particularly challenging because surface reflectance dominates the satellite signal. A structure function method is suitable and can effectively solve aerosol optical depth inversion in high reflectance areas. How to select d (the pixel distance between two pixels) value is one of the key problems with the structure function method. We present a method based on geostatistics, where variogram theory is referenced, to determine the pixel distance in structure function model for aerosol optical depth inversion. This method was validated by the Moderate Resolution Imaging Spectroradiometer (MODIS) 1 km resolution level 1B data from Beijing, China. The results indicate that the relationship between variogram and d in four different directions can be fitted by exponential function, of which correlation coefficients are all above 0.9. Compared with the MODIS aerosol product (MOD 04 product), the inversion AOD has higher accuracy, with an absolute error of −0.00187 instead of −0.00854 and a relative error of 0.99% instead of 4.35%, based on AERosol RObotic NETwork (AERONET) observations. For validation, we applied this new method separately to both Beijing–Tianjin–Hebei region and MODIS 500 m resolution images for region and resolution validation. The results show that inversion AOD has higher accuracy and more efficient pixels. Full article
Show Figures

Figure 1

1722 KiB  
Article
Diagnosing Lee Wave Rotor Onset Using a Linear Model Including a Boundary Layer
by Miguel A. C. Teixeira
Atmosphere 2017, 8(1), 5; https://doi.org/10.3390/atmos8010005 - 07 Jan 2017
Cited by 6 | Viewed by 4473 | Correction
Abstract
A linear model is used to diagnose the onset of rotors in flow over 2D hills, for atmospheres that are neutrally stratified near the surface and stably stratified aloft, with a sharp temperature inversion in between, where trapped lee waves may propagate. This [...] Read more.
A linear model is used to diagnose the onset of rotors in flow over 2D hills, for atmospheres that are neutrally stratified near the surface and stably stratified aloft, with a sharp temperature inversion in between, where trapped lee waves may propagate. This is achieved by coupling an inviscid two-layer mountain-wave model and a bulk boundary-layer model. The full model shows some ability to diagnose flow stagnation associated with rotors as a function of key input parameters, such as the Froude number and the height of the inversion, in numerical simulations and laboratory experiments carried out by previous authors. While calculations including only the effects of mean flow attenuation and velocity perturbation amplification within the surface layer represent flow stagnation fairly well in the more non-hydrostatic cases, only the full model, taking into account the feedback of the surface layer on the inviscid flow, satisfactorily predicts flow stagnation in the most hydrostatic case, although the corresponding condition is unable to discriminate between rotors and hydraulic jumps. Versions of the model not including this feedback severely underestimate the amplitude of trapped lee waves in that case, where the Fourier transform of the hill has zeros, showing that those waves are not forced directly by the orography. Full article
(This article belongs to the Special Issue Atmospheric Gravity Waves)
Show Figures

Figure 1

2584 KiB  
Article
Characterization of Positive Cloud to Ground Flashes Observed in Indonesia
by Ariadi Hazmi, Primas Emeraldi, Muhammad Imran Hamid, Nobuyuki Takagi and Daohong Wang
Atmosphere 2017, 8(1), 4; https://doi.org/10.3390/atmos8010004 - 05 Jan 2017
Cited by 13 | Viewed by 4292
Abstract
The characteristics of 77 electric field changes of positive cloud to ground (CG) flashes in the tropics of Indonesia were investigated. It was found that the arithmetic mean (AM) and geometric mean (GM) values for 0%–100% and 10%–90% rise time were 12.7 μs, [...] Read more.
The characteristics of 77 electric field changes of positive cloud to ground (CG) flashes in the tropics of Indonesia were investigated. It was found that the arithmetic mean (AM) and geometric mean (GM) values for 0%–100% and 10%–90% rise time were 12.7 μs, 11.9 μs and 6.1 μs, 5.8 μs, respectively. The percentages of single, double, and triple strokes of lightning flashes were 83% (64 cases), 16% (12 cases), and 1% (1 case), respectively. The AM and GM of the interstroke intervals and the return stroke (RS) amplitude ratios were 163.9 ms, 0.29, and 13.3 ms, 0.26, respectively. Furthermore, it was also found that 7 (9%) of 77 positive CG flashes had double peak return stroke waveforms with AM and GM values for 0%–100% and 10%–90% rise time of subsequent return strokes that were 6.7 μs, 6.4 μs and 4.1 μs, 4 μs, respectively. We inferred that these double peaks are produced by two ground terminations with a time interval varying from 7 to 560 μs. Full article
Show Figures

Figure 1

1698 KiB  
Article
Deposition of PM2.5 Sulfate in the Spring on Urban Forests in Beijing, China
by Lu Zhao, Xiaoxiu Lun, Renna Li, Yingying Cao, Fengbin Sun and Xinxiao Yu
Atmosphere 2017, 8(1), 3; https://doi.org/10.3390/atmos8010003 - 05 Jan 2017
Cited by 7 | Viewed by 4266
Abstract
Water-soluble ions such as sulfate may have great impacts on atmospheric pollution. To determine the deposition effect of PM2.5 sulfates, the major PM2.5 constituents, in the forest canopy in Beijing, China, an investigation was carried out in an urban forest, Olympic [...] Read more.
Water-soluble ions such as sulfate may have great impacts on atmospheric pollution. To determine the deposition effect of PM2.5 sulfates, the major PM2.5 constituents, in the forest canopy in Beijing, China, an investigation was carried out in an urban forest, Olympic Forest Park, and a suburban forest, Jiufeng National Forest Park. We measured the vertical distributions of sulfate by using monitoring towers in the two forests at the same times in March and May 2013. Sulfate (SO42−) was predominant in all PM2.5 water-soluble inorganic ions, with a proportion >40%. The vertical concentration of SO42− increased with height, and the average sulfate concentration in Olympic Forest Park was higher than that in Jiufeng National Forest Park. Results also revealed that meteorological conditions had significant impacts on both the sulfate concentration and the deposition velocity. In winter, the deposition of SO42− through the canopy was not obvious in the two forest parks, which was quite the opposite in spring. The deposition velocity in the daytime was higher than that in the nighttime in both Olympic Forest Park (0.9 ± 1.0 cm/s vs. 0.4 ± 0.3 cm/s) and Jiufeng National Forest Park (1.3 ± 1.2 cm/s vs. 0.8 ± 0.8 cm/s). While Jiufeng National Forest Park turned out to have a higher average sulfate deposition velocity than Olympic Forest Park. Full article
Show Figures

Figure 1

2540 KiB  
Article
Assessing Upper Tropospheric Jet Streak Proximity Using the Rossby Radius of Deformation
by Joshua S. Kastman, Patrick S. Market, Scott M. Rochette and Anthony R. Lupo
Atmosphere 2017, 8(1), 2; https://doi.org/10.3390/atmos8010002 - 29 Dec 2016
Cited by 3 | Viewed by 4141
Abstract
The Rossby radius of deformation is a parameter that describes the relative role of buoyant and inertial forces for atmospheric phenomena in a flow regime. It will be demonstrated that it can also be used to determine whether or not forcing for vertical [...] Read more.
The Rossby radius of deformation is a parameter that describes the relative role of buoyant and inertial forces for atmospheric phenomena in a flow regime. It will be demonstrated that it can also be used to determine whether or not forcing for vertical motions in the region between upper level tropospheric jet streaks overlaps or interacts. Using predefined points in the entrance and exit regions of neighboring upper level jet streaks, the distance between them is calculated for each event. If they are closer than twice the Rossby radius of deformation, the resulting region affected by both streaks is termed the Rossby Radius of Deformation Overlap Zone (RRDOZ). Plan-view and cross-sectional analysis shows that ageostrophic transverse circulations within the RRDOZ led to enhanced upward vertical velocities as predicted in prior research. Lastly, a short-term climatology for overlap events in North America is derived, and these are classified according to three proposed archetypes. Full article
Show Figures

Figure 1

3244 KiB  
Article
Land Use Regression Modeling of PM2.5 Concentrations at Optimized Spatial Scales
by Liang Zhai, Bin Zou, Xin Fang, Yanqing Luo, Neng Wan and Shuang Li
Atmosphere 2017, 8(1), 1; https://doi.org/10.3390/atmos8010001 - 23 Dec 2016
Cited by 34 | Viewed by 6829
Abstract
Though land use regression (LUR) models have been widely utilized to simulate air pollution distribution, unclear spatial scale effects of contributing characteristic variables usually make results study-specific. In this study, LUR models for PM2.5 in Houston Metropolitan Area, US were developed under [...] Read more.
Though land use regression (LUR) models have been widely utilized to simulate air pollution distribution, unclear spatial scale effects of contributing characteristic variables usually make results study-specific. In this study, LUR models for PM2.5 in Houston Metropolitan Area, US were developed under scales of 100 m, 300 m, 500 m, 800 m, and 1000–5000 m with intervals of 500 m by employing the idea of statistically optimized analysis. Results show that the annual average PM2.5 concentration in Houston was significantly influenced by area ratios of open space urban and medium intensity urban at a 100 m scale, as well as of high intensity urban at a 500 m scale, whose correlation coefficients valued −0.64, 0.72, and 0.56, respectively. The fitting degree of LUR model at the optimized spatial scale (adj. R2 = 0.78) is obviously better than those at any other unified spatial scales (adj. R2 ranging from 0.19 to 0.65). Differences of PM2.5 concentrations produced by LUR models with best-, moderate-, weakest fitting degree, as well as ordinary kriging were evident, while the LUR model achieved the best cross-validation accuracy at the optimized spatial scale. Results suggested that statistical based optimized spatial scales of characteristic variables might possibly ensure the performance of LUR models in mapping PM2.5 distribution. Full article
(This article belongs to the Special Issue Urban Air Pollution)
Show Figures

Figure 1

Previous Issue
Next Issue
Back to TopTop