
Interactions between Climate, Land Use and Vegetation Fire Occurrences in El Salvador

 , , ,
, , ,
Abstract
:1. Introduction
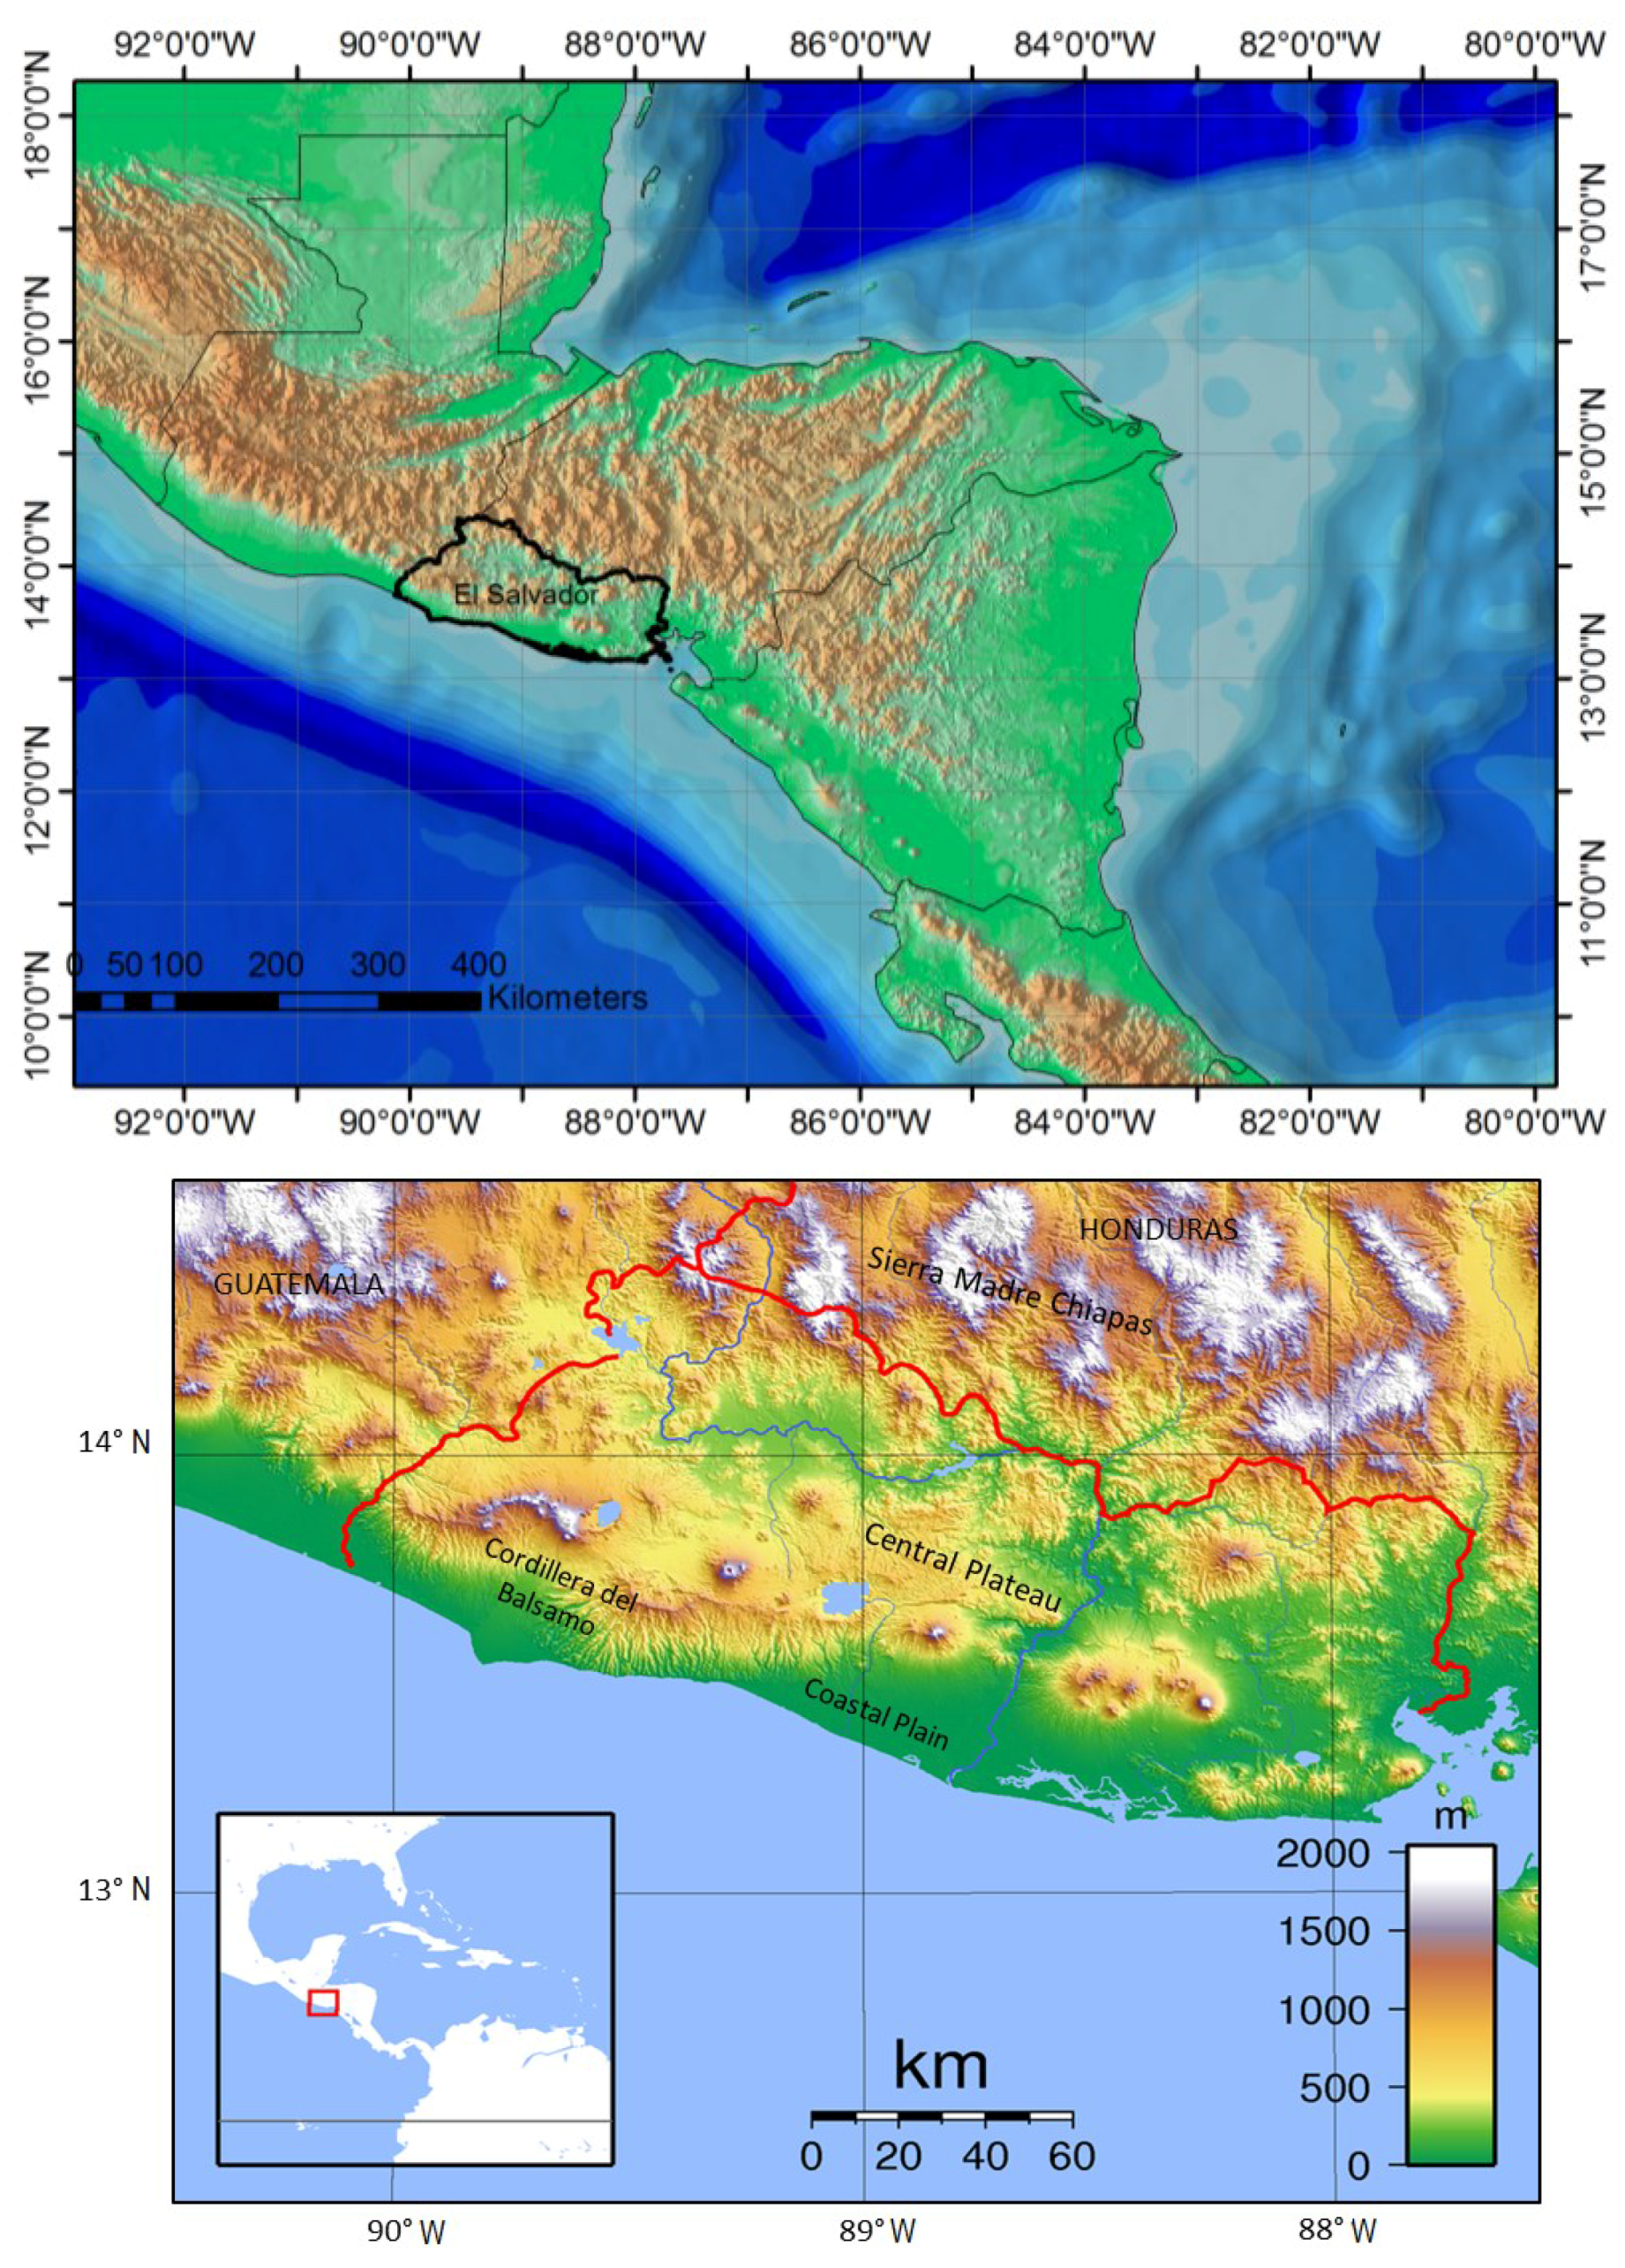
2. Study Area

3. Methods
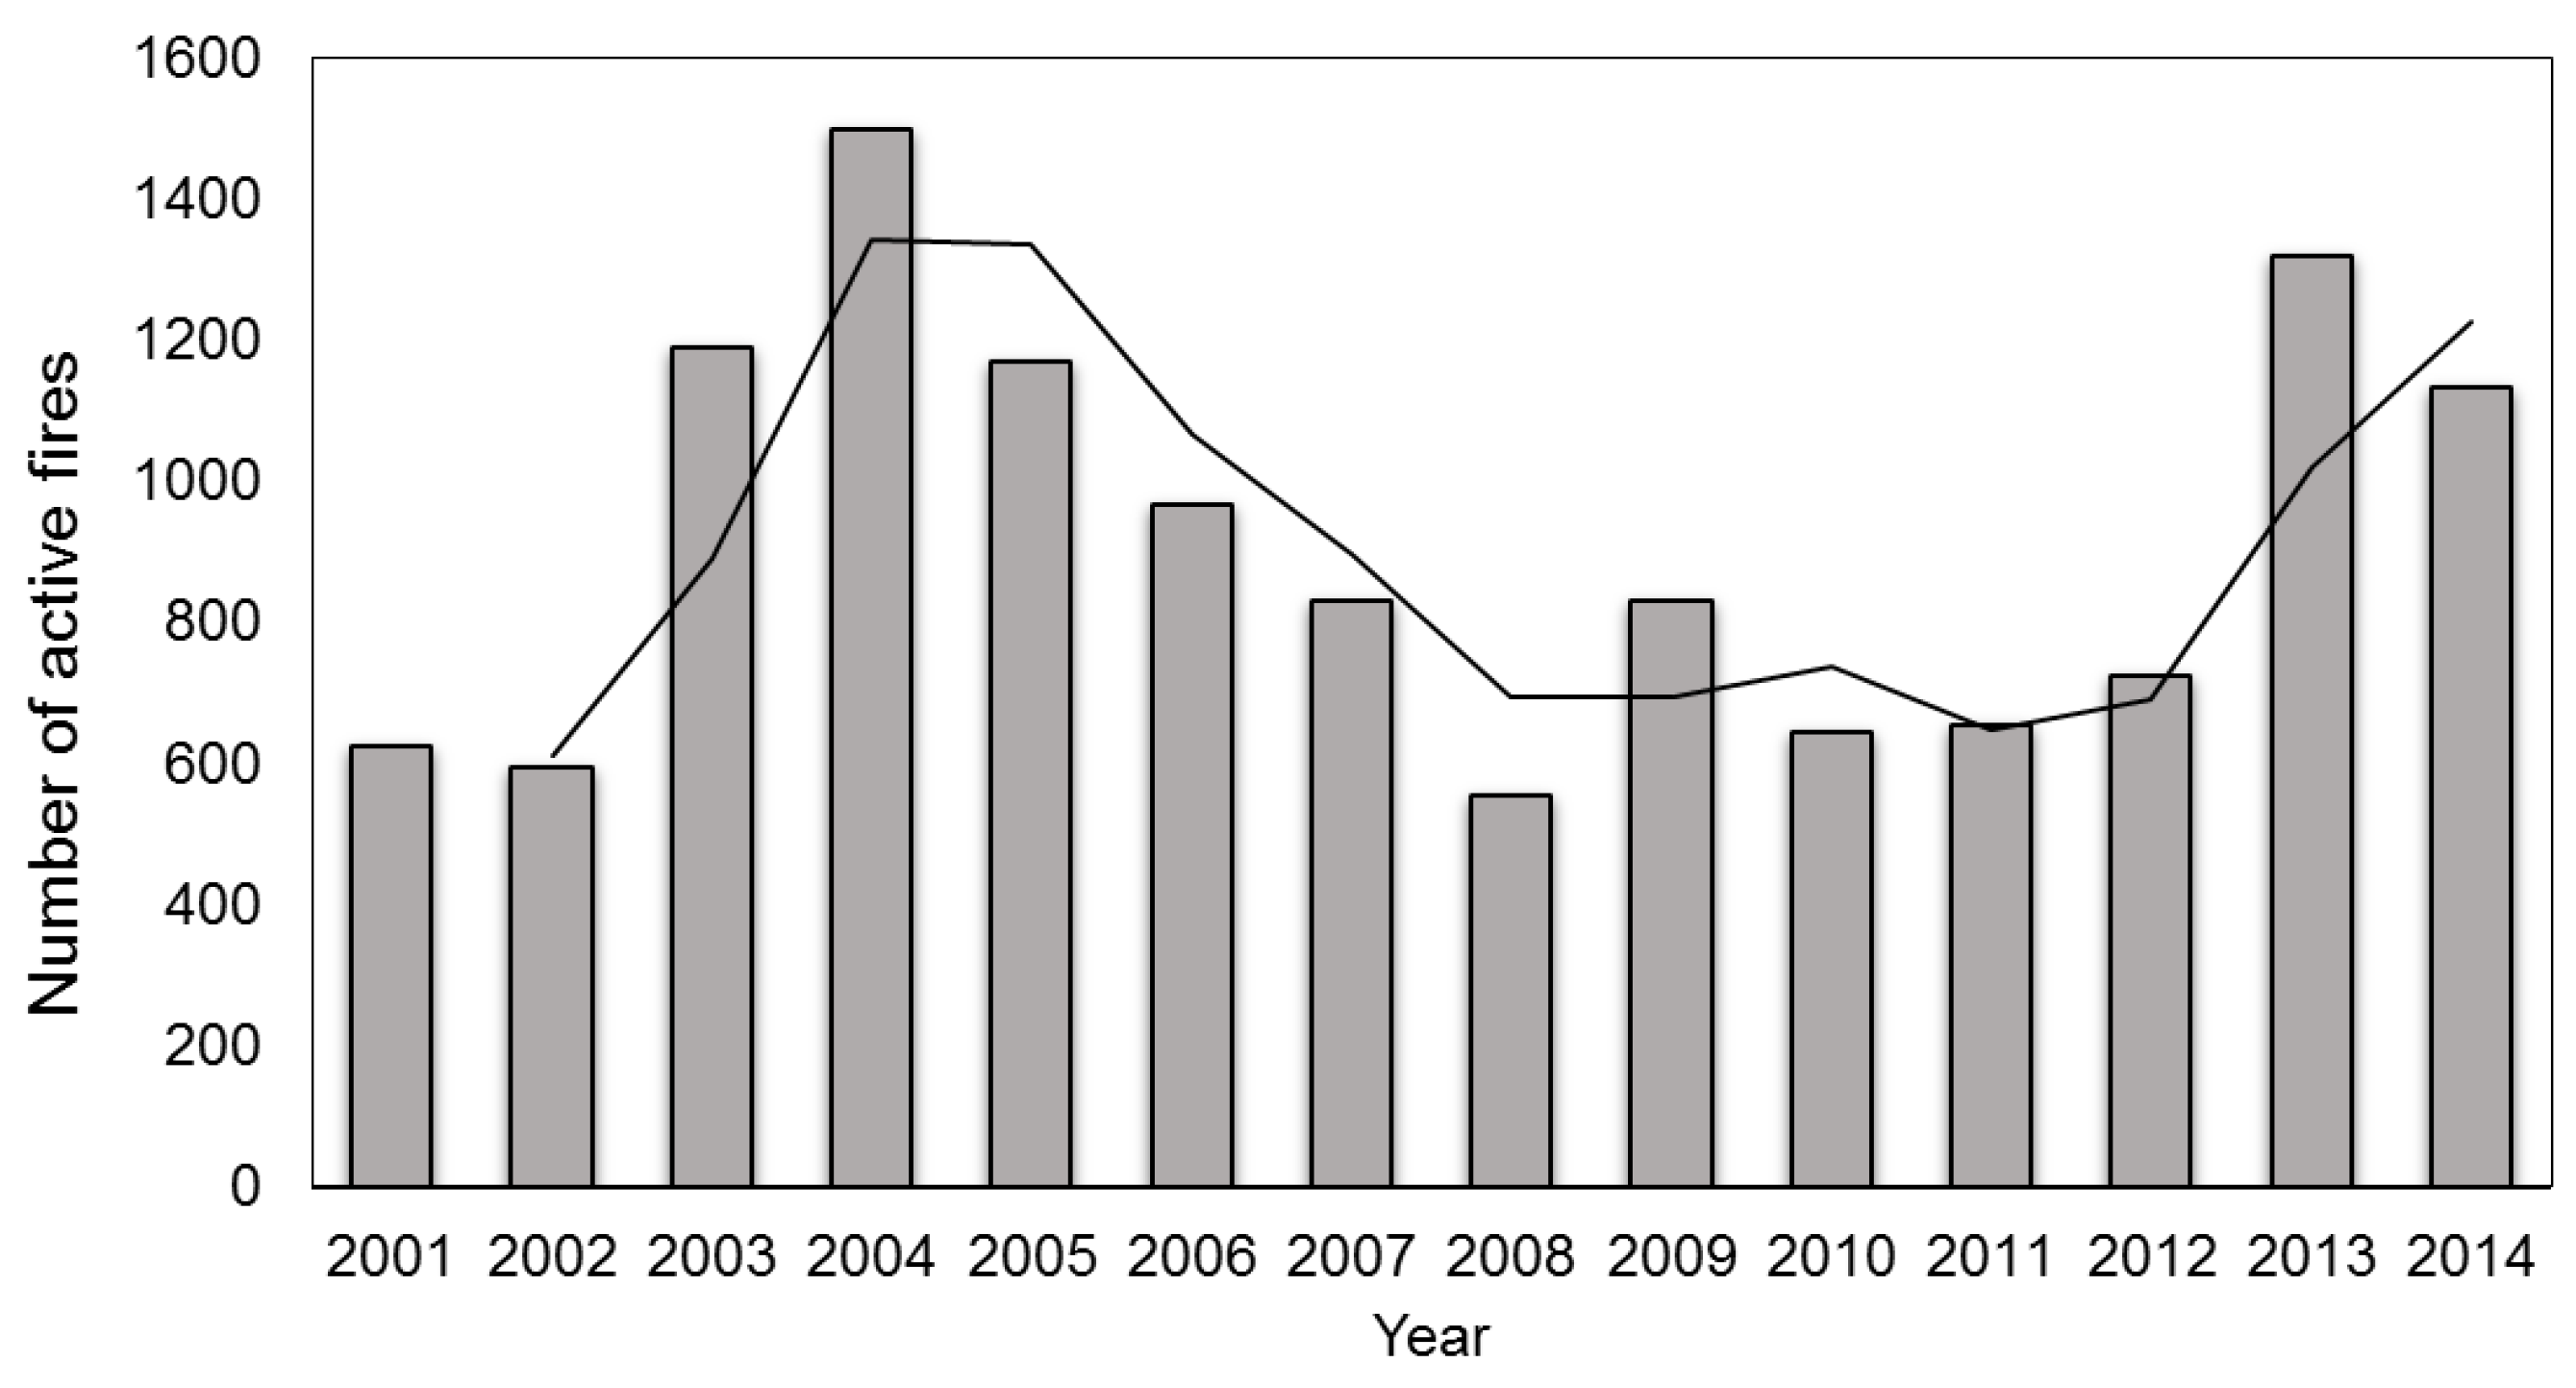
3.1. Active Fire Data
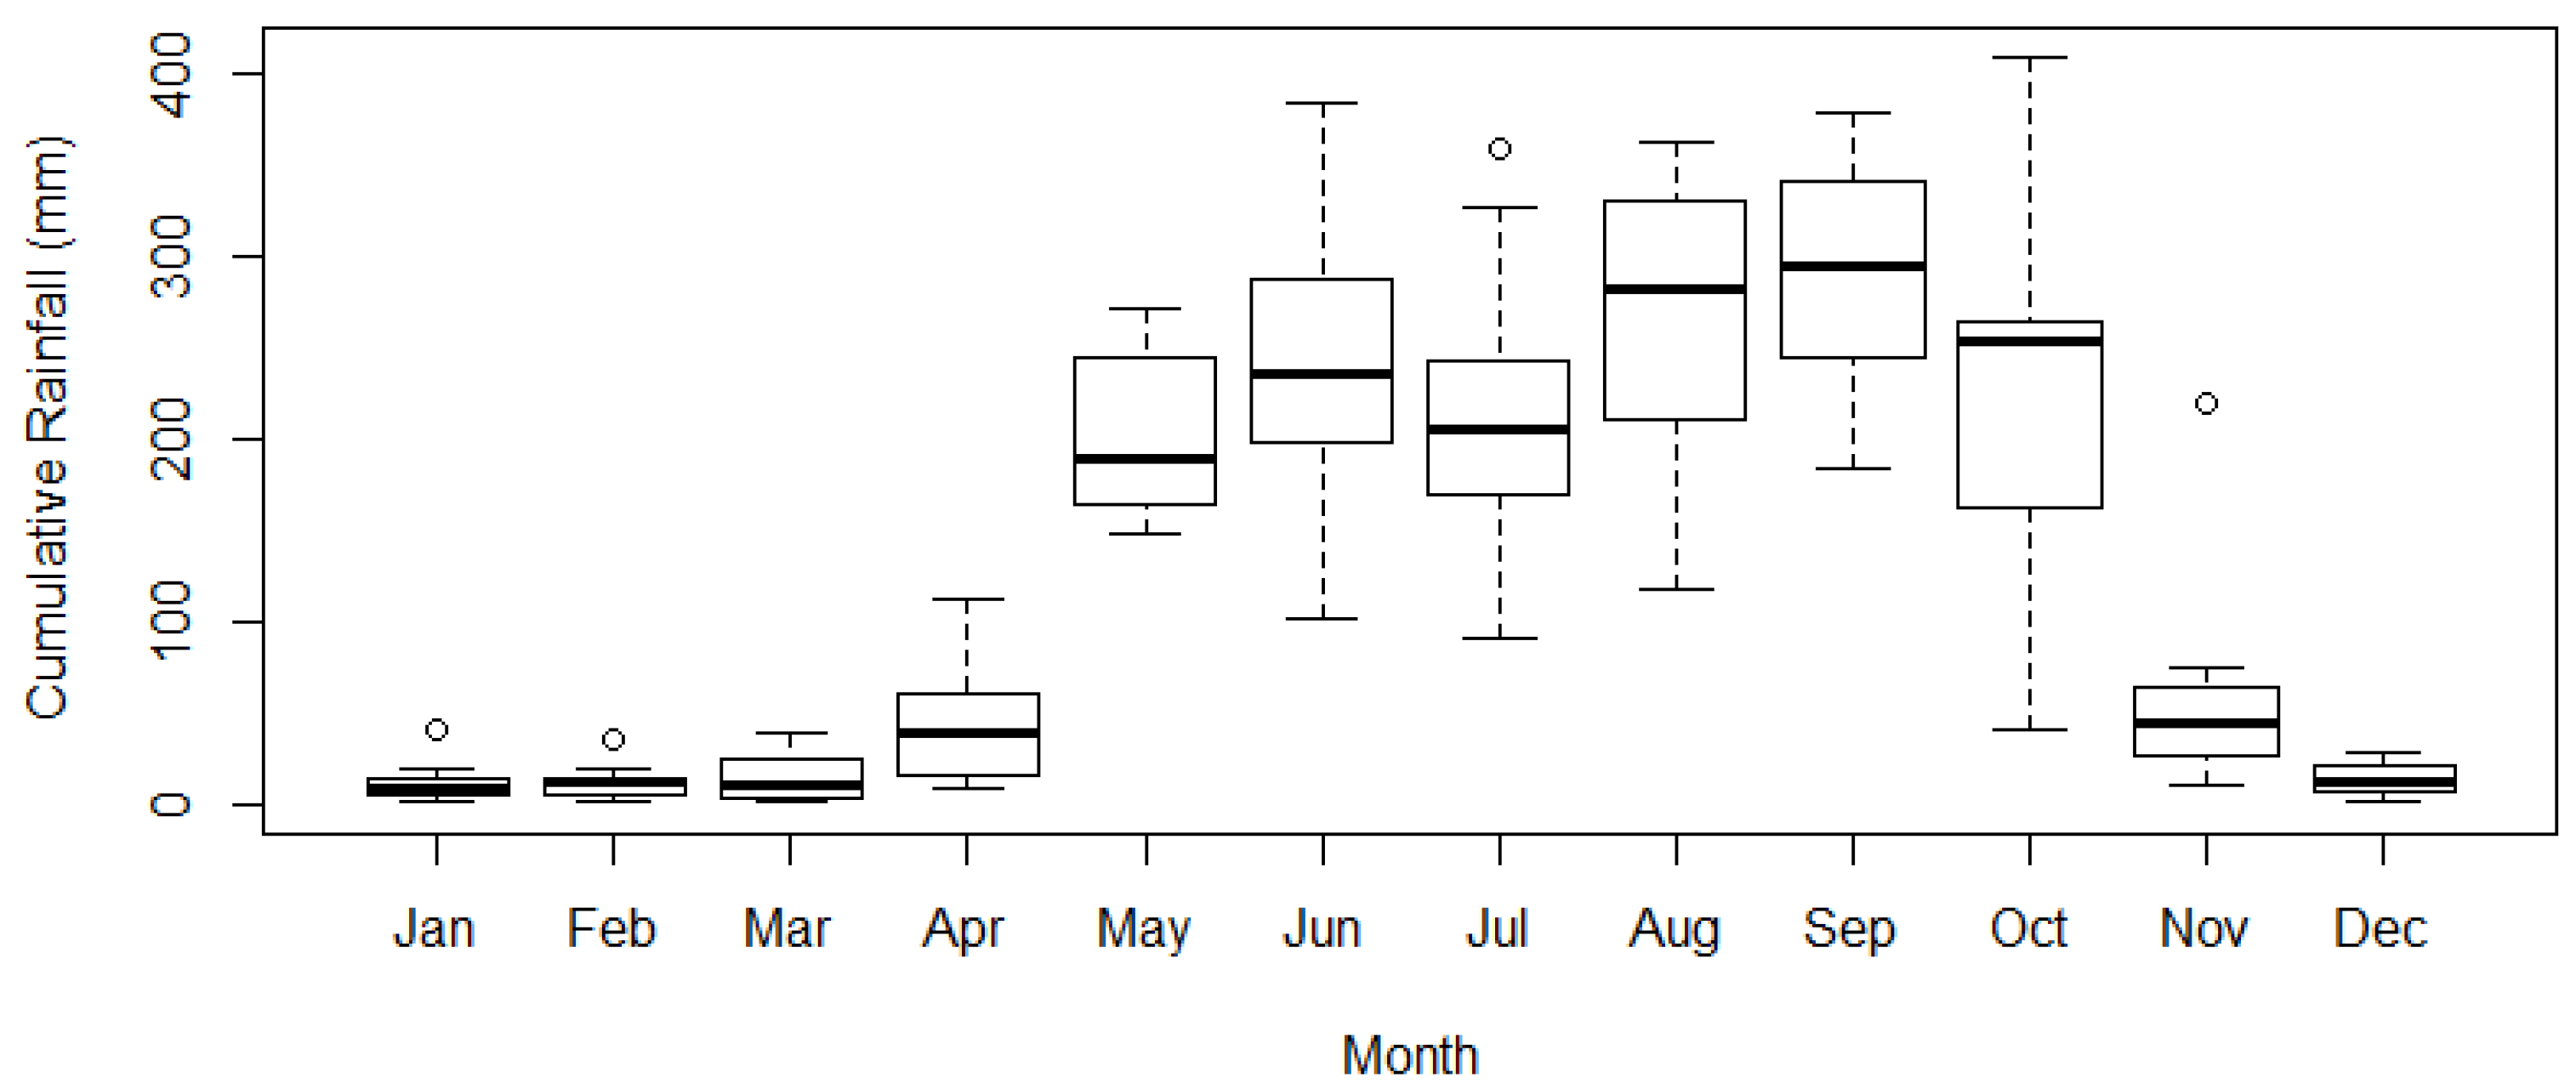
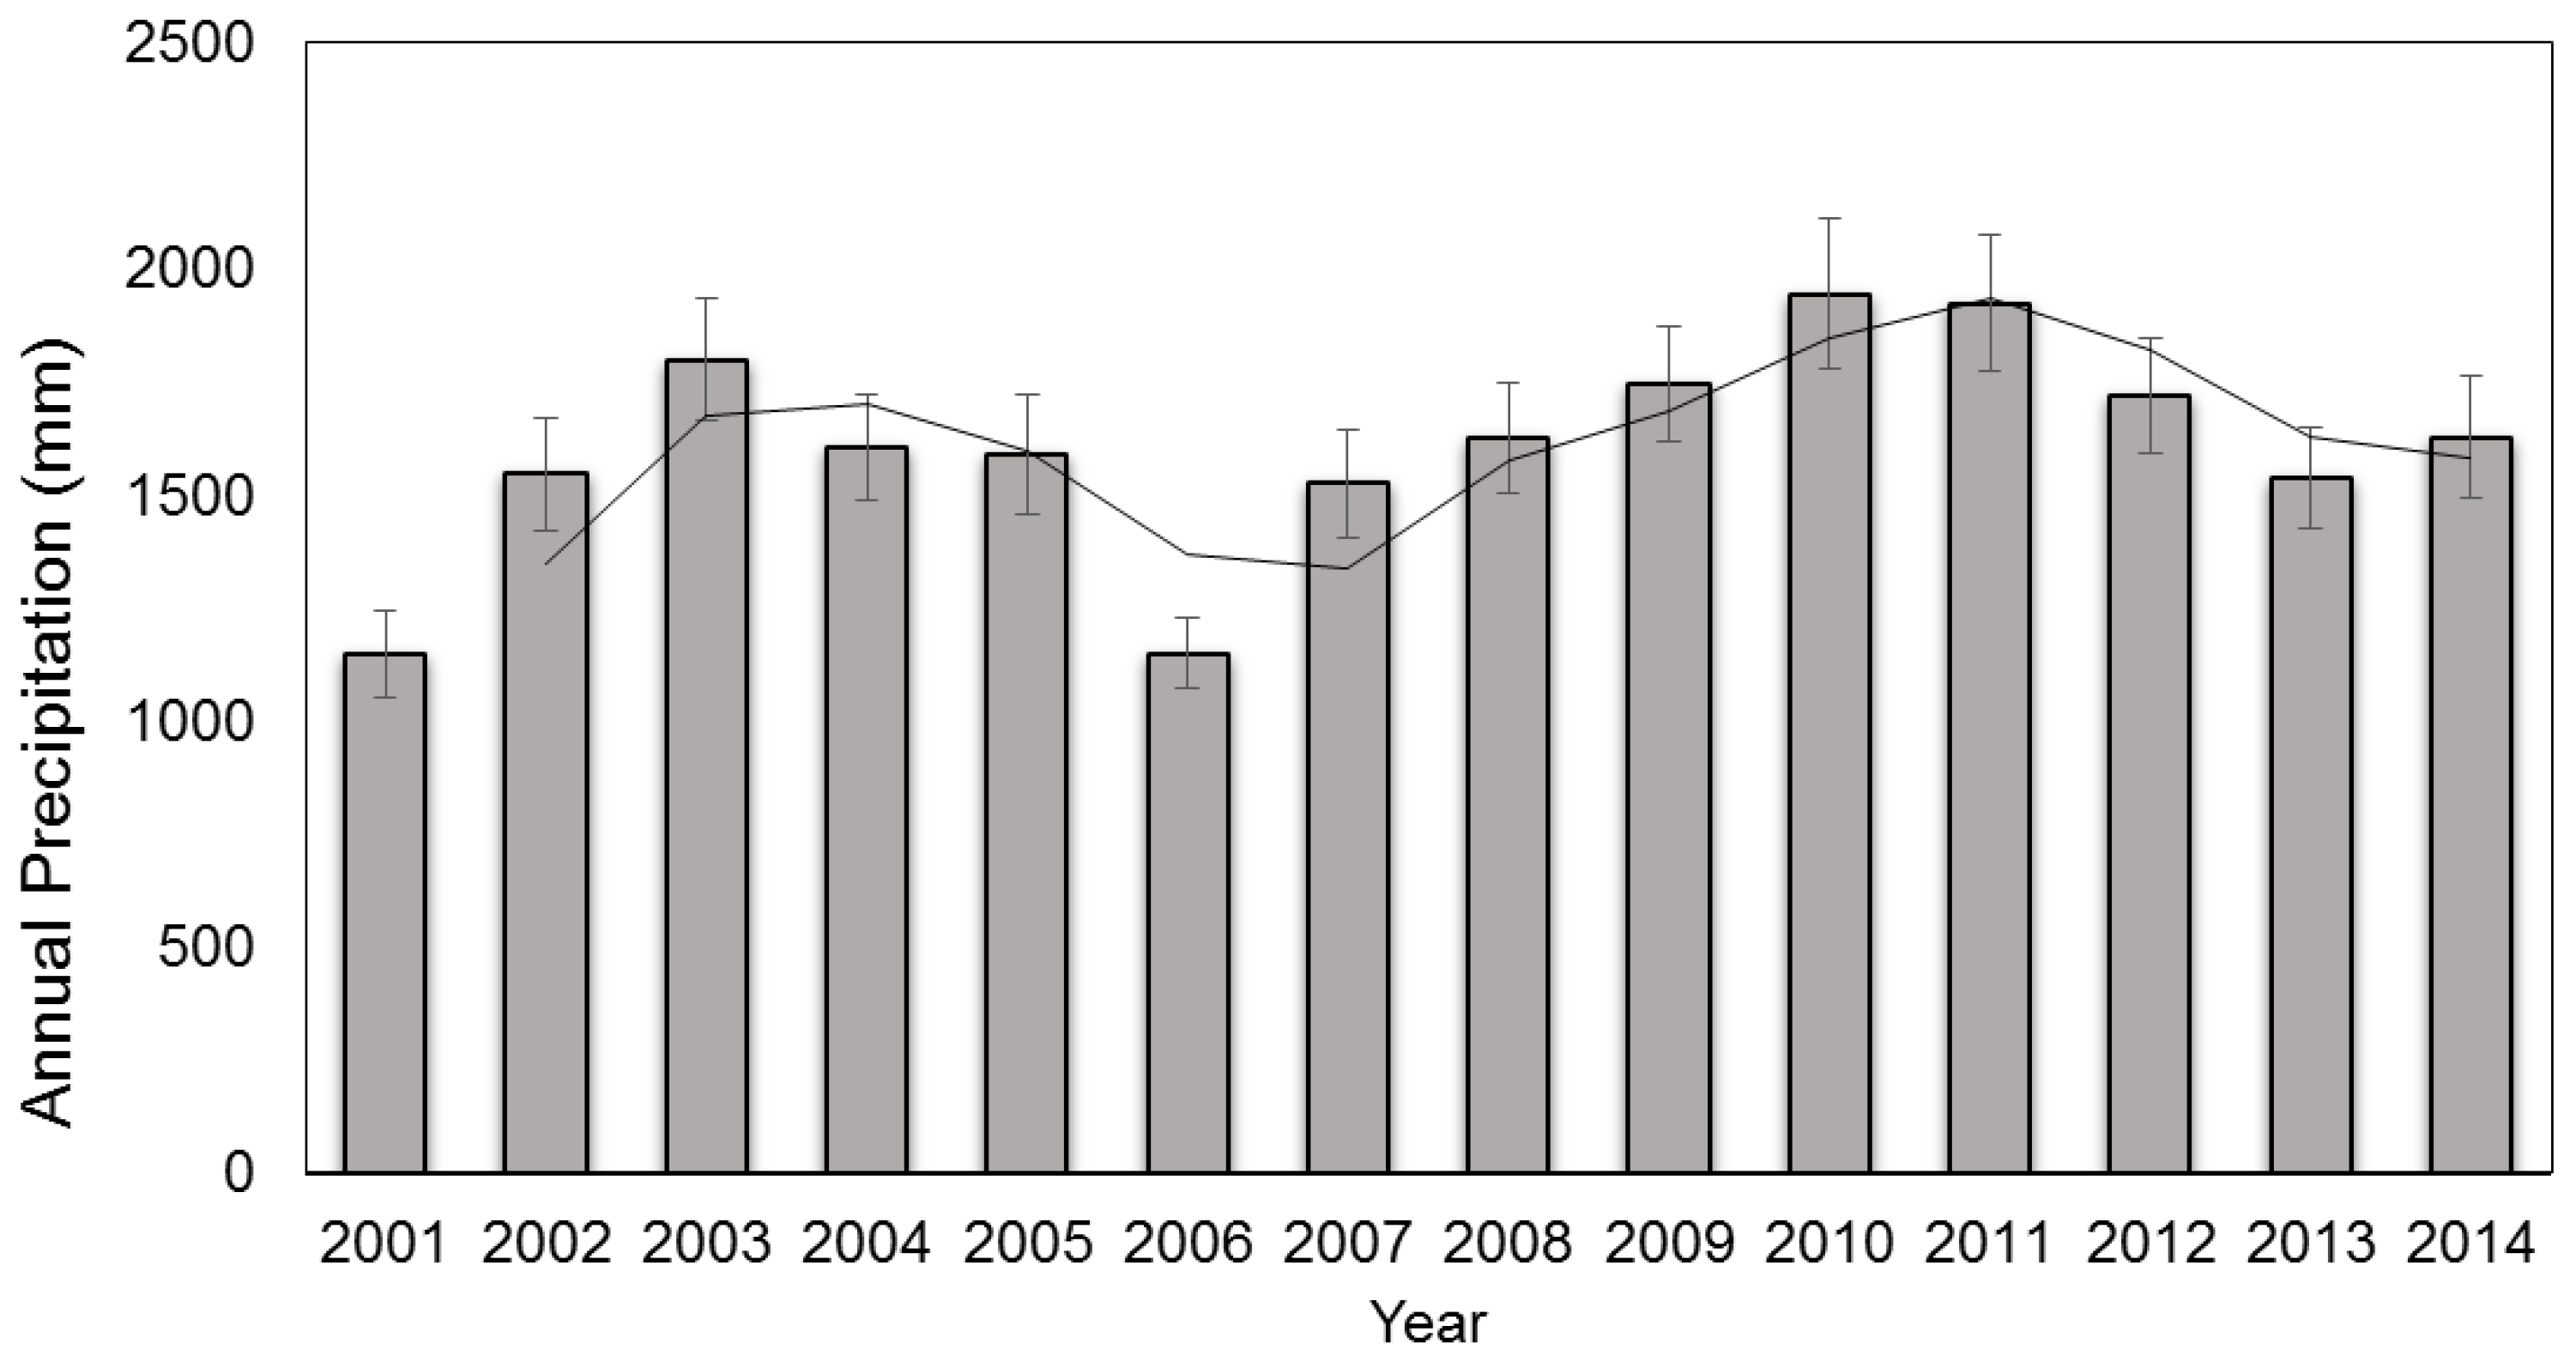
3.2. Rainfall Data and Standardized Rainfall Anomalies
3.3. Vegetation and Land Use Data
3.4. Analysis
4. Results
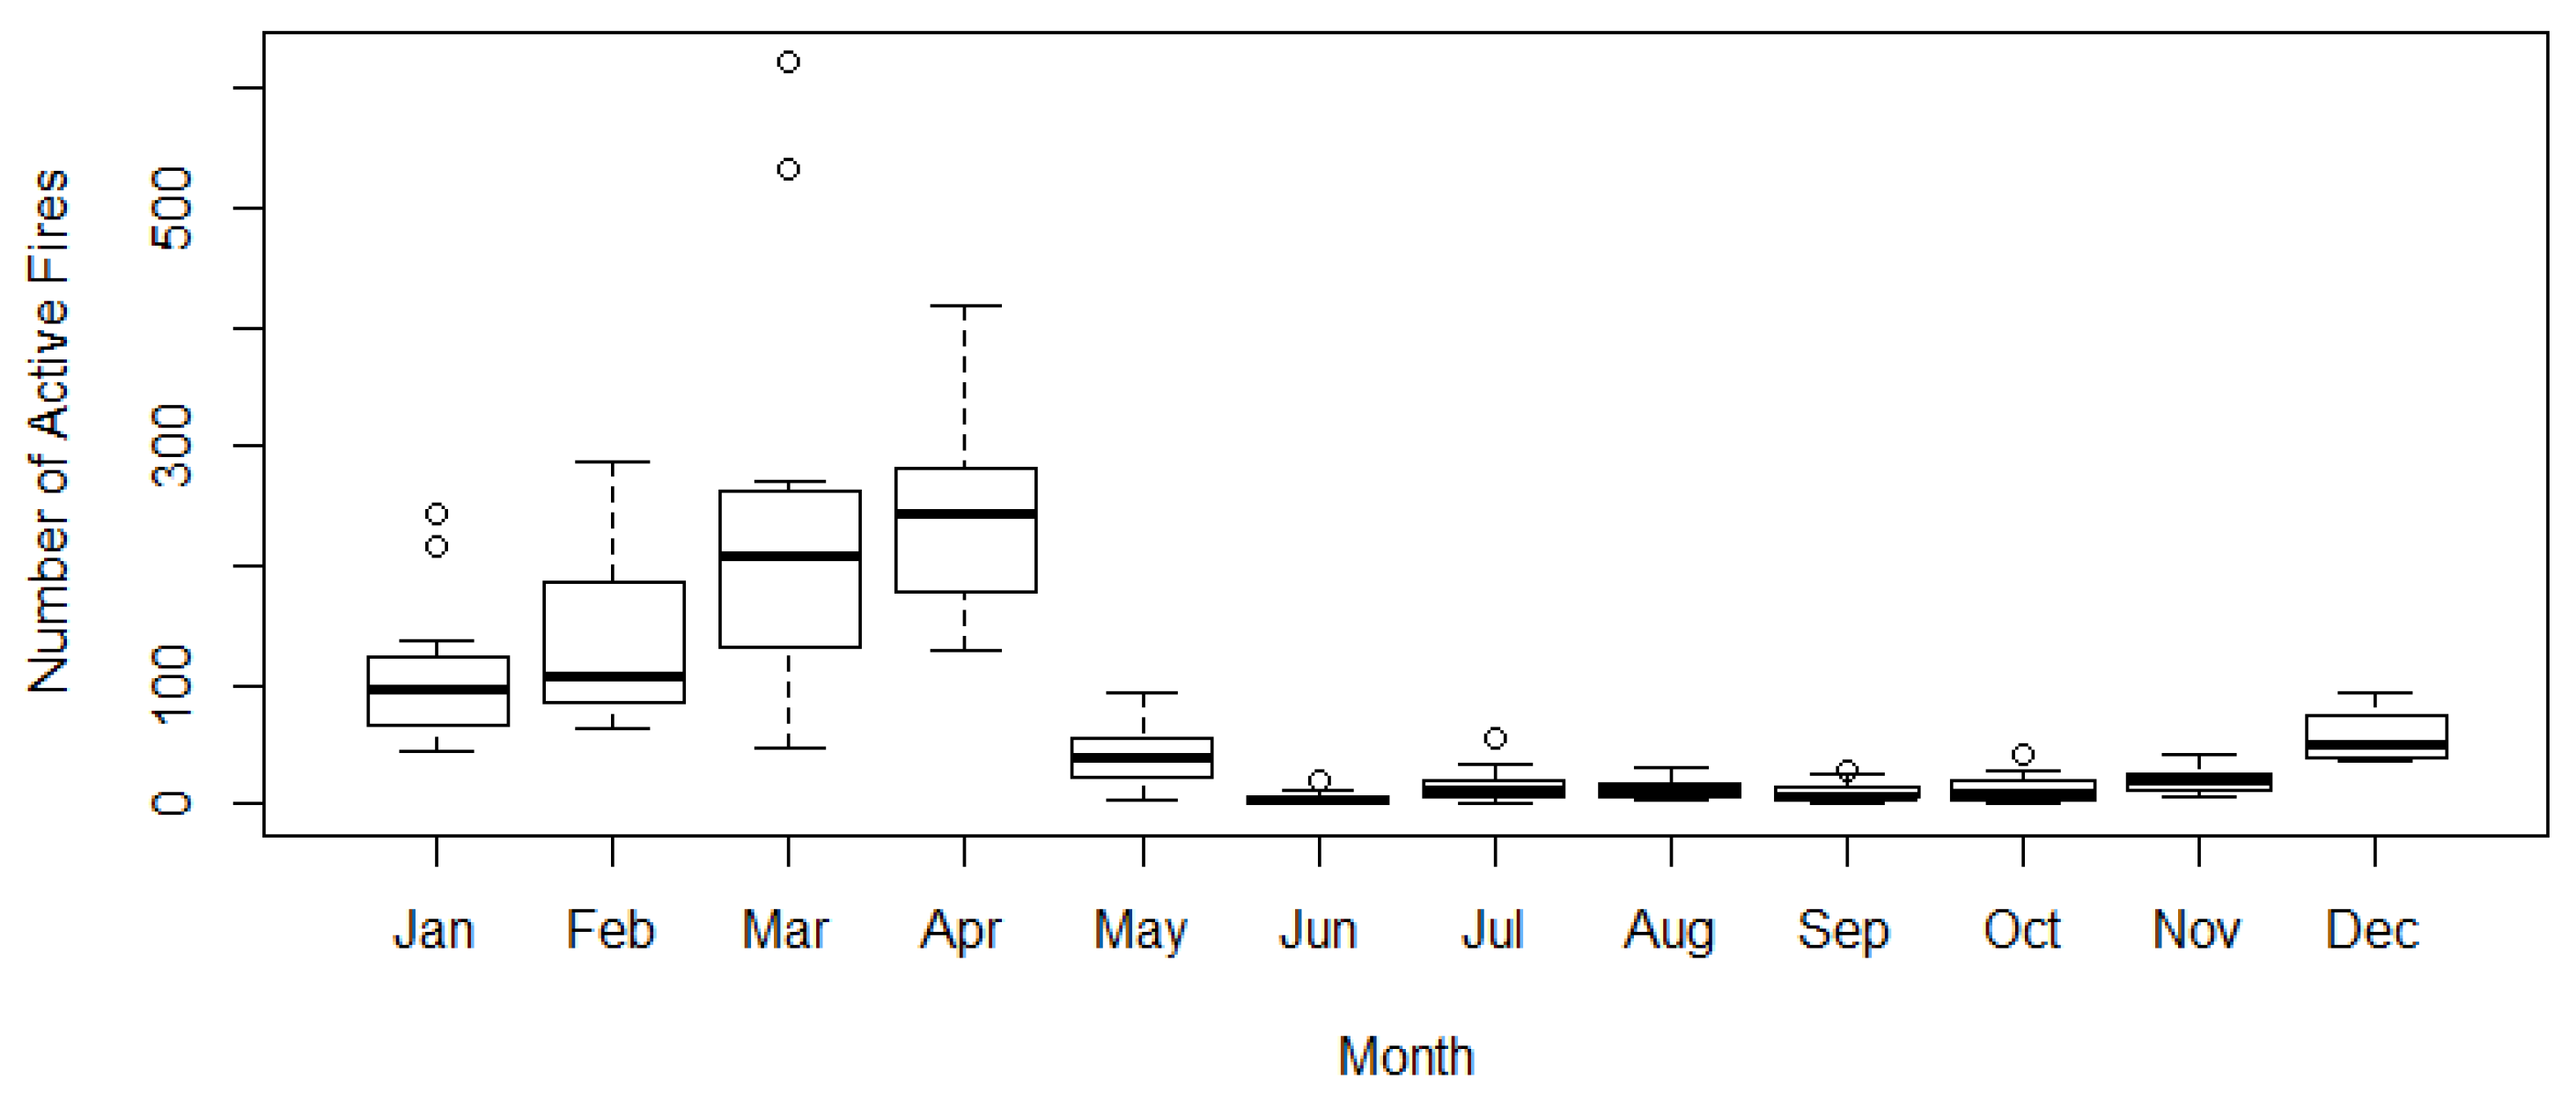
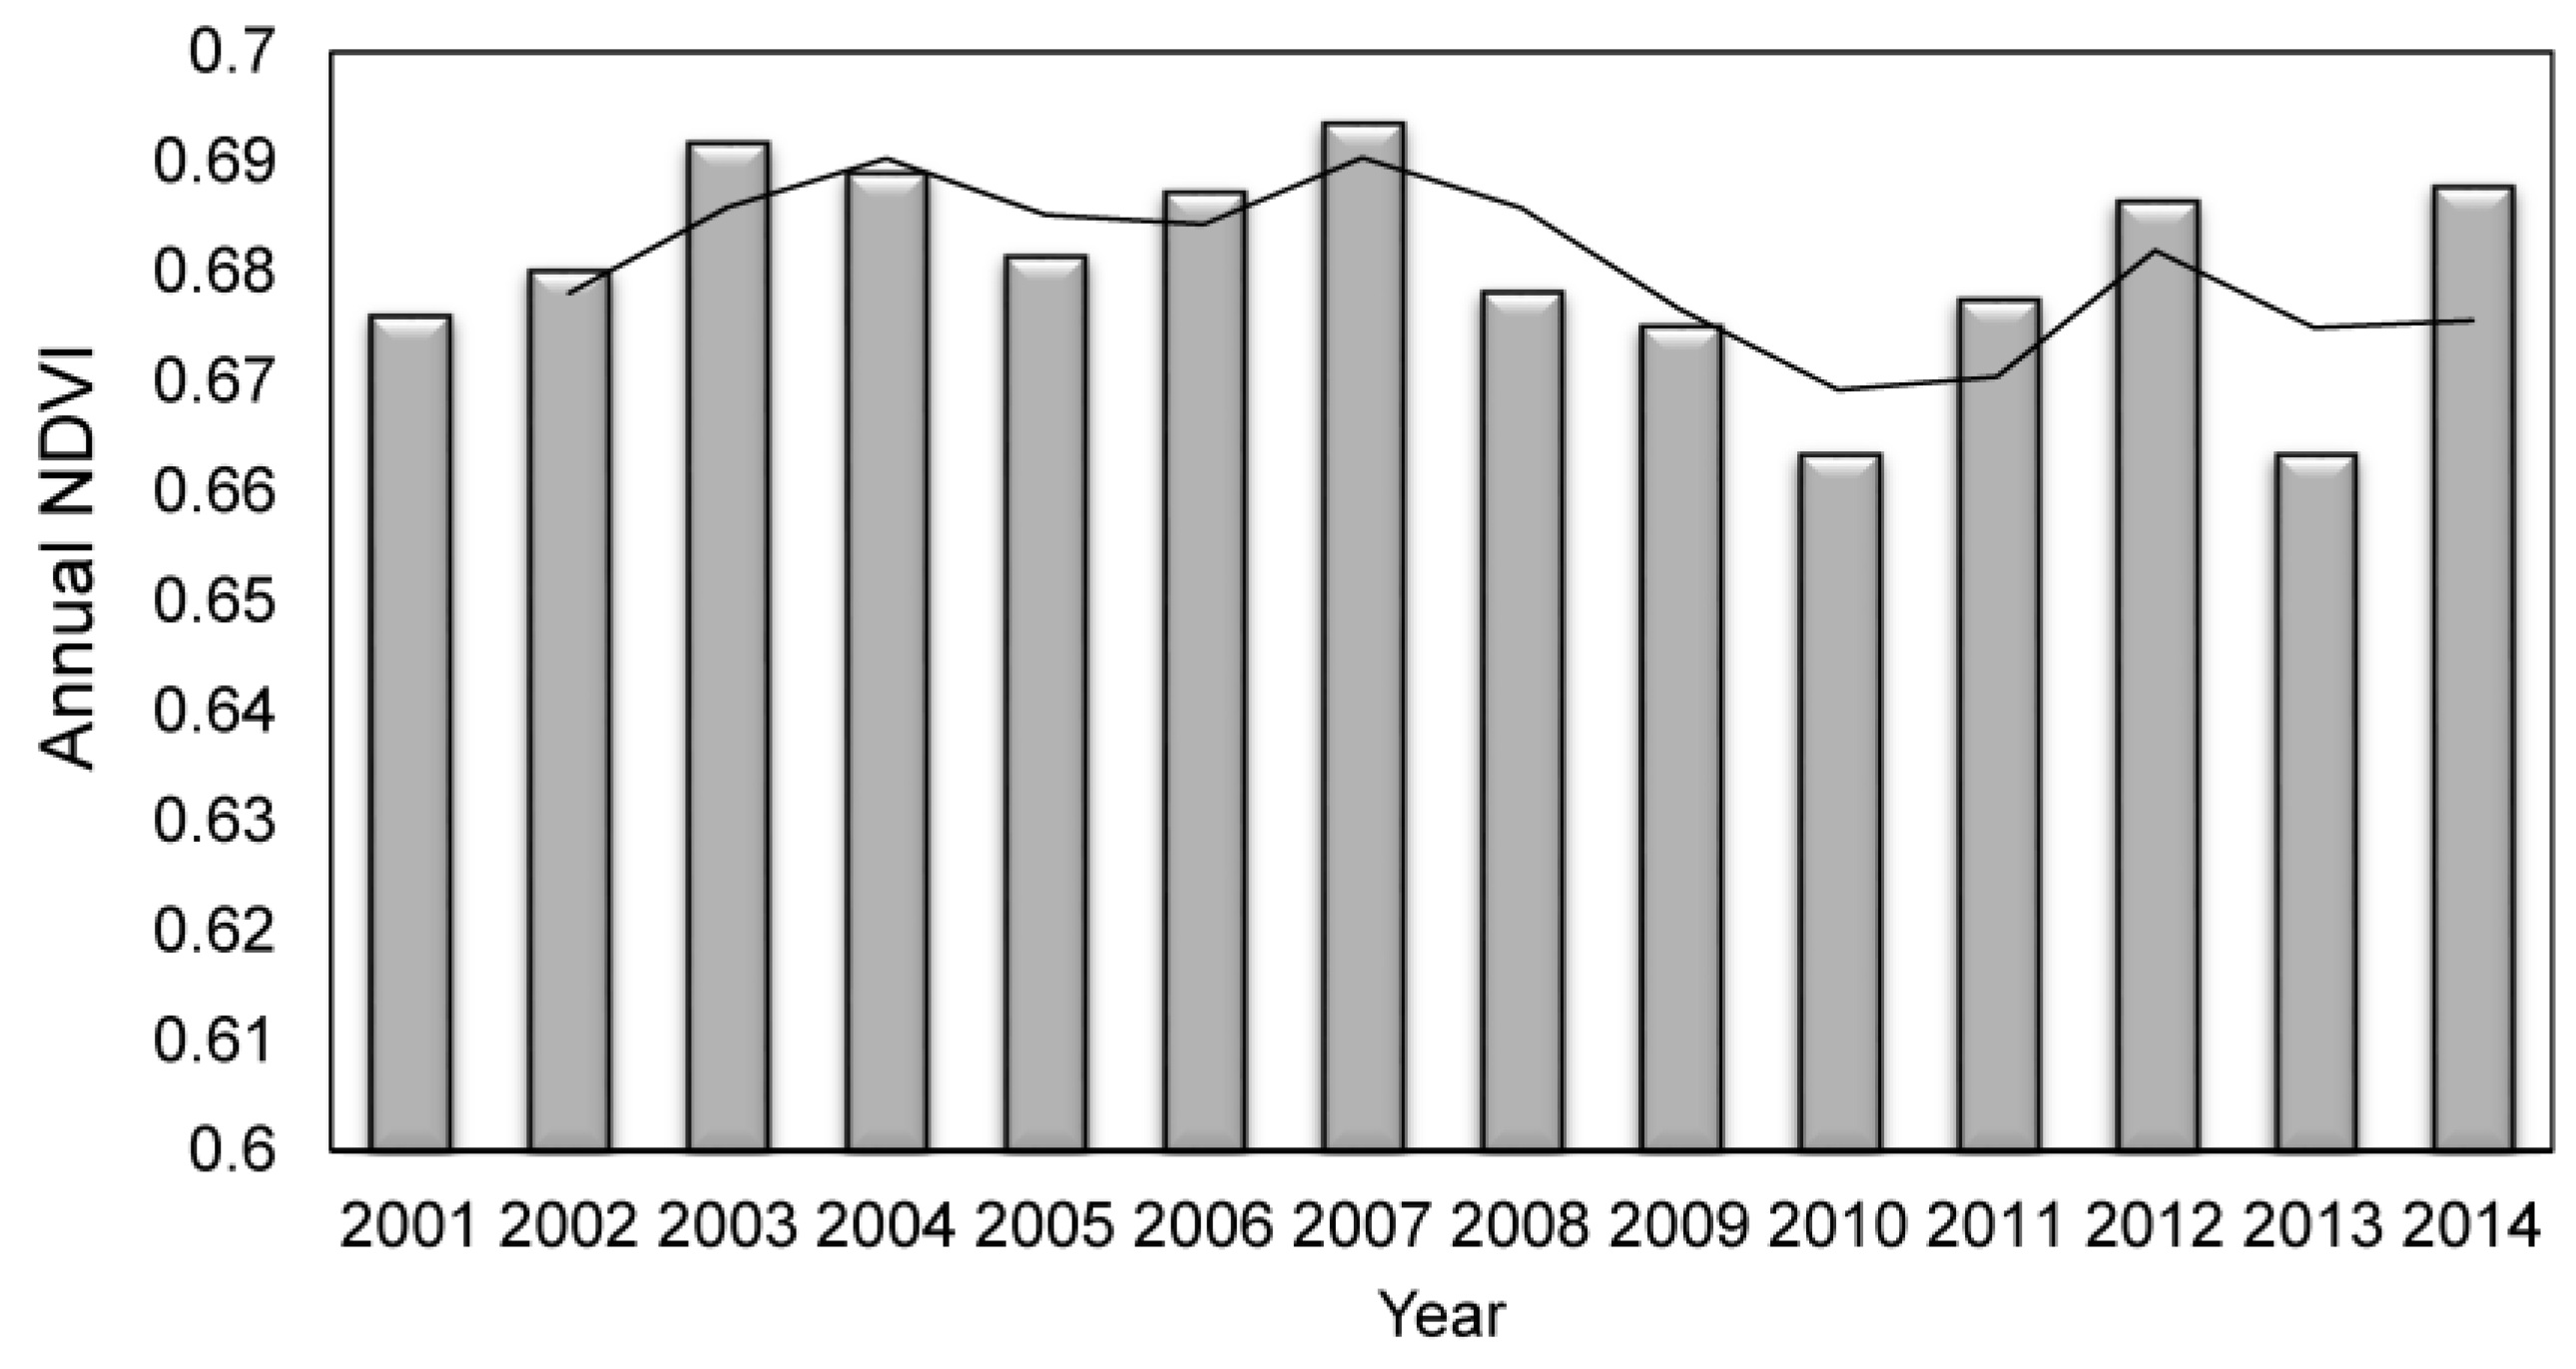
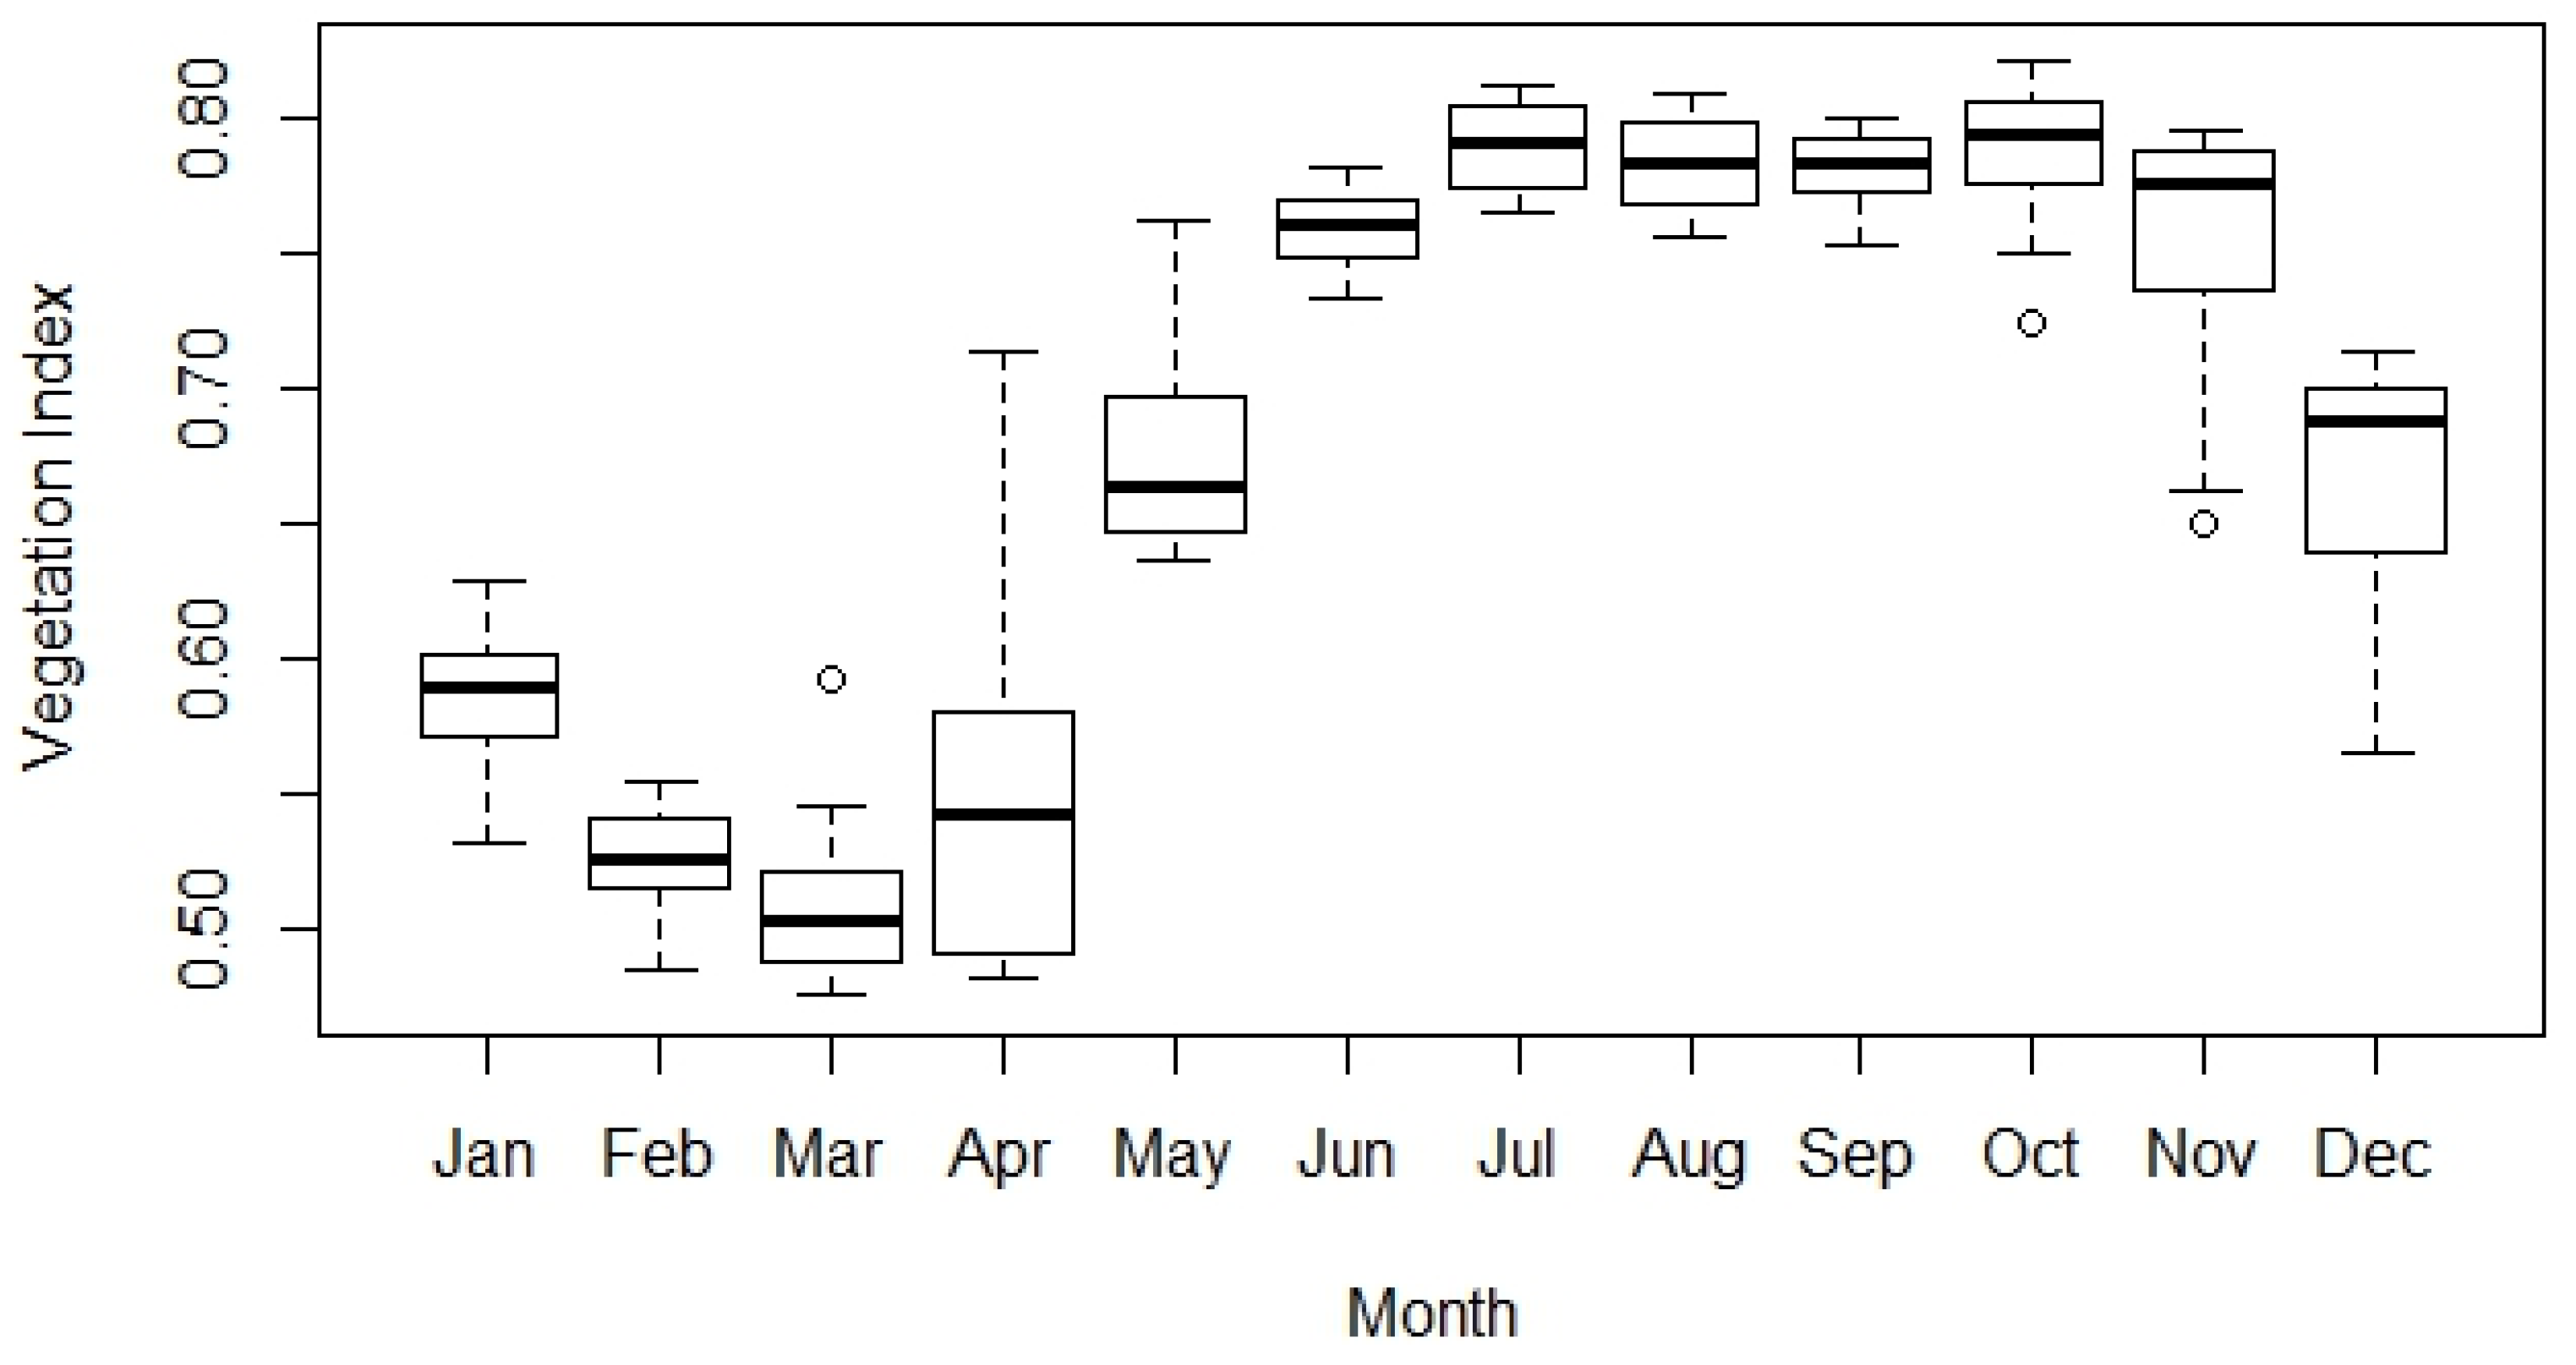
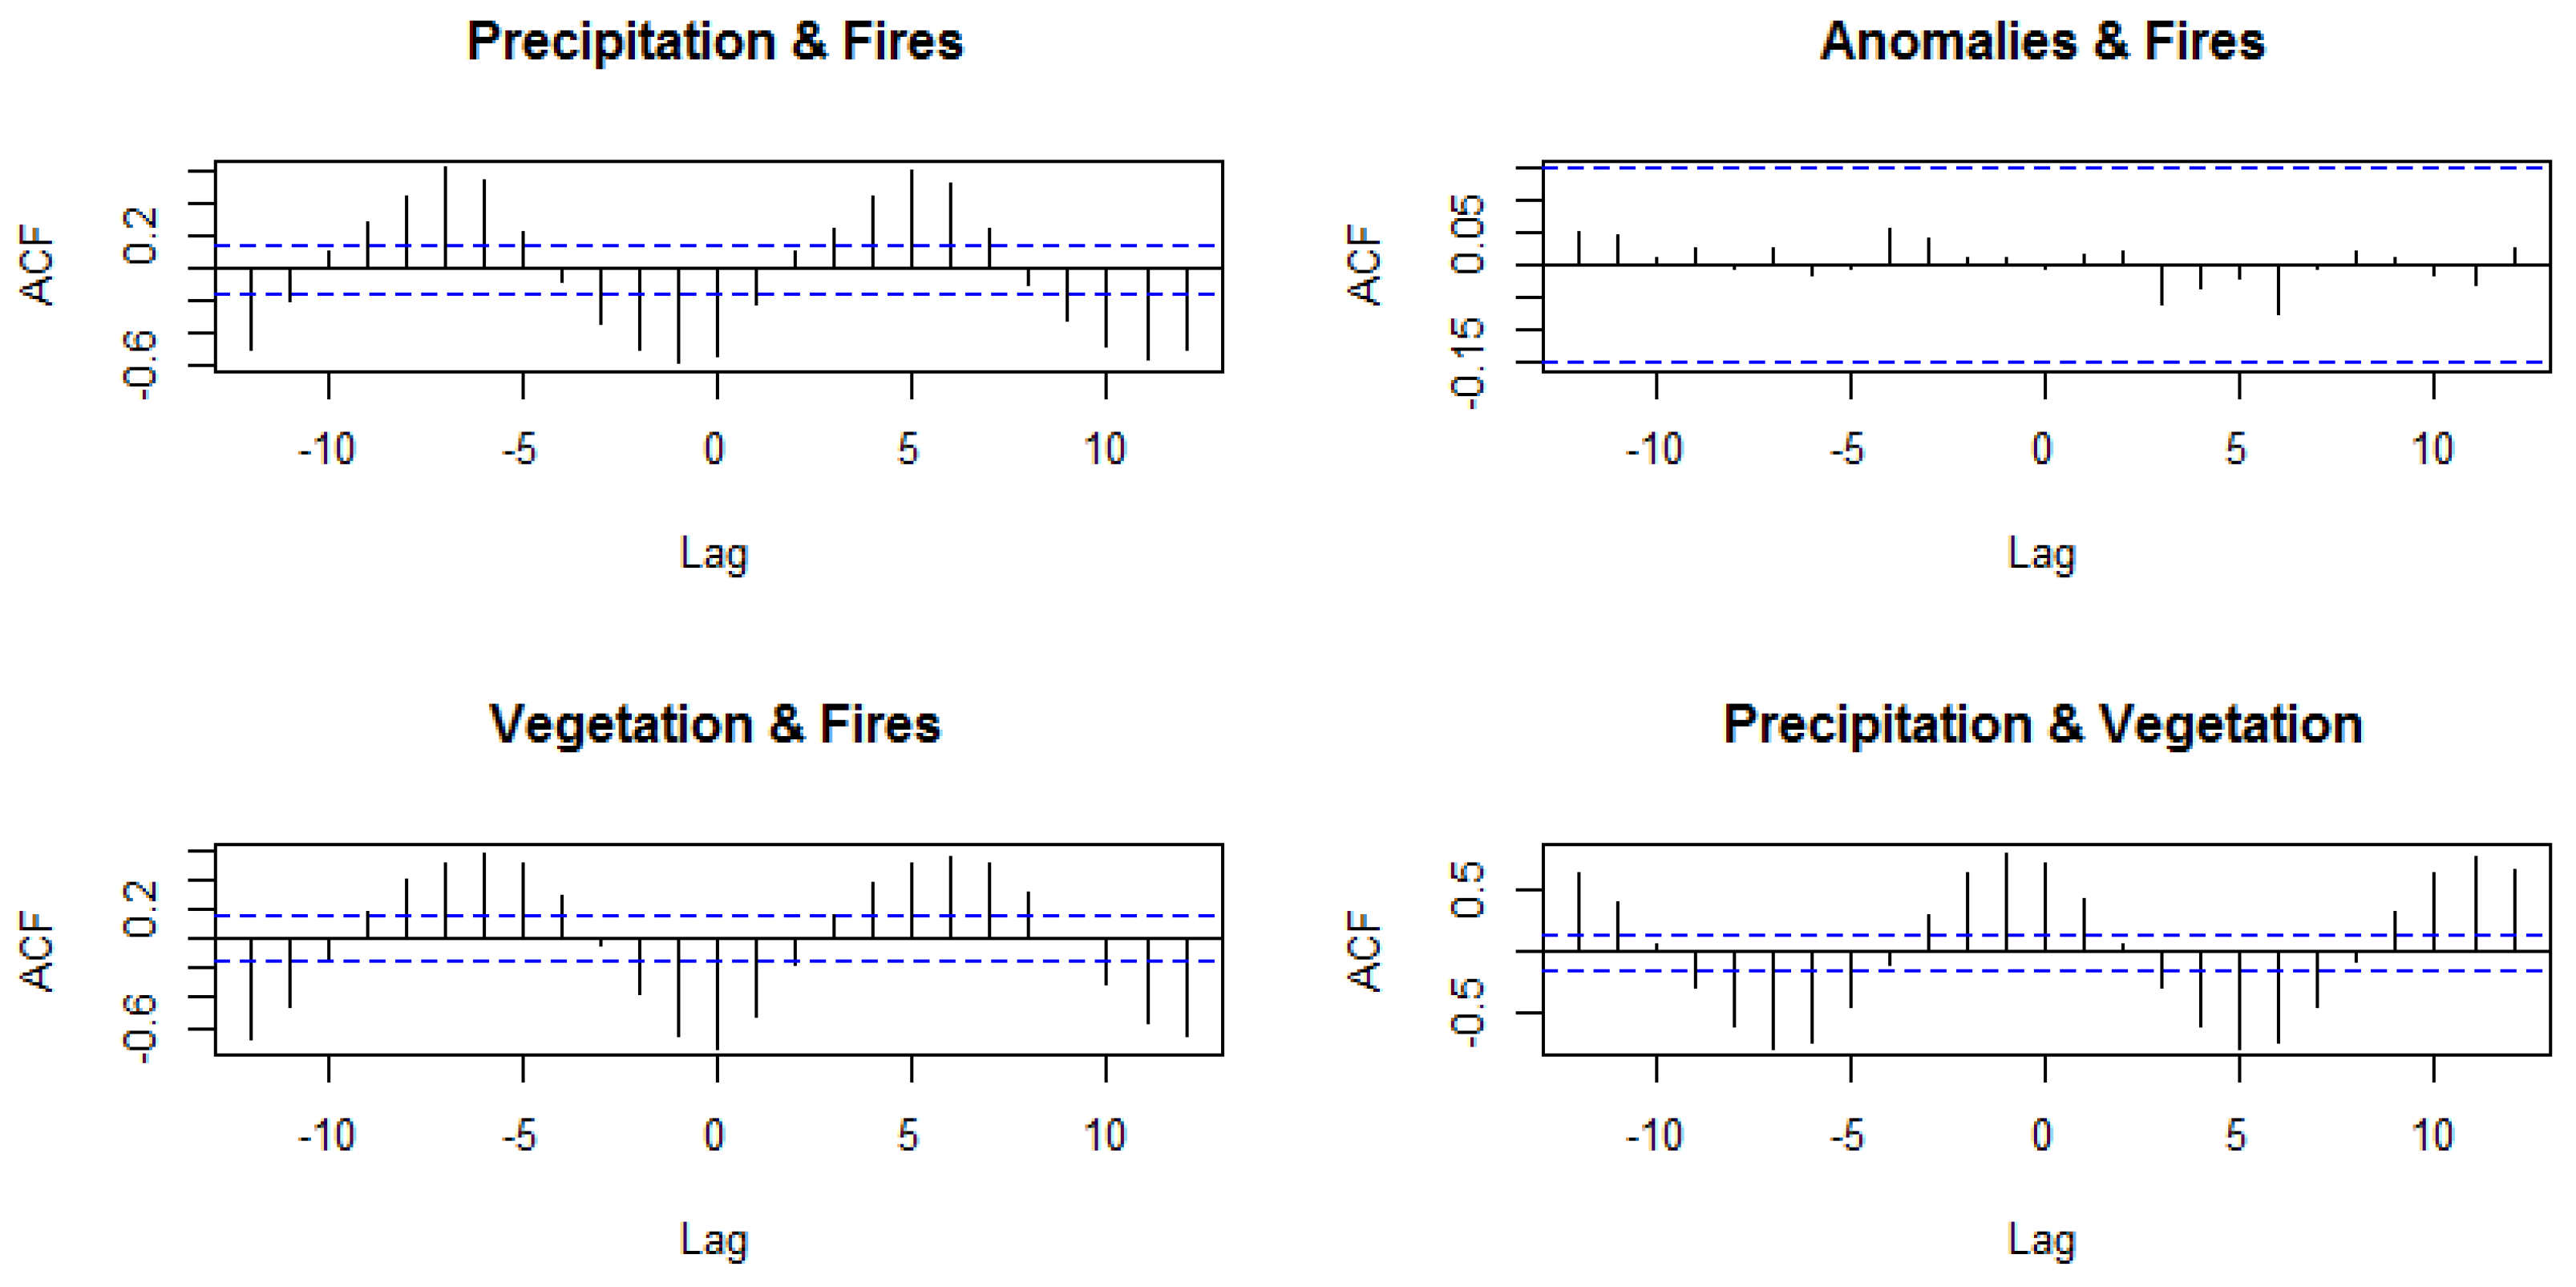
4.1. Temporal Variability of Rainfall, Hotspots and Vegetation


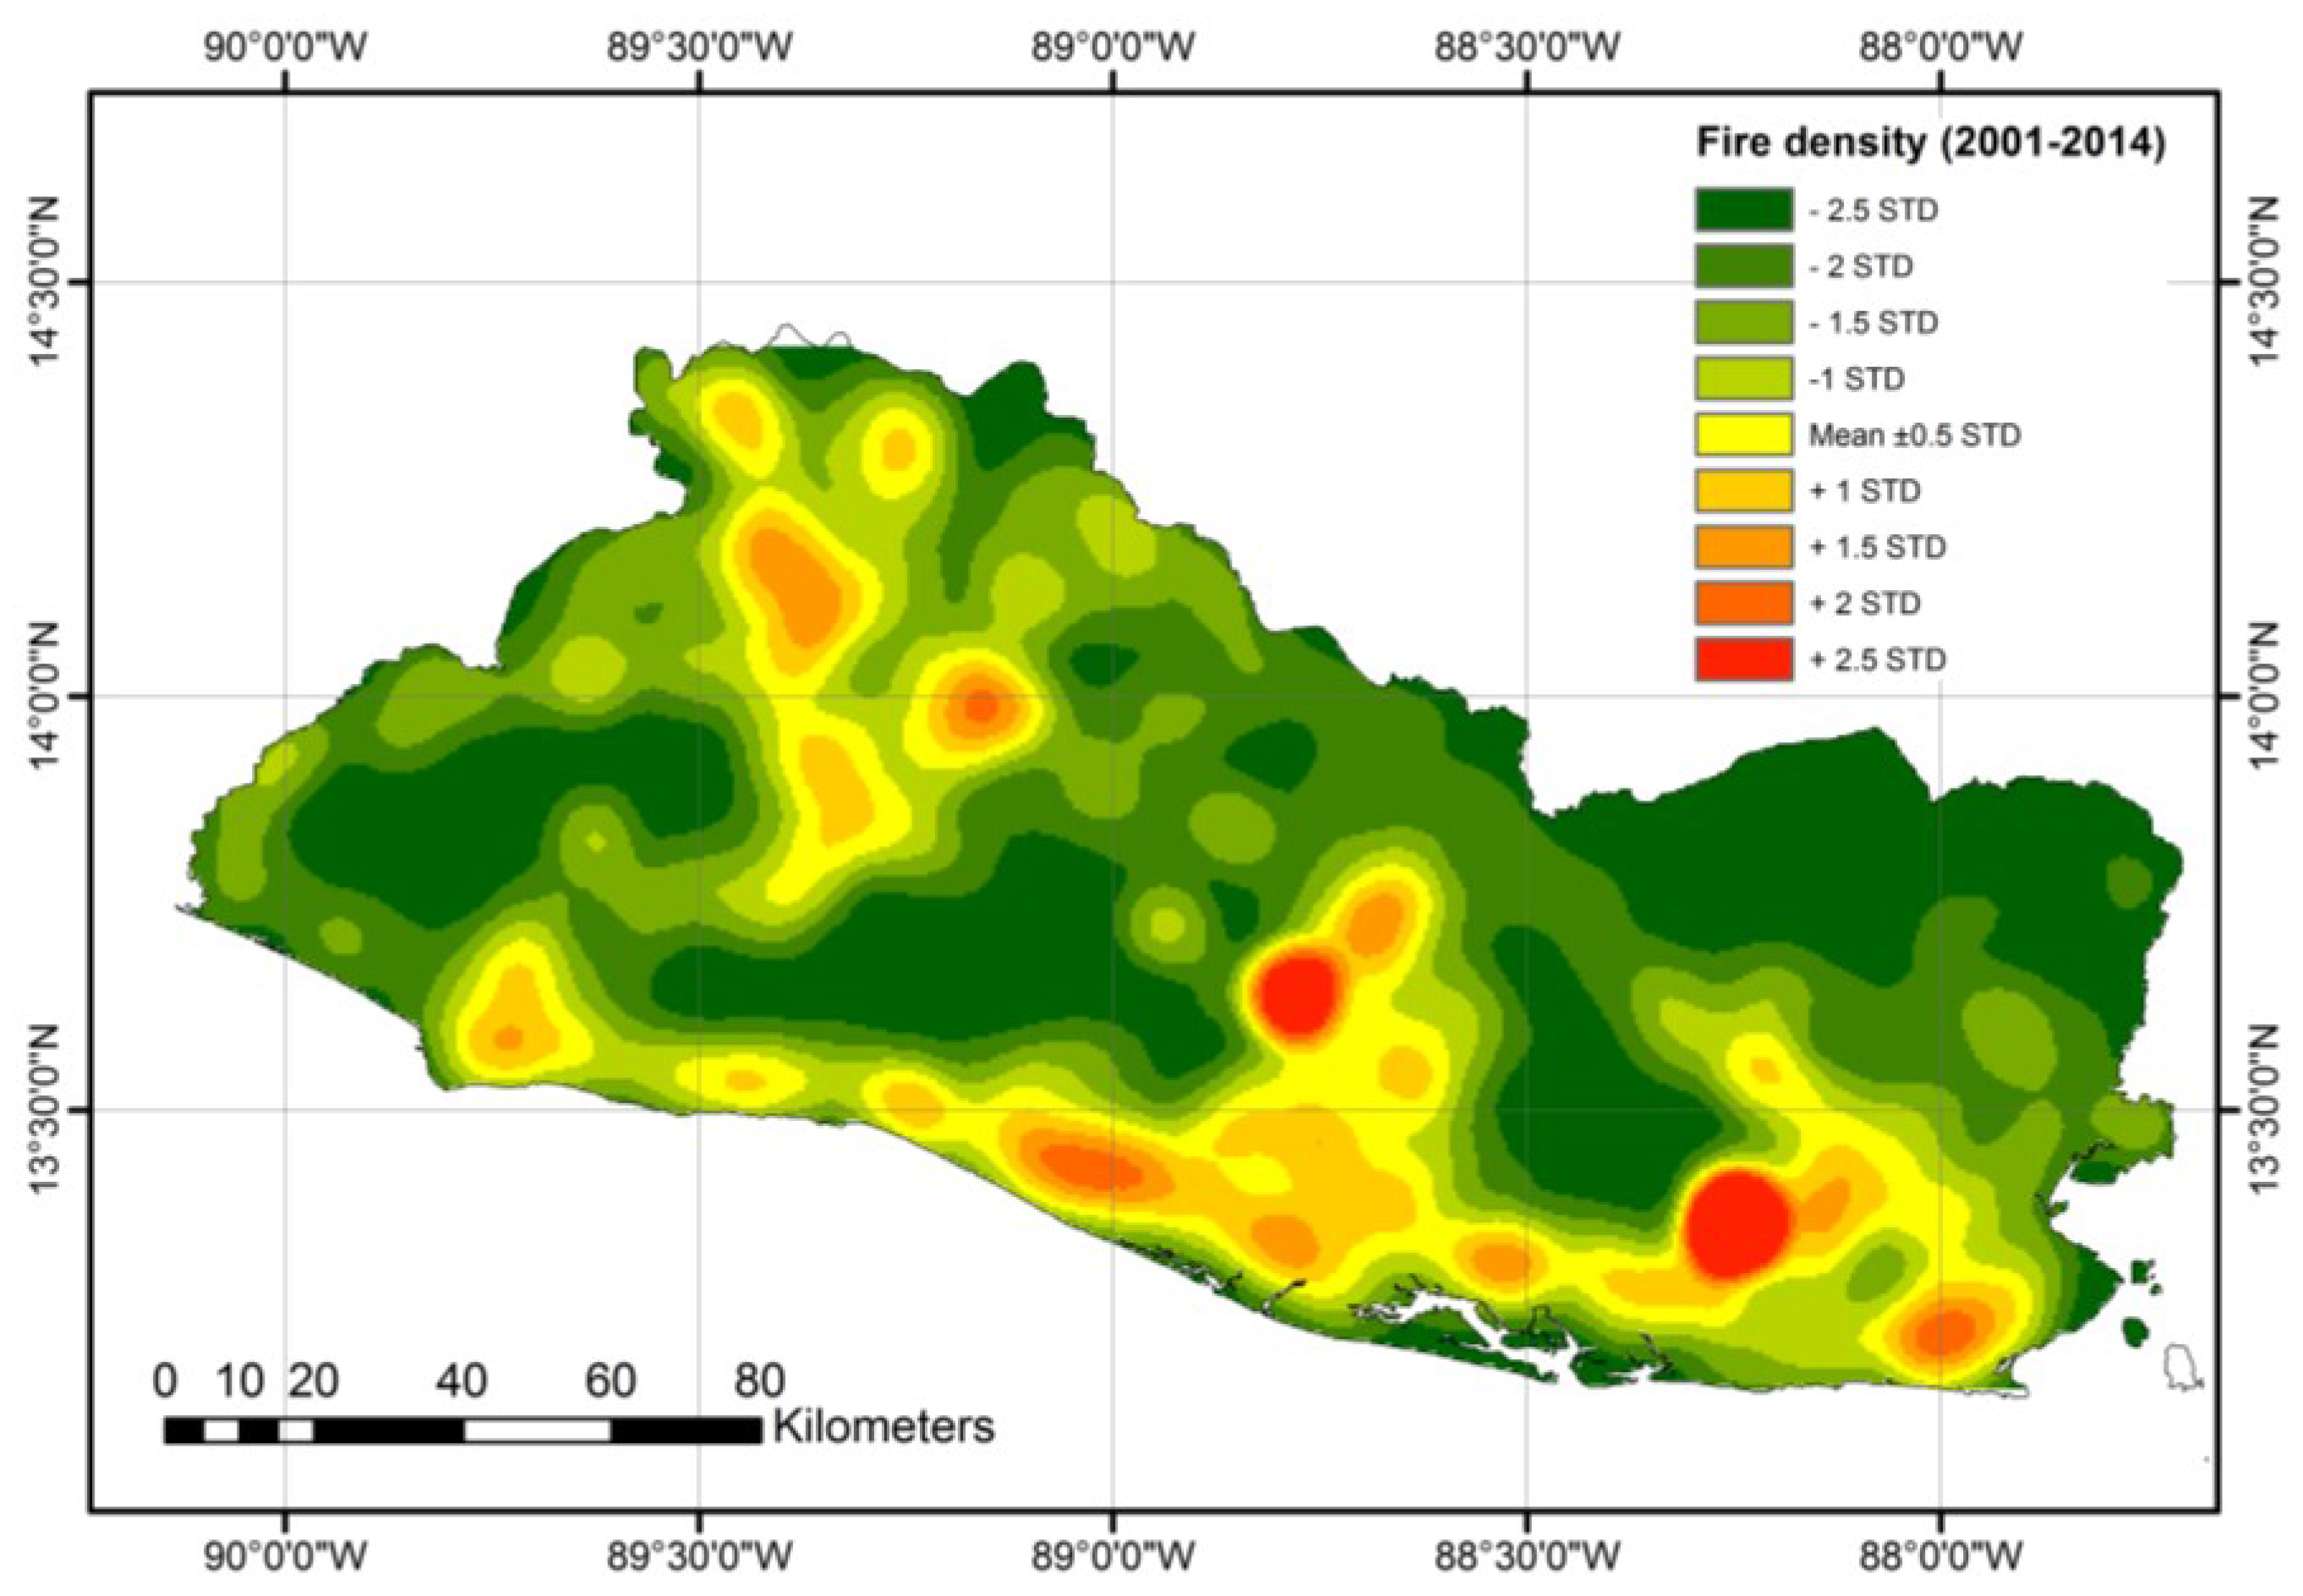
4.2. Spatial Variability of Fires Across the Country and Land Use and Land Cover Types


| Land Use Land Cover Type | Mean Area (ha) | SD | Number of Fires (Mean 2001–2014) | SD | Mean % of Fire Occurrence | SD |
|---|---|---|---|---|---|---|
| Cropland/Natural vegetation mosaic | 1,164,200 | 175,681.5 | 464.6 | 152.69 | 51.3% | 0.023 |
| Woody savannas | 768,594 | 100,406.3 | 189.9 | 67.31 | 20.8% | 0.016 |
| Croplands | 199,715 | 97,656.4 | 122.1 | 40.36 | 13.5% | 0.015 |
| Savannas | 67,817 | 46,468.0 | 64.2 | 22.69 | 7.1% | 0.008 |
| Deciduous Broadleaf forest | 34,071 | 13,572.8 | 24.9 | 15.85 | 2.6% | 0.008 |
| Evergreen Broadleaf forest | 139,573 | 7110.2 | 12.1 | 5.19 | 1.3% | 0.004 |
| Grasslands | 4183 | 3008.4 | 11.5 | 7.59 | 1.2% | 0.005 |
| Mixed forest | 12,821 | 3915.4 | 5.8 | 2.26 | 0.7% | 0.003 |
| Other | 63,625 | 6966.4 | 14.1 | 9.55 | 1.6% | 0.011 |
5. Discussion
6. Conclusions
Supplementary Materials
- Table S1. Area (in hectares) of each land use land cover category per year.
- Table S2. Percentage of landscape in each land use land cover category per year.
- Table S3. Number of satellite detected active fires per land use land cover category.
- Table S4. Percentage of fire ocurrence per land use land cover category.
Acknowledgments
Author Contributions
Conflicts of Interest
References
- Parra, A.C.L.; Bernal, F.H.T. Introducción a la ecología del fuego. In Incendios de la Cobertura Vegetal en Colombia; Parra-Lara, A.C., Ed.; Universidad Autónoma de Occidente: Cali, Colombia, 2011; pp. 17–51. [Google Scholar]
- Van der Werf, G.R.; Randerson, J.T.; Giglio, L.; Collatz, G.; Mu, M.; Kasibhatla, P.S.; Morton, D.C.; Defries, R.S.; Jin, Y.; van Leeuwen, T.T. Global fire emissions and the contribution of deforestation, savanna, forest, agricultural, and peat fires (1997–2009). Atmos. Chem. Phys. 2010, 10, 11707–11735. [Google Scholar] [CrossRef]
- Chuvieco, E. Satellite observation of biomass burning. In Earth Observation of Global Change; Chuvieco, E., Ed.; Springer: Dordrecht, The Netherlands, 2008; pp. 109–142. [Google Scholar]
- Krawchuk, M.A.; Moritz, M.A.; Parisien, M.-A.; Van Dorn, J.; Hayhoe, K. Global pyrogeography: The current and future distribution of wildfire. PLoS ONE 2009, 4, e5102. [Google Scholar] [CrossRef] [PubMed]
- Kloster, S.; Mahowald, N.M.; Randerson, J.T.; Lawrence, P.J. The impacts of climate, land use, and demography on fires during the 21st century simulated by CLM-CN. Biogeosciences 2012, 9, 509–525. [Google Scholar] [CrossRef]
- Liu, Y.; Stanturf, J.; Goodrick, S. Trends in global wildfire potential in a changing climate. For. Ecol. Manag. 2010, 259, 685–697. [Google Scholar] [CrossRef]
- Bowman, D.M.; Balch, J.K.; Artaxo, P.; Bond, W.J.; Carlson, J.M.; Cochrane, M.A.; Pyne, S.J. Fires in the earth system. Science 2009, 324, 481–484. [Google Scholar] [CrossRef] [PubMed]
- Glaspool, I.; Scott, A. Phanerozoic concentrations of atmospheric oxygen reconstructed from sedimentary charcoal. Nat. Geosci. 2010, 3, 627–630. [Google Scholar] [CrossRef]
- Van der Werf, G.R.; Randerson, J.T.; Giglio, L.; Gobron, N.; Dolman, A.J. Climate controls on the variability of fires in the tropics and subtropics. Glob. Biogeochem. Cycles 2008, 22, GB3028. [Google Scholar] [CrossRef]
- Cochrane, M.A. Fire science for rainforests. Nature 2003, 421, 913–919. [Google Scholar] [CrossRef] [PubMed]
- Yevich, R.; Logan, J.A. An assessment of biofuel use and burning of agricultural waste in the developing world. Glob. Biogeochem. Cycles 2003, 17, 1095. [Google Scholar] [CrossRef]
- Cochrane, M.A.; Barber, C.P. Climate change, human land use and future fires in the Amazon. Global Change Biol. 2009, 15, 601–612. [Google Scholar] [CrossRef]
- Forster, P.; Ramaswamy, V.; Artaxo, P.; Berntsen, T.; Betts, R.; Fahey, D.W.; van Dorland, R. Changes in atmospheric constituents and in radiative forcing. In Climate Change 2007: The Physical Science Basis; Contribution of Working Group I to the Fourth Assessment Report of the Intergovernmental Panel on Climate Change; Solomon, S., Qin, D., Manning, M., Chen, Z., Marquis, M., Averyt, K.B., Tignor, M., Miller, H.L., Eds.; Cambridge University Press: Cambridge, UK, 2007. [Google Scholar]
- Aragão, L.E.O.; Malhi, Y.; Barbier, N.; Lima, A.; Shimabukuro, Y.; Anderson, L.; Saatchi, S. Interactions between rainfall, deforestation and fires during recent years in the Brazilian Amazonia. Philos. Trans. R. Soc. Lond. Ser. B 2008, 363, 1779–1785. [Google Scholar] [CrossRef] [PubMed] [Green Version]
- Cochrane, M.A.; Laurance, W. Synergisms among fire, land use, and climate change in the Amazon. AMBIO J. Hum. Environ. 2008, 37, 522–527. [Google Scholar] [CrossRef]
- Chen, Y.; Morton, D.C.; Jin, Y.; Collatz, G.J.; Kasibhatla, P.S.; van der Werf, G.R.; Randerson, J.T. Long-term trends and interannual variability of forest, savanna and agricultural fires in South America. Carbon Manag. 2013, 4, 617–638. [Google Scholar] [CrossRef]
- Morton, D.C.; Le Page, Y.; DeFries, R.; Collatz, G.J.; Hurtt, G.C. Understorey fire frequency and the fate of burned forests in southern Amazonia. Philos. Trans. R. Soc. Lond. Ser. B 2013, 368. [Google Scholar] [CrossRef] [PubMed]
- Chuvieco, E.; Opazo, S.; Sione, W.; del Valle, H.; Anaya, J.A.; di Bella, C.; Libonati, R. Global burned-land estimation in Latin America using MODIS composite data. Ecol. Appl. 2008, 18, 64–79. [Google Scholar] [CrossRef] [PubMed]
- Roman-Cuesta, R.M.; Gracia, M.; Retana, J.; Maria, R. Environmental and human factors influencing fire trends in ENSO and non-ENSO years in tropical Mexico. Ecol. Appl. 2003, 13, 1177–1192. [Google Scholar] [CrossRef]
- Maloney, E.D.; Camargo, S.J.; Chang, E.; Colle, B.; Fu, R.; Geil, K.L.; Zhao, M. North American Climate in CMIP5 Experiments: Part III: Assessment of Twenty-First-Century Projections. J. Clim. 2014, 27, 2230–2270. [Google Scholar] [CrossRef]
- Herrador, D.V.; Boada i Juncà, M.; Varga Linde, D.; Mendizábal Riera, E. Tropical forest recovery and socio-economic change in El Salvador: An opportunity for the introduction of new approaches to biodiversity protection. Appl. Geogr. 2011, 31, 259–268. [Google Scholar] [CrossRef]
- Ministerio de Medio Ambiente y Recursos Naturales (MARN). El Salvador: Medio Ambiente y Recursos Naturales. 1999. Available online: http://www.marn.gob.sv/ (accessed on 17 November 2015).
- Food and Agriculture Organization (FAO). Global Forest Resources Assessment 2000: Main Report; FAO: Rome, Italy, 2001. [Google Scholar]
- Hecht, S.B.; Kandel, S.; Gomes, I.; Cuellar, N.; Rosa, H. Globalization, forest resurgence, and environmental politics in El Salvador. World Dev. 2006, 34, 308–323. [Google Scholar] [CrossRef]
- Redo, D.J.; Grau, H.R.; Aide, T.M.; Clark, M.L. Asymmetric forest transition driven by the interaction of socioeconomic development and environmental heterogeneity in Central America. Proc. Natl. Acad. Sci. USA 2012, 109, 8839–8844. [Google Scholar] [CrossRef] [PubMed]
- Lexa, J.; Šebesta, J.; Chavez, J.A.; Hernández, W.; Pécskay, Z. Geology and volcanic evolution in the southern part of the San Salvador Metropolitan Area. J. Geosci. 2011, 56, 106–140. [Google Scholar] [CrossRef]
- Damon, A.L. Agricultural land use and asset accumulation in migrant households: The case of El Salvador. J. Dev. Stud. 2010, 46, 162–189. [Google Scholar] [CrossRef]
- Food and Agriculture Organization (FAO). FAOSTAT. Available online: http://faostat.fao.org/site/377/default.aspx#ancor (accessed on 12 August 2014).
- Land Processes Distributed Active Archive Center (LP DAAC). MODIS Land Cover Type Yearly L3 Global 500 m SIN Grid. NASA EOSDIS Land Processes DAAC; USGS Earth Resources Observation and Science (EROS) Center: Sioux Falls, SD, USA, 2013. Available online: https://lpdaac.usgs.gov (accessed on 1 March 2015).
- National Aeronautics and Space Administration (NASA). Fire Information for Resource Management System (FIRMS). Land, Atmosphere near Real-Time Capability for EOS (LANCE). 2013. Available online: https://earthdata.nasa.gov/data/near-real-time-data/firms (accessed on 17 November 2015). [Google Scholar]
- Davies, D.K.; Ilavajhala, S.; Wong, M.M.; Justice, C.O. Fire information for resource management system: Archiving and distributing MODIS active fire data. IEEE Trans. Geosci. Remote Sens. 2009, 47, 72–79. [Google Scholar] [CrossRef]
- Roberts, G.; Wooster, M.J. Fire detection and fire characterization over Africa using Meteosat SEVIRI. IEEE Trans. Geosci. Remote Sens. 2008, 46, 1200–1218. [Google Scholar] [CrossRef]
- Csiszar, I.A. Assessment of the status of the development of the standards for the Terrestrial Essential Climate Variables: Fire. Glob. Terr. Obs. Syst. 2009. Version 27, 38 pages. [Google Scholar]
- Armenteras-Pascual, D.; Retana-Alumbreros, J.; Molowny-Horas, R.; Roman-Cuesta, R.M.; González-Alonso, F.; Morales-Rivas, M. Characterising fire spatial pattern interactions with climate and vegetation in Colombia. Agric. For. Meteorol. 2011, 151, 279–289. [Google Scholar] [CrossRef]
- Xie, Y.; Sha, Z.; Yu, M. Remote sensing imagery in vegetation mapping: A review. J. Plant Ecol. 2008, 1, 9–23. [Google Scholar] [CrossRef]
- Bégué, A.; Vintrou, E.; Ruelland, D.; Claden, M.; Dessay, N. Can a 25-year trend in Soudano-Sahelian vegetation dynamics be interpreted in terms of land use change? A remote sensing approach. Glob. Environ. Chang. 2011, 21, 413–420. [Google Scholar] [CrossRef]
- Pettorelli, N.; Vik, J.O.; Mysterud, A.; Gaillard, J.M.; Tucker, C.J.; Stenseth, N.C. Using the satellite-derived NDVI to assess ecological responses to environmental change. Trends Ecol. Evol. 2005, 20, 503–510. [Google Scholar] [CrossRef] [PubMed]
- Carlson, T.N.; Ripley, D.A. On the relation between NDVI, fractional vegetation cover, and leaf area index. Remote Sens. Environ. 1997, 62, 241–252. [Google Scholar] [CrossRef]
- Cryer, J.D.; Chan, K.S. Time Series Analysis with Applications in R, 2nd ed.; Springer: New York, NY, USA, 2008. [Google Scholar]
- Shumway, R.H.; Stoffer, D.S. Time Series Analysis and Its Applications: With R Examples; Springer: New York, NY, USA, 2006. [Google Scholar]
- Koutsias, N.G.; Xanthopoulos, D.; Founda, F.; Xystrakis, F.; Nioti, M.; Pleniou, G.; Mallinis, A.M. On the relationships between forest fires and weather conditions in Greece from long-term national observations (1894–2010). Int. J. Wildland Fire 2013, 22, 493–507. [Google Scholar] [CrossRef]
- Van der Werf, G.R.; Randerson, J.T.; Collatz, G.J.; Giglio, L.; Kasibhatla, P.S.; Arellano, A.F.; Olsen, S.C.; Kasischke, E.S. Continental-scale partitioning of fire emissions during the 1997 to 2001 El Niño/La Niña period. Science 2004, 303, 73–76. [Google Scholar] [CrossRef] [PubMed]
- Coffin, A.W. From roadkill to road ecology: A review of the ecological effects of roads. J. Transp. Geogr. 2007, 15, 396–406. [Google Scholar] [CrossRef]
- GRID-Arendal Year. Vital Climate Graphics Latin America and the Caribbean. 2005. Available online: http://www.grida.no/graphicslib/collection/vital-climate-graphics-latin-america-and-the-caribbean (accessed on 17 November 2015).
- Forman, R.T.T.; Alexander, L.E. Roads and their major ecological effects. Annu. Rev. Ecol. Syst. 1998, 29, 207–231. [Google Scholar] [CrossRef]
- Spellerberg, I.F.; Morrison, T. The ecological effects of new roads: A literature review. Sci. Conserv. 1998, 84, 1–58. [Google Scholar]
- Forman, R.T.T.; Sperling, D.; Bissonette, J.A.; Clevenger, A.P.; Cutshall, C.D.; Dale, V.H.; Fahrig, L.; France, R.; Goldman, C.R.; Heanue, K.; et al. Road Ecology: Science and Solutions; Island Press: Washington, DC, USA, 2003; p. 481. [Google Scholar]
- Nagendra, H.; Southworth, J.; Tucker, C.J. Accessibility as a determinant of landscape transformation in western Honduras: Linking pattern and process. Landsc. Ecol. 2003, 18, 141–158. [Google Scholar] [CrossRef]
- Xystrakis, F.; Kallimanis, A.S.; Dimopoulos, P.; Halley, J.M.; Koutsias, N. Precipitation dominates fire occurrence in Greece (1900–2010): Its dual role in fuel build-up and dryness. Nat. Hazards Earth Syst. Sci. 2014, 14, 21–32. [Google Scholar] [CrossRef]
© 2016 by the authors; licensee MDPI, Basel, Switzerland. This article is an open access article distributed under the terms and conditions of the Creative Commons by Attribution (CC-BY) license (http://creativecommons.org/licenses/by/4.0/).
Share and Cite
Armenteras, D.; Gibbes, C.; Vivacqua, C.A.; Espinosa, J.S.; Duleba, W.; Goncalves, F.; Castro, C. Interactions between Climate, Land Use and Vegetation Fire Occurrences in El Salvador. Atmosphere 2016, 7, 26. https://doi.org/10.3390/atmos7020026
Armenteras D, Gibbes C, Vivacqua CA, Espinosa JS, Duleba W, Goncalves F, Castro C. Interactions between Climate, Land Use and Vegetation Fire Occurrences in El Salvador. Atmosphere. 2016; 7(2):26. https://doi.org/10.3390/atmos7020026
Chicago/Turabian StyleArmenteras, Dolors, Cerian Gibbes, Carla A. Vivacqua, Juan Sebastián Espinosa, Wania Duleba, Fabio Goncalves, and Christopher Castro. 2016. "Interactions between Climate, Land Use and Vegetation Fire Occurrences in El Salvador" Atmosphere 7, no. 2: 26. https://doi.org/10.3390/atmos7020026