1. Introduction
Walker circulation (WC), which is the large-scale zonal overturning circulation with ascent over the western and descent over the eastern tropical Pacific, is an important factor of the global climate system, and its variability is strongly associated with the El Niño Southern Oscillation (ENSO) [
1,
2]. It is of great importance to understand how the WC has changed and how it might change due to greenhouse warming, because the variations in its intensity and structure have a significant impact on not only the tropical climate, but also the monsoonal circulations over adjacent continents [
3] and the global climate [
3,
4].
Much observational evidence showed that the WC has strengthened and its western edge has shifted westward in recent decades [
5,
6,
7,
8,
9,
10,
11,
12,
13,
14]. For example, Sohn and Park [
5] showed that the WC has intensified since 1979 from both the reanalysis data and satellite-based water budget data. Zahn and Allan [
9] examined the changes in the tropical atmospheric circulation derived from the moisture transports into the tropics using high temporal and spatial resolution reanalysis data from the European Centre for Medium-Range Weather Forecasts (ECMWF) ERA-Interim [
15,
16]. They found a significant strengthening of both the lower-level inward transports and the mid-level outward transports in the two most recent decades (1989–2008), suggesting that the strengthening of WC was primarily caused by an intensification of the wind-related circulation strength.
In addition, a number of studies have focused on the roles of inhomogeneous warming,
i.e., the sea surface temperature (SST) warming pattern in the WC changes in response to greenhouse warming [
14,
17,
18,
19,
20,
21,
22,
23]. Tokinaga
et al. [
20] used an atmospheric model and showed that the SST warming pattern was the primary cause of the WC changes for 1950–2009. Bayr
et al. [
24] and Sandeep
et al. [
22] showed that the WC trend was closely related to the SST zonal gradient trend in the tropical Pacific in the Coupled Model Intercomparison Project Phase 3 (CMIP3) and 5 (CMIP5) climate models. There are also several studies suggesting a role for the SST warming trend outside the tropical Pacific, such as from the Indian Ocean [
12], the Atlantic [
14] or both in the observed WC intensification since the early 1990s.
On the other hand, it has been suggested that the differences in the convection anomalies associated with the ENSO on interannual timescales may have affected the WC trend for a substantial period of time. Bayr
et al. [
24] found that the changes in the zonal circulation cells in the tropical Pacific were very similar to the dominant modes of the internal variability in the tropical zonal circulation cells, which were dominated by the ENSO. Therefore, the WC trend primarily followed the dominant mode of the internal variability such as ENSO. Sandeep
et al. [
22] also showed that the ENSO-related SST force weakens the WC trend by comparing the results of atmospheric general circulation model experiments with the ENSO-related and ENSO-unrelated SST variability under global warming. These studies raise the question of what would happen if the SST warming pattern is prescribed in the climate models. In other words, it is useful to examine whether or not the models project consistent WC changes under the same SST-constrained conditions, and if not, what could make a difference in the WC changes among the climate models.
The aim of this study is to examine and compare the WC trend based on the same SST-constrained Atmospheric Model Intercomparison Project (AMIP) simulations of various CMIP5 climate models. We investigate the relationship between the WC trend and the ENSO variability in order to understand the inter-model diversity in the WC trend. In particular we focus on the differences in the ENSO-related convection. We examine how the inter-model diversity in the WC trend is related to the zonal position of the ENSO-related convection anomalies in the AMIP simulations.
3. Results
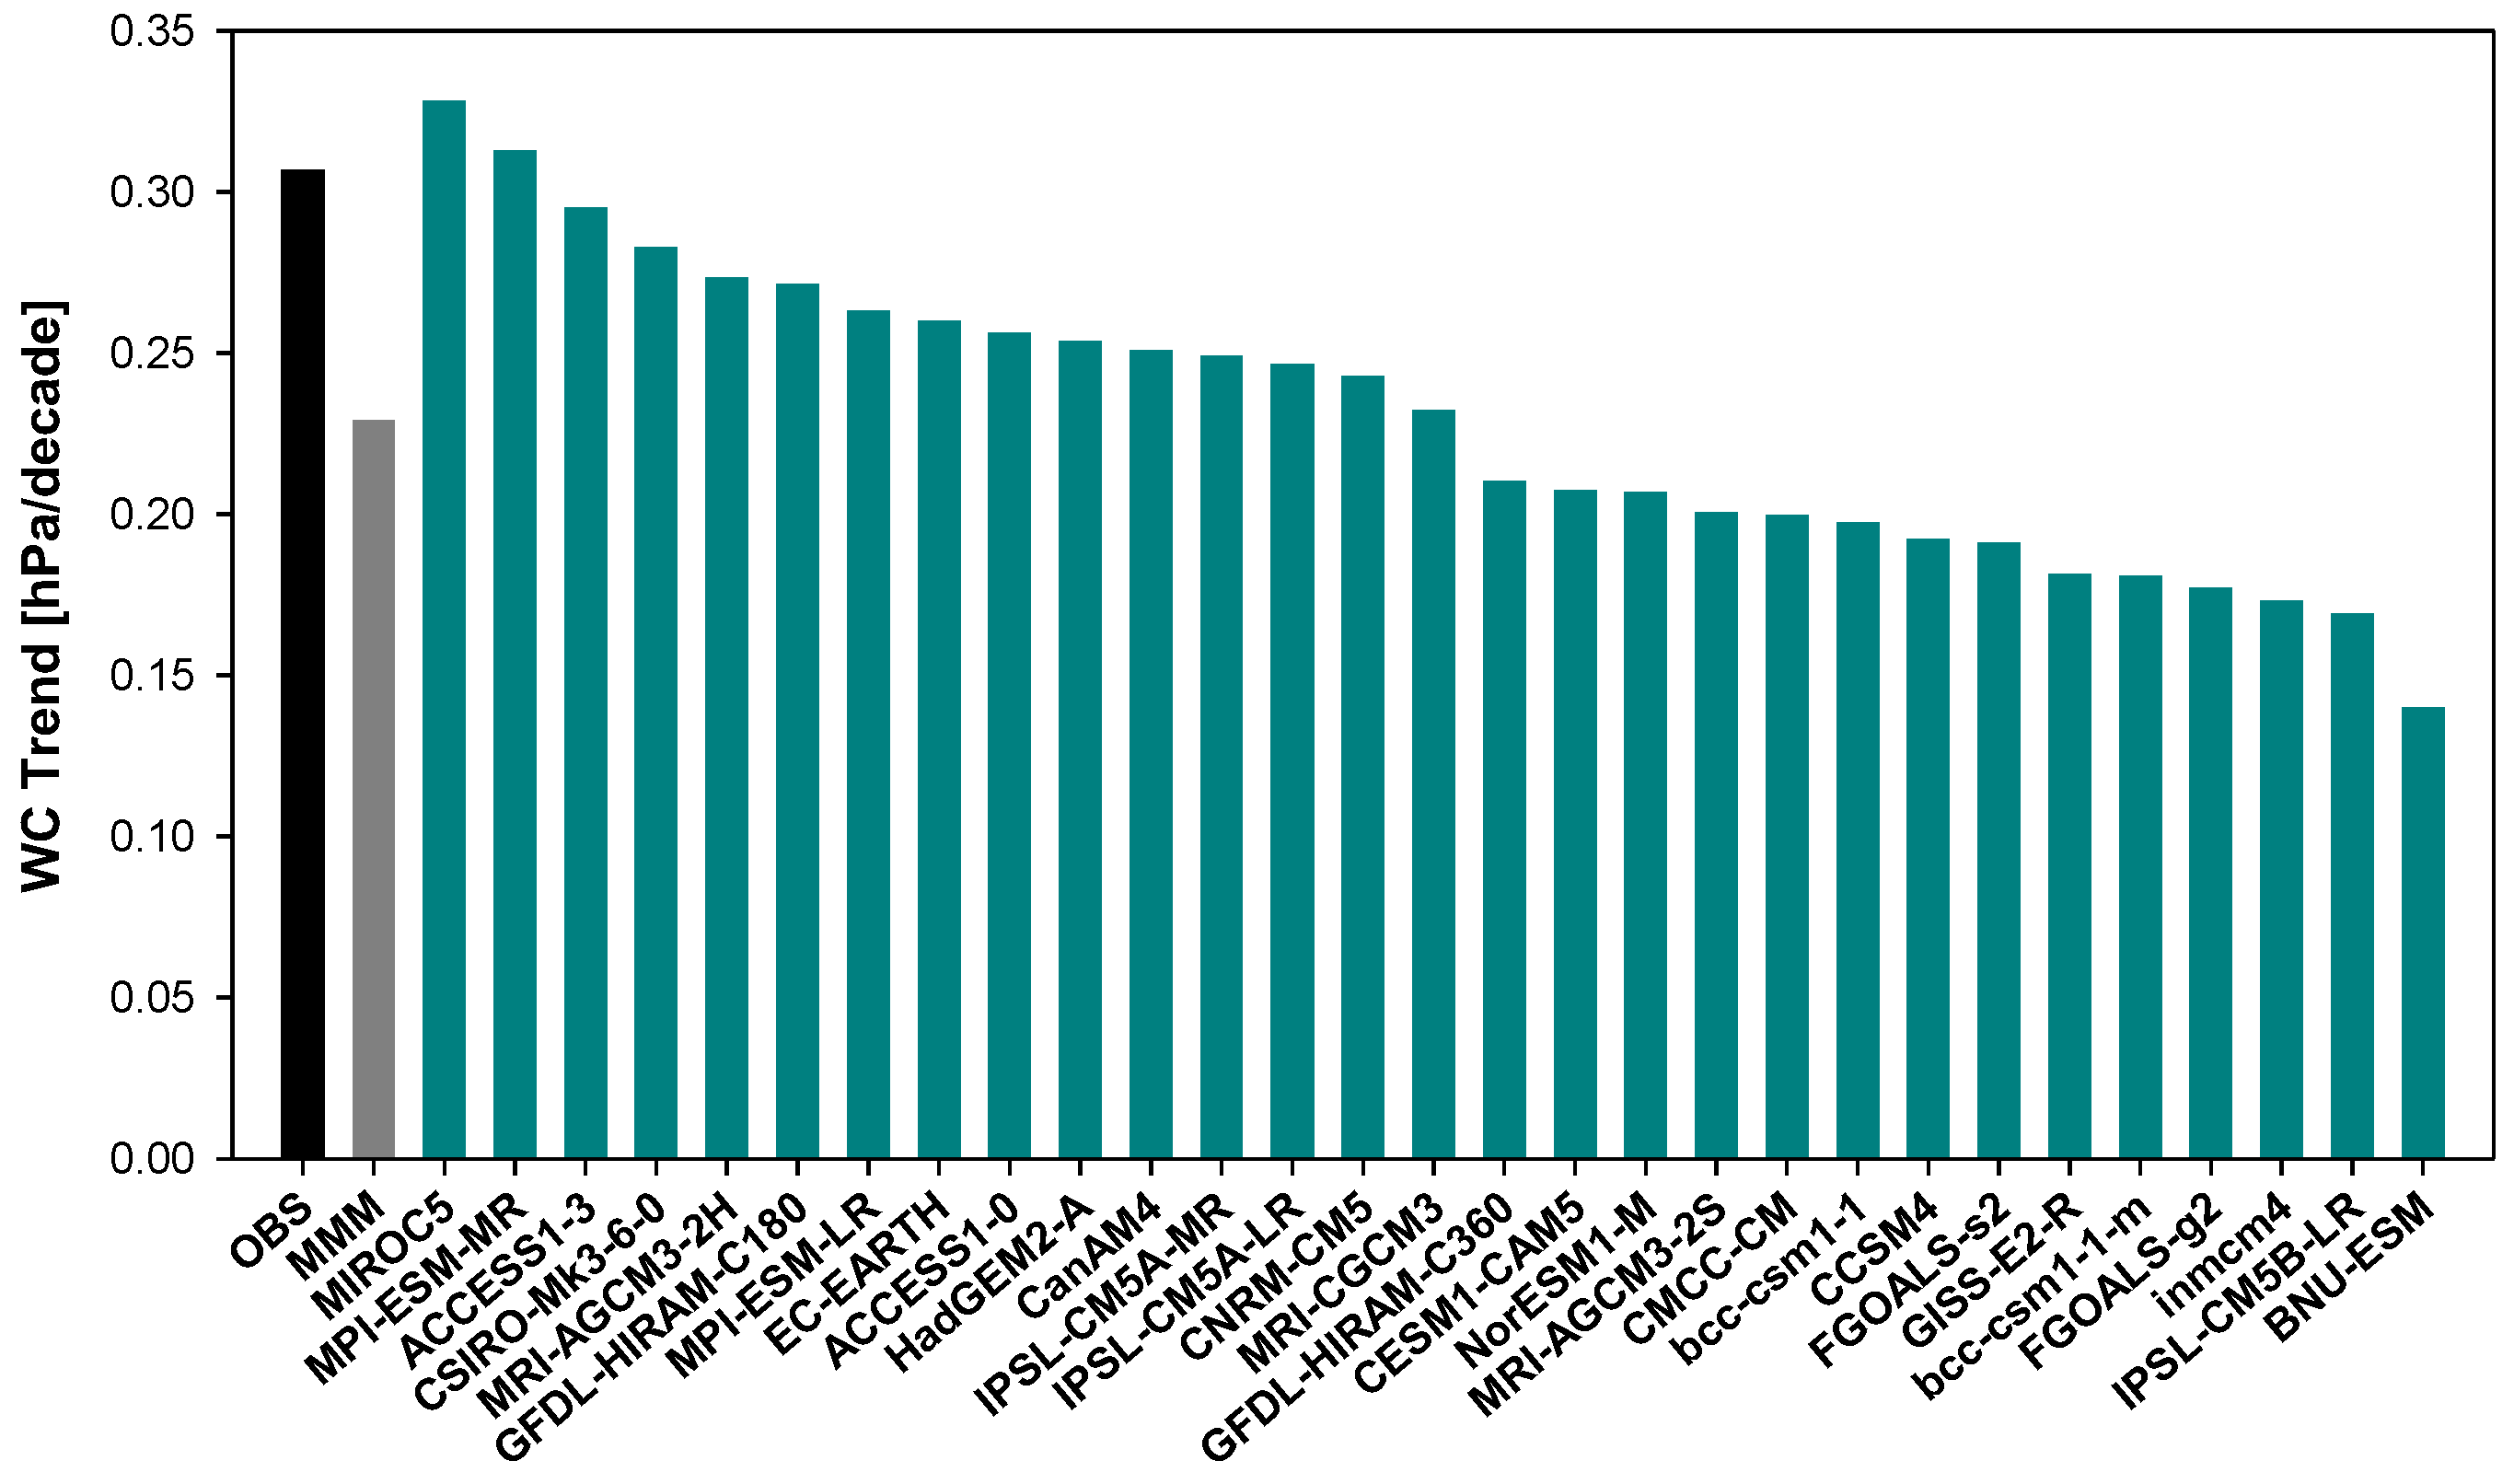
Figure 1 shows the WC trend for 1979–2005 in the 29 models of the CMIP5 AMIP simulations, together with the observation and multi-model mean (MMM) of the 29 models. Similar to the observation, the MMM and individual models show a consistent increase in the SLP zonal gradient,
i.e., a decrease in the low SLP over the western tropical Pacific and an increase in the high SLP over the eastern tropical Pacific. It is obvious that the strengthening of the WC trend is predominantly caused by an increase in the SST zonal gradient (0.19 K/decade) along the equator due to the prescribed SST of the AMIP simulations. However, the individual models show considerable diversity in the strengthening of the WC trend. It ranges from 0.14 hPa/decade in the Beijing Normal University-Earth System Model (BNU-ESM) to 0.33 hPa/decade in the Model for Interdisciplinary Research On Climate version 5 (MIROC5), with 0.23 hPa/decade in the MMM. This result indicates that although the climate models reproduce the strengthening of the WC reasonably well in response to an increase in the SST zonal gradient, its strength is quite model-dependent. That is, the climate models simulate the magnitude of the WC trend differently even in the same SST-constrained AMIP simulations. This implies that factors may exist that modify the WC intensity other than the inhomogeneous SST warming pattern in the climate models.
Following the work by Bayr
et al. [
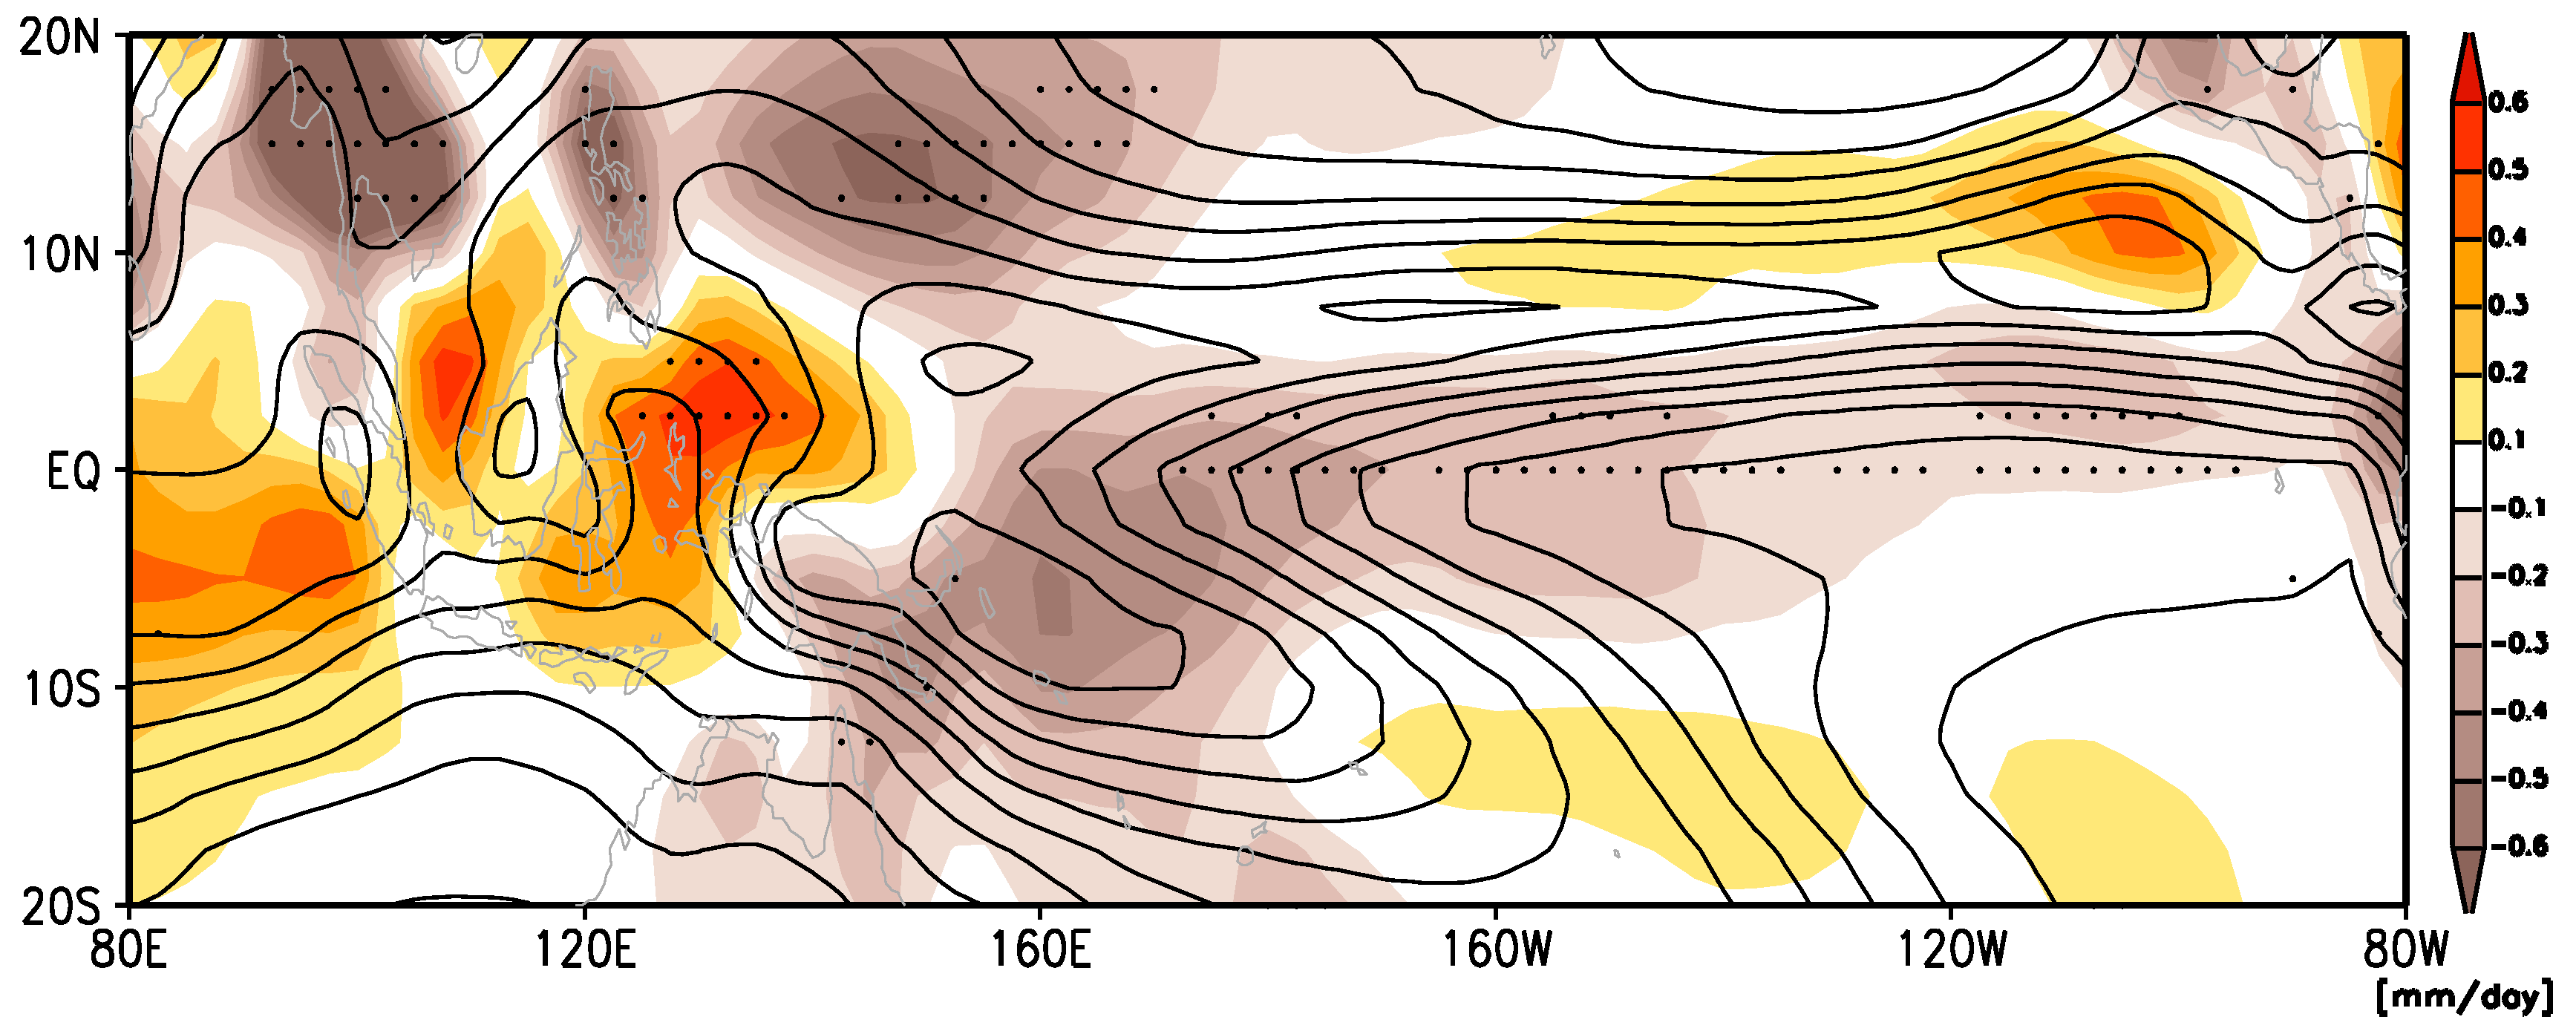
24], we hypothesize that the differences in the ENSO-related convection on interannual timescales may have affected the WC trend for 1979–2005. In order to illustrate the relationship between the WC trend and the ENSO-related convection in the climate models, we show the regression coefficients of the precipitation anomaly (PRCPA) with respect to the normalized NINO3.4 SST index (
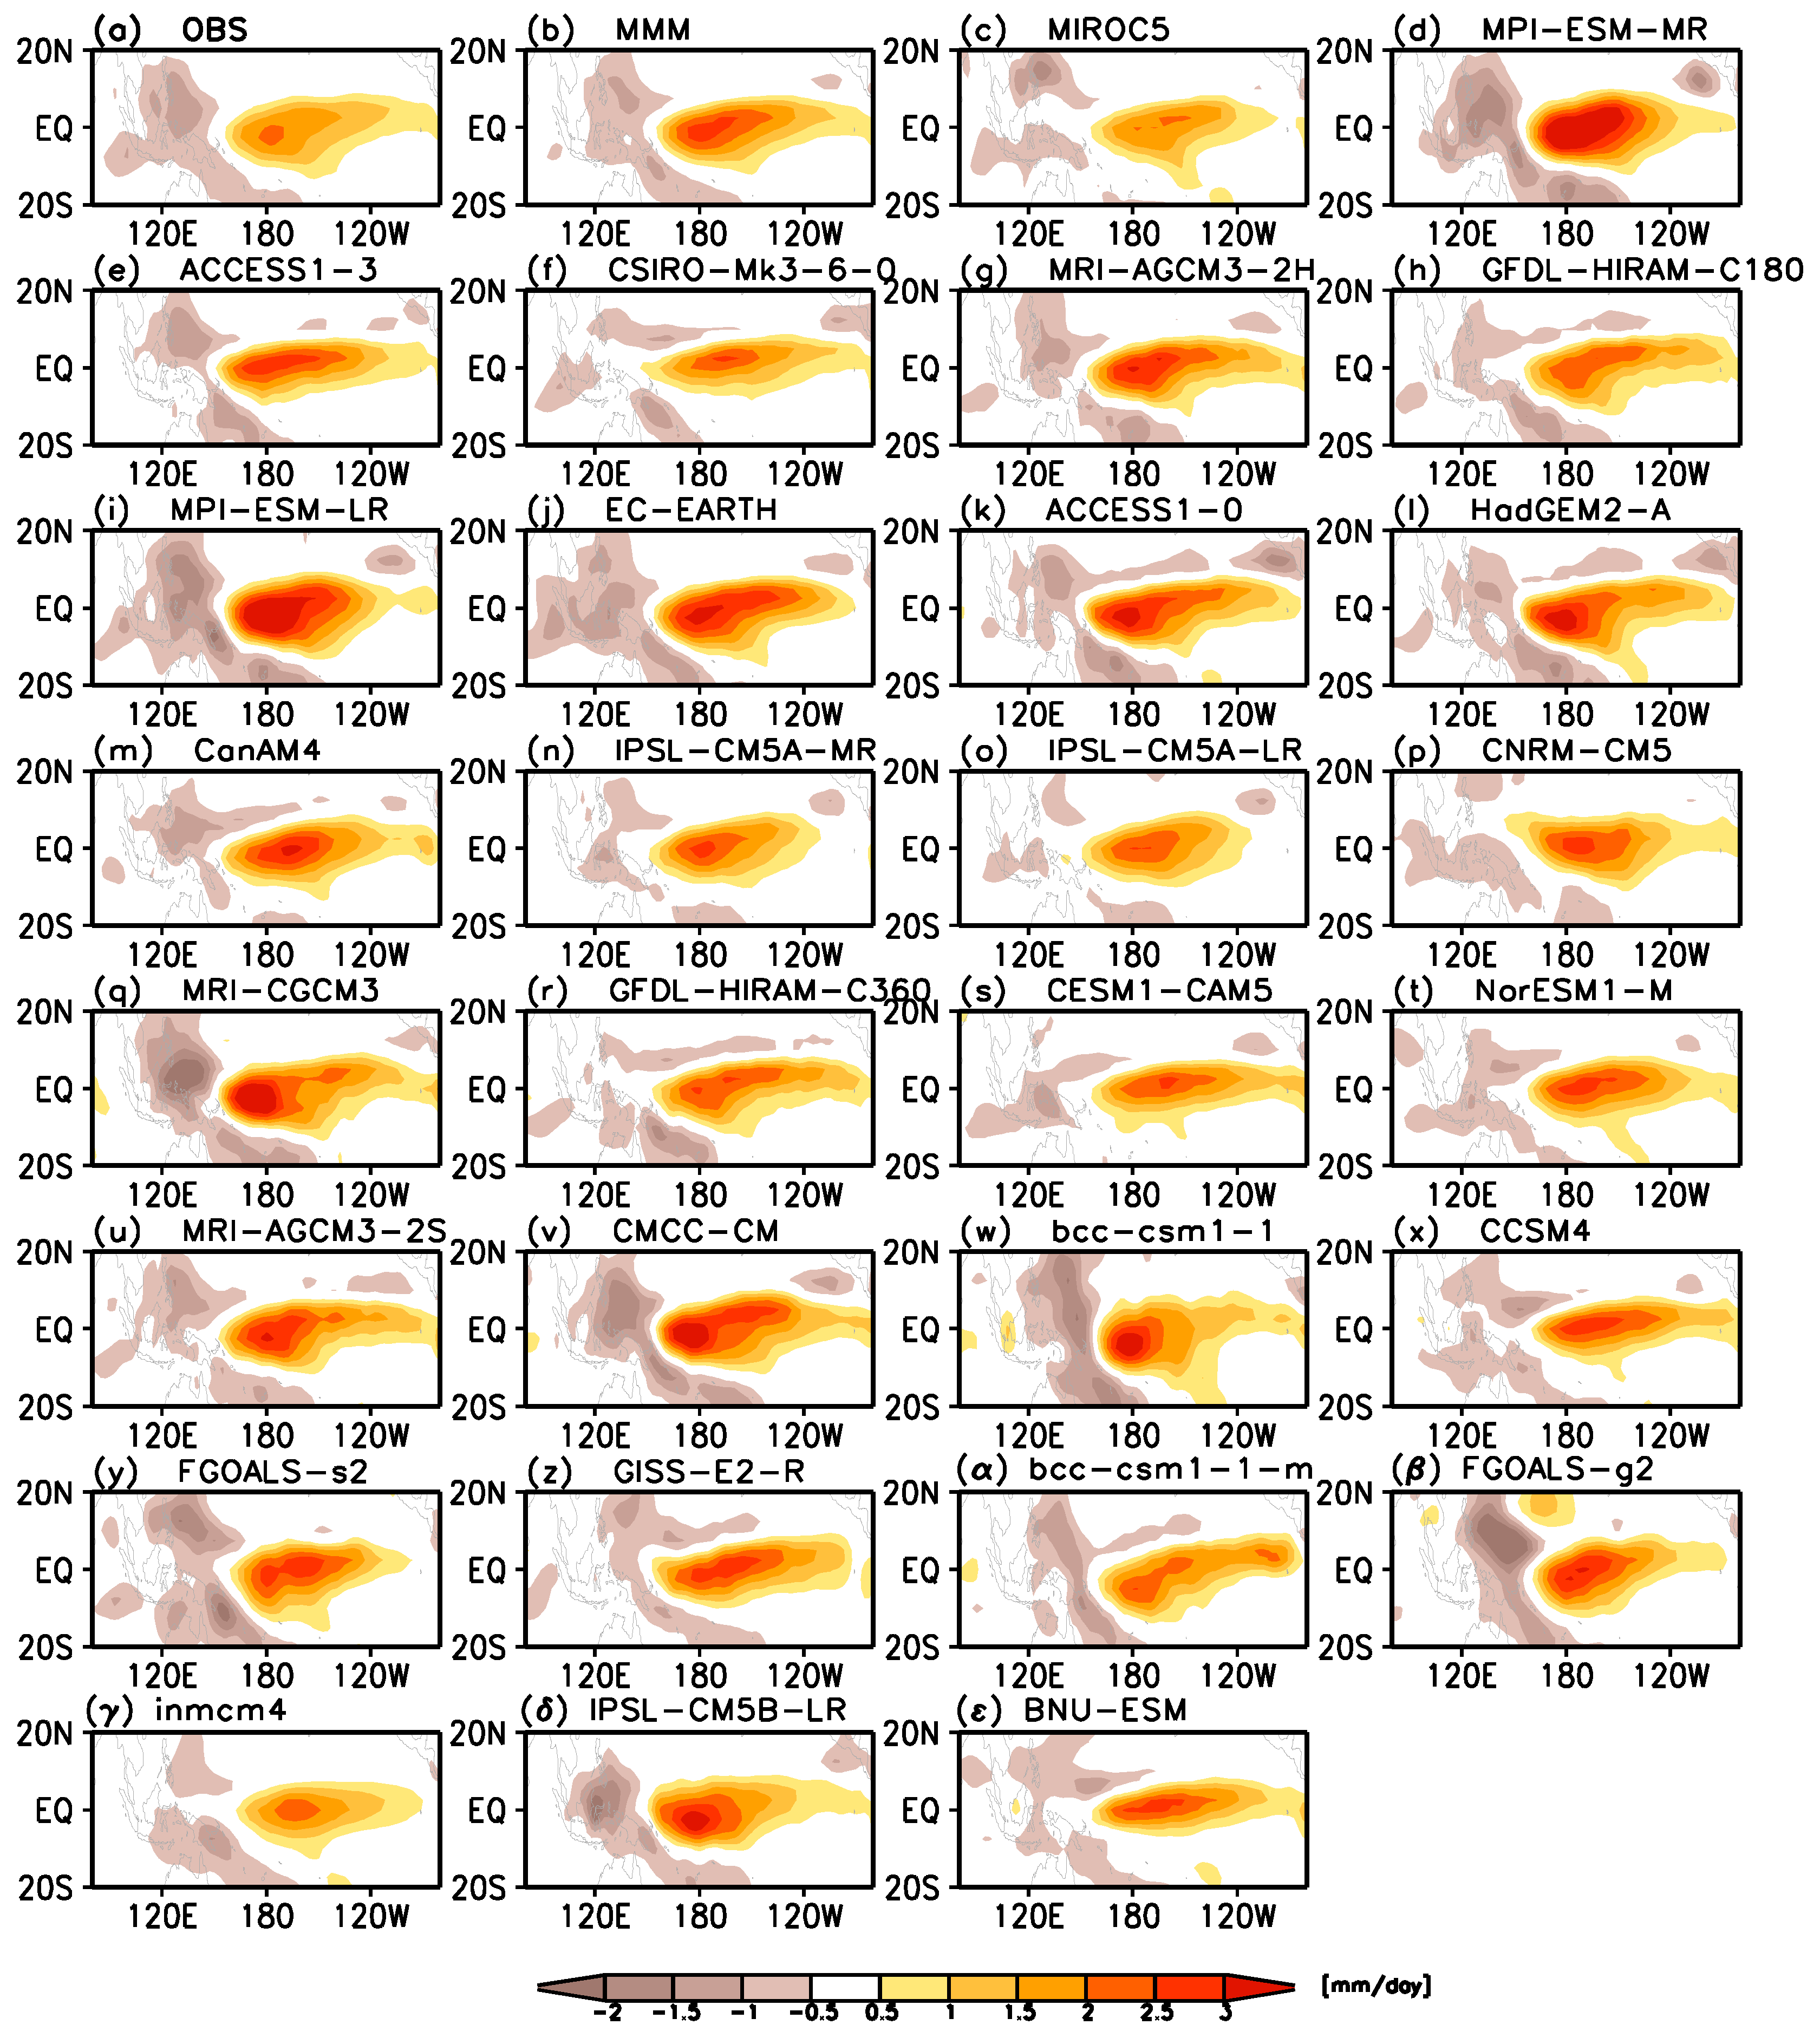
Figure 2). The climate models and MMM (
Figure 2b–ε) simulate the overall features of a positive PRCPA in the central-to-eastern tropical Pacific and a negative PRCPA in the western tropical Pacific associated with ENSO in the observations (
Figure 2a) reasonably. Therefore, a shift in the convection over the Maritime Continent to the central (western) tropical Pacific during El Niño (La Niña) is associated with a weakening (strengthening) of the WC, indicating that a zonal shift of convective forcings is crucial to determine the WC intensity as suggested by previous study (e.g., [
2]).
Figure 1.
WC trends in the 29 models, together with those in the observations (OBS) and MMM of the 29 models. The models are arranged by the magnitude of the strengthening trend of the WC.
Figure 1.
WC trends in the 29 models, together with those in the observations (OBS) and MMM of the 29 models. The models are arranged by the magnitude of the strengthening trend of the WC.
Figure 2.
Regression coefficients of the PRCPA with respect to the normalized NINO3.4 SST index in the observations, MMM, and 29 models. (a) OBS; (b) MMM; (c) MIROC5; (d) MPI-ESM-MR; (e) ACCESS1-3; (f) CSIRO-Mk3-6-0; (g) MRI-AGCM3-2H; (h) GFDL-HIRAM-C180; (i) MPI-ESM-LR; (j) EC-EARTH; (k) ACCESS1-0; (l) HadGEM2-A; (m) CanAM4; (n) IPSL-CM5A; (o) IPSL-CM5A-LR; (p) CNRM-CM5; (q) MRI-CGCM3; (r) GFDL-HIRAM-C360; (s) CESM1-CAM5; (t) NorESM1-M; (u) MRI-AGCM3-2S; (v) CMcC-CM; (w) bcc-csm1-1; (x) CCSM4; (y) FGOALS-s2; (z) GISS-E2-R; (α) bcc-csm1-1-m; (β) FGOALS-g2; (γ) Inmcm4; (δ) IPSL-CM5B-LR and (ε) BNU-ESM.
It is found that there are slight differences in the centers and the magnitudes of the ENSO-related PRCPA in the tropical Pacific between the MMM and the observations. The centers of the ENSO-related PRCPA in the MMM are located around 190°E in the central-to-eastern tropical Pacific and 137.5°E in the western tropical Pacific, whereas those in the observations are 185°E and 127.5°E, respectively (
Figure 2a,b). This indicates that the ENSO-related PRCPAs in both regions are slightly shifted to the east in the MMM compared to the observations. Simply, this result indicates that a zonal contrast of the ENSO-related PRCPA in the tropical Pacific might be associated with the difference of the WC trend between the MMM and the observations (see
Figure 1). In detail, there is a large diversity in the pattern of the ENSO-related PRCPA among climate models. The location of the center of the ENSO-related PRCPA is different in the central-to-eastern tropical Pacific as well as in the western tropical Pacific in the CMIP5 AMIP simulations.
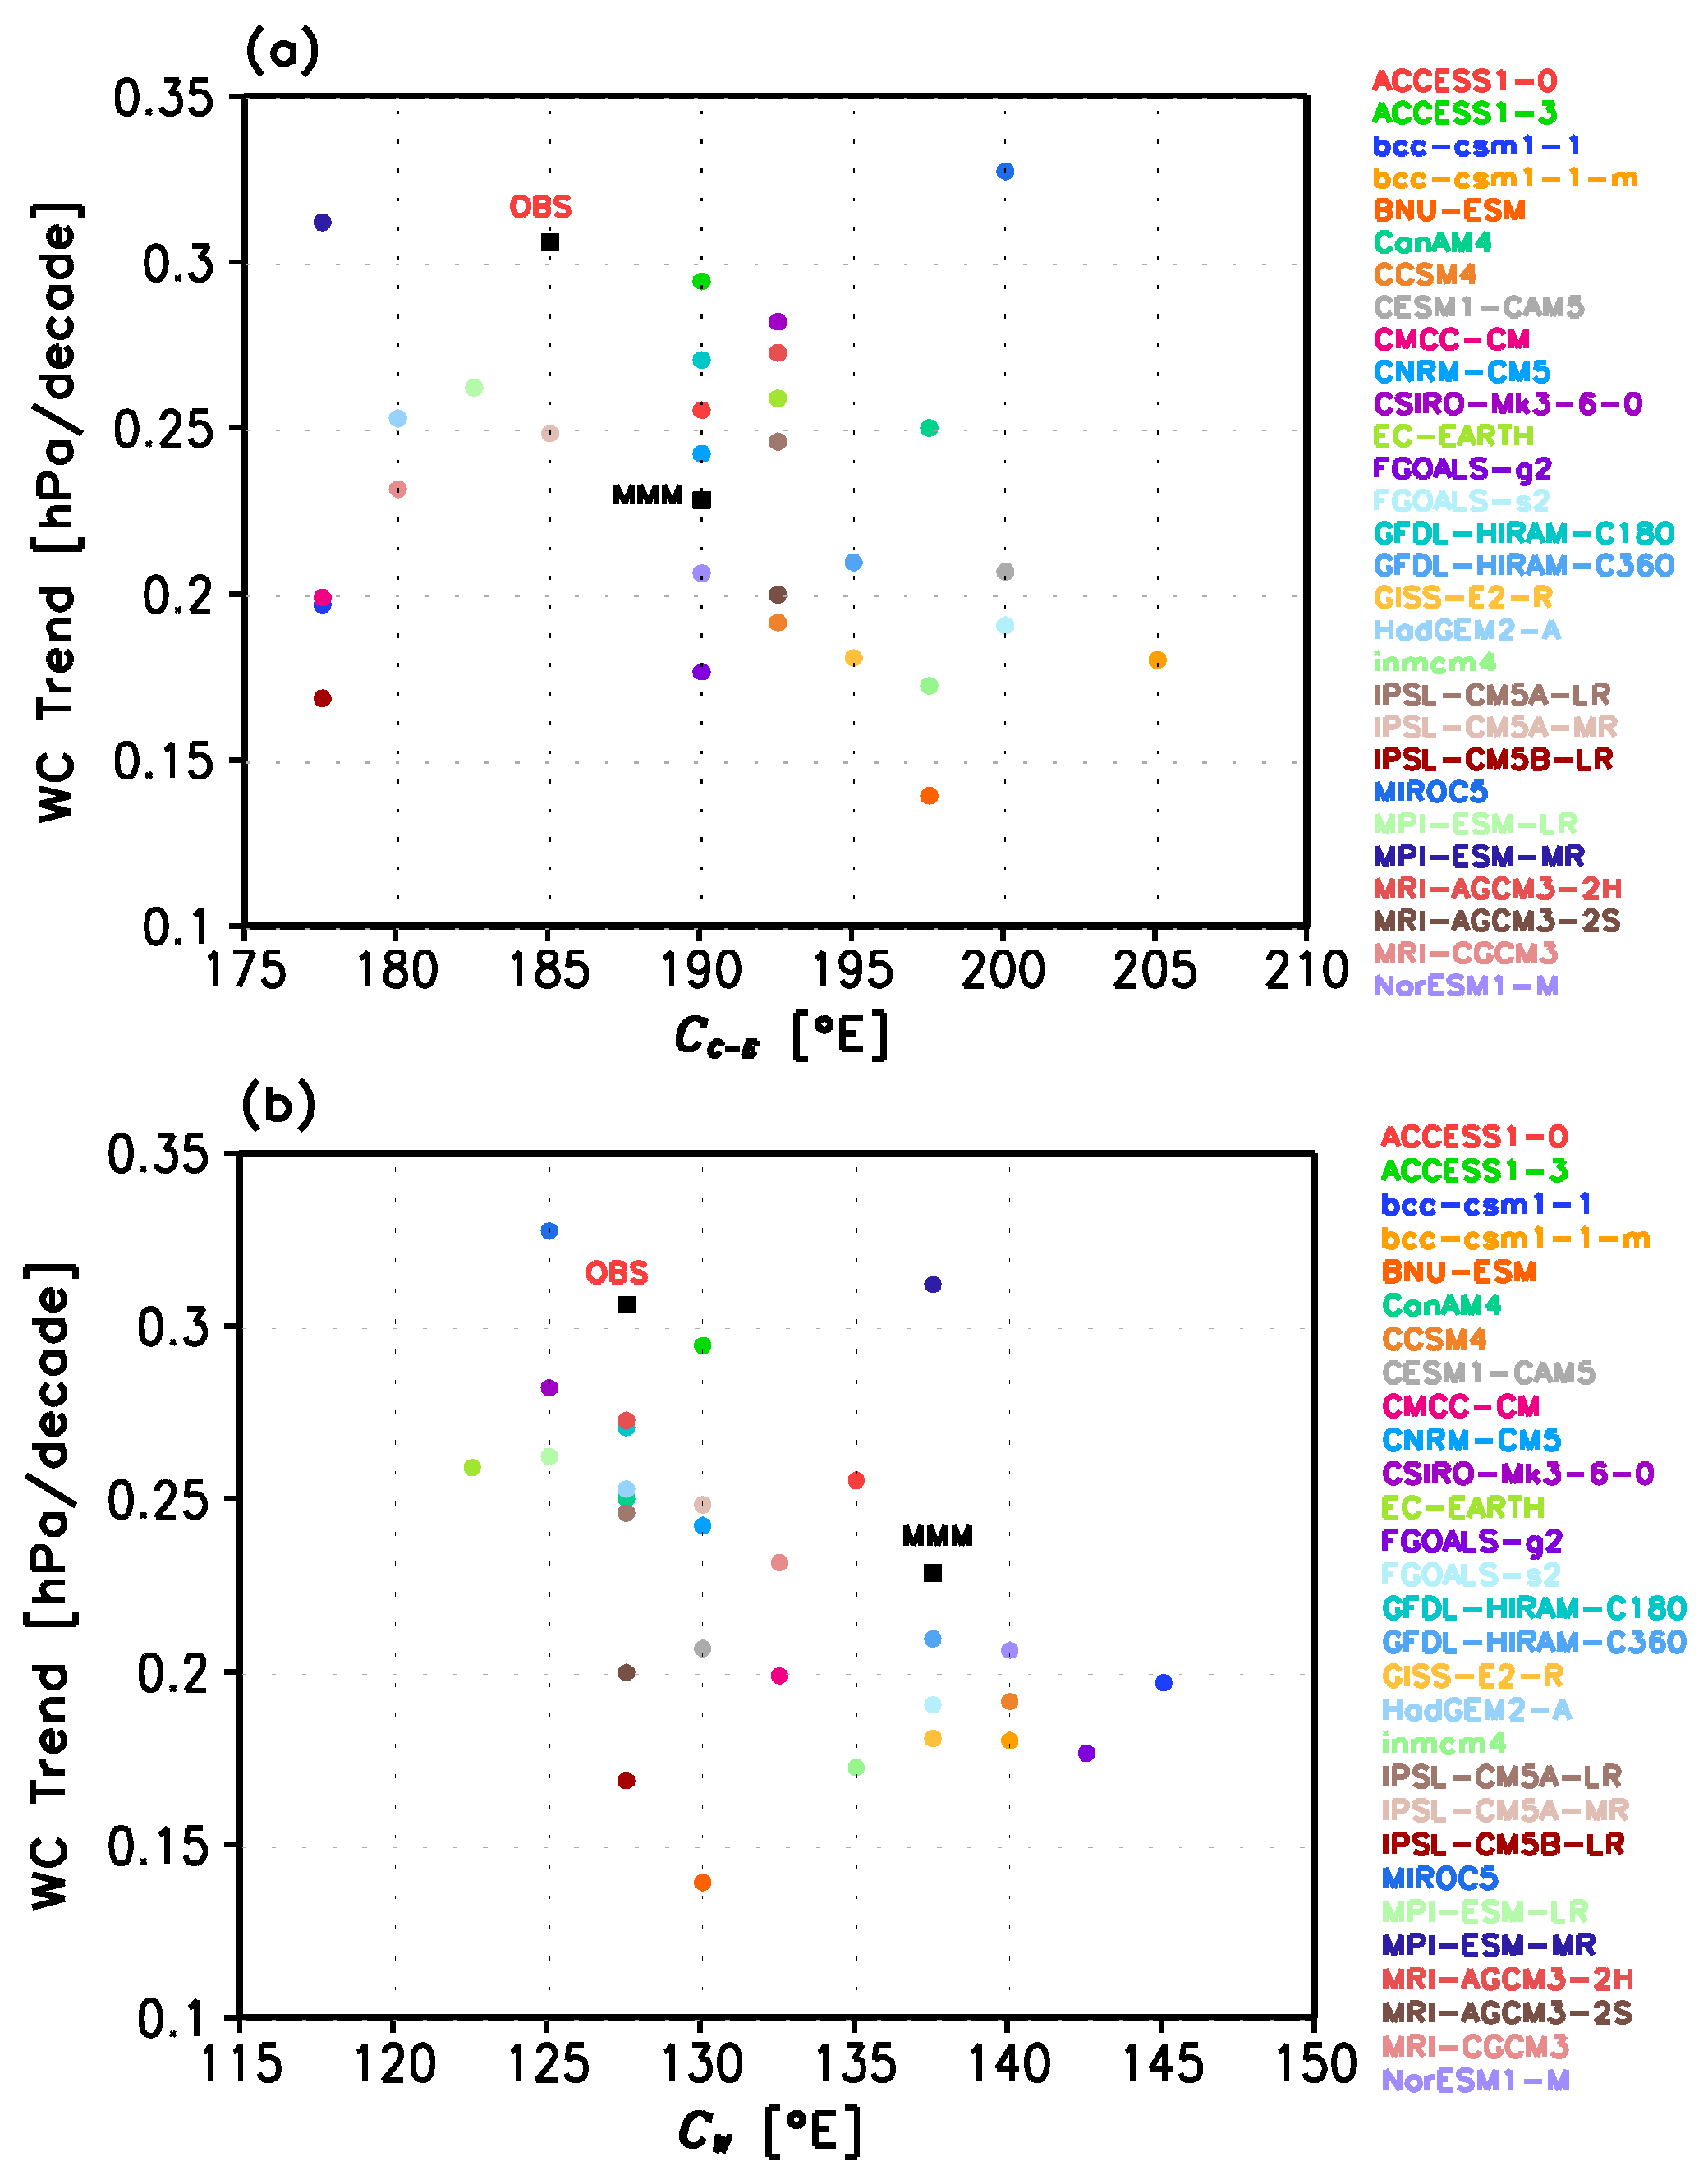
To further examine how the WC trend is related to the ENSO-related PRCPA in the climate models, we plot scatter diagrams of the WC trend and the longitudinal position of the center of the ENSO-related PRCPA (
Figure 3). In order to separate the roles of the ENSO-related PRCPA in the central-to-eastern tropical Pacific and the western tropical Pacific, respectively, we define each center of ENSO-related PRCPA in the two regions,
i.e.,
CC-E and
CW. These are defined as the longitudes in which the ENSO-related PRCPA averaged over 5°S–5°N and 0–20°N are the maximum and minimum values, respectively. The correlation coefficient between the WC trend and
CC-E in the climate models is only −0.15, which is not statistically significant (
Figure 3a). On the other hand, the correlation coefficient between the WC trend and
CW is −0.49, which is statistically significant at the 95% confidence level in spite of a large inter-model diversity among individual climate models (
Figure 3b). This result indicates that the longitudinal position of the ENSO-related PRCPA in the western tropical Pacific is closely related to the magnitude of the WC trend. More specifically, the strengthening of the WC trend is larger (smaller) in the climate models in which the ENSO-related PRCPA in the western tropical Pacific is located more westward (eastward). When the ENSO-related PRCPA in the western tropical Pacific is located more westward (eastward), the convection center is shifted less (more) eastward during El Niño and is shifted more (less) westward during La Niña, resulting in a smaller (larger) weakening of the WC during El Niño and a larger (smaller) strengthening of the WC during La Niña. Therefore, our results indicate that the zonal shift of the ENSO-related PRCPA in the western tropical Pacific could play a role in modifying the WC trend in the presence of inhomogeneous SST warming conditions (
i.e., AMIP simulations). In other words, the ENSO-related convective forcings in the western tropical Pacific, where the ascending branch of the WC exists, could play a role in modulating the WC trend in climate models under the same SST conditions.
Meanwhile, it should be noted that
CC-E and
CW are not correlated in the 29 climate models (correlation coefficient of 0.17), indicating that
CC-E and
CW appeared to be independent of each other in the CMIP5 models. This result also indicates that the factors that forced the ENSO-related PRCPA in the central-to-eastern
versus the western tropical Pacific are different in the climate models. That is, the positive PRCPA in the central-to-eastern Pacific is mainly attributed to positive SST anomalies in the central-to-eastern Pacific, whereas the negative PRCPA in the western tropical Pacific is influenced by local atmosphere-ocean interactions as well as remote SST forcings from the Indian Ocean during El Niño [
28,
29,
30,
31,
32,
33,
34,
35,
36,
37]. In spite of no atmosphere-ocean interactions in the AMIP simulations, this implies that the ENSO-related convective forcings in the western tropical Pacific could contribute to the WC trend projected in the climate models.
The relationship between the WC trend and longitudinal position of the El Niño– and La Niña–related PRCPA in the western tropical Pacific also needs to be further examined.
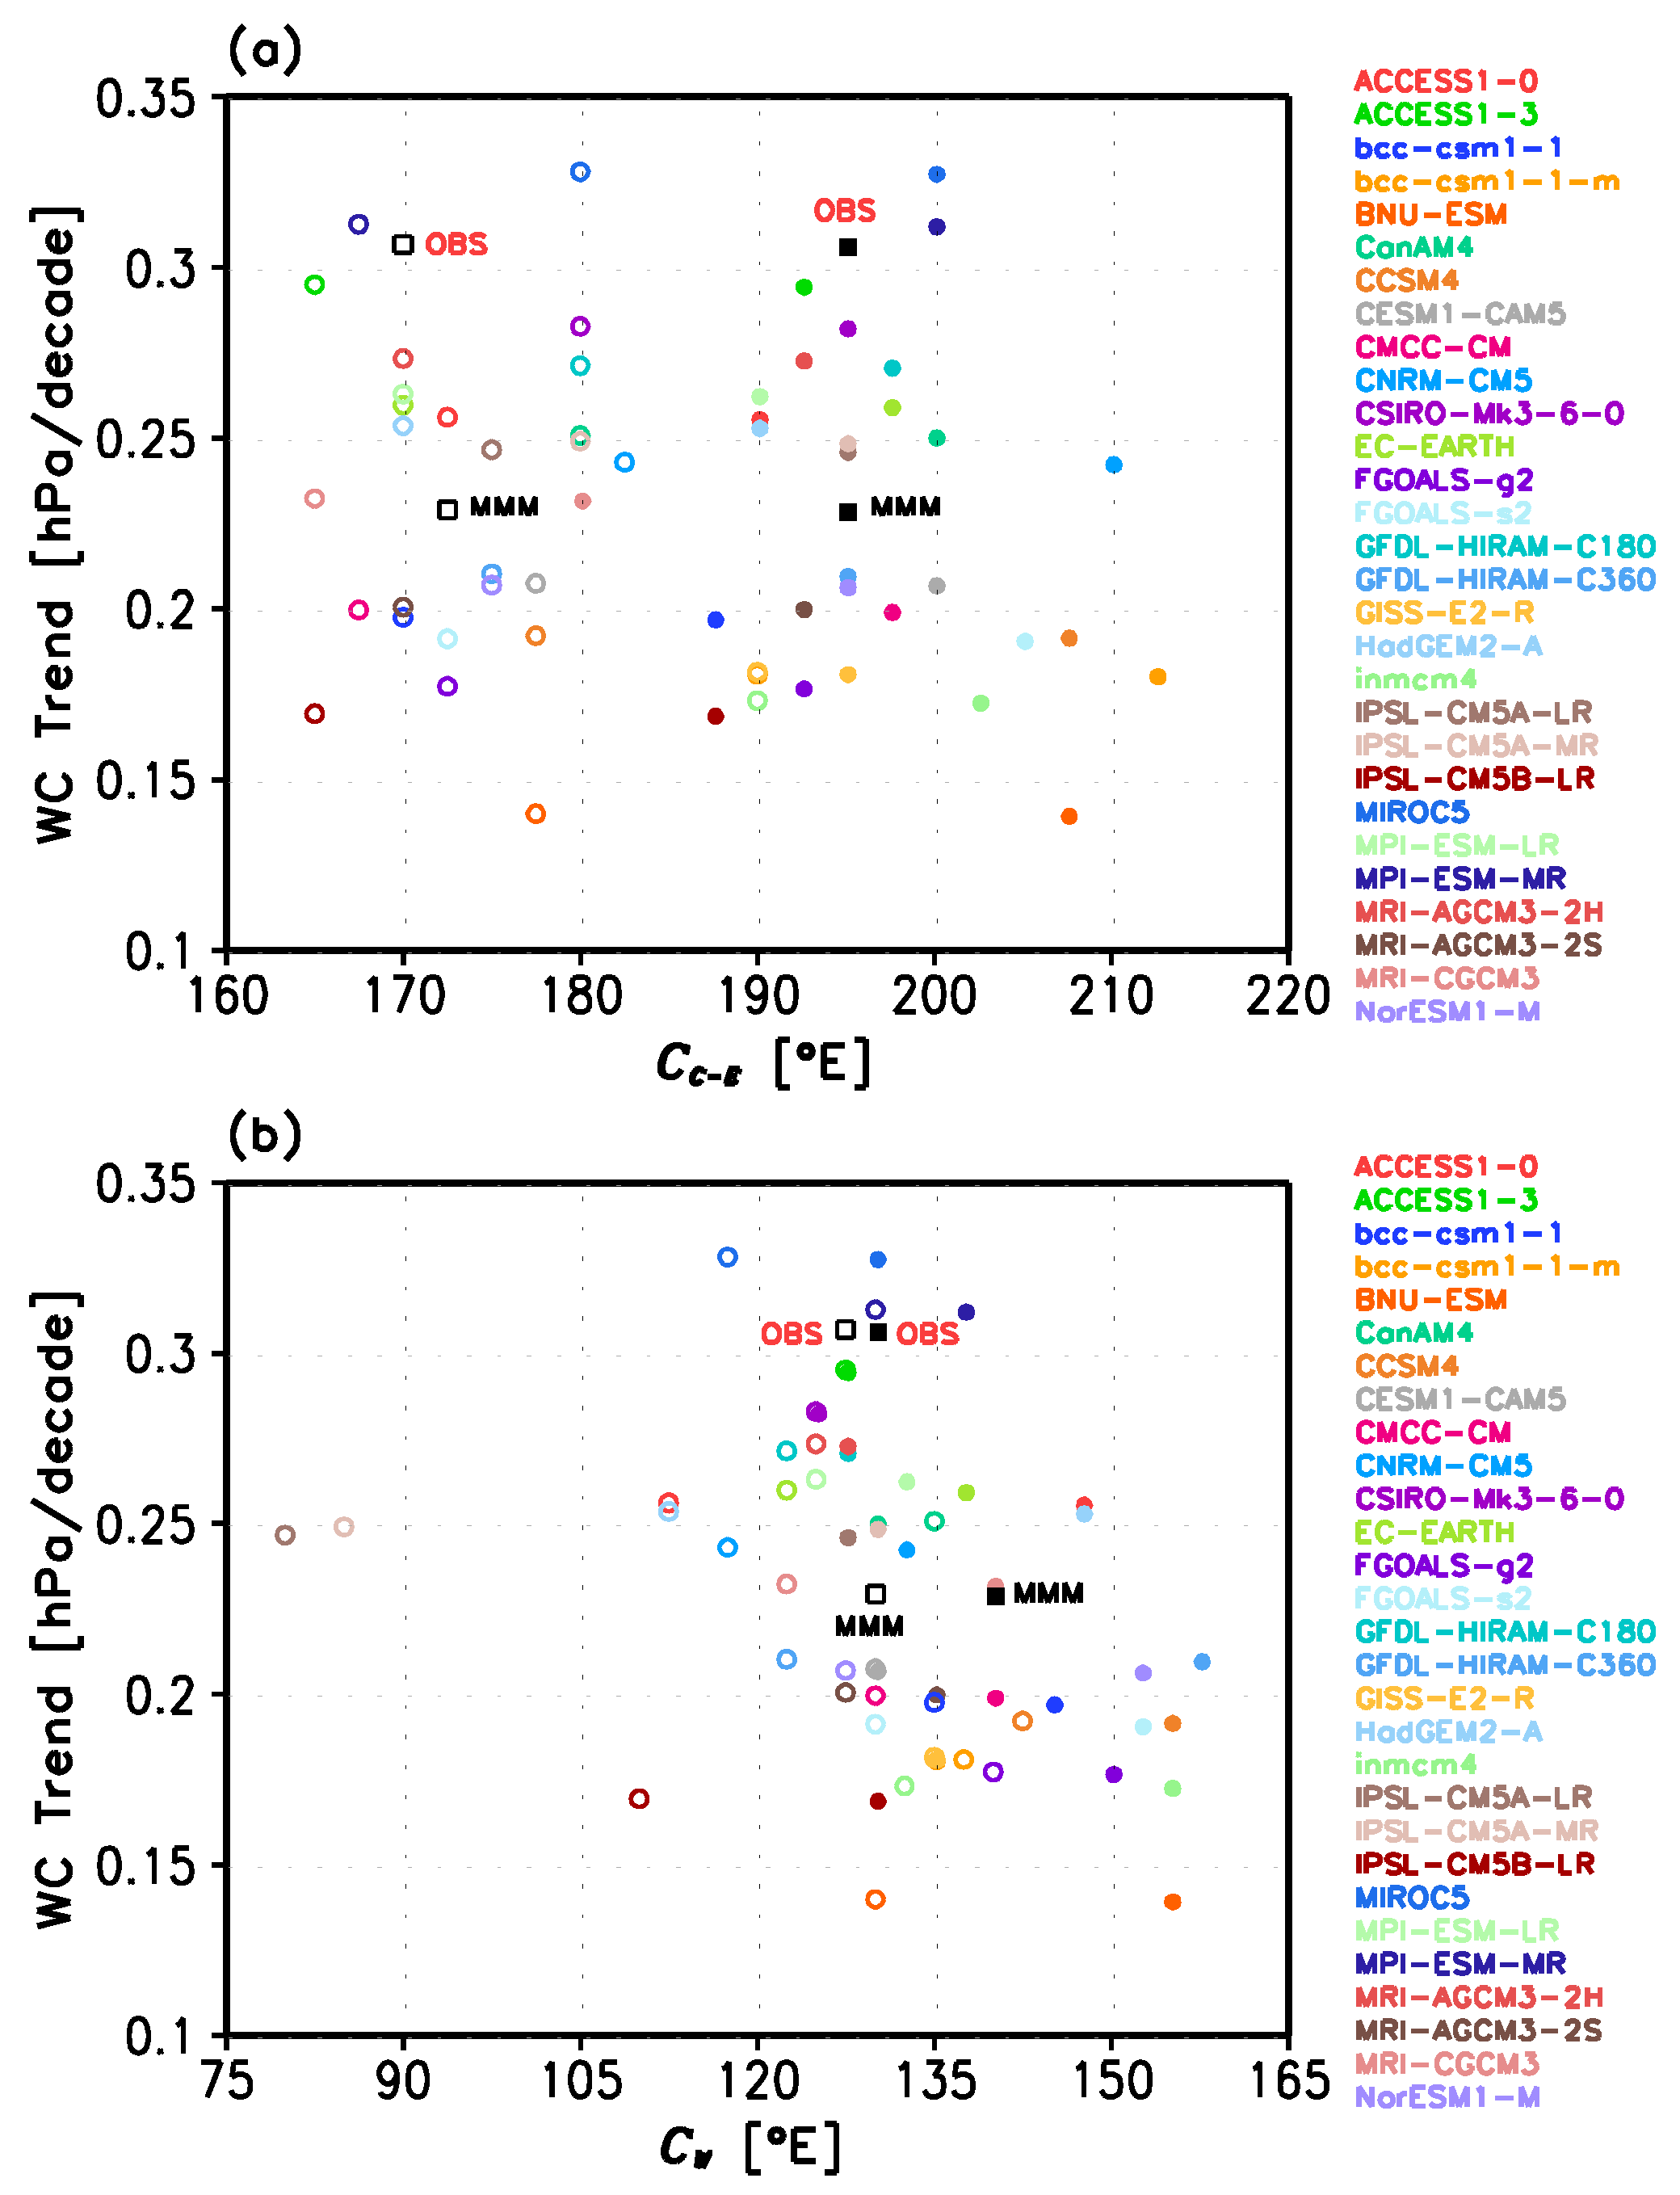
Figure 4a,b show scatter diagrams of the WC trend
versus CC-E and
CW during El Niño and La Niña, respectively. Here,
CC-E and
CW are calculated for each model in the same way as in
Figure 3, from the composite of the PRCPA pattern during El Niño and La Niña. Note that El Niño and La Niña events are defined as when the NINO3.4 SST index exceeds its positive and negative one standard deviation, respectively.
Figure 3.
Scatter diagrams of the WC trend versus the longitudinal positions of the center of the ENSO-related PRCPA in the (a) central-to-eastern tropical Pacific (5°S–5°N) and the (b) western tropical Pacific (0–20°N) regions in the 29 models, together with those in the observations and the MMM.
Figure 3.
Scatter diagrams of the WC trend versus the longitudinal positions of the center of the ENSO-related PRCPA in the (a) central-to-eastern tropical Pacific (5°S–5°N) and the (b) western tropical Pacific (0–20°N) regions in the 29 models, together with those in the observations and the MMM.
Figure 4.
Same as
Figure 3a,b, but during El Niño (closed marks) and La Niña (open marks).
Figure 4.
Same as
Figure 3a,b, but during El Niño (closed marks) and La Niña (open marks).
The climate models simulate an overall feature of a zonal shift of ENSO-related PRCPA reasonably, by showing that both
CC-E and
CW during El Niño are mostly located to the east compared to those during La Niña. Consistent to
Figure 3a, the correlation coefficients between the WC trend and
CC-E during El Niño and La Niña are low, with correlation coefficients of −0.20 and −0.22, respectively (
Figure 4a). On the other hand, the correlation coefficients between the WC trend and
CW are −0.56 and −0.32 during El Niño and La Niña, respectively, which is statistically significant at the 95% confidence level for El Niño (
Figure 4b). This indicates that the longitudinal position of the El Niño–related PRCPA in the western tropical Pacific could strongly affect the WC trend in the climate models. In other words, it indicates that when the negative El Niño–related PRCPA in the western tropical Pacific is located more westward, a weakening of the WC during El Niño could be suppressed and thus the strengthening of WC trend could become larger under the same SST-constrained conditions.
Then, the remaining question is why the longitudinal position of the ENSO-related PRCPA is different among the climate models in the AMIP simulations. As an attempt to explain it, we argue that such differences in the ENSO-related PRCPA might be associated with the differences in the climatological mean precipitation in the climate models. For example, previous studies showed that climatological dryness in the central-to-eastern tropical Pacific could confine the ENSO-related convection to the western tropical Pacific [
38,
39,
40,
41,
42]. We plot the regression coefficients of climatological mean (1979–2005) precipitation with respect to the
CW (see
Figure 3b) in the 29 AMIP climate models (
Figure 5). Note that the spatial distribution of the correlation coefficient between the climatological mean precipitation and the
CW is similar to
Figure 5 (not shown figure). It is found that the ENSO-related PRCPA in the western tropical Pacific tends to be shifted more westward in climate models in which the climatological mean precipitation is drier in the off-equatorial western Pacific and the central-to-eastern tropical Pacific. It is also found that the correlation coefficient between the WC trend and climatological mean precipitation averaged over the off-equatorial western Pacific (90°E–130°E, 10°N–20°N) and the central-to-eastern tropical Pacific (160°W–100°W, 5°S–5°N) is −0.48, which is statistically significant at the 95% confidence level. Our result indicates that the dryness of the climatological mean precipitation in the off-equatorial western Pacific and the central-to-eastern tropical Pacific could contribute to the westward shift of a center of the ENSO-related PRCPA in the western tropical Pacific, which is associated with the strengthening of the WC trend. Note that the WC trend is not directly related to the climatological mean WC intensity, with a correlation coefficient of 0.08.
Figure 5.
Regression coefficients of climatological mean (1979–2005) precipitation with respect to the one standard deviation westward shift of CW in the 29 models. One standard deviation of CW is 5.9° and the areas with dots are significant at the 90% confidence level. Contours represent the climatological mean precipitation in the MMM.
4. Summary and Discussion
We investigated how the WC trend for 1979–2005 was related to the ENSO-related PRCPA on interannual timescales by analyzing the same SST-constrained AMIP simulations of the 29 CMIP5 models. Our results showed that all of the models used in this study projected a strengthening of the WC trend in response to an increase in the SST zonal gradient along the equator. Despite the same SST-constrained conditions, however, a considerable diversity in the magnitude of the strengthening of the WC trend existed among the climate models.
It was found that the longitudinal position of the center of the ENSO-related PRCPA in the western tropical Pacific is closely related to the WC trend in the climate models. The strengthening of the WC trend is large (small) in CMIP5 AMIP simulations in which the ENSO-related PRCPA in the western tropical Pacific was located more westward (eastward). In particular, the westward shift of the El Niño–related PRCPA in the western tropical Pacific is associated with a strengthening of the WC trend. It is known that the intensity of WC becomes weak during El Niño on interannual timescales (e.g., [
2]). Therefore, the westward shift of the El Niño–related PRCPA acts to suppress the relationship of WC intensity and El Niño on interannual timescales, contributing to the strengthening of WC trend under the same SST-constrained conditions. Therefore, the ENSO-related precipitation in the tropical Pacific could play a secondary role to determine the WC trend in climate models. Further analysis also suggested that the dryness of the climatological mean precipitation in the off-equatorial western Pacific and the central-to-eastern tropical Pacific could contribute to shifting a center of the ENSO-related PRCPA in the western tropical Pacific more westward on interannual timescales, resulting in the strengthening of the WC trend for a substantial period of time. This indicates that the diversity of the WC trend in the CMIP5 AMIP simulations might be closely associated with how the climate models simulate the climatological mean precipitation in the tropical Pacific.
The present study showed that the location of the ENSO-related PRCPA in the western tropical Pacific is closely related to the WC trend; in addition, the location of the ENSO-related PRCPA is associated with the climatological mean precipitation in the tropical Pacific. However, there exist some discrepancies among individual climate models. Therefore, it needs to be further explored why the ENSO-related PRCPA and climatological mean precipitation differ among individual models even in the same SST-constrained conditions. It could be useful to consider other coherent features of climate models, such as convection scheme and land surface processes, that may affect cloud and atmospheric circulation in the tropics.
While we mainly emphasize the role of ENSO-related convection to examine factors that could affect the WC intensity in the AMIP simulations, how our results could be applied for the CMIP simulations may need to be discussed. Further analysis based on the 21 CMIP5 climate models with both the AMIP and CMIP simulations shows that the WC trend in the historical run (1979–2005) is highly correlated with the SST zonal gradient trend (correlation coefficient of 0.94) (not shown figure). This indicates that the WC trend is primarily controlled by the SST zonal gradient trend in the CMIP simulations as well, as noted by previous studies [
22,
24]. Nonetheless, the SST zonal gradient trend in the historical run is associated with the WC trend in the AMIP simulations, with a correlation coefficient of −0.44 (statistically significant at the 90% confidence level). Therefore, climate models in which the ENSO-related PRCPA in the western tropical Pacific shifts more westward in the AMIP simulations tend to simulate a decrease in the SST zonal gradient in the CMIP simulations. In other words, climate models simulating the dryness of climatological precipitation in the tropical Pacific also tend to simulate a decrease in the SST zonal gradient in the CMIP simulations, leading to a weakening of the WC trend. This indicates that some features associated with the atmospheric circulation of climate models (
i.e., the ENSO-related convection and climatological mean precipitation) could affect the inter-model diversity in the WC trend.


