Article

Analysis of PAHs Associated with Particulate Matter PM2.5 in Two Places at the City of Cuernavaca, Morelos, México

by
Hugo Saldarriaga-Noreña
1,*,
Rebecca López-Márquez
1,
Mario Murillo-Tovar
1,2,
Leonel Hernández-Mena
3,
Efrén Ospina-Noreña
4,
Enrique Sánchez-Salinas
5,
Stefan Waliszewski
6 and
Silvia Montiel-Palma
1
1
Centro de Investigaciones Químicas, IICBA, Universidad Autónoma del Estado de Morelos, Cuernavaca 62209, Mexico
2
Centro de Investigaciones Químicas, IICBA, Universidad Autónoma del Estado de Morelos, Consejo Nacional de Ciencia y Tecnología, Cuernavaca 62209, Mexico
3
Centro de Investigación y Asistencia en Tecnología y Diseño del Estado de Jalisco, Guadalajara 44270, Mexico
4
Facultad de Ciencias Agrarias, Departamento de Agronomía, Universidad Nacional de Colombia, Bogotá 111321, Colombia
5
Centro de Investigación en Biotecnología, Universidad Autónoma del Estado de Morelos, Cuernavaca 62209, Mexico
6
Instituto de Medicina Forense, Universidad Veracruzana, Veracruz 91980, Mexico
*
Author to whom correspondence should be addressed.
Atmosphere 2015, 6(9), 1259-1270; https://doi.org/10.3390/atmos6091259
Submission received: 11 July 2015 / Revised: 14 August 2015 / Accepted: 15 August 2015 / Published: 25 August 2015
(This article belongs to the Special Issue Atmospheric Composition Observations)

Abstract

:
This study was carried out between January and February 2013, at two sites in the city of Cuernavaca, México, using low-volume equipment. Fifteen Polycyclic aromatic hydrocarbons (PAHs), were identified by gas chromatography coupled with mass spectrometry. The total average concentration observed for PAHs was 24.0 ng·m−3, with the high molecular weight compounds being the most abundant. The estimated equivalent concentration for Benzo (a) P (BaPE) was 4.05 ng·m−3. Diagnostic ratios together with the principal components analysis (PCA) allowed for establishing coal burning and vehicle emissions as being the main sources of these compounds in the area. The PAHs used to calculate this index account for 51% of the 15 PAHs identified, which probably involves a risk to the exposed population.

1. Introduction

Polycyclic aromatic hydrocarbons (PAHs) are one of the most studied families of organic compounds present in the atmosphere, given their proven negative effects on health and persistence in the environment. Different PAHs, specifically those with high molecular weight, which predominate in the particulate phase of atmospheric aerosols, have shown to be carcinogenic [1].
It is also known that PAHs accumulated in particles are mainly associated with fine particulate matter (PM2.5). These fine particles are better able to penetrate the respiratory system, which increases their potential health effects [2,3].
PAHs are produced by incomplete combustion and pyrolysis of fossil fuels such as oil and coal, and from other organic materials from natural and anthropogenic sources [4,5,6], including vehicle emissions, wood burning, waste incineration, coke production, and metal production [7,8,9].
Their concentrations in ambient air are lower in rural than in urban and suburban areas. Moreover, they can have different profiles depending on the geographical location, the type of sources and the dominant atmospheric characteristics [10]. To identify possible sources of these compounds, diagnostic ratios were used. However, these should be used with caution, because sometimes the discrimination between these compounds is difficult, taking into account the reactivity of some of the PAHs with species such as NOx, O3, etc. [11].
For the city of Cuernavaca, there is little information on the chemical characterization of PM2.5, specifically in determining PAHs. Therefore, the present study has as its main objective to determine ambient levels of these compounds and their possible sources. The results will serve as a basis for mitigation programs of air pollution and/or generation of regulatory standards for the environmental authorities responsible for monitoring of air quality.

2. Results and Discussion

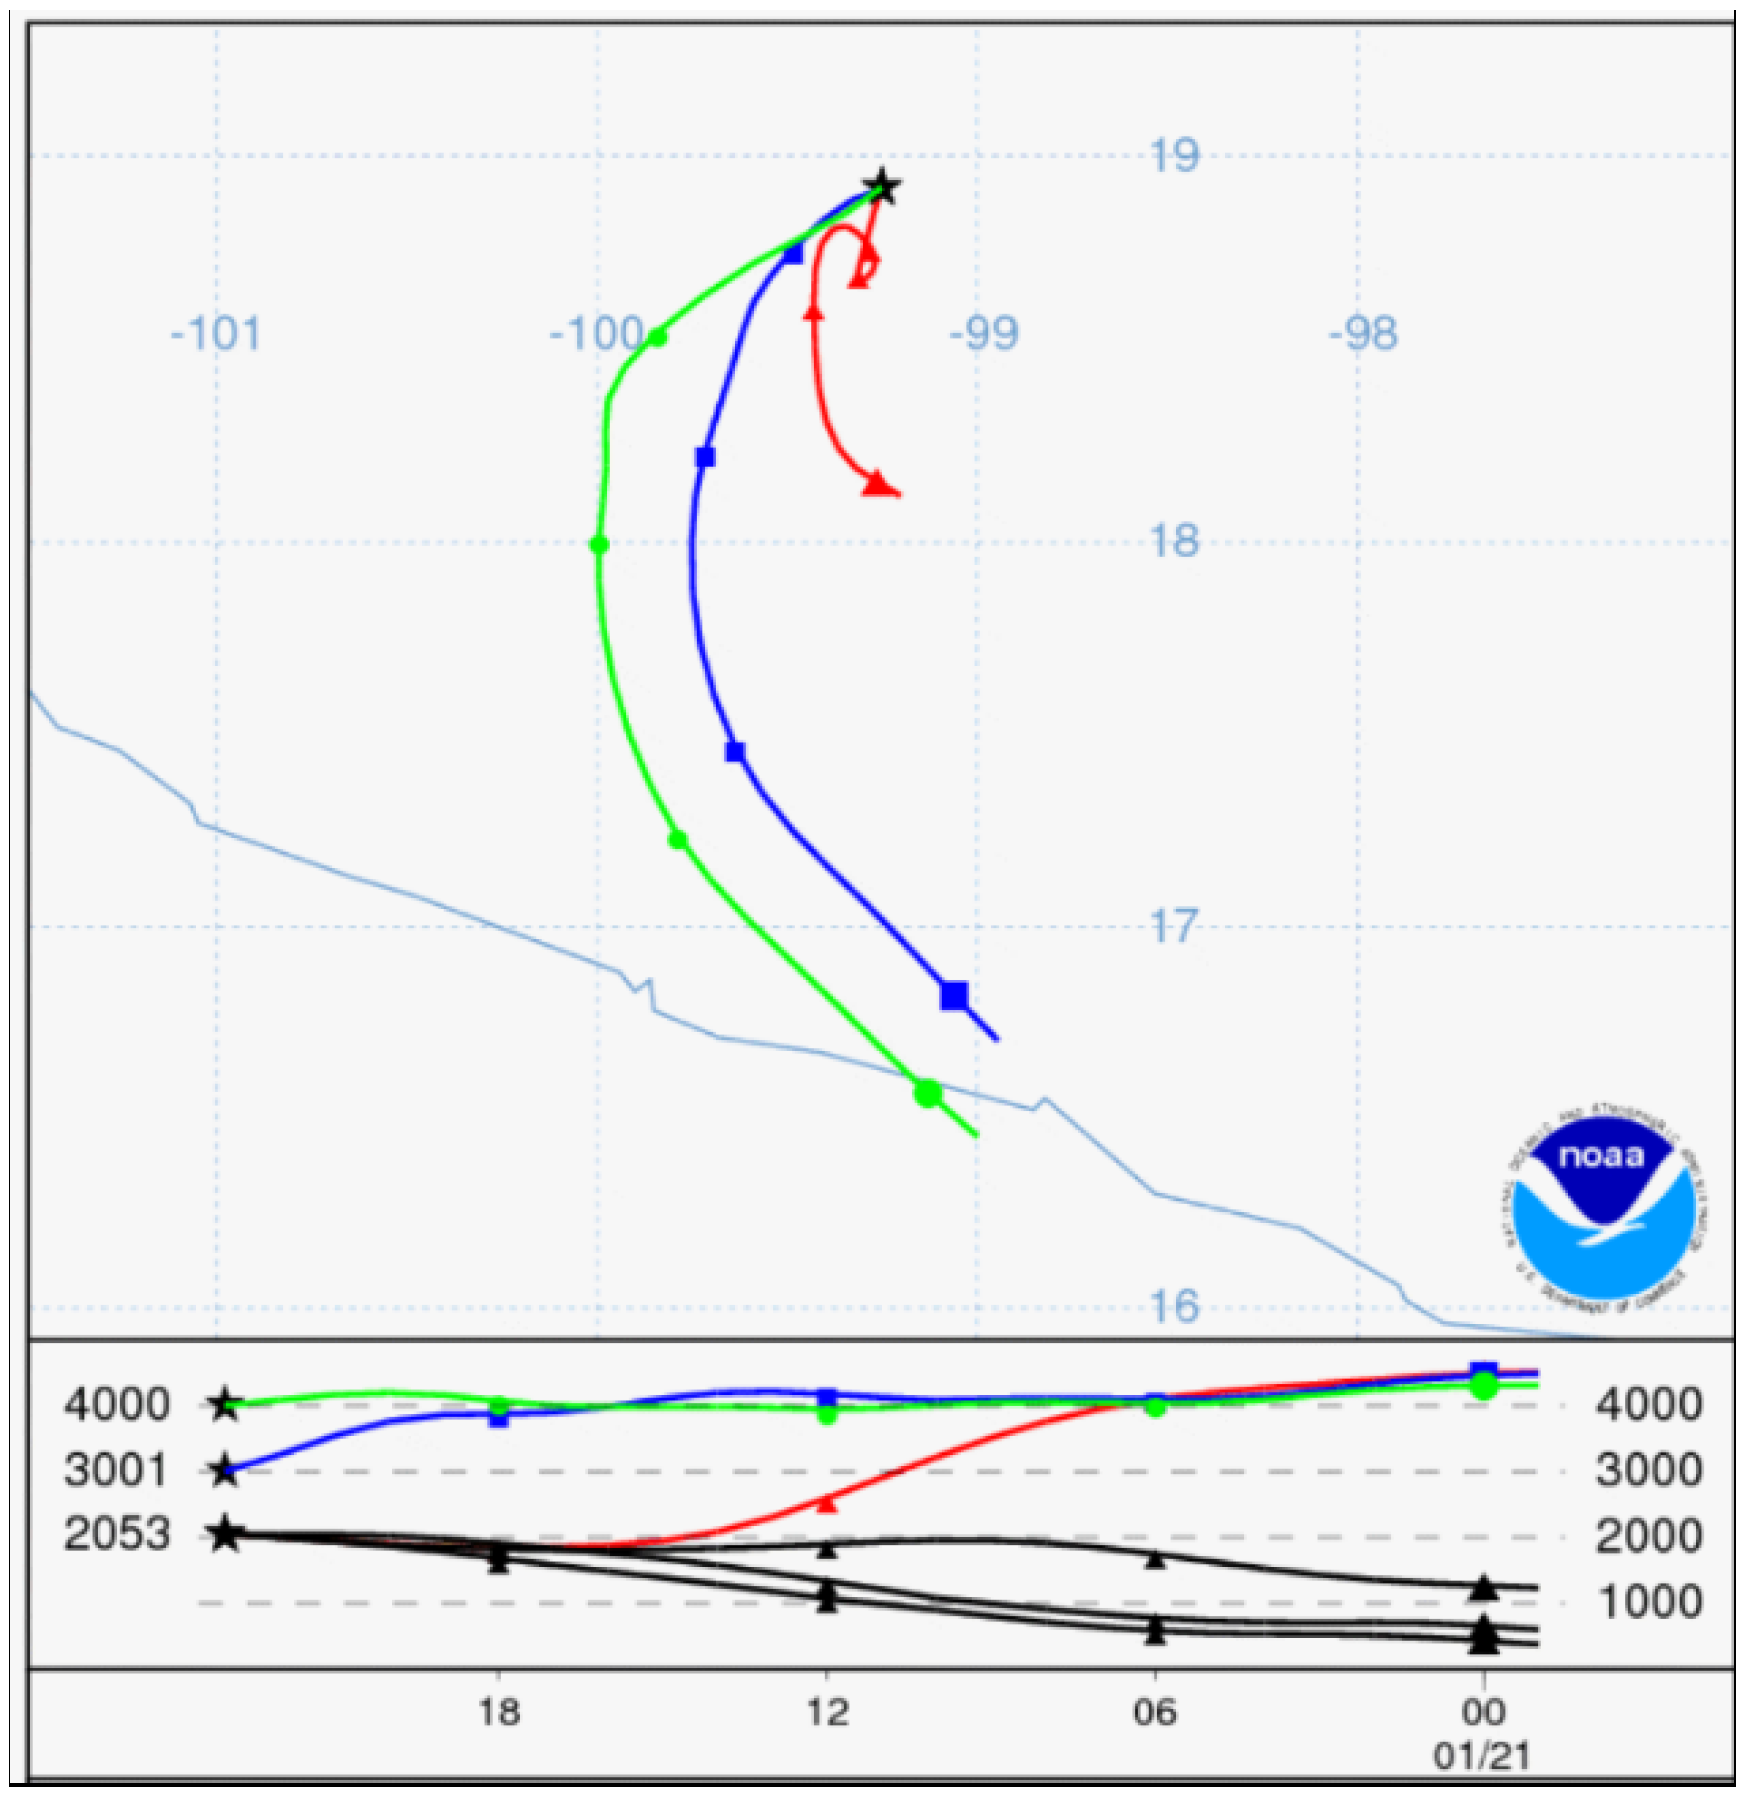
2.1. Wind Trajectories

During the study period, the winds came mainly from the southeast of the state (66%), which probably suggests that part of air pollutants identified in the Autonomous University of State of Morelos (in the north) had its origin in the industrial zone of the city (located to the south) and the downtown area of the city. However, other possible sources could be the emissions from the Popocatepetl volcano, located to the south east of the State (Figure 1).
Figure 1. Behavior of wind trajectories in Cuernavaca during January and February 2013. Source: 18°55′N, 99°13′W, heights: 1000, 2000 and 3000 m above mean sea level (a.m.s.l.).
Atmosphere 06 01259 g001

2.2. Concentration of PAHs

PAHs with 2 and 3 aromatic rings (Acen, Ace, Flu, Phe and Ant) showed the lowest levels of concentration at both sites, whereas those with 4–6 rings (Flt, Pyr, BaA, Chr, BbF, BkF, BaP, IP, DBahA, BghiP) were the most abundant. This suggests that the combustion of gasoline constitutes one of the main sources of these compounds in the study area, which is consistent with that observed by Zielinska et al. 2004 [12].
At the downtown site the average total PAHs concentration was 22.57 ng∙m−3 (Σ15 PAHs), while that at the CIQ site was 25.43 ng∙m−3 (Σ15 PAHs), indicating that there were no statistically significant differences in the concentration of this family of compounds between sites (p < 0.05). Such behavior suggests relatively stable atmospheric conditions or similar emission sources in the study area (Table 1). Also the proximity of the University Campus to the México-Cuernavaca highway, probably is affecting the concentration of PAHs in this area, as well as transportation from the southern part of the city, such as was seen in the wind field.

2.3. Comparison with Other Studies

Comparisons with other studies, were carried out using the average between the two study sites. The average total concentration in Cuernavaca (24.0 ng∙m−3, Σ15 PAHs) was similar to that reported in Taichung, China (22.29 ng∙m−3, Σ15 PAHs) [13] and in Seoul, Korea (26.14 ng∙m−3, Σ14 PAHs) [14]. It was lower than that reported for Nanjing (62.58 ng∙m−3, Σ15 PAHs) [6] and Jinzhou, China (190.86 ng∙m−3, Σ13 PAHs) [15]. All these places have the characteristic of being large urban areas with high vehicular activity. However, the average total concentration was higher than that reported in Atlanta, USA (1.52 ng∙m−3, Σ15 PAHs) [16], Wanqingsha, Hong Kong (19.3 ng∙m−3, Σ17 PAHs) [17] Porto, Portugal (13.3 ng∙m−3, Σ15 PAHs) [18] and Mount Taishan, China (7.05 ng∙m−3 Σ15 PAHs) [19]. These results are consistent with the type of industrial and/or vehicular activities, which occur in this urban area.
Table 1. Average concentration of PAHs associated with particulate matter PM2.5 in two places of the city of Cuernavaca, Morelos during the winter season of 2013 (ng∙m−3).
--CIQGB (Downtown)
MediaMinMaxSDMedianMediaMinMaxSDMedian
Acen0.810.720.900.060.801.290.676.171.620.82
Ace0.960.791.250.160.940.930.631.460.230.89
Flu0.950.771.090.120.980.940.721.150.140.99
Phe1.271.001.450.141.341.180.791.460.251.23
Ant1.070.871.240.101.101.140.771.640.241.15
Flt1.731.072.760.511.611.240.631.690.341.32
Pyr1.390.991.820.241.451.220.631.560.321.29
BaA1.571.172.110.261.571.330.771.790.301.32
Chr1.540.992.040.271.551.390.691.780.361.44
BbF2.681.833.490.492.732.361.043.340.772.53
BkF2.751.823.580.462.782.451.173.320.742.52
BaP2.631.533.540.502.552.270.933.130.732.47
IP2.141.562.810.352.141.700.892.560.561.64
DBahA1.681.112.160.261.721.460.922.000.321.56
BghiP2.251.573.360.502.161.680.533.130.831.72
Total (ΣHAP)25.43--------22.57--------
n = 11; Min: minimum value; Max: maximal value; SD: standard deviation.

2.4. Possible Sources of PAHs in Cuernavaca

2.4.1. Diagnostic Ratios

Given the variability in the concentration of PAHs emitted into the atmosphere, often diagnostic ratios between them are used in order to estimate the possible sources [20]. However, they should be used with caution, if one considers, for example, reactivity with some of the PAH species such as NOx, O3, etc. [9].
Diagnostic ratios used in this study, were calculated and reported by various authors, which established ranges or values indicating possible sources of origin of polycyclic aromatic hydrocarbons (Table 2).
Table 2. Diagnostic ratios.
Diagnostic RatiosGasoline EnginesDiesel EnginesCoalWood CombustionThis Study
Flt/ (Flt + Pyr) [21,22]0.40–0.500.40–0.50>0.50>0.500.42
IP/( IP + BghiP) [21,23,24,25]0.180.37–0.700.560.620.50
Phe/ ( Phe + Ant) [23,26]0.500.650.76--0.52
IP/ BghiP [27,28]0.220.501.30--1.05
The ratio Flt/(Flt + Pyr) was between 0.40 and 0.50, suggesting that the study area is influenced by emissions from gasoline and diesel [21,22]. Meanwhile the IP/(IP + BghiP) ratio obtained in this study was 0.5. Some previous studies that were done in other places have reported values between 0.18 and 0.40 corresponding to vehicle emissions, 0.56 corresponding to coal burning and 0.62 to wood combustion [21,22,23,24,25], indicating that in the study area coal burning is an important source. The Phe/(Ant + Phe) ratio was also estimated, giving a value of 0.52. This value is associated with vehicle emissions, specifically gasoline [23,26]. Meanwhile the IP/BghiP (1.05) ratio indicated coal burning as a major source in this zone [27,28]. These results are congruent with the dimensions, anthropogenic activities and population density of the Cuernavaca city. Recently, Ortíz-Hernández et al. [29] performed an emissions inventory, this study suggests vehicle emissions, coal burning and forest activities as the principal sources of greenhouse gases in this region.

2.5. Principal Component Analysis

A principal component analysis (PCA) with varimax rotation was performed to determine the possible sources of these compounds in the city of Cuernavaca. The principal components (PC) were selected with eigenvalues greater than 1.0. In total 3 PC were extracted. The PC1 explained 75.6% of the total variance. In this component the compounds loads were similar. Although the BaA, Chr and BaP stand out slightly, these compounds are considered as markers of pyrogenic sources (combustion of oil and coal) [30]. While the PC2 represented 8.5% of the remaining variance, the compounds with the greatest burden in this component were BkF, IP and BghiP, which are associated with vehicle emissions [30,31]. Meanwhile, the PC3 explained 7.0%, and the greatest burden was provided by Ace and Flu, considered as indicators of coke production (Table 3).
The results show that the study area is being specifically affected by emissions from gasoline and diesel.
The combined results of the PCA and diagnostic ratios suggests that vehicle emissions and coal combustion are probably the main sources of PAHs associated with the PM2.5 in the study area.
Table 3. Principal Component Analysis for Cuernavaca.
--PC1PC2PC3
Eigenvalues11.301.301.10
% Variance accumulated75.6084.1091.10
Acen0.230.15−0.05
Ace0.17−0.240.66
Flu0.250.17−0.14
Phe0.260.10−0.31
Ant0.26−0.26−0.15
Flt0.240.040.41
Pyr0.270.140.27
BaA0.280.060.20
Chr0.290.120.02
BbF0.270.16−0.02
BkF0.260.37−0.19
BaP0.290.12−0.13
IP0.270.290.05
DBahA0.27−0.06−0.27
BghiP0.260.28−0.11

2.6. Evaluation of Health Risk

The value obtained for the BaPE in this study was 4.05 ng∙m−3. This value is lower than that reported for Nanging, China, (7.1 ng∙m−3) [6] and Zonguldak, Turkey (14.1 ng∙m−3) [32]. However, it was higher than that found in Hamilton, Canada (0.84 ng∙m−3) [33] and in Florence, Italy (0.92 ng∙m−3) [34]. The compounds used to calculate BaPE (BaA, BaP, BbF, BkF, IP, DBah) represent 51% of the PAHs identified in Cuernavaca, which constitutes a risk factor for the exposed population, taking into account the high degree of penetration in the respiratory system that have the PM2.5 particles.

3. Experimental Section
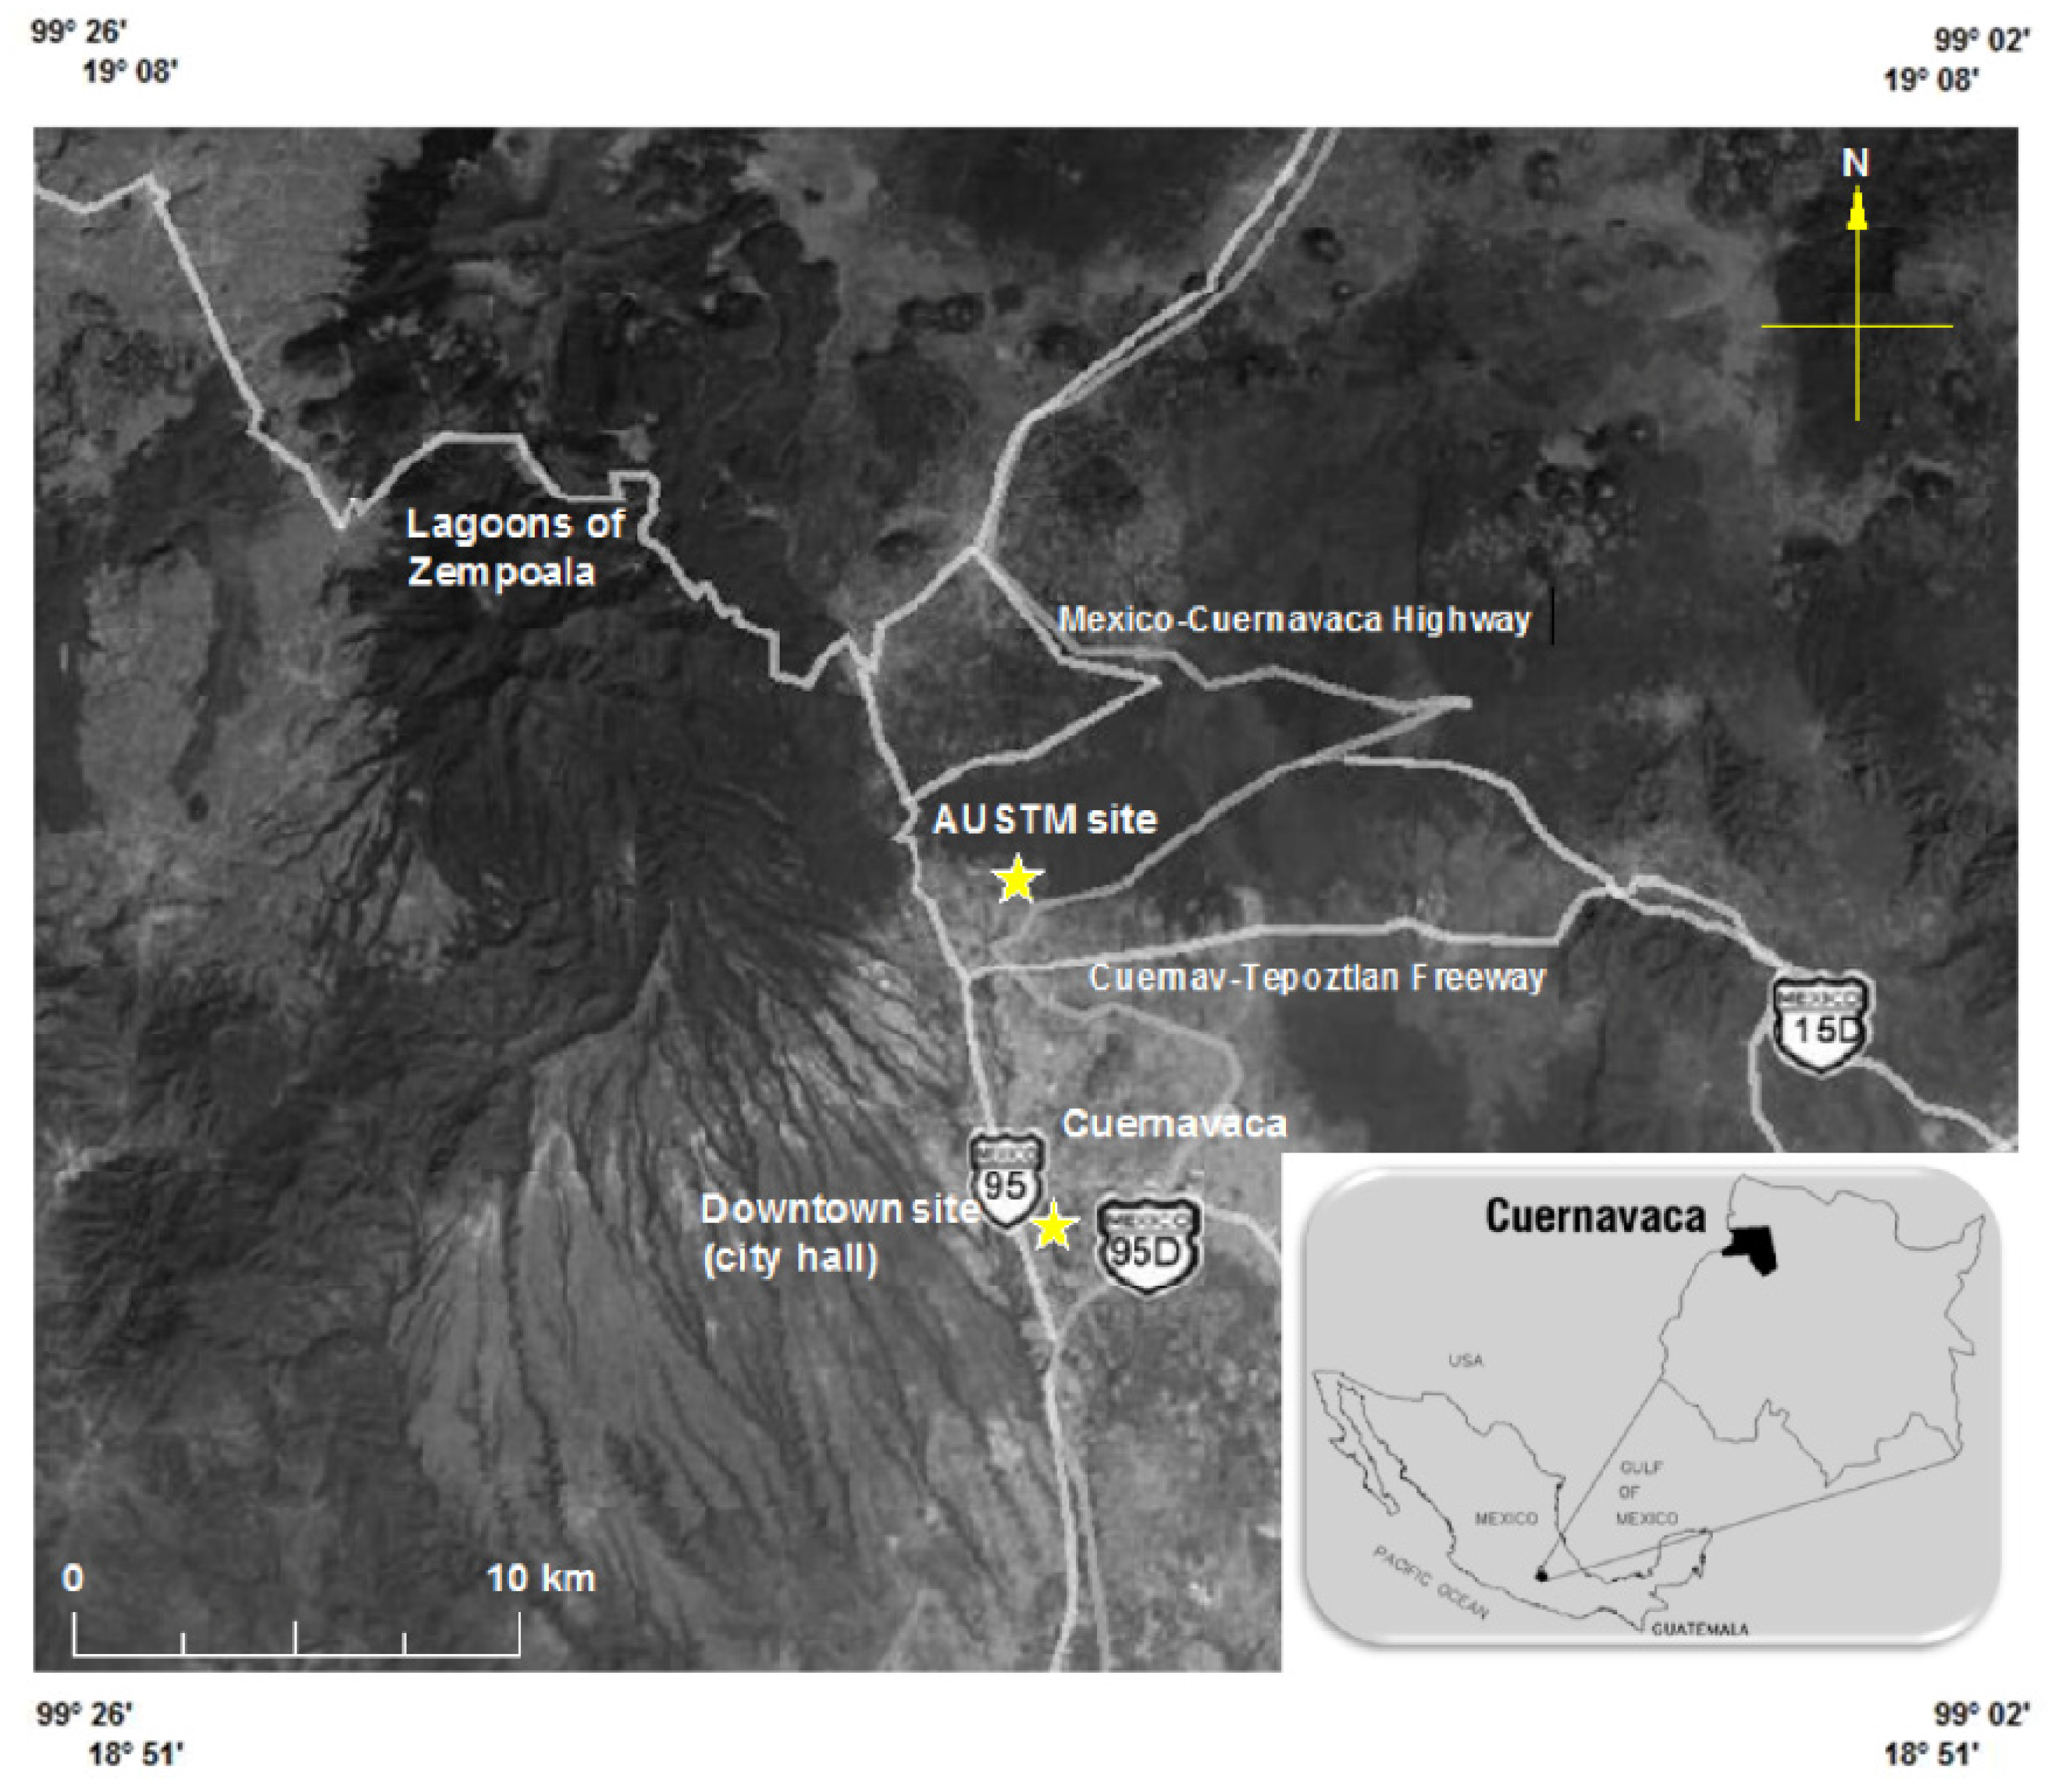
3.1. Sampling Sites

The study was conducted at two sites in the city of Cuernavaca. The first one is located in the downtown of the city (Government Building, GB), which is characterized by high commercial and vehicular activity. The second is located north of the city, at the Autonomous University of State of Morelos Campus ((Center of Chemical Research, CIQ), for its acronym in Spanish). This location is characterized as being surrounded by mountains, having a great variety of vegetation, and being influenced by the Mexico-Cuernavaca highway. The city has a total area of 207.5 km2 and a population of 338,620 inhabitants. During the study period, the average temperature was 23.1 °C (minimum 9.6 ºC, maximum 26.7 ºC), the relative humidity was 36.2% and the average wind speed was 5.3 m∙s−1 (Figure 2).
Figure 2. Sampling sites at the city of Cuernavaca, Morelos.
Atmosphere 06 01259 g002
The particles were collected on quartz filters of 47 mm diameter and in a pore size of 2.0 µm, baked to 180 ºC for at least 24 h to remove adsorbed organics, after which they were transferred to a chamber with relative humidity of <40% at 20–23 °C for another 24 h for conditioning. Afterward, the filters with particles were equilibrated in the chamber for an additional 24 h. Low volume equipment (Mini-Vol) were used at a constant flow of 5.0 L∙min−1, equipped with impactors for PM10 and PM2.5. Sampling was carried out in periods of 24 h (12:00–12:00), from January 25 to 28 February 2013, every two days. In total, 11 samples were collected for each site. After sampling, the filters were refrigerated (4 °C) until extraction.

3.2. Wind Trajectories

To determine the behavior of winds in the study area, HYSPLIT4 model trajectories obtained from the NOAA (National Oceanic and Atmospheric Administration) were used. The trajectories were made for the entire study period [35].

3.3. Extraction of Organic Matter

Sampled filters were extracted using 10 mL of dichloromethane (Burdick & Jackson, HPLC grade) in an ultrasound bath (Branson 3210) for 30 min. This procedure was performed twice. The Erlenmeyer flasks in which the filters were introduced, were fitted with cooled condensers with water at 10 °C. The extracts were filtered through a polytetrafluoroethylene (PTFE) membrane (0.22 µm, Millipore), and then concentrated on a rotary evaporator (Buchi R-3) to about 1.0 mL and stored under refrigeration until analysis.

3.4. Quality Control of the Analytical Method

Field blanks (glass fiber filters) were performed once a week. Field blanks were stored in Petri dishes and returned to the laboratory until analysis. Further, blanks of laboratory material were used to discard the presence of analytes of interest during each one of the stages. The efficiency of the extraction methodology was evaluated by the enrichment of sampled filters with airborne particles with a solution containing 16 PAHs:
Acenaphthylene (Acen), Acenaphthene (Ace), Fluorene (Flu), Phenanthrene (Phe), Anthracene (Ant), Fluoranthene (Flt), Pyrene (Pyr), Benzo[a]Anthracene (BaA), Chrysene (Chr), Benzo[b]Fluoranthene (BbF), Benzo[k]Fluoranthene (BkF), Benzo[a]Pyrene (BaP), Indeno[1,2,3-cd]Pyrene (IP), Dibenzo[a,h]Anthracene (DBahA) and Benzo[g,h,i]Perylene (BghiP), at a concentration of 250 parts per billion (ppb). The amount recovered for each compound was compared to the amount added to calculate the recoveries. Once the percent recovery was determined on the enriched filters, the repeatability was calculated by estimating the coefficient of variation (% CV). The recoveries ranged from 60% to 90%, for Fluorene and IP, respectively. The repeatability in terms of % CV was less than 10%, which is consistent with the variation (30%) set by the United States Environmental Protection Agency [36], for these samples.
Instrumental detection limits were performed based on a weight regression, proposed by Miller and Miller 2002 [37]; these ranged between 16.71 and 61.70 ng∙mL−1 for BghiP and BaP, respectively (Table 4). The concentrations of the compounds in ambient air were corrected using the recovery percentages.
Table 4. Detection limits ng∙mL−1.
CompoundLOD
Acen33.62
Ace32.20
Flu31.19
Phe35.17
Ant37.30
Flt46.85
Pyr50.00
BaA26.00
Chr44.00
BbF26.04
BkF22.50
BaP61.70
IP59.22
DahA44.30
BghiP16.71
LOD: limit of detection.

3.5. Instrumental Analysis

The extracts obtained were concentrated under a gentle stream of nitrogen to near dryness and subsequently resuspended with 150 µL of dichloromethane in an insert injection. To this volume, 50 µL of a solution containing 6 PAH-d (internal standard) were added to a final volume of 200 µL (naphthalene-d8, acenaphthene-d10, phenanthrene-d10, pyrene-d10, chrysene-d12 and perylene-d12) (Chemservice West Chester, PA), at a final concentration of 2500 ppb of internal standard.
The chromatographic analysis was performed on an Agilent Technologies, Model 6890 gas chromatograph (GC) coupled to a mass spectrometer (MS) 5973N with quadrupole mass filter. The separation of the compounds was carried out on a capillary column (J & W Scientific, USA) with an internal diameter of 0.25 mm with 5% phenyl stationary phase and 95% dimethyl polysiloxane and a film thickness of 0.25 µm. The oven temperature program was as follows: 60 °C for 10 min at a gradient of 5 °C per minute to 300 °C for 10 min. The injector temperature was 300 °C in the splitless mode (purge time 30 sec) and the injection volume of 2.0 µL. Helium was used as carrier gas at a flow of 1.0 mL∙min−1. The MS was operated in the electron impact (70 eV) mode and the temperature of the ion source and the quadrupole filter were 230 °C and 150 °C, respectively.
The mass-charge ratios (m/z) monitored were: Acenaphthylene (Acen, 152), Acenaphthene (Ace, 153), Fluoranthene (Flt, 202), Pyrene (Pyr, 202), Benzo[a]Anthracene (BaA, 228), Chrysene (Chr, 228), Benzo[a]Pyrene (BaP, 252), Benzo[b]Fluoranthene (BbF, 252), Benzo[k]Fluoranthene (BkF, 252), Indeno[1,2,3-cd]Pyrene (IP, 276), Dibenzo[a,h]Anthracene (DahA, 278), Benzo[g,h,i]Perylene (BghiP, 276). Multicomponent calibration curves were made for all PAHs in a concentration range of 12.5 to 1600 ng∙mL−1 (r > 0.99, p < 0.001).

3.6. Evaluation of Health Risk

BaP is considered one of the most powerful mutagens, in many cases is used as a general indicator of PAHs and regarded by the World Health Organization (WHO) as a good index for whole PAH carcinogenicity. However, BaP it degrades easily in the presence of sunlight and some oxidants [38,39]. For this reason, BaP concentration alone does not give a good indication of the hazard presented by all the PAHs, and the PAHs’ carcinogenic character, could be underestimated under determined conditions if only this compound is taken as the representative of carcinogenicity.
Therefore, an equivalent index for BaP (BaPE), was created with the objective of allowing a better estimation of the carcinogenic potential of PAHs associated with atmospheric particles. The concentration of BaPE for each PAH, was calculated by multiplying their concentration by its corresponding toxic equivalent factor (TEF), which represents the relative carcinogenic potency of the corresponding PAH [40]:
BaPE = BaA × 0.06 + BF × 0.07 + BaP + DBahA × 0.6 + IP × 0.08
where BF includes all the isomers of benzofluoranthene. The BaPE index tries to parameterize the health risk for human health related to ambient PAH exposure, and was calculated by multiplying the concentrations of each carcinogenic congener with its carcinogenic factor obtained by laboratory studies.

3.7. Statistical Analysis

The statistical analysis, including Kruskal-Wallis test, correlation analysis and principal component analysis (PCA), were realized using STATGRAPHICS program (Statistical Graphics Corp.).

4. Conclusions

The most abundant PAHs were those of high molecular weight, suggesting that in this area the combustion processes significantly contribute to atmospheric emissions. The diagnostic ratios and PCA revealed that coal burning and vehicle emissions are the main source of PAHs in the studied sites. The value obtained for the BaPE suggests a risk to the population, taking into account the degree of penetration of the PM2.5. It is important to mention that this result must be taken with caution, because the study was performed just for one month in the winter season, what suggests longer sampling periods in this urban zone for a better estimation of the risk.
The results obtained reflect the deterioration in air quality that is happening in the urban area of Cuernavaca as a result of high population growth, vehicle fleet growth and development in the industrial park that this region has experienced in recent years. This suggests that establishing strategies oriented to the reduction of atmospheric emissions is required, including the modernization of road transport and implementation of mass transportation systems, among other strategies.

Acknowledgments

The authors would like to express their appreciation to Winston Smith of the Peace Corps for the revision of this paper, to María Gregoria Medina Pintor for her support in the chromatographic analysis, to the Air Quality Monitoring Network of the State of Morelos (RAMAMOR, for its acronym in Spanish) for allowing the installment of the equipment in their locations. Special thanks also Program for the Professional Development of Teachers (PRODEP, for its acronym in English), for the financial support in this project. The authors gratefully acknowledge the NOAA Air Resources Laboratory (ARL) for the provision of the HYSPLIT transport and dispersion model and/or READY website (http://www.ready.noaa.gov) used in this publication. Also to National Laboratory of Macromolecular Structures (LANEM, for its acronym in Spanish, project 251613).

Author Contributions

Saldarriaga-Noreña and López-Márquez wrote the article, Murillo-Tovar, Montiel-Palma and Hernández-Mena designed the study, Waliszewski realized the PAHs analysis, Ospina-Noreña and Sánchez-Salinas performed the statistical analysis.

Conflicts of Interest

The authors declare no conflict of interest.

References

  1. Monographs on the Evaluation of Carcinogenic Risks to Humans. Available online: http://monographs.iarc.fr/ENG/Monographs/vol32/volume32.pdf (accessed on 11 July 2015).
  2. Aceves, M.; Grimalt, J.O. Seasonally dependent size distributions of aliphatic and polycyclic aromatic hydrocarbons in urban aerosols from densely populated areas. Environ. Sci. Technol. 1993, 27, 2896–2908. [Google Scholar] [CrossRef]
  3. Kiss, G.; Varga-Puchony, Z.; Rohrbacher, G.; Hlavay, J. Distribution of polycyclic aromatic hydrocarbons on atmospheric aerosol particles of different sizes. Atmos. Res. 1998, 46, 253–261. [Google Scholar] [CrossRef]
  4. Mazquiaran, M.A.B.; de Pinedo, L.C.O. Organic composition of atmospheric urban aerosol: Variations and sources of aliphatic and polycyclic aromatic hydrocarbons. Atmos. Res. 2007, 85, 288–299. [Google Scholar] [CrossRef]
  5. Ravindra, K.; Bencs, L.; Wauters, E.; de Hoog, J.; Deutsch, F.; Roekens, E.; Bleux, N.; Berghmans, P.; Grieken, R. Seasonal and site-specific variation in vapour and aerosol phase PAHs over Flanders Belgium and their relation with anthropogenic activities. Atmos. Environ. 2006, 40, 771–785. [Google Scholar] [CrossRef]
  6. Wang, G.; Huang, L.; Zhao, X.; Niu, H.; Dai, Z. Aliphatic and polycyclic aromatic hydrocarbons of atmospheric aerosols in five locations of Nanjing urban area, China. Atmos. Res. 2006, 81, 54–66. [Google Scholar] [CrossRef]
  7. Galarneau, E. Source specificity and atmospheric processing of airborne PAHs: Implications for source apportionment. Atmos. Environ. 2008, 42, 8139–8149. [Google Scholar] [CrossRef]
  8. Sklorz, M.; Kreis, J.S.; Liu, Y.B.; Orasche, J.; Zimmermann, R. Daytime resolved analysis of polycyclic aromatic hydrocarbons in urban aerosol samples—Impact of sources and meteorological conditions. Chemosphere 2007, 67, 934–943. [Google Scholar] [CrossRef] [PubMed]
  9. Liu, Y.; Liu, L.B.; Lin, J.M.; Tang, N.; Hayakawa, K. Distribution and characterization of polycyclic aromatic hydrocarbon compounds in airborne particulates of East Asia. China Partic. 2006, 6, 283–292. [Google Scholar] [CrossRef]
  10. Cotham, W.E.; Bidleman, T.F. Polycyclic aromatic hydrocarbons and polychlorinated biphenyls in air at an urban and a rural site near Lake Michigan. Environ. Sci. Technol. 1995, 29, 2782–2789. [Google Scholar] [CrossRef] [PubMed]
  11. Mantis, J.; Chaloulakou, A.; Samara, C. PM10-bound polycyclic aromatic hydrocarbons (PAHs) in the Greater Area of Athens, Greece. Chemosphere 2005, 59, 593–604. [Google Scholar] [CrossRef] [PubMed]
  12. Zielinska, B.; Sagebiel, J.; McDonald, J.; Whitney, K.; Lawson, D. Emission rates and comparative chemical composition from selected in-use diesel and gasoline-fueled vehicles. J. Air Waste Manag. Assoc. 2004, 54, 1138–1150. [Google Scholar] [CrossRef] [PubMed]
  13. Fang, G.C.; Wu, Y.S.; Chen, J.C.; Fu, P.P.C.; Chang, C.N.; Ho, T.T.; Chen, M.H. Characteristic study of polycyclic aromatic hydrocarbons for fine and coarse particulates at Pastureland near Industrial Park sampling site of central Taiwan. Chemosphere 2005, 3, 427–433. [Google Scholar] [CrossRef] [PubMed]
  14. Park, S.S.; Kim, Y.J.; Kang, C.H. Atmospheric polycyclic aromatic hydrocarbons in Seoul, Korea. Atmos. Environ. 2002, 36, 2917–2924. [Google Scholar] [CrossRef]
  15. Kong, S.; Ding, X.; Bai, Z.; Han, B.; Chen, L.; Shi, J.; Li, Z.Y. A seasonal study of polycyclic aromatic hydrocarbons in PM2.5 and PM2.5–10 in five typical cities of Liaoning Province, China. J. Hazard Mater. 2010, 183, 70–80. [Google Scholar]
  16. Li, Z.; Porter, E.N.; Sjödin, A.; Needham, L.L.; Lee, S.; Russell, A.G. Characterization of PM2.5-bound polycyclic aromatic hydrocarbons in Atlanta Seasonal variations at urban, suburban, and rural ambient air monitoring sites. Atmos. Environ. 2009, 43, 4187–4193. [Google Scholar] [CrossRef]
  17. Huang, B.; Liu, M.; Bi, X.; Chaemfa, C.; Ren, Z.; Wang, X.; Sheng, G.; Fu, J. Phase distribution, sources and risk assessment of PAHs, NPAHs and OPAHs in a rural site of Pearl River Delta region, China. Atmos. Pollut. Res. 2014, 5, 210–218. [Google Scholar] [CrossRef]
  18. Slezakova, K.; Castro, D.; Pereira, M.C.; Morais, S.; Delerue-Matos, C.; Alvim-Ferraz, M.C. Influence of Traffic Emissions on the Carcinogenic Polycyclic Aromatic Hydrocarbons in Outdoor Breathable Particles. J. Air Waste Manage. Assoc. 2010, 60, 393–401. [Google Scholar] [CrossRef]
  19. Li, P.H.; Wang, Y.; Li, Y.H.; Wang, Z.F.; Zhang, H.Y.; Xu, P.J. Characterization of polycyclic aromatic hydrocarbons deposition in PM2.5 and cloud/fog water at Mount Taishan (China). Atmos. Environ. 2010, 44, 1996–2003. [Google Scholar] [CrossRef]
  20. Kendall, M.; Hamilton, R.; Watt, J.; William, I.D. Characterization of selected speciated organic compounds associated with particulate matter in London. Atmos. Environ. 2001, 35, 2483–2495. [Google Scholar] [CrossRef]
  21. Kavouras, I.; Koutrakis, P.; Tsapakis, M.; Lagoudaki, E.; Stephanou, E.; Stephanou, E.G.; von Baer, D.; Oyola, P. Source apportionment of urban particulate aliphatic and polynuclear aromatic hydrocarbons (PAHs) using multivariate methods. Environ. Sci. Technol. 2001, 35, 2288–2294. [Google Scholar] [CrossRef] [PubMed]
  22. Yunker, M.; Macdonald, R.; Vingarzan, R.; Mitchell, R.; Goyette, D.; Sylvestre, S. PAHs in the Fraser River basin: A critical appraisal of PAH ratios as indicators of PAH source and composition. Org. Geochem. 2002, 33, 489–515. [Google Scholar] [CrossRef]
  23. Khalili, N.; Scheff, P.; Holsen, T. PAH source fingerprints for coke ovens, diesel and gasoline engines, highway tunnels, and wood combustion emissions. Atmos. Environ. 1995, 29, 533–542. [Google Scholar] [CrossRef]
  24. Sicre, M.A.; Saliot, A.; Aparicio, X.; Grimalt, J.; Albaiges, J. Aliphatic and aromatic hydrocarbons in different sized aerosols over the Mediterranean Sea: occurrence and origin. Atmos. Environ. 1987, 21, 2247–2259. [Google Scholar] [CrossRef]
  25. Rogge, W.F.; Hildemann, L.; Mazurek, M.A.; Cass, G.R.; Simoneit, B.R.T. Sources of fine organic aerosol: Non-catalyst and catalyst equipped automobiles and heavy duty diesel trucks. Environ. Sci. Technol. 1993, 27, 636–651. [Google Scholar] [CrossRef]
  26. Alves, C.; Pio, C.; Durate, A. Composition of extractable organic matter of air particles from rural and urban Portugese areas. Atmos. Environ. 2001, 35, 5485–5496. [Google Scholar] [CrossRef]
  27. Grimmer, G.; Jacob, J.; Naujack, K. Profile of the polycyclic aromatic compounds from crude oils-inventory by GC GC-MS. PAH in environmental materials: Part 3. Fresen. J. Anal. Chem. 1983, 316, 29–36. [Google Scholar] [CrossRef]
  28. Caricchia, A.M.; Chiavarini, S.; Pezza, M. Polycyclic Aromatic Hydrocarbons in the urban atmospheric particulate matter in the city of Naples (Italy). Atmos. Environ. 1999, 33, 3731–3738. [Google Scholar] [CrossRef]
  29. Ortíz-Hernández, M.L.; Quiroz-Castañeda, R.E.; Sánchez-Salinas, E.; Castrejón-Godínez, M.L.; Macedo-Abarca, B. Emissions of Greenhouse Gases in the State of Morelos, 1st. ed.; Environmental Management Degree Program: Morelos, Mexico, 2013. (In Spanish) [Google Scholar]
  30. Simcik, M.F.; Eisenreich, S.J.; Lioy, P.J. Source apportionment and source/sink relationships of PAHs in the coastal atmosphere of Chicago and Lake Michigan. Atmos. Environ. 1999, 33, 5071–5079. [Google Scholar] [CrossRef]
  31. Kulkarni, P.; Venkataraman, C. Atmospheric polycyclic aromatic hydrocarbons in Mumbai, India. Atmos. Environ. 2000, 34, 2785–2790. [Google Scholar] [CrossRef]
  32. Akyüz, M.; Cabuk, H. Meteorological variations of PM2.5/PM10 concentrations and particle-associated polycyclic aromatic hydrocarbons in the atmospheric environment of Zonguldak, Turkey. J. Hazard Mater. 2009, 170, 13–21. [Google Scholar] [CrossRef] [PubMed]
  33. Anastasopoulos, A.T.; Wheeler, A.J.; Karman, D.; Kulka, R.H. Intraurban concentrations, spatial variability and correlation of ambient polycyclic aromatic hydrocarbons (PAH) and PM2.5. Atmos. Environ. 2012, 59, 272–283. [Google Scholar] [CrossRef]
  34. Lodovici, M.; Venturini, M.; Marini, E.; Grechib, D.; Dolara, P. Polycyclic aromatic hydrocarbons air levels in Florence, Italy, and their correlation with other air pollutants. Chemosphere 2003, 50, 377–382. [Google Scholar] [CrossRef]
  35. Draxler, R.R.; Rolph, G.D. HYSPLIT—Hybrid Single-Particle Lagrangian Integrated Trajectory Model. Available online: http://www.arl.noaa.gov/HYSPLIT.php (accessed on 11 July 2015).
  36. Environmental Protection Agency (EPA) of the United States. Compendium Method TO-13A, Determination of Polycyclic Aromatic Hydrocarbons (PAHs) in Ambient Air Using Gas Chromatography/Mass Spectrometry (GC/MS); EPA: Cincinnati, OH, USA, 1999.
  37. Miller, J.N.; Miller, J.C. Estadística y Quimiometría para Química Analítica, 6th ed.; Prentice Hall: Harlow, UK, 2002. [Google Scholar]
  38. Daisey, J.M.; Cheney, J.L.; Lioy, P.J. Profiles of organic particulate emissions from air pollution sources: status and needs for receptor source apportionment modelling. J. Air. Pollut. Control. Assoc. 1986, 36, 17–33. [Google Scholar] [CrossRef] [PubMed]
  39. Muller, J.F.; Hawker, D.F.; Connel, D.F. Polycyclic aromatic hydrocarbons in the atmospheric environment of Brisbane, Australia. Chemosphere 1998, 37, 1369–1383. [Google Scholar] [CrossRef]
  40. Nisbet, C.; LaGoy, P. Toxic equivalency factors (TEFs) for polycyclic aromatic hydrocarbons (PAHs). Regul. Toxicol. Pharmacol. 1992, 16, 290–300. [Google Scholar] [CrossRef]

