Article

The Behavior and Removal of Condensable Particulate Matter in Flue Gas in a Multi-Field Force: A Modeling and Experimental Study

1
Hebei Key Laboratory, Power Plant Flue Gas Multipollutant, Department of Environmental Science and Engineering, North China Electric Power University, Baoding 071003, China
2
MOE Key Laboratory of Resources and Environmental Systems Optimization, College of Environmental Science and Engineering, North China Electric Power University, Beijing 102206, China
*
Author to whom correspondence should be addressed.
Atmosphere 2024, 15(3), 250; https://doi.org/10.3390/atmos15030250
Submission received: 16 January 2024 / Revised: 8 February 2024 / Accepted: 17 February 2024 / Published: 21 February 2024

Abstract

:
Condensable particulate matter (CPM) is different from filterable particulate matter (FPM), which could escape from air pollution control devices (APCDs) and pose a great threat to the environment and human health. Thus, modeling and experimental studies were conducted on CPM particle behavior and removal, in a cold electrode electrostatic precipitator (CE−ESP) coupled with a electric field, temperature field and concentration field. A multi−field force coupling model was then established that was based on the mechanical behavior of particles inside the CE−ESP. The results showed that temperature field was beneficial to depositing small size particles and that, the greater the temperature gradient, the higher CPM’s removal efficiency. While the electric field tended to gather larger size particles, the greater the voltage provided, the higher the removal efficiency for CPM and FPM. In the multi−field, the augmented coagulation and the removal efficiencies of both CPM and FPM increased significantly, reaching 89% and 98%, respectively. Subsequently, experiments were conducted by a self−made CE−ESP device, which showed the removal efficiencies of CE−ESP of a CPM in a multi−field were 91% and 81% for a coal−fired power plant and a waste incineration plant, respectively. This research could make a great contribution to CPM condensation, aggregation and removal.

1. Introduction

In 2022, the average concentration of PM2.5 in China was 29 μg/m3 [1] throughout the year, showing a year−on−year decrease of 3.3% [2]. The control of conventional air pollutants has been effectively achieved, and the BlueSky Defense War has made phased achievements. However, the control effect on non−conventional substances, such as condensable particulate matter (CPM) from fixed source emissions, is limited. According to the World Air Quality Report, the health limit for PM2.5 is set at an annual average of 0–5 μg/m3. In 2022, only 13 countries or regions met this recommended concentration. In the PM2.5&CO2 forum, Song pointed out that the main reason for the exceeding of PM2.5 emissions is CPM dominance [3]. CPM is different from filterable particulate matter (FPM) that cannot be filtered through a membrane, and is the core substance that forms PM2.5 aerosols. It is characterized by a small particle size (submicron−level), strong light extinction ability, a huge number of particles (counted in tens of millions per cubic centimeter), difficulty in settling, and the ability to absorb moisture and amplify [4]. These properties cause CPM to directly contribute to the formation of haze. It greatly harms the environment and human health, and results in the prevention and control of air pollution remaining a long and arduous task.
Some scholars have collected and analyzed the composition of particulate matter emitted from fixed sources. Li collected particulate matter from three ultra−low emission coal−fired power plants equipped with air pollution control devices (APCDs) by using the EPA 202 method [5], and found the percentage of CPM in total particulate matter (TPM) ranged from 5–84%. Yang collected CPM from different industrial combustion sources such as coal−fired power plants, brick factories, and waste incineration plants, by using the impaction condensation method [6], producing results that showed the proportion of CPM in TPM ranged from 44–74%. In TPM samples from steel mills, the proportion of CPM could reach 99.6%. Yang investigated boiler emissions from different fuels (coal, wood, heavy oil, diesel, and natural gas) [7], and found the the CPM/TPM level ranged from 25.7–96.5%. These studies suggested that the emission concentration and proportion of CPM are very high. However, the current conventional APCDs have poor removal efficiency for CPM, with experiments showing that the removal rate of LLT–ESP for CPM ranges from 60.9% to 78.89% [8]. Huang et al. collected and measured CPM before and after EBF and ESP in the factory, and found that the removal rates of ESP and EBF for CPM were 77.34% and 79.23%, respectively [9]. A study conducted on a super−low emission and coal−fired unit showed that its existing low−temperature electric precipitator, seawater desulfurization and wet electrostatic precipitator devices were effective in removing CPM [10]. The overall CPM removal rate was 97.2% and 97.6% in high load (300 MW) and low load (150 MW) conditions respectively, resulting in CPM emissions of 5.58 mg/m3 and 5.55 mg/m3 respectively [11]. The study also found that the removal efficiency of dry electrostatic precipitation and wet electrostatic precipitation for inorganic CPM was higher than that for organic CPM. Seawater desulfurization had a significant overall effect on CPM removal, but also brought in large amounts of Cl and Na+ from seawater into the flue gas, forming some new CPM [12]. However, the downstream wet electrostatic precipitation was able to remove these newly formed CPM, ultimately ensuring low concentration emissions of CPM. Future developments in controlling CPM could include techniques such as condensation, adsorption, and wet electrostatic precipitation, which are currently being researched. Exploring new and efficient dust removal technologies to replace conventional dust removal devices is key to reducing CPM emissions from fixed sources.
Dust removal technologies based on field effects, such as electric, temperature and sound fields, have been developed to remove CPM, which are well adjusted to its small particle size and condensable nature. Studies have shown that while these external field effects can promote the growth of fine particles to some extent, there is a need to undertake more research into subsequent particle collection and removal, such as removal methods, condensation characteristics, agglomeration mechanisms, collision enhancement mechanisms, and removal efficiency. Li analyzed the motion characteristics of particles of different sizes near the wall surface by undertaking thermophoresis action through direct numerical simulation [13]. The results showed that the effect of thermophoretic force on small−sized particles was significant. At the same time, thermophoresis played a positive role in the movement of particles towards, and deposition within, the cold wall surface, while weakening the movement of particles towards the hot wall surface. In addition, some scholars have studied the deposition effect of particles in the joint action of isothermal and electric fields. Chen optimized governing equations by undertaking coordinate transformation and performed numerical simulation, with the aim of analyzing the deposition status of particles in the joint action of thermophoresis, electric field force, convection and Brownian motion [11]. Yang et al. investigated the deposition effect of microparticles in a vertical pipe by using the Lagrangian trajectory tracking method, and found that the deposition effect of particles on the wall of the pipe was significantly enhanced by the combined action of thermophoresis and electrophoresis [14]. Researchers focused on electrostatic precipitators, developing a turbulent diffusion model that incorporates electrostatic transport effects in order to study the motion and sedimentation behavior of particles within the precipitator. The findings suggest that particle sedimentation in the reactor is primarily due to the combined effects of electrostatic migration and turbulent diffusion [15,16].
This study, which is based on a combination of existing CPM capture methods and the observation of poor CPM capture of ultra−low emissions by APCDs, systematically conducts a modeling and experimental study of the behavior and removal of CPM particles in an electric field, temperature field and concentration field. It does this by taking a cold electrode electrostatic precipitator (CE−ESP) and coupling it with an electric field, temperature field and concentration field [17]. In the modeling part, the finite element analysis method is used to construct the flow field model, corona electric field model, particle motion model, particle charging model and water film evaporation model, respectively. After each model is coupled and calculated, the distribution and motion characteristics of CPM force in the synergistic action of electric field, temperature field, concentration field and multi−field are analyzed. The electric field distribution, particle concentration along the length and classification of particle concentration and removal efficiency inside the CE−ESP in different working modes, are studied. The influence of different electric field strengths, wall heat transfer, or synergistic effect of CPM on the motion trajectory, deposition effect and removal efficiency, respectively, in the CE−ESP are revealed. In addition, a self−made CE−ESP device is constructed to carry out experiments in a coal fire power plant and a waste incineration plant and test the removal effect. This paper describes the total concentration distribution along the path, the classified concentration distribution, the reduction rate of classified concentration along the path, the particle trajectory, and the deposition efficiency of CPM in CE–ESP in the synergistic effect of multiple fields. It provides an in−depth study of the internal physical processes, such as the distribution and motion characteristics of particles inside the electrostatic precipitator, and therefore offers a theoretical foundation that will contribute to efforts to improve the removal efficiency of CPM.

2. Model Description and Experimental Methods

2.1. Model Description

2.1.1. Force Analysis of Particles

In the process of establishing a model, it is necessary to consider the forces acting on particles during their motion. In a specific analysis of the ease and relative magnitudes of different forces, only the main forces can be considered and the secondary ones should be neglected, as this will simplify the force analysis. This approach does not only highlight the main characteristics of particle motion but also reasonably reduces the resource consumption of simulation calculations [18].
In this study, the particles motion is primarily influenced by drag force (FD), Van der Waals force (Fv), electric field force (FE), gravity (Fg), and thermophoresis (Fth). The drag force can be expressed as:
F D = 1 8 π d p 2 ρ g C D | u p u g | ( u p u g )
where C D is the drag coefficient; Re is the particle Reynolds number; d p is the particle diameter, m; ρ g is the gas density, kg/m3; u p is the particle velocity, m/s; and u g is the gas velocity, m/s.
The drag coefficient is related to the particle Re. In this paper, we mainly investigate the movement characteristics of inhalable particles in CE−ESP, where the particle Re ≤1, indicating the particles are in the Stokes region.
Fv between spherical particles can be approximated as follows:
F V = H 6 z 2 r 1 r 2 r 1 + r 2
where H is the Van der Waals constant, z is the Van der Waals force equilibrium spacing, m; and r is the particle radius, m [19].
FE is calculated based on classical mechanics and electrical laws, and can be expressed as follows:
F E = E 0 q
where E0 is the applied potential gradient, V/m; q is the charge of the particle, C.
Due to the gravitational force, particles are always subject to gravity, which can be represented as:
F g = 1 6 d p 3 ρ g
where ρ is the density of the particles, kg/m3.
When particles are in a non−uniform temperature field, the temperature gradient leads to a difference in energy between gas molecules on the two sides of the particle, resulting in a pressure being exerted on the particle [20]. This phenomenon is typically referred to as Fth and can be expressed as:
F t h = 6 π μ v d p C S ( k 1 + C t k n ) T / T ( 1 + 3 C m k n ) ( 1 + 2 k 1 + 2 C t k n )
where C m is the momentum exchange coefficient, C S is the thermal slip coefficient, k n is the Knudsen number, k is the ratio of gas to particle thermal conductivity, and T is the gas temperature in Kelvin.
The CPM removal process involves various physical processes, including corona discharge, gas motion, heat transfer, particle charging, particle motion, and water film evaporation. To accurately simulate the electrostatic precipitation process, corresponding mathematical models need to be established for each physical process.

2.1.2. Corona Electric Field Model

To establish the mathematical model for the corona electric field, some simplifying assumptions were made, including:
(1) Corona discharge is stable, meaning that the internal electric field and charge density distribution do not vary with time.
(2) Corona discharge occurs on the surface of the corona wire, and the thickness of the corona region is negligible.
(3) The polarity of charged ions is singular, and the ion migration rate is constant.
Neglecting the influence of particles and flue gas on the electric field, the governing equations for corona discharge can be simplified to the Poisson’s equation for electric potential and continuity equation for current:
ε 0 E = ρ i
J = 0
E = φ
J = ( u + b E ) ρ i D i ρ i
where ε 0 is the permittivity of free space, V·m; J is the current density, A/m2; E is the electric field strength, V/m; ρ i is the charge density, C/m3; u is the fluid velocity, m/s, φ is the voltage, V, and b is the ion migration coefficient, m2/(K·s) [21].
Considering that the corona wire is grounded (potential = 0), the boundary conditions are set out in accordance with Table 1.
Where φ w is the voltage of the corona wire, ρ w is the surface charge density on the corona wire, and E w is the electric field strength on the corona wire’s surface.

2.1.3. Gas Flow Fields Model

The turbulent flow field is solved using the k−ε turbulent model, combined with the steady−state compressible Navier−Stokes equations in COMSOL software 6.1. The mass conservation equation and momentum conservation equation in the Navier−Stokes equations are solved, given by:
u i x i = 0
ρ f u i u j x i = p x i + x j [ ( μ + μ t ) ( u i x j + u j x i ) ] + F c i + ρ f g i
where ρ f is the fluid density, kg/m3; u i is the fluid velocity, m/s; μ is the laminar viscosity coefficient, kg/(m·s); μ t is the turbulent viscosity coefficient, kg/(m·s); p is the pressure, Pa; F c i is the electric field force acting on the fluid, N/m; and g i is the acceleration due to gravity, m/s2.
The standard k−ε turbulent model consists of the turbulent kinetic energy equation and turbulent dissipation rate equation. The governing equations are as follows:
t ( ρ f κ ) + x i ( ρ f u i κ ) = x j ( μ t σ κ ε x j ) + 2 μ G ρ f ε
t ( ρ f ε ) + x i ( ρ f u i ε ) = x j ( μ t σ ε ε x j ) + C 1 ε ε κ 2 μ t G C 2 ε ρ f ε 2 κ
μ t = ρ f C μ κ 2 ε
G = 1 2 ( u i x j + u j x i ) u j x i
where κ is the turbulent kinetic energy and ε is the turbulent dissipation rate. The other parameters are constants related to the turbulent model: σ ε   = 1.3, σ κ   = 1, C μ   = 0.09, C 1 ε = 1.44 , C 2 ε = 1.92 .

2.1.4. Particle Charge Model

In an electric field, there are two methods for particle charging: one is field charging, where ions collide with particles under the action of electric field force; the other is diffusion charging, where ions collide with particles during their diffusion motion.
The particle charging equation is:
q s = 3 π ε 0 E 0 d p 2 ε r ε r + 2
where q s is the particle saturation charge, C; E 0 is the average electric field strength between the two poles, V/m; and ε r is the relative dielectric constant.
The diffusion charging equation is:
q p = 2 π k T ε 0 d p e ln ( 1 + e 2 u d p N 0 8 ε 0 k T t )
where q p is the diffusion charge quantity, C; k is the Boltzmann’s constant (1.38 × 10⁻²³ J/K); T is the absolute temperature, K; and u is the thermal velocity of ion motion, m/s.

2.1.5. Wall Heat Transfer Model

In the CE−ESP, circulating water is used on the dust collection electrode to reduce the gas temperature inside the precipitator through convective heat transfer [14]. Assuming a constant internal thermal conductivity of the solids, the energy equation for convective heat transfer is:
t τ + u t x + v t y + w t z = α 2 t x 2 + 2 t y 2 + 2 t z 2
where u ,     v ,     w is the velocity component of the fluid.

2.1.6. Particle Motion Model

In the CE–ESP, a large amount of charged ions are distributed due to corona discharge. When particles enter, they become charged by the action of the electric field and diffusion. Furthermore, there are processes such as gas−solid two−phase flow and heat and mass transfer inside the reactor, making the particle force complex. Of them, the drag force and Coulomb force have the greatest influence on particle motion. When there is a large temperature gradient, thermal gradient force also needs to be considered. According to Newton’s second law, the particle motion equation can be written as:
m d u p d t = F D + F g + F e + F t h

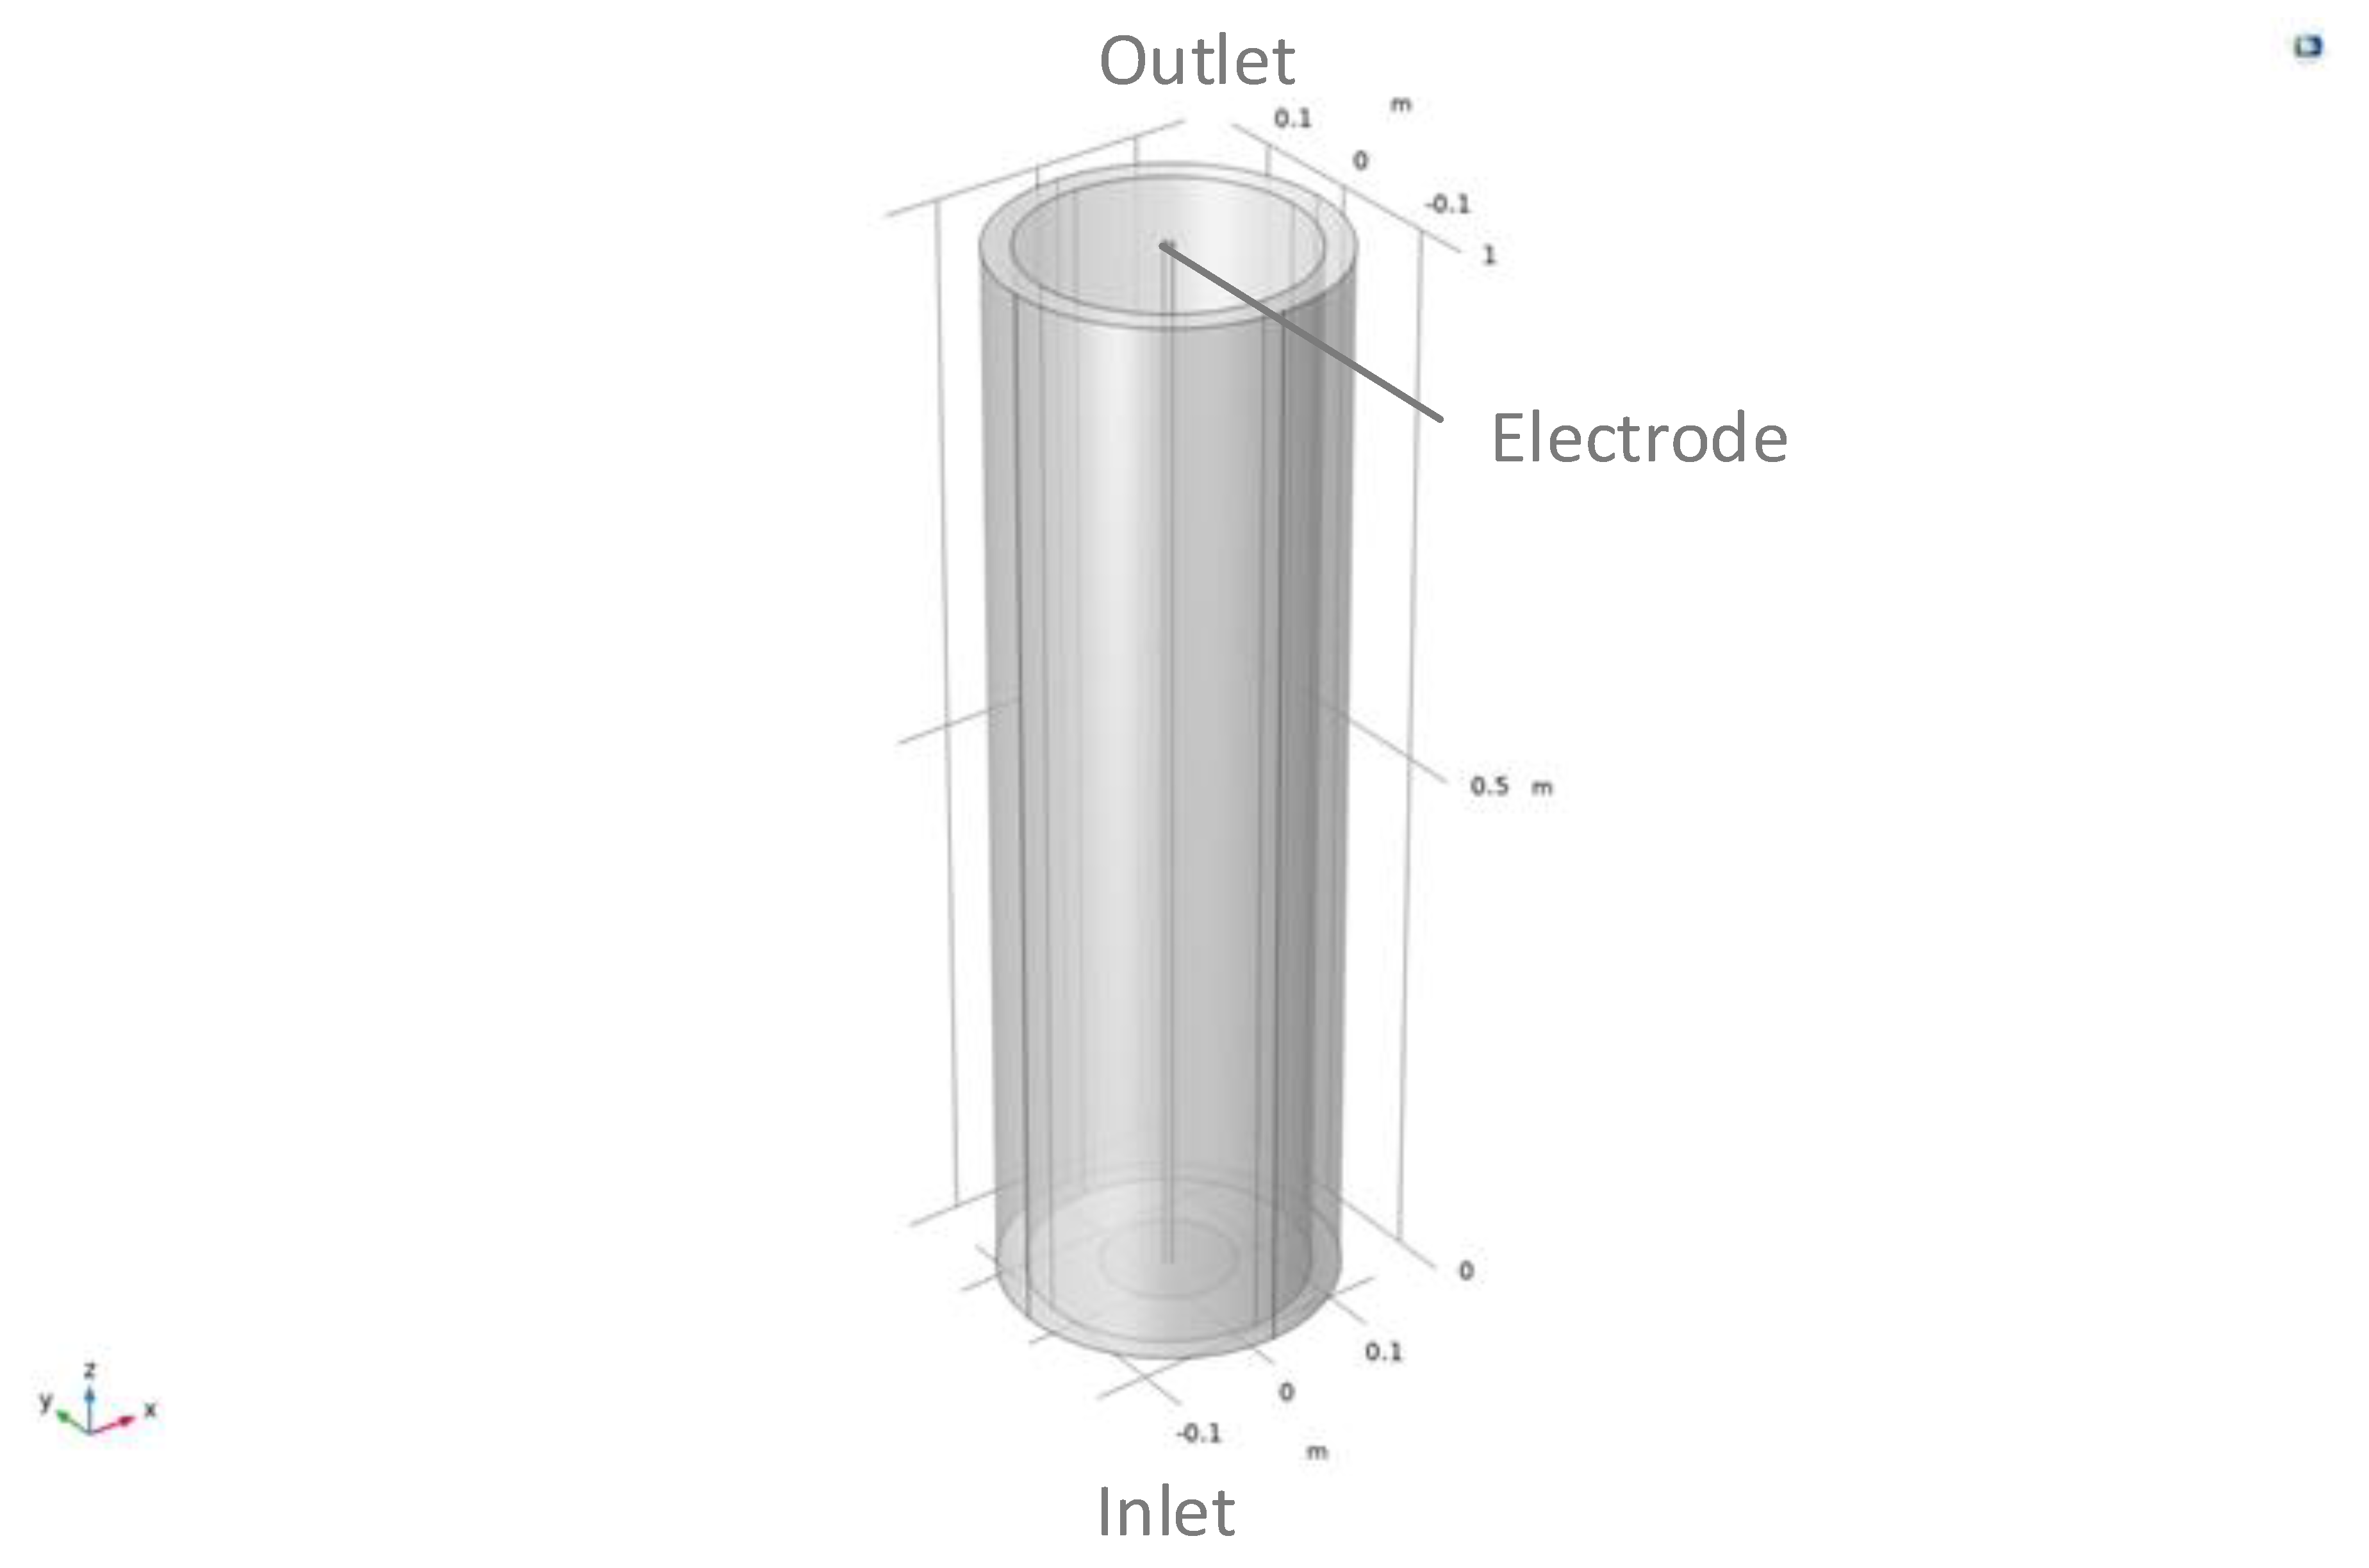
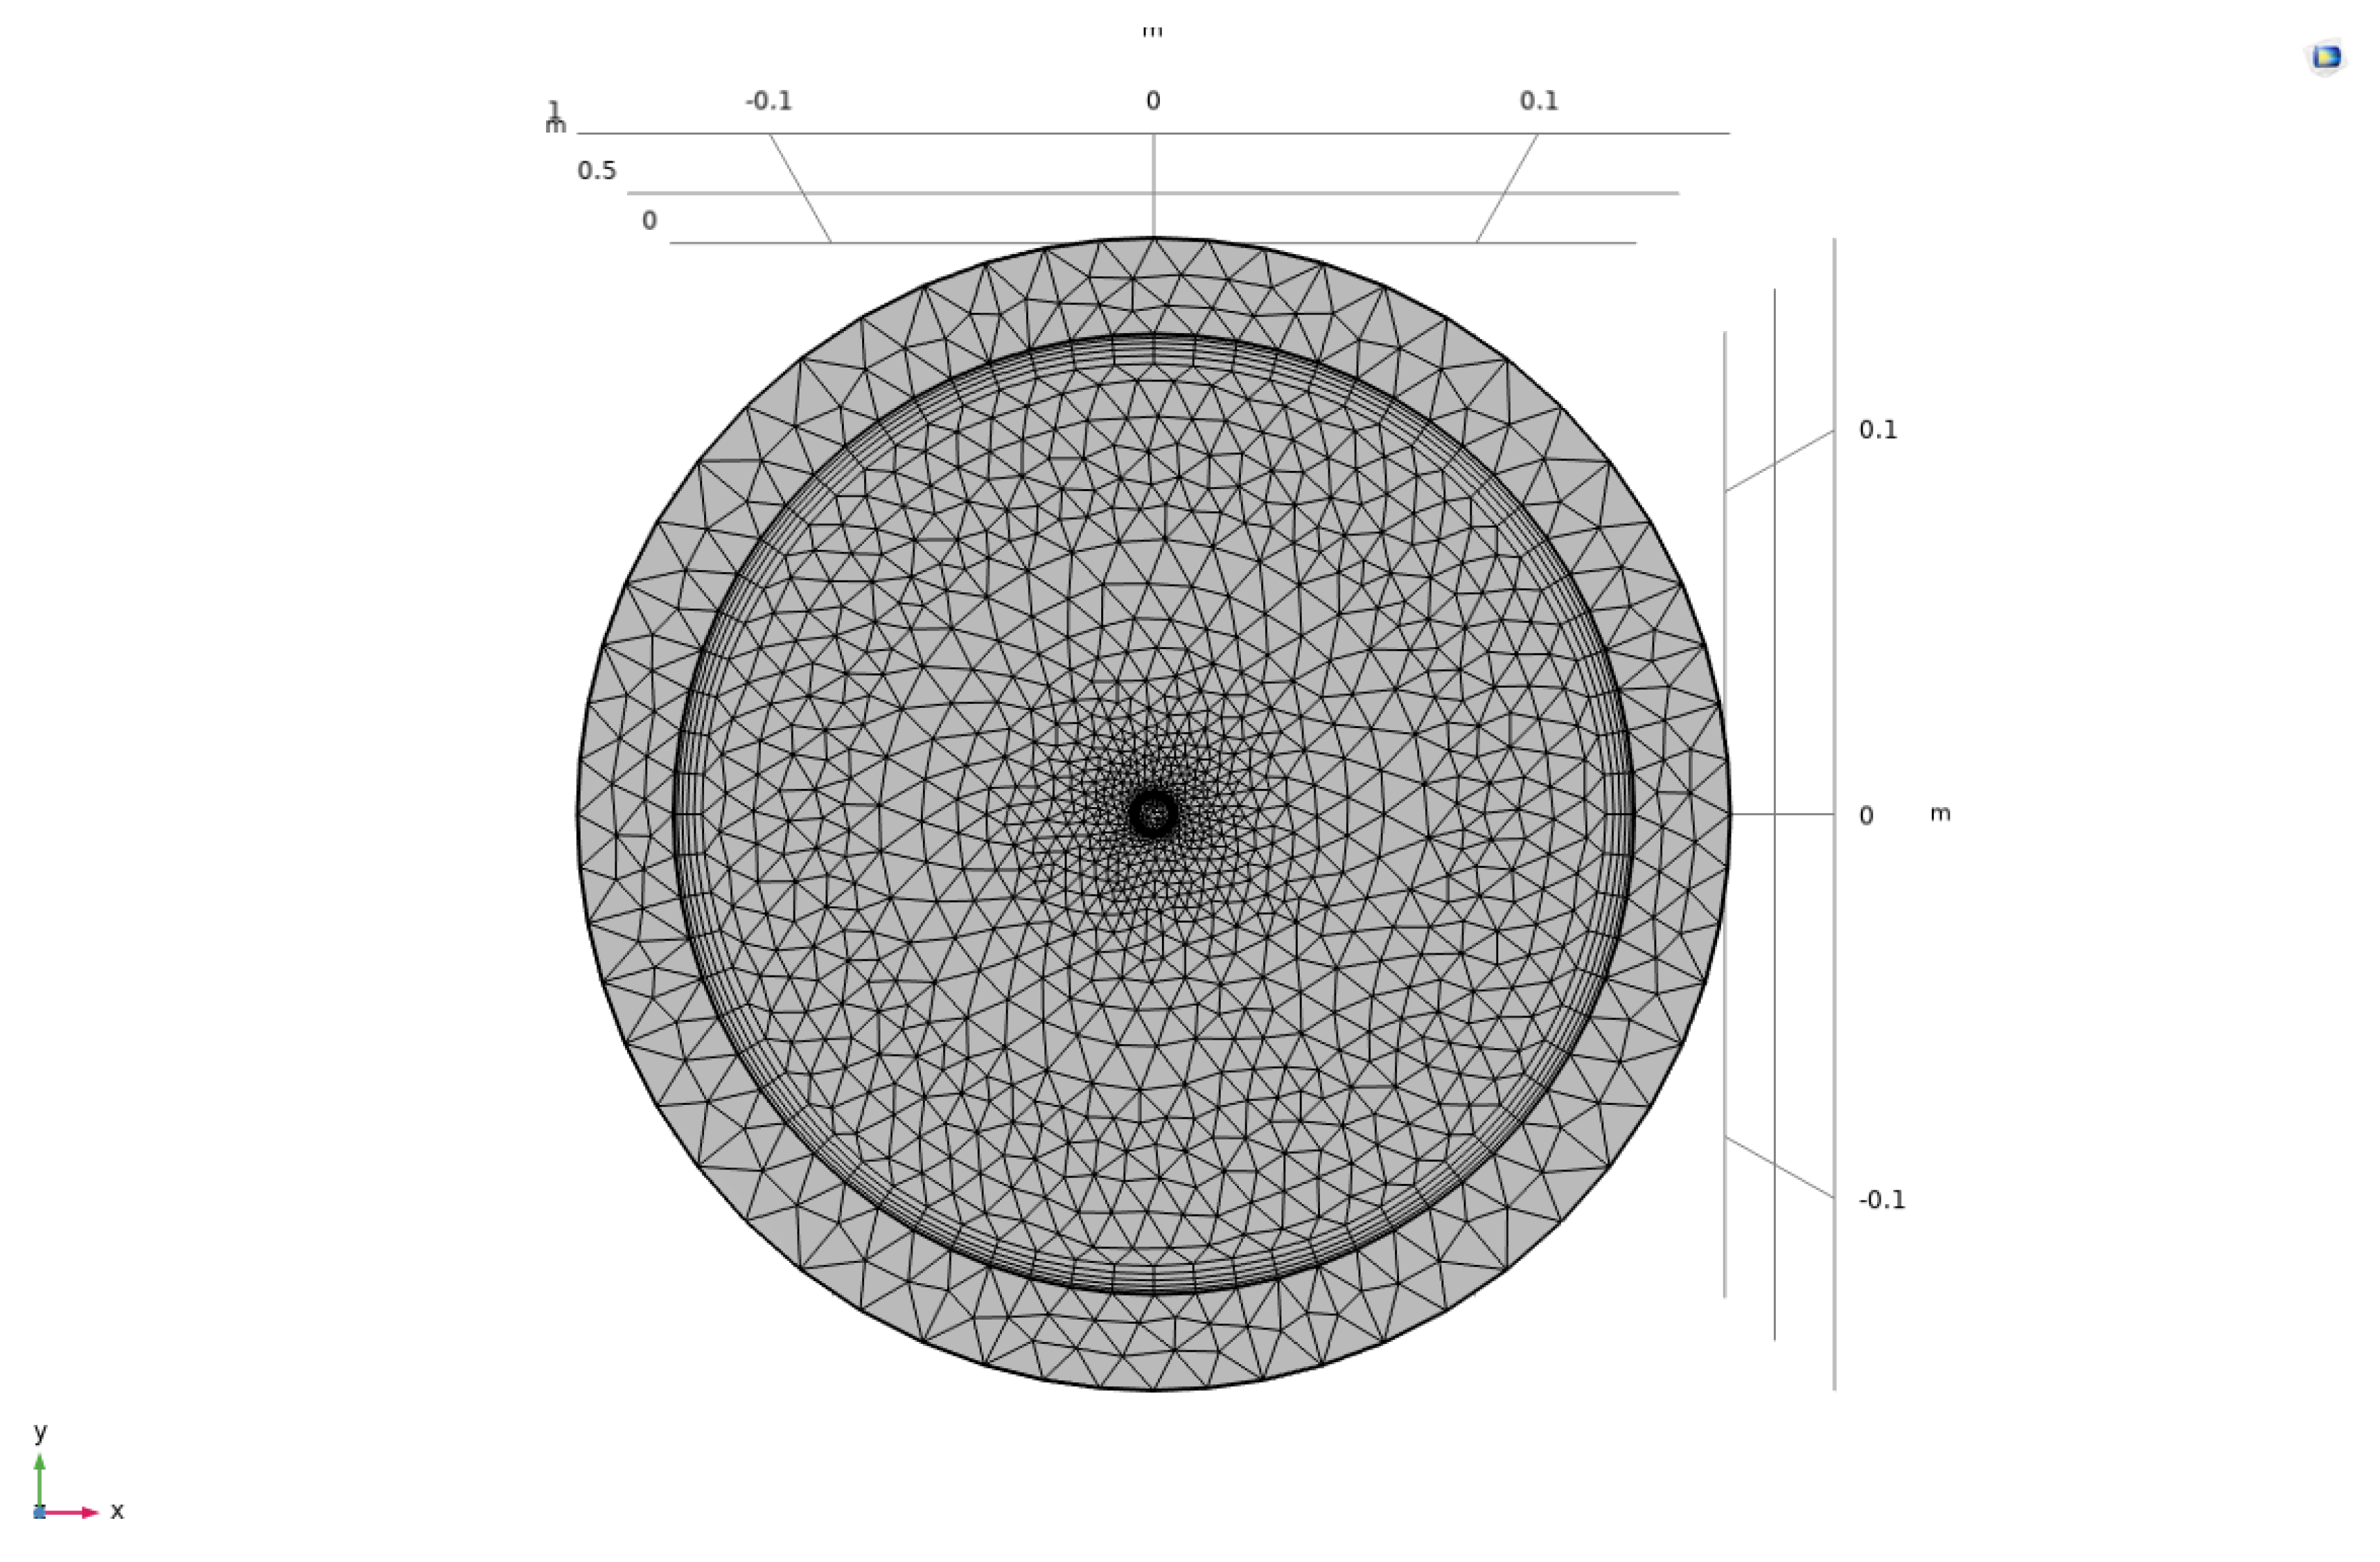
2.1.7. Geometric Model

The three−dimensional geometric model of the physical field is built using the three−dimensional geometry module of COMSOL software. A temperature−controlled interlayer is set outside the cold electrode dust tubular collection electrode to provide cooling circulation water. The length of the tubular collection electrode is 1000 mm, the distance between the two electrodes is set to 125 mm, and the radius of the electrode wire is 5 mm. The three−dimensional model is shown in Figure 1.
The mesh is set using user−controlled meshing, with local refinement near the electrode wire to improve computational accuracy and obtain a higher quality mesh model. This approach also helps to reduce computational costs. The mesh division is shown in Figure 2.
The gas simulation is used to simulate the concentration of flue gas at the outlet of a coal−fired power plant. The gas flow inlet is set at the bottom of the model, and the boundary condition for the inlet is specified as velocity with a normal flow velocity of 0.5 m/s. The air temperature is set to 293.15 K, and the pressure is set to 101.3 kPa. The pressure condition at the outlet is set to static pressure. The boundary conditions for the tubular collection electrode and the outlet are set to frozen, meaning that when particles collide with the tubular collection electrode or the outlet boundary, the particles’ position and velocity remain stationary. A particle counter is placed at the outlet to accurately record the number of particles frozen on the outlet boundary, thus calculating the model’s dust removal efficiency.
The basic parameters are shown in Table 2.

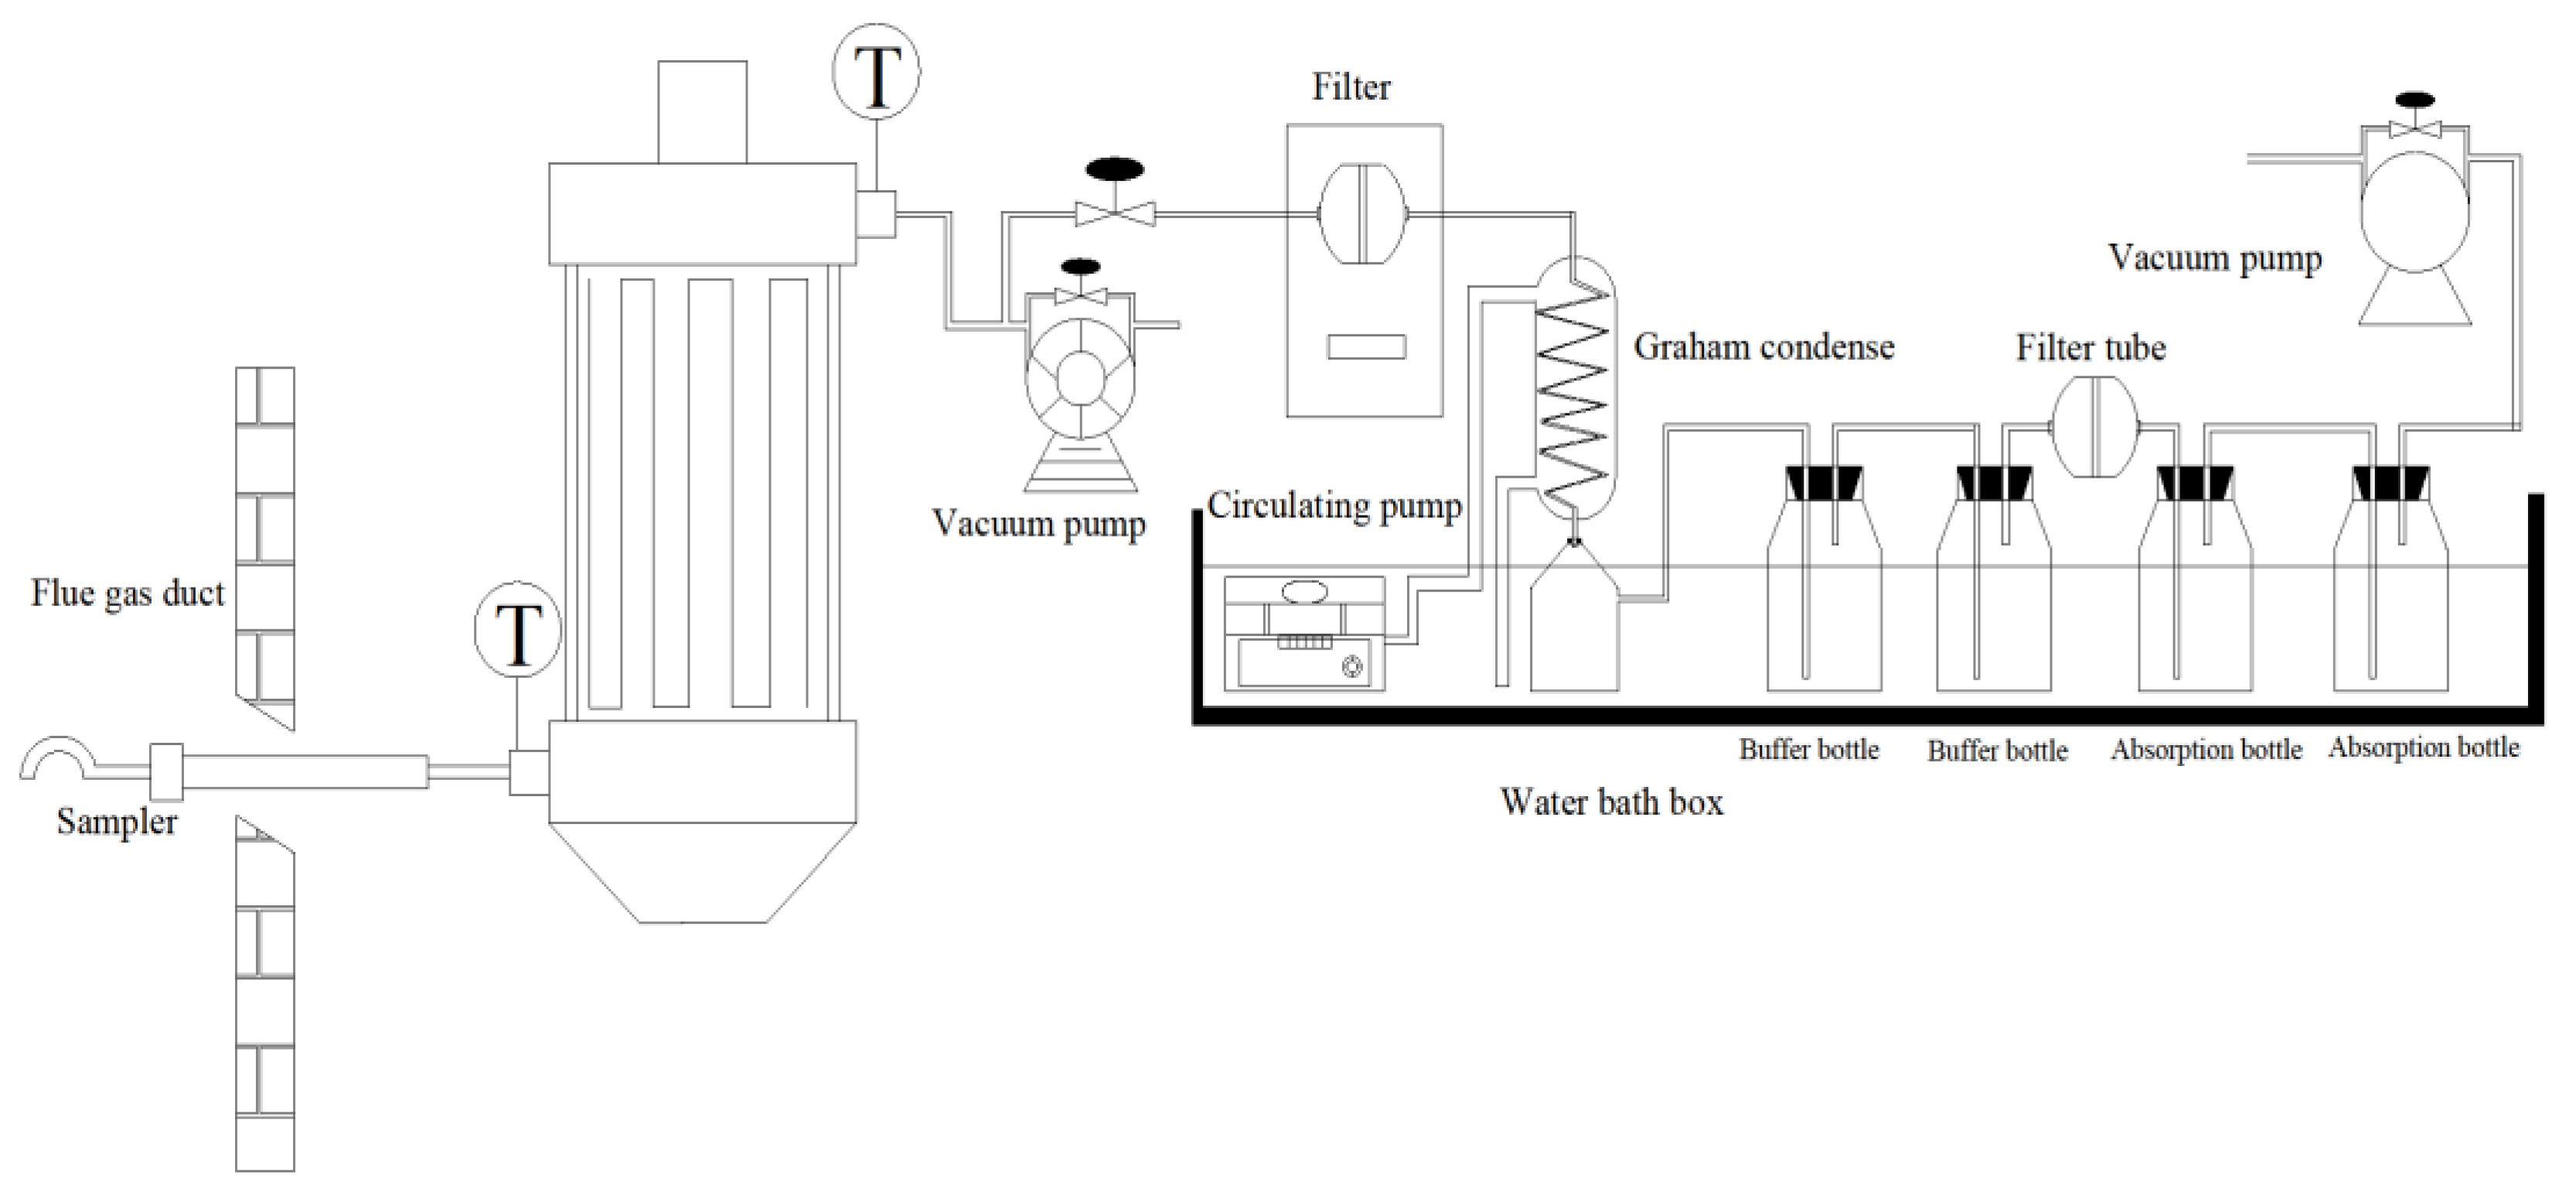
2.2. Experimental Methods

To verify the accuracy of the model established by the simulation software, the removal efficiency of CE−ESP was experimentally verified by conducting field experiments in a waste incineration plant and a coal−fired power plant. The experimental model size was consistent with the modeling size, and the experimental device was as shown in Figure 3 below. The front−end collection part consisted of a universal sampling nozzle, filter cartridge, and sampling gun for particulate matter collection systems. The end of the sampling gun was connected to a condensation tube with a hose. A condensate collection bottle, buffer bottle, and filter membrane were then connected to the sampling pump. Inside the water bath, a thermocouple thermometer was installed to ensure that the sampling temperature remained below 30 °C throughout the process. The working modes were consistent with the optimal parameters of the model, verifying the results of the model. The field experimental device used a stainless steel shell with a breakdown voltage of 25 KV. A temperature control interlayer was set up outside the dust tubular collection electrode to arrange a cooling circulating water system, which controlled the heat exchange rate by controlling the flow rate of the circulating cooling water. The field experiments were conducted according to EPA Method 202. The sampling equipment used the Laoying 3012H automatic flue gas tester to determine stable flow velocity sampling points in the flue and measure the flue gas temperature. Sampling points were set up behind the semi−dry reaction tower of the waste incineration plant and the dedusting device of the coal−fired power plant, to test the removal efficiency of CE−ESP on TPM in three modes (mode A1 denotes temperature field only, mode A2 denotes the electric field only, and mode A3 denotes multi−field coupled with temperature and electric fields). The experimental working conditions were as shown in Table 3 below.

3. Results and Discussion

3.1. Particle Behavior and Removal in the Temperature Field

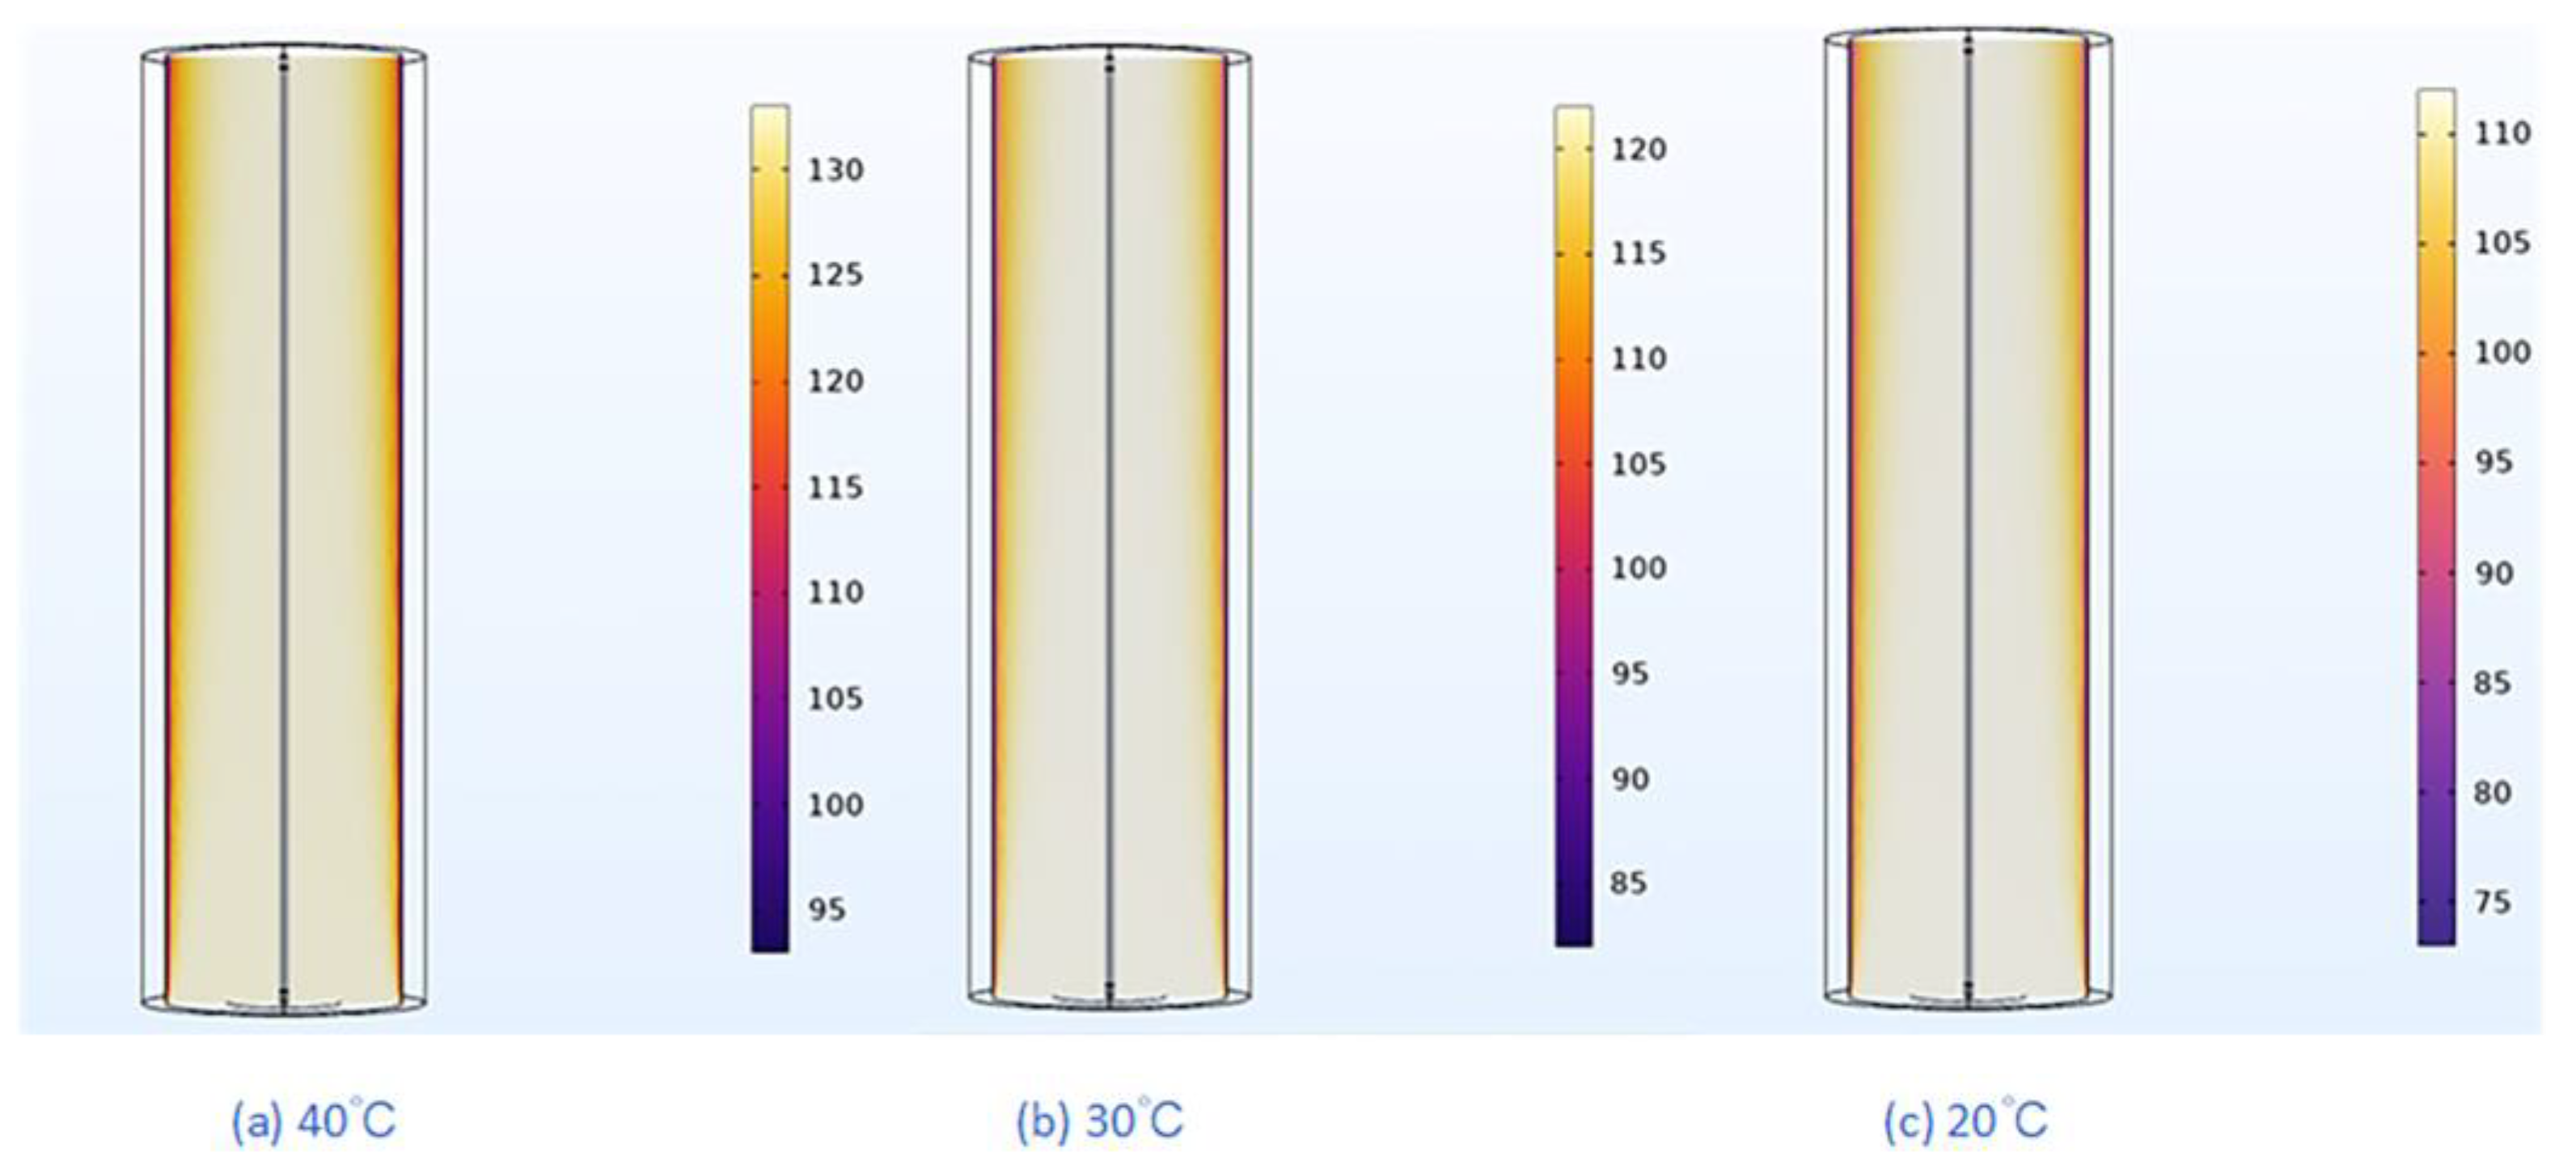
3.1.1. Analysis of the Temperature Distribution Effect in the Temperature Field

In A1, a heat exchange water tank was arranged outside the collecting electrode of the CE−ESP. During the operation of circulating cooling water, the heat at the collecting electrode was continuously removed by the cooling water, resulting in a significant temperature gradient in the near−wall region. At this time, the thermophoretic force caused by the temperature gradient had a direct impact on the deposition of particles at the collecting electrode, and then affected the distribution and motion characteristics of particles throughout the precipitator. In Figure 4, which shows temperature distribution diagrams for three working conditions of the model shows that, as wall temperatures dropped from 40 °C, to 30 °C and then to 20 °C, the flue gas temperature showed a gradually decreasing trend; as the temperature decreased gradually from the polar line region to the near−wall region, it was observed that the temperature of flue gas at the polar line position was the highest, and the temperature decreased as it approached the wall surface. A distinct low−temperature region was present in the near−wall area; the lower the wall temperature, the better the heat exchange efficiency of the flue gas. At a wall temperature of 20 °C, the near−wall region reached a temperature of up to 75 °C, with a significant drop in temperature occurring along the way.

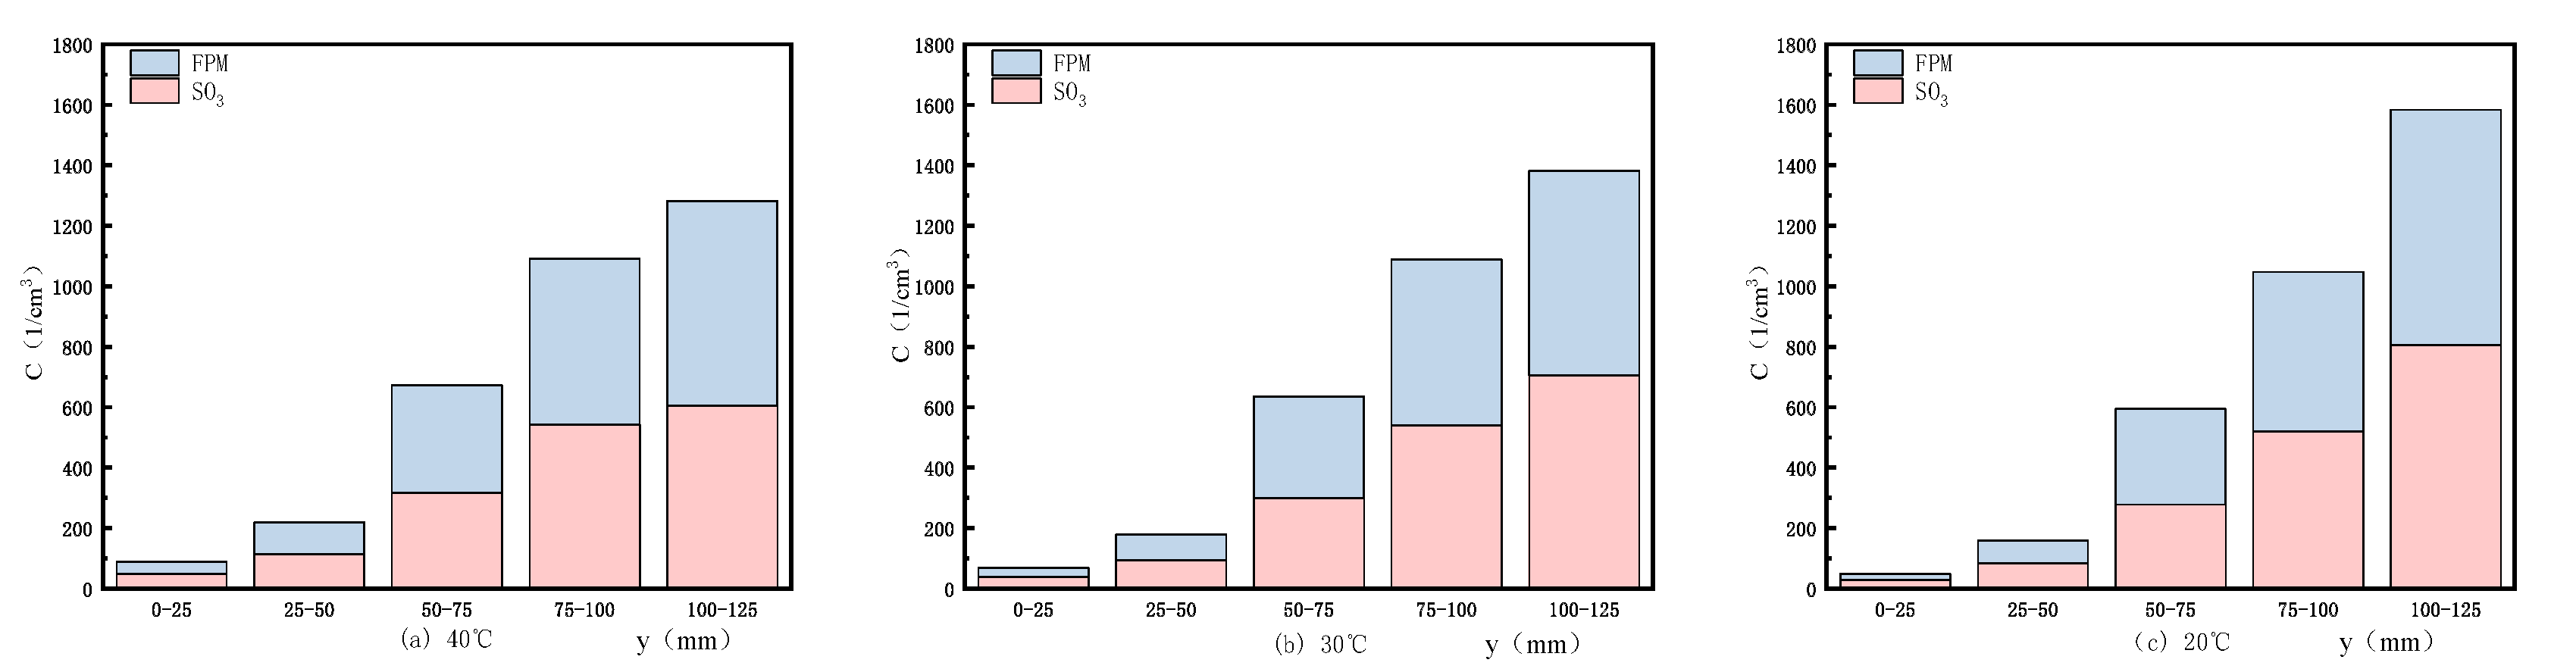
3.1.2. Particle Concentration Distribution along Radial Direction in the Temperature Field

On the basis of data of particulate matter concentration distribution inside the CE−ESP, the distance between particles and polar line was divided into five radial regions: 1–25, 25–50, 50–75, 75–100, and 100–125, which were named as Zone 1, Zone 2, Zone 3, Zone 4, and Zone 5, respectively. By observing the concentration distribution at different distance intervals from the cathode line, the following radial particle concentration distribution chart could be obtained. It can be seen from Figure 5 that the closer to the wall, the higher the particle concentration; the lower the temperature, the larger the temperature difference, resulting in a concentration difference in the five radial regions, thereby generating a concentration field and promoting further movement of particles towards larger concentrations. After the wall surface heat exchanged, a temperature gradient was generated in the near−wall region. The thermophoresis forces generated by this temperature gradient promoted the movement of particles towards the wall.

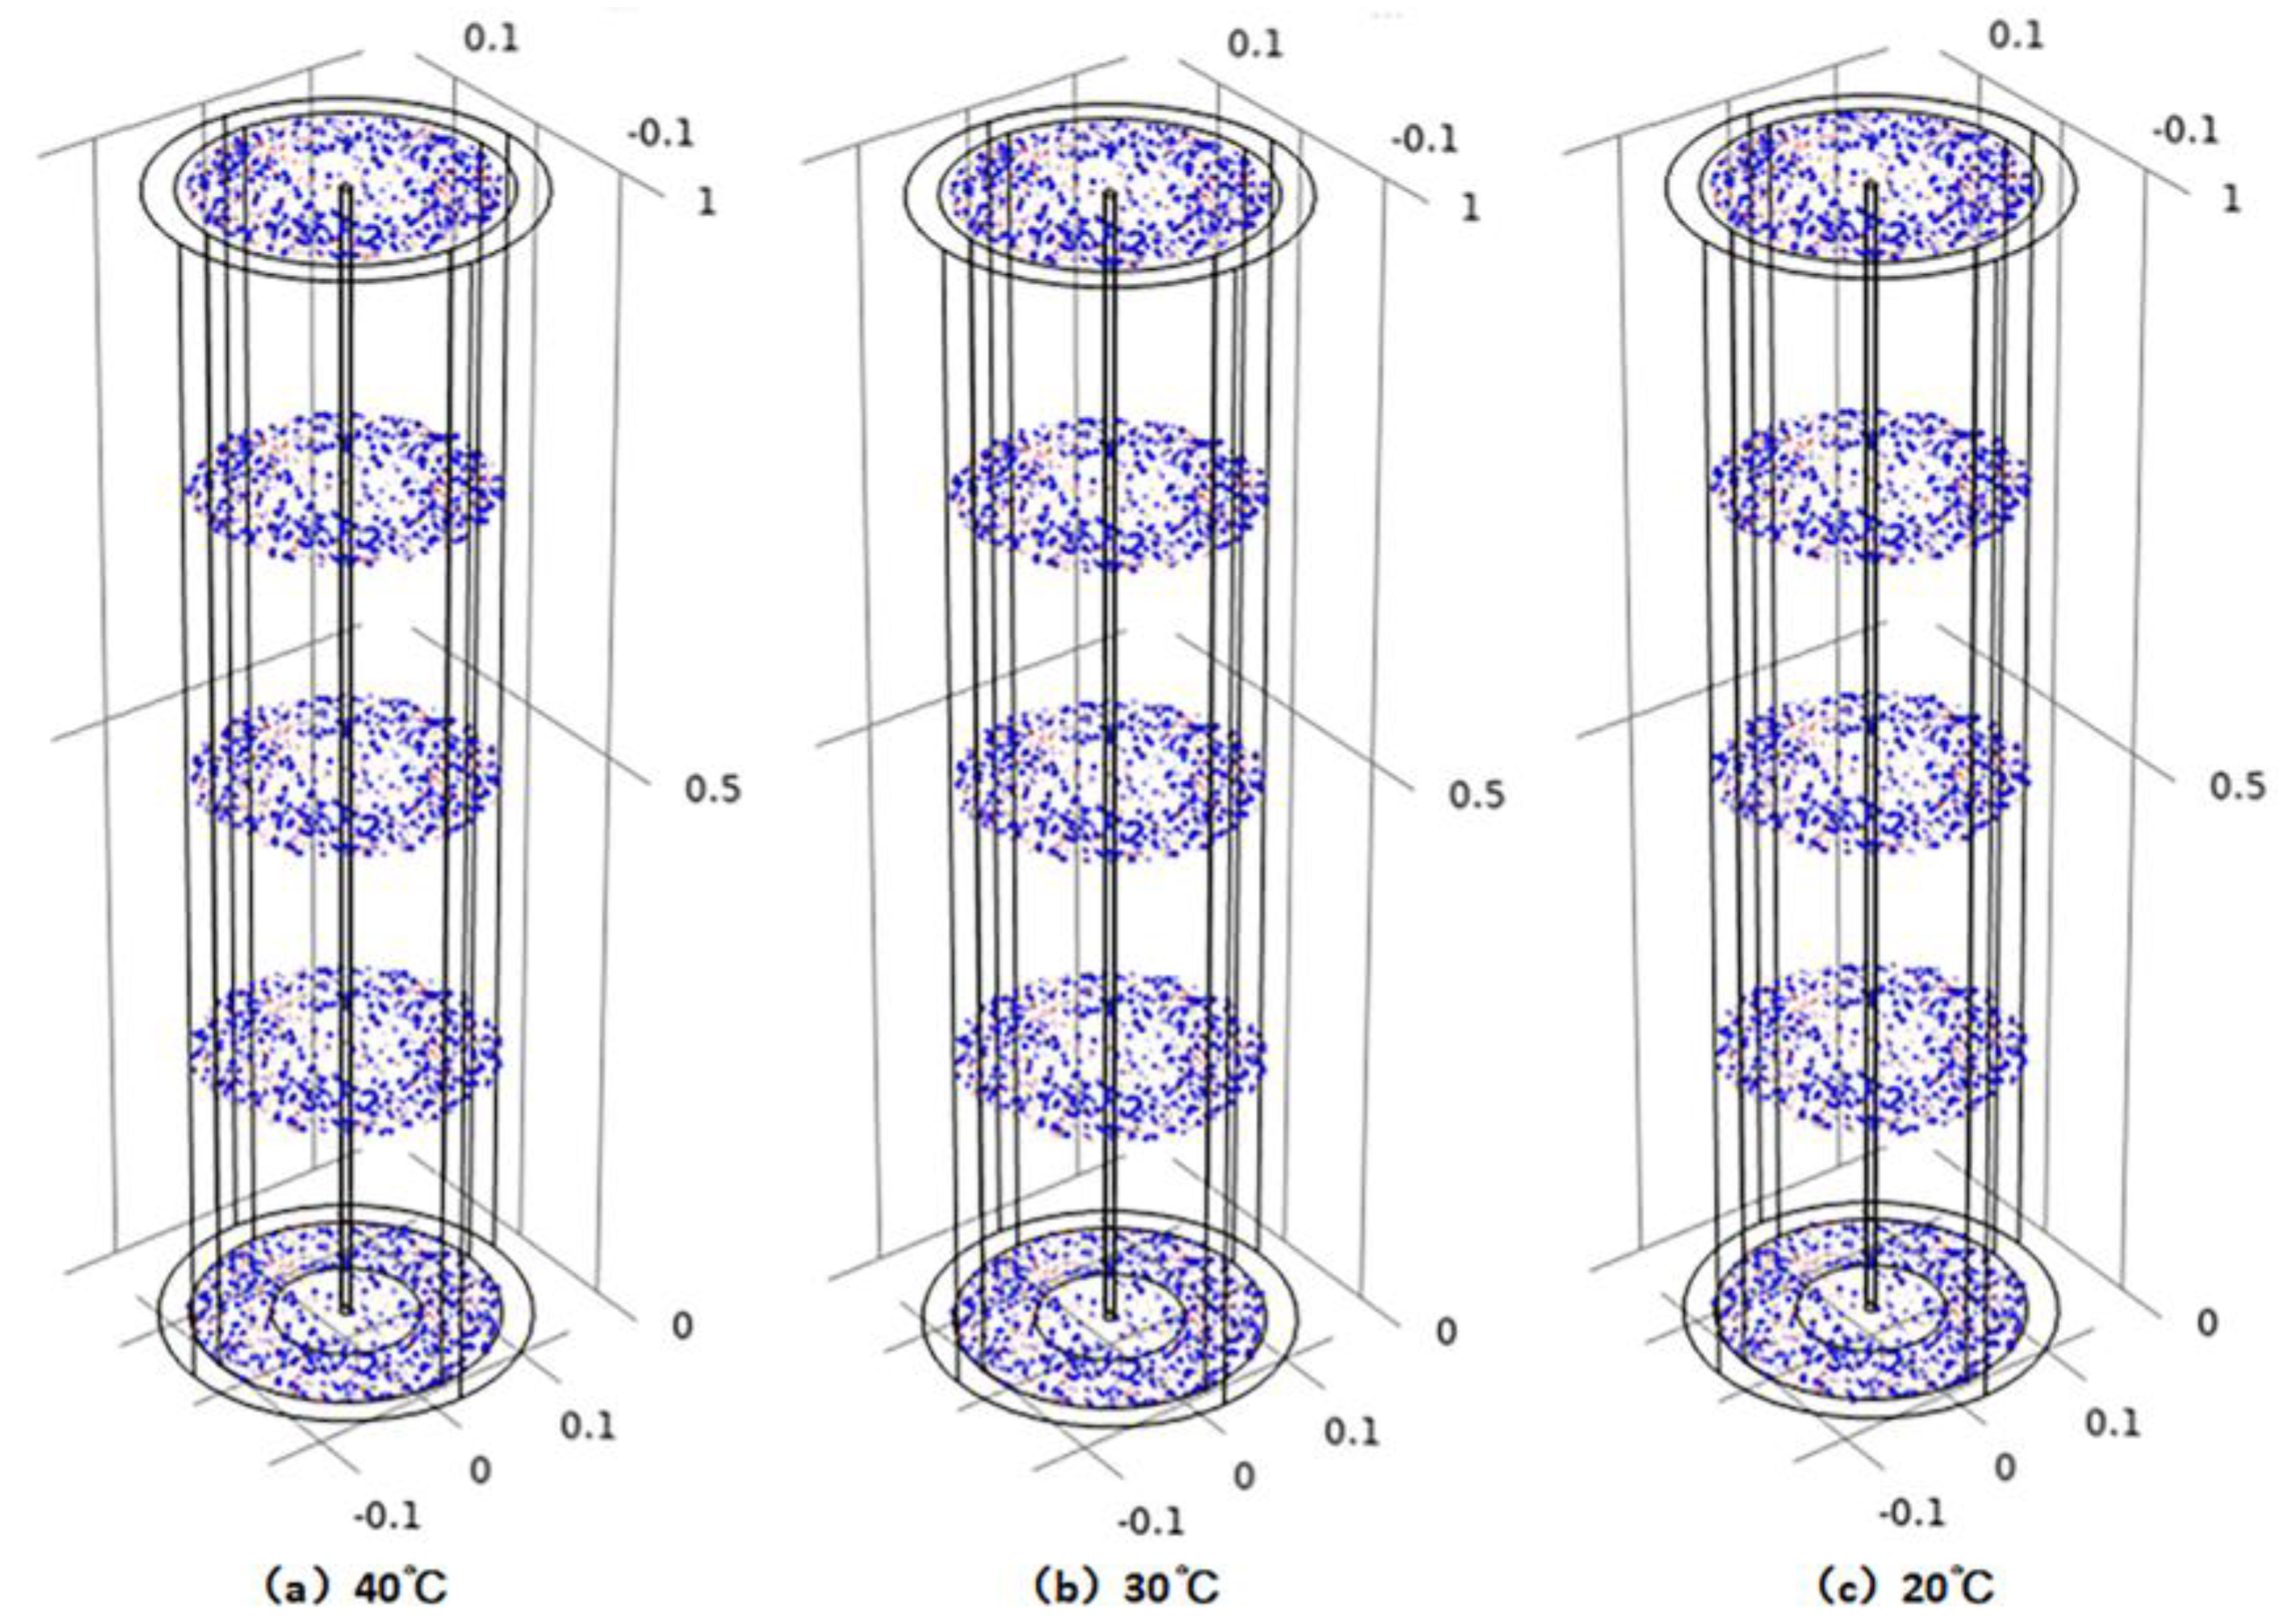
3.1.3. Particle Size Distribution along Axial Direction in the Temperature Field

In order to investigate the variation trend of particle concentration along the process, the CE−ESP was evenly divided into four parts axially, and the particle motion trajectories on five working surfaces (A, B, C, D, and E) were recorded. Figure 6 presents the gradual reduction rates of particulate matter with diameters of 0–0.1 μm, 0.1–0.5 μm, 0.5–1 μm, and 1–10 μm in four sections (B, C, D, and E) along the path for three temperatures. As can be seen from the figures, the gradual reduction rates of particulate matter along the path for three temperatures were generally consistent. With decreasing temperature and increasing temperature difference, the effect of thermophoresis forces became more pronounced, resulting in an increase in the reduction rate of particles of all sizes, with the lowest rate being noted in particles larger than 1 μm. In Figure 6c, the gradual reduction rate of 0–0.1 μm CPM particles was the highest, reaching 33.7%. The curves in Figure 6a–c all showed a downward trend, indicating that temperature field was beneficial for depositing small size particles: the greater the temperature gradient, the higher the removal efficiency of CPM; temperature was also conducive to the agglomeration and coalescence of fine particles, resulting in larger particle sizes. This led to higher removal efficiency for smaller particles. Zhou used an improved diffusion model to simulate gas−solid two−phase flow in pipes, and found that within a certain particle diameter range [22] the effect of thermophoresis forces on the movement and deposition of smaller particles was greater than that of larger particles. Byers studied the deposition efficiency of fine particles with average diameters of 0.3 μm and 1.2 μm, and found that the thermophoresis deposition efficiencies were 30% and 5%, respectively [23]. This fully illustrates that thermophoresis has a more significant effect on small particles. Meanwhile, the solid forces, such as electrostatic force and electric field force, which particles experience at the wall surface, also had a relatively significant effect on small particles. Therefore, small particles were found to be significantly better in terms of efficiently removing sulfur trioxide in the action of temperature field, and the FPM removal efficiency of large particles was weaker. Moreover, small−sized CPM particles showed typical characteristics of CPM, namely sensitivity to temperature, which led to more significant removal efficiency for particles below 1 μm in diameter.

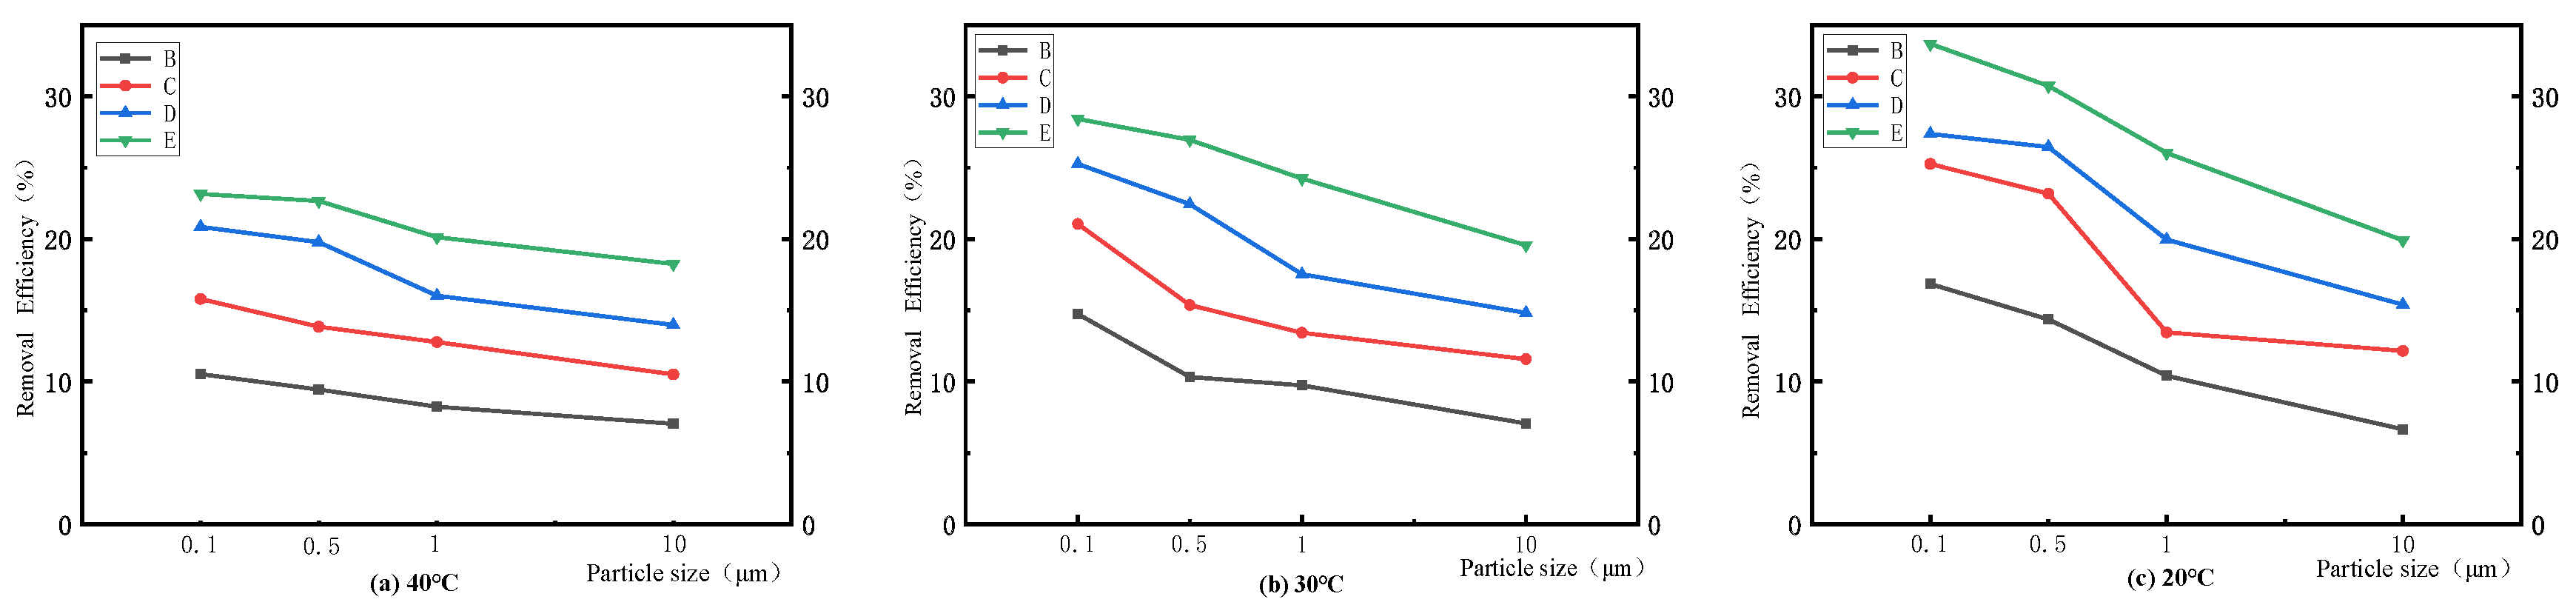
3.1.4. Particle Deposition and Removal along Axial Direction in the Temperature Field

As shown in Figure 7, particle concentration on the four working surfaces of a CE−ESP with external wall temperatures of 40 °C, 30 °C, and 20 °C could be seen, and it was observed that in the three working conditions, there was not much difference in concentration at different positions in each cross−section along the process. The concentration distribution of the entire cross−section was relatively uniform. However, along the direction of airflow flow, the uniformity of concentration distribution gradually decreased. The closer to the outlet, the lower the particle concentration. In traversing from left to right, we see that as the temperature decreases, the removal efficiency improves.
Figure 8 illustrates the deposition efficiencies of CPM, FPM, and TPM along the four working surfaces. It can be observed that as the temperature decreases, the deposition rate of particulate matter increases. As the temperature decreased, the removal efficiency of FPM remained relatively stable at around 18–19%, with little change. However, the removal efficiency of CPM increased significantly from 18% to 26%. The reason for this was that after a low temperature field was applied, the high temperature of the inlet flue gas produced a large temperature difference between the gas and the wall, forming a strong temperature gradient near the wall. The thermophoresis forces gradually increased. When the particles are in the temperature gradient field, the t thermophoresis forces drive them towards the lower temperature wall surface. Thermophoresis enhanced the force in the direction of wall movement for particles in the near−wall region, further consolidating the bonding between particles and the wall surface. This increased the effective deposition of particles, thereby improving the removal efficiency of particles. However, thermophoresis force was a short−range force and worked better in areas with significant temperature differences. It also had a more significant effect on smaller particle sizes, resulting in a more pronounced removal of CPM in single temperature field conditions.

3.2. Particle Behavior and Removal in the Electric Field

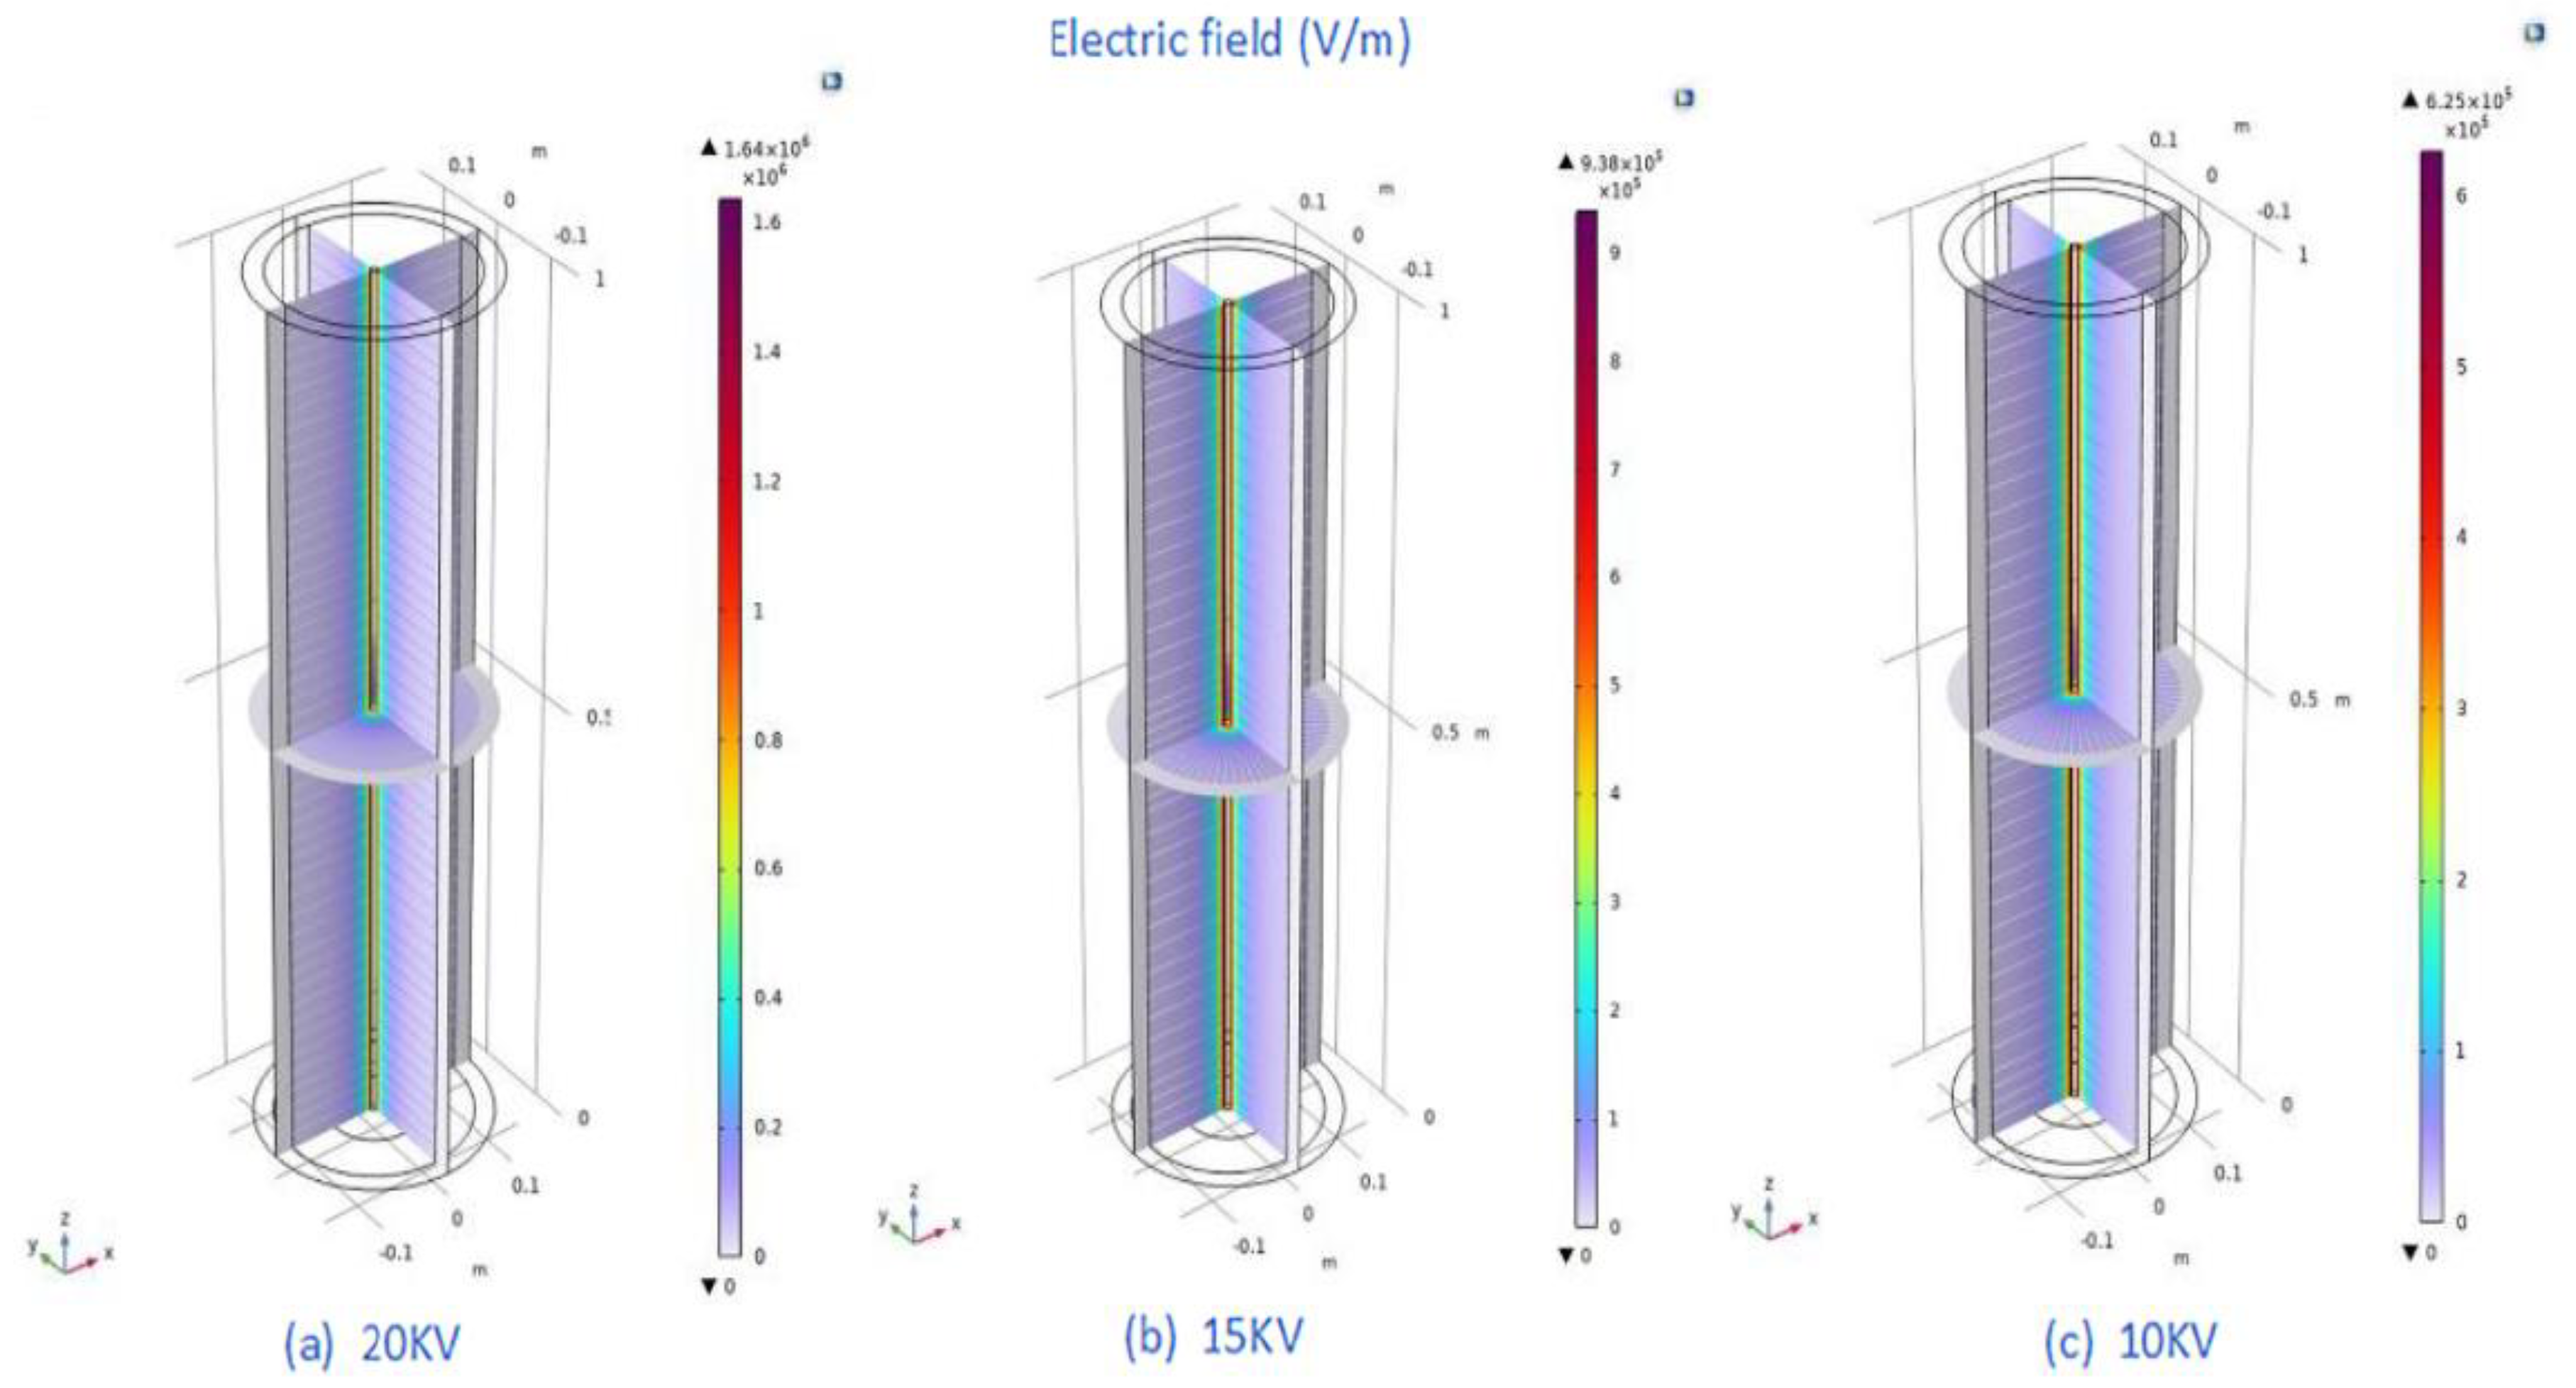
3.2.1. Analysis of Electric Field Distribution Effect in the Electric Field

When the flue gas entered the CE−ESP, the action of the airflow caused the particles in the airflow to move towards the outlet. At the same time, the discharge electrodes ionized the air, resulting in collision with the particles forming charged particles. The charged particles then moved towards the collection electrode having been influenced by the action of the electric field force, eventually depositing on the collection electrode. The magnitude of the electric field force was directly related to the magnitude of the applied voltage. The voltage had a significant impact on the distribution and motion characteristics of particles within the precipitator. In addition, through the influence of the action of the electric field, the force experienced by particles within the CE−ESP directly affected their concentration changes, motion trajectory, deposition conditions, and removal efficiency. The modeling results of the electrostatic field were represented by the electric field strength of the model cross−section. As shown in Figure 9, the electric field strength distribution inside the dust remover was given under three conditions of 10 kV, 15 kV and 20 kV. The electric field strength distribution was axially symmetrical. Since the shell was grounded, the wall potential was 0. The electric field strength inside the electrostatic precipitator decreased gradually from the corona electrode to the collection electrode. The closer to the corona electrode, the stronger the electric field strength. The overall high electric field strength range was small, and the change in electric field strength at the same position along the direction of the corona electrode was not significant. The stronger the applied voltage, the greater the electric field strength. In the condition of 20 kV, the maximum electric field strength inside the dust remover could reach 1.64 × 10⁶ V/m. In this mode, the charging efficiency of particulate matter was the highest and the Coulomb force it experienced was also the strongest. A larger electrode voltage created a larger potential gradient, providing better conditions for particle charging and achieving better dust collection efficiency.

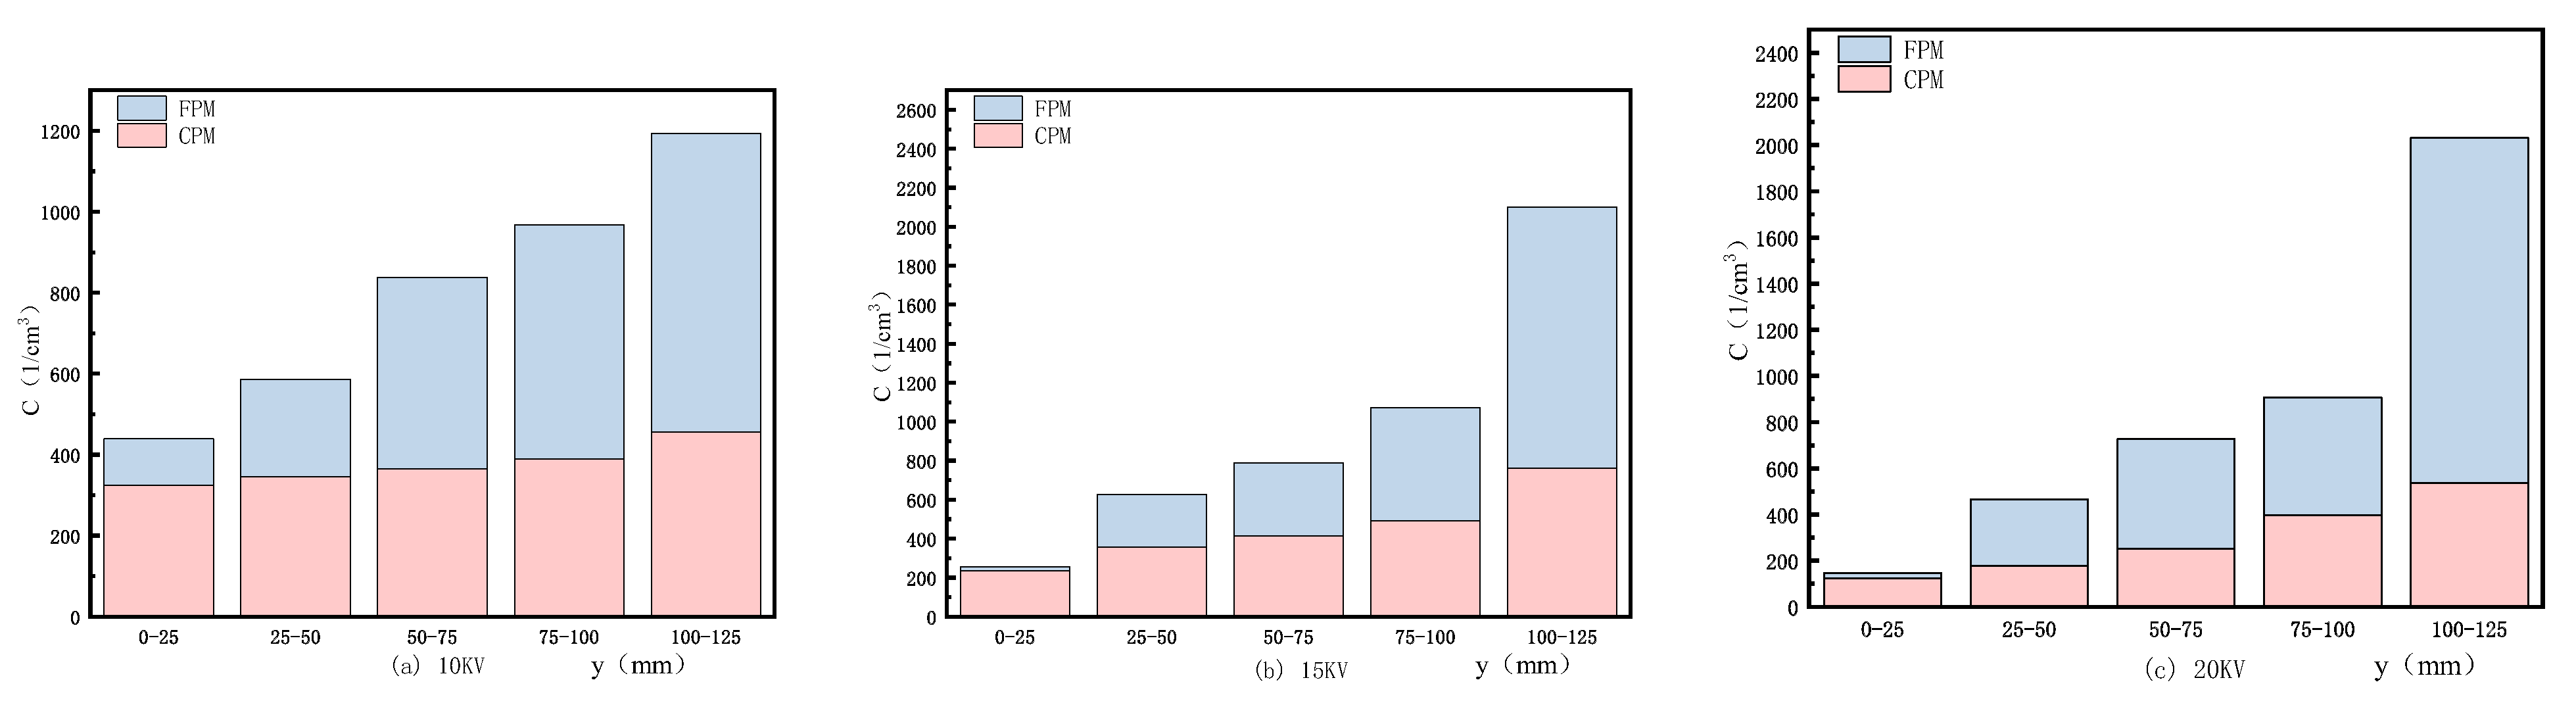
3.2.2. Particle Concentration Distribution along the Radial Direction in the Electric Field

On the basis of particle concentration distribution data for three different voltages inside the CE−ESP, the radial particle concentration distribution shown in Figure 10 could be obtained by observing the concentration distribution of different distance intervals from the cathode line. As voltage increased, we found, in accordance with the electric field charging theory of particles, that the charged energy of particles was proportional to the electric field intensity, electric field intensity increased with the increase of voltage, and the more charged particles were more conducive to the wall motion. The concentration of FPM with large particle size changed more obviously with the change of distance from the cathode line in the whole movement process; the larger the voltage, the larger the difference in radial particle concentration, with the concentration reaching its maximum after effective deposition near the wall. However, the concentration of CPM changed little, indicating that the single electric field had a poor effect on the removal of fine particles. In the area near the dust collecting pole, the air flow velocity was relatively small, and the electric field force, drag force, ionic wind force and other forces subjected to the particles were correspondingly weakened. When the particles entered the charged region, the applied electric field increased field strength around the electrode, and the charged particles began, as the electric field force and drag force exerted influence, to move towards the wall. Finally, the particles collided with the dust collecting pole and were collected, and the concentration near the pole gradually decreased.

3.2.3. Particle Size Distribution along Axial Direction in the Electric Field

As can be seen from Figure 11, in different voltage conditions that travelled along the direction of airflow movement, the grade concentration reduction rate showed a trend of gradually increasing. As voltage increased, the grade concentration reduction rate gradually increased. The larger the particle size, the higher the removal efficiency. The electric field had poor removal efficiency for particles with a particle size of around 0–0.5 μm, and the increase in voltage had little effect on their concentration reduction rate. The main reason for this was because when the particle size was between 0–0.5 μm, both field charging and diffusion charging mechanisms needed to be considered simultaneously. The special distribution of grade concentration reduction rate along the flow direction in electrostatic action was formed by the interaction between particle charging and fluid drag force [24]. Moreover, when the particle size was small, the van der Waals force and electrostatic attraction at the near−wall region were less than the electrostatic repulsion, making it difficult for particles to be adsorbed onto the wall surface. This led to a positive correlation between the electric field’s removal efficiency of particulate matter and particle size, which was consistent with many experimental results. In the systematic experimental study of electric precipitators by Ji, it was found that the main disadvantage of the precipitator was the difficulty it encountered when removing small particles. When the inlet wind speed of the experiment was 8.0 m/s, the removal efficiency of smoke and dust below 1 μm was only 35.5%.

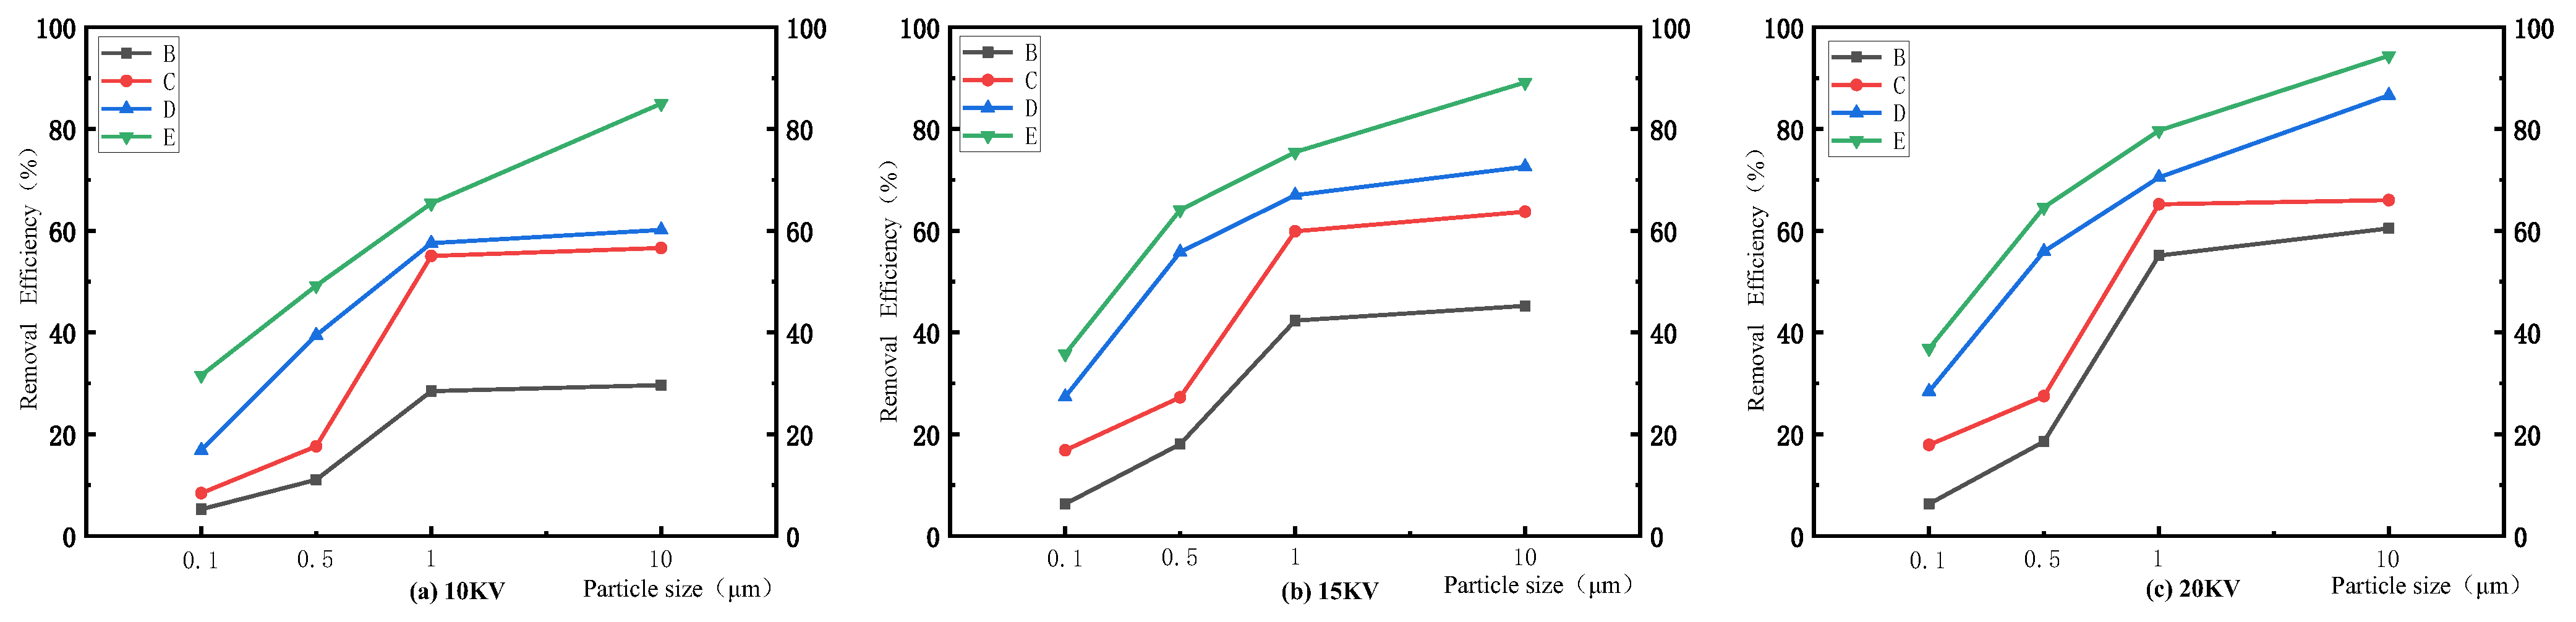
3.2.4. Particle Deposition and Removal along Axial Direction in the Electric Field

In referring to the modeling results and Figure 12, we see that, in comparison to the temperature field scenario, a drastic change occurred in the concentration distribution at each cross−section in an electric field application. The concentration distribution of each cross−section was consistent when subject to the influence of the electric field. Along the direction of the airflow, the concentration of particles in the vicinity of the cathode line decreased significantly. Furthermore, as the airflow developed, particles near the cathode line gradually moved towards the wall surface, resulting in a gradual decrease in the average concentration at the cross−section. With the increase in voltage, the overall concentration along the cross−section gradually decreased, and the movement of particles towered the wall surface intensified [25]. After the application of an external electric field, the forces, such as resistance and pressure gradient force, that acted on the particles and were related to the flow field velocity remained unchanged. However, the additional field force generated by the external electric field acted on the particles at this time, exerting a significant influence on the motion of the particles, driving the particles towards the collecting and discharging tubular collection electrode. When approaching the wall, the variation of particle concentration along the path was relatively small which was because, in this area near the wall, the airflow velocity was relatively small. At this time, the electric field force, drag force, ion wind force and other forces acting on the particles were correspondingly weakened, and many particles could not pass through the boundary layer near the wall and were directly carried away by the mainstream airflow.
Figure 13 shows the deposition efficiency at different CPM, FPM, and TPM positions. It can be seen that as the voltage increased, so did the average electric field strength inside the CE−ESP and so did the space charge density also increased, which promoted the removal efficiency of particles. When particles move in an electric field, they tend to migrate towards the tubular collection electrode, and this migration tendency becomes more pronounced as voltage increases. According to the electric field charging theory of particles, the charge number of particles is directly proportional to the electric field strength. However, we observed that the concentration of FPM, when compared to CPM, changed more drastically with voltage, and the removal efficiency was significantly higher. At 20 kV, the removal efficiency of CPM at the outlet was 71%, while FPM could reach 82%. The charging of particles was positively correlated with particle size, and so micro−sized particles had a small charge amount and a small deflection amplitude, resulting in slow movement. It could be seen that a single electric field had a fast dust removal speed and high dust removal efficiency for large particle sizes, and also that when particle size was larger, the dust removal effect was improved. In the case of submicron−sized CPM, the dust removal efficiency was significantly reduced, and this was because its charging mechanism was more complex, with both electric field charging and diffusion charging playing a role, which resulted in diffusion charging being the dominant charging mechanism. Additionally, due to their small particle size, these particles were not only affected by the electric field force but also by other forces, such as drag force and ion wind force, making the dust removal process more complicated. Indeed, as evidenced by the deposition efficiency plots of TPM, an increase in voltage led to a progressive shift of particle deposition towards the front and a concomitant increase in deposition quantity. This phenomenon could be attributed to the enhanced electrostatic forces acting on the particles within the electric field, resulting in these particles being more efficiently captured and then deposited onto the tubular collection electrode.

3.3. Particle Behavior and Removal in the Multi−Field

3.3.1. Particle Concentration Distribution along the Radial Direction in the Multi−Field

The comparison of TPM concentration changes in single−field and multi−field regions in Figure 14 shows an increasing trend in particle concentration from the pole line position to the wall surface position. The multi−field region displayed a greater concentration gradient, which led to the formation of a concentration field near the wall surface that further promoted the movement of particulate matter towards the wall. Changed particles, in only being influenced by the electric field, moved towards the tubular collection electrode having been subject to the combined action of the electric field force and fluid drag force. However, when the particles approached the wall surface, a portion of them could not have been able to pass through the boundary layer and were carried away by the main airflow, which may have produced a decrease in particle removal efficiency. When the temperature field was coupled with the electric field, a significant temperature gradient was formed near the wall surface (due to the higher gas temperature), which resulted in an increasing thermal migration force. When particles were subjected to the temperature gradient field, the thermal migration force drove them towards the cooler wall surface. As a result, some particles settled on the wall surface, having been subject to the combined action of thermal migration force and electric field force. Additionally, the increased deposition thickness of charged particles at the wall surface strengthened the interaction between the particle forces and the solid phase, reducing the repulsive force that pushes particles away from the wall surface, which This mitigated the back mixing phenomenon of particles in the near−wall region and enhanced their removal efficiency.

3.3.2. Particle Size Distribution along the Axial Direction in the Multi−Field

As shown in Figure 15, the concentration reduction rate of the multi−field along the pipe increased with each stage. The concentration reduction rates of CPM particles with particle sizes of 0–0.1 μm and 0.1–0.5 μm were greatly improved. The reduction rates of CPM particles with particle sizes of 0–0.1 μm and 0.1–0.5 μm on working surface B were only 10.12% and 17.25%, but reached 78% and 81% at the outlet. The concentration reduction rate of particles with sizes around 1–10 μm had the smallest difference in the process, indicating that the agglomeration of particles around 0–0.5 μm led to a decrease in their number, while causing an increase in the number of larger particles. This was mainly due to the increase in spatial charge density, which increased the probability of collisions and agglomeration between particles. This phenomenon was more pronounced in the near−wall region, where particle agglomeration was more significant [4]. After agglomeration occurred, it was apparent that, in each particle size that corresponded to a certain stage, the agglomeration of its own particles into larger particles would result in a decrease in the number of its own particles and an increase in the number of larger particles. This led to a corresponding increase or decrease in the concentration reduction rate at each stage.

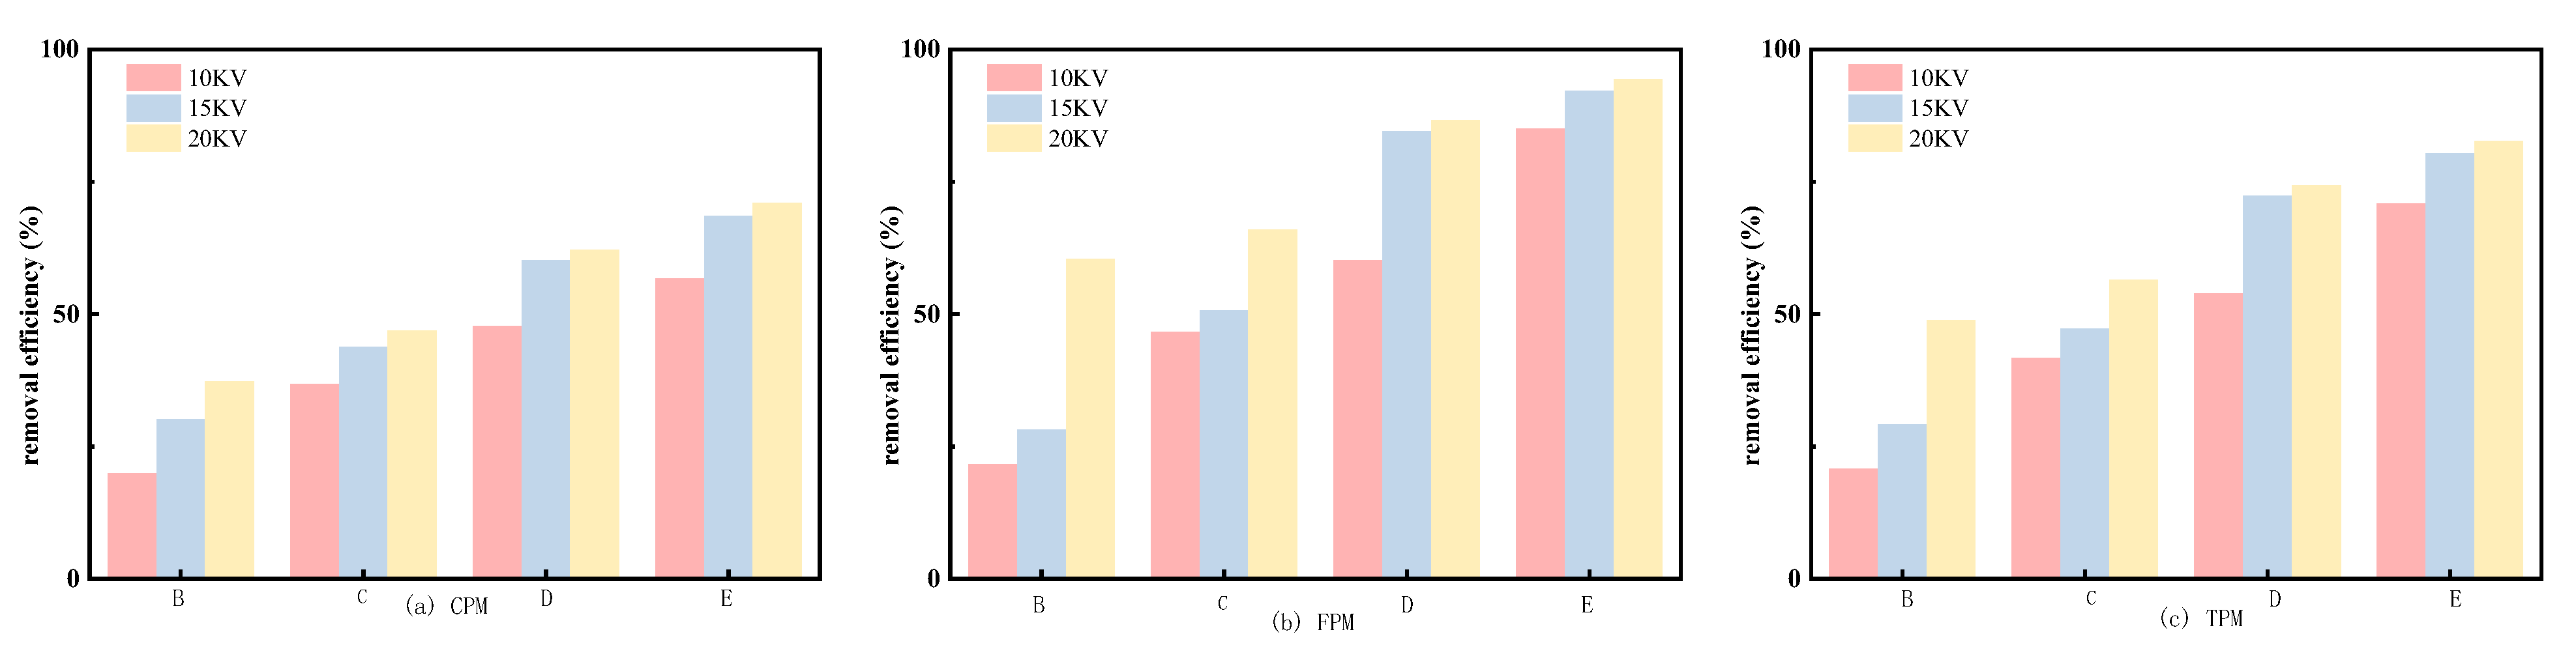
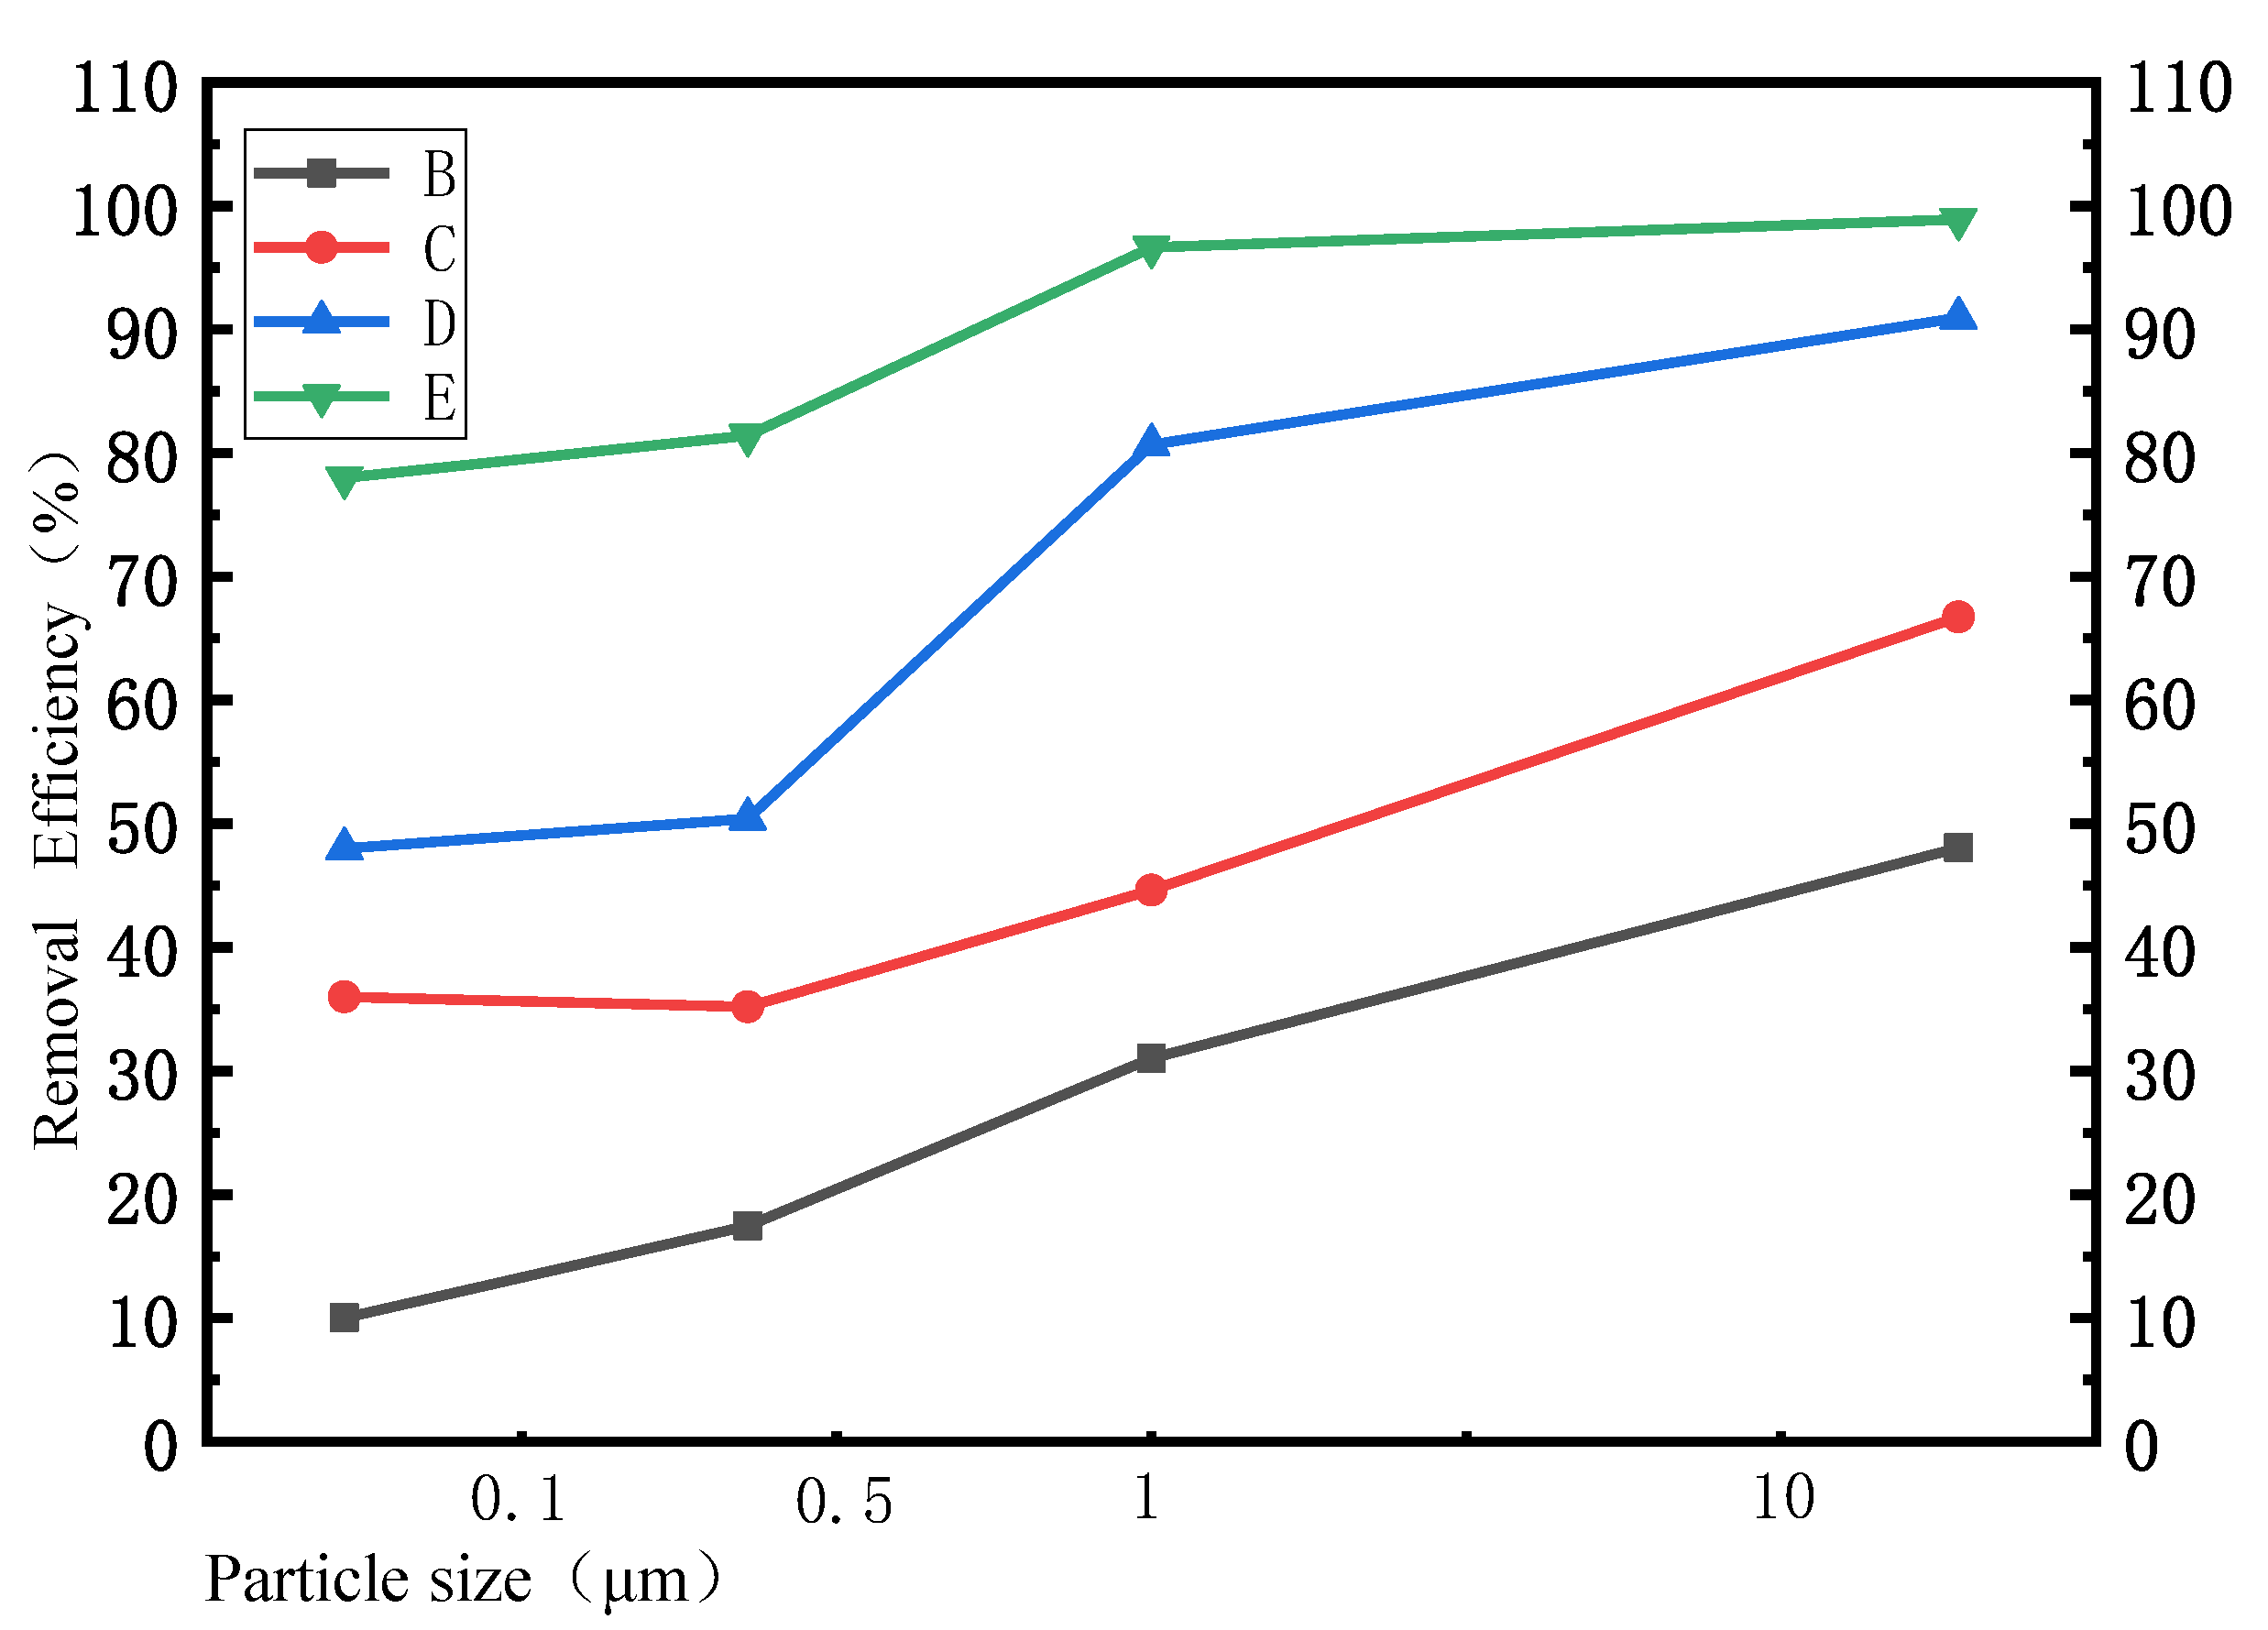
3.3.3. Particle Deposition and Removal along the Axial Direction in the Multi−Field

As shown in Figure 16, the deposition efficiency trend for temperature field, electric field, and multi−field were similar. The efficiency of export removal increased sequentially. The multi−field could achieve a removal efficiency of TPM of up to 93%. The decrease in temperature in the multi−field reduced the corona onset voltage and increased the spatial charge density, which was beneficial for charging small particles that primarily undergo diffusion charging. The increase in CPM charging of small particles led to a significant improvement in their concentration reduction rate along the process, which was approximately 18% higher, compared to the single electric field. The FPM in larger particle size was mainly charged by the electric field with a fast−charging speed, and could approach the saturation charge in a short time. Therefore, the decrease in temperature had no significant effect on the reduction rate of concentration of large particles along the way, and the removal efficiency was only about 5% higher than that of a single electric field. When the electric field and temperature field were combined, the temperature field would have an impact on the flow field. The gas density decreased with increasing temperature, while the gas viscosity increased. This resulted in an increase in the fluid drag force experienced by the particles. In a synergistic state, temperature gradient and concentration gradient jointly promoted particle movement towards the wall direction and, as the deposition position of particles gradually moved forward; the deposition amount gradually increased, verifying the theory of coupling field promoting particle deposition.

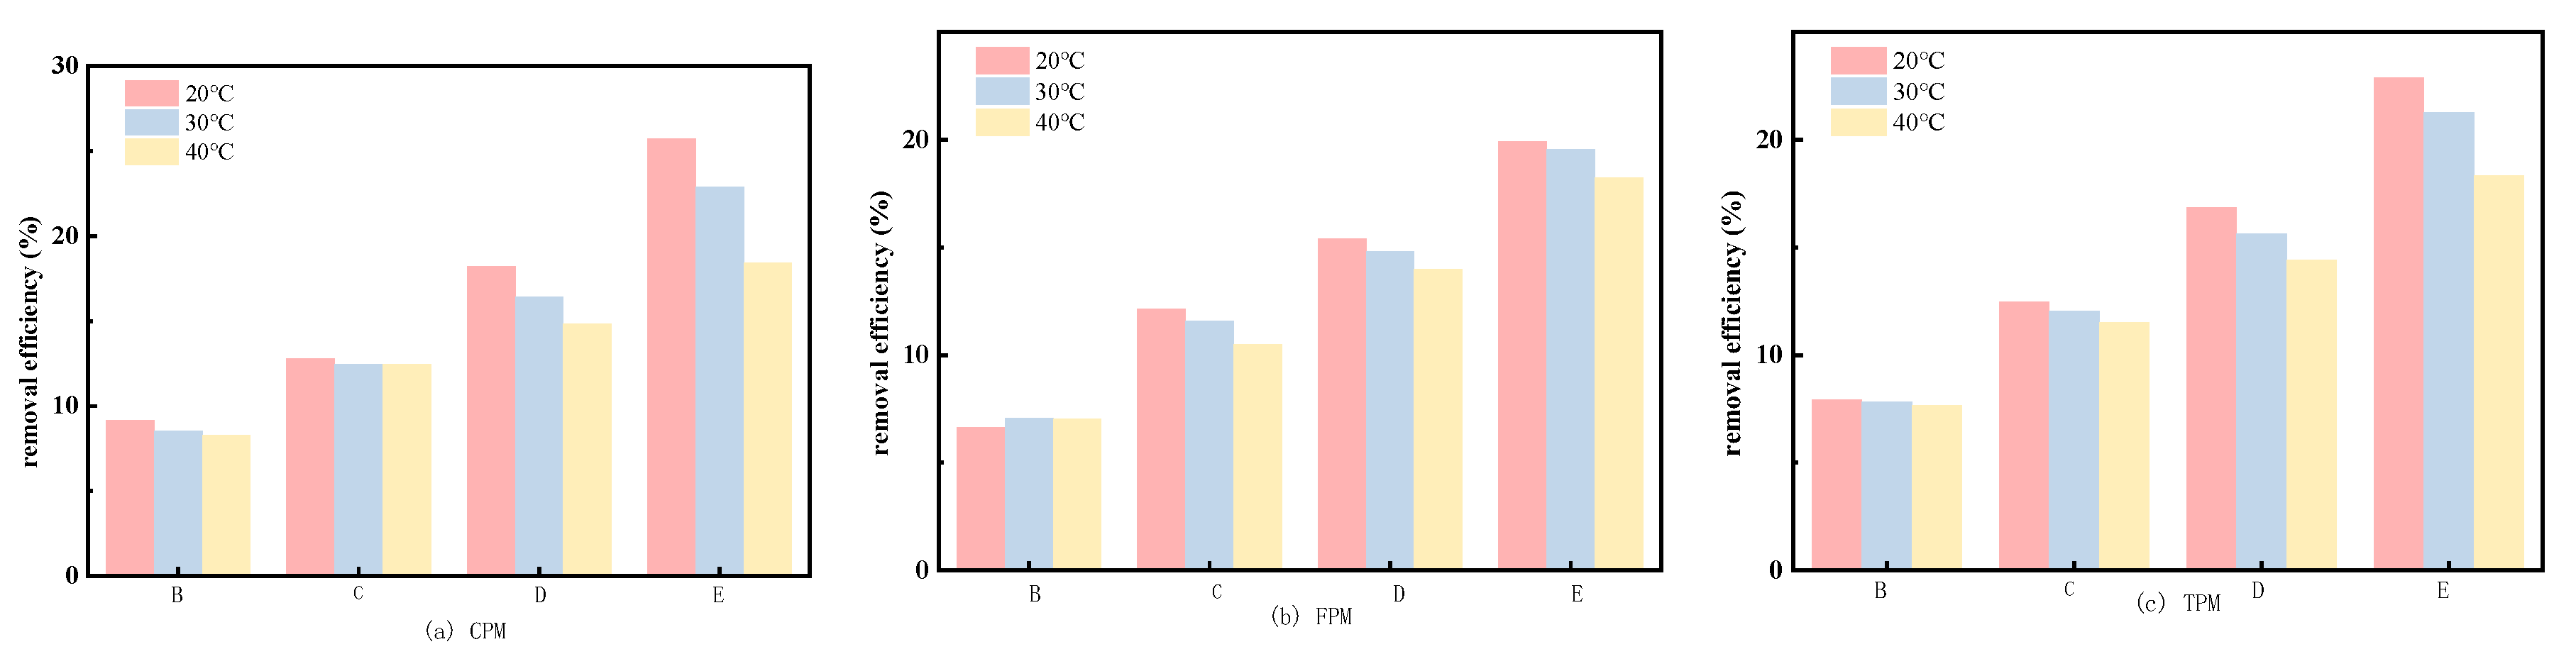
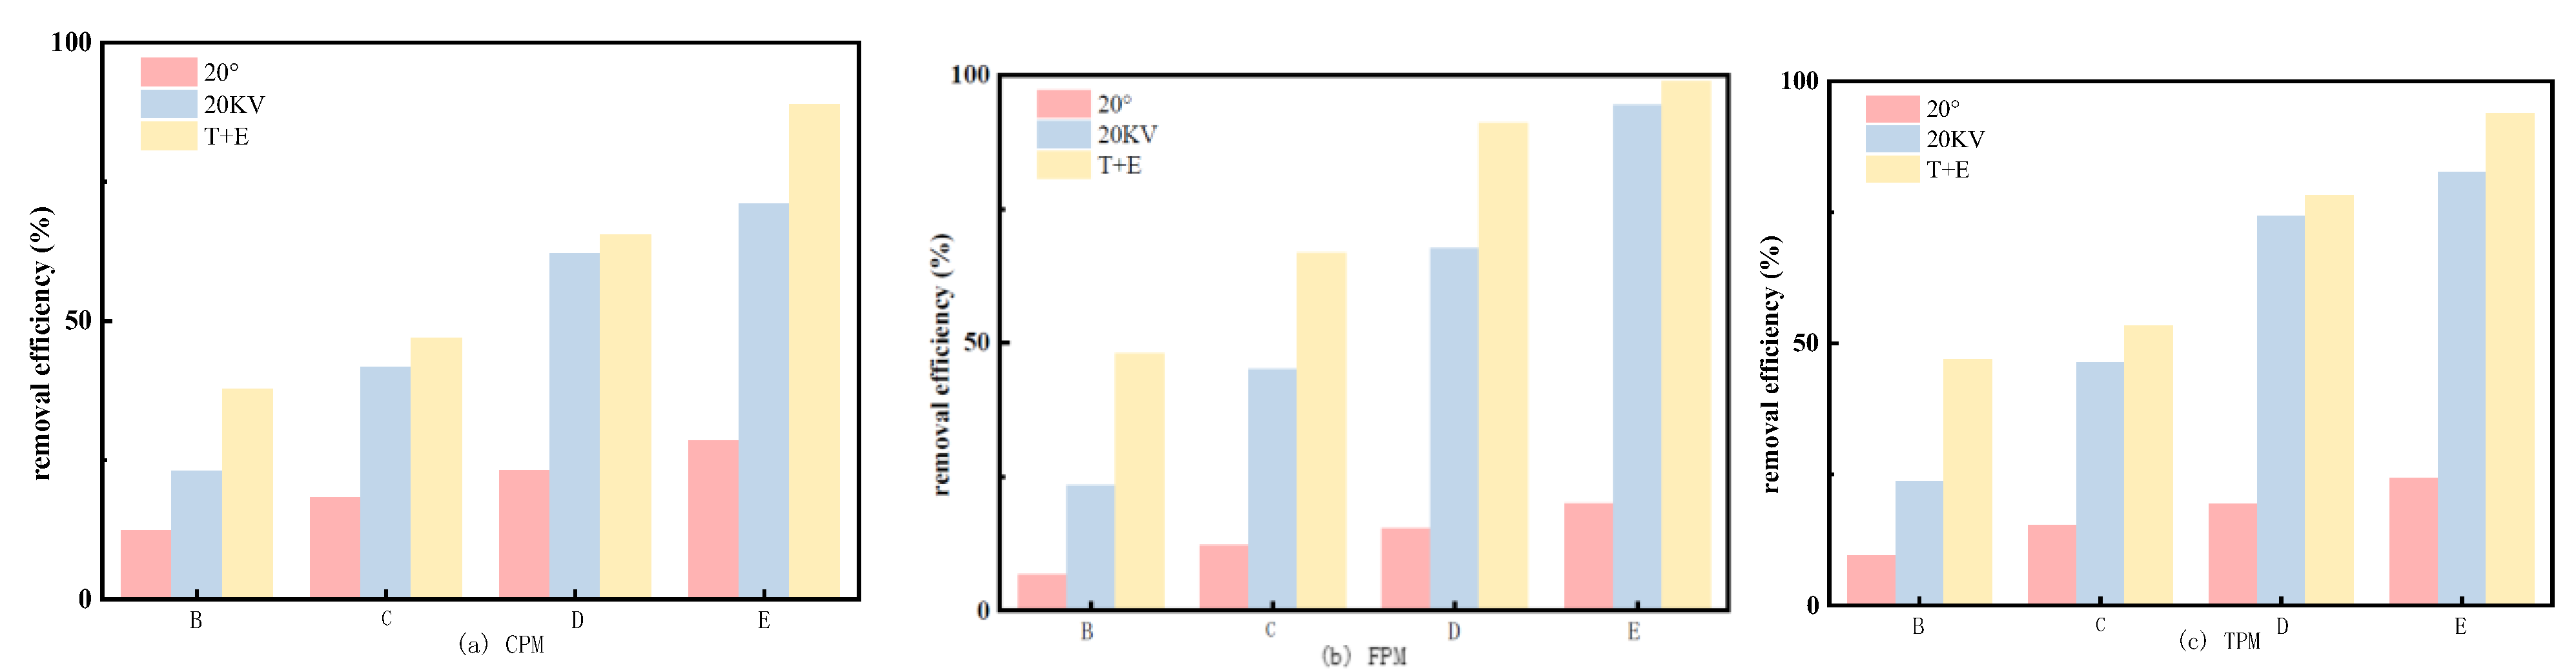
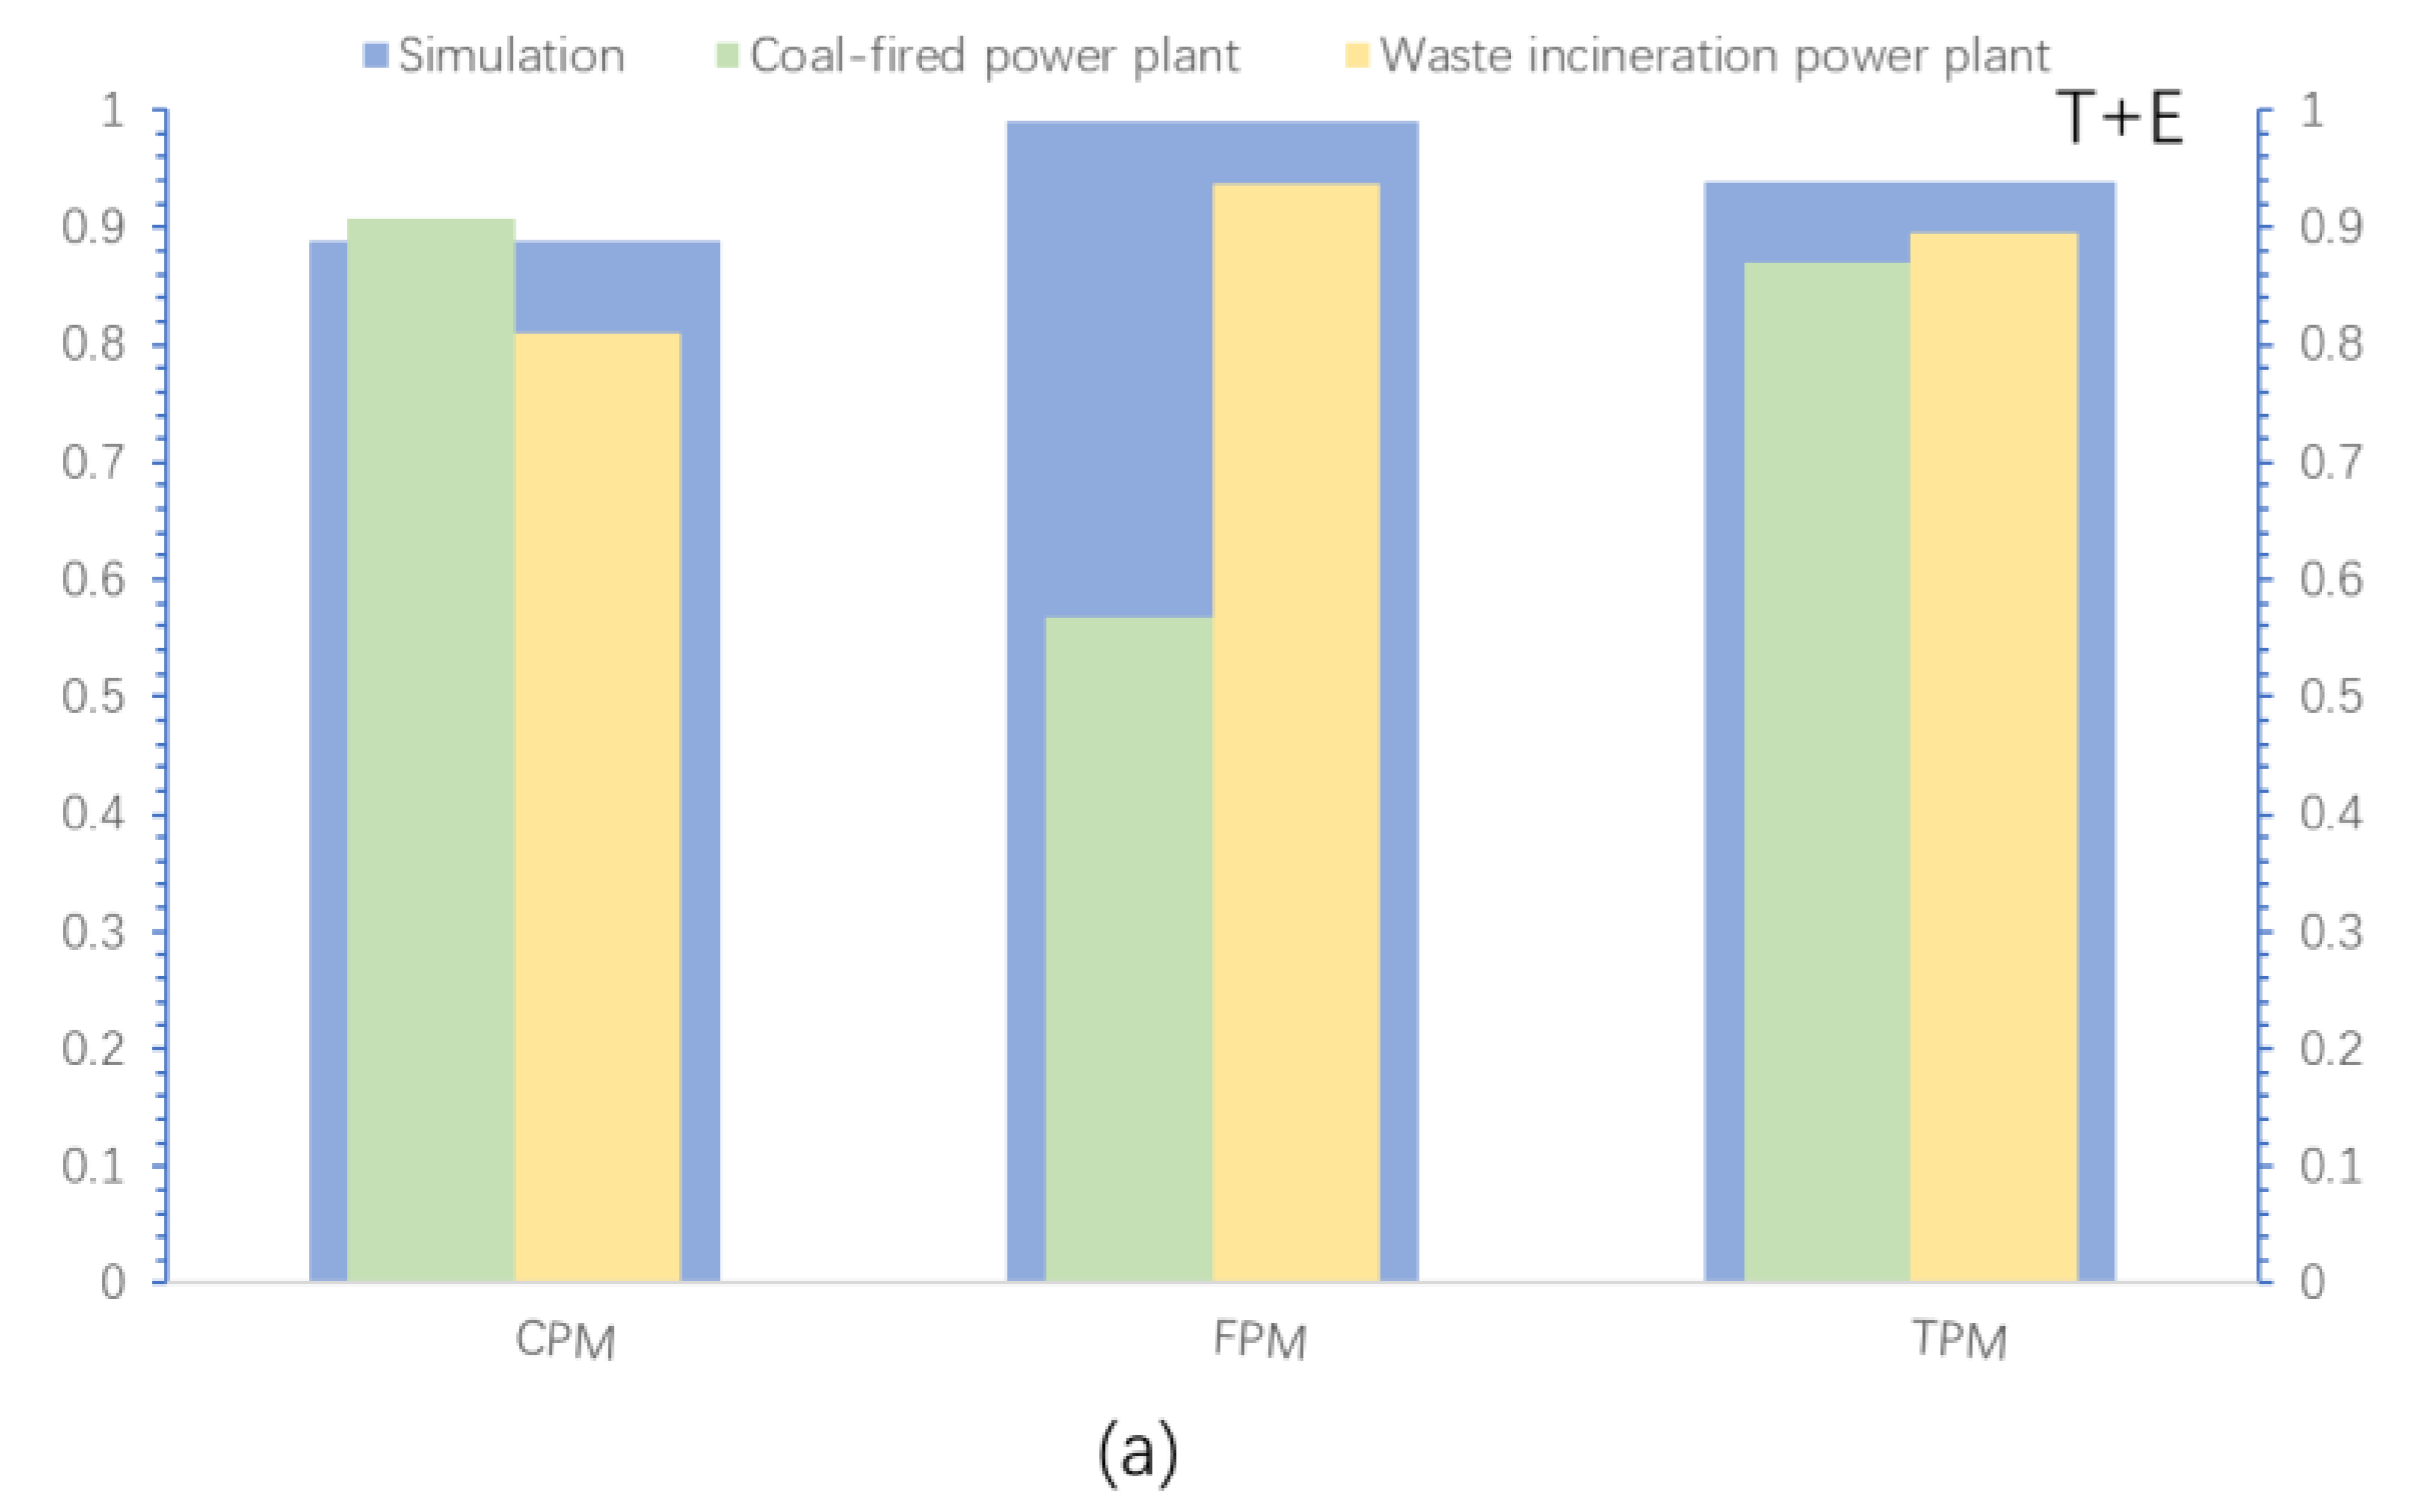
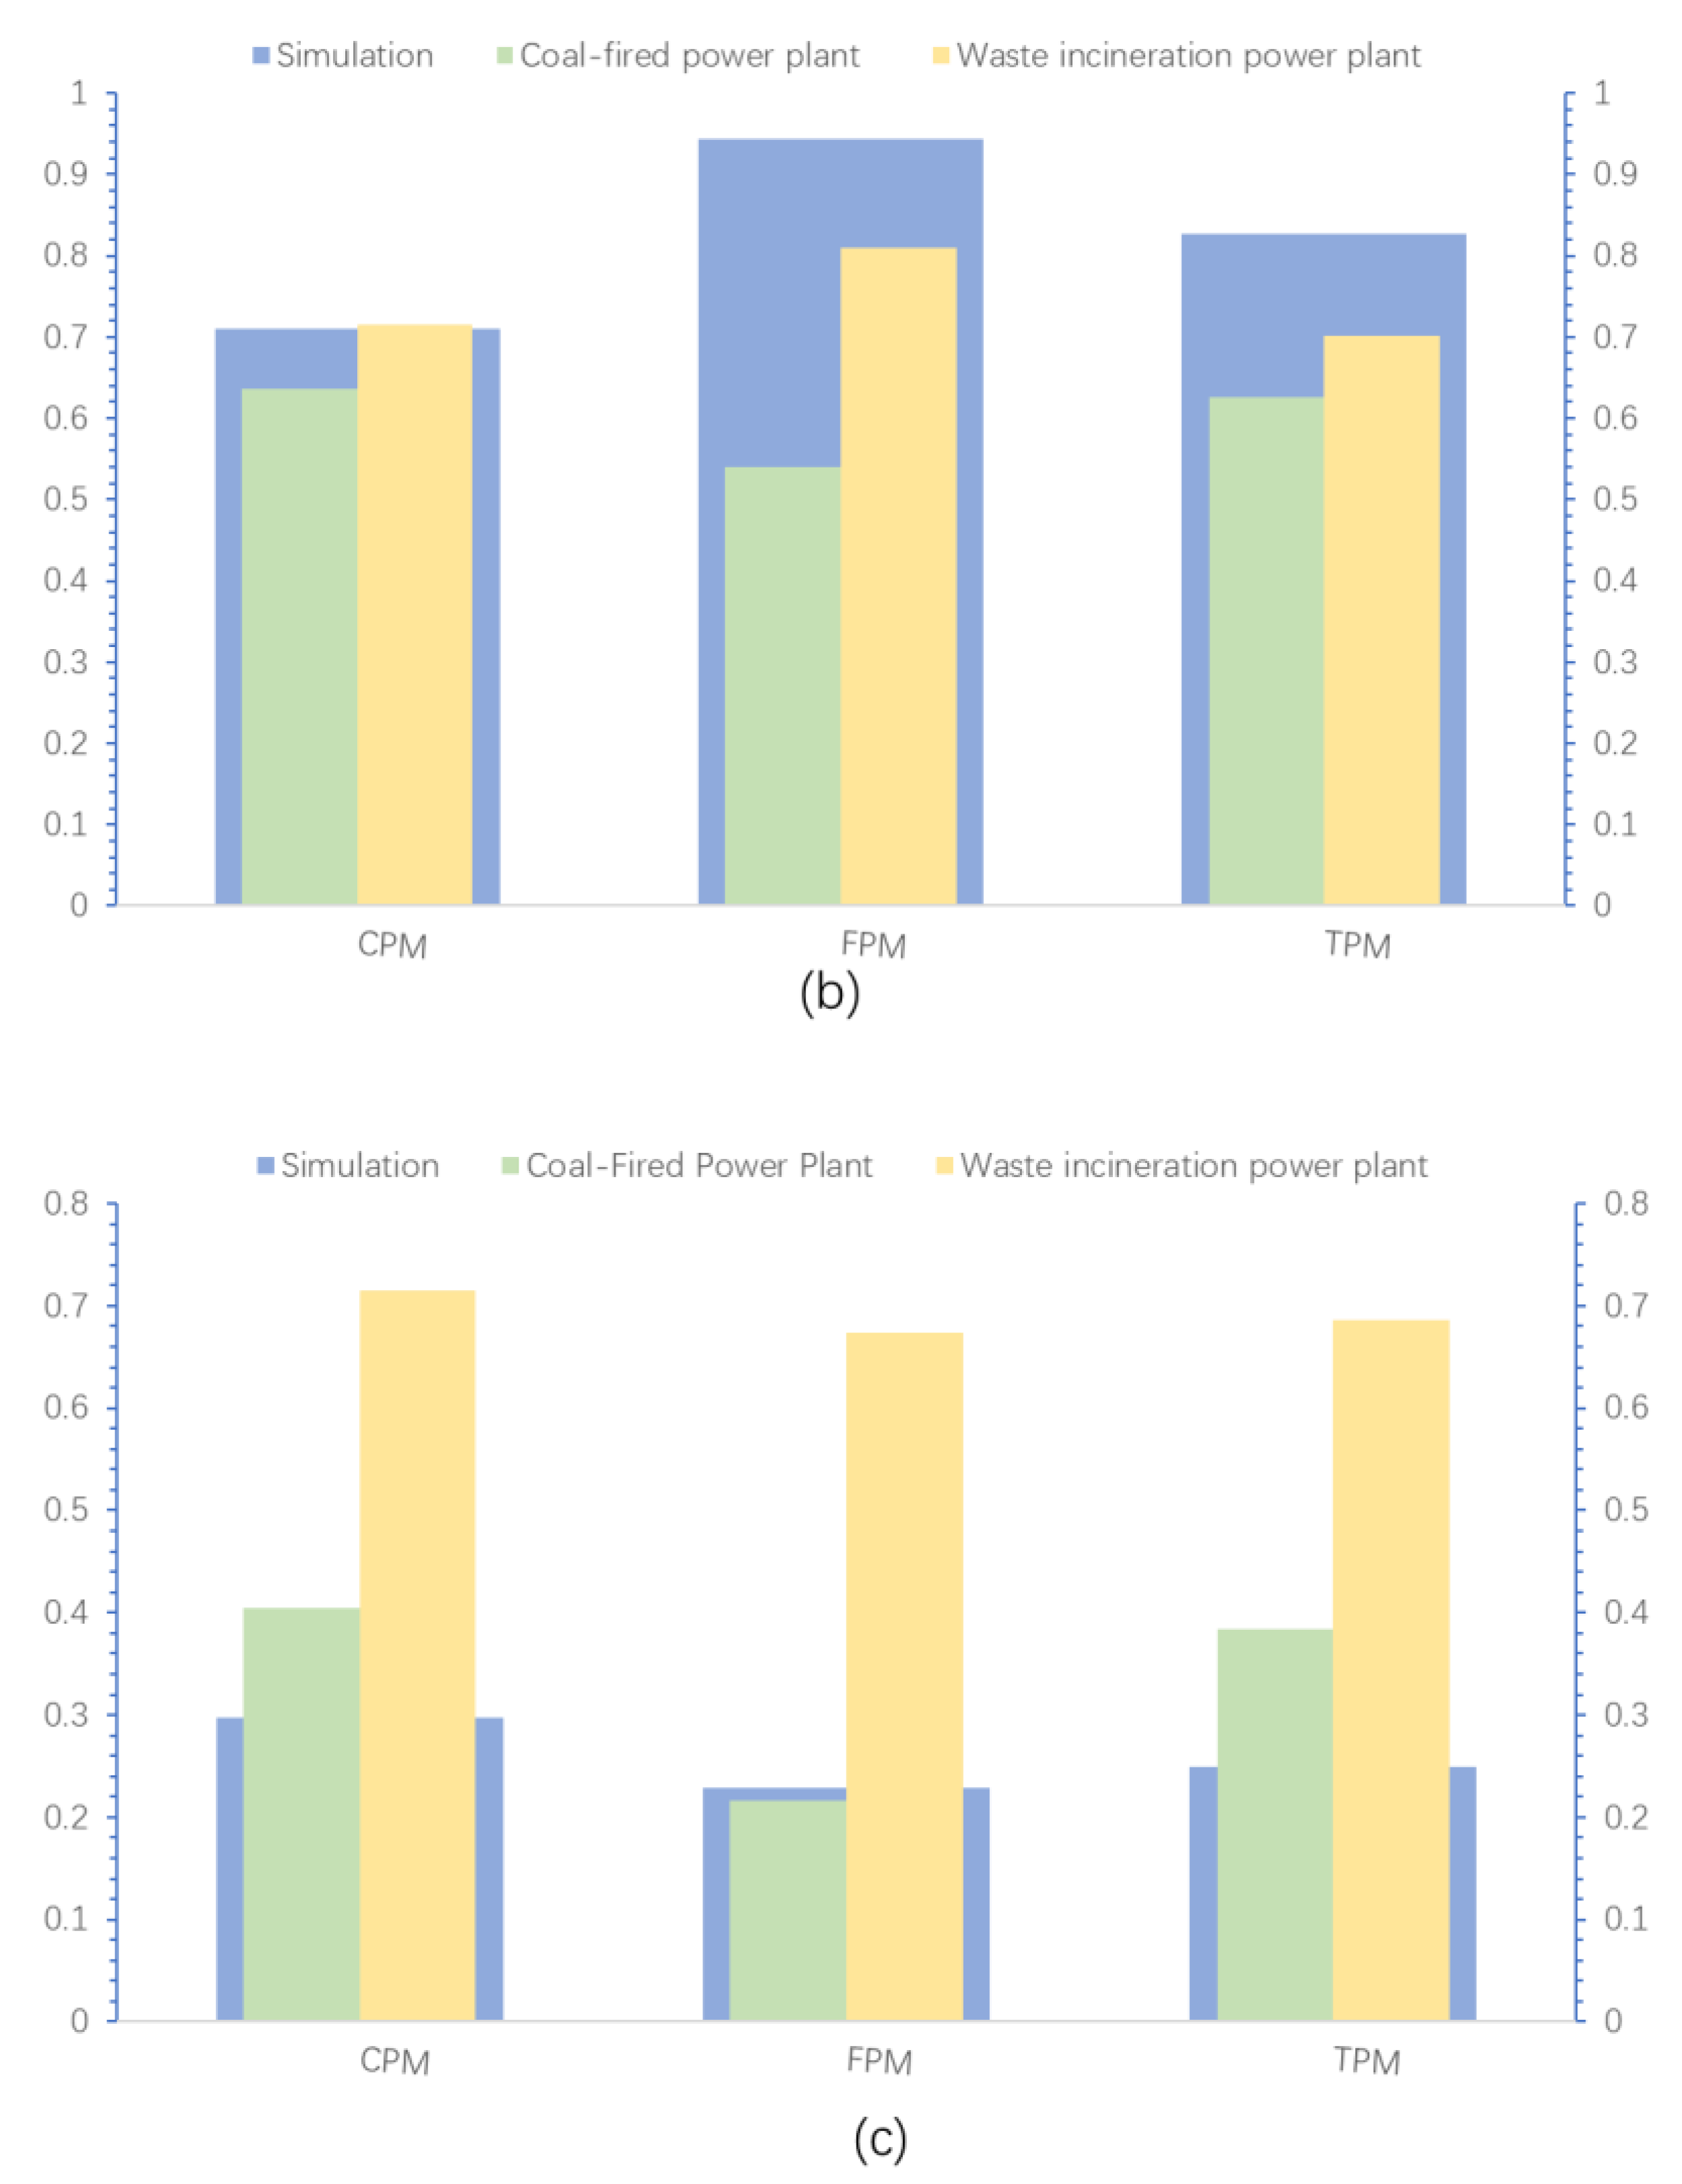
3.4. Experimentation

The particle removal efficiency of comparative results obtained from experiment and modeling are shown in Figure 17. As can be seen in Figure 17a,b, the experimental results were basically consistent with the modeling results of the multi−field and single electric field and follow the same rules. However, there was a certain difference between the experimental result and the modeling result obtained for the single temperature field shown in Figure 17c: the actual efficiency was higher than that of the modeling result, although this variation might relate to the particle type used in the model, with the parameter values of CPM being substituted by those of SO3. The composition of CPM on site was more complex and had a higher proportion of organic material, resulting in stronger temperature sensitivity. In addition, the saturation of humidity at A1 meant CPM was prone to coagulate with suspended water vapor particles, meaning the removal efficiency of CPM would be higher in the actual operation.

4. Conclusions

This study explored the research of CE−ESP by combining numerical modeling and experimental investigation. It described the total concentration distribution, classified concentration distribution, reduction rate of classified concentration along the path, particle trajectories, and deposition efficiency of CPM, when subject to the synergistic effect of multiple fields within the CE−ESP. This in−depth exploration of internal physical processes, such as particle distribution and motion characteristics inside the electrostatic precipitator, provided a theoretical foundation for improving the removal efficiency of CPM. The forces that particles may experience inside the CE−ESP were summarized and their magnitude and direction were briefly described.
The results obtained in different operating conditions (A1, A2 and A3) revealed the internal electric field distribution, temperature field distribution, along−path particle concentration, classified particle concentration, and removal efficiency of the CE−ESP. The findings indicated that in A1, the along−path temperature gradually decreased from the wire area to the near−wall area, leading to better removal of CPM, with smaller particle sizes and lower temperatures resulting in higher removal efficiencies. In A2, as the applied voltage increased, the particle deflection was enhanced; as the deposition position of CPM moved forward, the deposition amount increased, and higher voltages and larger particle sizes yielded higher removal efficiencies. In A3,—the along−path deposition efficiency, compared with the heat transfer conditions and high−voltage power supply, still showed an increasing trend, but the deposition efficiency at each cross−section of along−path particles had increased, with significant improvements in the removal efficiencies of both CPM and FPM, reaching 89% and 98%, respectively.
When field experiments conducted in coal−fired power plants and waste incineration power plants were considered alongside the model results, it was found that in the coupled field A3, the removal efficiencies of CPM were 91% and 81%, respectively, and the removal efficiencies of FPM were 57% and 94%. This study combined experimental content with the model, revealing the deep removal effect of the self−made CE−ESP on CPM by coupling the electric field, temperature field and concentration field. When compared with the field experiments, this demonstrated that numerical simulation methods could accurately describe the changes in along−path particle deposition efficiency in different states, and providing theoretical support to the engineering application and promotion of CE−ESP.

Author Contributions

Conceptualization, J.L.; methodology, W.L.; software, W.L.; validation, W.L.; formal analysis, Z.Z.; investigation, X.Z.; resources, W.L.; data curation, W.L.; writing—original draft preparation, Z.Z.; writing—review and editing, W.L.; visualization, Z.Z.; supervision, J.L.; project administration, J.L.; funding acquisition, J.L. All authors have read and agreed to the published version of the manuscript.

Funding

This research was funded by the National Natural Science Foundation of China grant number 51761125011.

Institutional Review Board Statement

Not applicable.

Informed Consent Statement

Not applicable.

Data Availability Statement

Data is contained within the article. The data presented in this study are available in this article.

Conflicts of Interest

The authors declare no conflict of interest.

References

  1. Rabbat, C.; Villot, A.; Awad, S.; Andrès, Y. Gaseous and particulate matter emissions from the combustion of biomass-based insulation materials at end-of-life in a small-scale biomass heating boiler. Fuel 2023, 338, 127182. [Google Scholar] [CrossRef]
  2. Jiang, Y.; Wang, X.; Li, M.; Liang, Y.; Liu, Z.; Chen, J.; Guan, T.; Mu, J.; Zhu, Y.; Meng, H.; et al. Comprehensive understanding on sources of high levels of fine particulate nitro-aromatic compounds at a coastal rural area in northern China. J. Environ. Sci. 2023, 135, 483–494. [Google Scholar] [CrossRef]
  3. Guo, M.; Li, X.; Wang, Y.; Zhang, Y.; Fu, Q.; Huguet, A.; Liu, G. New insights into the mechanism of phosphate release during particulate organic matter photodegradation based on optical and molecular signatures. Water Res. 2023, 236, 119954. [Google Scholar] [CrossRef] [PubMed]
  4. Tan, J.; Luo, Q.; Cai, Y.; Zhang, Y.; Cheng, T.; Wang, B. Study on the promotion of particle heterogeneous condensation by different charging approaches. Powder Technol. 2023, 415, 118144. [Google Scholar] [CrossRef]
  5. Li, J.; Li, X.; Wang, W.; Wang, X.; Lu, S.; Sun, J.; Mao, Y. Investigation on removal effects and condensation characteristics of condensable particulate matter: Field test and experimental study. Sci. Total Environ. 2021, 783, 146985. [Google Scholar] [CrossRef]
  6. Yang, W.; Pudasainee, D.; Gupta, R.; Li, W.; Wang, B.; Sun, L. Particulate matter emission during municipal solid waste combustion: Submicron particulates formation mechanism. Fuel 2022, 310, 122271. [Google Scholar] [CrossRef]
  7. Yang, Z.; Zheng, C.; Liu, S.; Guo, Y.; Liang, C.; Wang, Y.; Hu, D.; Gao, X. A combined wet electrostatic precipitator for efficiently eliminating fine particle penetration. Fuel Process. Technol. 2018, 180, 122–129. [Google Scholar] [CrossRef]
  8. Bin, H.; Lin, Z.; Yang, Y.; Fei, L.; Cai, L.; Linjun, Y. PM2.5 and SO3 collaborative removal in electrostatic precipitator. Powder Technol. 2017, 318, 484–490. [Google Scholar] [CrossRef]
  9. Huang, Y.-M.; Huang, S.-H.; Lin, C.-W.; Yang, H.-H.; Chen, C.-C. Evaluation of Bias in the Measurement of Condensable Particulate Matter with Method 202. Aerosol Air Qual. Res. 2021, 21, 200149. [Google Scholar] [CrossRef]
  10. Fujitani, Y.; Sato, K.; Tanabe, K.; Morino, Y.; Takahashi, K.; Hoshi, J. Characteristics of different volatility classes of organic compounds emitted by a municipal solid waste incineration plant. Atmos. Environ. X 2023, 17, 100197. [Google Scholar] [CrossRef]
  11. Ott, W.R.; Zhao, T.; Cheng, K.-C.; Wallace, L.A.; Hildemann, L.M. Measuring indoor fine particle concentrations, emission rates, and decay rates from cannabis use in a residence. Atmos. Environ. X 2021, 10, 100106. [Google Scholar] [CrossRef]
  12. Yuan, C.; Su, S.; Xu, R.; Liang, S.; Cheng, H.; Yao, Z.; Jiang, L.; Wang, Z. Effect of wet flue gas desulfurization on the concentrations and component profiles of condensable particulate matter from ultralow emission coal-fired power plants. Atmos. Pollut. Res. 2022, 13, 101376. [Google Scholar] [CrossRef]
  13. Li, J.; Qi, Z.; Li, M.; Wu, D.; Zhou, C.; Lu, S.; Yan, J.; Li, X. Physical and Chemical Characteristics of Condensable Particulate Matter from an Ultralow-Emission Coal-Fired Power Plant. Energy Fuels 2017, 31, 1778–1785. [Google Scholar] [CrossRef]
  14. Yang, H.-H.; Gupta, S.K.; Dhital, N.B.; Lee, K.-T.; Hsieh, Y.-S.; Huang, S.-C. Establishment of Indicatory Metals for Filterable and Condensable PM2.5 Emitted from Important Stationary Emission Sources. Energy Fuels 2019, 33, 10878–10887. [Google Scholar] [CrossRef]
  15. Dziubak, T. Experimental research on separation efficiency of aerosol particles in vortex tube separators with electric field. Bull. Pol. Acad. Sci. Tech. Sci. 2020, 68, 503–516. [Google Scholar] [CrossRef]
  16. Maćkowiak, A.; Kostrzewski, M.; Bugała, A.; Chamier-Gliszczyński, N.; Bugała, D.; Jajczyk, J.; Woźniak, W.; Dombek, G.; Nowak, K. Investigation into the Flow of Gas-Solids during Dry Dust Collectors Exploitation, as Applied in Domestic Energy Facilities—Numerical Analyses. Eksploat. I Niezawodn.-Maint. Reliab. 2023, 25, 174095. [Google Scholar] [CrossRef]
  17. Liu, W.; Zhao, B.; Feng, Q.; Zhou, Z.; Lu, J. Synergistic Effect of Multi-field Force on Condensable Particulate Matter Properties and Behavior in Flue Gas: A Case Study in a Municipal Solid Waste Incineration Plant. Aerosol Air Qual. Res. 2023, 23, 220217. [Google Scholar] [CrossRef]
  18. Yang, H.-H.; Arafath, S.M.; Wang, Y.-F.; Wu, J.-Y.; Lee, K.-T.; Hsieh, Y.-S. Comparison of Coal- and Oil-Fired Boilers through the Investigation of Filterable and Condensable PM2.5 Sample Analysis. Energy Fuels 2018, 32, 2993–3002. [Google Scholar] [CrossRef]
  19. Cao, Q.m.; Wang, H.; Qin, J.q.; Chen, G.z.; Zhang, Y.b. Partitioning of PAHs in pore water from mangrove wetlands in Shantou, China. Ecotoxicol. Environ. Saf. 2015, 111, 42–47. [Google Scholar] [CrossRef]
  20. Liu, X.; Xu, Y.; Zeng, X.; Zhang, Y.; Xu, M.; Pan, S.; Zhang, K.; Li, L.; Gao, X. Field Measurements on the Emission and Removal of PM2.5 from Coal-Fired Power Stations: 1. Case Study for a 1000 MW Ultrasupercritical Utility Boiler. Energy Fuels 2016, 30, 6547–6554. [Google Scholar] [CrossRef]
  21. Xu, J.; Zhang, J.; Yu, Y.; Meng, Q.; Zhong, H. Characteristics of Vapor Condensation on Coal-Fired Fine Particles. Energy Fuels 2016, 30, 1822–1828. [Google Scholar] [CrossRef]
  22. Zhou, Z.; Lu, J.; Jin, Y. Influence factors and mechanism of typical slurry ions and operating conditions on SO3 scrubbing characteristics in simulated desulfurized flue gas of coal-fired power plants. Fuel 2023, 333, 126287. [Google Scholar] [CrossRef]
  23. Ramifehiarivo, N.; Barthès, B.G.; Cambou, A.; Chapuis-Lardy, L.; Chevallier, T.; Albrecht, A.; Razafimbelo, T. Comparison of near and mid-infrared reflectance spectroscopy for the estimation of soil organic carbon fractions in Madagascar agricultural soils. Geoderma Reg. 2023, 33, e00638. [Google Scholar] [CrossRef]
  24. Zhang, F.; Yang, L.; Sheng, Z.; Wu, T.; Hu, T. Study on the characteristics of sulfate ion in condensable particulate matter from ultra-low emission coal-fired power plants. J. Clean. Prod. 2023, 383, 135392. [Google Scholar] [CrossRef]
  25. Zhao, Z.; Liu, S.; Wang, Z.; Zhu, X.; Zhang, L.; Zhang, Q. Effect of ash in biodiesel combustion particulate matter on the oxidation characteristics of carbon soot. J. Energy Inst. 2022, 105, 262–272. [Google Scholar] [CrossRef]
Figure 1. Geometric model.
Atmosphere 15 00250 g001
Figure 2. Mesh partition.
Atmosphere 15 00250 g002
Figure 3. Field sampling system.
Atmosphere 15 00250 g003
Figure 4. Temperature Distribution.
Atmosphere 15 00250 g004
Figure 5. Particle Concentration Distribution along the Radial Direction (Temperature Field).
Atmosphere 15 00250 g005
Figure 6. Particle Concentration Distribution along the Axial Direction (Temperature Field).
Atmosphere 15 00250 g006
Figure 7. Particle distribution in different parts (Temperature Field).
Atmosphere 15 00250 g007
Figure 8. Particle Deposition and Removal along the Axial Direction (Temperature Field).
Atmosphere 15 00250 g008
Figure 9. Electric field distribution.
Atmosphere 15 00250 g009
Figure 10. Particle Concentration Distribution along Radial Direction (Electric Field).
Atmosphere 15 00250 g010
Figure 11. Particle Size Distribution along the Axial Direction (Electric Field).
Atmosphere 15 00250 g011
Figure 12. Particle distribution in different electric fields.
Atmosphere 15 00250 g012
Figure 13. Particle Deposition and Removal along the Axial Direction (Electric Field).
Atmosphere 15 00250 g013
Figure 14. Particle Concentration Distribution along the Radial Direction (Multi−Field).
Atmosphere 15 00250 g014
Figure 15. Particle Size Distribution along the Axial Direction (Multi−Field).
Atmosphere 15 00250 g015
Figure 16. Particle Deposition and Removal along the Axial Direction (Multi−Field).
Atmosphere 15 00250 g016
Figure 17. The removal efficiency of modeling and experiments.
Atmosphere 15 00250 g017aAtmosphere 15 00250 g017b
Table 1. The boundary conditions.
Solution VariablesCorona ElectrodeTubular Collection ElectrodeOther Boundaries
Voltage φ w 0 φ / n = 0
Charge density ρ w   E w ρ / n = 0 ρ / n = 0
Table 2. The basic parameters.
Operating ConditionParameter
Basic ParametersInlet flue gas flow 720 m3/h
Air density 1.225 kg/m3
Particle viscosity 1.721 × 10⁻⁵ Pa·s
Flue gas temperature 140 °C
Density 1.225 kg/m3
Inlet particle concentration 100 mg/m3
50% of the particles in the flue gas is conventional 1–10 μm particulate matter
50% is 0–1 μm SO3 particles
Temperature field (A1)Wall temperatures of 20 °C, 30 °C, 40 °C
Electric field (A2)The electric field strength of 10 KV, 15 KV, 20 KV
Multi−field (A3)Comprehensive optimal parameters
Table 3. Experimental working conditions.
Sampling PointTemperature (°C)Sampling Time (min)Flow Rate (m/s)
Waste incineration plant1553011
Coal−fired power plant1103010
Disclaimer/Publisher’s Note: The statements, opinions and data contained in all publications are solely those of the individual author(s) and contributor(s) and not of MDPI and/or the editor(s). MDPI and/or the editor(s) disclaim responsibility for any injury to people or property resulting from any ideas, methods, instructions or products referred to in the content.

