Article

Spatiotemporal Analysis of Urban Heat Islands and Vegetation Cover Using Emerging Hotspot Analysis in a Humid Subtropical Climate

1
Department of Geography, Golestan University, Gorgan 49138-15759, Iran
2
Sustainable Building Design Lab, Department UEE, Faculty of Applied Science, Liege University, 4000 Liège, Belgium
*
Authors to whom correspondence should be addressed.
Atmosphere 2024, 15(2), 161; https://doi.org/10.3390/atmos15020161
Submission received: 27 December 2023 / Revised: 17 January 2024 / Accepted: 22 January 2024 / Published: 25 January 2024

Abstract

:
Research on the temporal and spatial changes of the urban heat island effect can help us better understand how urbanization, climate change, and the environment are interconnected. This study uses a spatiotemporal analysis method that couples the Emerging Hot Spot Analysis (EHSA) technique with the Mann–Kendall technique. The method is applied to determine the intensity of the heat island effect in humid subtropical climates over time and space. The data used in this research include thermal bands, red band (RED) and near-infrared band (NIR), and Landsat 7 and 8 satellites, which were selected from 2000 to 2022 for the city of Sari, an Iranian city on the Caspian Sea. Pre-processed spectral bands from the ‘Google Earth Engine’ database were used to estimate the land surface temperature. The land surface temperature difference between the urban environment and the outer buffer (1500 m) was modeled and simulated. The results of this paper show the accuracy and novelty of using Emerging Hotspot Analysis to evaluate the effect of vegetation cover on the urban heat island intensity. Based on the Normalized Difference Vegetation Index (NDVI), the city’s land surface temperature increased by approximately 0.30 °C between 2011 and 2022 compared to 2001 to 2010. However, the intensity of the urban heat island decreased during the study period, with r = −0.42, so an average −0.031 °C/decade decrease has been experienced. The methodology can be transferred to other cities to evaluate the role of urban green spaces in reducing heat stress and to estimate the heat budget based on historical observations.

1. Introduction

For several reasons, understanding temporal and spatial variations in urban heat islands (UHI) is critical [1]. First, the UHI effect is a phenomenon in which metropolitan regions have greater temperatures than surrounding rural areas due to human activities such as transportation, industrial processes, and building materials [2]. This effect can negatively influence human health (heat-related illnesses and mortality) and the environment (increased energy usage and greenhouse gas emissions) [3]. Understanding the temporal and spatial variations of the heat island effect can thus assist policymakers and urban planners in developing effective mitigation solutions to mitigate its detrimental effects [4].
Second, the UHI effect can have economic consequences, such as increased energy costs for cooling buildings and damage to infrastructure due to extreme heat [5]. The UHI effect is a complex phenomenon influenced by local and global influences. Green areas and water-consuming urban heat island effect (UHIE) solutions can help mitigate the consequences of the UHI effect. Still, more research is needed to fully understand the influence of global warming on the UHI effect. However, urban activities such as transportation, buildings, industry, and deforestation contribute to climate change, and measuring climate change awareness in the public is critical for designing mitigation measures [6]. In general, the findings of various studies on the intensity of urban heat islands in various dimensions show that urban heat islands are a phenomenon in which urban areas tend to be warmer than their rural counterparts due to heat absorption and retention by buildings and other infrastructure [7].
Third, researching the temporal and spatial variations of the UHI effect can benefit from new spatiotemporal analysis methods and available data of geospatial information based on satellite maps and remote sensing. Urban planners and policymakers can benefit from the advancements of Geographical Information Systems (GIS) and earth observation satellites to identify locations most sensitive to these economic repercussions and design targeted mitigation plans by examining the temporal and spatial fluctuations of the UHI effect. Research on UHI effects using satellite map datasets with historical observations of land surface temperatures, thermal bands, red bands, and near-infrared bands is proliferating [8,9,10]. Emerging Hot Spot Analysis (EHSA) is a technique that falls under Exploratory Spatial Data Analysis (ESDA) hot spot analysis. The Emerging Hot Spot Analysis tool calculates the Getis–Ord Gi* statistic using the traditional time-series Mann–Kendall test for monotonic trends.
Therefore, this study uses a spatiotemporal analysis method to determine the intensity of the heat island effect in humid subtropical climates over time and space. To evaluate whether urbanization and population expansion or other reasons, such as climate change, are to blame for temporal changes in UHII (Urban Heat Island intensity), it is crucial first to comprehend the changes in UHI’s temporal and spatial pattern using a case study. The case study was chosen as a mid-size study representative of a city in a humid subtropical climate (Köppen: Cfa, Trewartha: Cf). Sari, located in Northern Iran, was chosen as a representative city on the Caspian Sea with high population growth rates. Between 1960 and 2020, the city population increased 17 times, reaching 338 thousand people in 2025 [11]. While the impact of climate change on the alteration of air temperature patterns in the city of Sari has been assessed previously, a review of the existing literature reveals a gap in research regarding the influence of global warming on changes in the Urban Heat Island Intensity (UHII) for this city. Consequently, the discoveries and framework presented in this study can serve as a valuable foundation for future articles aiming to investigate and assess the impact of global warming on coastal cities in northern Iran. The research questions of this research are formulated as follows:
  • How to couple Emerging Hot Spot Analysis and the time-series Mann–Kendall test for characterizing the vegetation change and urban heat island effects?
  • What are the effects of climate change on the urban heat island effect intensity in Sari?
  • What is the influence of vegetation on the land-surface temperature in Sari?

2. Literature Review

A UHI is where urban regions suffer higher temperatures than surrounding rural areas due to human activities and changes in urban composition and layout [12]. Due to human activities such as population pressure, infrastructure development, and economic growth, urban regions experience greater temperatures than neighboring rural areas [13]. UHI has the strongest effect on large and densely populated cities and impacts many human societies worldwide [7,14]. The trend of urban integration has accelerated, amplifying the impacts of UHI. UHI impacts are caused by the interaction of land use pattern change, subsurface diversity, and human activities [15]. The energy foundation of the urban heat island can be linked to gravity, which is extremely powerful since matter is concentrated in a relatively small region [7,16]. The UHI effect is a severe environmental and social issue that modern cities worldwide face, posing threats to urban populations’ physical and mental health, air quality, and the healthy growth of surface plants. This issue will grow more pressing as urbanization continues [17]. UHI is caused by urbanization and leads to changes in land use, vegetation degradation, and climate change [13].
Global warming can impact UHI since an increase in urban air temperature due to UHI or global warming can be advantageous in the winter but detrimental in the summer [16]. The findings of a study on the influence of global warming on the UHI demonstrate that in some circumstances, modern climate change can increase and decrease the severity of the UHI effect [18]. Urban stations frequently demonstrate local UHI effects and global warming, making it difficult to distinguish between the two signals in the reported surface air temperature (SAT) warming. The mean urban impact indicator (Uii) of the 45 urban stations increased from 0.06 to 0.35 from 1992–2013; this increase was revealed by linear regressions between the trends of annual averaged daily mean SAT, maximum SAT, and minimum SAT between urban and near stations [19]. Additionally, positive correlations between the changes in Uii and SAT trends were substantial at the 0.001 significance level. The combination of heat waves (HWs) and UHI has increased the intensity, frequency, and duration of extreme heat events in urban areas, seriously endangering the health of urban populations. According to Luo et al. (2023) [20], low wind speeds contribute to increased HW frequency of HWs and augmentation of UHII. Both the UHII and HWs decreased with rising wind speed. Anthropogenic heat (AH) emissions from human activities can alter urban circulation, which in turn affects the level of air pollution in and around cities. AH emissions can considerably alter urban heat islands and urban breeze circulations in large cities. These variations in weather can considerably impact the geographical and vertical distributions of air contaminants [21]. Urbanization and economic growth are responsible for the deterioration of the environment and lead to increased carbon emissions [22]. Urbanization causes thermal pollution caused by specific urban activities and patterns on the ground levels in cities, which changes the city’s local climate. It at least negatively affects the comfort of the city [23]. Based on investigations in six major cities surrounding the Hangzhou Gulf in eastern China, the climatic effects of the heat island’s growth and intensity suggest that the phenomenon is increasing irregularly in the research area.
Because solar and human activities impact UHI days, the change during the day appears bigger than the change at night. There was some urban cool island phenomenon in winter when urban surface temperatures were −1–0 °C lower than the ambient LST. Except for winter, other seasons’ UHI during daytime changed from 0.5 °C to 2.5 °C and during nighttime strongly changed from 0.5 °C to 5 °C in 2009 [24]. A preliminary study of land temperature in the Bangkok metropolitan area revealed a trend toward higher ground temperatures in several seasonal sectors, especially agricultural activities. Burning straw and weed cover during the preparation of rice cultivation land caused the greatest LST in the rice fields [25]. According to a study by Nyangena et al. (2019) [26], sub-Saharan Africa’s rapid urbanization and economic growth resulted in higher demands for housing, transportation, and energy. According to the study, policies, and strategies considering environmental issues and carbon emissions are required to support sustainable urbanization and economic growth. Finally, the authors concluded that urbanization has a big impact on climate change and that urbanization and how nations may develop without affecting the environment should be the focus of future research. To determine how urban and physical characteristics affect air temperatures and produce different UHI configurations, an experimental study was conducted at the micro-scale at several spots in the city. The intensity of UHI peaks during the summer and at night. Areas with higher density (station 2—Local Climate Zone 2) record high UHII day and night (4.0 °C and 4.2 °C). Areas with lower density (station 3—LCZ 5) show high values of UHI during daytime (up to 4.8 °C) and lower values of UHI intensity during nighttime (up to 2.8 °C).
Finally, an increase of up to 4 °C in urban air temperatures will be expected, significantly increasing urban livability, according to Martinelli et al., 2020 [27], who studied the frequency distribution of current and future weather situations. UHII in Coventry showed that UHI intensity does not follow a predictable pattern across the seasons. However, minor temperature rises did occur in some urban locations [28]. The impact of UHI on the heating intensity of buildings was analyzed based on the observed hourly temperature data during the heating periods from 2009 to 2017 in Tianjin, China. The results showed that the average annual heating intensity decreased by 8.08% and 10.30%, with the urban center’s temperature increasing by 1.46 °C and 1.90 °C compared with the suburban and outer suburban areas [29]. The rise in temperatures within the Mediterranean region can worsen the UHI.
Consequently, cities like Rome and Thessaloniki experience minimum temperatures (Tmin) compared to rural areas, where nighttime UHIs range from +1.5–3 °C. However, researchers did not find any changes in UHI due to the impact of climate change [30]. In the most disastrous climate change scenarios, the number of heat wave days might treble if there is no UHI effect, according to a study carried out for Sydney, Australia, because, on more than 90% of the days, the heat wave does not pass the threshold [31].
Therefore, this paper aims to help us better comprehend the complex relationships between urbanization, climate change, and the environment. This knowledge can be used to create sustainable urban planning and design methods that can help alleviate urbanization’s negative environmental impacts and promote more sustainable and resilient communities. Overall, research into the temporal and spatial changes of the heat island effect is vital for understanding the effects of urbanization on the environment, human health, and the economy and creating effective mitigation strategies.

3. Materials and Methods

Sari is situated at a geographical location of 53°3′ E longitude and 36°34′ N latitude. It has an average elevation of approximately 40 m above sea level. Sari’s general topography falls within the 0–100 m altitude range. The northernmost part of the city stands at a height of 12 m, while the southernmost part reaches 80 m. The alignment lines in Sari run from east to west.
The city experiences a warm and humid subtropical climate (Köppen: Cfa, Trewartha: Cf), which shares similarities with a Mediterranean climate (Csa). Winters in Sari are cool and rainy, while summers are hot and humid. With an average annual temperature of 18 °C, it is slightly warmer than the Iranian average. While July and August bring scorching heat with highs above 30 °C, January and February offer a respite with lows around 4 °C. Rainfall averages around 665 mm annually, peaking in spring and fall, although recent trends indicate a slight decline. High humidity, particularly in summer (up to 80%), adds to the perceived warmth. Moderate winds shift direction with the seasons, blowing from the northwest in winter and the southwest in summer. Sari has over 2183 h of sunshine annually, which is more than in other parts of Iran [32,33].
Sari has a rich history that dates to the Sassanid era and has evolved substantially over time [34]. Due to fast population expansion and urbanization, Sari has expanded its city borders and created new residential and commercial areas in recent decades (Figure 1). Sari’s strategic location as a transportation hub in northern Iran has played a significant role in its growth. This city has a railway station and an airport, and it is located on the main highway that connects Tehran to the Caspian Sea. Another factor impacting the development is that Sari is a hub for regional businesses, health services, and education. The city’s numerous educational institutions, medical facilities, and commercial centers attract scholars, patients, and customers from the neighboring districts [35,36].
In this study, Landsat satellites 7 and 8 from 2000 to 2022 collected thermal bands, red bands (RED), and near-infrared bands (NIR). For this purpose, we considered days with 1% or less cloud cover (Table 1).
The LST was estimated using pre-processed spectral bands in a ‘Google Earth Engine’ environment. The BT parameter (brightness temperature) was determined by analyzing the thermal band. Land Surface Emissivity (LSE) was then estimated using the NDVI index. For this purpose, NDVI was first estimated using Equation (1) [37,38]:
N D V I = N I R R E D N I R + R E D
In Table 2, the details of urban vegetation classes and NDVI value are provided [39]:
Equation (2) was used to calculate the proportion of vegetation (PV) [40].
P V = N D V I N D V I m i n N D V I m a x N D V I m i n 2
Equation (3) calculates the LSE [40].
L S E = 1.009 + 0.047 P V
Finally, Equation (4) was used to determine the LST [40].
L S T = B T 1 + W B T 14380 l o g ( L S E )
In Equation (4), W is equivalent to the wavelength of emitted radiance. The LST difference between the urban area and the surroundings was measured for the UHII of Sari City in the following section following the LST assessment in the study region. This study chose a 1500 m border in Sari’s outer environment (buffer) as a rural area. Based on this, the following equation [41] was also extracted to produce the UHII:
U H I I = T u r b a n T r u r a l
In Equation (5), Turban stands for the LST in urban areas, and Trural stands for the LST in the city’s outside regions. Then, using ArcGisPro software (Version 10.8.2), the needed data in the form of structure was used to identify the trend of changes and the zoning of the anomalies of UHII over Sari. It should be mentioned that the Mann–Kendall technique was utilized for the temporal and spatial analysis of the trend of changes in the UHII of the city of Sari, and the hotspot analysis function was employed for the zoning of the intensity anomaly of the UHI. This method calculates the difference between each observation and all the observations, and the parameter S is obtained. For a random sample containing n observations, the estimator S can be calculated with the following equation [42,43]:
S = k = 1 n 1 j = k + 1 n s g n x j x k
where n is the total number of series observations, and xj and xk indicate the jth and kth data points, respectively. The “sgn” function may alternatively be computed using the Equation (7) [44,45,46]:
s g n x j x k = + 1   f o r   x j x k > 0 0   f o r   x j x k = 0 1   f o r   x j x k < 0
Next, one of the following equations (Equation (8)) is used to calculate the variance of S [44,45,46]:
V a r S = n n 1 2 n + 5 i = 1 m t t 1 ( 2 t + 5 ) 18   f o r   n > 10 V a r S = n n 1 2 n + 5 ( n 2 + 5 ) 18   f o r   n < 10
where n and m indicate how many sequences include at least one duplicate data value. The frequency of similar data in a sequence is also represented by t. Finally, one of the following relations (Equation (9)) is used to obtain the Z [44,45,46]:
Z = S 1 V a r S   f o r   S > 0 Z = 0   f o r   S = 0 Z = S + 1 V a r ( S )   f o r   S < 0
In the case of a two-tailed trend test, the following criteria must be satisfied to accept the null hypothesis:
Z < Z a / 2
where a is the significance level that is considered for the test and Za is the standard normal distribution statistic at the significance level of a, which becomes a 2 because of the two domains of the test.
It is necessary to explain that in this study, the main pixels throughout the study area are combined in the form of 3 × 3. Therefore, to perform this process, the fishnet function was used to obtain pixels with dimensions of 88 m. Then, the significance of the change process was evaluated using the Mann–Kendall method for each of the pixels.
The UHII anomaly was then estimated using the Getis–Ord Gi statistic and is determined as follows [41]:
G i * = j = 1 n w i , j x j X ¯   j = 1 n w i , j S n j = 1 n w 2 i , j j = 1 n w i , j 2 n 1
In Equation (12), Xj is the attribute value for complication j, Wij is the spatial weight between complications i and j, and n is equal to the total number of complications.
X ¯ = j = i n x j n   S = j = 1 n x j 2 n ( X ¯ ) 2
Gi is some Z-score. Therefore, no further estimate is required.
Subsequently, we applied the Emerging Hotspot Analysis (EHA) using ArcGIS Pro software [47] to understand spatiotemporal variations of emergency calls during the study period. The Emerging Hotspot Analysis is among the new methods added to the GIS-based analyses, and its usage in spatiotemporal analysis is growing [48,49,50,51,52,53,54]. This information is used to analyze various zones according to how frequently EHSA occurred in various metropolitan locations throughout the 23-year timeframe. Using ArcGisPro3.1 software, the classes of this assessment, according to Table 3, were employed.

4. Results

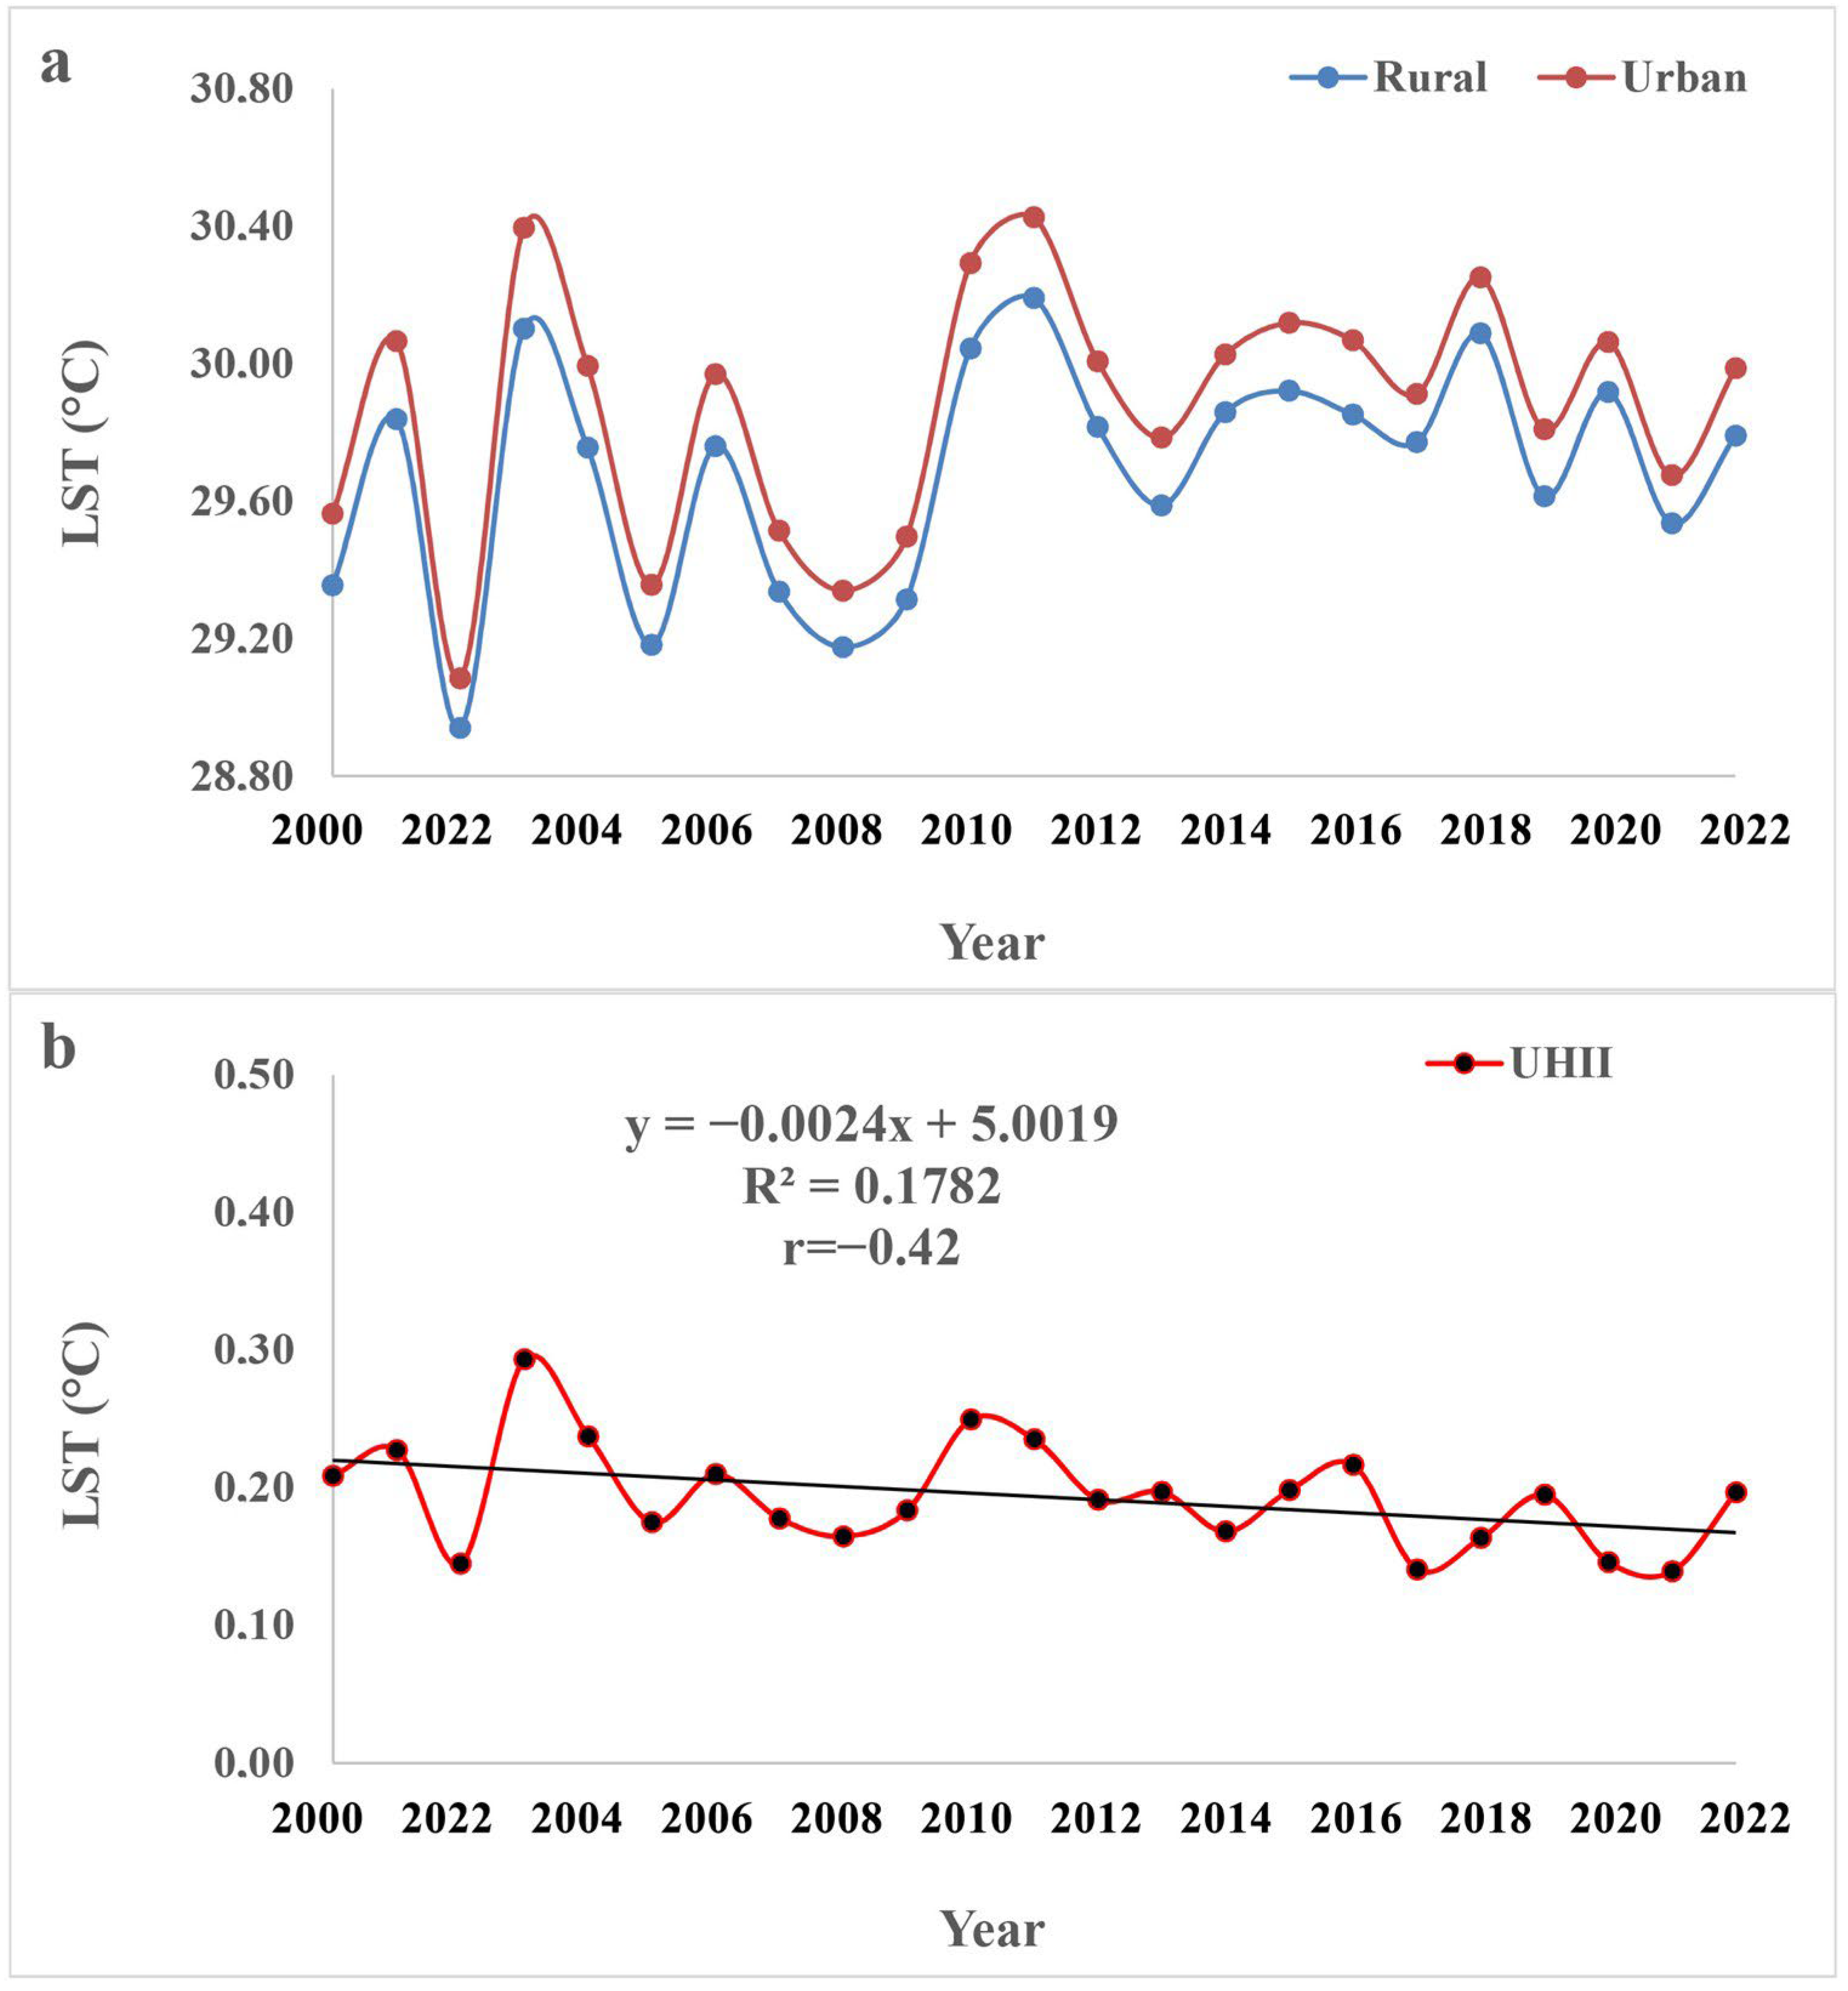
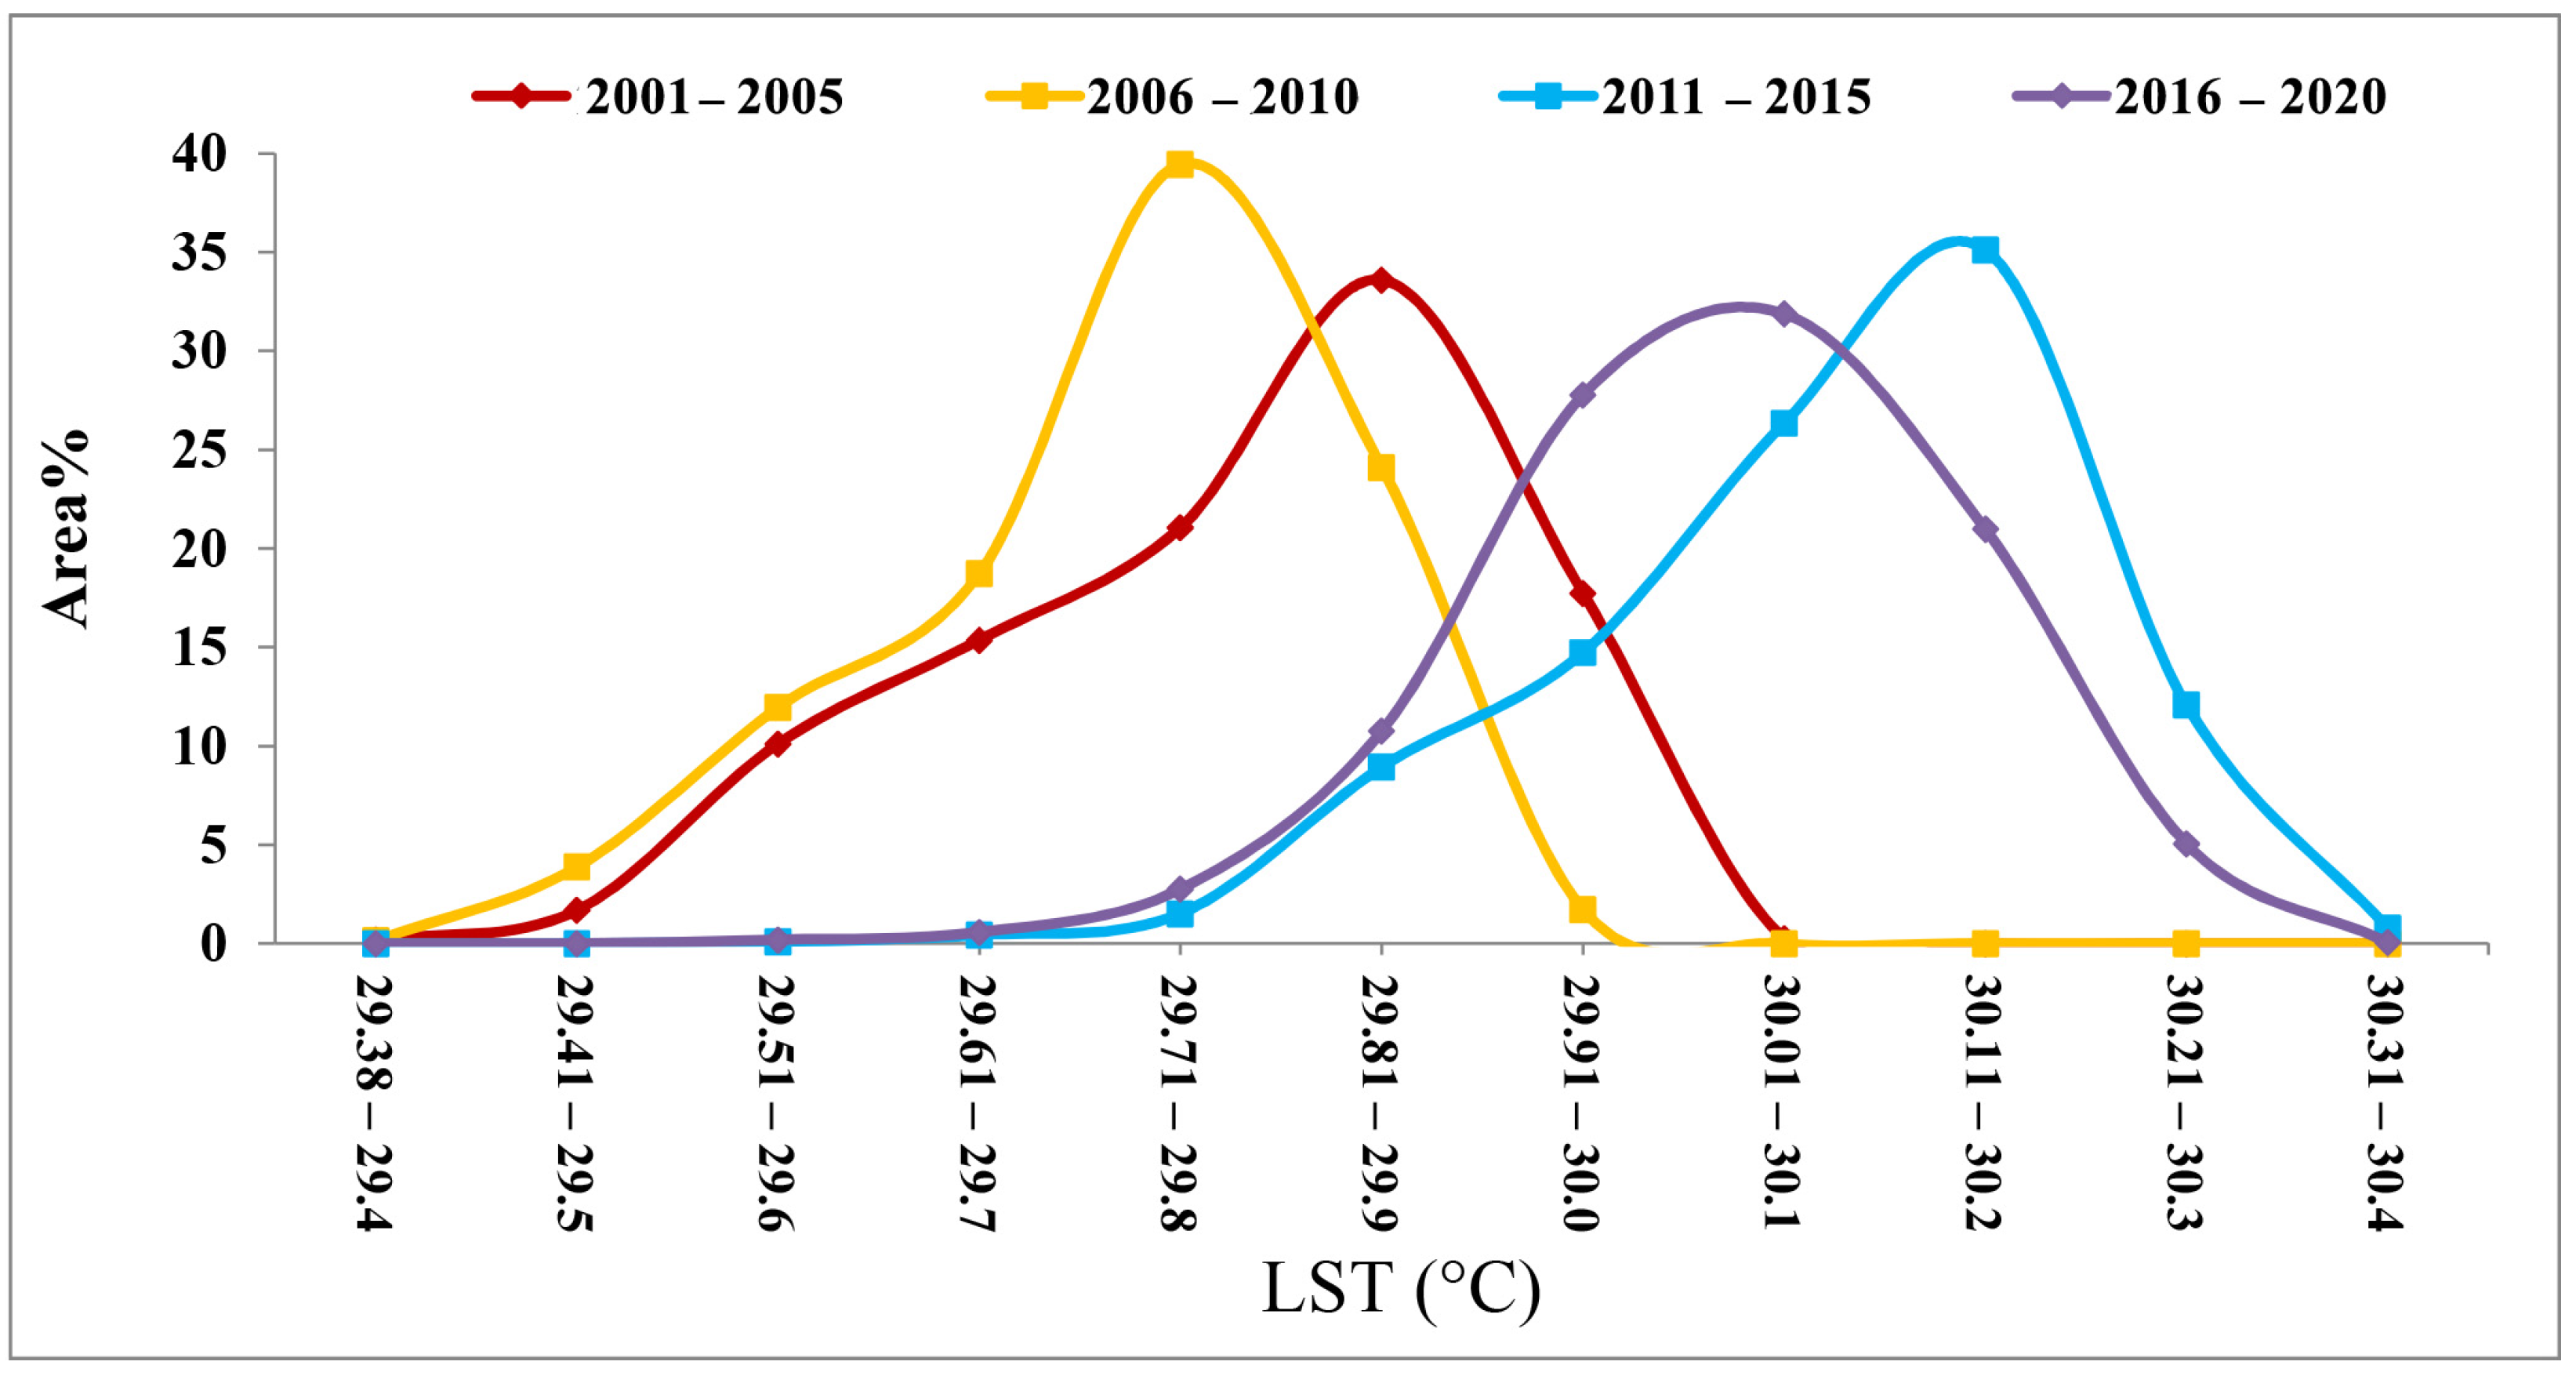
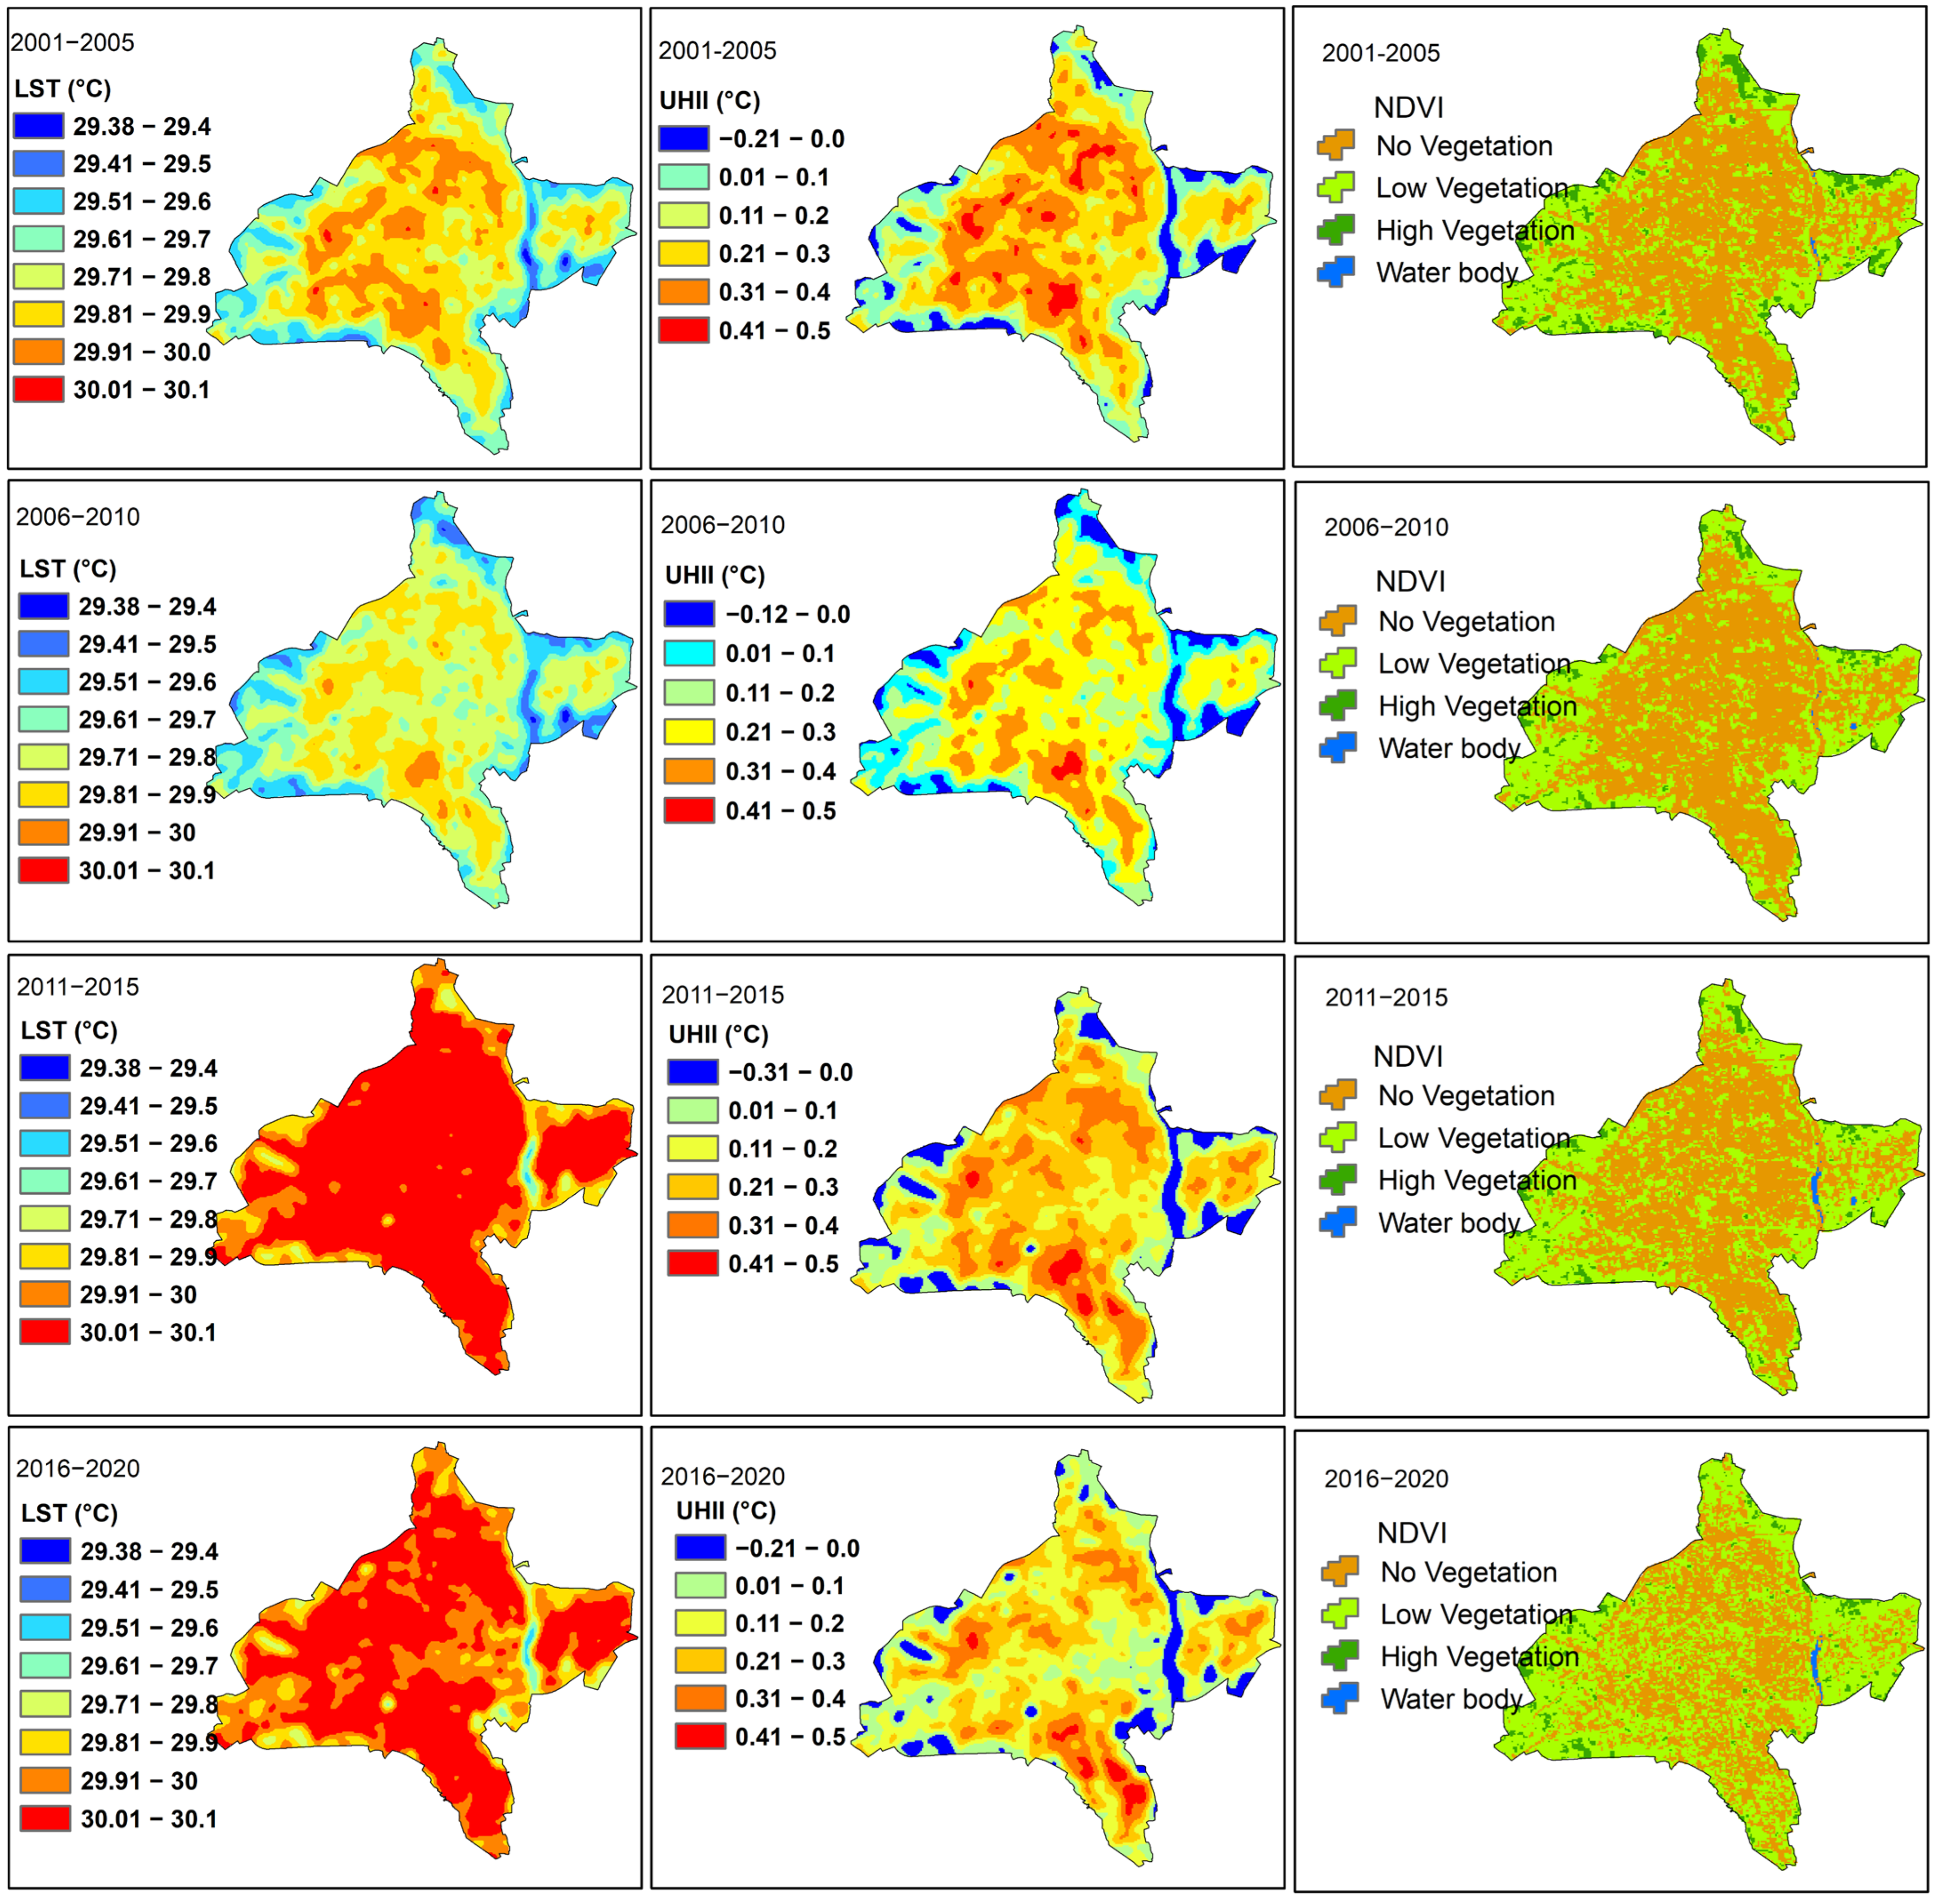
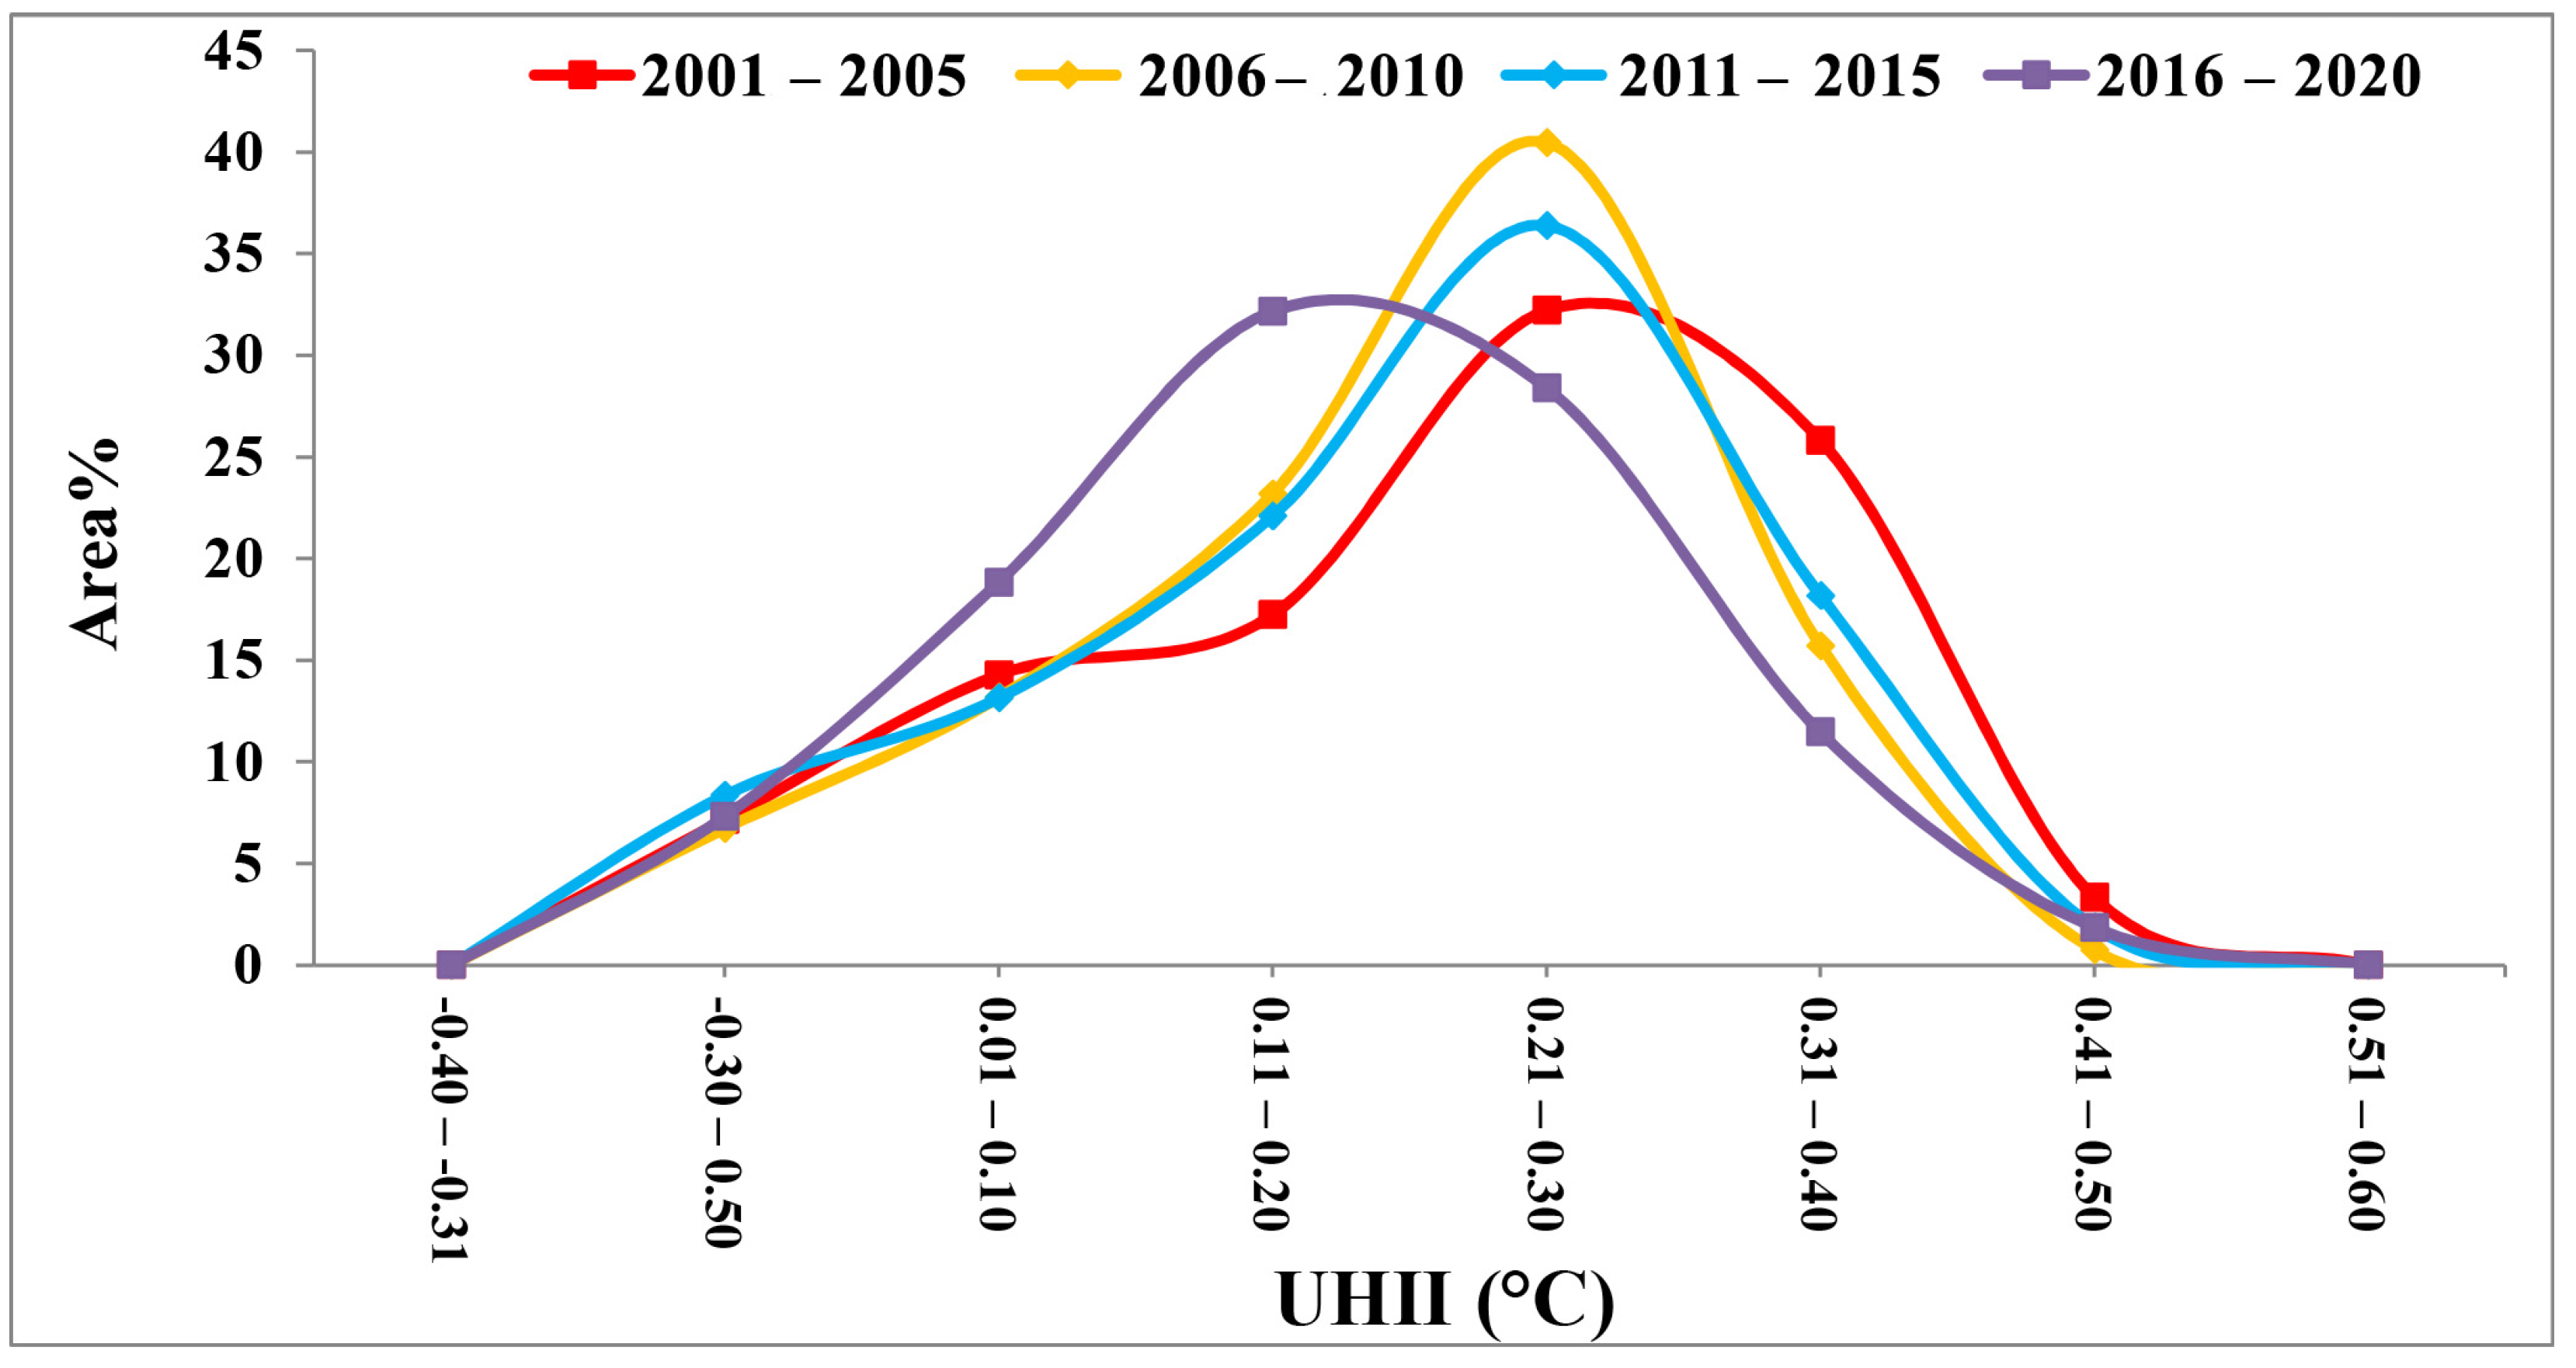
4.1. Analyses of the LST Changes and UHII

Point-to-point LST differences were obtained using the average rural area in this investigation to explore the temporal and spatial changes of the UHI. The UHI in the city was used for demonstrating regions warmer than 0 °C. Figure 2a displays the change in the average LST rural and the area of Sari city during the 2001–2022 period. As can be observed, the LST in the city region was higher than the LST in rural areas over the entire period. However, its alterations are accompanied by a growing tendency and fluctuation in different years. However, Figure 2b depicts the difference between the average yearly LST in rural and urban areas, which shows a considerably significant decreasing trend (r = −0.42). In other words, the UHI’s severity has been lowered due to urban warming.
It appears that the escalation of global warming is not confined solely to urban regions but extends to suburban areas as well. Consequently, this phenomenon results in a reduction of temperature disparity between the city and its suburbs, diminishing the intensity of the UHI. Despite this challenge, certain mechanisms contribute to UHI intensity reduction, with one notable factor being alterations in urban green spaces, as expounded upon in the subsequent sections.
A parallel issue is observable when evaluating temperature differences between elevated and low-lying regions. The impact of global warming manifests in a diminished temperature contrast between high-altitude mountainous areas and low-altitude areas [55,56].
Figure 3 also displays the five-year average dispersion of average LST and UHII. The spread pattern of LST in urban areas is changing in this figure; the city level’s LST range was between 29.38 °C and 30.1 °C between 2001 and 2005. The highest LSTs were found in the city center, and the lowest LSTs were in the east and near the Tajen River. The LST distribution pattern in 2006–2010 indicates a range of changes between 29.38 °C and 30.0 °C, like the prior decade. On the other hand, the distribution of the highest LST has been extended to parts of the city’s south. The variation in LST increased from 2011 to 2015, reaching 29.58 °C to 30.40 °C. The LST intensity distribution, on the other hand, was like the previous period. The range of LST variations was like the previous period from 2016 to 2020. During this time, the south of the city had the highest LSTs. The LST was at its lowest in 2001–2005 and 2006–2010, with the city’s major areas ranging from 29.6–29.51 °C and 29.81–29.9 °C. This range is equivalent to 80.15% of the city’s area in the first period and 94.26% of Sari’s area in the second period. However, the LST class range increased between 2010 and 2015, and the greatest urban area was between LST classes 29.9–29.81 °C and 30.30–30.21 °C. So, from 2010 to 2015, the area of coverage of these two tiers covered 97.19% of the city, and from 2016 to 2020, it covered 96.44% of the city. According to Figure 3, the range of LST changes in the city is generally increasing.
Furthermore, Figure 4’s assessment of UHII changes shows that the largest UHII was seen between 2001 and 2005. As a result, the distribution of spots with intensity classes ranging from 0.40–0.31 °C to 0.50–0.41 °C covered roughly 29.14% of the entire city in the center region, while the scope of these two classes was 16.45% from 2006 to 2010, 20.05% from 2015 to 2011, and 13.13% of the city’s total area from 2016 to 2020. The figure shows that the severity of Sari’s UHI has worsened over the last two decades. Figure 5 shows the area changes of the UHII in different classes and the skewness of the UHII trends to be positive in 2001–2005 compared to 2016–2020. In other words, the greater part of city areas with decreased UHII occurred between 2016 and 2020. An important sign of the UHII is that, in addition to existing in areas with low construction density, the UHI has not spread. Rather, the Tajen River’s role in weakening the power of the UHI is pretty evident, and it has remained so across all four periods. In general, the results of this phase of the study indicate a decrease in UHII with the rise in NDVI in recent years. These trends are particularly noticeable in the second through fourth decades. The overall average NDVI for these decades is 0.211, 0.228, and 0.238, respectively. Correspondingly, the average UHII for the second and third decades is 0.197 °C, while for the fourth decade, it is 0.172 °C. Conversely, the findings reveal an increasing trend in both high vegetation and low vegetation areas from the second to the fourth period. This growth in green spaces within the urban environment directly contributes to the reduction in UHII.

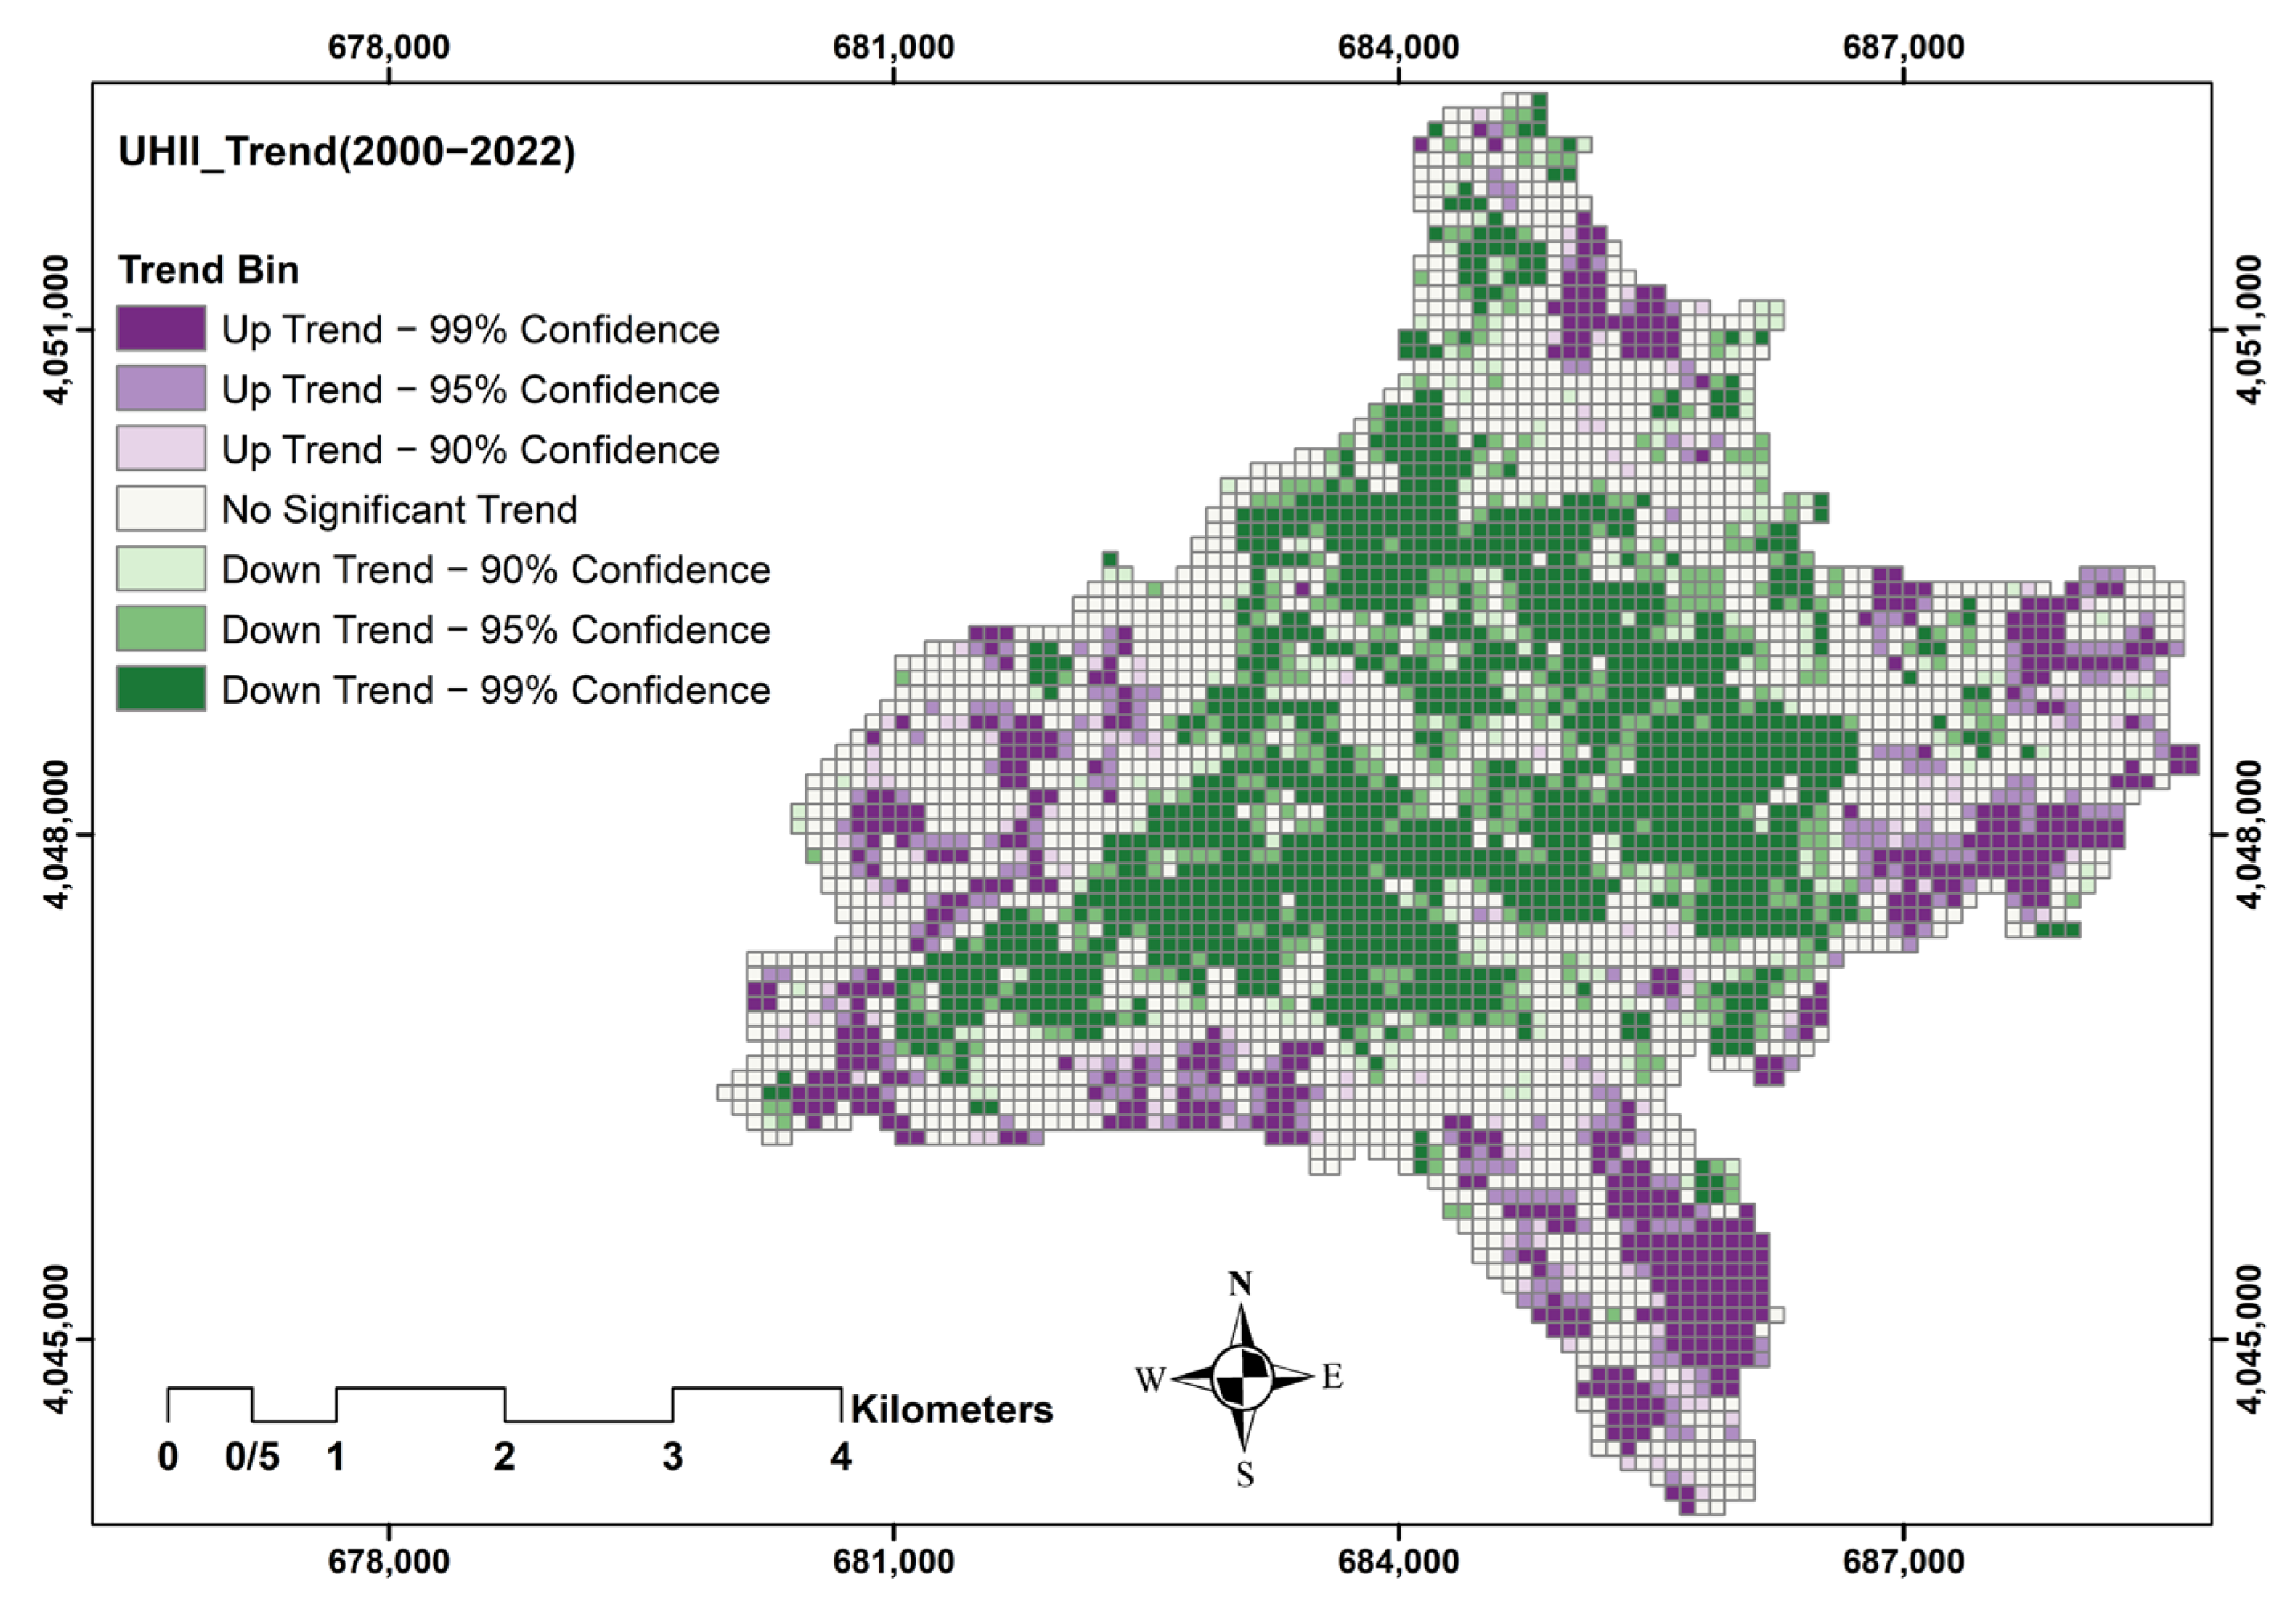
4.2. Investigating the Trend of Changes in the UHII of Sari City

Figure 6 shows a distribution map of the significant change in the intensity of Sari’s UHI from 2000 to 2022. As previously indicated, the Mann–Kendall approach was utilized to create this estimate as independent pixels in a 23-year time series. As seen on the map, the main parts of the city center indicate a downward trend, while the city’s outskirts show an increase in UHII (upward trends). This issue indicates that the city’s outskirts are fast developing. Table 4 demonstrates that, on the other hand, about 11.99% of the city area with a 99% confidence level and 5.77% with a 95% confidence level reveal an upward trend of UHII in Sari City. While 27.14% of the city area has a confidence level of 99%, and 8.81% has a confidence level of 95%, the severity of the UHII is decreasing (downward trend). It has a larger overall extent than the expanding state in the decreasing trend areas of the UHI.

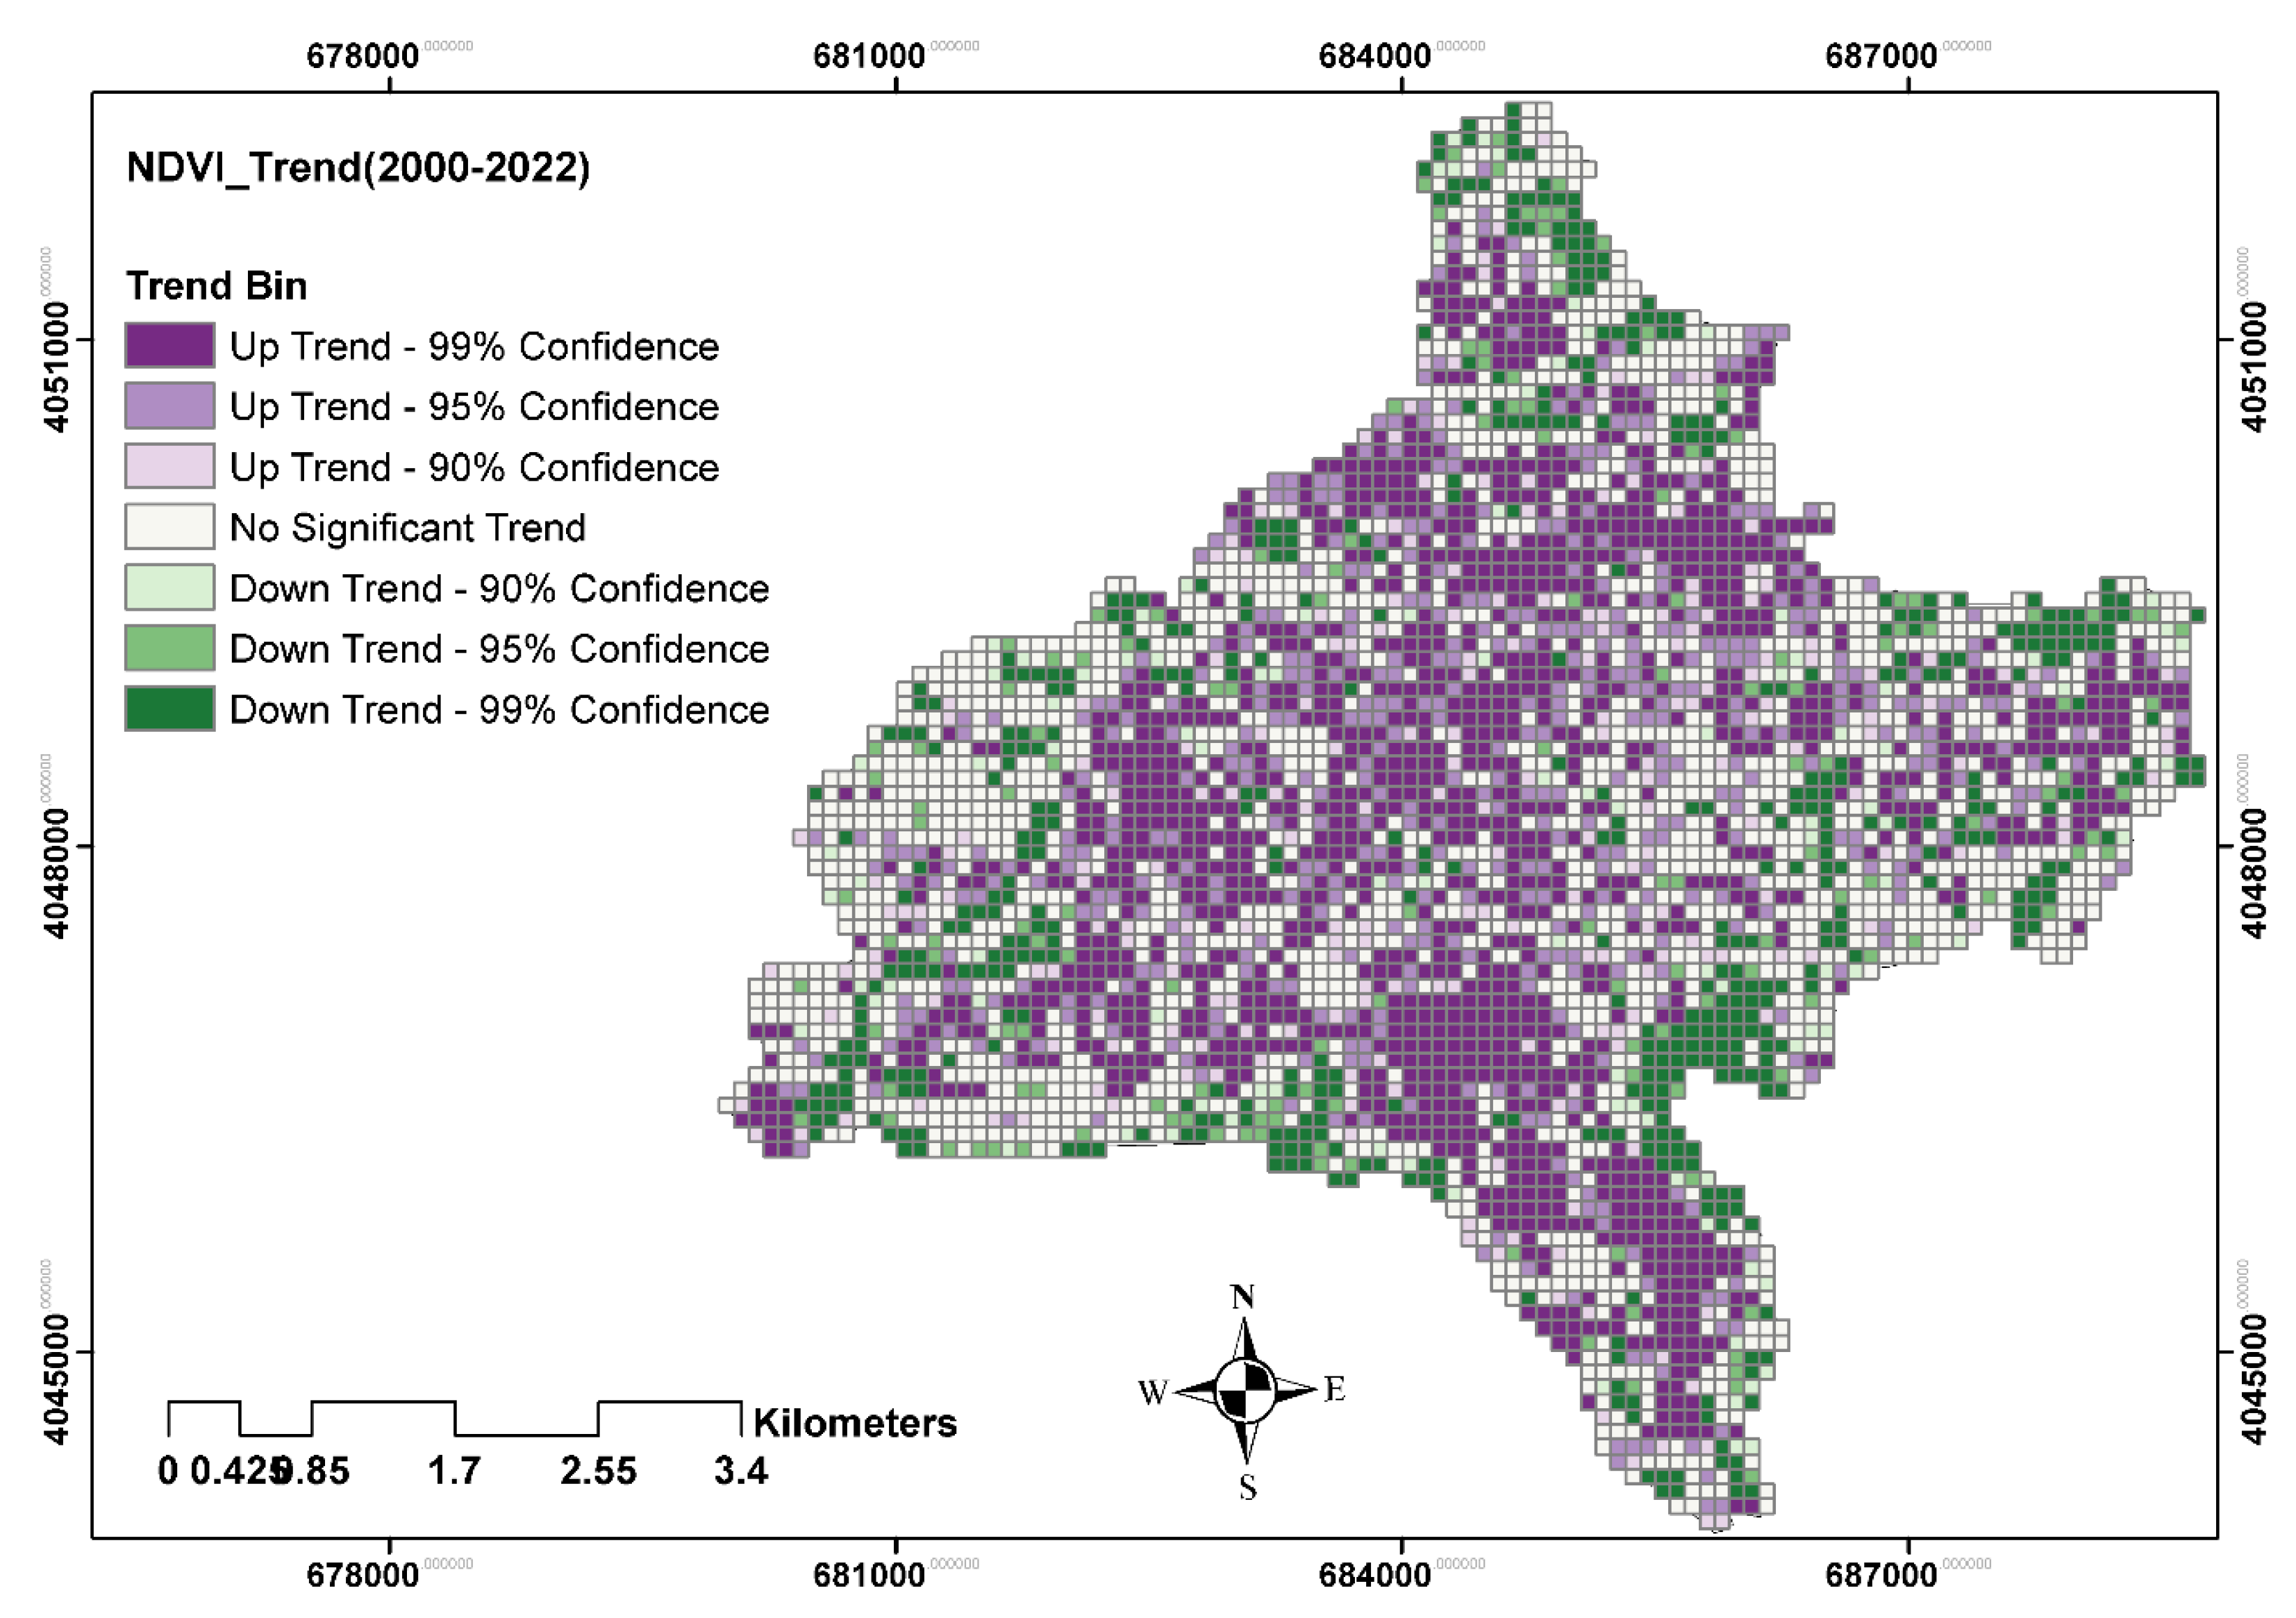
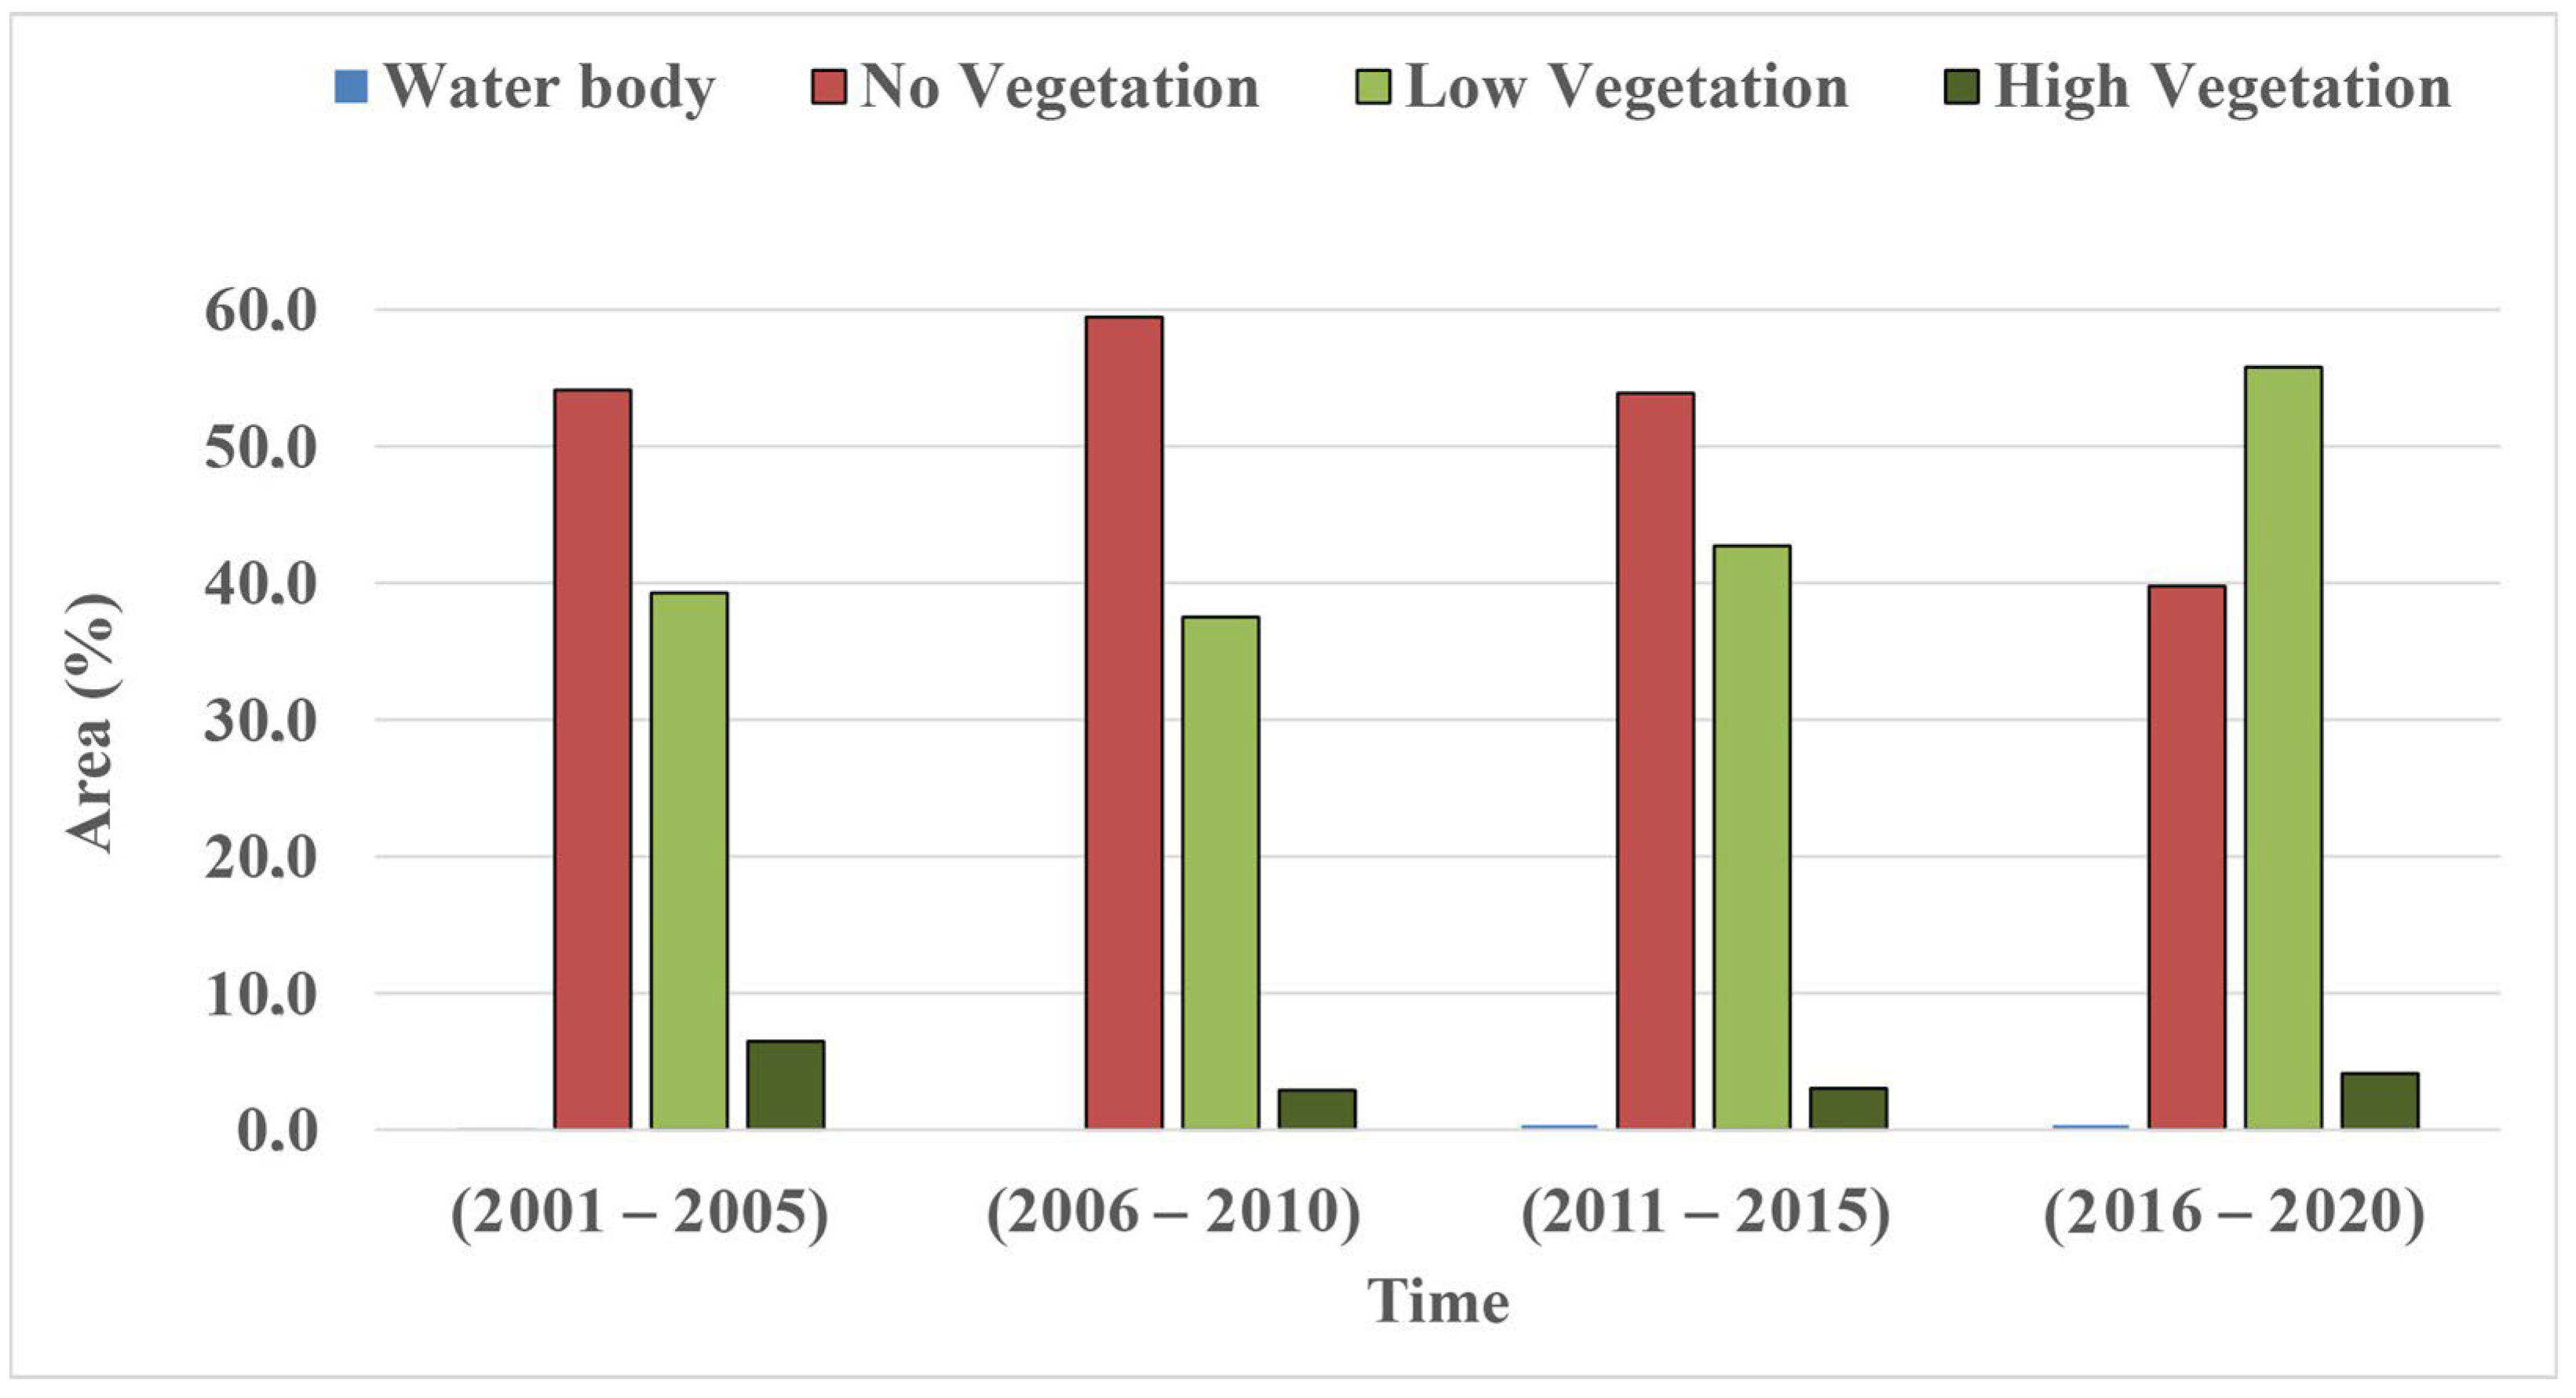
4.3. Investigating the Trend of Changes in the NDVI of Sari City

Figure 7 shows a distribution map of the significant change in the NDVI over Sari from 2000 to 2022. As seen on the map, the main parts of the city center indicate an upward trend, while moving away from the city center, the NDVI change trend is decreasing (downward trend). This can be because, with the city’s expansion (urban sprawl), the surrounding lands have been allocated to urban use, and on the other hand, the green space in the city’s central areas has been expanding. Table 5 demonstrates that, on the other hand, about 12.06% of the city area with a 99% confidence level and 3.60% with a 95% confidence level reveal an upward trend of NDVI in Sari City. While 5.85% of the city area has a confidence level of 99%, and 11.84% has a confidence level of 95%, the severity of the NDVI is decreasing (downward trend). In general, the area with a significant level of more than 90% for the increasing trend of NDVI with an area of 48.6% is more than the areas with a decreasing trend of NDVI with an area of 18.2% for the city of Sari.
Based on the long-term average from 2000 to 2020, 0.22% of the city’s area is included in the water body class. The No Vegetation class occupies the largest area with 51.83%, and for the two classes of Low Vegetation and High Vegetation, the areas are 43.82% and 4.13%, respectively (Figure 4 and Figure 8). In general, in every decade, on average, the area of the water body class has increased by 0.23%/decade, which is a very small percentage. But it is interesting to note that the area of the No Vegetation class has decreased by −9.97%/decade; on the other hand, the area of the Low Vegetation class shows an average increase of 10.85%/decade. At the same time, the areas covered by the High Vegetation class, which are usually around the city and are the place of physical expansion and development, show a decrease of −1.11%/decade (Figure 4 and Figure 8).

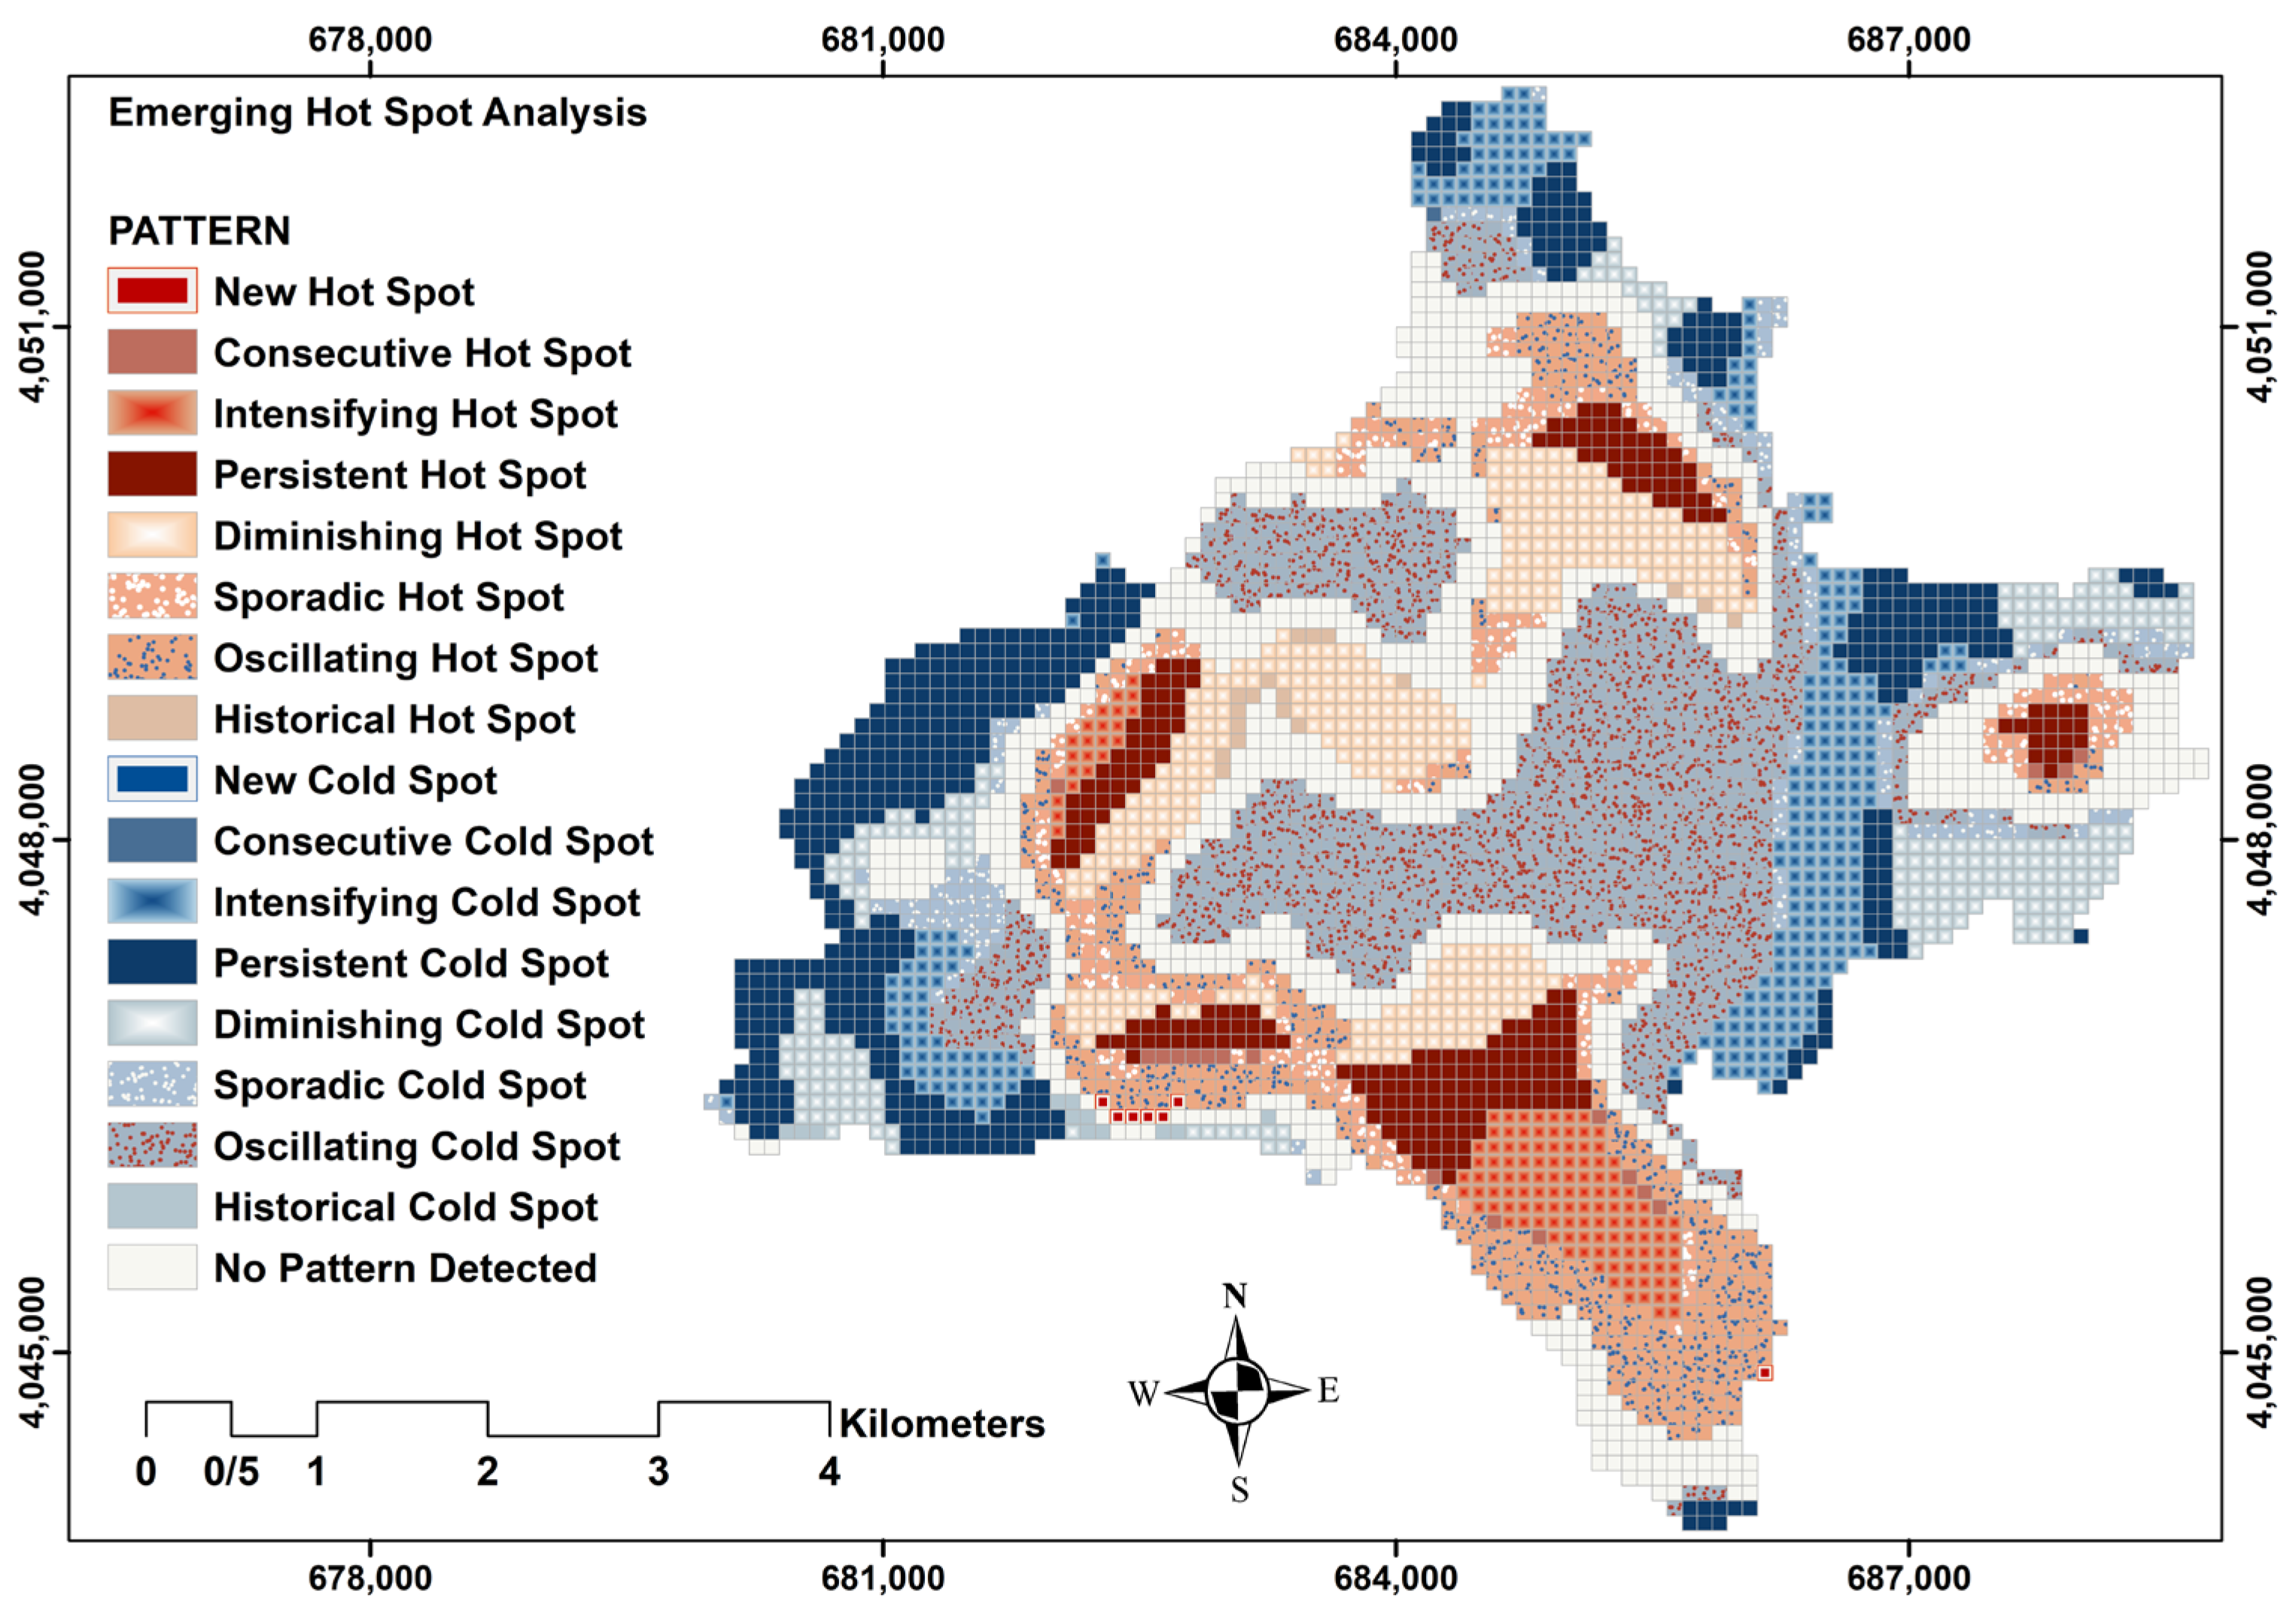
4.4. Temporal and Spatial Changes of Emerging Hot Spots of Urban Heat Island in Sari City

The EHSA tool was applied in this research to assess spatiotemporal patterns of UHII anomalies within Sari. As mentioned earlier, the tool utilizes two statistical measures: first, the Getis–Ord Gi* statistic and second, the Mann–Kendall trend test. The Mann–Kendall statistic is used to determine if there is a statistically significant temporal trend in each bin’s 23-year time series of Z scores from the Getis–Ord Gi* statistic.
However, it also reveals numerous Z scores for the complexity over time in hot spot time series analysis. As a result, distinct locations are given different names based on the frequency at which they occur. Figure 9 illustrates the findings of the EHSA analysis function in this investigation over 23 years. Based on this, the hot spot pattern recognized approximately 31.6% of the entire city, the cold spot pattern identified 49.26%, and the lack of pattern identified 19.24%. However, according to Table 6, the “Oscillating Cold Spot” accounts for 21.8% of the city in the cold spot pattern. In addition, “Persistent Cold Spot” extends to 11.6% of the city area in this manner.
Moreover, the “Intensifying Cold Spot” has extended to 7.29% of the city. Then, it should be mentioned that 5.86% of the city of Sari had the “Diminishing Cold Spot” pattern present. Cold spot occurrence zones with the “Sporadic Cold Spot” pattern can be seen in 3.02% of the city’s area. But based on the distribution of hot spots, “Diminishing Hot Spots” occupy 8.73% of the area, and the “Oscillating Hot Spot” pattern is equivalent to 8.54% of the city area.

5. Discussion

This study aimed to characterize and comprehend the changes in urban heat island temporal and spatial patterns in Sari, Iran, as a representative humid subtropical climate. The study investigated vegetation changes as a factor influencing the behavior of UHII. In the following paragraphs, we discuss the major study findings and limitations and reflect on the requirements for future work.
The intensity of the UHI is one of the climatic phenomena influenced by climate change and can also impact local climates. In other words, the large-scale climate can influence the UHII while controlling the small-scale climate. The average temperature of the metropolitan environment and its outer space are a function of an increasing trend in global temperature, according to the estimated results of this study since both habitats exhibit an increasing temperature trend. In the case of Sari, Iran, the difference between the metropolitan environment’s average LST and its outermost boundary is decreasing. In other words, it can be inferred that the temperature rise brought on by global warming decreases the temperature disparity between tiny climate regions. The LST range between 2011 and 2022 has expanded by around 0.30 °C compared to 2001 to 2010, according to an analysis of the Sari urban LST map. This amount is significant for 20 years in a town of moderate size like Sari. Based on an investigation of urban LST area variations from 2011 to 2015, the largest part of Sari City in the LST class of 30.2–30.11 °C equates to 35.11%. At the same time, it is 39.46% of the overall city in the LST class of 29.8–29.71 °C from 2006 to 2010. As a result, it can be thought that the LST of Sari has been increasing in recent years due to global warming. Other variables, such as human indicators (AI), could have influenced it.
On the other hand, the examination of the UHII in Sari suggests that the range of UHI classes is the same in all 5-year periods, except that the class area has been relocated. Thus, the largest area from 2001 to 2005 is 0.30–0.21 °C, accounting for 32.2% of the total city, whereas the largest area from 2016 to 2020 is in the range of 0.20–0.11 °C, accounting for 32.2%. In other words, even though the total severity of the UHI has not changed in 20 years, its placement inside the urban boundaries has moved. Sari’s urban development and extension have been affected by time and place. Climate change can justify LST fluctuations based on LST variations and the UHII.
Uncertainty in remote sensing data, particularly in the context of NDVI data, is a critical consideration that can impact the reliability and interpretation of results. The sources of uncertainty in NDVI data are diverse, ranging from sensor limitations and atmospheric conditions to preprocessing techniques. Variability in sensor calibration, spectral resolution, and radiometric accuracy introduces uncertainties that may propagate throughout the entire data processing chain. Additionally, atmospheric conditions, such as cloud cover, aerosols, and water vapor, can affect the quality of satellite imagery and introduce uncertainties in the derived NDVI values. Furthermore, choices made during data preprocessing, such as atmospheric correction and geometric rectification, can influence the final accuracy of NDVI data. Acknowledging and quantifying these uncertainties are crucial for ensuring the robustness of any analysis or modeling based on remote sensing-derived NDVI data. Researchers often employ sensitivity analyses and validation techniques to understand better and communicate the potential sources and magnitude of uncertainty in their findings [57,58].
Our study evaluated the NDVI variability and monitored it during the last two decades. Landsat satellites 7 and 8 data were from 2000 to 2020. Thus, our research methodology is robust and valid based on a recent dataset of land surface temperatures. Moreover, we applied state-of-the-art hotspot analysis to understand the spatiotemporal variations. Energy Hot Spot analysis is a new method used in GIS-based analysis. The richness and freshness of the dataset allowed us to draw a novel and accurate picture of the UHI in Sari, Iran. The satellite data allowed us to calculate and visualize the average LST difference between the city and the surrounding area. However, the temporal and spatial dispersion of Sari UHI can be influenced by human activity. This conclusion is supported by the fact that the intensity range of the UHI at the surface has not changed. However, its average value shows a decreasing tendency, indicating that it is a function of climate change, which causes LST uniformity. The Mann–Kendall approach reveals a considerable drop in the UHI’s severity in Sari’s center area.
In point-to-point urban mode, 35.95% of the urban area decreased, although the marginal expansion of the UHII increased in recent years. This research showed that the increase in the UHII in suburban areas is due to decreased NDVI and the decrease in the High Vegetation class. In fact, with the expansion of urban areas to the surrounding areas, urban land use has replaced the dense vegetation cover, and the UHII has increased in this area. On the other hand, the decrease in UHII in the central areas is also affected by the increase in NDVI, especially the increase in the Low Vegetation class.
Spatial and temporal analysis of the urban heat island effect in cities is gaining attention [59]. Several studies are reporting the results due to the availability of remote-sensing-based datasets [60]. The increase in the surface of the urban heat island in many cities, including Sari, is becoming a common finding [61]. Most of those studies focus on coupling land surface temperature and NDVI [62]. Our results and methodology benefit from the advancement of spatio-temporal modeling utilizing remote sensing techniques and geostatistical hot spot analysis [63]. However, what is needed is to find a relationship between the surface heat island effects and air heat island effects [64]. Remote sensing can stay on the 2D level if we do not address the air heat temperature and think about the urban thermal layer in 3D [65].
Future research is needed to properly comprehend the connection between the NDVI and UHI impact mitigation. By increasing the green space in the urban area, the intensity of thermal stress and the temperature budget of the city can be reduced. Overall, the impact of introducing green vegetation or nature-based solutions into the UHI effect is complex and varies depending on the city’s location, layout, and growth, the quantity and density of its inhabitants, and the urban economy’s energy and water use. As shown in this study, increasing green spaces in cities can counterbalance the effects of the UHI. Also, field surveys and local measurement campaigns are needed to move from the mesoscale to the microscale to move to a lower urban thermal layer, addressing the spatial and temporal variability [66]. Decisions regarding how to adapt to control urban densification and lessen the effects of climate change in urban settings can be made with the use of this knowledge by policymakers and urban planners. There is a need to investigate the evolution of UHI of mid-size cities (under 1 million inhabitants) like Sari to understand how human activity affects and, more importantly, how the increase in vegetation can play a role in mitigating the urban heat island effects.

6. Conclusions

The proposed spatiotemporal analysis method, amalgamating Emerging Hot Spot Analysis (EHSA) and the Mann–Kendall test, offers a theoretical framework to enhance our comprehension of the intricate interplay among urbanization, climate change, and the environment. By employing EHSA, the approach identifies spatial clusters with significant changes in vegetation over time, shedding light on the dynamic patterns of urban greenery. Simultaneously, the Mann–Kendall test explores temporal trends, revealing shifts in both vegetation indices and land surface temperatures. This combined methodology allows for a nuanced understanding of how urbanization processes, reflected in changing vegetation, interact with the broader context of climate change. The analysis contributes theoretically by unraveling the spatiotemporal nuances of urban heat island effects, offering valuable insights into the evolving environmental dynamics within urban areas. The interconnectedness of urbanization, climate change, and the environment is thus elucidated through a comprehensive examination of both spatial and temporal dimensions. This study aimed to characterize the urban heat island effects in a mid-size Iranian city representing a humid subtropical climate. Thermal bands and infrared bands of Landsat 7 and 8 satellites were used to generate a dataset between 2000 and 2022 for Sari, Iran. The Mann–Kendall and Emerging Hot Spot Analysis techniques were used as analytical methods for spatiotemporal heat island effect analysis. The results indicate that the LST of Sari has been increasing in recent years due to global warming. Other variables, such as human indicators (AI), could have influenced it. The urban LST area variations from 2011 to 2015 were found in the largest part of Sari City in the LST class of 30.2–30.11 °C, which equates to 35.11%. It is like 39.46% of the overall city in the LST class of 29.8–29.71 °C from 2006 to 2010. The Normalized Difference Vegetation Index increase over the study period decreased the UHI intensity. The city’s LST increased by approximately 0.30 °C between 2011 and 2022. However, the intensity of the UHII decreased during the study period. An average −0.031 °C/decade decrease in the UHII has been experienced. The findings prove the positive role of urban green vegetation and its influence in reducing heat stress. Future research should investigate further effective measures to introduce nature-based solutions concerning water and energy use in urban dense agglomerations. Also, field surveys and local measurement campaigns are needed to characterize the spatial and temporal variability of the UHI.

Author Contributions

Conceptualization, A.G. and S.A.; methodology, A.G.; software, A.G. and G.R.; validation, A.G., G.R. and K.A.; formal analysis, S.A.; investigation, A.G. and G.R.; resources, K.A. and S.A.; data curation, A.G.; writing—original draft preparation, A.G., G.R. and S.A.; writing—review and editing, A.G., G.R. and S.A.; visualization, A.G. and K.A.; supervision, A.G.; project administration, A.G. All authors have read and agreed to the published version of the manuscript.

Funding

This research received no external funding.

Institutional Review Board Statement

Not applicable.

Informed Consent Statement

Not applicable.

Data Availability Statement

The datasets used during the current study are available from the first corresponding author on reasonable request. The data is not publicly available due to privacy considerations with a third party.

Acknowledgments

The authors would also like to acknowledge the Sustainable Building Design (SBD) lab at the Faculty of Applied Sciences at the University of Liege for valuable support during the data acquisition, data analysis and paper writing.

Conflicts of Interest

The authors declare no conflicts of interest.

References

  1. Sun, S.; Zhou, D.; Chen, H.; Li, J.; Ren, Y.; Liao, H.; Liu, Y. Decreases in the urban heat island effect during the Coronavirus Disease 2019 (COVID-19) lockdown in Wuhan, China: Observational evidence. Int. J. Climatol. 2022, 42, 8792–8803. [Google Scholar]
  2. Bottyán, Z.; Kircsi, A.; Szegedi, S.; Unger, J. The relationship between built-up areas and the spatial development of the mean maximum urban heat island in Debrecen, Hungary. Int. J. Climatol. 2005, 25, 405–418. [Google Scholar] [CrossRef]
  3. He, S.; Li, Z.; Wang, W.; Yu, M.; Liu, L.; Alam, M.N.; Gao, Q.; Wang, T. Dynamic relationship between meteorological conditions and air pollutants based on a mixed Copula model. Int. J. Climatol. 2021, 41, 2611–2624. [Google Scholar] [CrossRef]
  4. Ren, C.; Wang, K.; Shi, Y.; Kwok, Y.T.; Morakinyo, T.E.; Lee, T.C.; Li, Y. Investigating the urban heat and cool island effects during extreme heat events in high-density cities: A case study of Hong Kong from 2000 to 2018. Int. J. Climatol. 2021, 41, 6736–6754. [Google Scholar] [CrossRef]
  5. Takane, Y.; Kikegawa, Y.; Hara, M.; Ihara, T.; Ohashi, Y.; Adachi, S.A.; Kondo, H.; Yamaguchi, K.; Kaneyasu, N. A climatological validation of urban air temperature and electricity demand simulated by a regional climate model coupled with an urban canopy model and a building energy model in an Asian megacity. Int. J. Climatol. 2017, 37 (Suppl. S1), 1035–1052. [Google Scholar] [CrossRef]
  6. Younger, M.; Morrow-Almeida, H.R.; Vindigni, S.M.; Dannenberg, A.L. The built environment, climate change, and health: Opportunities for co-benefits. Am. J. Prev. Med. 2008, 35, 517–526. [Google Scholar] [CrossRef]
  7. Aram, F.; Solgi, E.; Garcia, E.H.; Mosavi, A.H. Urban heat resilience at the time of global warming: Evaluating the impact of the urban parks on outdoor thermal comfort. Environ. Sci. Eur. 2020, 32, 117. [Google Scholar] [CrossRef]
  8. Liu, Y.; Ortega-Farías, S.; Tian, F.; Wang, S.; Li, S. Estimation of Surface and Near-Surface Air Temperatures in Arid Northwest China Using Landsat Satellite Images. Front. Environ. Sci. 2021, 9, 791336. [Google Scholar] [CrossRef]
  9. Roshan, G.; Sarli, R.; Grab, W.S. The case of Tehran’s urban heat island, Iran: Impacts of urban ‘lockdown’ associated with the COVID-19 pandemic. Sustain. Cities Soc. 2021, 75, 103263. [Google Scholar] [CrossRef]
  10. Pena Acosta, M.; Dikkers, M.; Vahdatikhaki, M.; Santos, J.; Dorée, A.G. A comprehensive generalizability assessment of data-driven Urban Heat Island (UHI) models. Sustain. Cities Soc. 2023, 96, 104701. [Google Scholar] [CrossRef]
  11. World Population Review. Available online: https://worldpopulationreview.com/world-cities/sari-population (accessed on 20 October 2023).
  12. Adulkongkaew, T.; Satapanajaru, T.; Charoenhirunyingyos, S.; Singhirunnusorn, W. Effects of Agricultural Suburb on Urban Heat Island of Bangkok Metropolitan City, Thailand. In Proceedings of the 5th International Conference on Chemical, Agricultural, Biological and Environmental Sciences, Kyoto, Japan, 18–19 April 2017. [Google Scholar]
  13. Halder, B.; Bandyopadhyay, J.; Banik, P. Evaluation of the Climate Change Impact on Urban Heat Island Based on Land Surface Temperature and Geospatial Indicators. Int. J. Environ. Res. 2021, 15, 819–835. [Google Scholar] [CrossRef]
  14. Bondar, H.M.; Baygi, M.M.; Ghahraman, B. Evaluation and Separation between Urban Heat Island and Global Warming in Mashhad Region. Water Soil 2021, 35, 137–151. [Google Scholar]
  15. Hao, Z.; Qi, Z.-F.; Ye, X.-Y.; Cai, Y.-B.; Ma, W.-C.; Chen, M.-N. Analysis of land use/land cover change, population shift, and their effects on spatiotemporal patterns of urban heat islands in metropolitan Shanghai, China. Appl. Geogr. 2013, 44, 121–133. [Google Scholar]
  16. Narumi, D.; Levinson, R.; Shimoda, Y. Effect of Urban Heat Island and Global Warming Countermeasures on Heat Release and Carbon Dioxide Emissions from a Detached House. Atmosphere 2021, 12, 572. [Google Scholar] [CrossRef]
  17. Steensen, B.M.; Marelle, L.; Hodnebrog, Ø.; Myhre, G. Future urban heat island influence on precipitation. Clim. Dyn. 2022, 58, 3393–3403. [Google Scholar] [CrossRef]
  18. Ginzburg, A.S.; Alexandrov, A. Influence of global warming and climate continentality on the Moscow urban heat island. IOP Conf. Ser. Earth Environ. Sci. 2020, 606, 012012. [Google Scholar] [CrossRef]
  19. Jin, K.; Wang, F.; Zong, Q.; Qin, P.; Liu, C. An Updated Estimate of the Urban Heat Island Effect on Observed Local Warming Trends in Mainland China’s 45 Urban Stations. J. Meteorol. Soc. Jpn. Ser. II 2020, 98, 787–799. [Google Scholar] [CrossRef]
  20. Luo, F.; Yang, Y.; Zong, L.; Bi, X. The interactions between urban heat island and heat waves amplify urban warming in Guangzhou, China: Roles of urban ventilation and local climate zones. Front. Environ. Sci. 2023, 11, 1084473. [Google Scholar] [CrossRef]
  21. Xie, M.; Zhu, K.; Wang, T.; Feng, W.; Gao, D.; Li, M.; Li, S.; Zhuang, B.; Han, Y.; Chen, P.; et al. Changes in regional meteorology induced by anthropogenic heat and their impacts on air quality in South China. J. Atmos. Chem. Phys. 2016, 16, 15011–15031. [Google Scholar] [CrossRef]
  22. Clement, M.T.; Elliott, J.R. Chapter 2 Growth Machines and Carbon Emissions: A County-Level Analysis of how U.S. Place-Making Contributes to Global Climate Change. In Urban Areas and Global Climate Change; Emerald Group Publishing Limited: Bingley, UK, 2012; Volume 12, pp. 29–50. [Google Scholar]
  23. Corumluoglu, O. SSD Analyze for the Assessment of Long Term Thermal Effect of Urbanization on the Izmir City’s Local Climate Change. Environ. Sci. Pollut. Res. 2021. [Google Scholar] [CrossRef]
  24. Zhang, Q.; Wu, Z.; Yu, H.; Zhu, X.; Shen, Z. Variable urbanization warming effects across metropolitans of China and relevant driving factors. Remote Sens. 2020, 12, 1500. [Google Scholar] [CrossRef]
  25. Adulkongkaew, T.; Satapanajaru, T.; Charoenhirunyingyos, S.; Singhirunnusorn, W. Effect of land cover composition and building configuration on land surface temperature in an urban-sprawl city, case study in Bangkok Metropolitan Area, Thailand. Heliyon 2020, 6, e04485. [Google Scholar] [CrossRef]
  26. Nyangena, O.; Senelwa, V.K.; Igesa, B.S. Climate change-urbanization nexus: Exploring the contribution of urbanization on carbon emissions in east Africa. J. Sci. Eng. Res. 2019, 6, 158–165. [Google Scholar]
  27. Martinelli, A.; Kolokotsa, D.D.; Fiorito, F. Urban heat island in Mediterranean coastal cities: The case of Bari (Italy). Climate 2020, 8, 79. [Google Scholar] [CrossRef]
  28. Sarah, J.; Louis, M.; Esae, O.E. An Eleven Years Analysis of the Seasonal Dynamics of Urban Heat Island (UHI) Intensity (2004–2014). Int. J. Geogr. Geol. 2020, 9, 55–70. [Google Scholar] [CrossRef]
  29. Meng, F.; Li, M.; Guo, J.; Zhang, L.; Cao, J.; Chen, Y. Impact of urban heat island effect on building heating intensity in Tianjin, China. Int. J. Glob. Warm. 2020, 21, 20–34. [Google Scholar] [CrossRef]
  30. Keppas, S.C.; Papadogiannaki, S.; Parliari, D.; Kontos, S.; Poupkou, A.; Tzoumaka, P.; Kelessis, A.G.; Zanis, P.; Casasanta, G.; de’Donato, F.; et al. Future Climate Change Impact on Urban Heat Island in Two Mediterranean Cities Based on High-Resolution Regional Climate Simulations. Atmosphere 2021, 12, 884. [Google Scholar] [CrossRef]
  31. Chaston, T.B.; Broome, R.A.; Cooper, N.; Duck, G.; Geromboux, C.; Guo, Y.; Ji, F.; Perkins-Kirkpatrick, S.E.; Zhang, Y.; Dissanayake, G.S.S.; et al. Mortality Burden of Heatwaves in Sydney, Australia Is Exacerbated by the Urban Heat Island and Climate Change: Can Tree Cover Help Mitigate the Health Impacts? Atmosphere 2022, 13, 714. [Google Scholar] [CrossRef]
  32. Faraji, A.; Rashidi, M.; Rezaei, F.; Sorooshnia, E. Determining Appropriate Thermal Comfort Period based on PET and PMV using the RayMan Model: A Case Study in the Subtropical City of Sari. Iran Univ. Sci. Technol. 2022, 32. [Google Scholar] [CrossRef]
  33. Rodrigues, E.; Fereidani, N.A.; Fernandes, M.S.; Gaspar, A.R. Climate change and ideal thermal transmittance of residential buildings in Iran. J. Build. Eng. 2023, 74, 106919. [Google Scholar] [CrossRef]
  34. Liaison, S.; Jakob, F.E.; Dunn, W.A.; Brager, G.S.; Brown, K.A.; Clark, D.R.; Deringer, J.J.; Hogeling, J.J.; Int-hout, D.; Jones, B.W.; et al. Thermal Environmental Conditions for Human Occupancy. ASHRAE Stand. 2004, 55, 5. [Google Scholar]
  35. Ziari, K.; Yadollahnia, H.; Yadollahnia, H. Urban Management Performance Analysis with Emphasis on Good Governance Indicators from the Citizen’s Perspective (Case Study: Sari City). J. Res. Urban Plan. 2020, 11, 1–16. [Google Scholar]
  36. Nikpour, A.; Yarahmadi, M. Easurement and evaluation of urban sprawl A Case study The Sari city. J. Geogr. Reg. Plan. 2022, 10, 189–204. [Google Scholar]
  37. Davis, Z.; Nesbitt, L.; Guhn, M.; Bosch, M.V.D. Assessing changes in urban vegetation using Normalised Difference Vegetation Index (NDVI) for epidemiological studies. Urban For. Urban Green. 2023, 88, 128080. [Google Scholar] [CrossRef]
  38. Vieira, F.R.; Christofaro, C. Contributions of the vegetation index (NDVI) in water quality prediction models in a semi-arid tropical watershed. J. Arid Environ. 2024, 220, 105122. [Google Scholar] [CrossRef]
  39. Hashim, H.; Abd Latif, Z.; Adnan, N.A. Urban Vegetation Classification with NDVI Threshold Value Method with Very High Resolution (VHR) Pleiades Imagery, The International Archives of the Photogrammetry, Remote Sensing and Spatial Information Sciences, Volume XLII-4/W16. In Proceedings of the 2019 6th International Conference on Geomatics and Geospatial Technology (GGT 2019), Kuala Lumpur, Malaysia, 1–3 October 2019. [Google Scholar]
  40. Sharma, V.R.; Kamal, B. Estimation of land surface temperature using Landsat data: A case study of Agra city, India. Int. J. Adv. Res. Ideas Innov. Technol. 2019, 5, 1850–1857. [Google Scholar]
  41. Carpio-Pinedo, J.; Romanillos, G.; Aparicio, D.; Martín-Caro, M.S.H.; García-Palomares, J.C.; Gutiérrez, J. Towards a new urban geography of expenditure: Using bank card transactions data to analyze multi-sector spatiotemporal distributions. Cities 2022, 131, 103894. [Google Scholar] [CrossRef]
  42. Roshan, G.; Yousefi, R.; Fitchett, J.M. Long-term trends in tourism climate index scores for 40 stations across Iran: The role of climate change and influence on tourism sustainability. Int. J. Biometeorol. 2016, 60, 33–52. [Google Scholar] [CrossRef] [PubMed]
  43. Zahraei, K.; Qanqormeh, A. Assessment of Caspian Sea climate change through analysis of water surface temperature trend. Nat. Environ. Hazards 2019, 8, 217–232. [Google Scholar]
  44. Gocic, M.; Trajkovic, S. Analysis of changes in meteorological variables using Mann-Kendall and Sen’s slope estimator statistical tests in Serbia. Glob. Planet. Chang. 2013, 100, 172–182. [Google Scholar] [CrossRef]
  45. Frimpong, B.F.F.; Koranteng, A.; Molkenthin, F. Analysis of temperature variability utilising Mann–Kendall and Sen’s slope estimator tests in the Accra and Kumasi Metropolises in Ghana. Environ. Syst. Res. 2022, 11, 24. [Google Scholar] [CrossRef]
  46. Nigrelli, G.; Chiarle, M. 1991–2020 climate normal in the European Alps: Focus on high-elevation environments. J. Mt. Sci. 2023, 20, 2149–2163. [Google Scholar] [CrossRef]
  47. ESRI. How Emerging Hot Spot Analysis Works. ESRI. 2023. Available online: https://pro.arcgis.com/en/pro-app/latest/tool-reference/space-time-pattern-mining/learnmoreemerging.htm (accessed on 16 May 2023).
  48. Adepeju, M.; Rosser, G.; Cheng, T. Novel evaluation metrics for sparse spatio-temporal point process hotspot predictions—A crime case study. Int. J. Geogr. Inf. Sci. 2016, 30, 2133–2154. [Google Scholar] [CrossRef]
  49. Gudes, O.; Varhol, R.; Sun, Q.C.C.; Meuleners, L. Investigating articulated heavy-vehicle crashes in Western Australia using a spatial approach. Accid. Anal. Prev. 2017, 106, 243–253. [Google Scholar] [CrossRef] [PubMed]
  50. Rabiei-Dastjerdi, H.; McArdle, G. Identifying patterns of neighbourhood change based on spatiotemporal analysis of airbnb data in Dublin. In Proceedings of the 2020 4th International Conference on Smart Grid and Smart Cities (ICSGSC), Osaka, Japan, 18–21 August 2020. [Google Scholar]
  51. Reddy, C.S.; Unnikrishnan, A.; Bird, N.G.G.; Faseela, V.S.; Asra, M.; Manikandan, T.M.; Rao, P.V.N. Characterizing vegetation fire dynamics in Myanmar and South Asian countries. J. Indian Soc. Remote Sens. 2020, 48, 1829–1843. [Google Scholar] [CrossRef]
  52. Hart, T.C. Investigating crime pattern stability at micro-temporal intervals: Implications for crime analysis and hotspot policing strategies. Crim. Justice Rev. 2021, 46, 173–189. [Google Scholar] [CrossRef]
  53. Asgary, A.; Solis, A.O.; Khan, N.; Wimaladasa, J.; Shafiei Sabet, M. Spatiotemporal Analysis of Emergency Calls during the COVID-19 Pandemic: Case of the City of Vaughan. Urban Sci. 2023, 7, 62. [Google Scholar] [CrossRef]
  54. Morckel, V.; Durst, N. Using Emerging Hot Spot Analysis to Explore Spatiotemporal Patterns of Housing Vacancy in Ohio Metropolitan Statistical Areas. Urban Aff. Rev. 2023, 59, 309–328. [Google Scholar] [CrossRef]
  55. Overland, J.E.; Wang, M.; Ballinger, T.J. Recent increased warming of the Alaskan marine Arctic due to midlatitude linkages. Adv. Atmos. Sci. 2018, 35, 75–84. [Google Scholar] [CrossRef]
  56. Thompson, L.G.; Davis, M.E.; Thompson, E.M.; Porter, S.E.; Corrales, G.V.; Shuman, C.A.; Tucker, C.J. The impacts of warming on rapidly retreating high-altitude, low-latitude glaciers and ice core-derived climate records. Geophys. Res. Lett. 2021, 203, 103538. [Google Scholar] [CrossRef]
  57. Shen, X.; Jiang, M.; Lu, X.; Liu, X.; Liu, B.; Zhang, J.; Wang, X.; Tong, S.; Lei, G.; Wang, S.; et al. Aboveground biomass and its spatial distribution pattern of herbaceous marsh vegetation in China. Sci. China Earth Sci. 2021, 64, 1115–1125. [Google Scholar] [CrossRef]
  58. Wang, Y.; Shen, X.; Jiang, M.; Tong, S.; Lu, X. Spatiotemporal change of aboveground biomass and its response to climate change in marshes of the Tibetan Plateau. Int. J. Appl. Earth Obs. Geoinf. 2021, 102, 102385. [Google Scholar] [CrossRef]
  59. Zhou, D.; Xiao, J.; Bonafoni, S.; Berger, C.; Deilami, K.; Zhou, Y.; Frolking, S.; Yao, R.; Qiao, Z.; Sobrino, J.A. Satellite remote sensing of surface urban heat islands: Progress, challenges, and perspectives. Remote Sens. 2018, 11, 48. [Google Scholar] [CrossRef]
  60. Espinoza-Molina, J.; Acosta-Caipa, K.; Chambe-Vega, E.; Huayna, G.; Pino-Vargas, E.; Abad, J. Spatiotemporal analysis of urban heat islands in relation to urban development, in the vicinity of the atacama desert. Climate 2022, 10, 87. [Google Scholar] [CrossRef]
  61. Li, F.; Sun, W.; Yang, G.; Weng, Q. Investigating spatiotemporal patterns of surface urban heat islands in the Hangzhou Metropolitan Area, China, 2000–2015. Remote Sens. 2019, 11, 1553. [Google Scholar] [CrossRef]
  62. Ma, X.; Peng, S. Research on the spatiotemporal coupling relationships between land use/land cover compositions or patterns and the surface urban heat island effect. Environ. Sci. Pollut. Res. 2022, 29, 39723–39742. [Google Scholar] [CrossRef] [PubMed]
  63. Hussain, N.; Ahmed, S.S.; Shumi, A.M. Remote sensing-based geostatistical hot spot analysis of Urban Heat Islands in Dhaka, Bangladesh. Singap. J. Trop. Geogr. 2023, 44, 438–458. [Google Scholar] [CrossRef]
  64. Sun, T.; Sun, R.; Chen, L. The trend inconsistency between land surface temperature and near surface air temperature in assessing urban heat island effects. Remote Sens. 2020, 12, 1271. [Google Scholar] [CrossRef]
  65. Huang, X.; Wang, Y. Investigating the effects of 3D urban morphology on the surface urban heat island effect in urban functional zones by using high-resolution remote sensing data: A case study of Wuhan, Central China. ISPRS J. Photogramm. Remote Sens. 2019, 152, 119–131. [Google Scholar] [CrossRef]
  66. Attia, S. The role of landscape design in improving the microclimate in traditional courtyard buildings in hot arid climates. In Proceedings of the 23rd International Conference on Passive and Low Energy Architecture-PLEA 2006, PLEA-Université de Genève-Groupe Énergie, Genève, Switzerland, 6–8 September 2006. [Google Scholar]
Figure 1. Satellite image of Sari’s growth between 2001 and 2020.
Atmosphere 15 00161 g001
Figure 2. Changes in LST (°C) (a) and average UHI (b) in urban and rural areas.
Atmosphere 15 00161 g002
Figure 3. Area changes related to LST classes based on 5-year averages.
Atmosphere 15 00161 g003
Figure 4. Spatial-temporal changes of LST, UHI and NDVI based on 5-year average intervals.
Atmosphere 15 00161 g004
Figure 5. Area changes related to UHII classes based on 5-year averages.
Atmosphere 15 00161 g005
Figure 6. Changing trend map of Sari’s UHII calculated using the Mann–Kendall method.
Atmosphere 15 00161 g006
Figure 7. Changing trend map of Sari’s NDVI calculated using the Mann–Kendall method.
Atmosphere 15 00161 g007
Figure 8. Area changes related to NDVI classes based on 5-year averages.
Atmosphere 15 00161 g008
Figure 9. Revealing spatiotemporal anomalies of UHII in Sari City using EHSA analysis.
Atmosphere 15 00161 g009
Table 1. The frequency of LST days was calculated from Landsat 7 and 8 satellite images.
YearLandsat 7Landsat 8Sum
20008---8
200111---11
20025---5
20035---5
200416---16
200513---13
200617---17
200725---25
200812---12
200911---11
201015---15
20119---9
201220---20
201315722
201491322
2015131932
201691019
2017131023
2018141327
2019121729
2020151025
2021212041
2022151025
Total304129433
Table 2. Urban vegetation classes and NDVI value.
ScenarioVegetation ClassesDescriptionNDVI
Value
1No VegetationBarren areas, built-up
area, road network
−1 to
0.199
2Low VegetationShrub and grassland0.2 to
0.5
3High VegetationTemperate and tropical
urban forest
0.501
to 1.0
Table 3. Spatial and temporal patterns for Emerging Hot Spot Analysis [47].
Pattern NameDefinition
No Pattern DetectedDoes not fall into any of the hot or cold spot patterns defined below.
New Hot SpotA location that is a statistically significant hot spot for the final time step has never been a statistically significant hot spot.
Consecutive Hot SpotA location with a single uninterrupted run of statistically significant hot spot bins in the final time-step intervals. The location has never been a statistically significant hot spot before the final hot spot run, and less than ninety percent of all bins are statistically significant hot spots.
Intensifying Hot SpotA location that has been a statistically significant hot spot for ninety percent of the time-step intervals, including the final time step. In addition, the intensity of clustering of high counts in each time step is increasing overall, which is statistically significant.
Persistent Hot SpotA location that has been a statistically significant hot spot for ninety percent of the time-step intervals with no discernible trend indicating an increase or decrease in the intensity of clustering over time.
Diminishing Hot SpotA location that has been a statistically significant hot spot for ninety percent of the time-step intervals, including the final time step. In addition, the intensity of clustering in each time step is decreasing overall, and that decrease is statistically significant.
Sporadic Hot SpotA location that is an on-again, off-again hot spot. Less than ninety percent of the time-step intervals have been statistically significant hot spots, and none have been statistically significant cold spots.
Oscillating Hot SpotA statistically significant hot spot for the final time-step interval with a history of also being a significant cold spot during a prior time step. Less than ninety percent of the time-step intervals have been statistically significant hot spots.
Historical Hot SpotThe most recent period is not hot, but at least ninety percent of the time-step intervals have been statistically significant hot spots.
New Cold SpotA location that is a statistically significant cold spot for the final time step and has never been a statistically significant cold spot before.
Consecutive Cold SpotA location with a single uninterrupted run of statistically significant cold spot bins in the final time-step intervals. The location has never been a statistically significant cold spot before the final cold spot run, and less than ninety percent of all bins are statistically significant cold spots.
Intensifying Cold SpotA location that has been a statistically significant cold spot for ninety percent of the time-step intervals, including the final time step. In addition, the intensity of clustering of low counts in each time step is increasing overall, which is statistically significant.
Persistent Cold SpotA location that has been a statistically significant cold spot for ninety percent of the time-step intervals with no discernible trend, indicating an increase or decrease in the intensity of clustering of counts over time.
Diminishing Cold SpotA location that has been a statistically significant cold spot for ninety percent of the time-step intervals, including the final time step. In addition, the intensity of clustering of low counts in each time step is decreasing overall, and that decrease is statistically significant.
Sporadic Cold SpotA location that is an on-again, off-again cold spot. Less than ninety percent of the time-step intervals have been statistically significant cold spots, and none have been statistically significant hot spots.
Oscillating Cold SpotA statistically significant cold spot for the final time-step interval with a history of being a statistically significant hot spot during a prior time step. Less than ninety percent of the time-step intervals have been statistically significant cold spots.
Historical Cold SpotThe most recent period is not cold, but at least ninety percent of the time-step intervals have been statistically significant cold spots.
Table 4. Spatial distribution of the significant level of change in the UHII of Sari City by Mann–Kendall method.
The Significance LevelTrend_BINTrend_ZTrend_PArea (%)
Down Trend—99% Confidence−3−3.1690.00227.14
Down Trend—95% Confidence−2−2.2180.0278.81
Down Trend—90% Confidence−1−1.9020.0574.39
No Significant Trend0−1.5850.11339.03
Up trend—90% Confidence11.8760.0612.87
Up trend—95% Confidence22.3770.0175.77
Up trend—99% Confidence32.8010.00511.99
Table 5. Spatial distribution of the significant level of change in the NDVI of Sari City by Mann–Kendall method.
The Significance LevelTrend_BINTrend_ZTrend_PArea (%)
Down Trend—99% Confidence−3−3.5870.00212.06
Down Trend—95% Confidence−2−2.2700.0253.60
Down Trend—90% Confidence−1−1.8240.0692.49
No Significant Trend00.2060.44133.28
Up trend—90% Confidence11.8290.0695.58
Up trend—95% Confidence22.2800.02411.84
Up trend—99% Confidence33.3470.00231.15
Table 6. The area related to UHII anomalies of Sari City according to each of the EHSA patterns.
RowPatternArea (%)
1New Hot Spot0.17
2Consecutive Hot Spot0.43
3Intensifying Hot Spot3.31
4Persistent Hot Spot5.67
5Diminishing Hot Spot8.73
6Sporadic Hot Spot4.32
7Oscillating Hot Spot8.54
8Historical Hot Spot0.43
9Consecutive Cold Spot0.02
10Intensifying Cold Spot7.29
11Persistent Cold Spot11.6
12Diminishing Cold Spot5.86
13Sporadic Cold Spot3.02
14Oscillating Cold Spot21.18
15Historical Cold Spot0.29
16No Pattern Detected19.13
Disclaimer/Publisher’s Note: The statements, opinions and data contained in all publications are solely those of the individual author(s) and contributor(s) and not of MDPI and/or the editor(s). MDPI and/or the editor(s) disclaim responsibility for any injury to people or property resulting from any ideas, methods, instructions or products referred to in the content.

