Article

Simulation of Storm Surge Heights Based on Reconstructed Historical Typhoon Best Tracks Using Expanded Wind Field Information

Department of Coastal Construction Engineering, Kunsan National University, Kunsan 54150, Jeollabuk-do, Republic of Korea
Atmosphere 2023, 14(9), 1461; https://doi.org/10.3390/atmos14091461
Submission received: 16 July 2023 / Revised: 8 September 2023 / Accepted: 19 September 2023 / Published: 20 September 2023
(This article belongs to the Special Issue Sea-Level Rise and Associated Potential Storm Surge Vulnerability)

Abstract

:
A numerical model integrating tides, waves, and surges can accurately evaluate the surge height (SH) risks of tropical cyclones. Furthermore, incorporating the external forces exerted by the storm’s wind field can help to accurately reproduce the SH. However, the lack of long-term typhoon best track (BT) data degrades the SH evaluations of past events. Moreover, archived BT data (BTD) for older typhoons contain less information than recent typhoon BTD. Thus, herein, the wind field structure, specifically its relationship with the central air pressure, maximum wind speed, and wind radius, are augmented. Wind formulae are formulated with empirically adjusted radii and the maximum gradient wind speed is correlated with the central pressure. Furthermore, the process is expanded to four quadrants through regression analyses using historical asymmetric typhoon advisory data. The final old typhoon BTs are converted to a pseudo automated tropical cyclone forecasting format for consistency. Validation tests of the SH employing recent BT and reconstructed BT (rBT) indicate the importance of the nonlinear interactions of tides, waves, and surges for the macrotidal west and microtidal south coasts of Korea. The expanded wind fields—rBT—based on the historical old BT successfully assess the return periods of the SH. The proposed process effectively increases typhoon population data by incorporating actual storm tracks.

1. Introduction

Coastal hazards induced by typhoons, such as strong winds, storm surge (SS), and wave-induced overtopping inundation, are continuously increasing. Recently, the accuracy of typhoon forecast information has improved, thus facilitating more precise predictions of typhoon-induced surges and wave-overtopped flooding. Numerical models typically combine tides and waves to simulate typhoon-induced SS and surface stress. These models accurately represent typhoon wind fields using the associated parameters. In addition, wind field information can also be obtained from meteorological models that directly consider air–sea interactions at the sea surface.
The mitigation of coastal disasters caused by typhoons necessitates both long- and short-term planning. Long-term plans are aimed at protecting coastal infrastructure from SS and wave-overtopped inundation by establishing safe crest levels of coastal infrastructures based on appropriate return periods for the SH estimation. Short-term plans involve immediate preemptive action during typhoon periods, such as implementing early warning systems (EWSs) for SS and wave-overtopped flooding.
This study is focused on a long-term plan scenario, wherein archived typhoon data are crucial for reformulating wind fields or estimating the SH. However, a previously recorded archived BT of typhoons is often insufficient compared with contemporary BTD owing to differences in the observation equipment and methods used for analyzing tropical cyclone (TC) wind structures. The BT is based on available information at the time and records the path of the typhoon, maximum wind speed, and air pressure. For hurricanes occurring in the US, the National Hurricane Center (NHC) has maintained BTD since the 1850s. Whereas for typhoons affecting Korea, Japan, and China in the Northwest Pacific, data have been recorded since the 1950s. More precise data, such as quadrant radii of 34, 50, and 64 kt wind speeds, have been recorded by the NHC and Joint Typhoon Warning Center (JTWC) since the 2000s.
In the past, typhoon parameters proposed by Holland [1] in the 1980 were used in simulations of hurricane or typhoon wind fields. These simulations have been extensively applied to numerical models for SS simulation, either in relatively simple wind field simulations such as Sea, Lake, and Overland Surge from Hurricanes (SLOSH) [2] or in models simulating complex phenomena such as Advanced Circulation (ADCIRC) [3]. Recently, researchers have begun simulating storm SHs from dynamically asymmetric or automated tropical cyclone forecasting (ATCF) format improved wind fields, by inputting detailed properties of the four quadrants. However, recent technological advancements have facilitated the automatic acquiring of detailed wind field information to predict the SS in near-real or real time. Moreover, additional scientific analysis of typhoon properties and SS inundation forecasts, such as presimulating wave overtopping, has resulted in the development of real-time forecasts of the SS and wave overtopping [4].
With the continuous advancement of technology, numerical models and the sophistication of wind field simulations have improved, in tandem with the evolution of cyclone observation equipment. However, a key component of this study was the reconstruction of the BT of past typhoons. The aim was to integrate historical wind field data, equivalent to recent wind information, into the numerical model, thus enabling the estimation of the maximum storm SH at a specific location and the frequency of the SH through extreme value analysis. Previous research [5] utilized a fully mathematical randomized typhoon track as a method; this study adopted an approach that overcame the limitations of previous methods. This approach recreates storms through the empirical expressions provided by various researchers, based on the characteristics of typhoons that have had significant impacts in the past. Consequently, this method is deemed to exhibit a higher degree of objectivity.
Bloemendaal et al. [6] reported two synthetic approaches for generating storm tracks: coupled statistical–dynamical models and statistical models. Historical records of TCs and SSs are often excessively limited to quantify risks, prompting Lin et al. [7] to generate 10,000 synthetic storms using a statistical size model. When paired with an appropriate hydrodynamic model, this facilitates the estimation of the SH and related coastal risks. Alternative methods have been considered when past typhoon BTD are insufficient for analyzing SS disasters in coastal regions. For instance, SS simulations were performed with over 170,000 synthetic typhoons generated using the Tropical Cyclone Risk Model (TCRM) [8], which passed through the Korean coast [5,9]. In previous research [10], it is suggested that the SH evaluations could be executed using deterministic and/or probabilistic methods. Deterministic modeling approaches can link historical records with the unique real-time features of a TC currently confronted by emergency managers, including forerunner surges appearing in primary surges [11]. However, probabilistic methods incorporate the impact of meteorological uncertainties on the SS results. Hence, both probabilistic and deterministic methods are beneficial in providing appropriate SS guidance for forecasters and emergency managers.
SS can be estimated using synthetic winds primarily via three approaches: (1) simulating changes in the SS as a hurricane or typhoon enters and passes the point of interest at various angles [7]; (2) shifting the path from the landfall point at certain intervals to identify changes in the SS at target points [12]; and (3) randomly generating hurricane and typhoon paths to simulate sea levels at the point of interest for the hazard risk analysis of coastal/land areas owing to storm winds [9]. When simulating a storm SH in such a manner, the first two cases involve performing an analysis by varying historical typhoon parameters, such as the speed of movement, changes in longitude and latitude, and alterations in the wind speed radius. The third case presents a situation that can occur in the future, assuming fully mathematical approaches. In all cases, the fluctuation of the SH at the point of interest can be studied by altering the typhoon path properties according to the best path that occurred in the past.
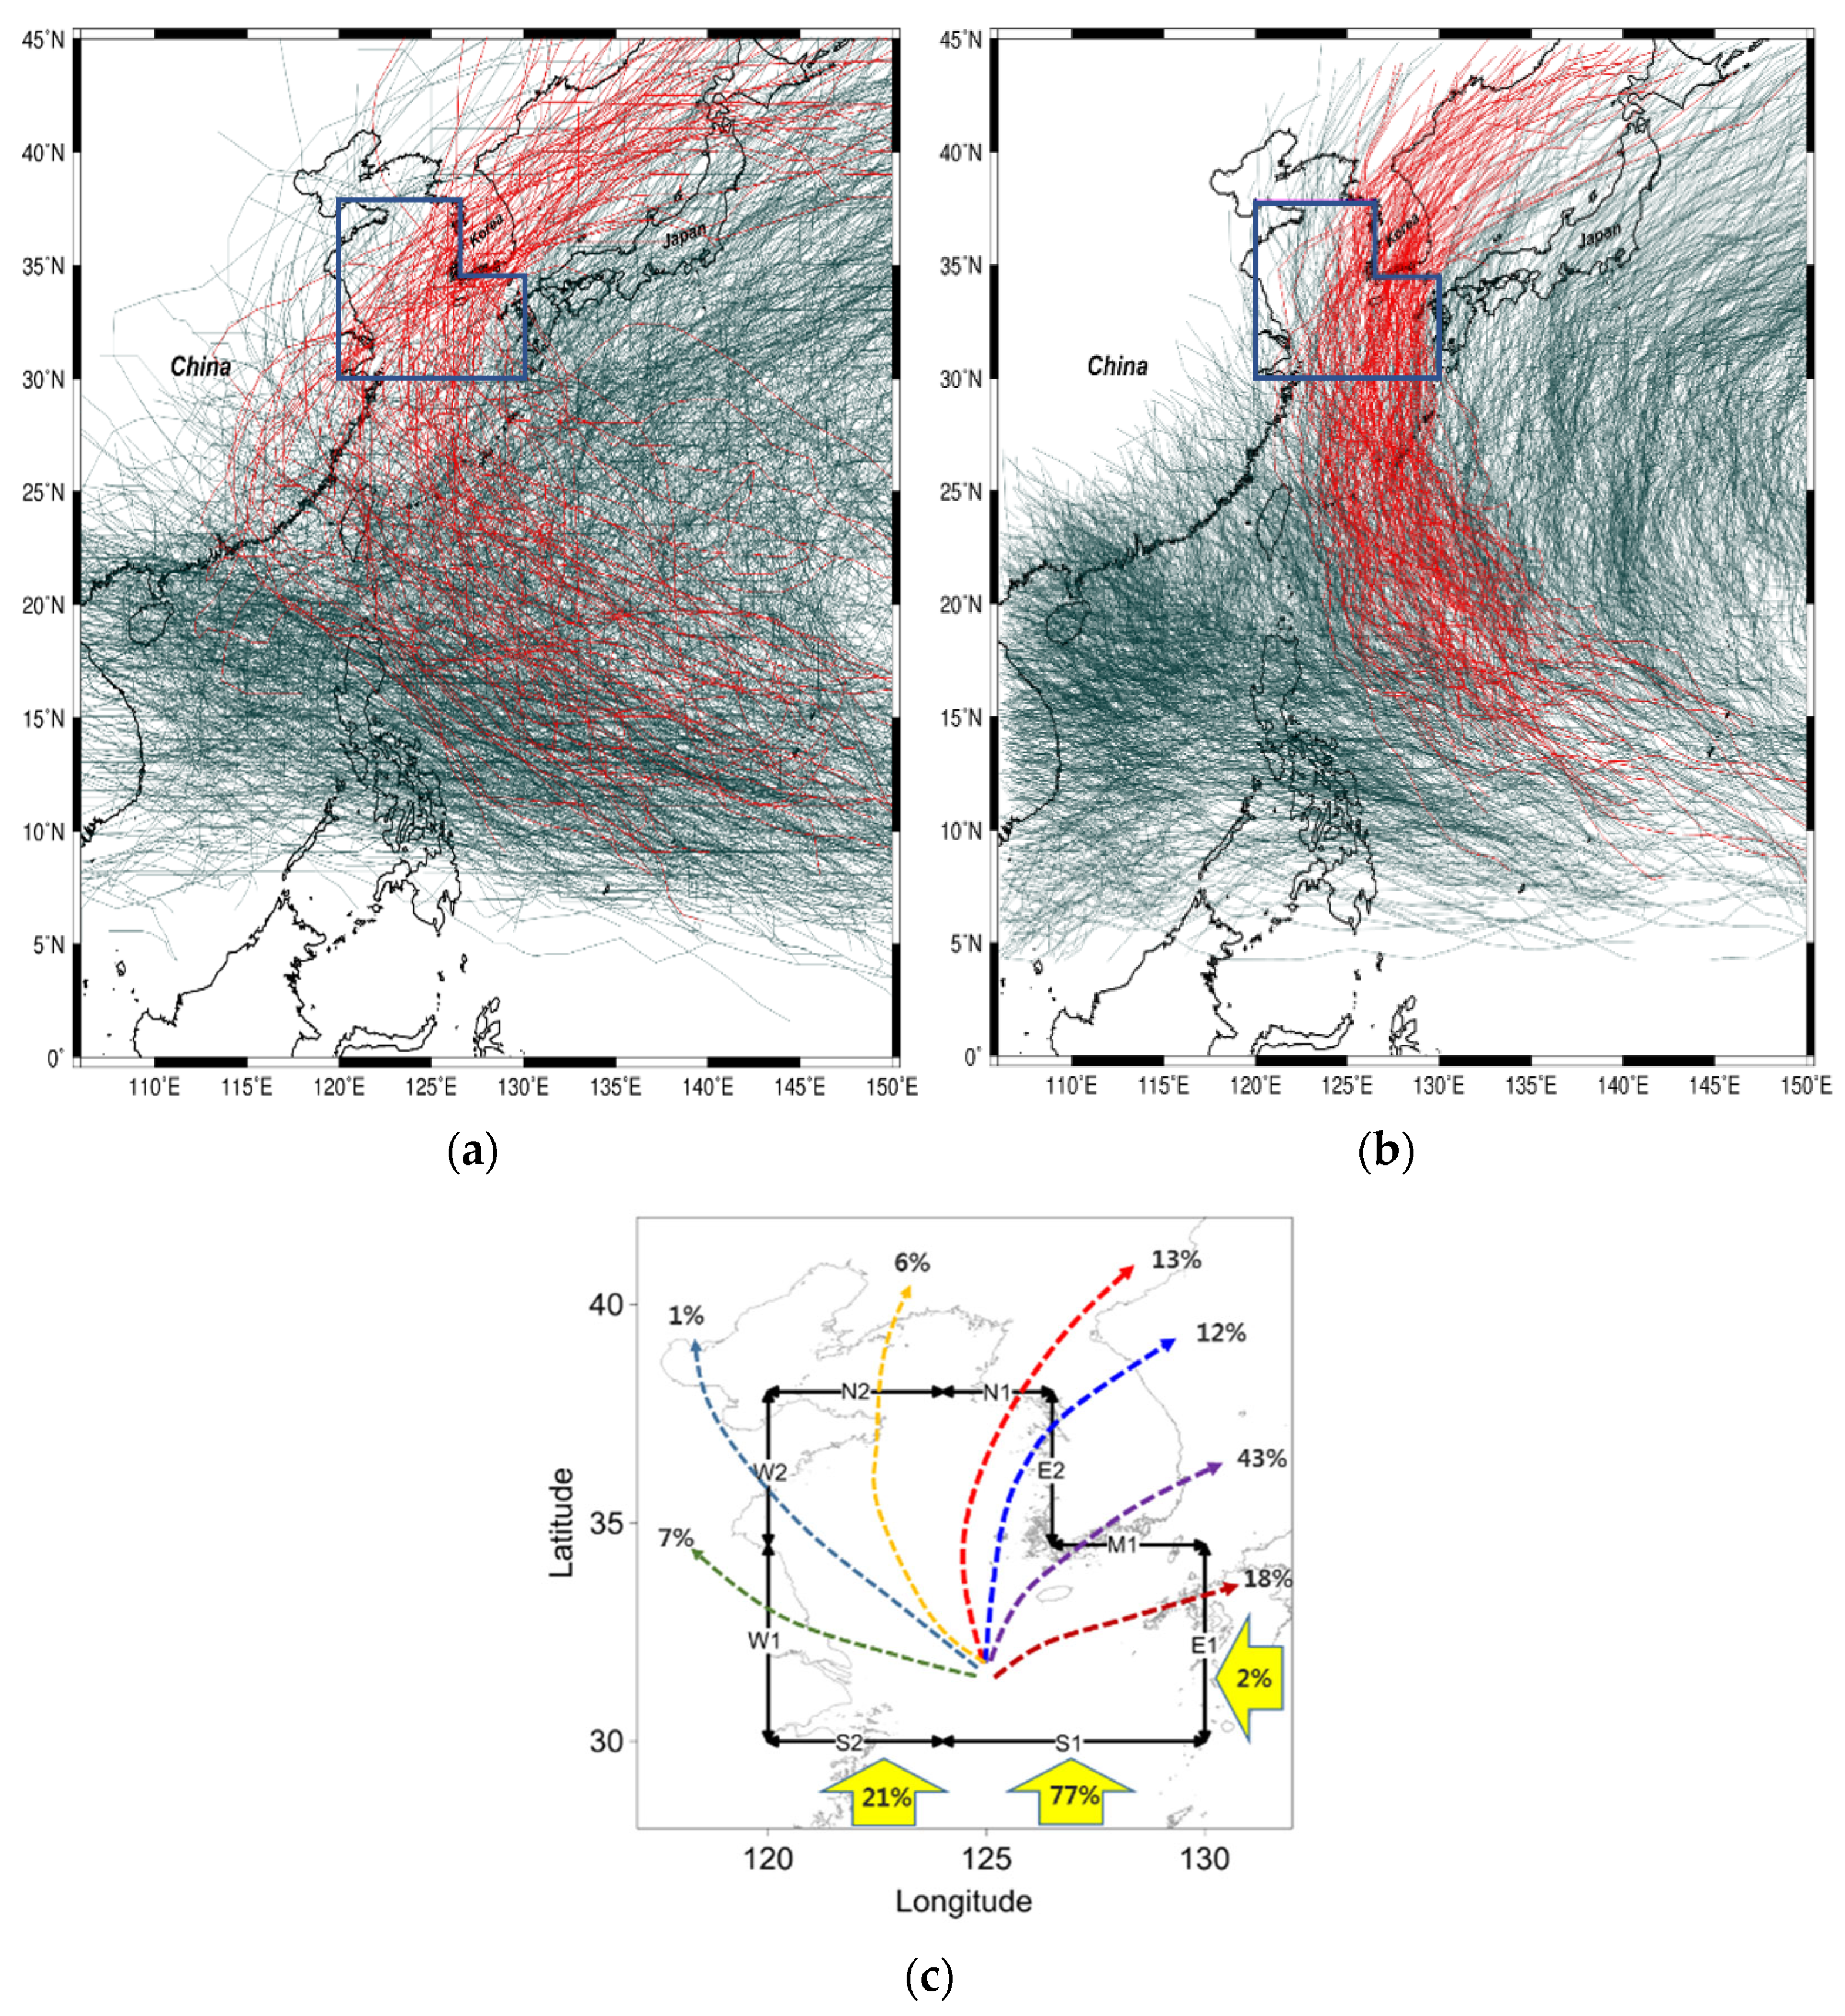
A previous study [5] on synthetic typhoon SHs using the TCRM demonstrated a reasonable possibility for the return period analysis of the SH using fully mathematical approaches. However, the speculative nature of this method resulted in frequent failure in the matching of the generated storm track and associated wind field parameters with the characteristics of observed historical typhoon tracks. This notable discrepancy in major track routes is highlighted in Figure 1. For instance, the figure reveals that certain actual typhoons struck Southeast China and then re-emerged. Moreover, many storms affecting the west coast of Korea displayed sharply curved track routes, whereas the artificially generated tracks exhibited milder transitions.
The TCRM track was primarily based on mathematical modeling, which had limitations in capturing real-world atmospheric dynamics, especially the effects of surrounding high- or low-pressure air mass. Furthermore, the influence of geostrophic effects was minimal in the synthetic tracks, leading to inaccuracies in simulating the SS and SH. In a subsequent study [8], significant modifications were implemented in the TCRM track to enhance its realism. These adjustments aimed to improve the accuracy of SS analyses, particularly along the west coast of Korea after the typhoon made landfall on the Chinese coast and subsequently moved into the Yellow Sea. Upon thoroughly examining historical typhoon paths, as shown in Figure 1c, it becomes evident that a substantial 98% of them enter through the Ryukyu Islands, with 25% affecting the west coast and 43% impacting the south coast. Furthermore, 86 out of 1572 historical typhoons, constituting 18.3%, follow trajectories that pass through N1, E2, and M1, thereby affecting Korea. Interestingly, in TCRM tracks, 122 out of 2576 synthetic typhoons, or 21.1%, similarly pass through these boundaries, impacting Korea in a roughly equivalent order of magnitude.
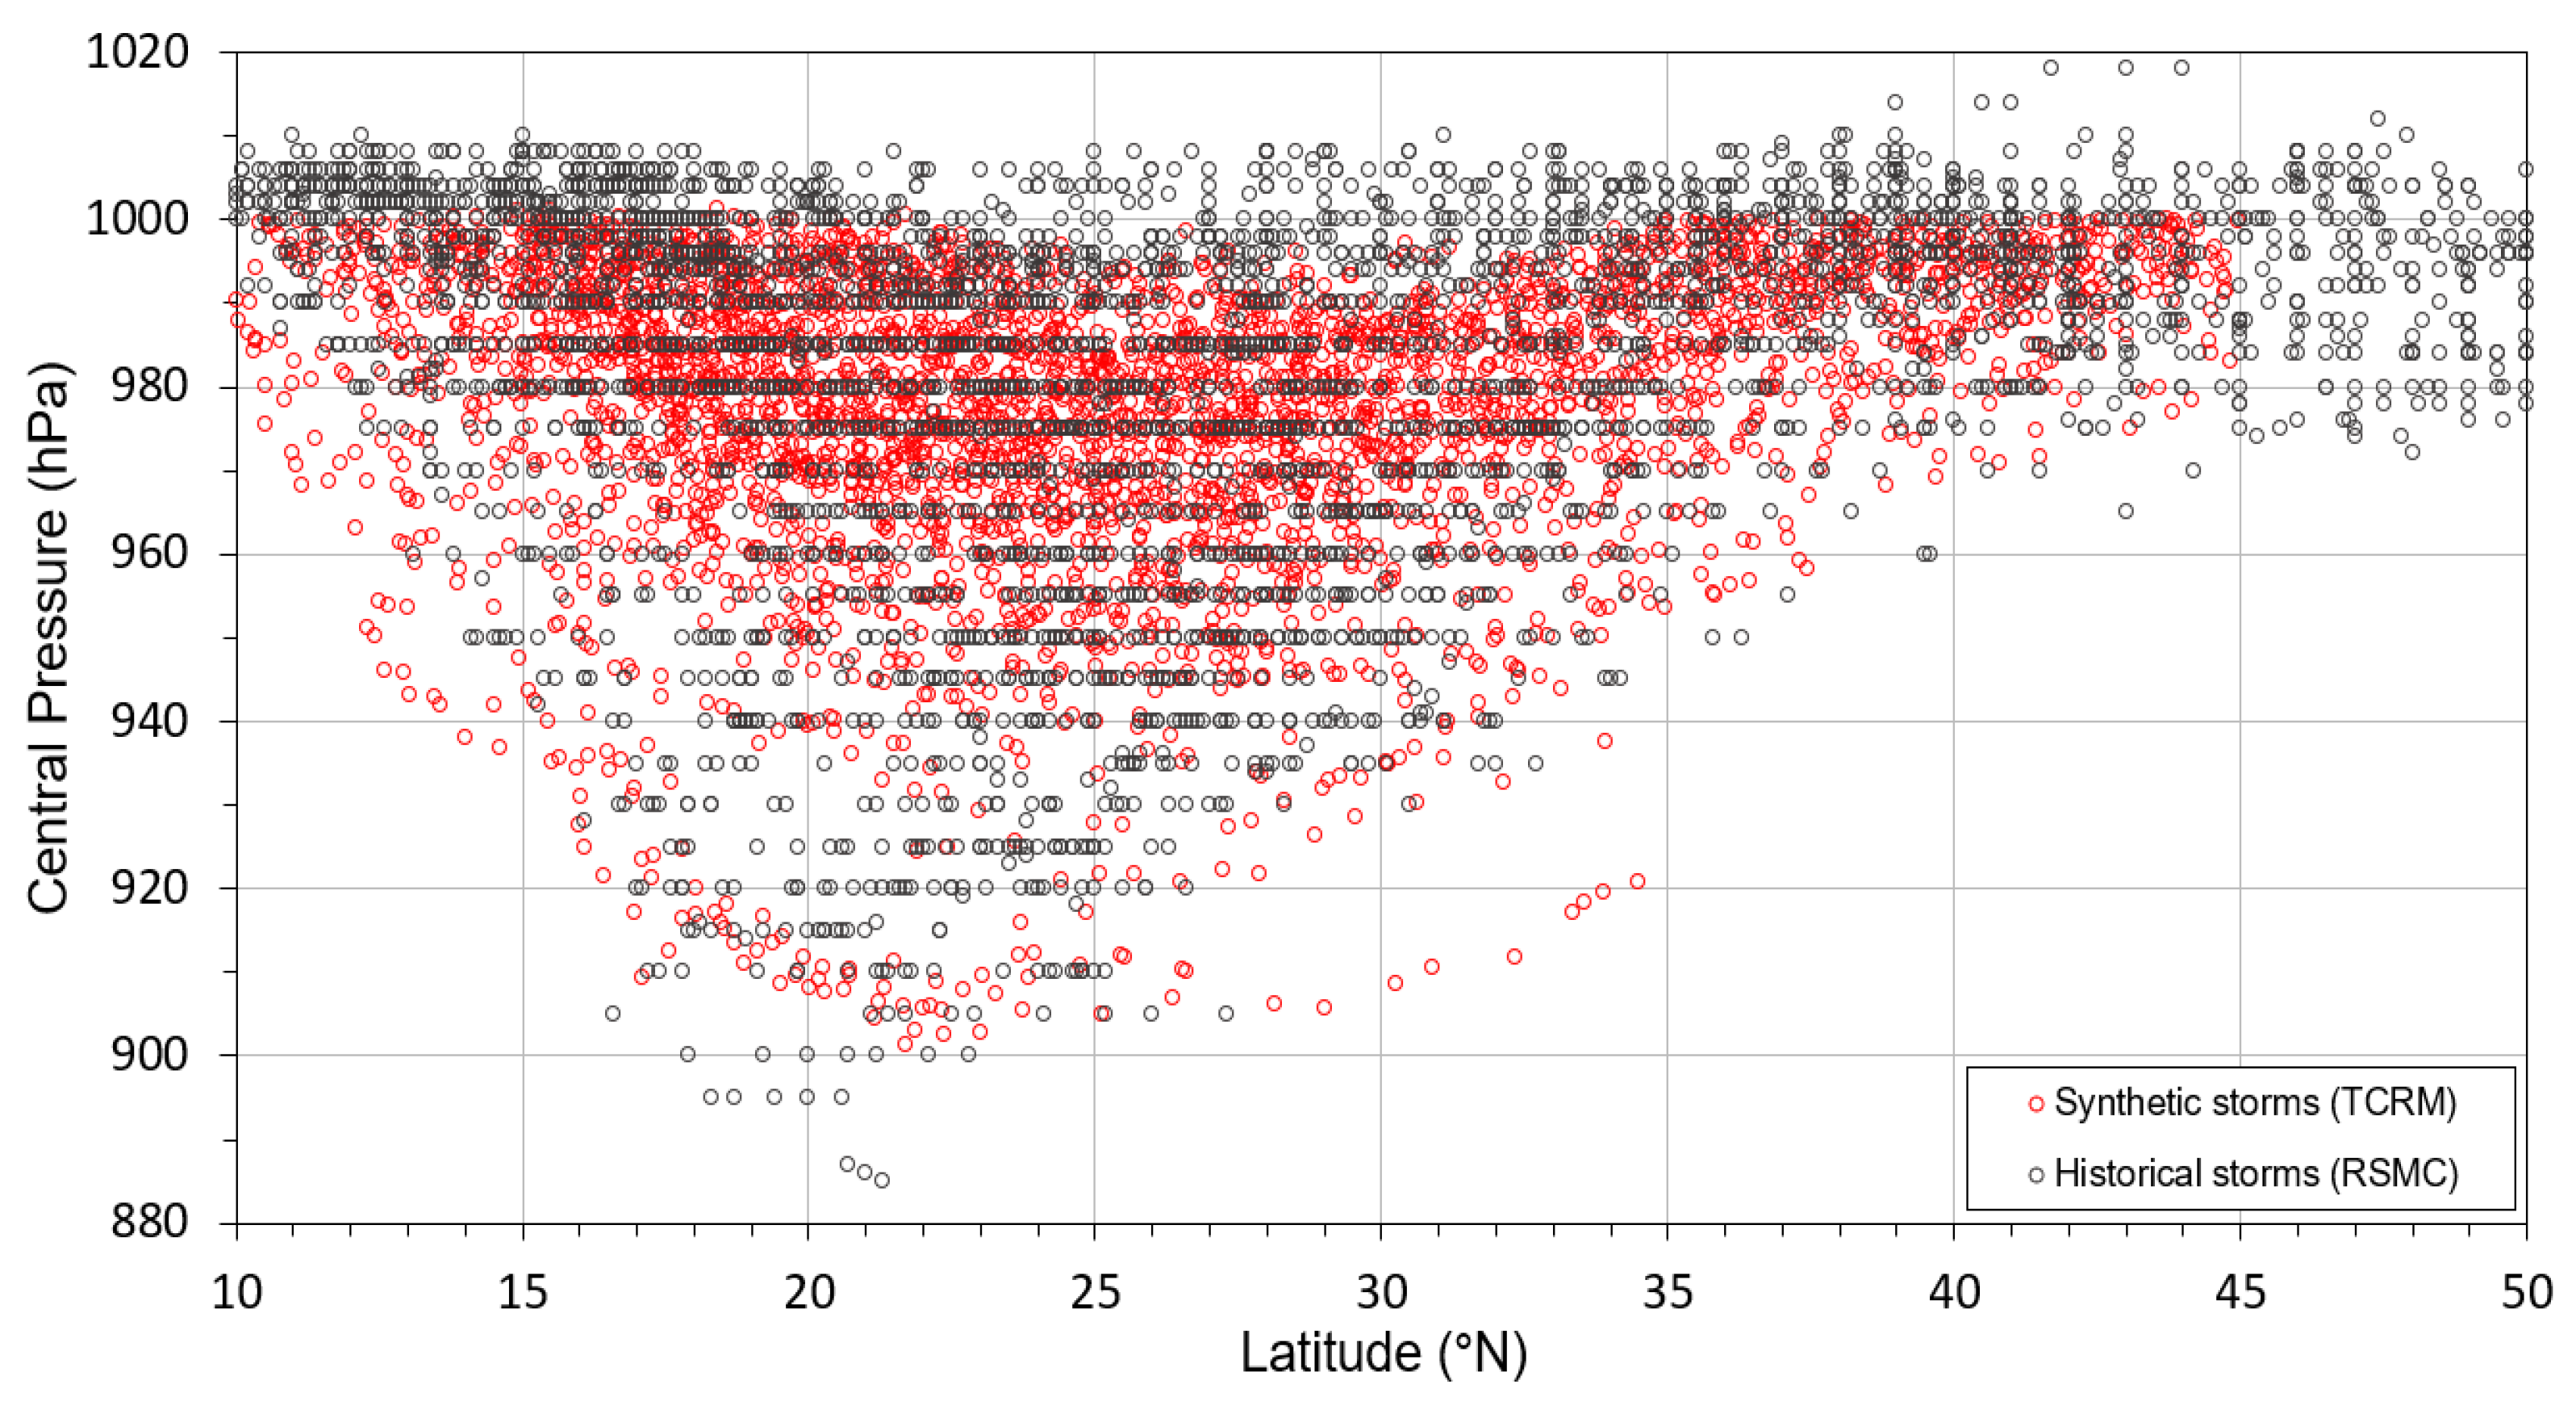
Furthermore, one of the major storm characteristics, the central pressure ( P c ) variation with respect to latitude, exhibited somewhat different characteristics, as depicted in Figure 2. Consequently, the validity of fully synthetic typhoon wind fields must be reevaluated or historically affected typhoon tracks and their characteristics must be utilized in the return period analyses of the SH. However, the primary limitation of using historical typhoons is the lack of recorded size for extreme value analysis. Moreover, older BTD lack sufficient wind information compared with recent BTD.
Simulating the SS response by altering the parameters of a historical typhoon fundamentally differs from examining the response of a completely randomly generated typhoon. The former includes the possibility that a past cyclone may have changed its behavior during its journey based on the surrounding weather conditions. If such a change occurred when it made landfall in the area of interest, the timing and magnitude of the storm SH would differ. In the previous study [10], extensive tests on the track properties of Typhoon Bolaven in 2012 have been conducted. This included variations in parameters such as the center position, movement path, moving speed, size of the wind radius, and V m a x , both by increasing and decreasing them by 20%. The results revealed that the timing and the peak values of the SH differ at the typhoon’s landfall site.
By contrast, a fully mathematical model assumes that a typhoon, which has not occurred in the past, could stochastically appear along a particular path. Therefore, this study aimed to examine the case of changing the properties based on historical typhoon records, akin to the methods 1 and 2 examined by previous researchers.
To enhance the reliability of the SS simulation, using the actual typhoon and its BTD information is recommended. Purely mathematical models that exclude past tracks showed several discrepant TC trajectories [13,14]. However, in the case of the old BTD, quadrant radii of R34 and R50, that is, 34 and 50 kt, respectively, are often not recorded. Consequently, consistently expressing these values using only recorded data such as P c is challenging. To overcome this challenge, this study proposed a combination of empirical and statistical methods to express the missing quadrant radii. This can improve the accuracy of SS simulations by expanding the old BTD through a reconstructing technique.
This study attempted to enhance the limited historical data on typhoon location, central pressure, and maximum wind speed from BTD by inferring quadrant wind speed radii similar to that available in recent BTD. Subsequently, these inferred parameters were empirically applied to estimate historical storm SHs. Inevitably, errors are involved when inferring properties that have not been experienced or observed in the past. The applicability of this type of expanded BT has been analyzed in previous studies [11] through a sensitivity analysis study. The study showed that increasing or decreasing the typhoon radius or parameter values minimally affects the SH. However, given that the alteration in the wind radius of 34 kt has a minimal significant impact on the SH, it is concluded that when the degree of error is relatively modest, the expansion and application of the existing historical BT using the proposed method are viable options.

2. Methods

2.1. Parametric Winds (Uncertainties/Sensitivity) in Storm Surge Simulation

The parametric model provides a simplified representation of cyclones and is frequently used for forecasting, risk assessment, and scenario analysis. It facilitates the quick and efficient simulation and analysis of numerous cyclones, offering valuable insights into their potential impact on coastal regions and other vulnerable areas. Evidently, the difference between the central pressure of a storm and the surrounding atmospheric pressure drives the SS. A lower central pressure results in a steeper pressure gradient, thus leading to stronger winds and a higher SS. Stronger winds, associated with a higher V m a x (representing the cyclone’s maximum sustained wind speed), generate larger waves and elevated SS. The wind speed is a critical factor in determining the magnitude of the SS as it dictates the amount of energy transferred from the atmosphere to the ocean surface, thus resulting in the water piling up along the coast. The maximum size of a storm, denoted by R m a x , can impact the extent of the coastal area affected by the SS. Larger storms, with a larger R m a x , can impact a more extensive region and cause a higher SS over a broader area. In addition to these factors, other storm characteristics, such as forward speed, storm track, and the angle at which the storm approaches the coast, can also influence the storm SH.
Willoughby et al. [15] developed a simple parametric representation of the primary hurricane vortex to improve the accuracy of hurricane intensity forecasting. This representation is based on a set of profile functions that capture the radial distribution of the wind speed within the hurricane. High-resolution numerical simulations were used to investigate the sensitivity of this representation to various storm parameters, including R m a x . Their findings indicated that the representation can effectively capture the observed variability in the radial wind profile. Moreover, they found that changes in R m a x significantly affected the shape of the radial wind profile. Irish et al. [16] studied the influence of the storm size on the storm SH using a numerical model. They conducted several sensitivity simulations to assess the impact on the peak surge caused by hurricane track variation. By analyzing the observed historical storm data, along with idealized numerical simulation data, they demonstrated that storm size plays a key role in hurricane surge generation in coastal areas, particularly in the case of intense storms on extremely shallow slopes.
Parametric wind models are widely utilized in SS simulations to estimate the potential impact of hurricanes or typhoons on coastal areas. This approach is broadly used in predicting the SS height because of the simplified mathematical representations of storm characteristics such as the central pressure, size, and forward speed. The National Weather Service extensively uses a simplified SS model referred to as SLOSH. The input parameters for the wind model include the storm track, radius of maximum winds, and the pressure difference between the central pressure of the storm and the ambient pressure. Resio and Westerink [17] highlighted the importance of accurate wind and pressure field representations and the various physical processes that affect storm SH simulation. Despite certain comprehensive comparisons of the prevailing empirical parameters used in defining the typhoon wind field, uncertainties still exist in the wind structure parameterization of TCs. Zhao et al. [18] compared observed data, including P c ,  R m a x , and latitude, with 16 empirical relationships, revealing significant uncertainties in the wind structure definition.
Although parametric models are widely utilized in SS analyses, they inevitably carry uncertainties owing to the complex interaction between atmospheric storm structures and sea surfaces. Consequently, several studies have focused on parameter sensitivity, which delved into the origins of uncertainties within typhoon parameter models. Those studies adopt an approach to identify the relatively significant parameters, directing their focus toward wind field inputs and, consequently, the evaluation of their impact on the SH. To evaluate the impact of variations in storm parameters on the storm SH, numerous sensitivity tests have been conducted. Rego and Li [19] explored the sensitivity of the storm SH to variations in the hurricane forward speed. They suggested that slower-moving storms generally yield a higher SS, as prolonged onshore winds have more time to push water toward the coast. Similarly, Lin et al. [20] performed sensitivity tests on storm parameters for New York City, particularly examining their impact on the storm SH; reportedly, the storm SH was found to be highly sensitive to alterations in the maximum wind speed, radius of maximum winds, and storm track angle. Notably, changes in R m a x were found to have a greater impact on the SH compared with changes in the maximum V m a x . Bunya et al. [21] investigated the correlation between the SS and the morphological parameters of coastal wetlands. Their research revealed that wetland morphology can significantly influence the storm SH. Consequently, the preservation of wetlands could be an effective strategy for reducing SS damage. Wang et al. [22] studied the response of the SH to changes in various typhoon parameters, including the typhoon’s track, size, intensity, and forward speed. The study concluded that all of these parameters significantly affected the storm SH. Extensive sensitivity tests were conducted for various parameters in modeling the SH [11]. It was found that wind fields that were 20% larger or smaller resulted in only a 1% error in the primary SH. Moreover, ±20% of the moving speed resulted in a −9% to +7% variation in the SH. It was also concluded that the SH is influenced by the storm characteristics and geomorphological properties and tidal environment, as demonstrated by Resio and Westerink [17].
Capturing an accurate SS with existing parametric storm models is a challenging task. However, parametric changes in existing historical BTD can project “what if” scenarios of future SHs based on past events. Thus, the expansion of BT information by modifying the wind size can aid in understanding the SH response. SS is a complex phenomenon influenced by various factors related to both the storm itself and the local environment. Thus, understanding the relationship between storm characteristics such as V m a x , R m a x or R 34 , and P c , and the storm SH is crucial for accurate SS predictions and effective coastal planning and risk management.

2.2. Data

Historically, the BTD of typhoons offered limited information, such as tracking the typhoon movement through timestamps every 6 h, the central position, and the central atmospheric pressure (Table 1). However, more recently, the JTWC has started to provide additional details such as the four-quadrant wind speed radii and V m a x , as presented in Table 2. As indicated in Table 1, the BTD from the Korea Meteorological Agency (KMA) include the appearance time of the typhoon’s eye, its location, V m a x , and P c . Conversely, as exemplified by Typhoon Bolaven in 2012 (Table 2), the JTWC’s BTD feature quadrant wind speed radii for the corresponding high wind radii of 34, 50, and 64 kt. Notably, the BTD information for P c , which is a major cyclone characteristic, do not match between the two agencies. According to the JTWC, the lowest pressure was 929 hPa at 00:00 UTC on 25 August 2012, whereas the KMA recorded a value of 910 hPa at 12:00 UTC on the same day. The disparity in the lowest central pressure values between the KMA and JTWC, which can be as much as 19 hPa, is primarily attributed to the lack of transparency in the methods employed by each organization for central pressure analysis and prediction. However, it is important to note that the location of the TC track featuring the lowest central pressure (24.3° N 130.7° E) is situated to the southeast of the Ryukyu Islands. This location falls within the timeframe of progression toward Korea (082512Z), occurring approximately 2–3 days before the observed SH along the coast (from SP station on 082718Z to IC station on 082812Z). Consequently, it is considered that the variance in the minimum central pressure magnitude between the two organizations is unlikely to have a significant impact on the actual SH.
This BTD information facilitates more accurate simulations of asymmetrical dynamic wind fields that closely mirror real-world conditions, resulting in more precise estimates of the SS [10]. Therefore, to accurately evaluate the SS, the BTD must be reliable and include four-quadrant information on the typhoon wind structure. If the necessary data are unavailable, research on the SS damage using parametric wind field simulations is limited. Although the JTWC provides four-quadrant information for typhoons post-2001 through its ATCF system, older BTD must be reconstructed into a pseudo format similar to that of the JTWC using ATCF. This can provide an alternative statistical–dynamical approach to simulate the SS.
This study examined typhoons that either made landfall in Korea or passed nearby, causing an SS. Among the historical typhoons, the BTD of 211 typhoons that impacted Korea from 1952 to 2020 were used in this study. These BTD were recorded by the National Typhoon Center (NTC) of the KMA. All the historical BTD, containing the essential information listed in Table 1, will be expanded to the format presented in Table 2.

2.3. Reconstructing BT

Various methods have been employed to simulate the SH using synthetically generated wind fields. Emanuel et al. [13] applied a deterministic, coupled numerical model to simulate the storm intensity, whereas a fully statistical approach based on an empirical formula for wind structure was used [5]. By contrast, semi-hybrid statistical–dynamical methods using synthesized storms were proposed [6]. However, despite these advances, representing wind parameters through a single relationship remains challenging, as demonstrated by Zhao et al. [18], who reviewed 16 empirical formulae.
This study applied a “cocktail” approach to calculate R34 and R50, combining previous empirical relationships [23,24]. This approach aimed to mitigate the uncertainties inherent in using a single storm formula.
Takagi and Wu [24] proposed a formula for R50 in the context of the NWP as R 50 = 1 / 0.35 ( 0.15 R m a x ) . Meanwhile, Quiring et al. [23] suggested a relationship for R34 with V m a x when studying the Gulf of Mexico and the Atlantic Ocean as R 34 = 47.19 + 0.51   V m a x . Both forms were employed in this study to generate the most reasonable rBT, while considering the empirical equations from existing old BTs in the NWP. Figure 3 shows the empirical relationships between V m a x and P c for historical typhoons [5]. Given that both linear and quadratic regression demonstrated similar levels of accuracy well within an acceptable range, the quadratic formula was employed in this study.
V m a x = 0.00225 P c 2 + 3.7018 P c 1436.9
The final form of the synthesized rBT is presented in Table 3, where it is compared with the BT from the JTWC for Typhoon Bolaven in 2012. As mentioned earlier, the rBT is based on the KMA BT; hence, the differences in the P c yield variations in V m a x and R 34 when compared with those recorded in the JTWC’s BT. Nonetheless, the rBT, with its expanded wind information, can be applied and compared with recent BT data or results obtained from mesoscale model (MSM) simulations.
Each meteorological agency releases cyclone information in its own manner. Thus, the resulting synthetic rBTs may not exhibit exactly the same characteristics. Particularly, significant discrepancies in the P c information, which directly affect the V m a x and wind radii values, can result in somewhat different values in the expanded wind field structure. Notably, the V m a x values in the rBT, ranging from 117 to 138 kt, as evaluated from the empirical formula, appear a bit higher but fall nearly within the same range as the JTWC V m a x values of 105–125 kt, as shown in Table 3. Meanwhile, the V m a x values according to the recorded BT of the KMA for Typhoon Bolaven exhibit weaker values, that is, 80–100 kt, compared with those of the rBT or the JTWC BT. However, it is worth noting that the reconstructed R34 can sometimes appear to be significantly smaller than the JTWC’s BT at specific time points, such as at 2012082600Z to 082612Z when the typhoon’s center crossed the Ryukyu Islands. Despite these variations, it is important to emphasize that in most cases, SS events, including forerunner surges and SH occurrences along the Korean coast associated with typhoons originating from this region as demonstrated in a previous study [10], typically take one day or more to develop prior to landfall. Therefore, when considering a series of typhoon tracks for simulating the SS based on the rBT data, the relatively smaller predicted R 34 values may not significantly impact the SH predictions, especially when the focus is on return period analyses.
Finally, parametric wind models utilizing the rBT can be easily implemented in a tide–wave coupled model, such as the coupled ADCIRC and Simulating Waves Nearshore (SWAN) models [26], either by using the symmetric form of the Holland model or an asymmetric model. The typhoon wind field can be represented by several specific parameters, with the shape parameter B significantly impacting the SH calculation. Following Holland [1], this parameter has been characterized, and subsequent studies, including those by Willoughby et al. [15] and other researchers [27,28,29], have addressed its importance. The purpose of this study is not to investigate the sensitivity or importance of these parameters. Instead, the aim is to calculate the SH due to the rBT and determine the return period by providing symmetric or asymmetric wind field options to the ADCIRC+SWAN coupling model [26]. Therefore, a more in-depth examination of these parameters should be conducted separately in future studies to assess their significance.
The full set of simulation cases are depicted in Figure 4. Case-1 generates synthetic rBT wind fields for 1952–2020 using the rBT format. Case-2 employs the rBT from 1952–1980 and then transitions to the JTWC’s BT information until 2020. Case-3 uses the rBT from 1952–2002 and then applies the Japan Meteorological Agency’s mesoscale model (JMA-MSM). In Case-3, the SS wind field reproduction performance is compared using the JMA-MSM, which is a meteorological model. However, certain challenges such as unsuitable interpolation may arise when grids of uneven shapes and densities are combined. Although the MSM wind field is stored in the Network Common Data Form (NetCDF) format, it can be efficiently reflected using one of the wind field simulation options in ADCIRC v55.
When managing wind fields as parameters in the ADCIRC model, R34 is a minimum requirement to define the typhoon wind fields, although quadrant information and wind speeds at 34, 50, and 64 kt are available. This study was conducted to satisfy the rBT expansion requirements for R34. Quadrant wind fields were extracted based on the characteristics of existing typhoons. Consequently, the northeast and southeast quadrants were 5–15% larger than the concentric radius, whereas the southwest and northwest quadrants were 8–10% smaller. The appropriateness of the quadrant R34 asymmetric wind field representation through this assumption may be subject to debate. However, based on the sensitivity study [11] for forerunners and the primary SS, the impact of wind field changes on the primary SS calculation is minimal. Therefore, the application of the rBT to past BTD for the frequency analysis of the SS may be justified.

3. Results

In this study, 211 historical typhoons that directly impacted or passed the Korean Peninsula from 1952 to 2020 were used to evaluate the SS for target coastal areas such as major tidal recording stations or points of interest. Despite considering 211 tracks, over a thousand cases were required to perform comprehensive computation on the wind field conditions of the tide+wave+surge coupling. This was realized by taking one of the three cases mentioned previously and external tidal conditions, such as whether tides, were factored in. Therefore, an automated algorithm for the entire computation should be provided to maintain consistency in the analyses of the SS. Consequently, fort.15 input files were automatically generated by a Python script controlling the entire simulation. This included nodal factors during the typhoon period in the ADCIRC+SWAN coupling, fort.22 files that controlled the wind structures as symmetric or asymmetric, and JMA-MSM NetCDF files with the aid of a Python script. As a nodal factor of 19.6 years affects the amplitude and phase of the tidal constituents and can significantly affect the simulated SS, this factor was also automatically incorporated into the tide simulation. This allowed the simulations to better capture real-world behavior during typhoon events. In addition, an automated script was introduced to extract the peak SH at selected target points along the coast from the output files of fort.61 of ADCIRC+SWAN. Finally, these calculations were performed on a parallel computer to enhance efficiency, and the SS for the target points of interest was obtained.
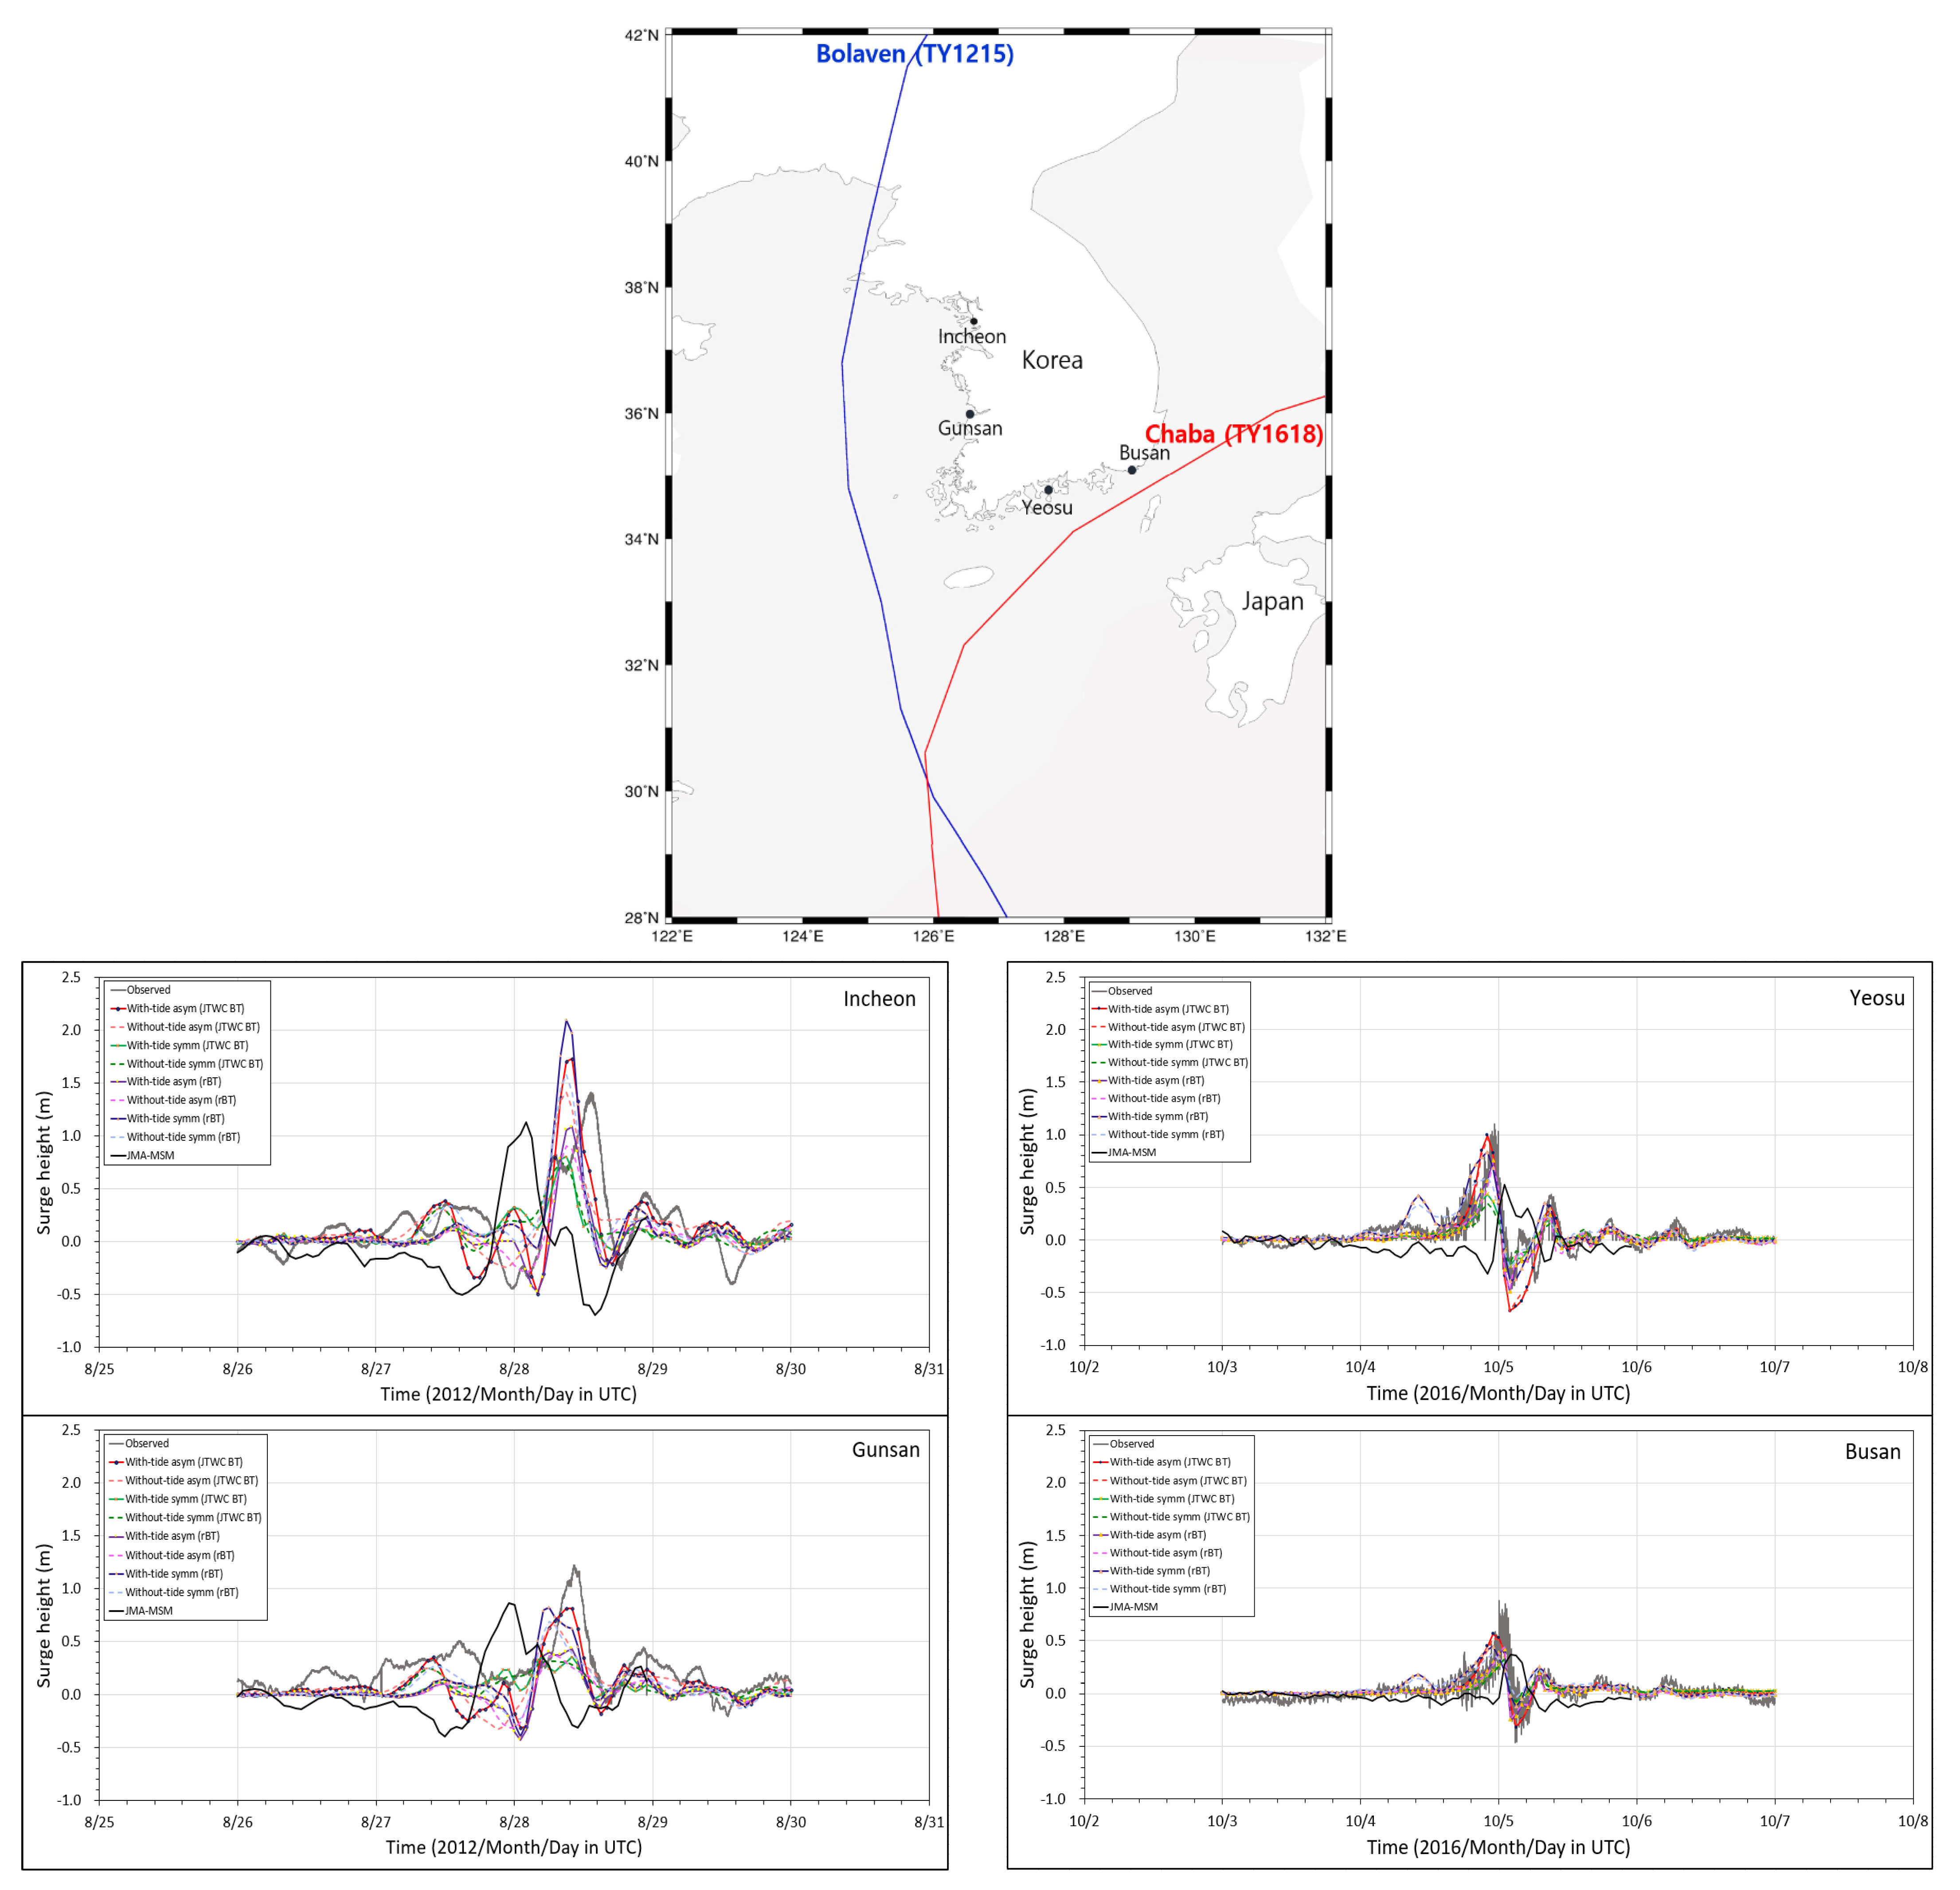
Before using the rBT for long-term coastal hazard analysis, typhoons Bolaven and Chaba were selected as case studies to assess the validity of the rBT application. Although these two cases may not provide the best performance validation, they have typically affected the western and southern coasts of Korea in recent years. Typhoon Bolaven significantly impacted the west coast in 2012, leading to the establishment of EWSs for SSs employing the ADCIRC+SWAN model, as documented in the previous research [10]. In addition, comprehensive analyses have been conducted for SH characteristics by varying the typhoon tracks and wind characteristics [11]. Particularly, for Typhoon Chaba, a comparative study has been conducted on SHs contrasting them with similar results generated by synthetic TCRM. Additionally, the WOT was analyzed for overland propagation characteristics during this investigation [4].
Simulations were conducted using the three cases described previously, and the results were compared with the observed SS along the western and southern coasts. This comparison aided in the evaluation of the accuracy of the simulated SS under different wind fields with tidal conditions and further provided insight into the effectiveness of the rBT approach.
Figure 5 shows that during the landfall of Bolaven, the most accurate SS simulation at Incheon was represented by the asymmetric wind from the JTWC BT. However, a symmetric-type wind field could overestimate the results. The reason might be the asymmetric nature of the wind field, that is, the NE and SE radii exert a more significant impact on the calculation of the SH for coastal stations situated on the right side during the typhoon movement along the west coast and landfall.
Moreover, the JMA-MSM wind field appeared to not accurately reproduce the SS. Consequently, incorporating tidal information into the simulations enhances the accuracy of the simulated SS at the Gunsan station, irrespective of the type of wind field used (JTWC BT or rBT). However, the JMA-MSM model also replicated similar results, albeit with a discrepancy in the timing of the peak SH. This could limit its usefulness in scenarios requiring the precise timing of the peak surge, such as in EWSs.
Table 4 presents the quantitative comparison results. The results indicated that the simulated SS results were closer to the observed peak surge when using the recent JTWC’s asymmetrical wind structure for typically selected typhoons Bolaven and Chaba. However, the simulated surge based on the asymmetrical wind structure of the rBT did not coincide with the real BT. The inconsistency between the rBT and the real BT may arise from the assumptions made about R34 and V m a x based on the minimum central pressure of the typhoon track. Meanwhile, the application of a symmetrical wind structure in the rBT produced a peak surge comparable to the observed values. Nevertheless, regardless of the wind structures, the peak surge incorporating the tidal interaction reproduced the surge well, except at the Incheon station in the Bolaven typhoon simulation. Furthermore, beyond the parametric BT wind structure, the JMA-MSM wind information poorly reproduced the SS both on the western and southern coasts.
For the validity tests of Typhoon Bolaven, the peak SH simulated at the Incheon station by the JTWC BT, considering an asymmetric wind field, was 1.73 and 1.41 m with and without tide coupling, respectively. However, the SH from the rBT yielded much lower values of 1.09 and 0.90 m, respectively, under the same conditions. When a symmetric wind structure was applied in the rBT, the SS values were 2.10 and 1.58 m, respectively. These simulated surges are comparable to the observed surge of 1.41 m. At the Gunsan station, located southward from Incheon, the simulated SH was lower at 0.82 m in the JTWC BT and 0.83 m in the rBT than the recorded peak surge of 1.23 m. In the case of Typhoon Chaba, the simulated SH using the asymmetric wind formula at the Yeosu station was 1.0 and 0.84 m for the JTWC and rBT, respectively, whereas the observed surge was 1.1 m. However, at the Busan station, the simulated SH values were 0.56 and 0.44 m, respectively, and the observed SS was 0.88 m.
Although these two typhoons may not be the best examples for performing the validity tests, the wind field generated by the JTWC BT provided peak SH results similar to observed values. Nonetheless, the SH by the rBT with symmetric representation was comparable with the recorded surge. In both the wind field approximations by the JTWC or rBT, incorporating the tidal interaction yielded a more accurate SH. However, the simulated and observed SS discrepancy does not entirely depend on the approximated storm wind structure. As suggested in earlier studies in the same domain, a better accuracy can be achieved when using a more finely discretized model [10]. A finer grid structure, which accurately resolves the complex geometry and topography, provides better results for both the tide and SS reproduction. However, it requires significantly more computational time. This study aimed to validate the feasibility of extracting more than a thousand SSs using an economical grid with a moderately resolved structure of 57k (approximately 57,000 vertices of an unstructured triangle grid) for the northwestern Pacific Sea. Although grids with 116k or 211k vertices provide better accuracy [10], they were not adopted for this study. Therefore, the validation results for typhoons Bolaven and Chaba in this study may not have been accurately compared. When a finer grid, with an enhanced resolution of morphological variations, is applied for other typhoon cases in future studies, a more accurate SH reproduction can be expected.
In the simulation of the SH for Typhoon Chaba, which impacted the southern coast, the parametric model was reproduced better than the meteorological wind field of the JMA-MSM at both the Yeosu and Busan stations, as depicted in Figure 5. Considering that the southern coast is less affected by external tides compared to the western coast, the SH exhibited similar results, regardless of the tide consideration. Expanded typhoon information using the rBT successfully reproduced the SH in Yeosu. In addition, the classical Holland type model, which assumes a symmetrical wind field shape, performed well in these simulations. When comparing the results at the Busan station, both the wind fields reproduced by the JTWC BT at the time of the typhoon and the results from this study, which calculated R 34 based on the rBT, were well reproduced. In the case of Typhoon Chaba, the JMA-MSM model exhibited a poor ability to reproduce the SH as a whole.
The validation tests demonstrated that synthetically generated typhoon wind structures based on symmetrical information from the rBT with the external tidal environment can reproduce the SH well. Although a relatively coarse grid resolution of 57k was applied in this study, compared to the 116k or 258k finer resolutions tested in [10], this choice was made to maintain the computational efficiency for simulating thousands of cases. Surprisingly, the simulation achieved satisfactory SH results even with the most straightforward parametric representation of a symmetric wind field. Nonetheless, it is crucial to emphasize that while a finer grid system with a realistically representative wind field can provide more accurate SH predictions, these validation test results should not be taken as a general trend but rather warrant further investigation. Therefore, the expanded old BTD can be effectively used in SS simulations. Furthermore, tide+wave+surge combinations should be considered to achieve a reasonable SH, regardless of the magnitude of tidal variation and the parametric wind structure. Additionally, along the west and south coasts of Korea, where macro- to microtidal environments dominate, in simulations of an SS, the asymmetrical wind information from the JTWC and symmetrical wind structures for the rBT may be alternately applied.
In conclusion, the parametric wind model expanded by the rBT combined with the SS simulations can effectively reproduce the actual storm SH. The asymmetric wind fields that consider external tides provide better results than the symmetric wind field. Furthermore, including the tidal effects resulted in better simulation results for the macrotidal environmental western coast. However, the results of the JMA-MSM model exhibited a poor ability to produce the actual SH as a whole. Thus, this study shows that the coupled model—tides, waves, and surge simulations—which was approximated by the wind parameter model that expanded the old BTD by the rBT can be used as an effective alternative for estimating the return periods of SHs in typhoon-prone areas.

4. Discussion

To evaluate long-term coastal vulnerability owing to the SS-induced inundation, the historical cyclone wind structure should be considered in the return period analyses for future scenarios. Return periods of SHs based on extreme value analysis (EVA) typically utilize recorded or simulated SH data, incorporating the storm wind structure into the tide and surge-coupled hydrodynamic numerical models. Both approaches require sufficient data to be viable in EVA. However, in case of inadequate total populations of recorded SH data or historical cyclones, another approach involves augmenting the amount of SH data based on simulated surges via synthetically generated wind fields.
As reviewed in the introductory part, the parametric wind models provide a straightforward mathematical relationship among the maximum wind speed, central pressure, and radial distance from the storm center. Subsequently, the application of the parametric model has been widely applied. Among the several researchers adopting the parametric model, Resio and Westerink [17] provided a comprehensive overview of the physics involved in SS simulations, including the role of parametric models. They emphasized the necessity for accurate wind and pressure field representations and the importance of considering various physical processes such as wave setup, coastal inundation, and the effect of coastal geometry. In addition, they also addressed the importance of the depth and nonlinear interactions between waves and tides. As tested and revealed in this study, the interactions between storm waves and tides must be considered to accurately simulate the SS regardless of the magnitudes of tidal amplification even when using the simple parametric wind model. Consequently, a holistic modeling approach that includes both wind field information as parameters from the BTD or expansion through empirical formulas such as the rBT and considerations of environmental tidal interactions is necessary for accurately reproducing the SS.
Generating a reasonable rBT that is applicable to an SH simulation is challenging. This is attributed to the prevailing uncertainties in storm wind forcing and the resulting SS. However, as demonstrated in the previous study [10], the parameters formulating the wind structure do not directly impact the calculated magnitude of the SH. Hence, any simply represented parametric wind structure can be used in SH simulations, provided the other physical characteristics are well resolved in a numerical SS model.
In this study, when comparing the rBT generated based on a historical BT from the KMA wind structure to the BT from the JTWC, insignificant deviations were observed in the location of the typhoon eye and maximum sustained wind speeds. Conversely, owing to different analytical records, the P c values yielded somewhat different expanded information for the R 34 . Thus, the simulated SH based on the rBT was calculated differently compared to the SH based on the actual BT. Nonetheless, the SH is a result of combining various meteorological factors such as the storm intensity, forward-moving speed, maximum wind radii, etc., as well as numerical surge model characteristics. Therefore, asserting whether expanded rBT information may not be applicable in SH estimation is challenging. However, as the final values of the rBT fall within the sensitivity test range highlighted [11], the rBT could be satisfactorily applicable in SH simulations, particularly in cases not focusing on real-time peak SH forecasting.
Although the peak storm SH calculated by the BT from the JTWC and rBT do not exactly match owing to issues related to the grid resolution and factors other than storm wind field representation, the magnitude of the peak SH by the expanded rBT can be considered to be compared to the real BT application tests (as shown in Figure 5 and Table 4). Furthermore, the nonlinear interaction with the tidal conditions yielded better SH results than the cases neglecting external tidal situations. This suggests that an appropriately represented empirical wind structure, even if it is expanded from limited information in old, recorded BT, can be successfully applied in the SH estimation for the return period analyses of coastal vulnerability.
The accuracy of empirical relations of wind fields can indeed vary depending on the region and dataset used. Zhao et al. [18] reported that an evaluation of the performance of 16 different empirical relations for R m a x in the East China Sea region exhibited variability in the accuracy of predictions. They suggested the need for further research to improve the accuracy of R m a x parameterization in numerical models. Song and Klotzbach [30] demonstrated the relationships between R m a x , V m a x , P c , and R50 for typhoons in the Northwest Pacific (NWP) region. Using V m a x to estimate R m a x , as proposed by Quiring et al. [23] for the entire Atlantic basin, offers a potentially useful approach, particularly in cases where the available historical BTD do not contain comprehensive information on the TC characteristics. For the NWP region, Takagi and Wu [24] proposed a different empirical relationship to estimate R m a x based on P c , specifically for situations where P c is less than 950 hPa. Despite these advancements, improving the accuracy of the SH reproduction necessitates a more precise description of the TC wind field effects. Kossin et al. [31] highlighted the relationships between critical wind radii, V m a x , and latitude to estimate the TC wind structure in the absence of precise data [25].
However, as reviewed and tested in this study, using empirical equations to describe TC structures highlights the challenge of creating a single equation to describe the complex wind field. Therefore, a proper wind field reproduction using an old or existing BT may be considered a reasonable approach in SH simulation.

5. Conclusions

This study aimed to assess the return periods of the storm SH by proposing an expanded wind structure based on historical old BT data. Although older BTs have limited information compared to more recent versions, synthetically generated rBTs can effectively provide a larger sample for the extreme analysis of the SH, based on actual storm tracks. This study confirmed that the model could effectively hindcast the actual SH by applying the rBT in a coupled model that considered the tide, wave, and surge effects. Therefore, the model can potentially be applied in disaster mitigation planning. This study emphasizes that including tidal information is crucial for the accurate simulation of the SH, particularly in areas with dominant tidal influences, such as the western coast of Korea. The research outcomes suggest that a parameter model incorporating the rBT could be a practical tool for predicting future coastal disasters regarding SH return periods, thus bolstering disaster response and mitigation efforts.
This study emphasized the complexities of accurately estimating the peak storm SH using numerical modeling. This estimation relies on the external storm wind parameterization and other factors such as tidal hydrodynamics, circulations, accurate representation of morphology, numerical approximations, and grid discretization. However, this study posits that the rBT formula, which is expanded based on past wind field data, can be satisfactorily applied as an empirical formula for estimating the SH for return period analyses. By incorporating wind fields representing R 34 in the rBT and integrating the tidal and wave effects, the hindcasting of SH simulations may present a significant improvement. A “cocktail” formula that combines different coefficients of empirical equations representing diverse basins could be applied to the SH simulation to estimate the frequency of the SH, thus assisting in the design of crest levels with significance. However, this method is not suited for real-time warnings owing to the short time frames involved in assessing and responding to coastal disaster risks. Despite this, the proposed method could be a viable option for estimating an extreme SS.
The estimation of the position, V m a x ,   a n d P c , constitutes critical factors in the forecasting of the SH. However, uncertainties persist when estimating these parameters from older BT data. In addition to B-parameter characteristics simulating typhoons, it is suggested that future research explores methods to enhance the accuracy of the rBT data, particularly for the central pressure, V m a x , or R34 characteristics derived from tropical cyclone records across various oceans. Therefore, a reasonable approach may involve utilizing a mixed expression derived from multiple empirical relationships, with the aim of minimizing uncertainties within the parametric wind model derived from BT data. This approach could remain applicable until further investigations refine the parameters or relationships governing storm structures in subsequent studies.

Funding

This research was a part of a project titled “Integrated System Development of Risk Assessment and Prediction for Coastal Activity Areas”, funded by the Korea Coast Guard, Korea (20200527). This study was also supported by the National Research Foundation of Korea (NRF) grant funded by the Korean Government (MOE) (No. NRF-2020R1I1A3071573).

Institutional Review Board Statement

Not applicable.

Informed Consent Statement

Not applicable.

Data Availability Statement

Not applicable.

Acknowledgments

The author thanks H.J. Kim of the Environmental Safety Technology Research Division in KAERI (Korea Atomic Energy Research Institute) for providing the data for Figure 1, Figure 2 and Figure 3. All figures are redrawn owing to the help of M.H. Lee of Sea-born Tex Inc. The author expresses sincere gratitude to the reviewers for their time and effort in reviewing the manuscript, as their valuable comments and suggestions have greatly improved its quality.

Conflicts of Interest

The authors declare no conflict of interest.

References

  1. Holland, G.J. An Analytic Model of the Wind and Pressure Profiles in Hurricanes. Mon. Weather Rev. 1980, 108, 1212–1218. [Google Scholar] [CrossRef]
  2. Jelesnianski, C.P. SLOSH: Sea, Lake, and Overland Surges from Hurricanes; U.S. Department of Commerce, National Oceanic and Atmospheric Administration, National Weather Service: Washington, DC, USA, 1992.
  3. Luettich, R.A.; Westerink, J.J.; Scheffner, N.W. ADCIRC: An Advanced Three-Dimensional Circulation Model for Shelves, Coasts, and Estuaries: Report 1 Theory and Methodology of ADCIRC-2DD1 and ADCIRC-3DL; U.S. Army Engineer Waterways Experiment Station: Vicksburg, MS, USA, 1992.
  4. Suh, S.W.; Kim, H.J. Simulation of Wave Overtopping and Inundation over a Dike Caused by Typhoon Chaba at Marine City, Busan, Korea. J. Coast. Res. 2018, 85, 711–715. [Google Scholar] [CrossRef]
  5. Kim, H.J.; Suh, S.W. Probabilistic Coastal Storm Surge Analyses Using Synthesized Tracks Based on Historical Typhoon Parameters. J. Coast. Res. 2016, 75, 1132–1136. [Google Scholar] [CrossRef]
  6. Bloemendaal, N.; Haigh, I.D.; de Moel, H.; Muis, S.; Haarsma, R.J.; Aerts, J.C.J.H. Generation of a Global Synthetic Tropical Cyclone Hazard Dataset Using STORM. Sci. Data 2020, 7, 40. [Google Scholar] [CrossRef]
  7. Lin, N.; Lane, P.; Emanuel, K.A.; Sullivan, R.M.; Donnelly, J.P. Heightened Hurricane Surge Risk in Northwest Florida Revealed from Climatological-Hydrodynamic Modeling and Paleorecord Reconstruction. MIT Web Domain 2014, 119, 8606–8623. [Google Scholar] [CrossRef]
  8. Arthur, W.C.; Summons, N.W.; Roberts, D.; Habili, N. Tropical Cyclone Risk Model; Geoscience Australia: Canberra, Australia, 2014. [Google Scholar]
  9. Kim, H.J.; Suh, S.W. Estimation of Frequency of Storm Surge Heights on the West and South Coasts of Korea Using Synthesized Typhoons. J. Korean Soc. Coast. Ocean. Eng. 2019, 31, 241–252. [Google Scholar] [CrossRef]
  10. Suh, S.W.; Lee, H.Y.; Kim, H.J.; Fleming, J.G. An Efficient Early Warning System for Typhoon Storm Surge Based on Time-Varying Advisories by Coupled ADCIRC and SWAN. Ocean Dyn. 2015, 65, 617–646. [Google Scholar] [CrossRef]
  11. Suh, S.W.; Lee, H.Y. Forerunner Storm Surge under Macro-Tidal Environmental Conditions in Shallow Coastal Zones of the Yellow Sea. Cont. Shelf Res. 2018, 169, 1–16. [Google Scholar] [CrossRef]
  12. Kim, S.W.; Melby, J.A.; Nadal-Caraballo, N.C.; Ratcliff, J. A Time-Dependent Surrogate Model for Storm Surge Prediction Based on an Artificial Neural Network Using High-Fidelity Synthetic Hurricane Modeling. Nat. Hazards 2015, 76, 565–585. [Google Scholar] [CrossRef]
  13. Emanuel, K.; Ravela, S.; Vivant, E.; Risi, C. A Statistical Deterministic Approach to Hurricane Risk Assessment. Bull. Amer. Meteor. Soc. 2006, 87, 299–314. [Google Scholar] [CrossRef]
  14. Hall, T.M.; Jewson, S. Statistical Modelling of North Atlantic Tropical Cyclone Tracks. Tellus A Dyn. Meteorol. Oceanogr. 2007, 59, 486. [Google Scholar] [CrossRef]
  15. Willoughby, H.E.; Darling, R.W.R.; Rahn, M.E. Parametric Representation of the Primary Hurricane Vortex. Part II: A New Family of Sectionally Continuous Profiles. Mon. Weather Rev. 2006, 134, 1102–1120. [Google Scholar] [CrossRef]
  16. Irish, J.L.; Resio, D.T.; Ratcliff, J.J. The Influence of Storm Size on Hurricane Surge. J. Phys. Oceanogr. 2008, 38, 2003–2013. [Google Scholar] [CrossRef]
  17. Resio, D.T.; Westerink, J.J. Modeling the Physics of Storm Surges. Phys. Today 2008, 61, 33–38. [Google Scholar] [CrossRef]
  18. Zhao, S.; Liu, Z.; Wei, X.; Li, B.; Bai, Y. Intercomparison of Empirical Formulations of Maximum Wind Radius in Parametric Tropical Storm Modeling over Zhoushan Archipelago. Sustainability 2021, 13, 11673. [Google Scholar] [CrossRef]
  19. Rego, J.L.; Li, C. On the Importance of the Forward Speed of Hurricanes in Storm Surge Forecasting: A Numerical Study. Geophys. Res. Lett. 2009, 36. [Google Scholar] [CrossRef]
  20. Lin, N.; Emanuel, K.A.; Smith, J.A.; Vanmarcke, E. Risk Assessment of Hurricane Storm Surge for New York City. J. Geophys. Res. 2010, 115, D18121. [Google Scholar] [CrossRef]
  21. Bunya, S.; Dietrich, J.C.; Westerink, J.J.; Ebersole, B.A.; Smith, J.M.; Atkinson, J.H.; Jensen, R.; Resio, D.T.; Luettich, R.A.; Dawson, C.; et al. A High-Resolution Coupled Riverine Flow, Tide, Wind, Wind Wave, and Storm Surge Model for Southern Louisiana and Mississippi. Part I: Model Development and Validation. Mon. Weather Rev. 2010, 138, 345–377. [Google Scholar] [CrossRef]
  22. Wang, J.; Mo, D.; Hou, Y.; Li, S.; Li, J.; Du, M.; Yin, B. The Impact of Typhoon Intensity on Wave Height and Storm Surge in the Northern East China Sea: A Comparative Case Study of Typhoon Muifa and Typhoon Lekima. J. Mar. Sci. Eng. 2022, 10, 192. [Google Scholar] [CrossRef]
  23. Quiring, S.; Schumacher, A.; Labosier, C.; Zhu, L. Variations in Mean Annual Tropical Cyclone Size in the Atlantic. J. Geophys. Res. Atmos. 2011, 116. [Google Scholar] [CrossRef]
  24. Takagi, H.; Wu, W. Maximum Wind Radius Estimated by the 50 Kt Radius: Improvement of Storm Surge Forecasting over the Western North Pacific. Nat. Hazards Earth Syst. Sci. 2016, 16, 705–717. [Google Scholar] [CrossRef]
  25. Vickery, P.J.; Wadhera, D. Statistical Models of Holland Pressure Profile Parameter and Radius to Maximum Winds of Hurricanes from Flight-Level Pressure and H*Wind Data. J. Appl. Meteorol. Climatol. 2008, 47, 2497–2517. [Google Scholar] [CrossRef]
  26. Dietrich, J.C.; Zijlema, M.; Westerink, J.J.; Holthuijsen, L.H.; Dawson, C.; Luettich, R.A.; Jensen, R.E.; Smith, J.M.; Stelling, G.S.; Stone, G.W. Modeling Hurricane Waves and Storm Surge Using Integrally-Coupled, Scalable Computations. Coast. Eng. 2011, 58, 45–65. [Google Scholar] [CrossRef]
  27. Dietrich, J.C.; Muhammad, A.; Curcic, M.; Fathi, A.; Dawson, C.N.; Chen, S.S.; Luettich, R.A. Sensitivity of Storm Surge Predictions to Atmospheric Forcing during Hurricane Isaac. J. Waterw. Port Coast. Ocean Eng. 2018, 144, 04017035. [Google Scholar] [CrossRef]
  28. Vijayan, L.; Huang, W.; Yin, K.; Ozguven, E.; Burns, S.; Ghorbanzadeh, M. Evaluation of Parametric Wind Models for More Accurate Modeling of Storm Surge: A Case Study of Hurricane Michael. Nat. Hazards 2021, 106, 2003–2024. [Google Scholar] [CrossRef]
  29. Kalourazi, M.Y.; Siadatmousavi, S.M.; Yeganeh-Bakhtiary, A.; Jose, F. Simulating Tropical Storms in the Gulf of Mexico Using Analytical Models. Oceanologia 2020, 62, 173–189. [Google Scholar] [CrossRef]
  30. Song, J.; Klotzbach, P. Wind Structure Discrepancies between Two Best-Track Data Sets for Western North Pacific Tropical Cyclones. Mon. Weather Rev. 2016, 144, 4533–4551. [Google Scholar] [CrossRef]
  31. Kossin, J.P.; Knaff, J.A.; Berger, H.I.; Herndon, D.C.; Cram, T.A.; Velden, C.S.; Murnane, R.J.; Hawkins, J.D. Estimating Hurricane Wind Structure in the Absence of Aircraft Reconnaissance. Weather Forecast. 2007, 22, 89–101. [Google Scholar] [CrossRef]
Figure 1. Typhoon tracks in the northwestern Pacific are represented by gray lines, whereas those affecting Korea are indicated in red. These tracks are derived from (a) historical data by Regional Specialized Meteorological Center (RSMC) from 1952 and (b) synthetic data by TCRM. The dark blue polygon shows the percentage of typhoon tracks as shown in (c) that entered the Yellow Sea and East China Sea and impacted the west and south coast of Korea. In the historical data (a), these tracks frequently resurface; however, in the synthetic data (b), such tracks are rare and when present, they exhibit a different direction of approach.
Atmosphere 14 01461 g001
Figure 2. Central pressure distribution with respect to latitude is illustrated using gray dots, representing historical typhoon tracks by RSMC. Conversely, the red dots depict synthetic tracks generated by TCRM.
Atmosphere 14 01461 g002
Figure 3. Empirical relationships between V m a x and P c for the historical typhoons [15,25].
Atmosphere 14 01461 g003
Figure 4. Simulation cases based on synthetically generated wind fields.
Atmosphere 14 01461 g004
Figure 5. Comparisons of SH for typhoons Bolaven in 2012 and Chaba in 2016 based on several wind structures using BT, rBT with or without tidal conditions at Incheon, Gunsan, Yeosu, and Busan tidal stations.
Atmosphere 14 01461 g005
Table 1. BT information of historical typhoons, Thelma (TY8705) and Bolaven (TY1215) from KMA.
Time
(UTC)
Lat.
(°N)
Long.
(°E)
Max.
Wind Speed (knot)
Central Pressure
(hPa)
Time
(UTC)
Lat.
(° N)
Long.
(° E)
Max.
Wind Speed (knot)
Central Pressure
(hPa)
198707120017.6127.3120920201208250023.5132.185930
198707120617.9126.8120925201208250624.2131.390920
198707121218.5126.6115935201208251224.3130.7100910
198707121819.2126.4105945201208251824.7130.295920
198707130019.9126.295950201208260025.3129.590925
198707130620.9126.090950201208260625.9129.090925
198707131222.1125.690940201208261226.6128.085930
198707131823.4125.390945201208261827.5127.480940
Table 2. BT information of historical Typhoon Bolaven (TY1215) by JTWC.

Time
(UTC)
Lat.
(°N)
Long.
(°E)
Max.
Wind Speed (knot)
Central Pressure
(hPa)
Wind Intensity
for the Radii
(knots)
Radii of the QuadrantsPressure of the Last Closed Isobar (hPa)Radius of the Last Closed Isobar (km)
1st quad.
(km)
2nd
quad.
(km)
3rd quad.
(km)
4th quad.
(km)
201208250023.5132.112592934190175160180995388.9
201208250023.5132.1125929501108575100995388.9
201208250023.5132.11259296440353540995388.9
201208250624.1131.312093334190190180180995388.9
201208250624.1131.3120933501001009090995388.9
201208250624.1131.31209336460605555995388.9
201208251224.4130.612093334190190180180995388.9
201208251224.4130.6120933501001009090995388.9
201208251224.4130.61209336460605555995388.9
201208251824.8130.112093334235215190205999388.9
201208251824.8130.112093350120110100105999388.9
201208251824.8130.11209336470656065999388.9
Table 3. BT comparison of Typhoon Bolaven (TY1215); JTWC and expanded 34 kt wind radii via rBT according to KMA.
Time
(UTC)
Lat.
(°N)
Long.
(°E)
Max.
Wind Speed (knot)
Central Pressure
(hPa)
Wind Intensity
for the Radii
(knots)
Radii of the QuadrantsPressure of the Last Closed Isobar (hPa)Radius of the Last Closed Isobar (km)
1st quad.
(km)
2nd
quad.
(km)
3rd quad.
(km)
4th quad.
(km)
JTWC BT201208250023.5132.112592934190175160280995388.9
201208250624.1131.312093334190190180180995388.9
201208251224.4130.612093334190190180180995388.9
201208260025.3129.5115937342302151852001001444.5
201208260625.9128.9110941342302151852001001444.5
201208261226.6128.010594434215215185185999444.5
rBT201208250023.5132.1117930342072071871871005·
201208250624.2131.3128920342192191981981005·
201208251224.3130.7138910342282282072071005·
201208260025.3129.5123925341151151041041005·
201208260625.9129.0123925341151151041041005·
201208261226.6128.0117930341121121011011005·
Table 4. Peak SH (in meter) comparison for typhoons Bolaven and Chaba based on the JTWC BT and rBT for considering symmetrical or asymmetrical wind structures at selected tidal record stations as shown in Figure 5 with (w-tide) or without (wo-tide) tidal interaction.
Bolaven (TY1215)
stationJTWC BTrBTJMA-MSMObserved
Peak SH
w-tide asymwo-tide asymw-tide symmwo-tide symmw-tide asymwo-tide asymw-tide symmwo-tide symm
Incheon1.731.410.800.751.090.902.101.581.131.41
Gunsan0.820.660.360.320.440.370.830.690.861.23
Chaba (TY1618)
stationJTWC BTrBTJMA-MSMObserved
Peak SH
w-tide asymwo-tide asymw-tide symmwo-tide symmw-tide asymwo-tide asymw-tide symmwo-tide symm
Yeosu1.000.970.430.350.760.740.840.600.521.10
Busan0.560.520.330.330.420.430.440.370.360.88
Disclaimer/Publisher’s Note: The statements, opinions and data contained in all publications are solely those of the individual author(s) and contributor(s) and not of MDPI and/or the editor(s). MDPI and/or the editor(s) disclaim responsibility for any injury to people or property resulting from any ideas, methods, instructions or products referred to in the content.

