
A Case Study of Drought during Summer 2022: A Large-Scale Analyzed Comparison of Dry and Moist Summers in the Midwest USA

 , , and
Abstract
:1. Introduction
2. Materials and Methods
2.1. Data
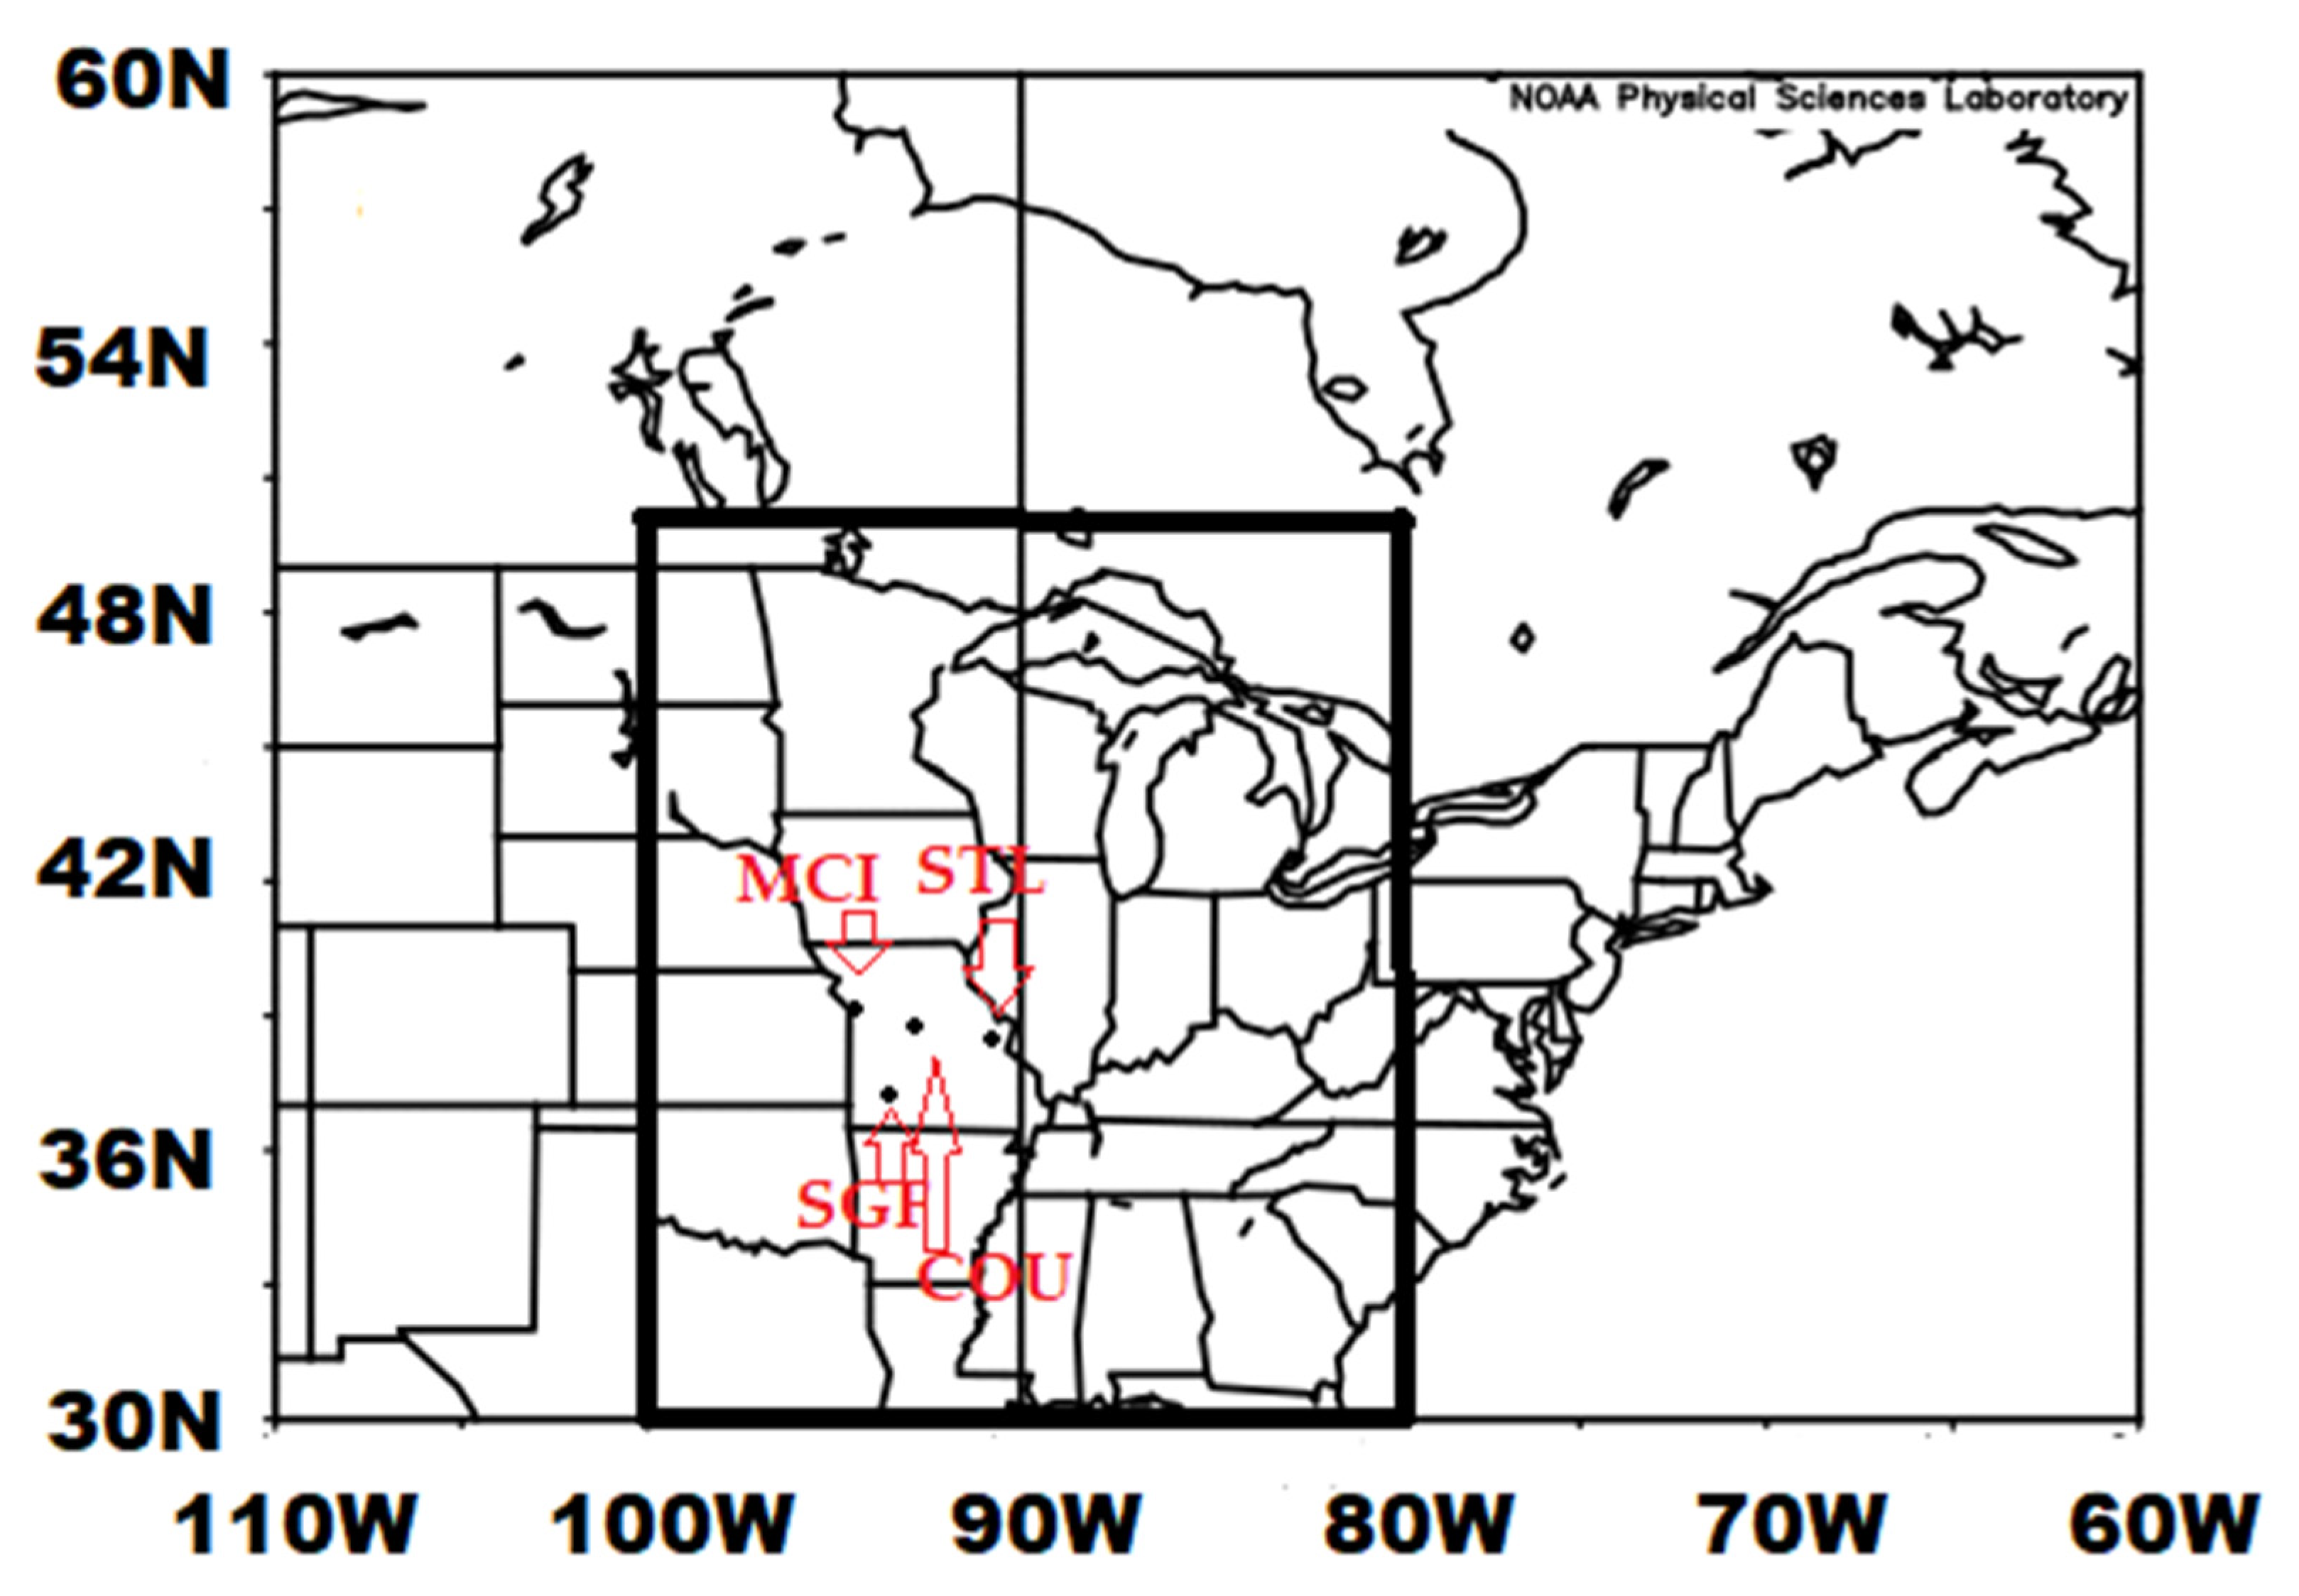
2.2. Study Region
2.3. Methodology
3. Results
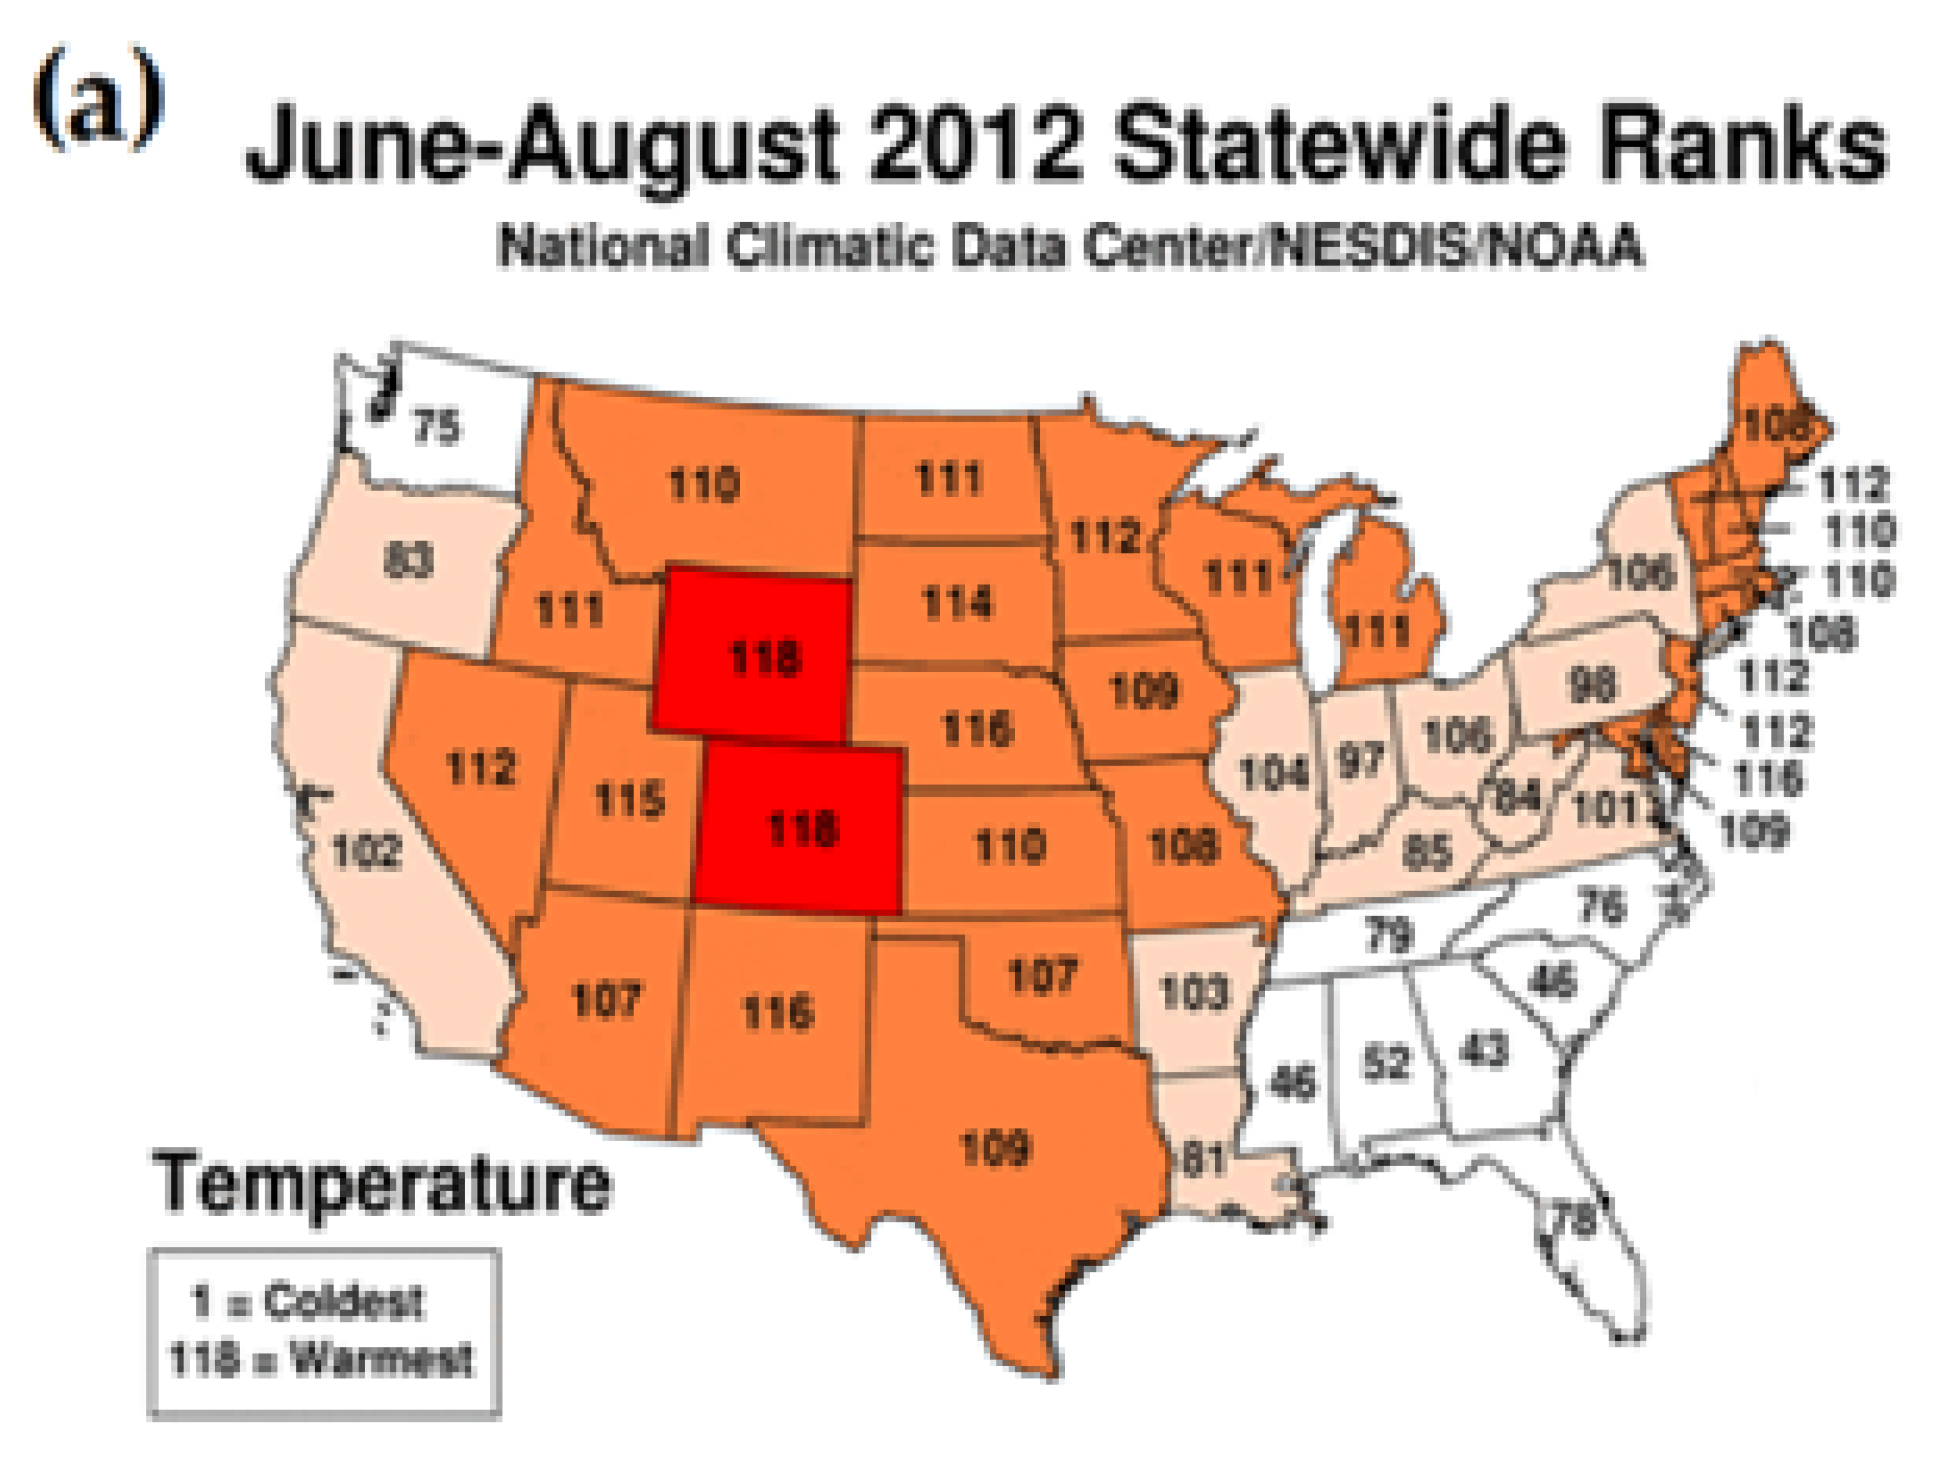
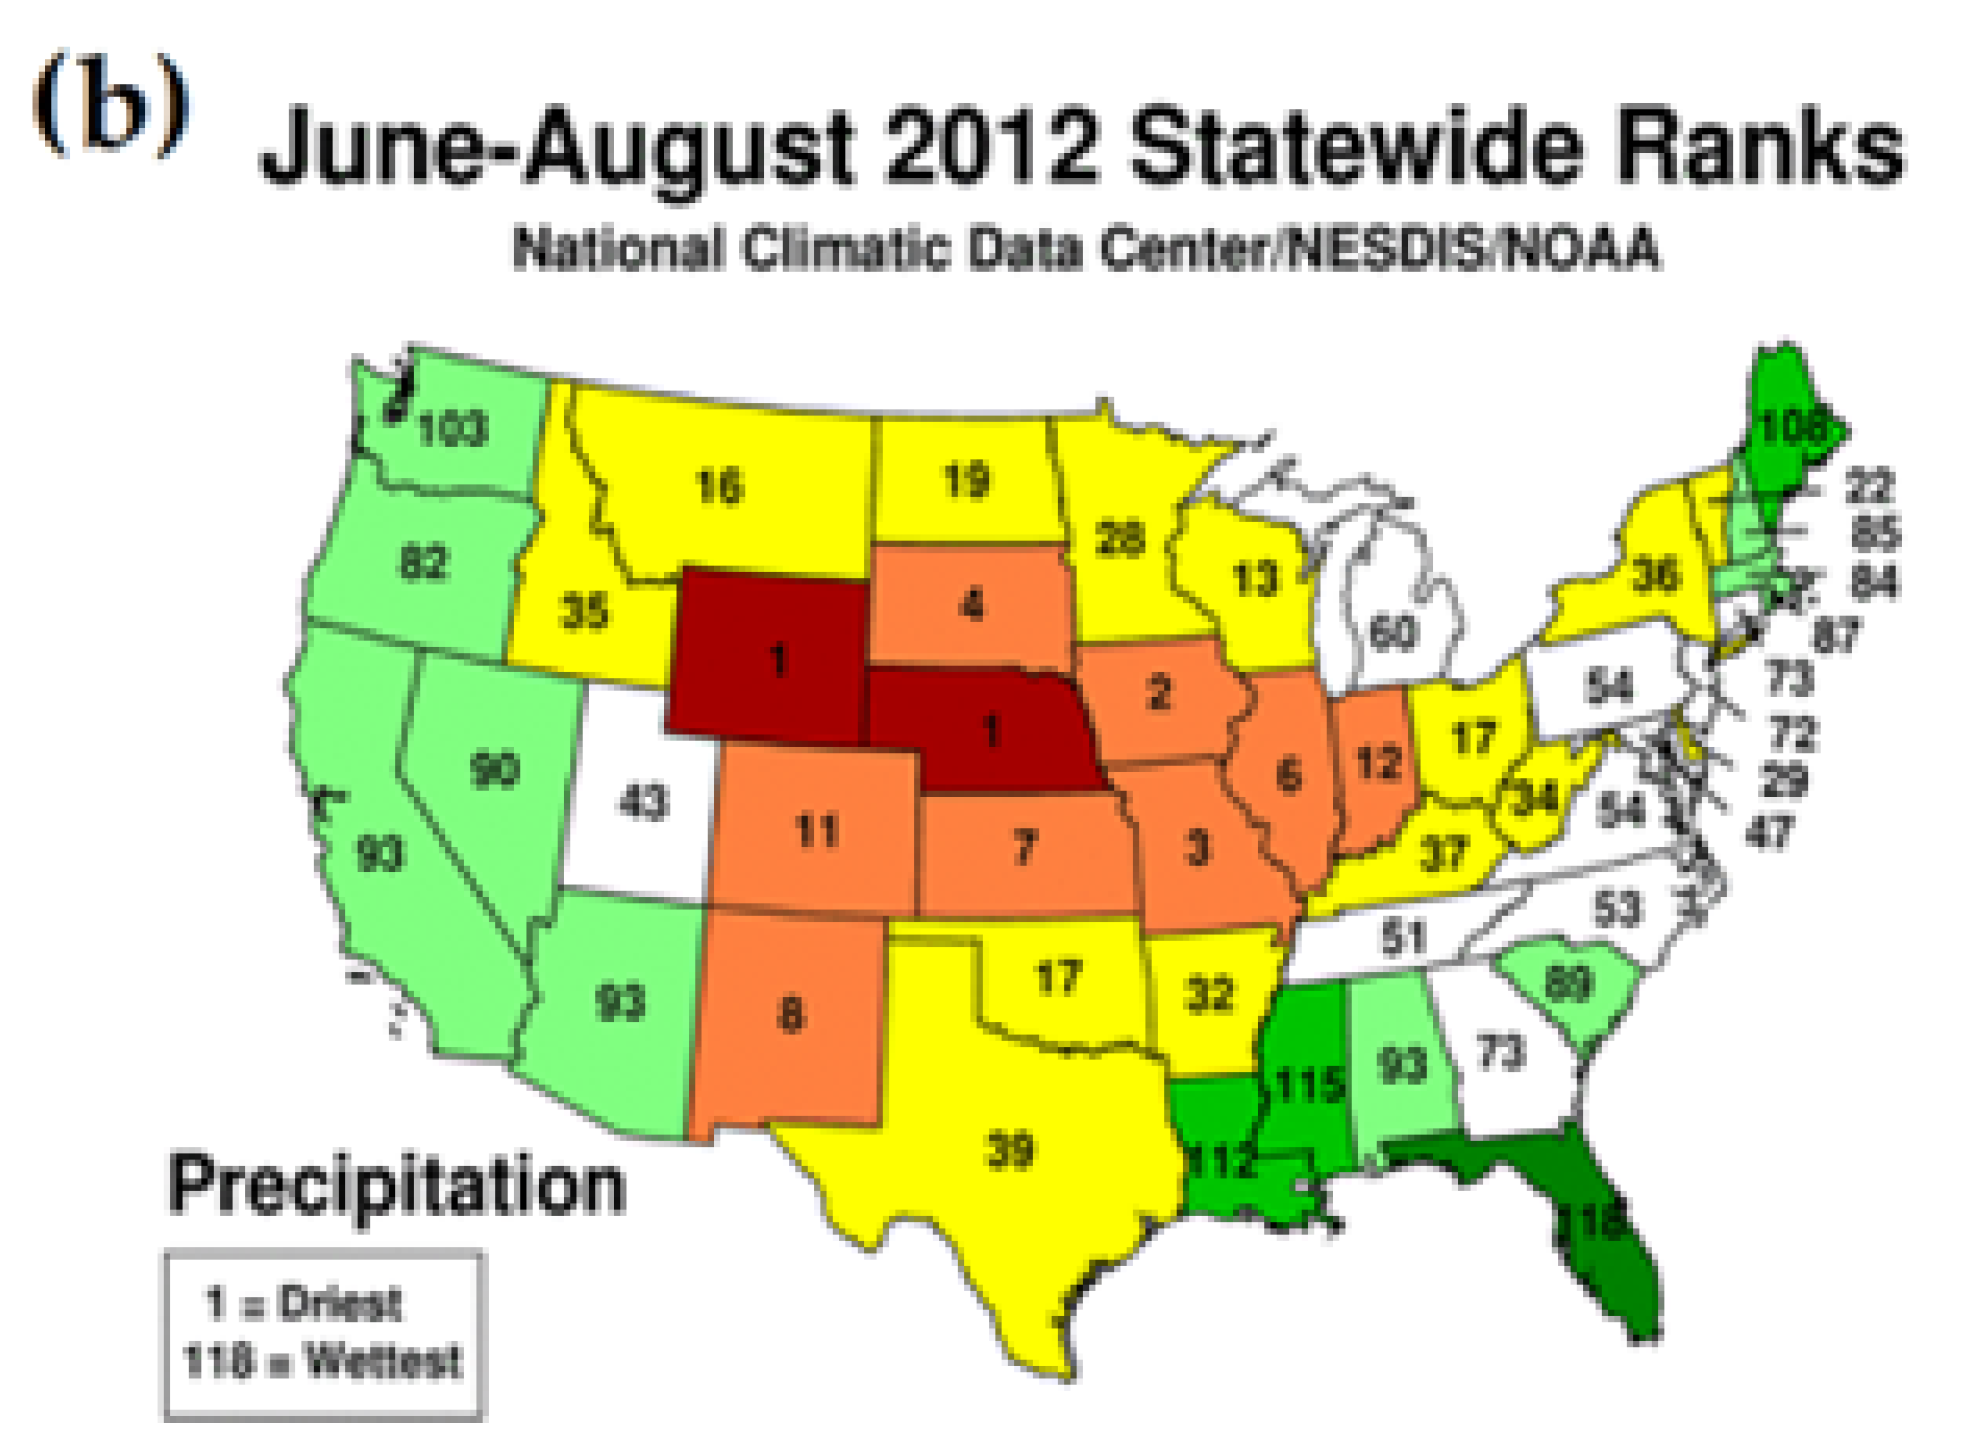
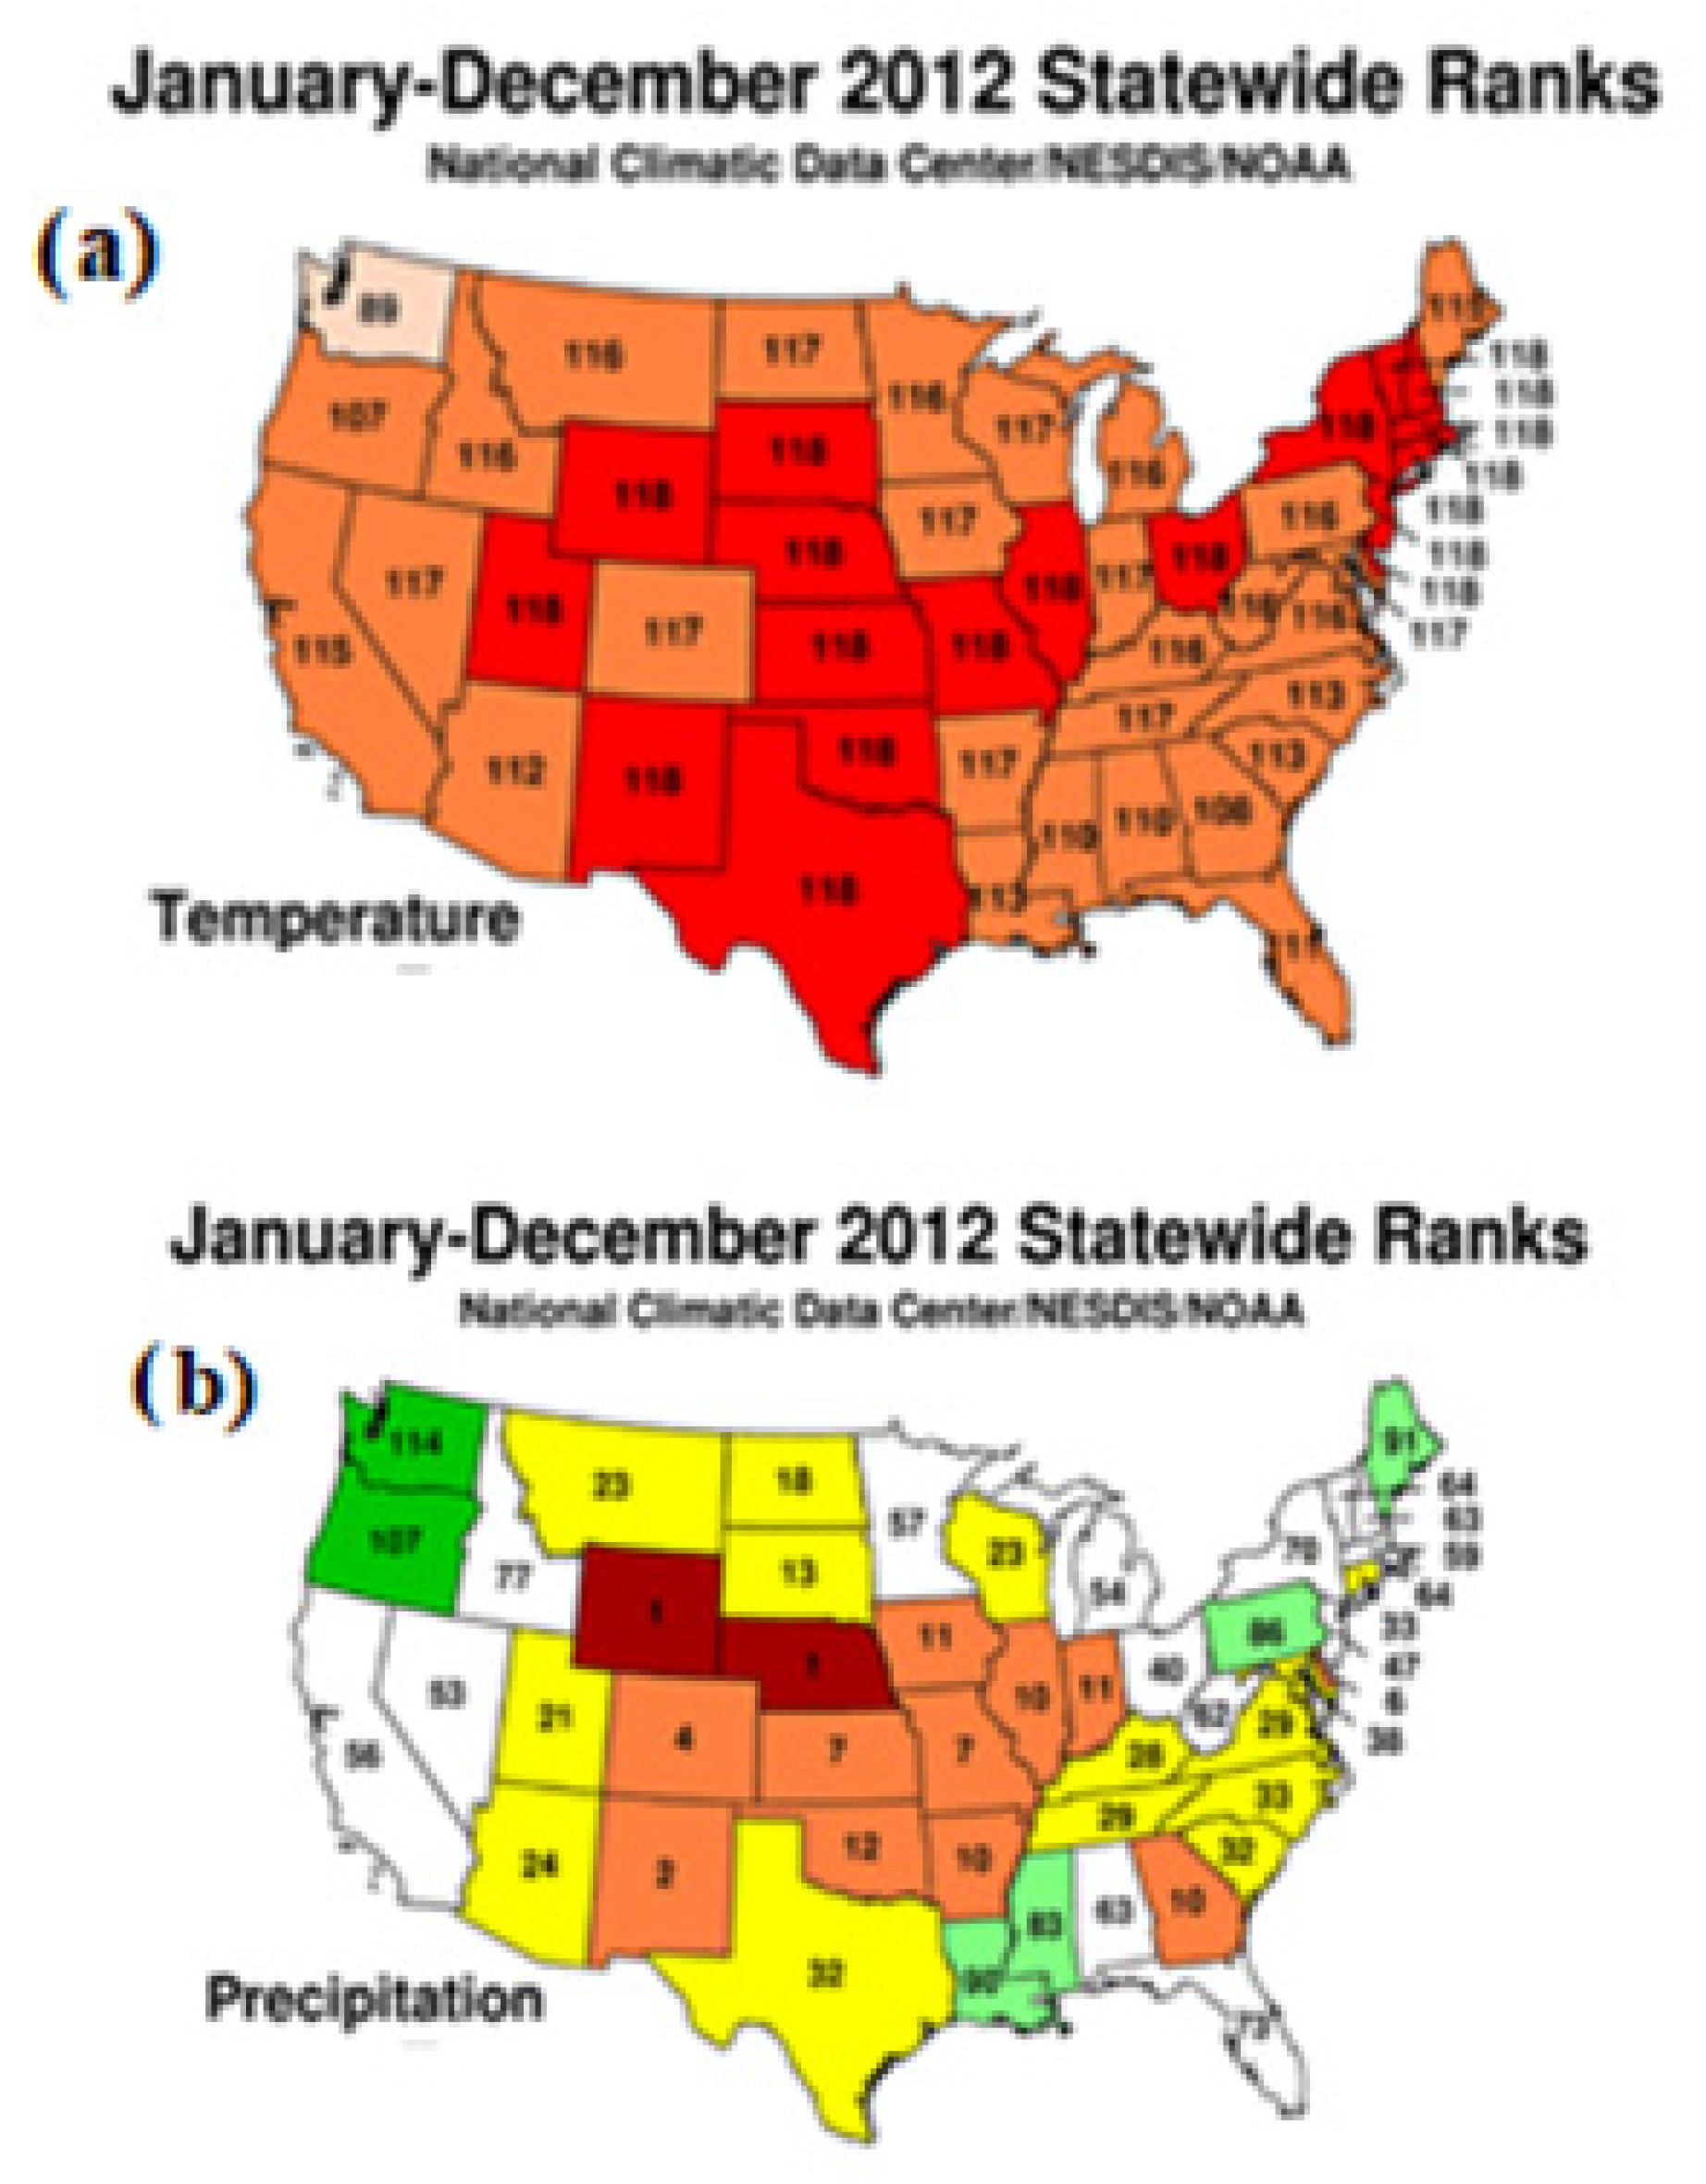
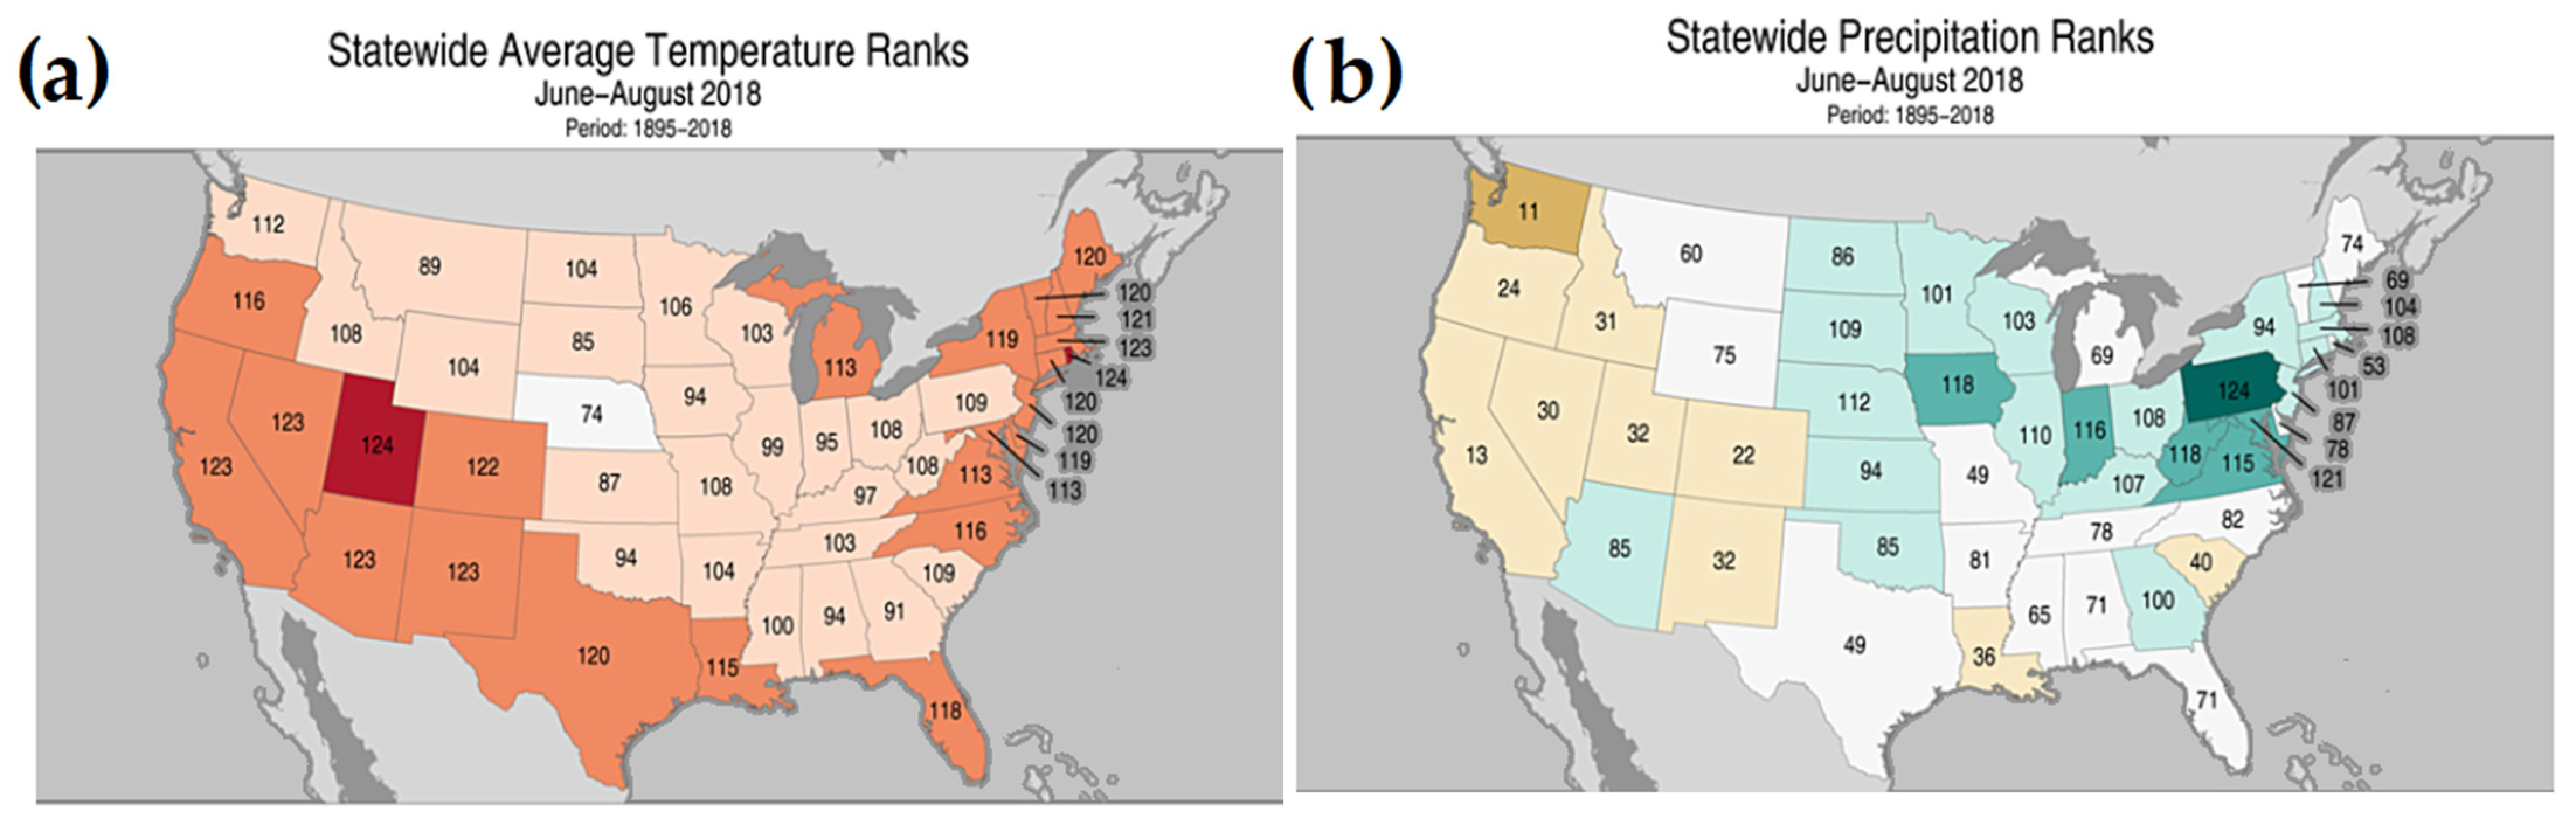
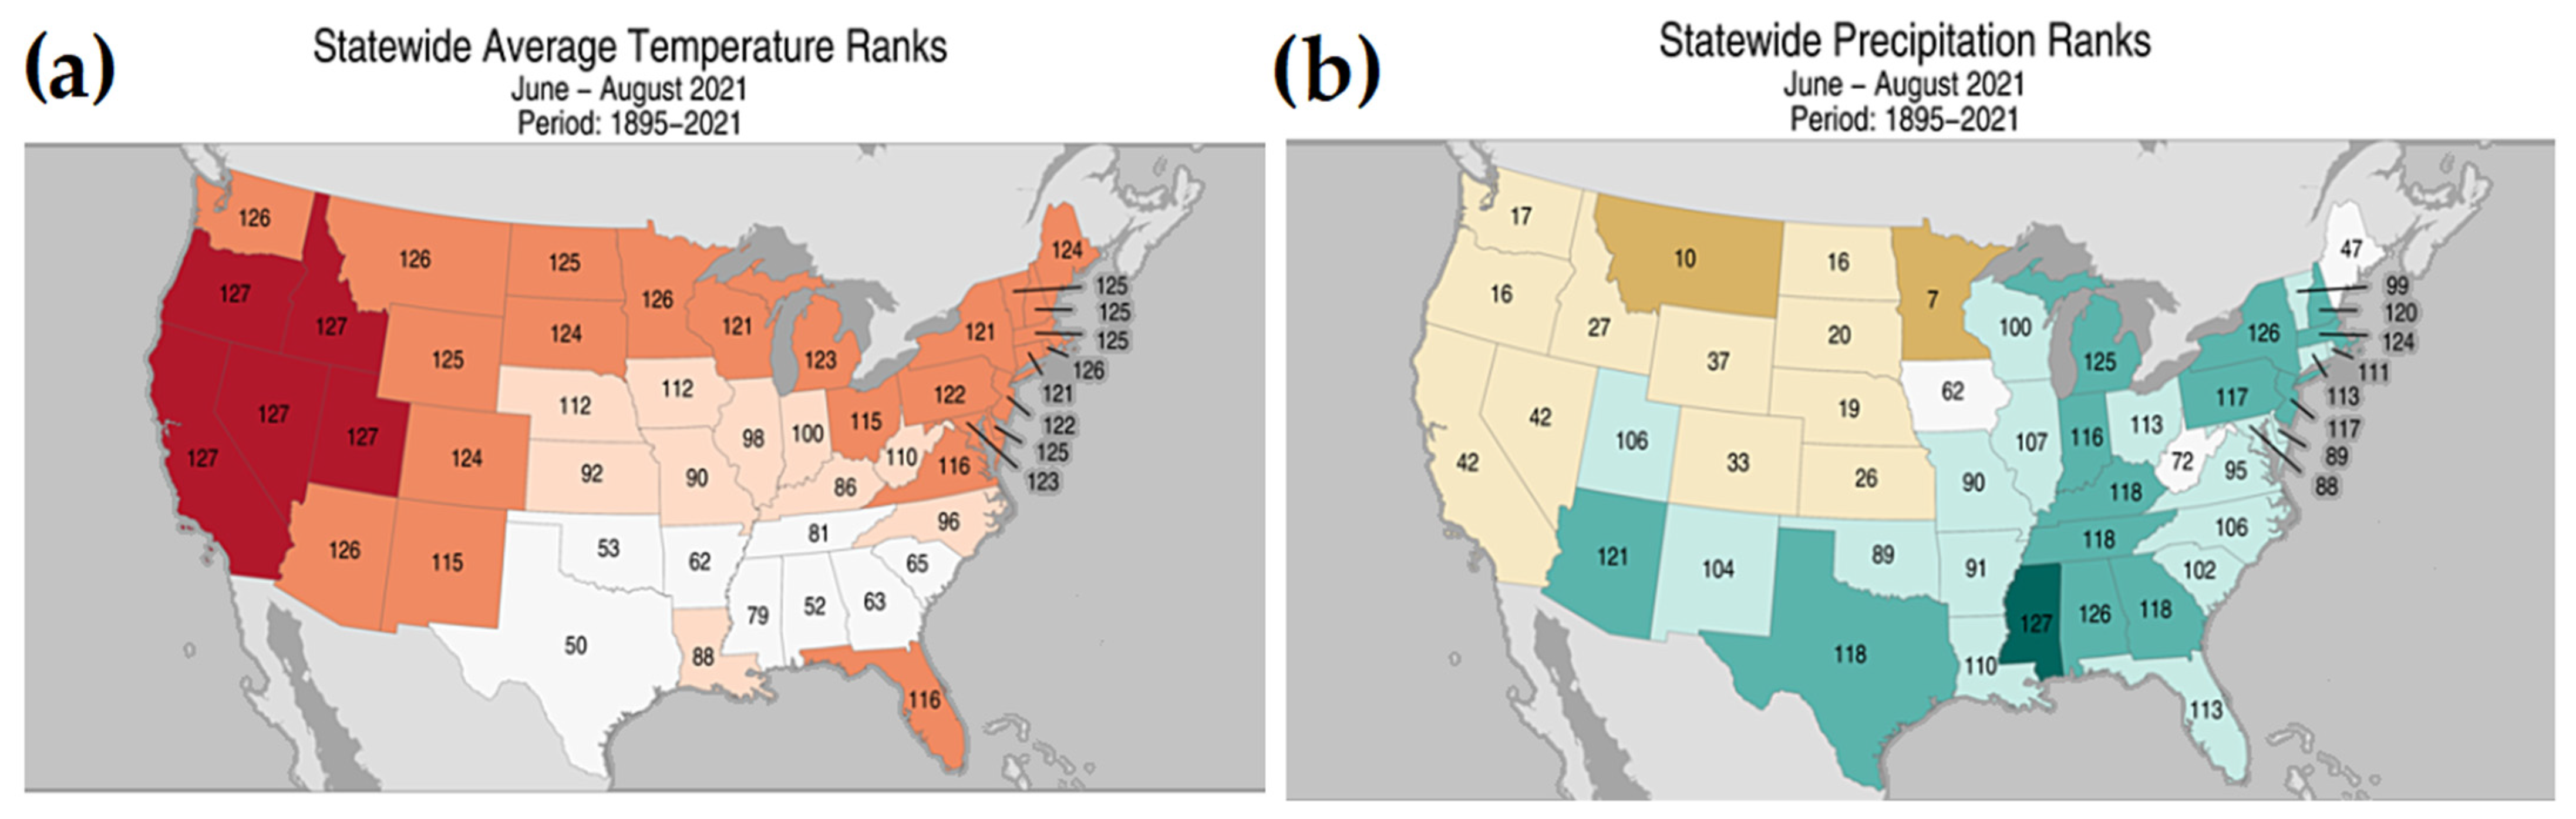
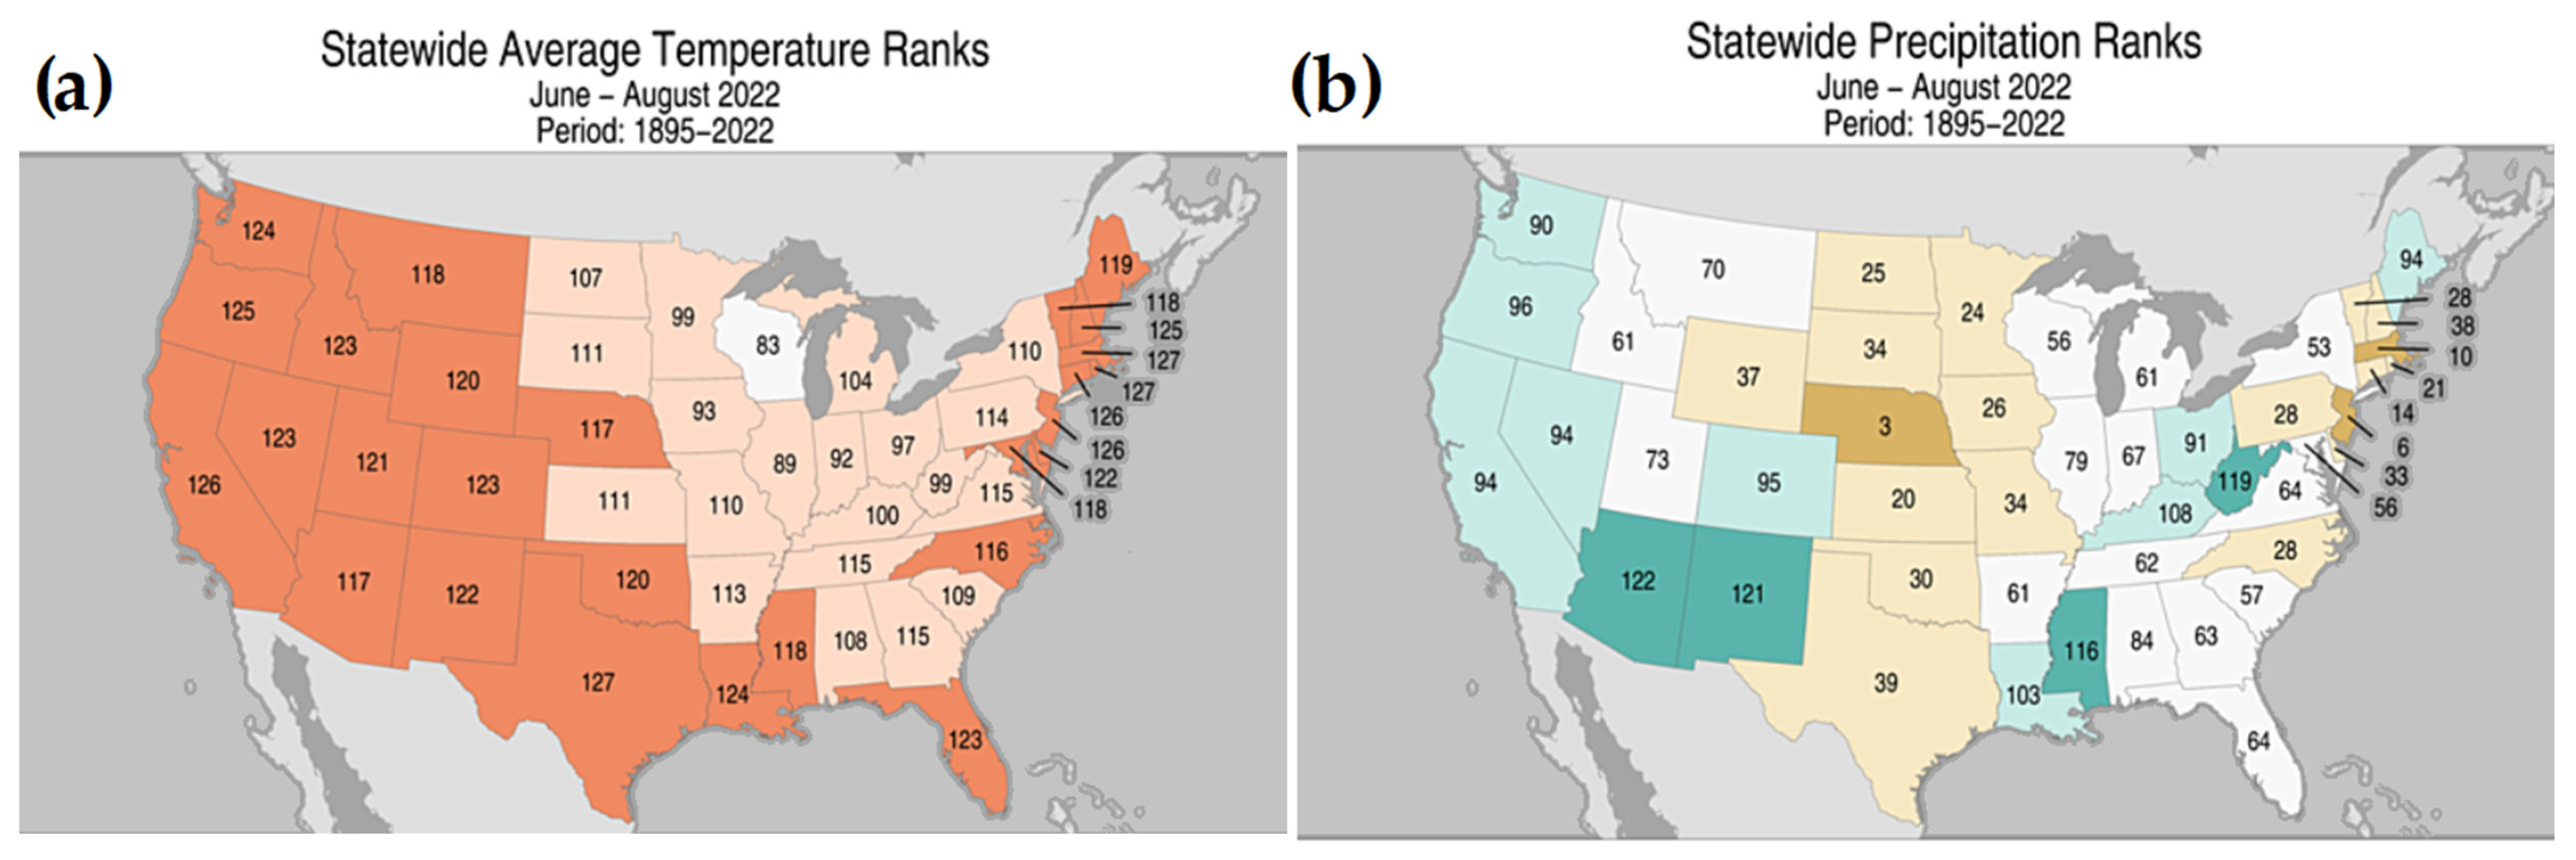
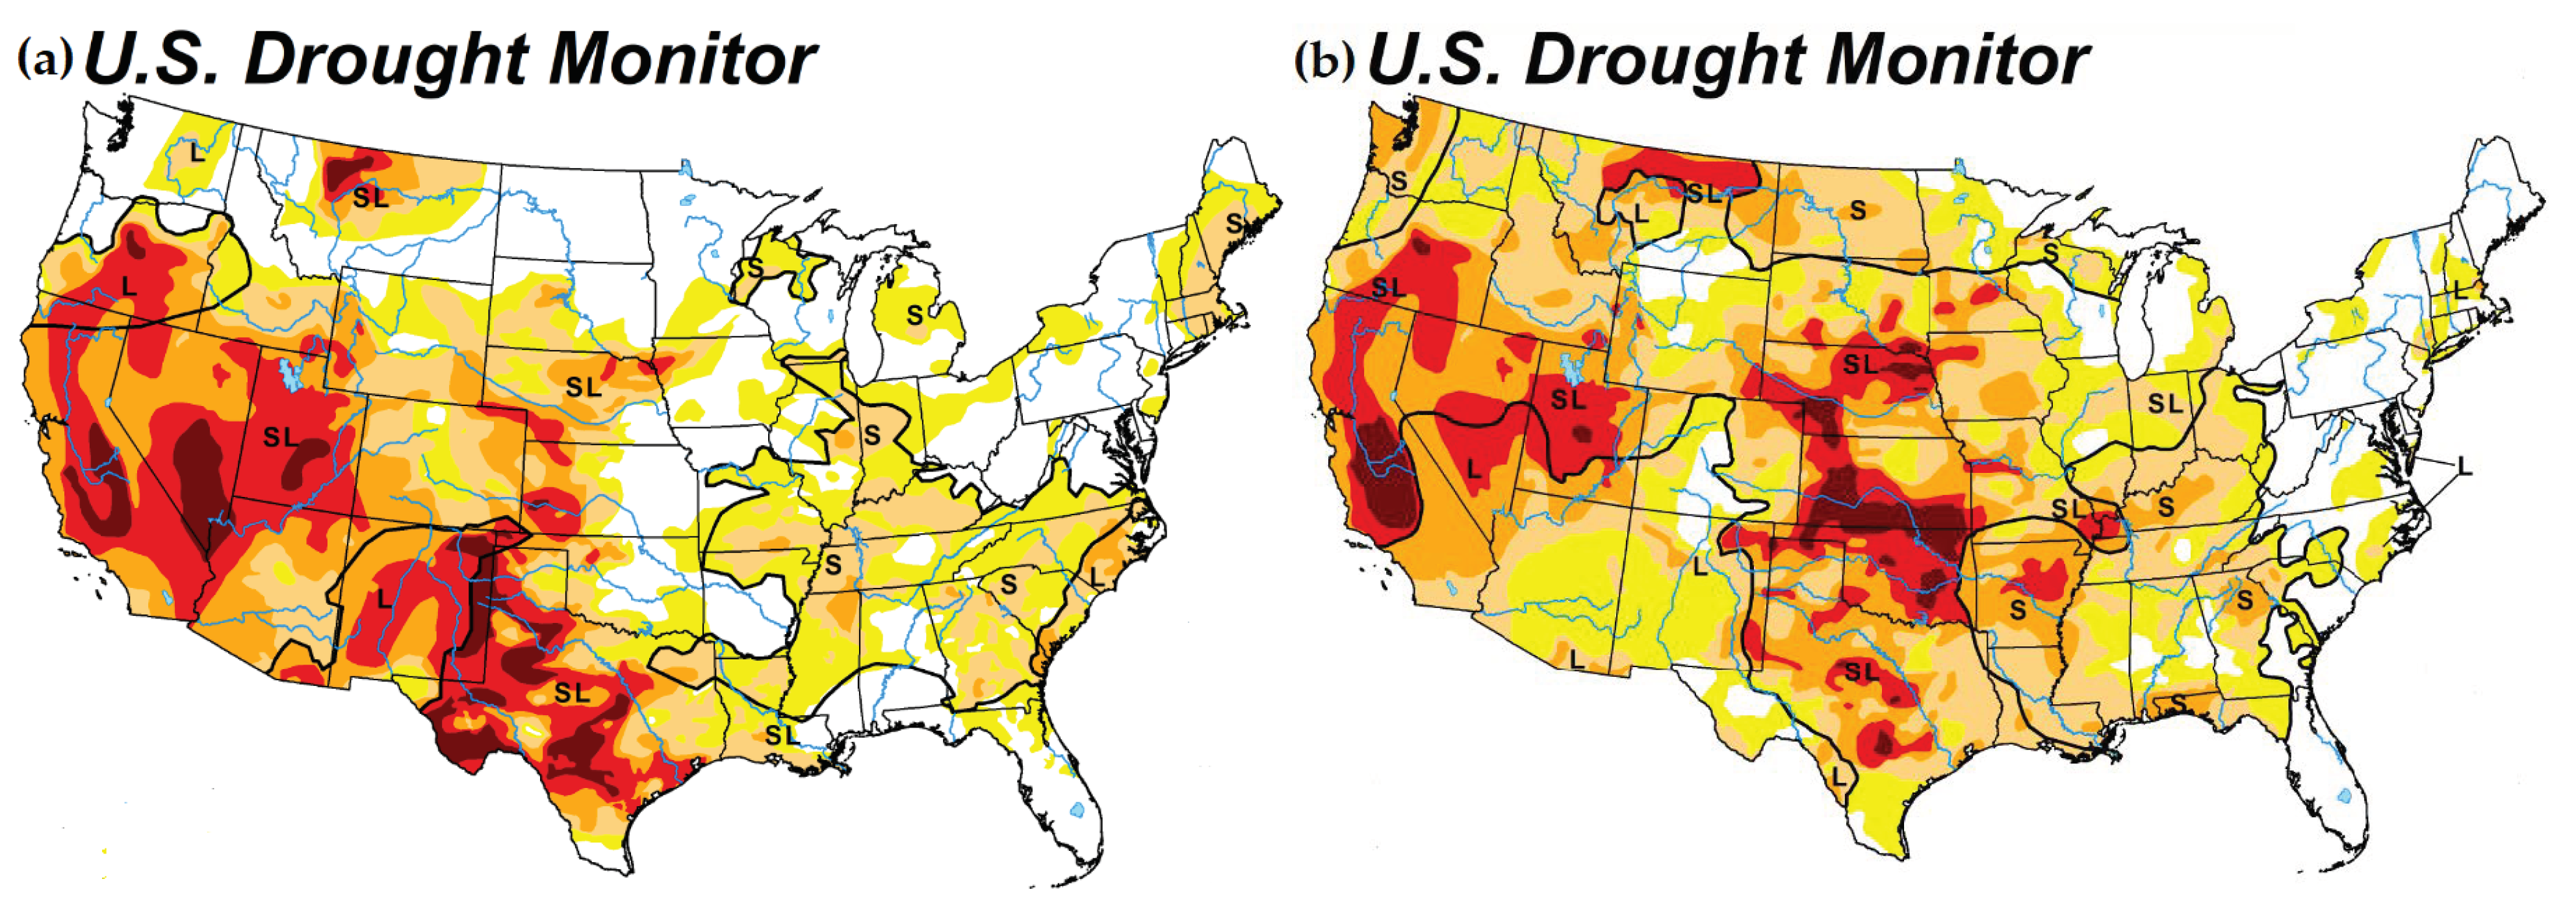
3.1. Drought 2022 in Context: United States Statewide Ranks
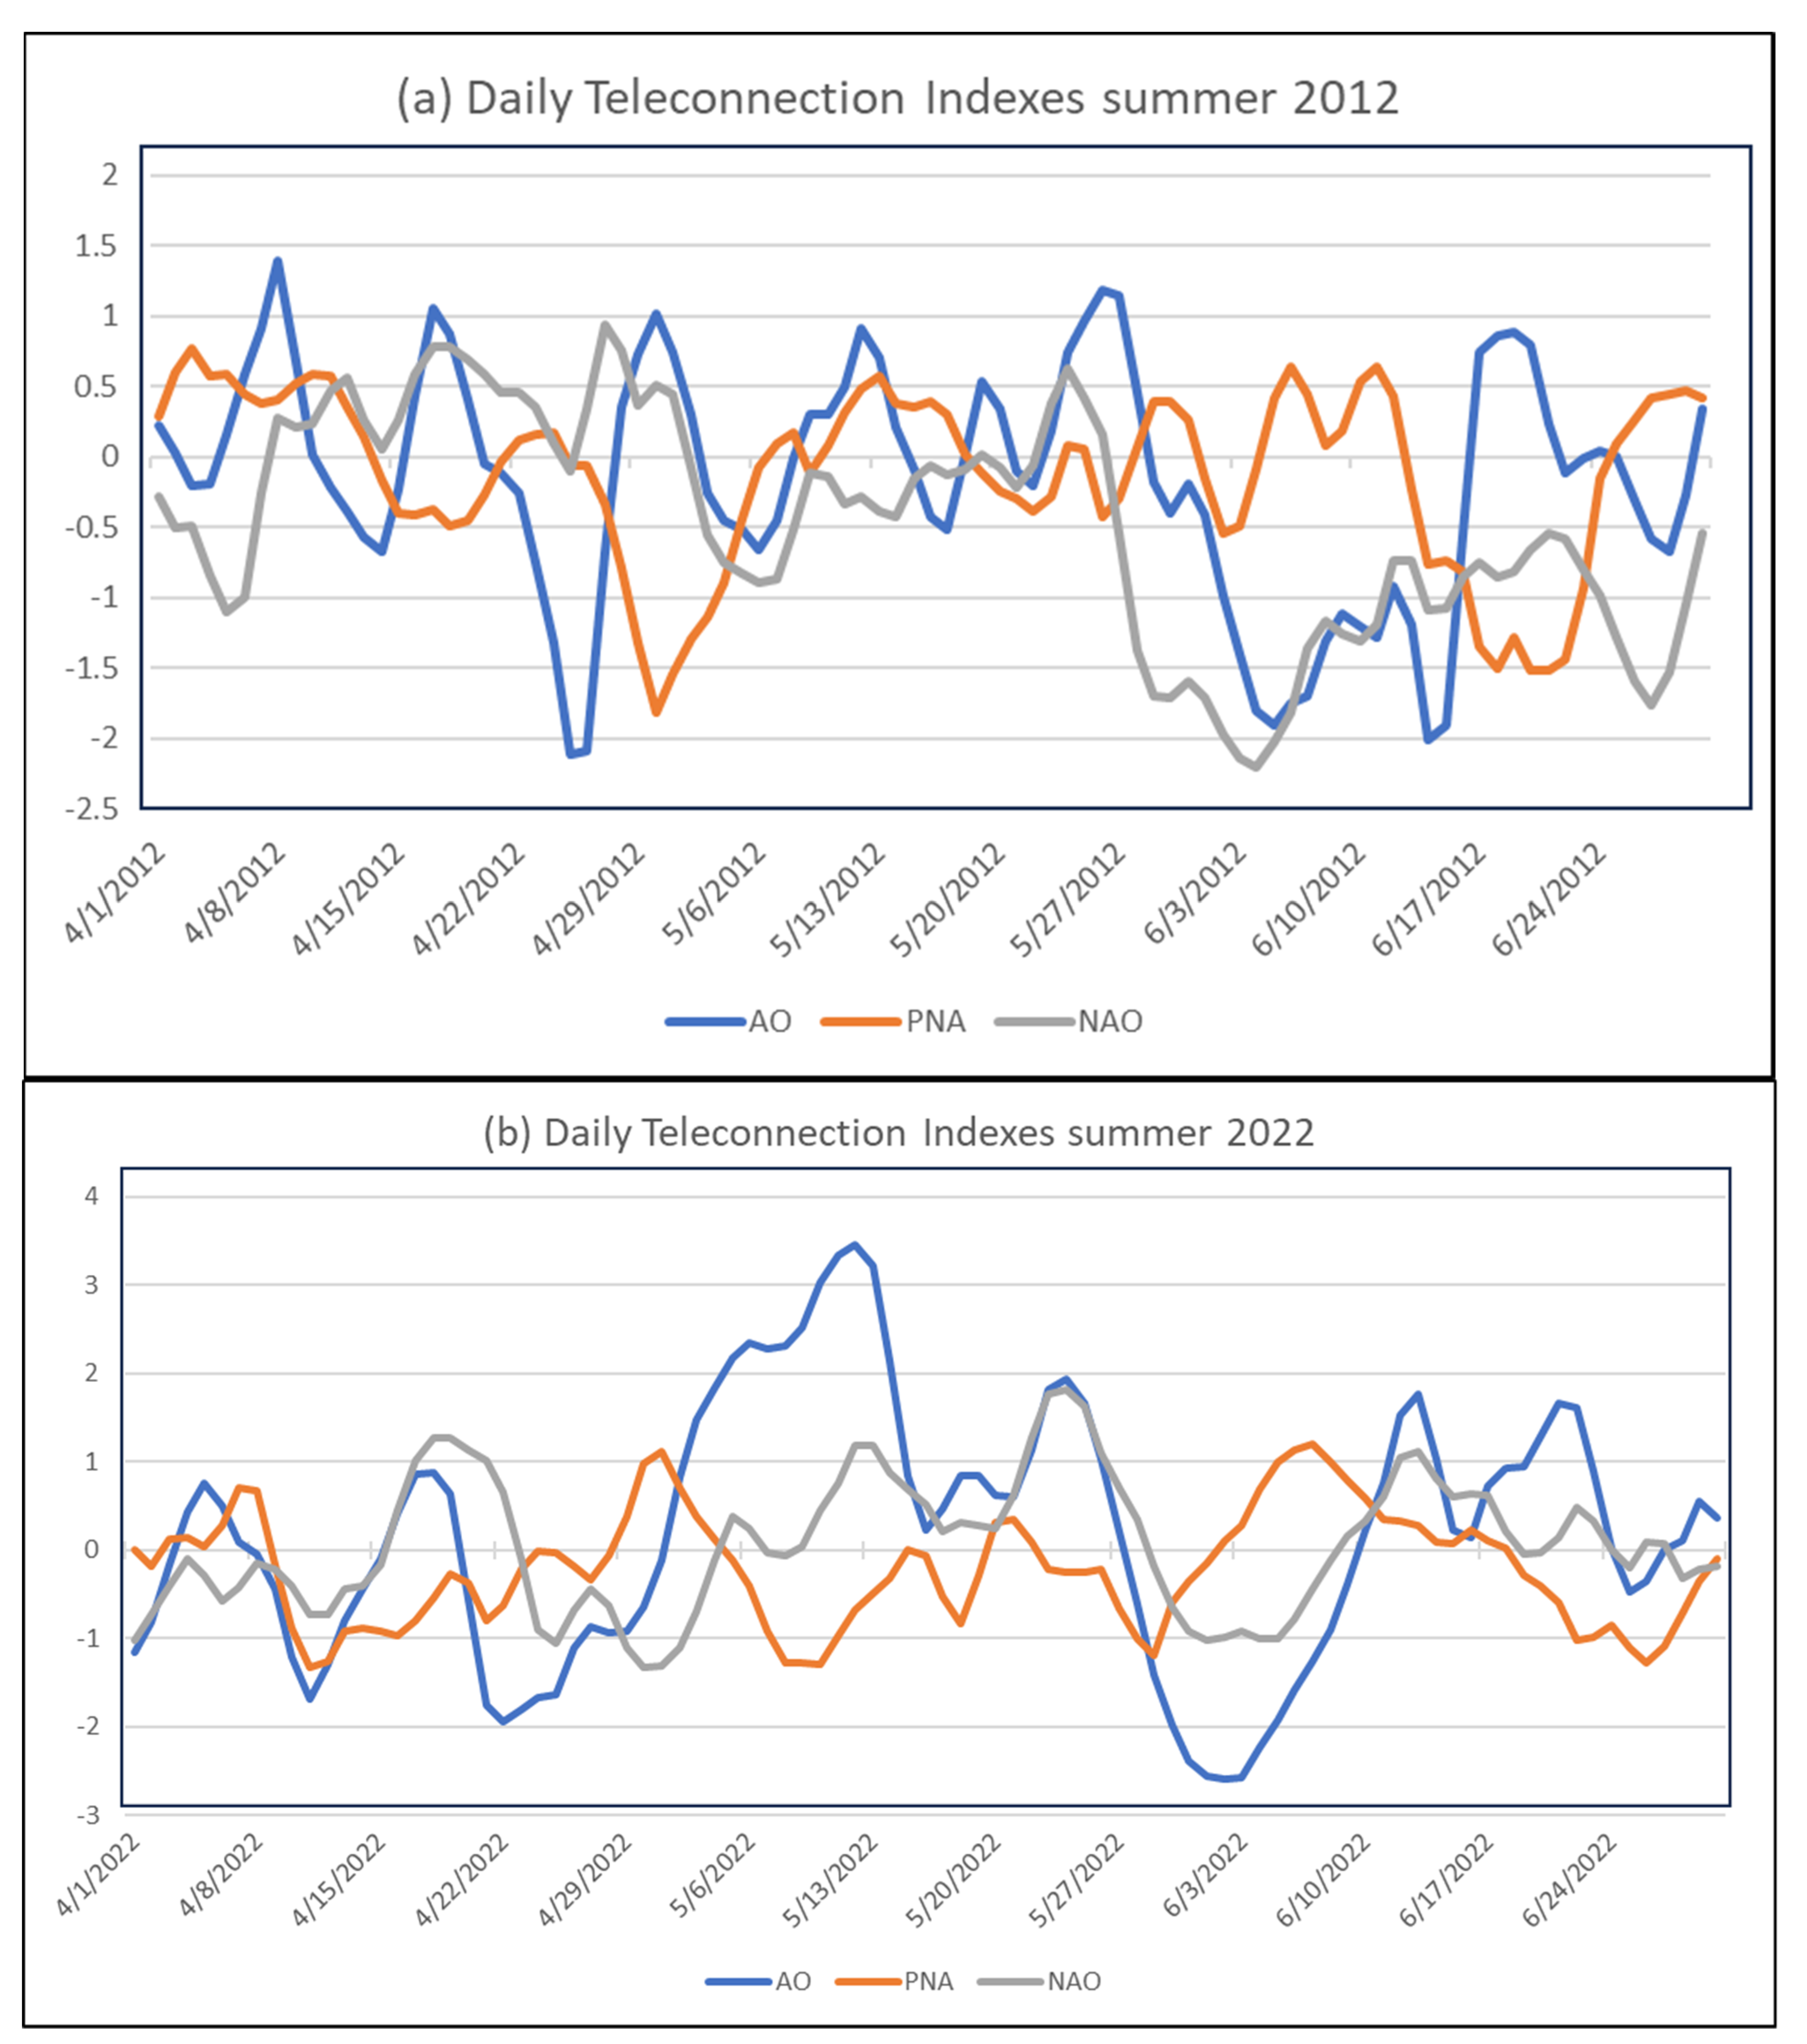
3.2. Teleconnections
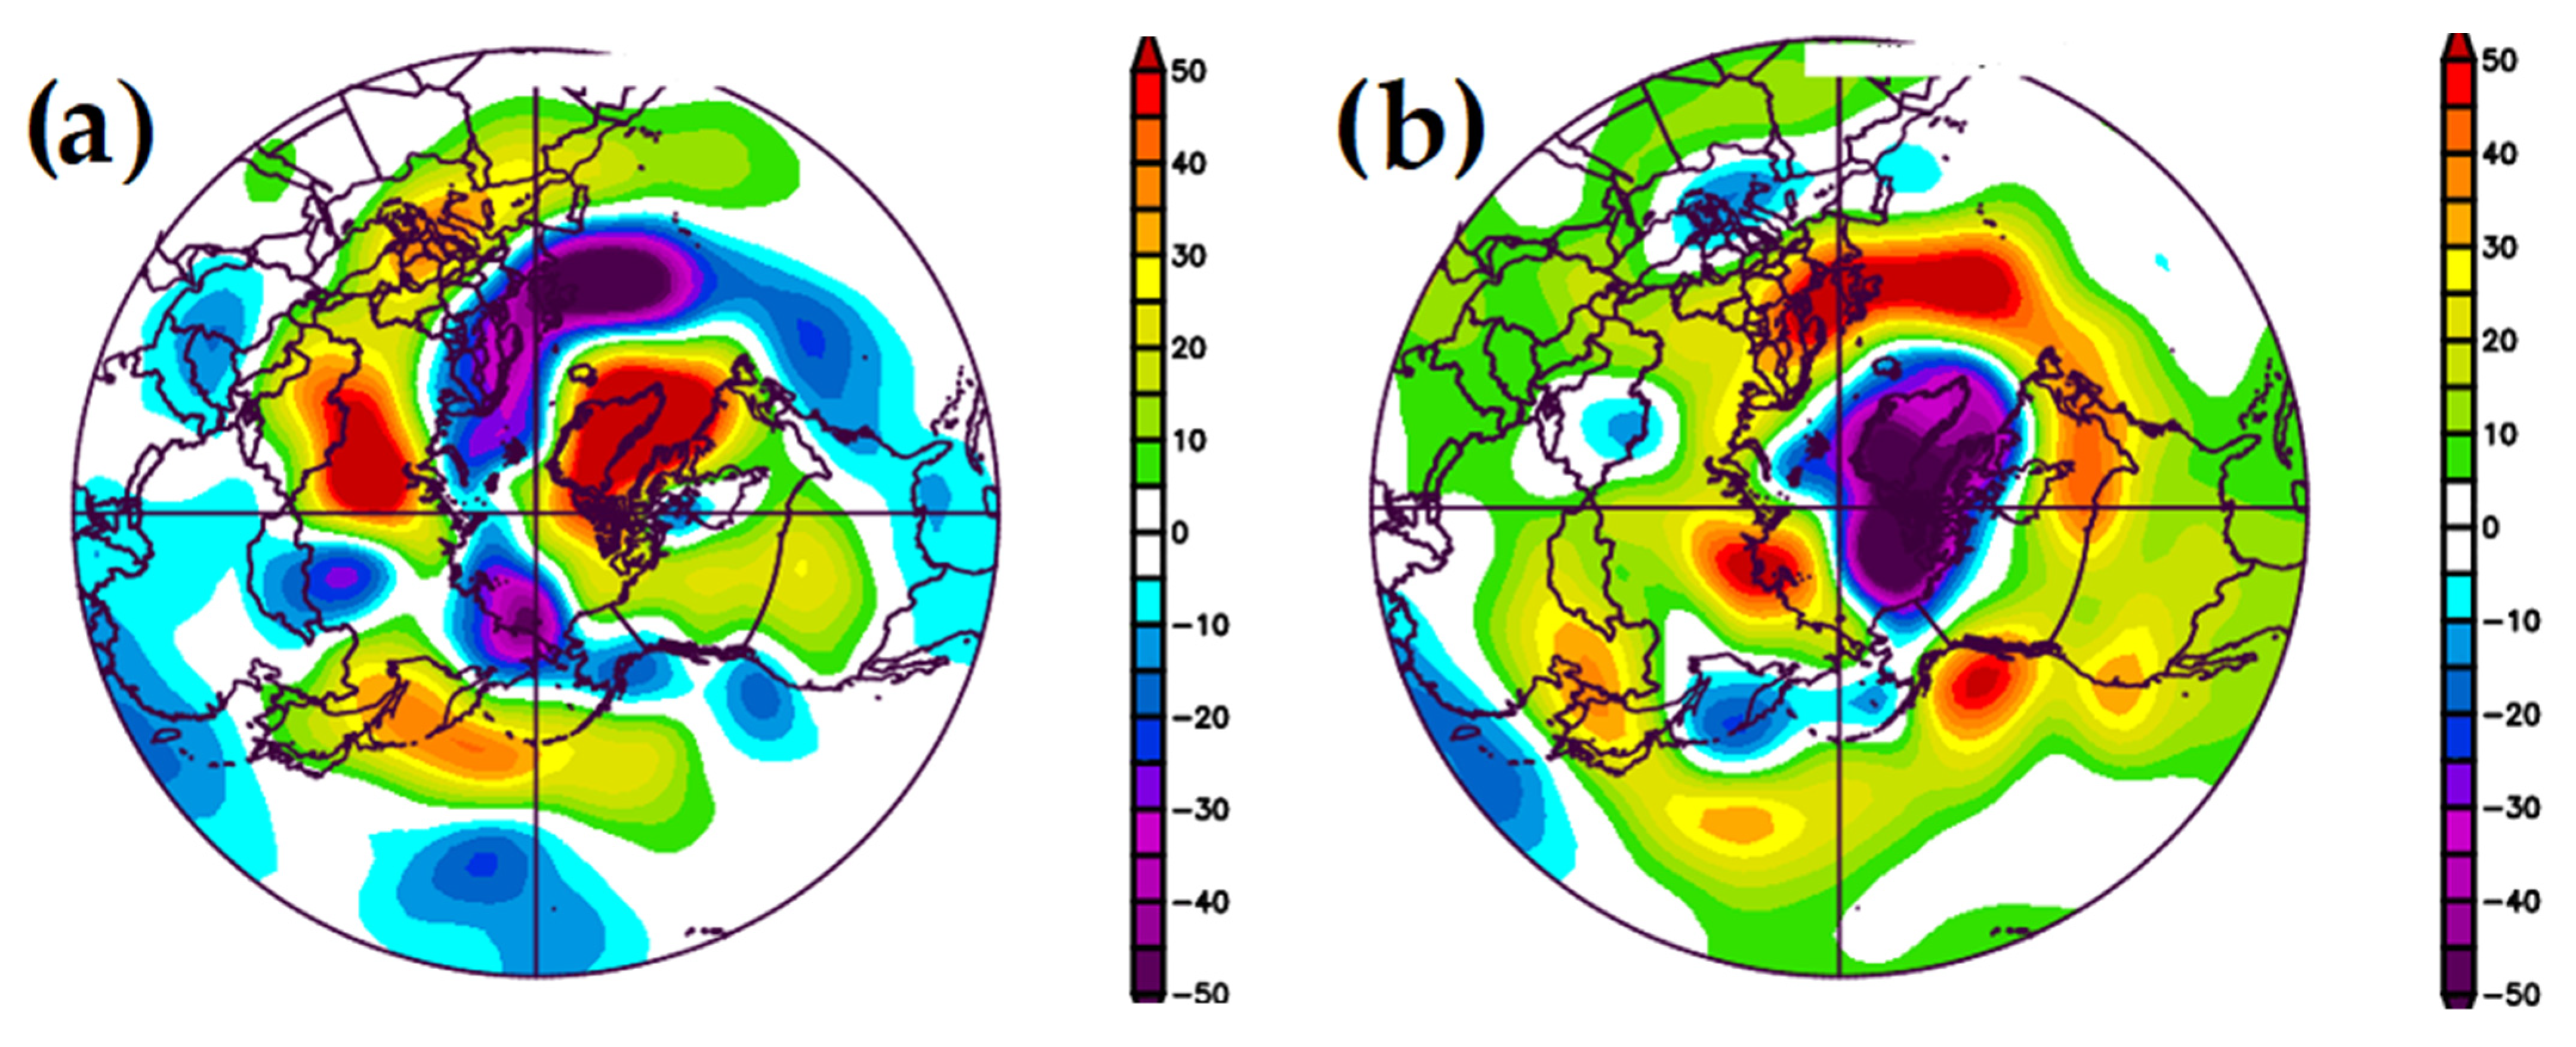
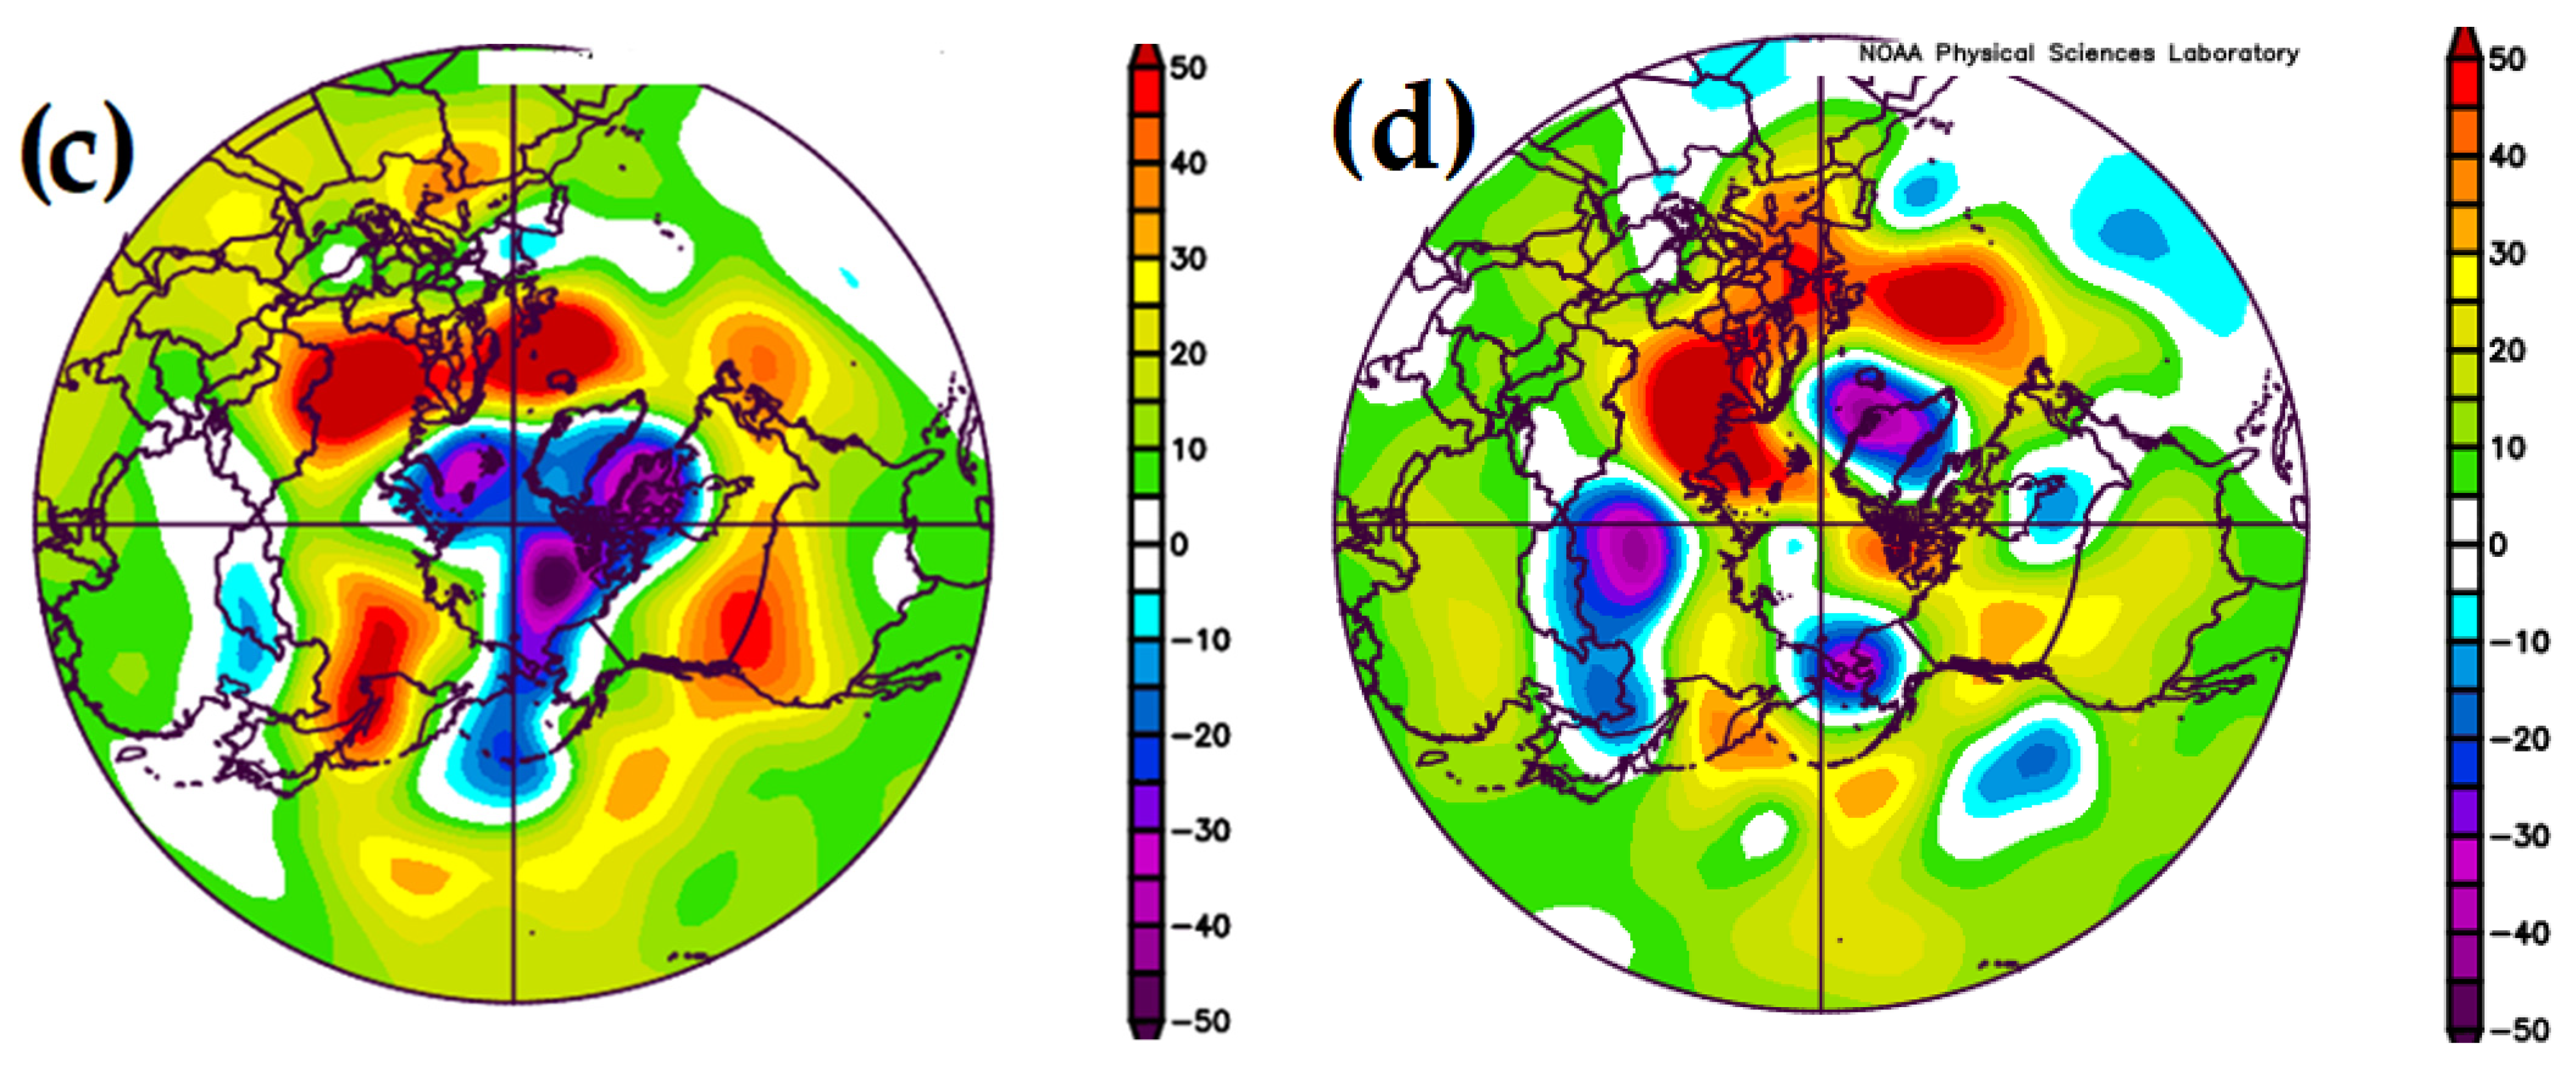
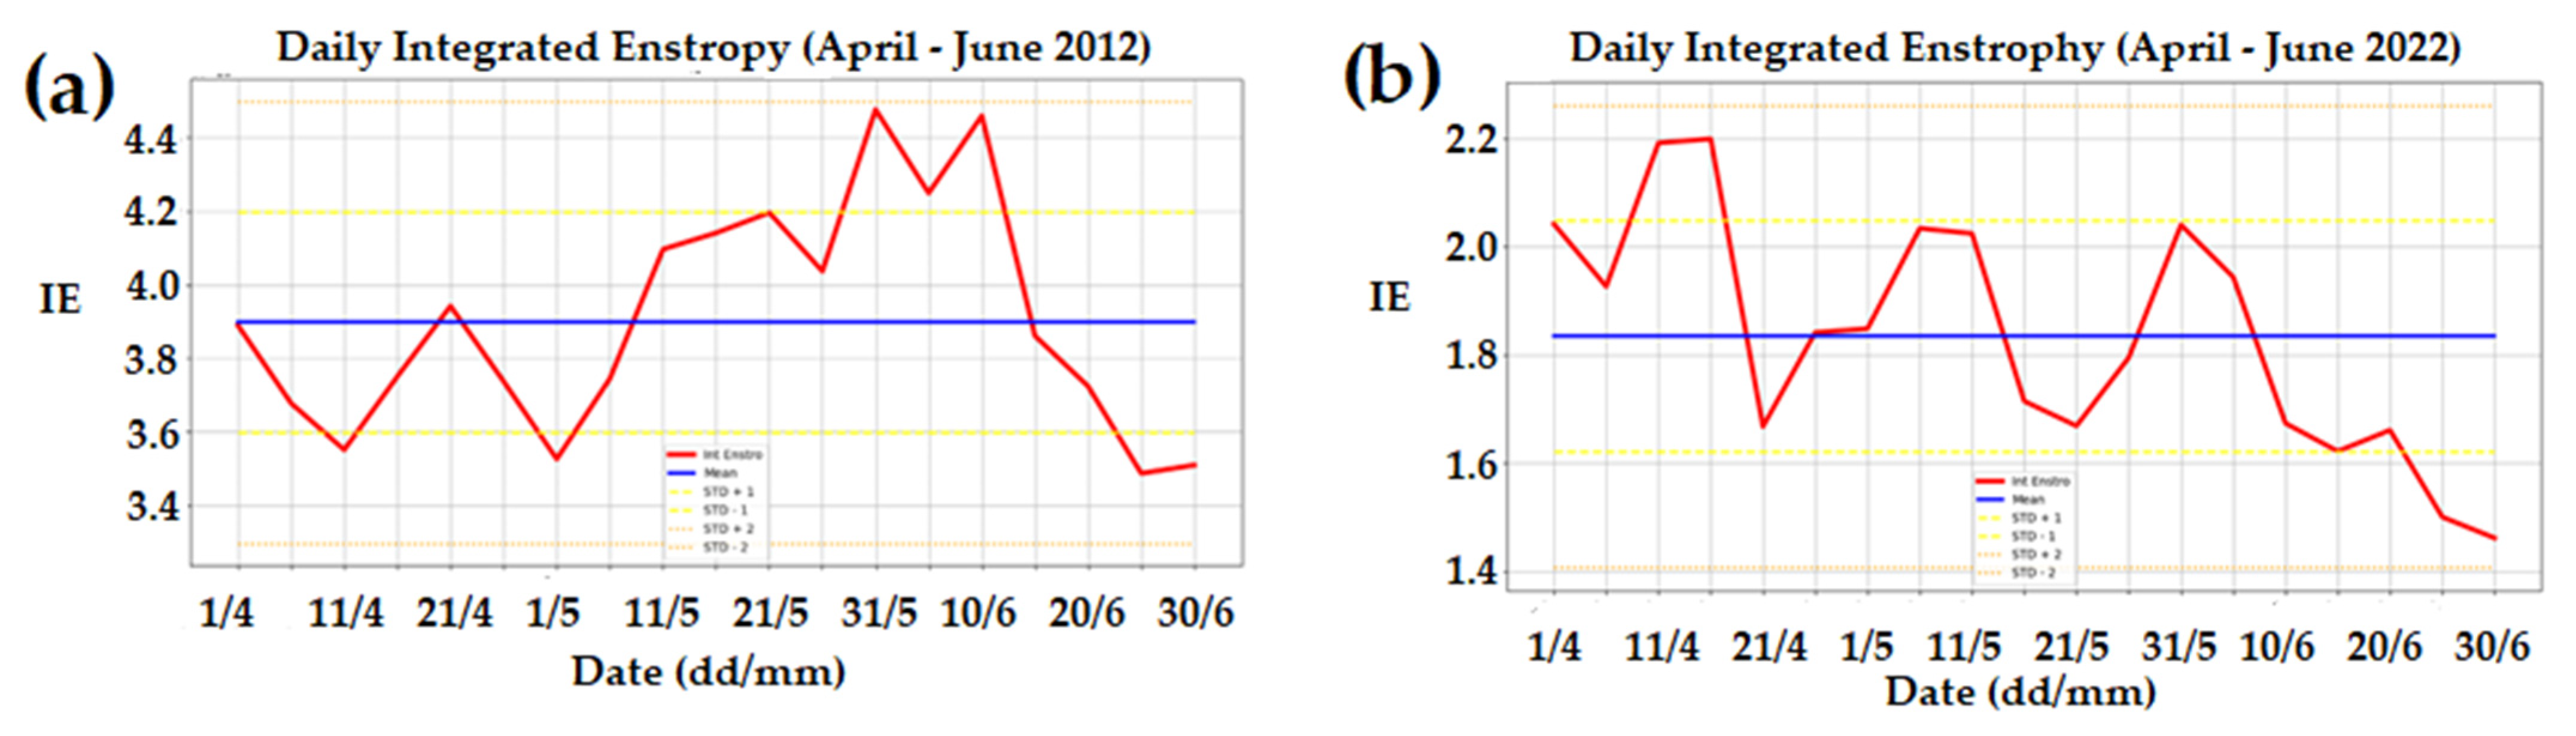
3.3. 500 hPa Flow, IE, and Blocking—United States
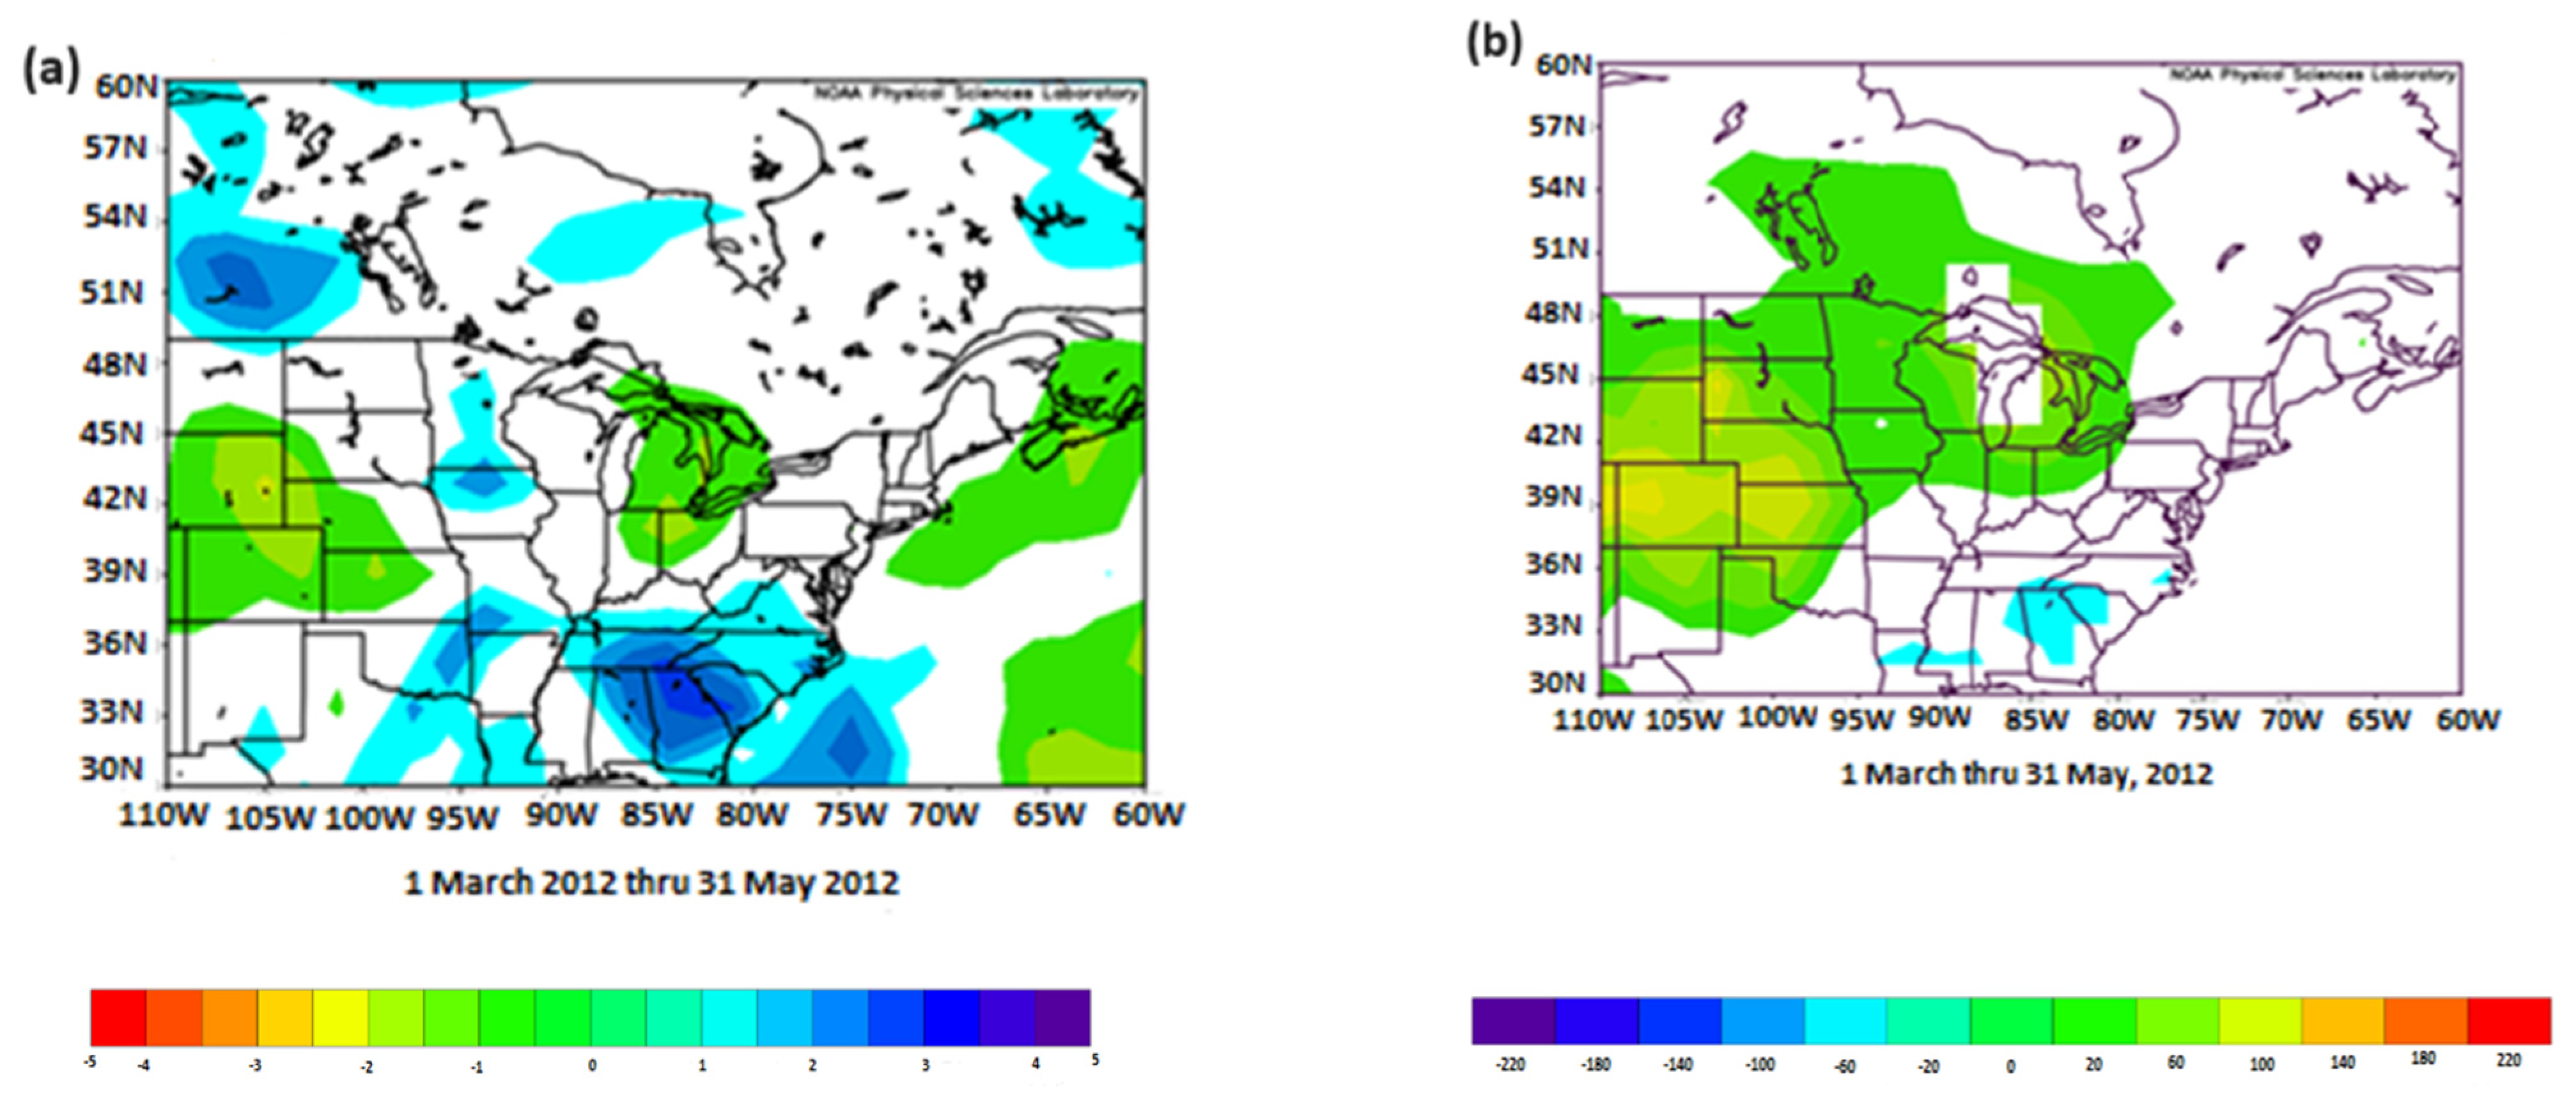
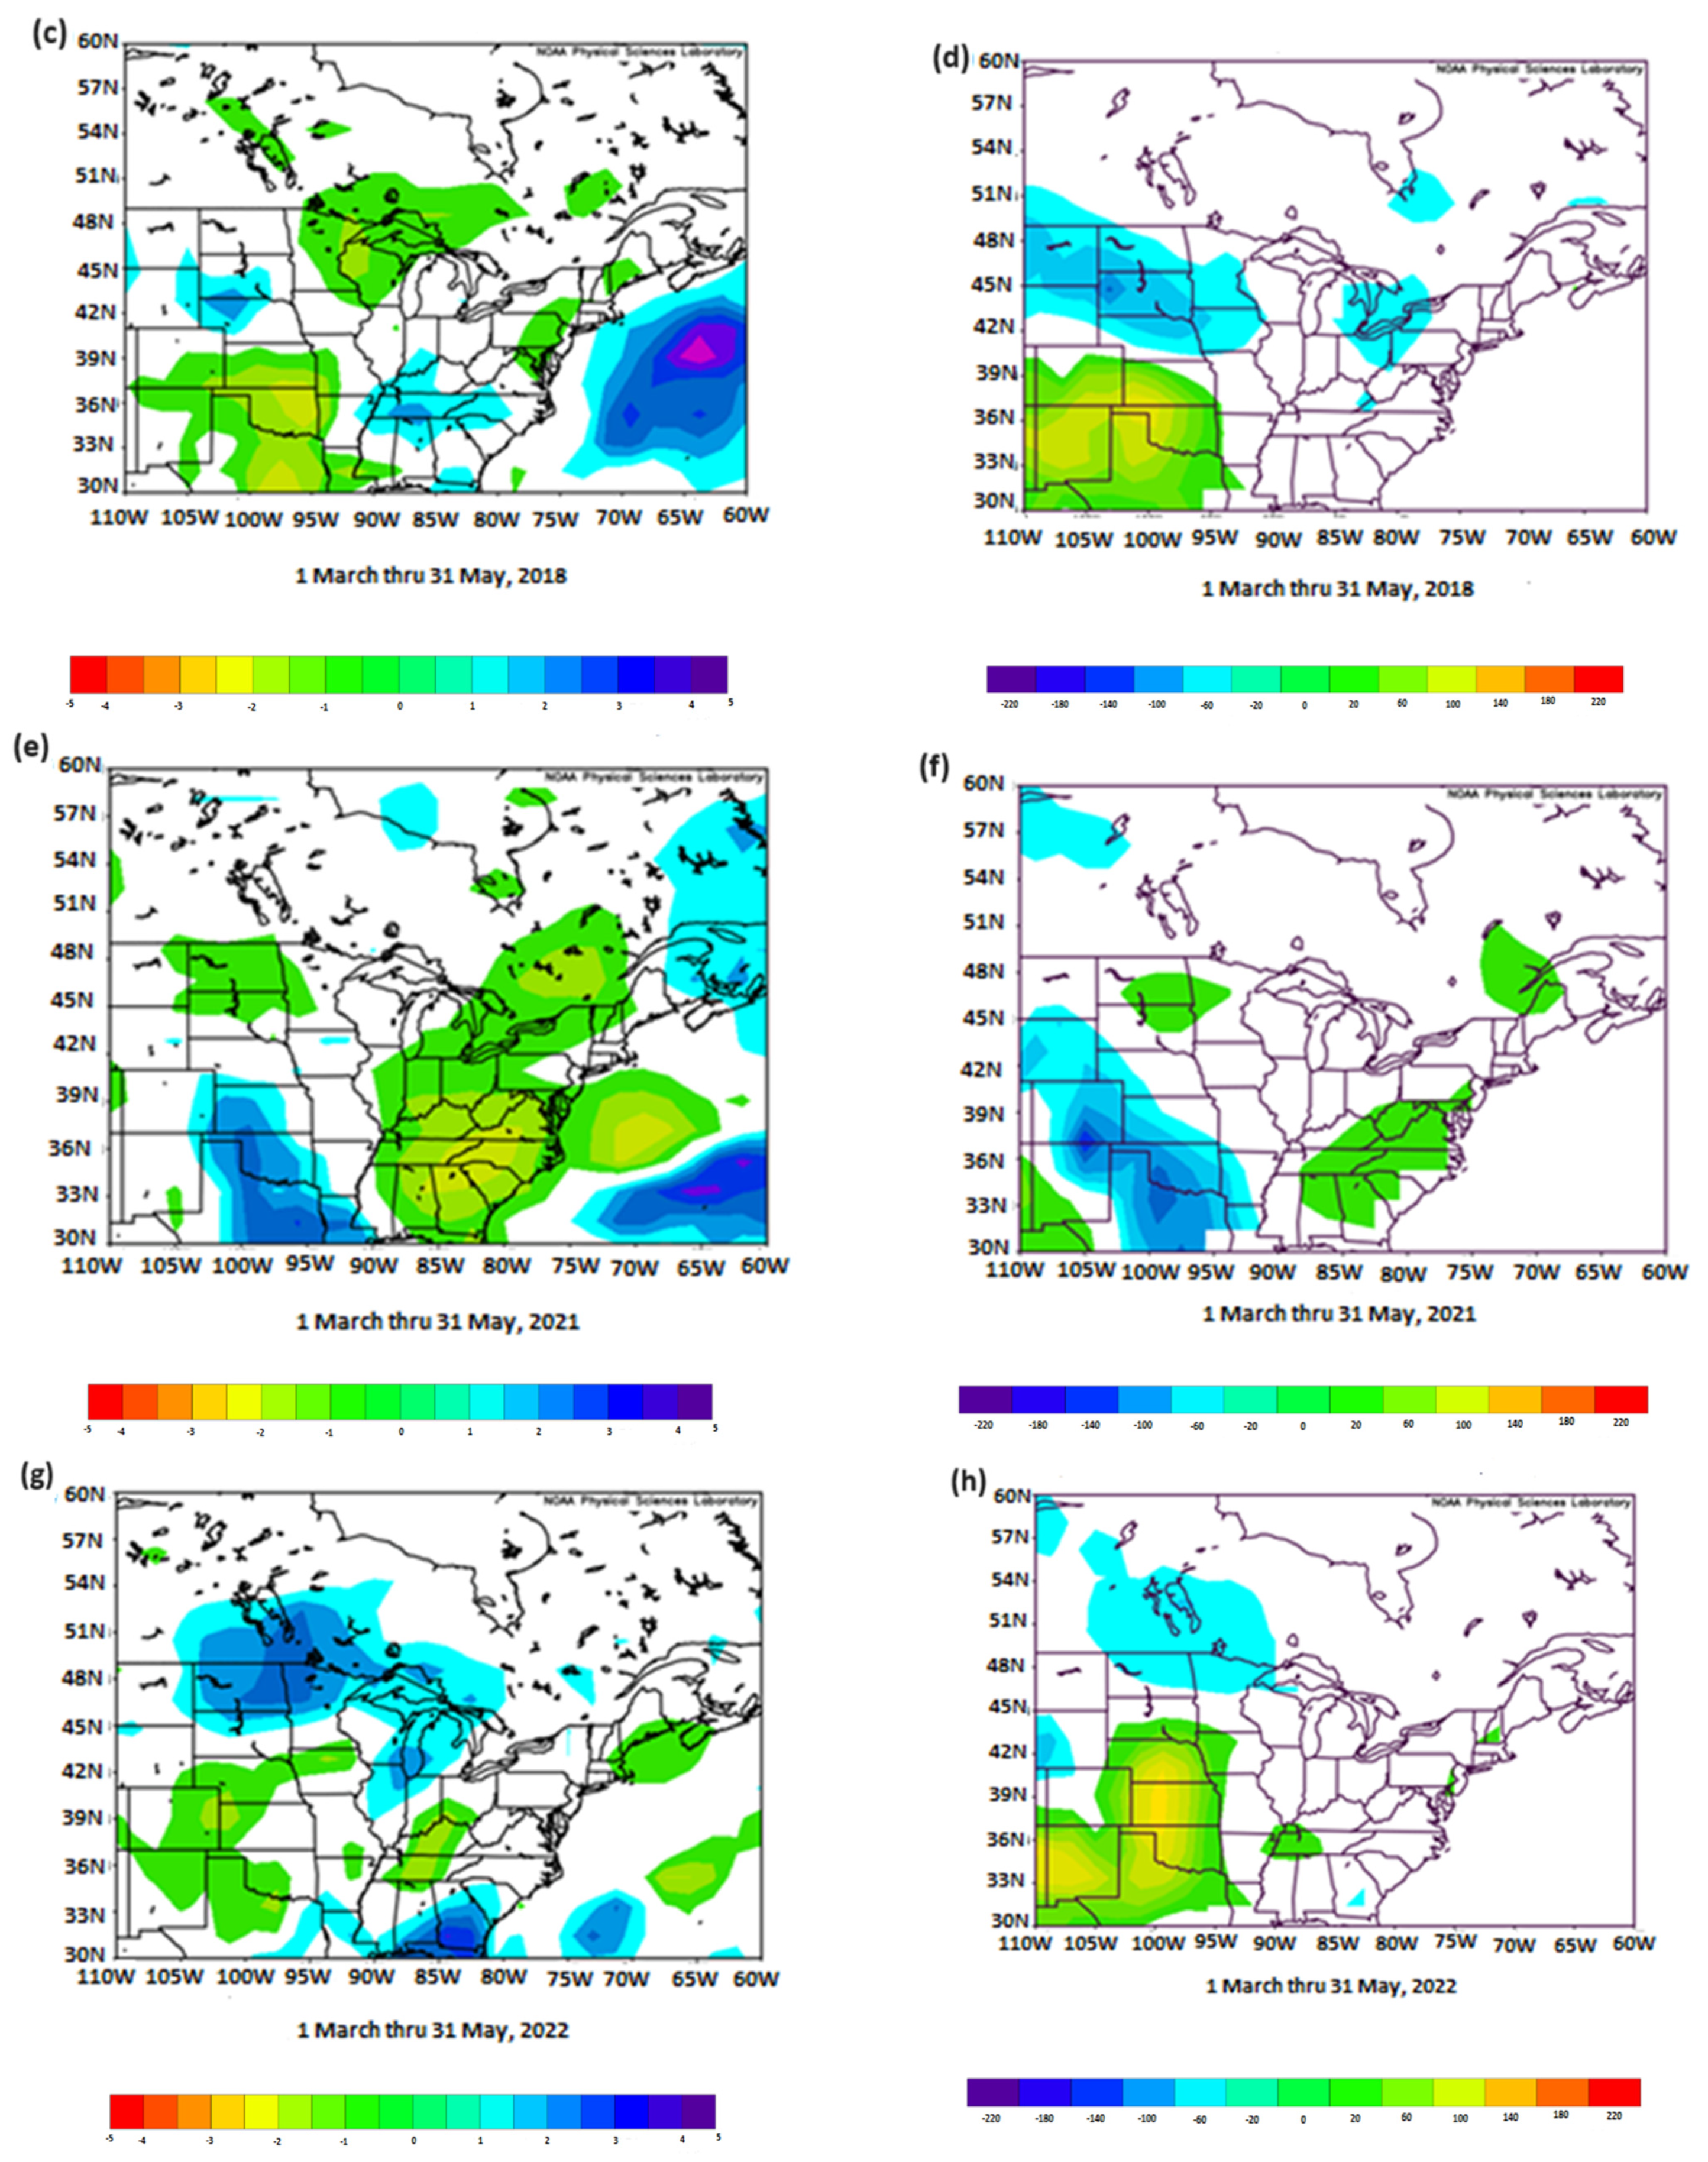
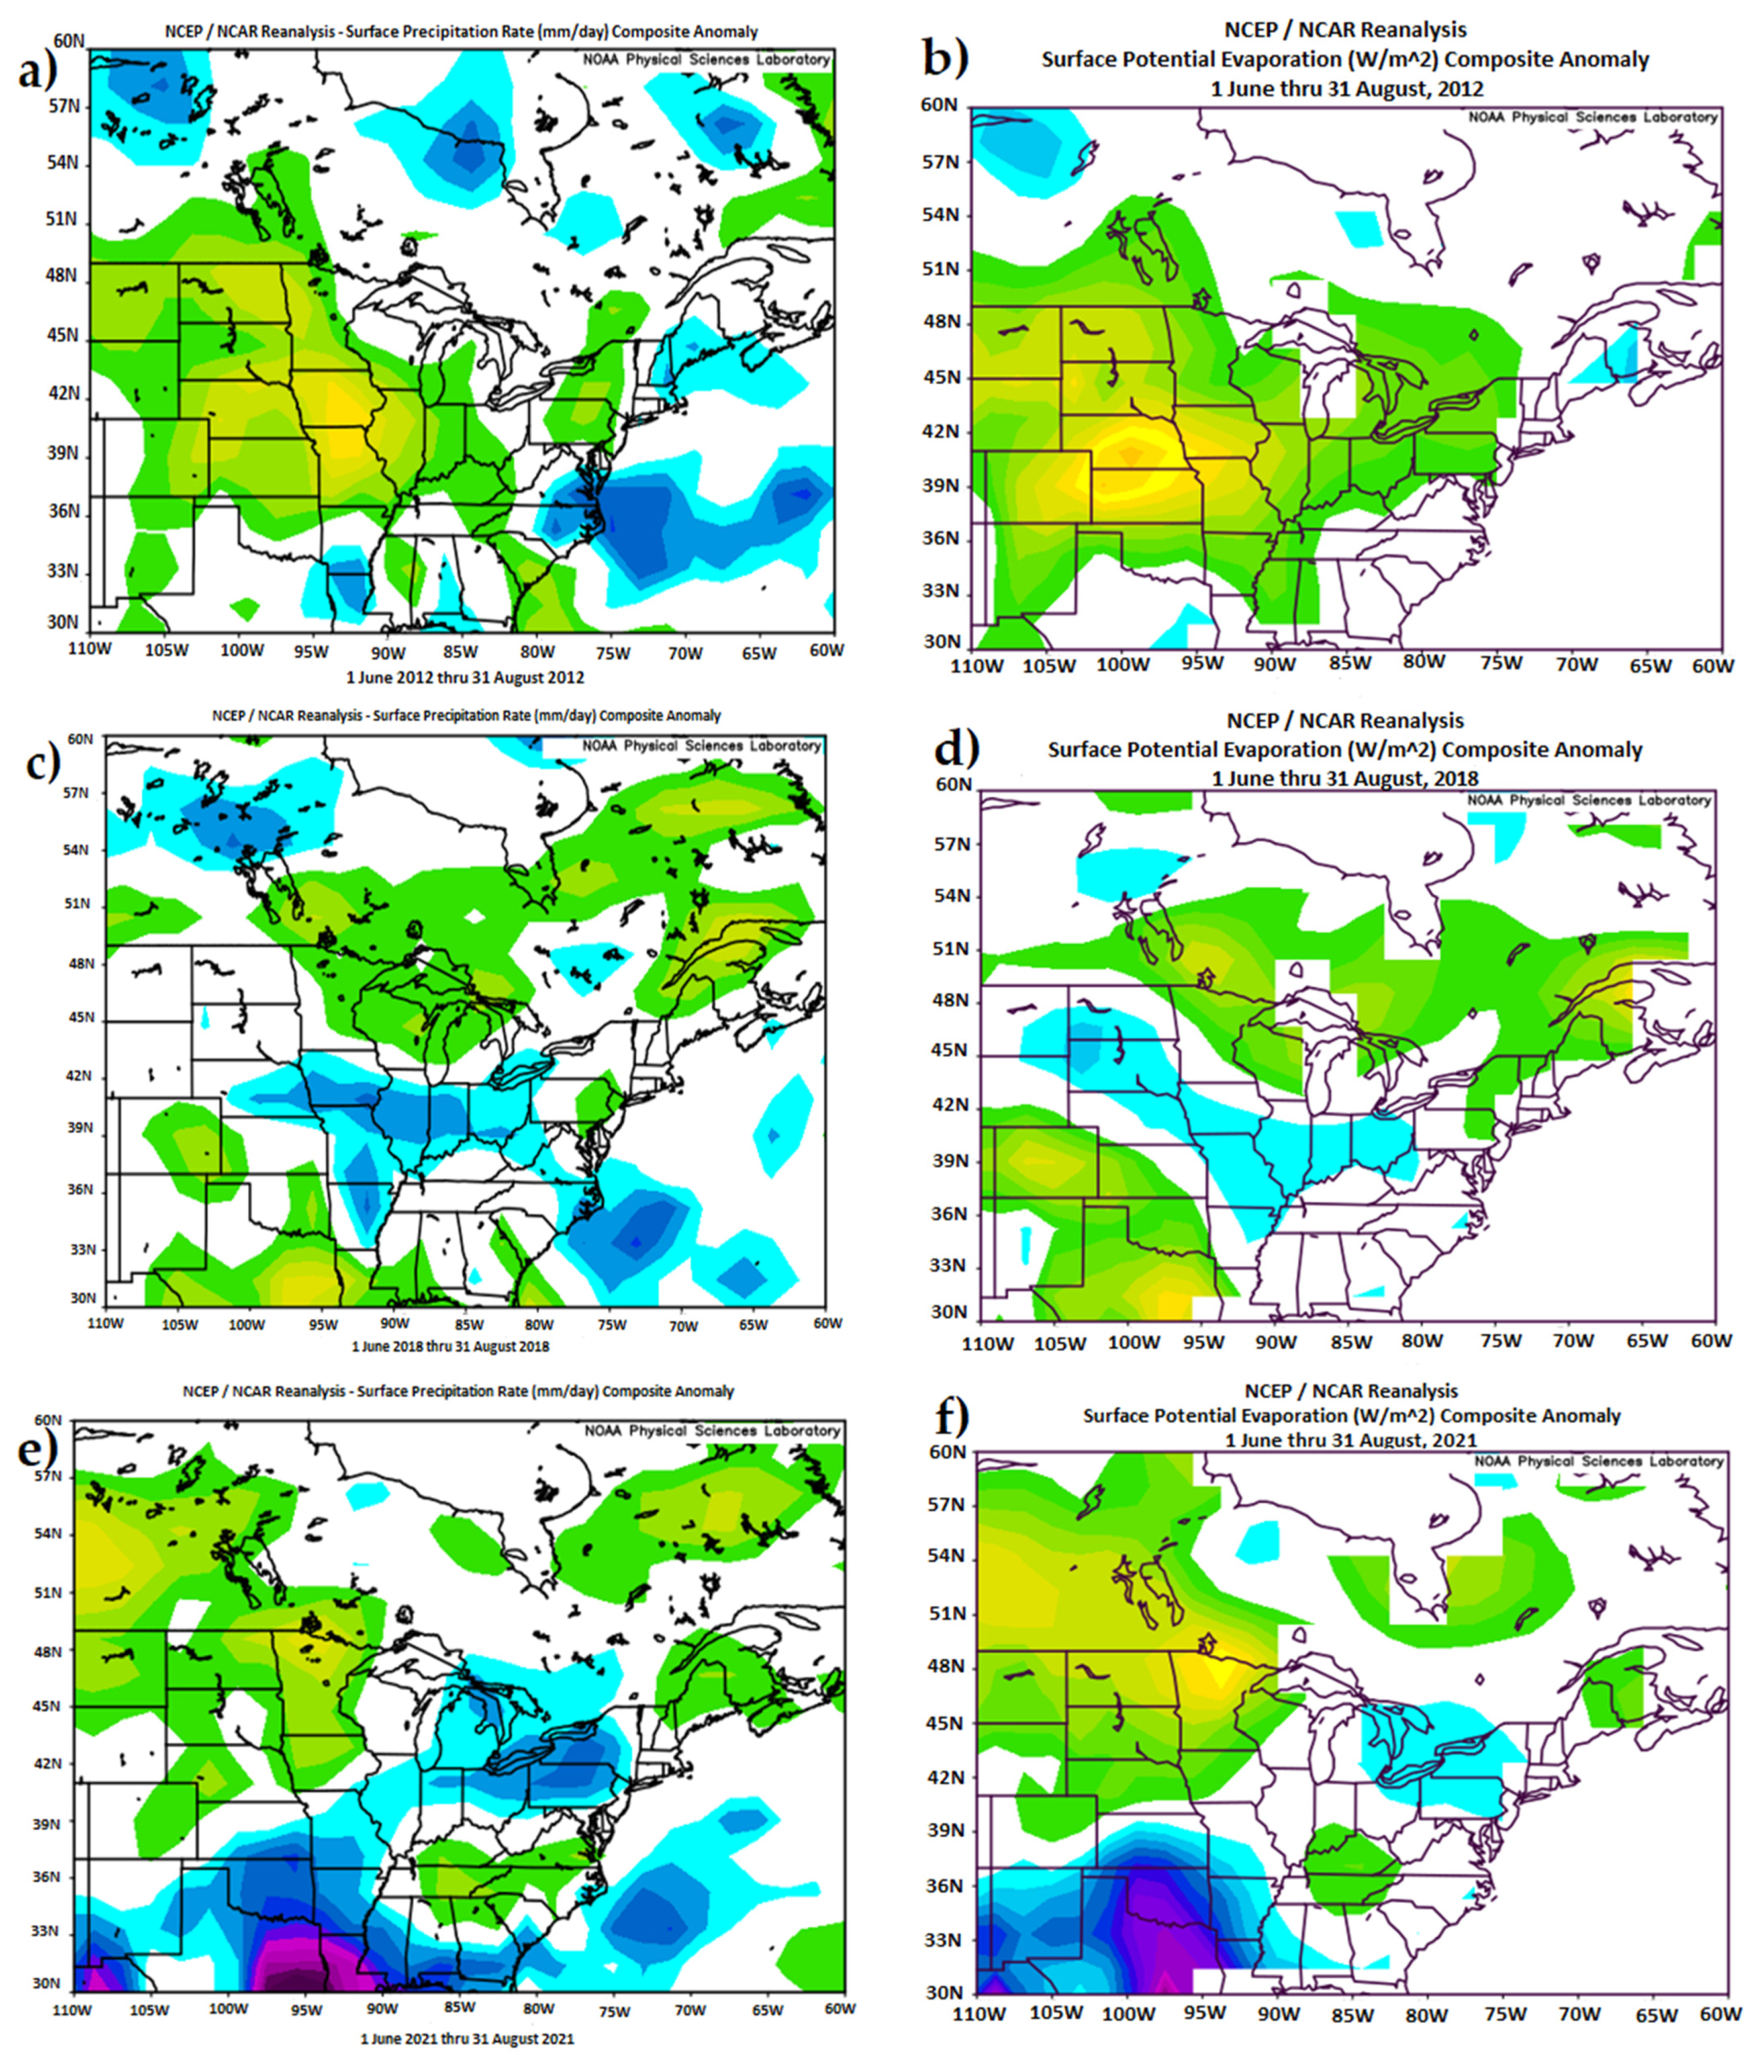
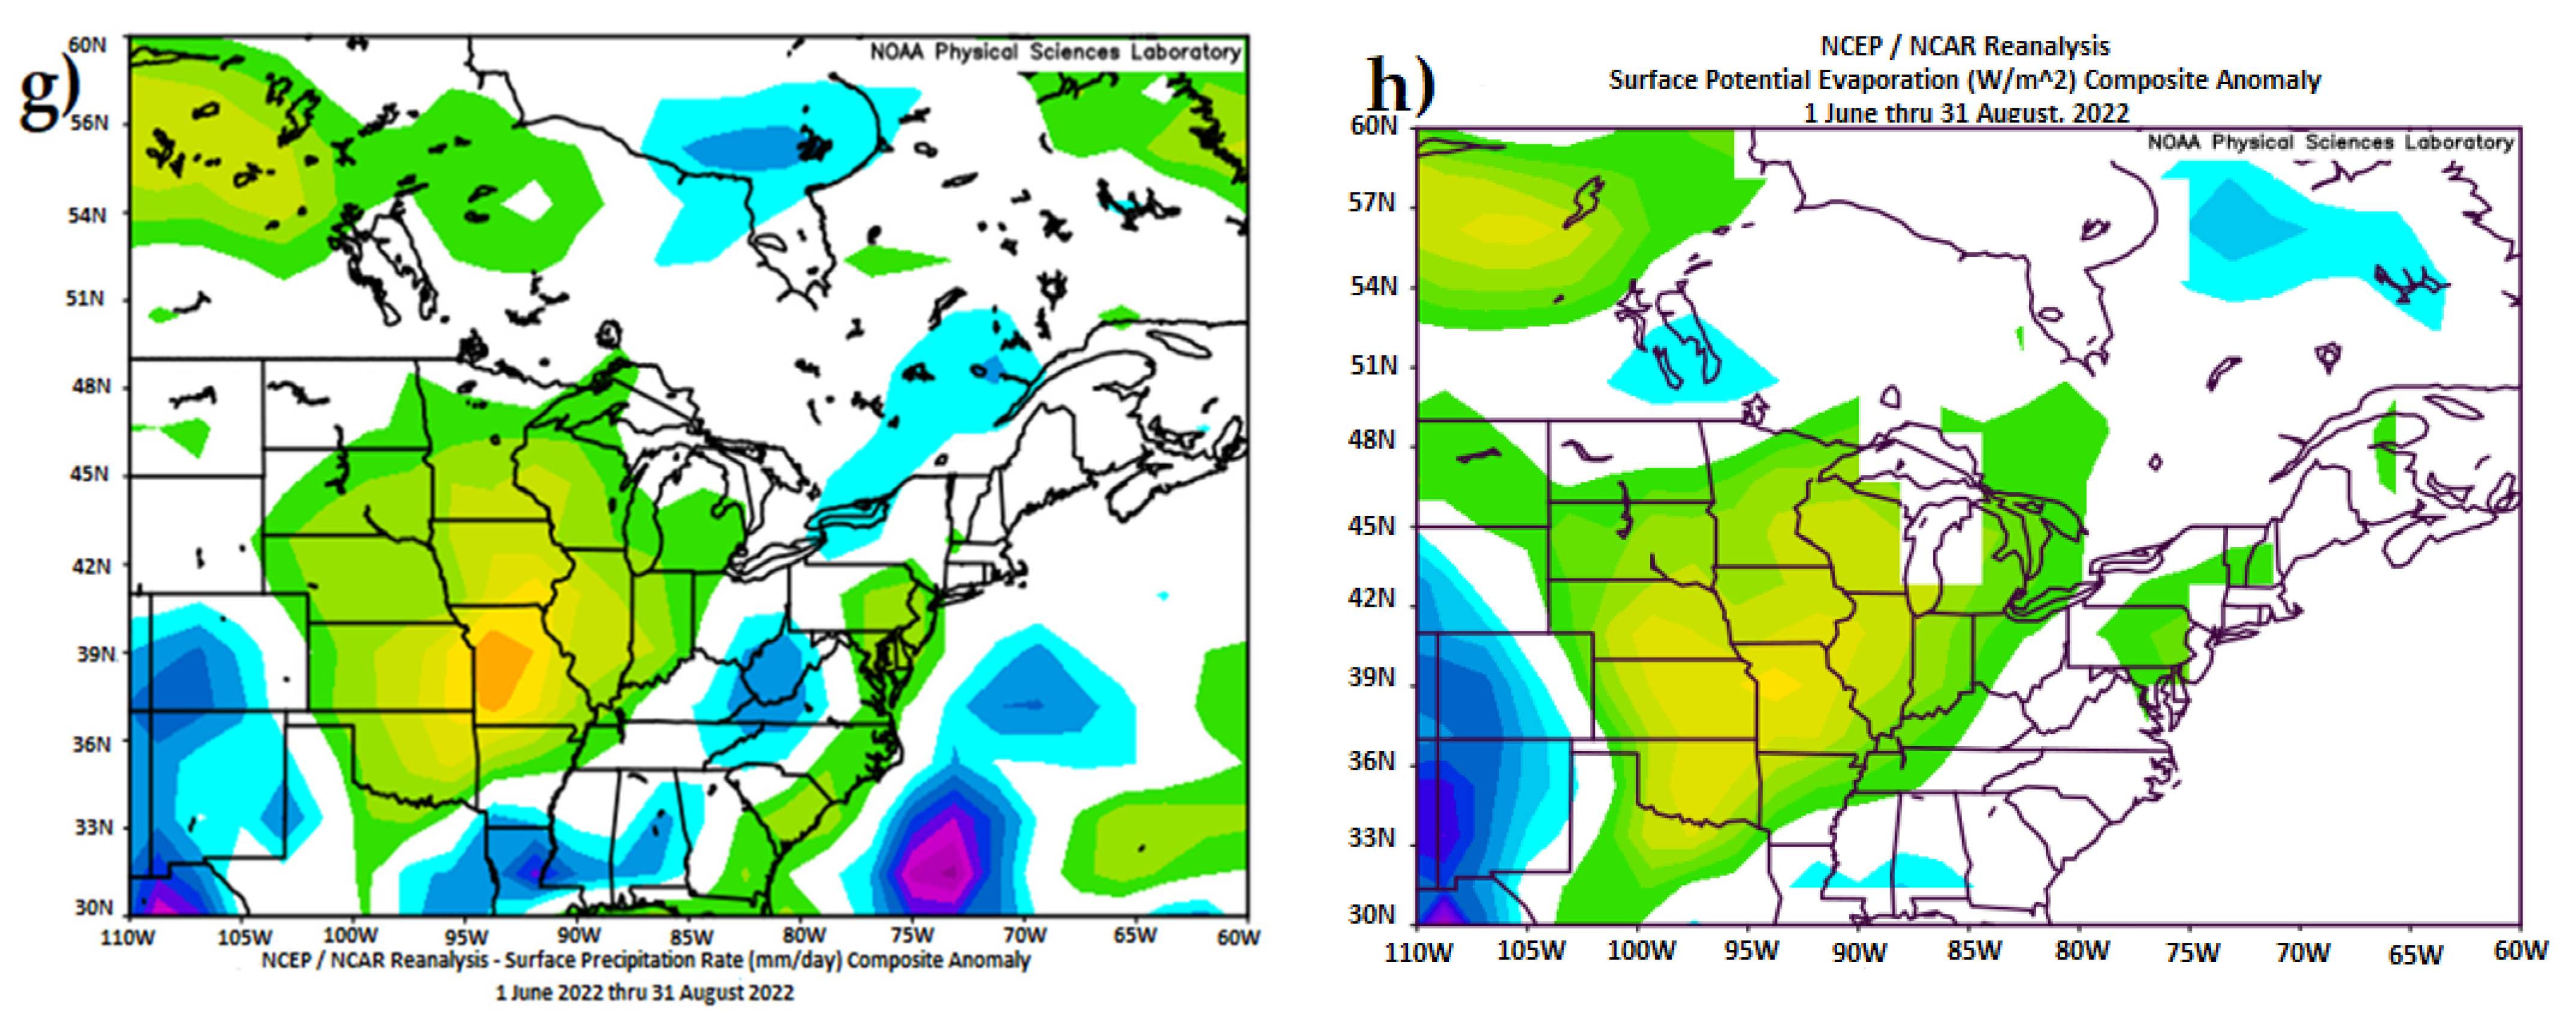
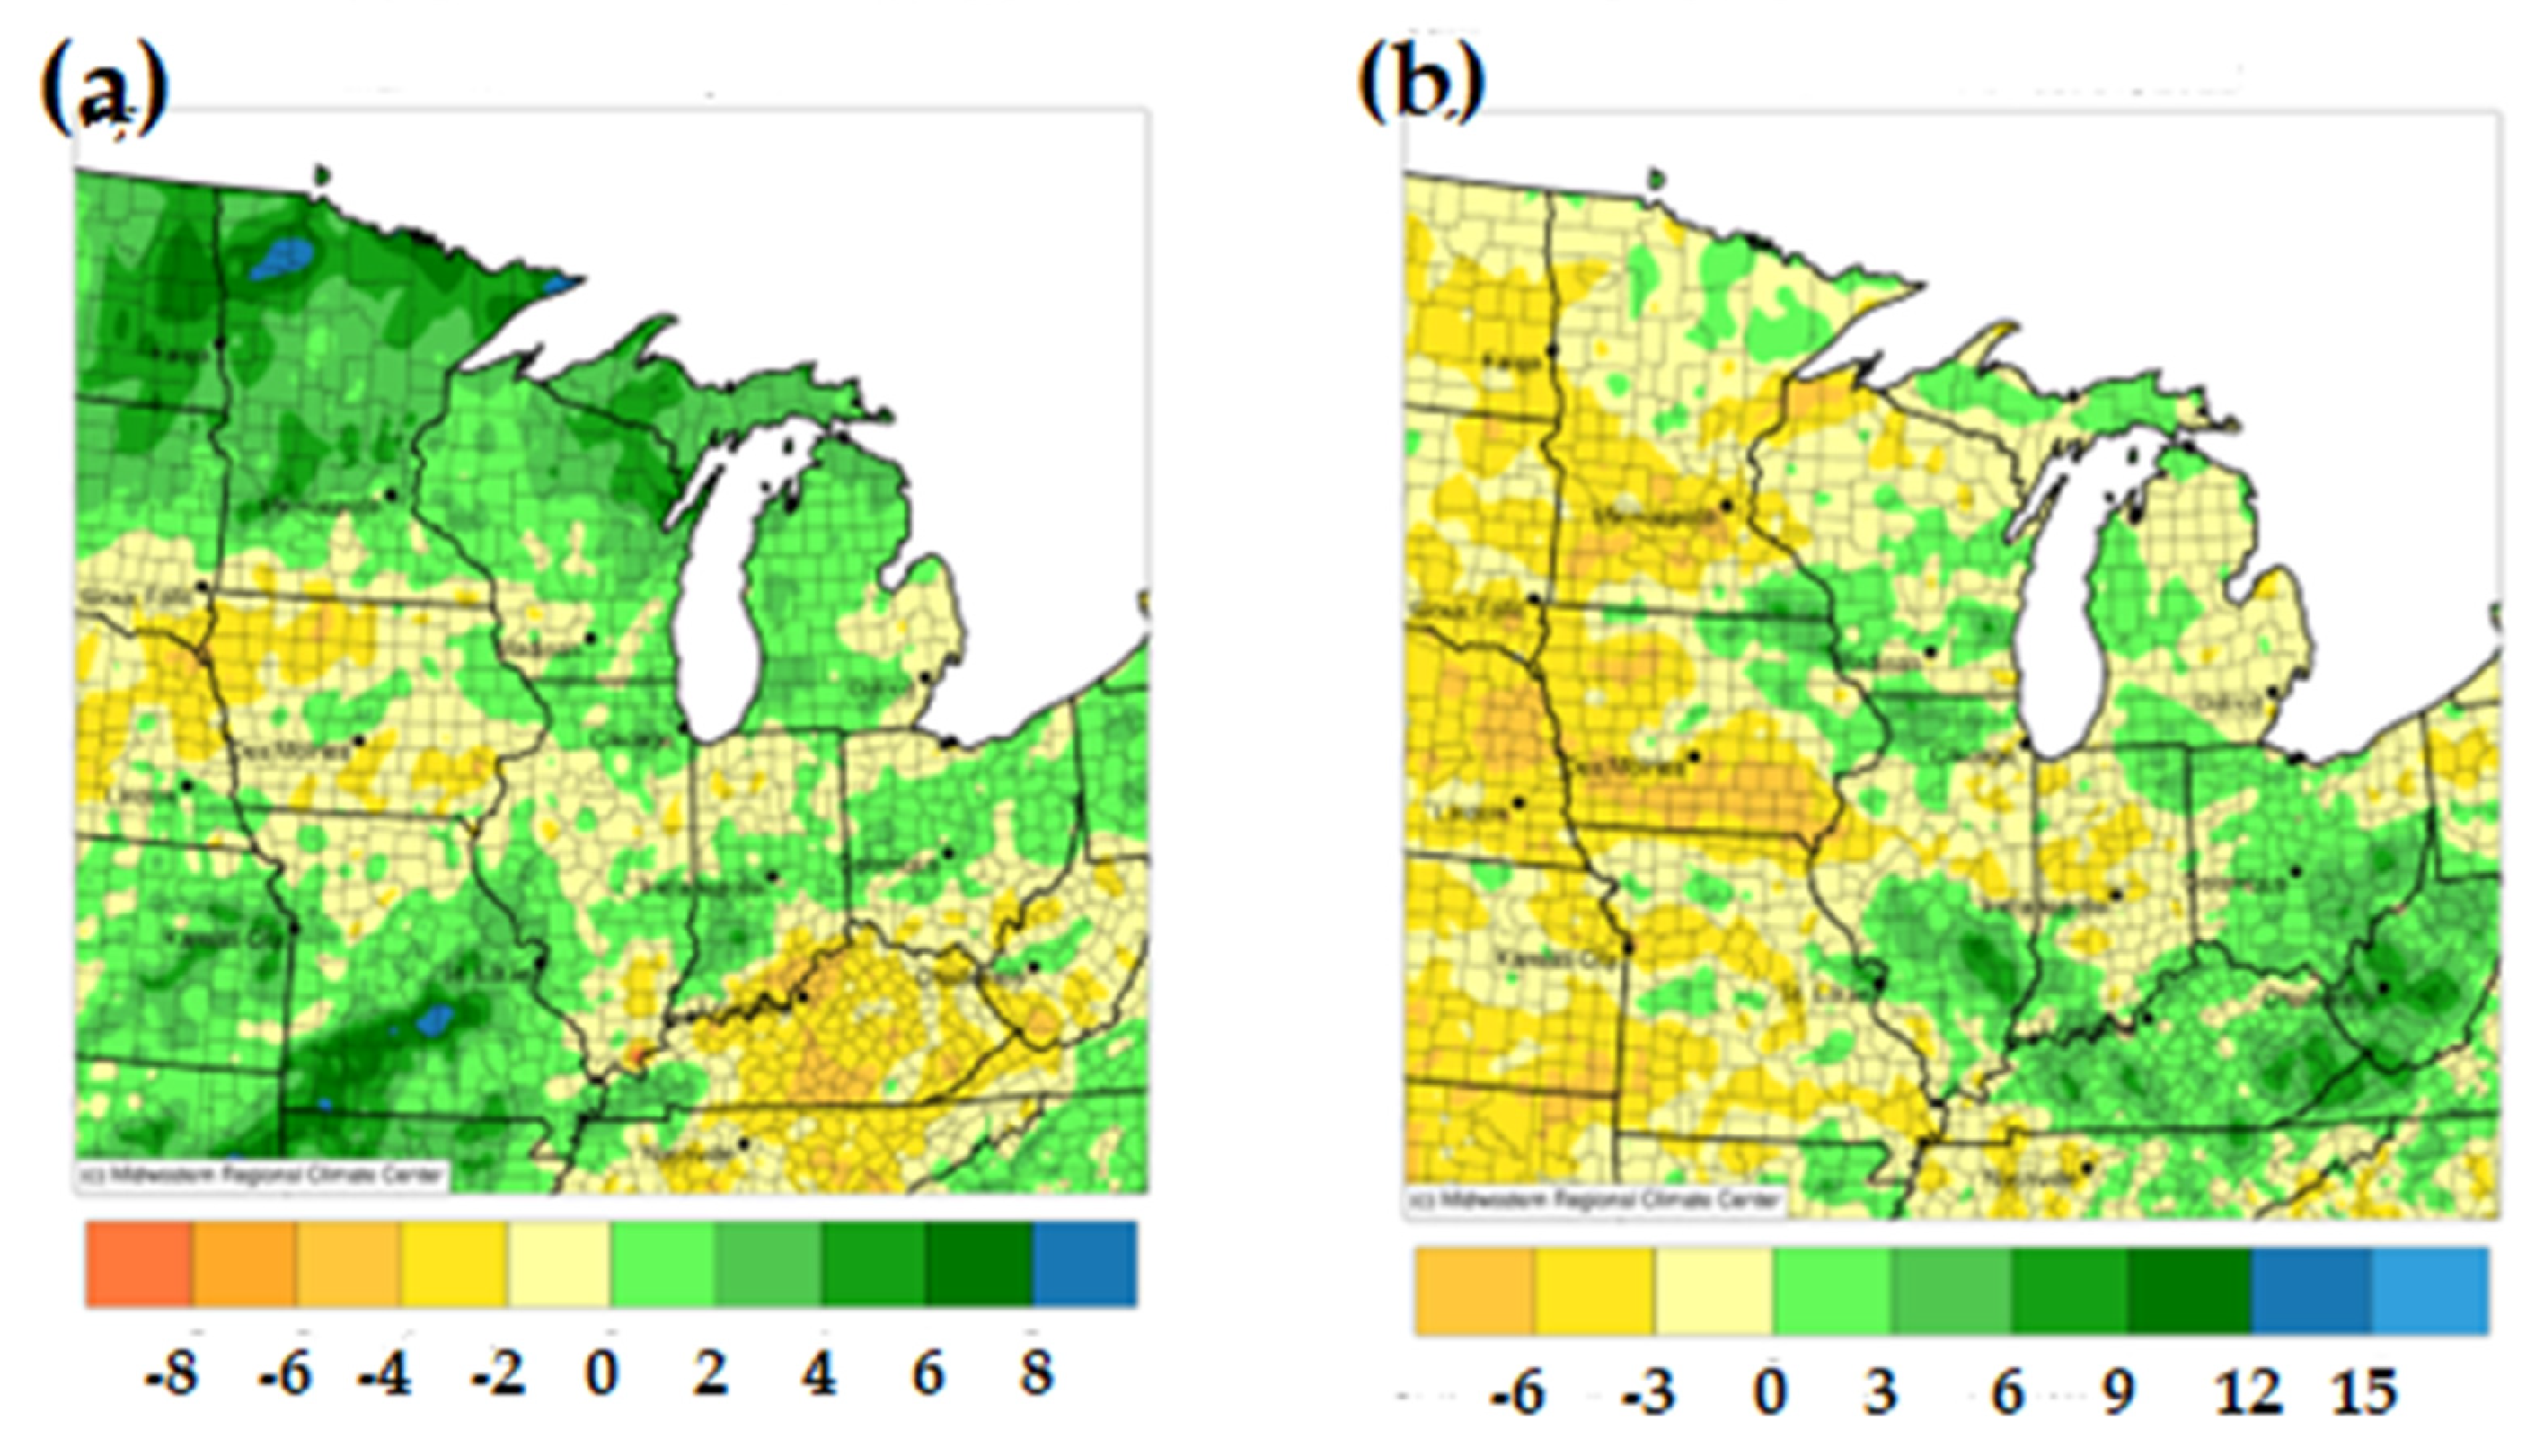
3.4. Precipitation and Surface Potential Evaporation
4. Discussion
5. Conclusions
Author Contributions
Funding
Institutional Review Board Statement
Informed Consent Statement
Data Availability Statement
Acknowledgments
Conflicts of Interest
References
- Intergovernmental Panel on Climate Change (IPCC). Climate Change 2013: The Physical Scientific Basis. 2013. Available online: http://www.ipcc.ch (accessed on 8 June 2021).
- National Weather Service—National Oceanic and Atmospheric Administration. 2022. Available online: https://www.weather.gov/bmx/kidscorner_drought (accessed on 20 December 2022).
- Lupo, A.R.; Kononova, N.K.; Semenova, I.G.; Lebedeva, M.G. A Comparison of the characteristics of extreme drought during the late 20th and early 21st centuries over Eastern Europe, Western Russia, and Central North America. Atmosphere 2021, 12, 1033. [Google Scholar] [CrossRef]
- NOAA—NIDIS, 2022: Defining Drought. Available online: https://www.drought.gov/what-is-drought/drought-basics (accessed on 2 December 2022).
- Ahrens, C.D.; Henson, R. Meteorology Today: An Introduction to Weather, Climate, and the Environment, 11th ed.; Cengage Learning: Boston, MA, USA, 2000. [Google Scholar]
- American Meteorological Society (AMS). Drought. 2013. Available online: https://www2.ametsoc.org/ams/index.cfm/aboutams/ams-statements/statements-of-the-ams-in-force/drought/ (accessed on 28 July 2021).
- Cherenkova, Y.A. Quantitative evaluation of atmospheric drought in federal districts of the European Russia. Proc. Russ. Acad. Sci. Geogr. Ser. 2013, 6, 76–85. (In Russian) [Google Scholar]
- Zuo, D.; Cai, S.; Xu, Z.; Peng, D.; Kan, G.; Sun, W.; Pang, B.; Yang, H. Assessment of meteorological and agricultural droughts using in-situ observations and remote sensing data. Agric. Water Manag. 2019, 222, 129–138. [Google Scholar] [CrossRef]
- Stefanidis, S.; Rossiou, D.; Proutsos, N. Drought severity and trends in a Mediterranean oak forest. Hydrology 2023, 10, 167. [Google Scholar] [CrossRef]
- Mohammadi, B. Modeling various drought time scales via a merged Artificial Neural Network with a Firefly Algorithm. Hydrology 2023, 10, 58. [Google Scholar] [CrossRef]
- Allen, R.A.; Fletcher, R.; Holmboe, J.; Namias, J.; Willett, H.C. Report on an Experiment in Five-Day Weather Forecasting; Massachusetts Institute of Technology and Woods Hole Oceanographic Institution: Woods Hole, MA, USA, 1940. [Google Scholar]
- Namias, J. The great pacific anticyclone of winter 1949–1950: A case study in the evolution of climatic anomalies. J. Meteor. 1951, 8, 251–261. [Google Scholar] [CrossRef]
- Wallace, J.M.; Gutzler, D.S. Teleconnections in the geopotential height field during the Northern Hemisphere winter. Mon. Weather Rev. 1981, 109, 784–812. [Google Scholar] [CrossRef]
- Kung, E.C.; Chern, J.-G. Prevailing anomaly patterns of the global sea surface temperatures and tropospheric responses. Atmosfera 1995, 8, 99–114. [Google Scholar]
- Birk, K.; Lupo, A.R.; Guinan, P.E.; Barbieri, C.E. The interannual variability of midwestern temperatures and precipitation as related to the ENSO and PDO. Atmosfera 2010, 23, 95–128. [Google Scholar]
- Lupo, A.R.; Kelsey, E.P.; Weitlich, D.K.; Davis, N.A.; Market, P.S. Using the monthly classification of global SSTs and 500 hPa height anomalies to predict temperature and precipitation regimes one to two seasons in advance for the mid-Mississippi region. Nat. Weather Dig. 2008, 32, 11–33. [Google Scholar]
- Lupo, A.R.; Mokhov, I.I.; Chendev, Y.G.; Lebedeva, M.G.; Akperov, M.; Hubbart, J.A. Studying summer season drought in Western Russia. Adv. Meteorol. 2014, 2014, 942027. [Google Scholar] [CrossRef]
- Newberry, R.G.; Lupo, A.R.; Jensen, A.D.; Zalipynis, R.A. An analysis of the spring-to-summer transition in the west central plains for application to long range forecasting. Atmos. Clim. Sci. 2016, 6, 375–393. [Google Scholar] [CrossRef]
- Nunes, M.J.; Lupo, A.R.; Lebedeva, M.G.; Chendev, Y.G.; Solovyov, A.B. The occurrence of extreme monthly temperatures and precipitation in two global regions. Pap. Appl. Geog. 2017, 3, 143–156. [Google Scholar] [CrossRef]
- Renken, J.S.; Herman, J.J.; Brandshaw, T.R.; Market, P.S.; Lupo, A.R. The utility of the Bering Sea and East Asia Rules in long-range forecasting. Adv. Meteor. 2017, 2017, 1765428. [Google Scholar] [CrossRef]
- Jiang, X.; Lau, N.-C. Intraseasonal teleconnection between North American and Western North Pacific monsoons with 20-day time scale. J. Clim. 2008, 21, 2664–2679. [Google Scholar] [CrossRef]
- Zhao, P.; Cao, Z.; Chen, J. A summer teleconnection pattern over the extratropical Northern Hemisphere and associated mechanisms. Clim. Dyn. 2010, 35, 523–534. [Google Scholar] [CrossRef]
- Wang, Y.; Lupo, A.R.; Qin, J. A response in the ENSO cycle to an extratropical forcing mechanism during the El Nino to La Nina transition. Tellus Ser. A Dyn. Meteorol. Oceanogr. 2013, 65, 22431. [Google Scholar] [CrossRef]
- Henson, C.B.; Lupo, A.R.; Market, P.S.; Guinan, P.E. ENSO and PDO-related climate variability impacts on Midwestern United States crop yields. Int. J. Biometeorol. 2017, 61, 857–867. [Google Scholar] [CrossRef]
- Cherenkova, E.; Semenova, I.; Bardin, M.; Zolotokrylin, A.N. Drought and grain crop yields over the East European Plain under influence of quasibiennial oscillation of global atmospheric processes. Int. J. Atmos. Sci. 2015, 2015, 932474. [Google Scholar] [CrossRef]
- Athar, H.; Lupo, A.R. Scale and stability analysis of blocking events from 2002–2004: A case study of an unusually persistent blocking event leading to a heat wave in the Gulf of Alaska during August 2004. Adv. Meteor. 2010, 2010, 610263. [Google Scholar] [CrossRef]
- Jensen, A.D.; Lupo, A.R.; Mokhov, I.I.; Akperov, M.G.; Reynolds, D.D. Integrated regional enstrophy and block intensity as a measure of Kolmogorov Entropy. Atmosphere 2017, 8, 237. [Google Scholar] [CrossRef]
- Jensen, A.; Lupo, A.R.; Mokhov, I.I.; Akperov, M.G.; Sun, F. The dynamic character of Northern Hemisphere flow regimes in a near term climate change projection. Atmosphere 2018, 9, 27. [Google Scholar] [CrossRef]
- Klaus, E.M.; Market, P.S.; Lupo, A.R.; Bodner, M.J.; Kastman, J.S. Projecting Northern Hemisphere flow regime transition using integrated enstrophy. Atmosphere 2000, 11, 915. [Google Scholar] [CrossRef]
- Est, M.A.; Mount, S.; Steward, C.A.; Lebedeva, M.G.; Lupo, A.R. Northern Hemisphere flow regime transitions, blocking, and the onset of spring in the central USA. Meteorology 2022, 1, 19. [Google Scholar]
- NOAA Physical Sciences Laboratory: NCEP—NCAR Reanalysis. 2022. Available online: https://psl.noaa.gov/data/gridded/data.ncep.reanalysis.html (accessed on 20 December 2022).
- Kalnay, E.; Kanamitsu, M.; Kisler, R.; Collins, W.; Deaven, D.; Gandin, L.; Iredell, M.; Saha, S.; White, G.; Woolen, J.; et al. The NCEP/NCAR 40-year reanalysis project. Bull. Am. Meteorol. Soc. 1996, 77, 437–471. [Google Scholar] [CrossRef]
- Kistler, R.; Kalnay, E.; Collins, W.; Saha, S.; White, G.; Wollen, J.; Chelliah, M.; Ebisuzaki, W.; Kanamistu, M.; Kousky, V.; et al. The NCEP-NCAR 50-year reanalyses: Monthly means CD-ROM and documentation. Bull. Am. Meteorol. Soc. 2001, 82, 247–268. [Google Scholar] [CrossRef]
- Bao, X.; Zhang, F. Evaluation of NCEP-CFSR, NCEP-NCAR, ERA-interim, and ERA-40 reanalysis datasets against independent sounding observations over the Tibetan Plateau. J. Clim. 2013, 26, 206–214. [Google Scholar] [CrossRef]
- He, W.-P.; Zhao, S.-S. Assessment of the quality of NCEP-2 and CFSR reanalysis daily temperature in China based on long-range correlation. Clim. Dyn. 2018, 50, 493–505. [Google Scholar] [CrossRef]
- University of Missouri Blocking Archive. 2022. Available online: http://weather.missouri.edu/gcc/ (accessed on 2 November 2022).
- Lupo, A.R. Atmospheric Blocking Events: A Review. Ann. N. Y. Acad. Sci. 2020, 1504, 5–24. [Google Scholar] [CrossRef]
- Lupo, A.R.; Jensen, A.D.; Mokhov, I.I.; Timazhev, A.V.; Eichler, T.; Efe, B. Changes in global blocking character during the most recent decades. Atmosphere 2019, 10, 92. [Google Scholar] [CrossRef]
- Mappr, 2023: United States Regions Map. Available online: https://www.mappr.co/political-maps/us-regions-map/ (accessed on 1 September 2023).
- NCDC—NOAA: June–August 2012 Statewide Ranks—Precipitation. Available online: https://www.ncdc.noaa.gov/sotc/service/national/Statewideprank/201206-201208.gif (accessed on 20 December 2022).
- NCDC—NOAA: June–August 2012 Statewide Ranks—Temperature. Available online: https://www.ncdc.noaa.gov/sotc/service/national/Statewidetrank/201206-201208.gif (accessed on 20 December 2022).
- National Centers for Environmental Information: Annual 2012 National Climate Report. Available online: https://www.ncdc.noaa.gov/sotc/national/201213 (accessed on 20 December 2022).
- NCDC—NOAA: January–December 2012 Statewide Ranks—Precipitation. Available online: https://www.ncdc.noaa.gov/sotc/service/national/Statewideprank/201201-201212.gif (accessed on 20 December 2022).
- NCDC—NOAA: January–December 2012 Statewide Ranks—Temperature. Available online: https://www.ncdc.noaa.gov/sotc/service/national/Statewidetrank/201201-201212.gif (accessed on 20 December 2022).
- National Centers for Environmental Information: Annual 2018 National Climate Report. Available online: https://www.ncei.noaa.gov/access/monitoring/monthly-report/national/201813 (accessed on 5 January 2023).
- National Centers for Environmental Information: Annual 2021 National Climate Report. Available online: https://www.ncei.noaa.gov/access/monitoring/monthly-report/national/202113 (accessed on 5 January 2023).
- National Center for Environmental Information: Annual 2022 National Climate Report. Available online: https://www.ncei.noaa.gov/access/monitoring/monthly-report/national/202213 (accessed on 5 January 2023).
- U.S. Drought Monitor Maps. 2023. Available online: https://droughtmonitor.unl.edu/CurrentMap.aspx (accessed on 23 June 2023).
- Lebedeva, M.G.; Lupo, A.R.; Chendev, Y.G.; Krymskaya, O.V.; Solovyev, A.B. Changes in the atmospheric circulation conditions and regional climatic characteristics in two remote regions since the mid-20th century. Atmosphere 2019, 10, 11. [Google Scholar] [CrossRef]
- National Weather Service—Climate Prediction Center, 2022: AAO, AO, NAO, PNA. Available online: https://www.cpc.ncep.noaa.gov/products/precip/CWlink/daily_ao_index/teleconnections.shtml (accessed on 30 December 2022).
- American Meteorological Society—Glossary of Meteorology: Enstrophy. Available online: https://glossary.ametsoc.org/wiki/Enstrophy (accessed on 10 May 2023).
- National Hurricane Center (USA). 2023. Available online: https://www.nhc.noaa.gov/data/ (accessed on 22 June 2023).
- Bonacci, O.; Bonacci, D.; Bonacci, T.R.; Vrsalovic, A. Proposal of a new method for drought analysis. J. Hydrol. Hydromech. 2023, 71, 100–110. [Google Scholar] [CrossRef]
- Mitra, S.; Srivastava, P. Spatiotemporal variability of meteorological droughts in southeastern USA. Nat. Hazards 2017, 86, 1007–1038. [Google Scholar] [CrossRef]
- Barnard, D.M.; Germino, M.J.; Bradford, J.B.; O’Connor, R.C.; Andrews, C.M.; Shriver, R.K. Are drought indices and climate data good indicators of ecologically relevant soil moisture dynamics in drylands? Ecol. Indic. 2021, 133, 108379. [Google Scholar] [CrossRef]
- Midwest Regional Climate Center. 2023. Available online: https://mrcc.purdue.edu/CLIMATE/index.jsp (accessed on 28 June 2023).
- Lupo, A.R.; Smith, N.B.; Guinan, P.E.; Chesser, M.D. The climatology of Missouri region dew points and the relationship to ENSO. Nat. Weather Dig. 2012, 36, 82–91. [Google Scholar]
- Kahya, E.; Dracup, J.A. U.S. streamflow patterns in relation to the El Niño/Southern Oscillation. Water Resour. Res. 1993, 29, 2491–2503. [Google Scholar] [CrossRef]
- Dracup, J.A.; Kahya, E. The relationships between US streamflow and La Niña events. Water Resour. Res. 1994, 30, 2133–2141. [Google Scholar] [CrossRef]
- Ting, M.; Wang, H. Summertime U.S. Precipitation Variability and Its Relation to Pacific Sea Surface Temperature. J. Clim. 1997, 10, 1853–1873. [Google Scholar] [CrossRef]
- Mo, K.C.; Schemm, J.E. Relationships between ENSO and drought over the southeastern United States. Geophys. Res. Lett. 2008, 35, L15701. [Google Scholar] [CrossRef]
- Mo, K.C.; Schemm, J.E. Drought and persistent wet spells over the United States and Mexico. J. Clim. 2008, 21, 980–994. [Google Scholar] [CrossRef]
- Rajagopalan, B.; Cook, E.; Lall, U.; Ray, B.K. Spatiotemporal Variability of ENSO and SST Teleconnections to Summer Drought over the United States during the Twentieth Century. J. Clim. 2000, 13, 4244–4255. [Google Scholar] [CrossRef]


| Year | P–E Anomaly | %Area | Col. 2 × 3 | ENSO Phase | Transition | Precursor |
|---|---|---|---|---|---|---|
| 2012 | −9.0 | 0.30 | −2.7 | NEU | NEU—NEU | Yes |
| 2018 | −6.6 | 0.10 | −0.7 | LA | LA—NEU | N/A |
| 2021 | −6.5 | 0.15 | −1.0 | LA | LA—LA | N/A |
| 2022 | −9.0 | 0.35 | −3.2 | LA | LA—LA | No |
| Year | AO | NAO | PNA |
|---|---|---|---|
| 2012 | 0.39/−0.15 | 0.28/−1.61 | −0.05/−0.28 |
| 2018 | 0.26/0.61 | 0.81/1.48 | −1.05/0.47 |
| 2021 | 0.58/0.42 | −0.65/0.17 | −1.12/0.73 |
| 2022 | 0.29/−0.08 | 0.37/0.42 | −0.48/1.01 |
| Year | AO/NAO | NAO/PNA | PNA/AO |
|---|---|---|---|
| 2012 | 0.46 | −0.17 | −0.23 |
| 2018 | 0.61 | 0.32 | 0.26 |
| 2021 | 0.65 | 0.49 | 0.01 |
| 2022 | 0.62 | −0.25 | −0.21 |
| Year | Blocking Events | Days | Block Intensity (BI) |
|---|---|---|---|
| 2012 | 0/0 | 0.0/0.0 | NA/NA |
| 2018 | 1/2 | 9.0/14.0 | 4.24/2.69 |
| 2021 | 4/3 | 34.5/24.5 | 2.78/2.28 |
| 2022 | 6/1 | 52.5/20.5 | 3.00/2.13 |
| Year | MCI | COU | STL | SGF |
|---|---|---|---|---|
| 2012 | −4.78/−3.79 | −2.92/−3.26 | −3.88/−2.80 | −3.37/−2.30 |
| 2018 | −1.17/−0.92 | −1.32/−2.22 | 0.64/−1.20 | −1.46/−0.84 |
| 2021 | −0.47/−0.81 | 0.85/0.95 | −0.89/0.44 | 1.48/−0.69 |
| 2022 | 0.47/−1.95 | 0.36/−2.04 | −0.41/0.98 | 1.53/−1.93 |
Disclaimer/Publisher’s Note: The statements, opinions and data contained in all publications are solely those of the individual author(s) and contributor(s) and not of MDPI and/or the editor(s). MDPI and/or the editor(s) disclaim responsibility for any injury to people or property resulting from any ideas, methods, instructions or products referred to in the content. |
© 2023 by the authors. Licensee MDPI, Basel, Switzerland. This article is an open access article distributed under the terms and conditions of the Creative Commons Attribution (CC BY) license (https://creativecommons.org/licenses/by/4.0/).
Share and Cite
Weaver, S.M.; Guinan, P.E.; Semenova, I.G.; Aloysius, N.; Lupo, A.R.; Hunt, S. A Case Study of Drought during Summer 2022: A Large-Scale Analyzed Comparison of Dry and Moist Summers in the Midwest USA. Atmosphere 2023, 14, 1448. https://doi.org/10.3390/atmos14091448
Weaver SM, Guinan PE, Semenova IG, Aloysius N, Lupo AR, Hunt S. A Case Study of Drought during Summer 2022: A Large-Scale Analyzed Comparison of Dry and Moist Summers in the Midwest USA. Atmosphere. 2023; 14(9):1448. https://doi.org/10.3390/atmos14091448
Chicago/Turabian StyleWeaver, Sarah M., Patrick E. Guinan, Inna G. Semenova, Noel Aloysius, Anthony R. Lupo, and Sherry Hunt. 2023. "A Case Study of Drought during Summer 2022: A Large-Scale Analyzed Comparison of Dry and Moist Summers in the Midwest USA" Atmosphere 14, no. 9: 1448. https://doi.org/10.3390/atmos14091448