


Investigating the Relationship of Outdoor Heat Stress upon Indoor Thermal Comfort and Qualitative Sleep Evaluation: The Case of Ankara


Abstract
:1. Introduction
2. Materials and Methods
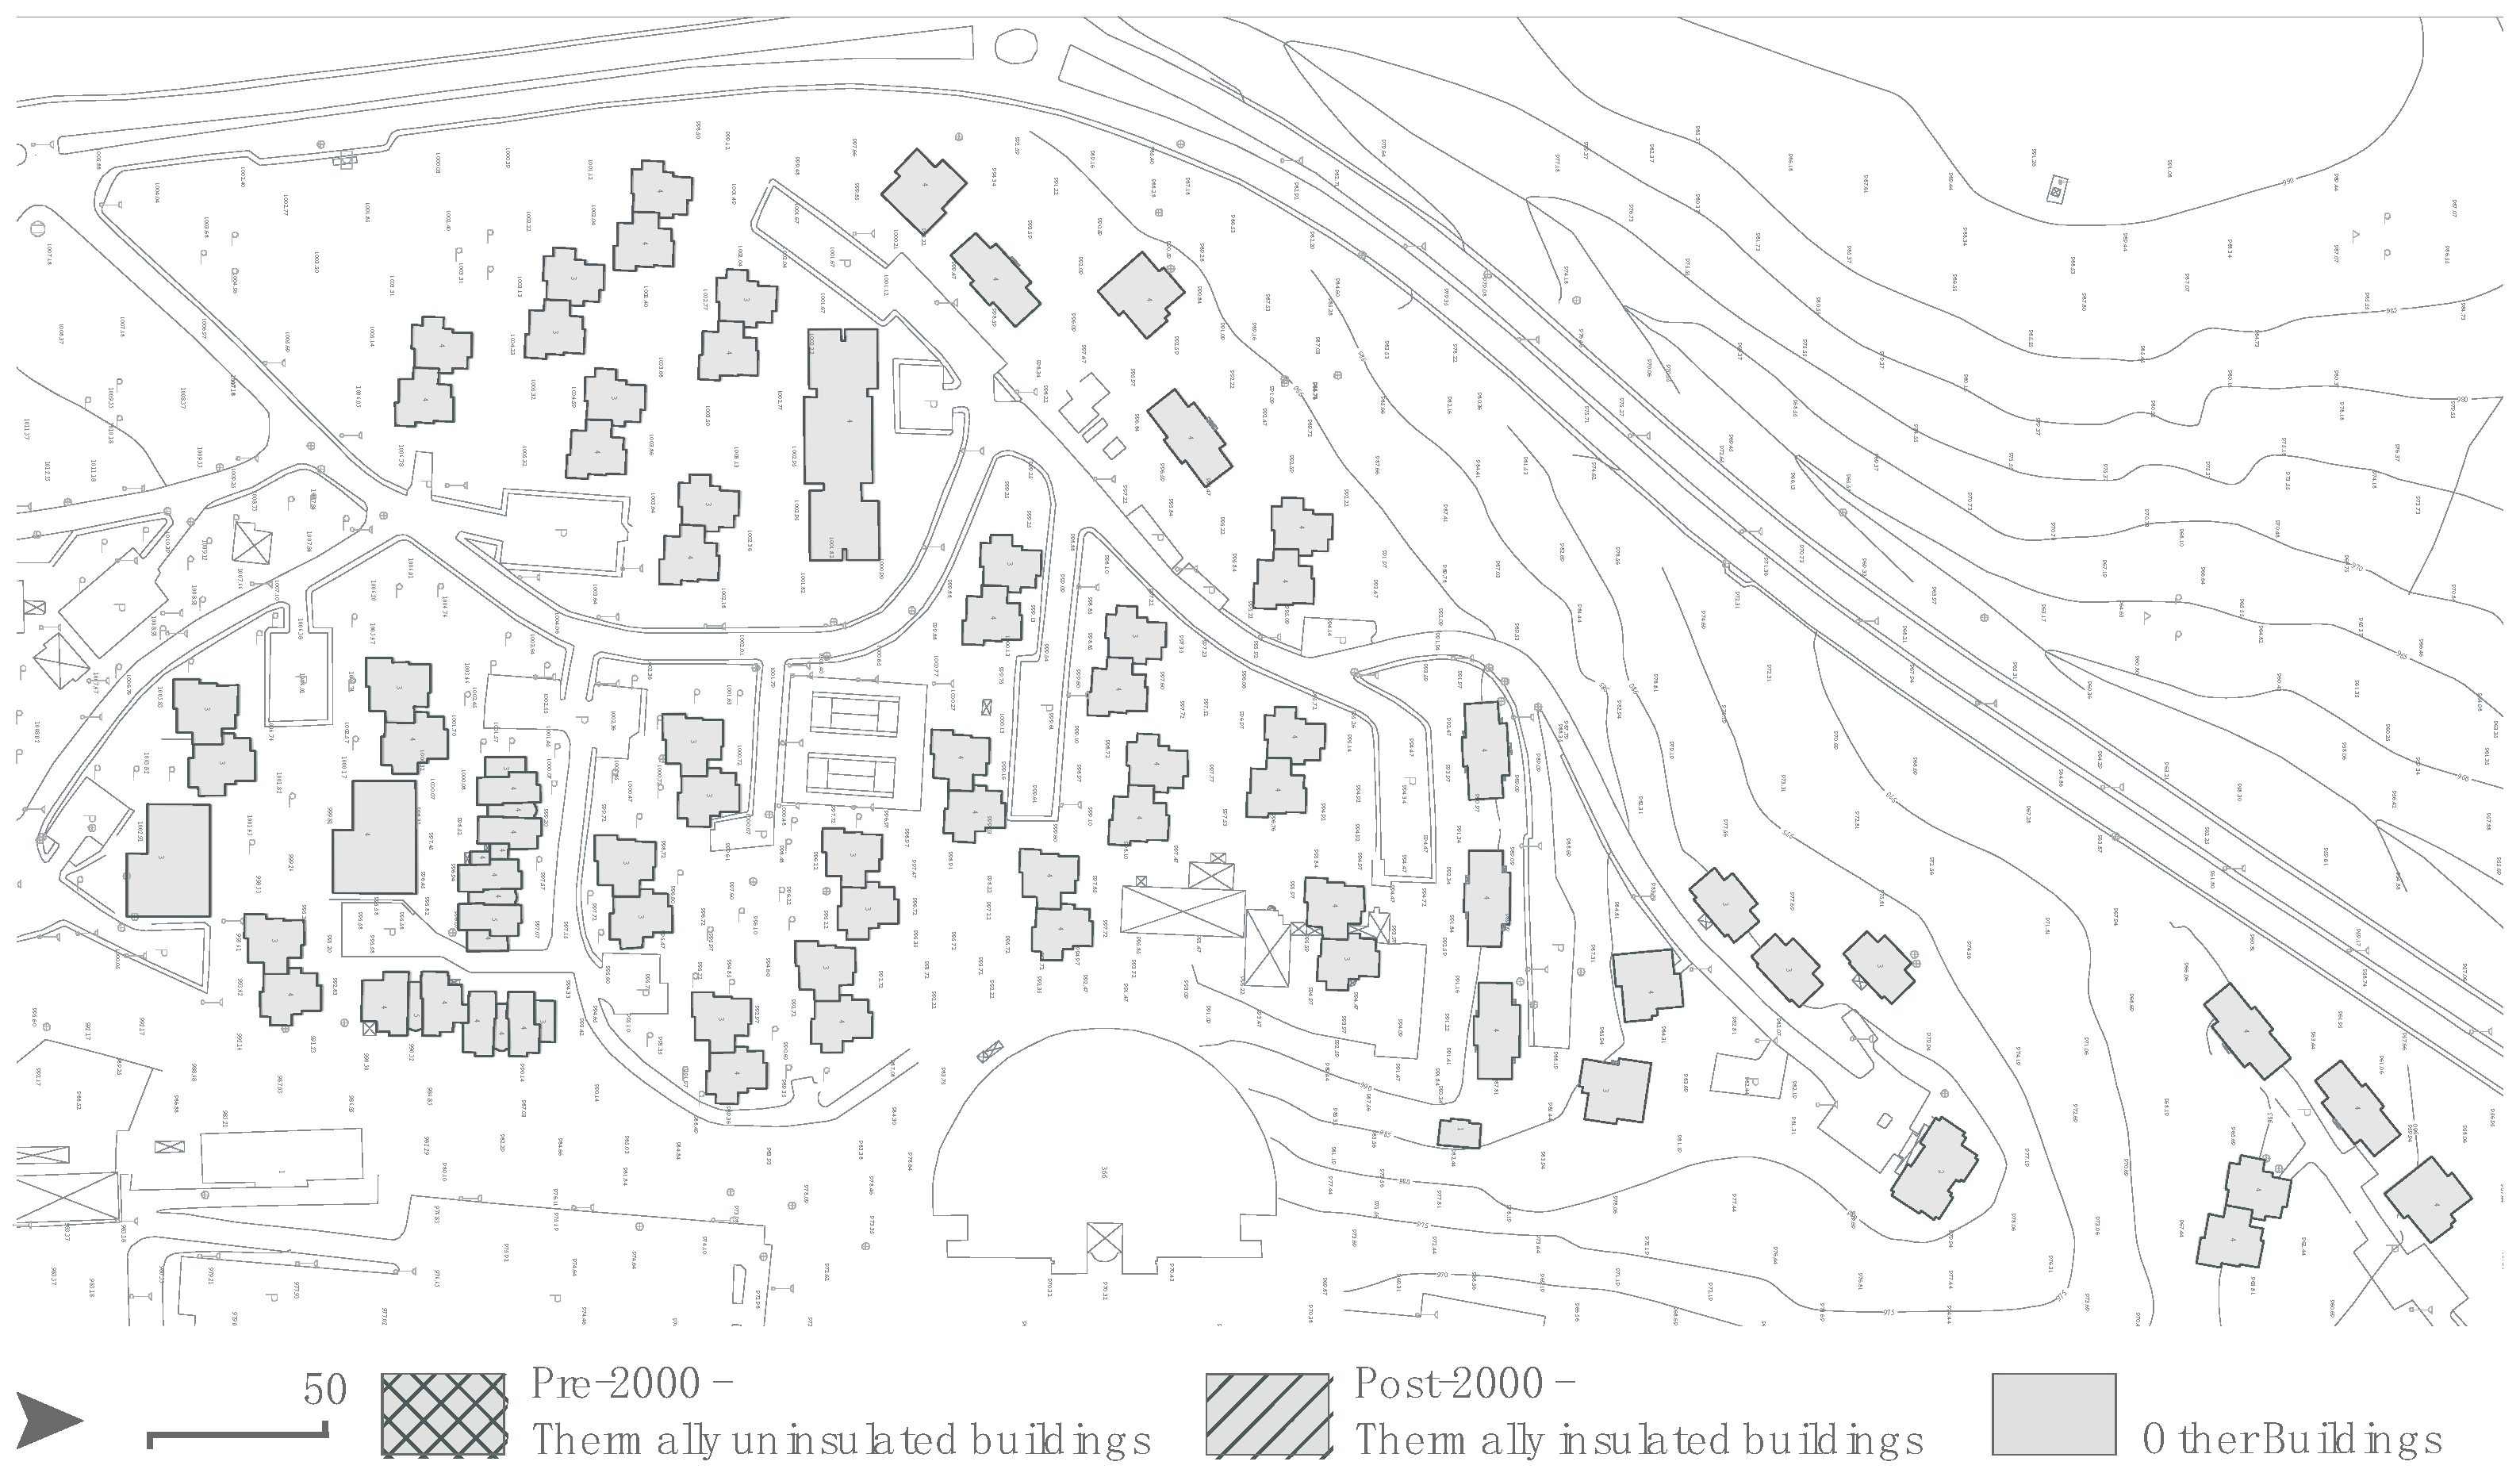
2.1. Study Area
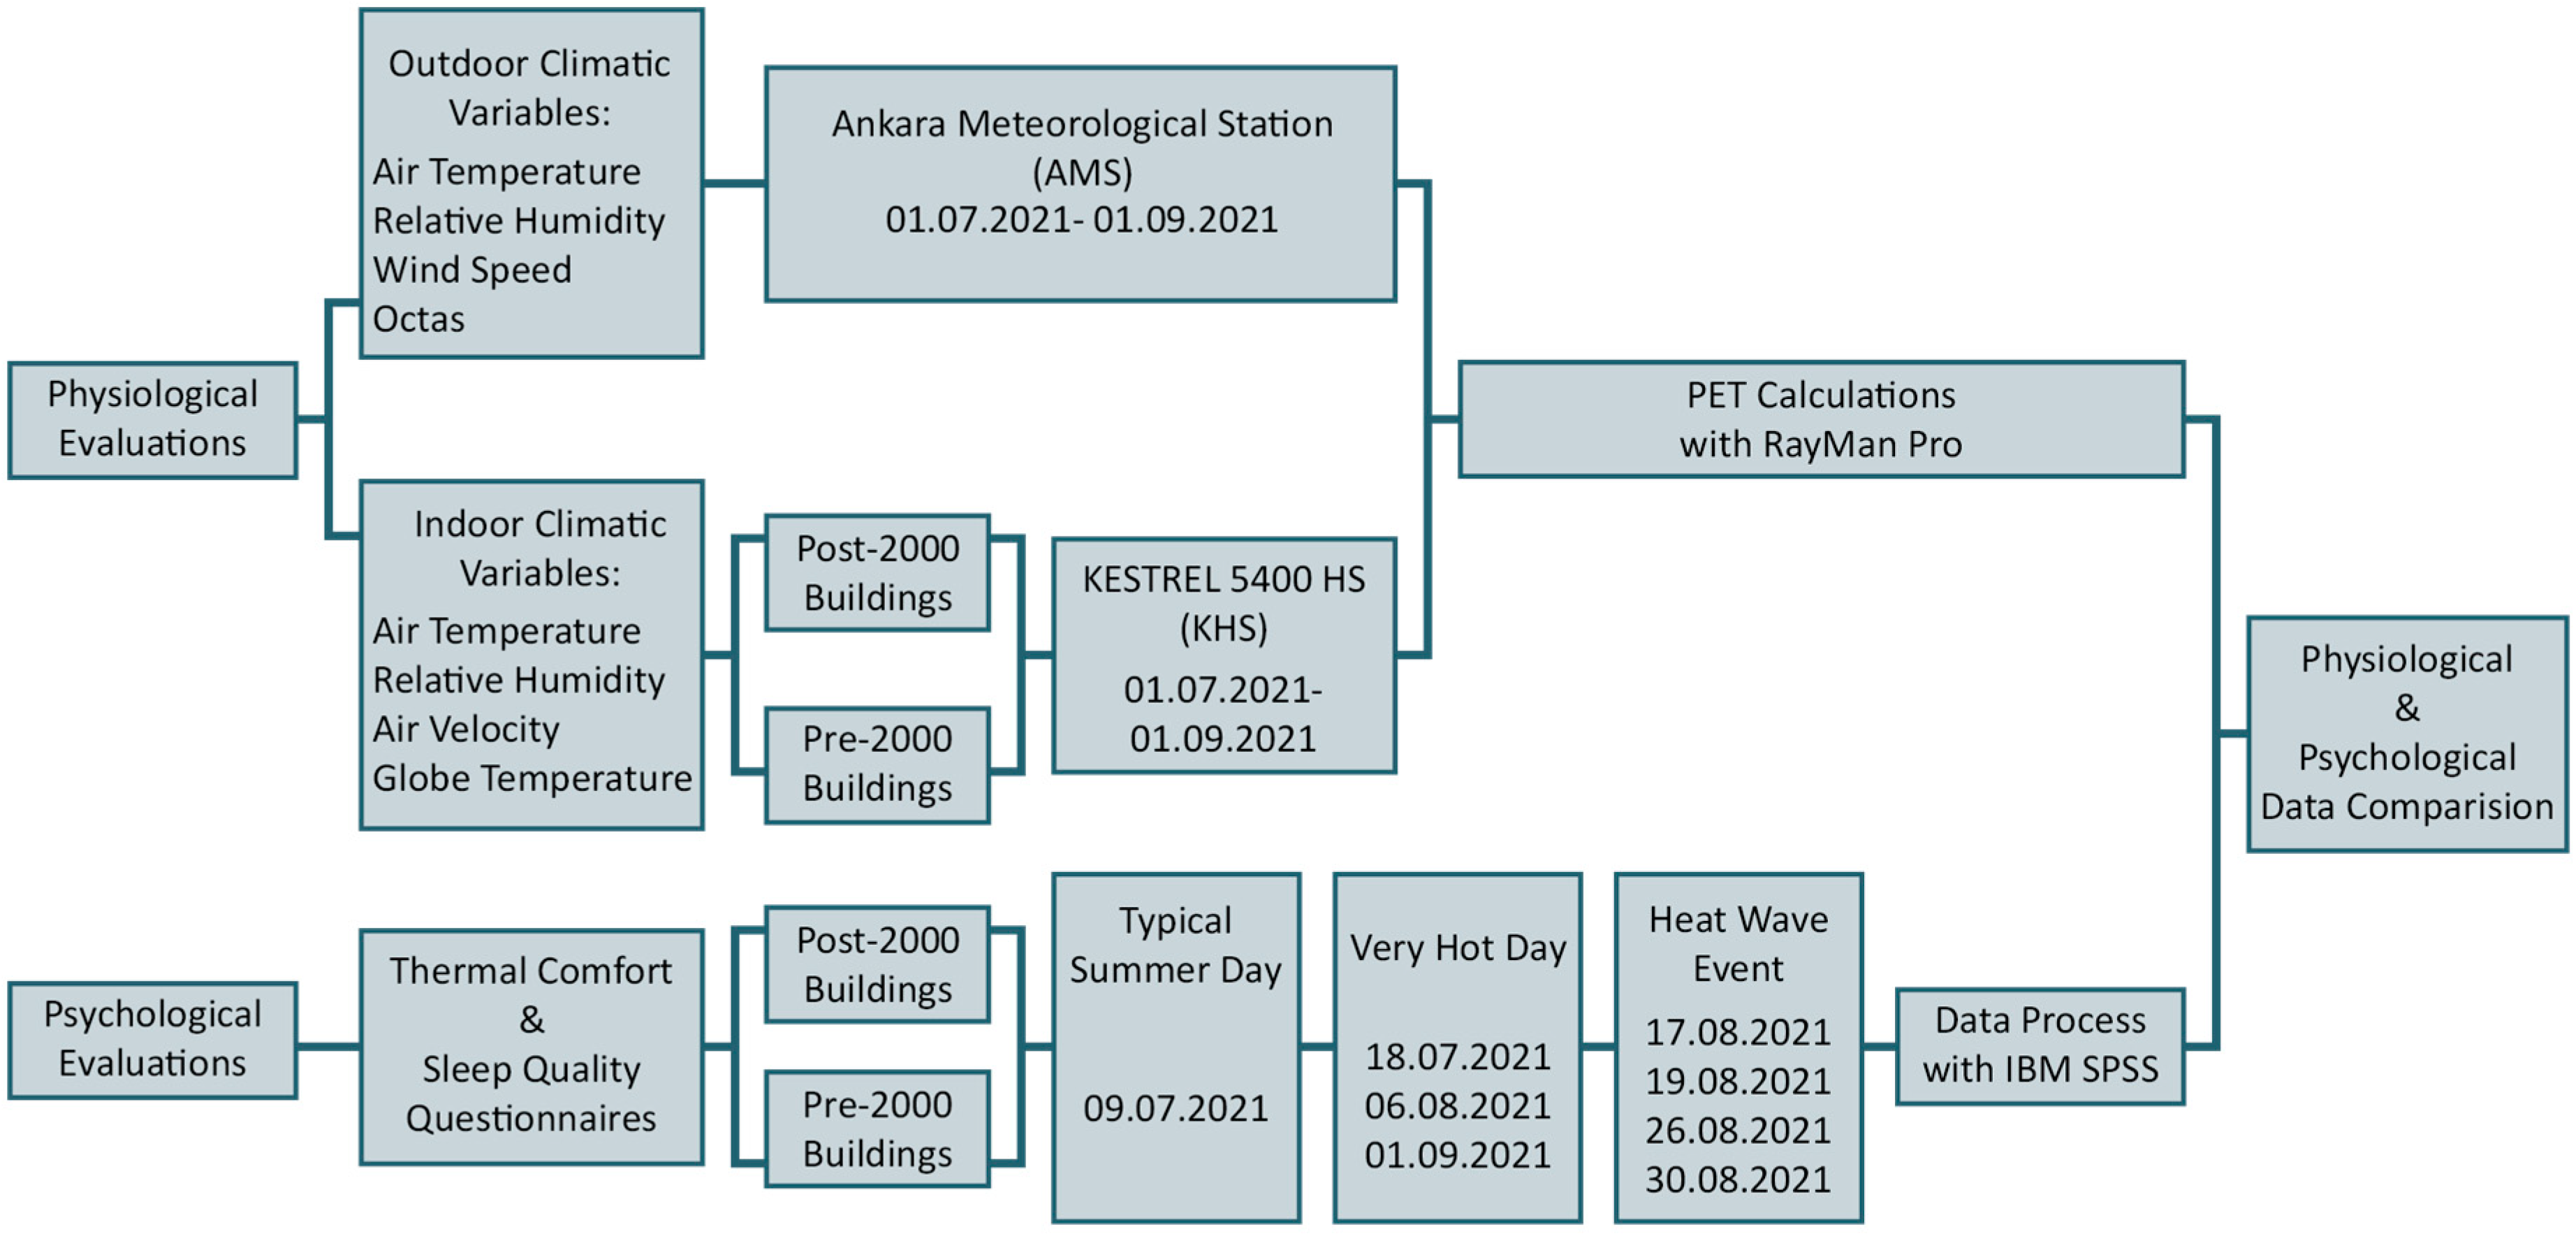
2.2. Study Procedure
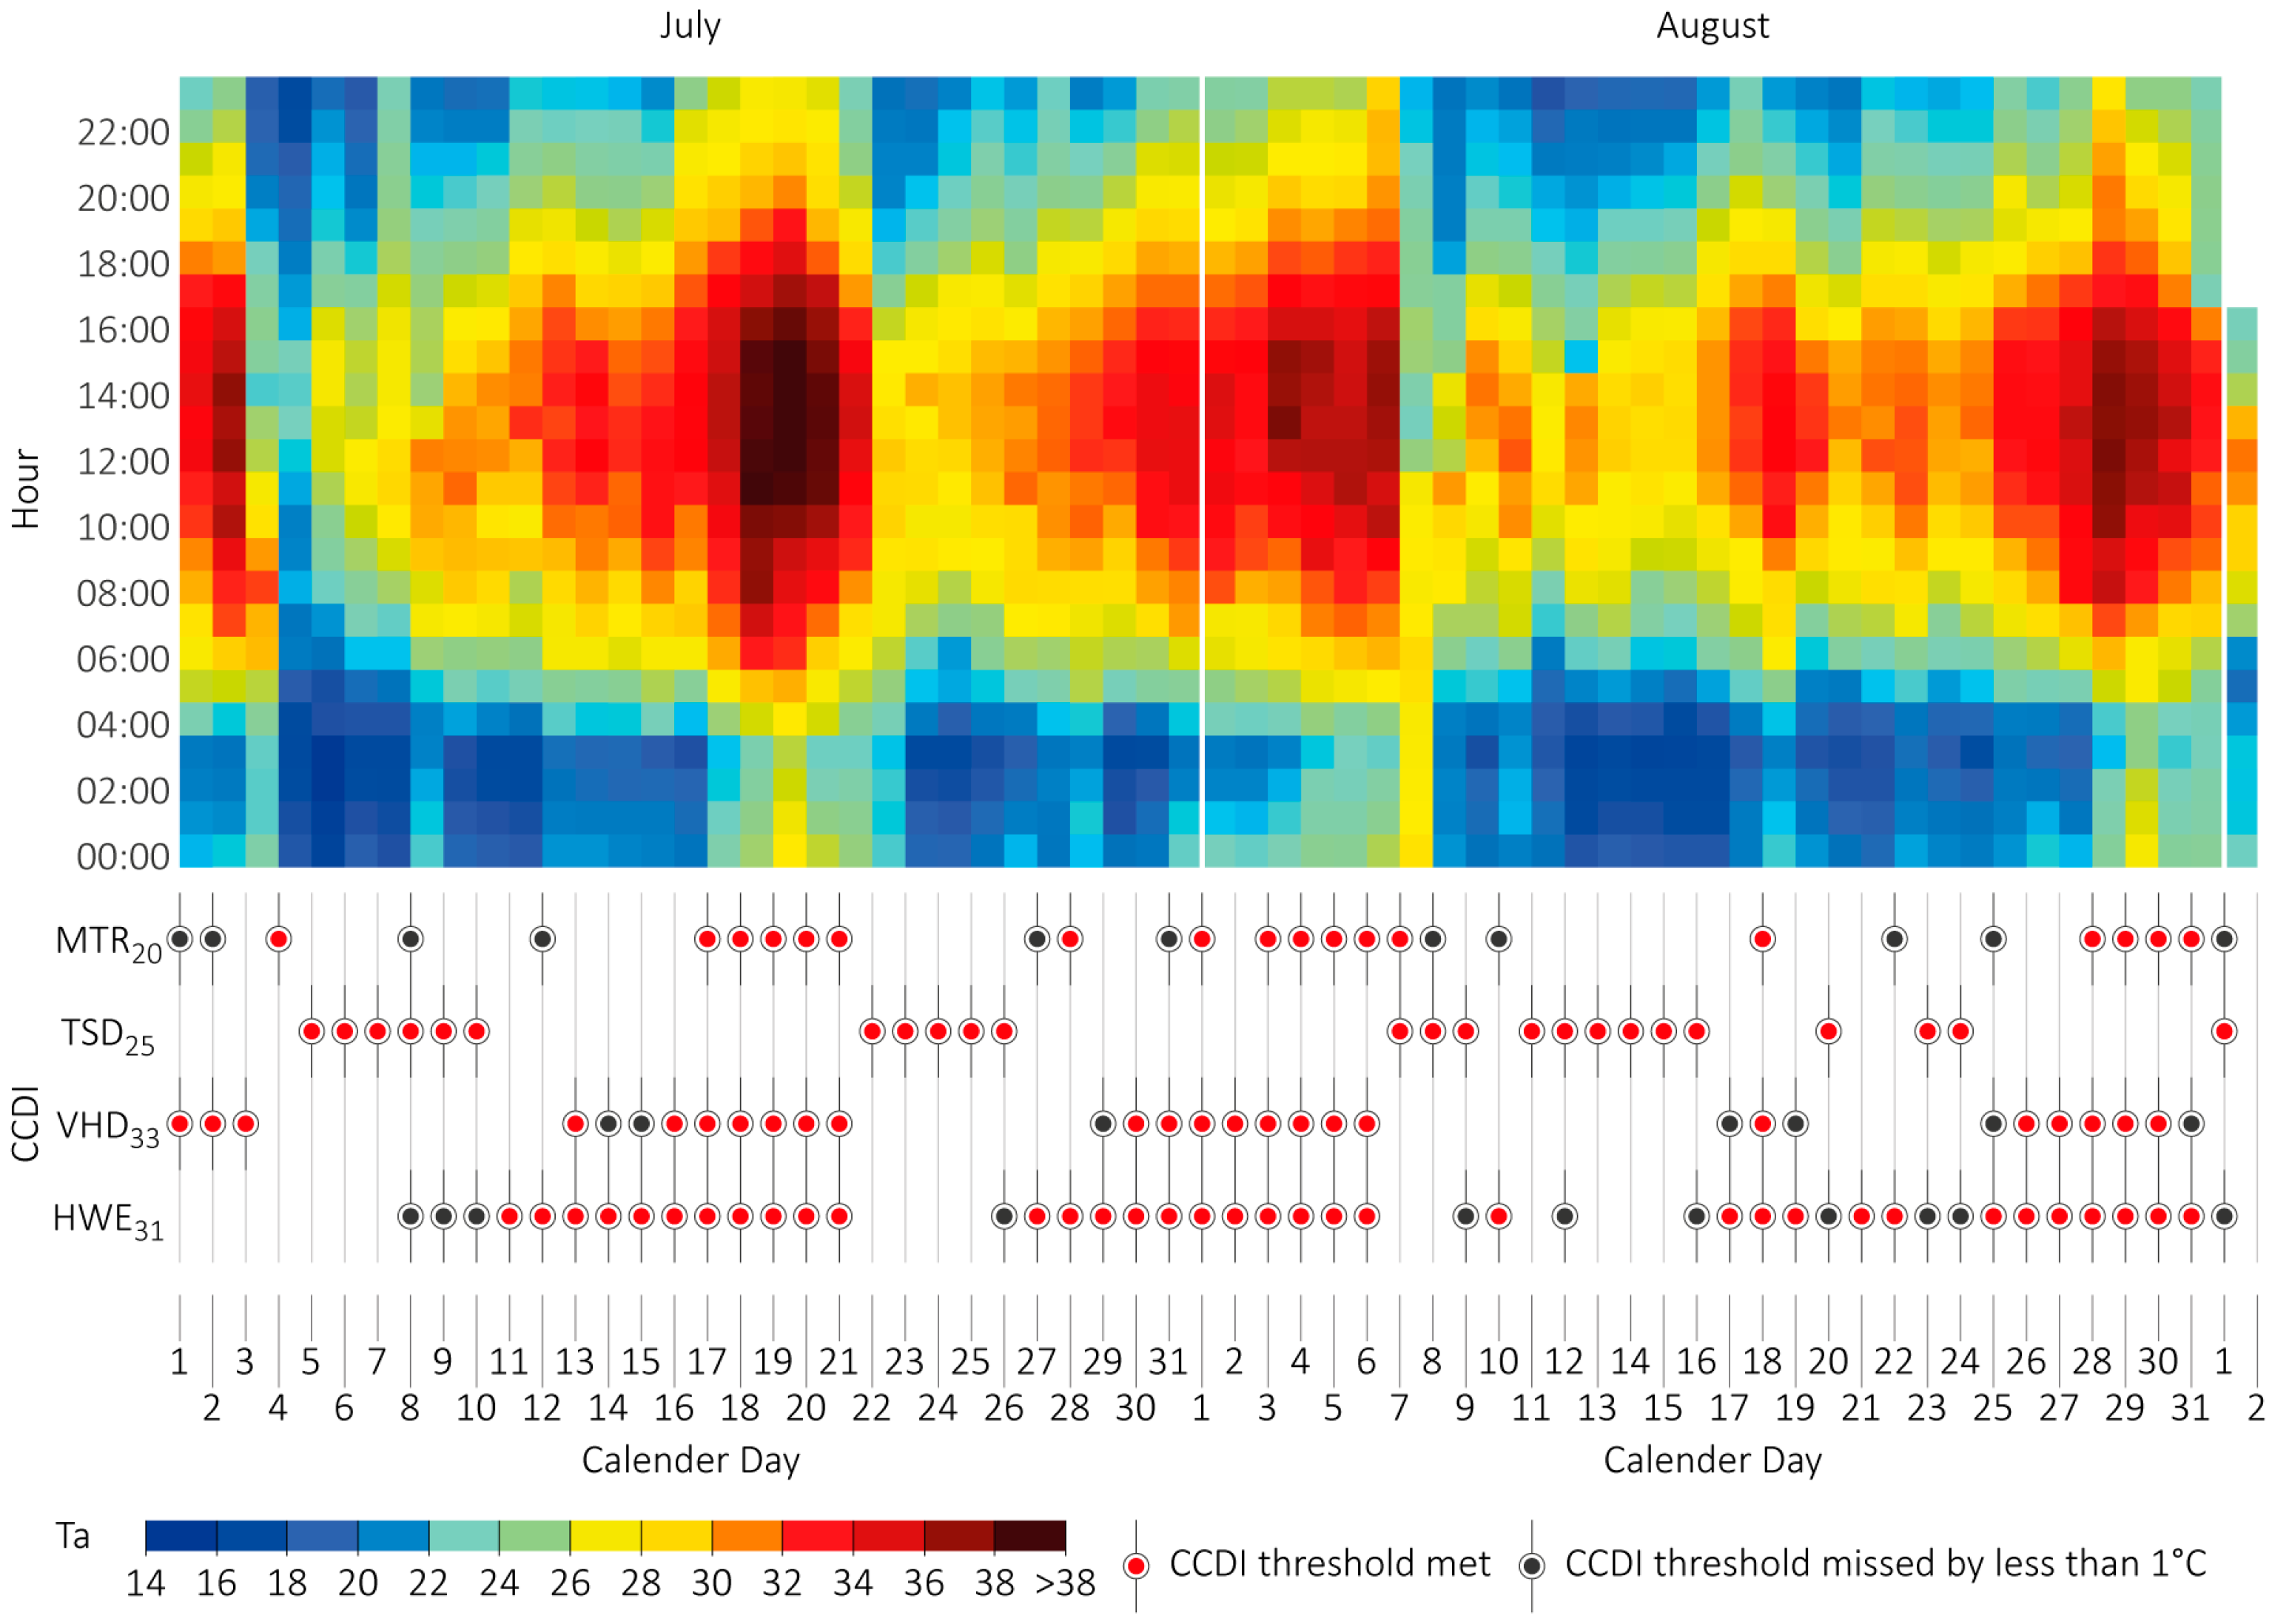
2.2.1. Application of Local Extreme Heat Thresholds
2.2.2. Physiological Approach
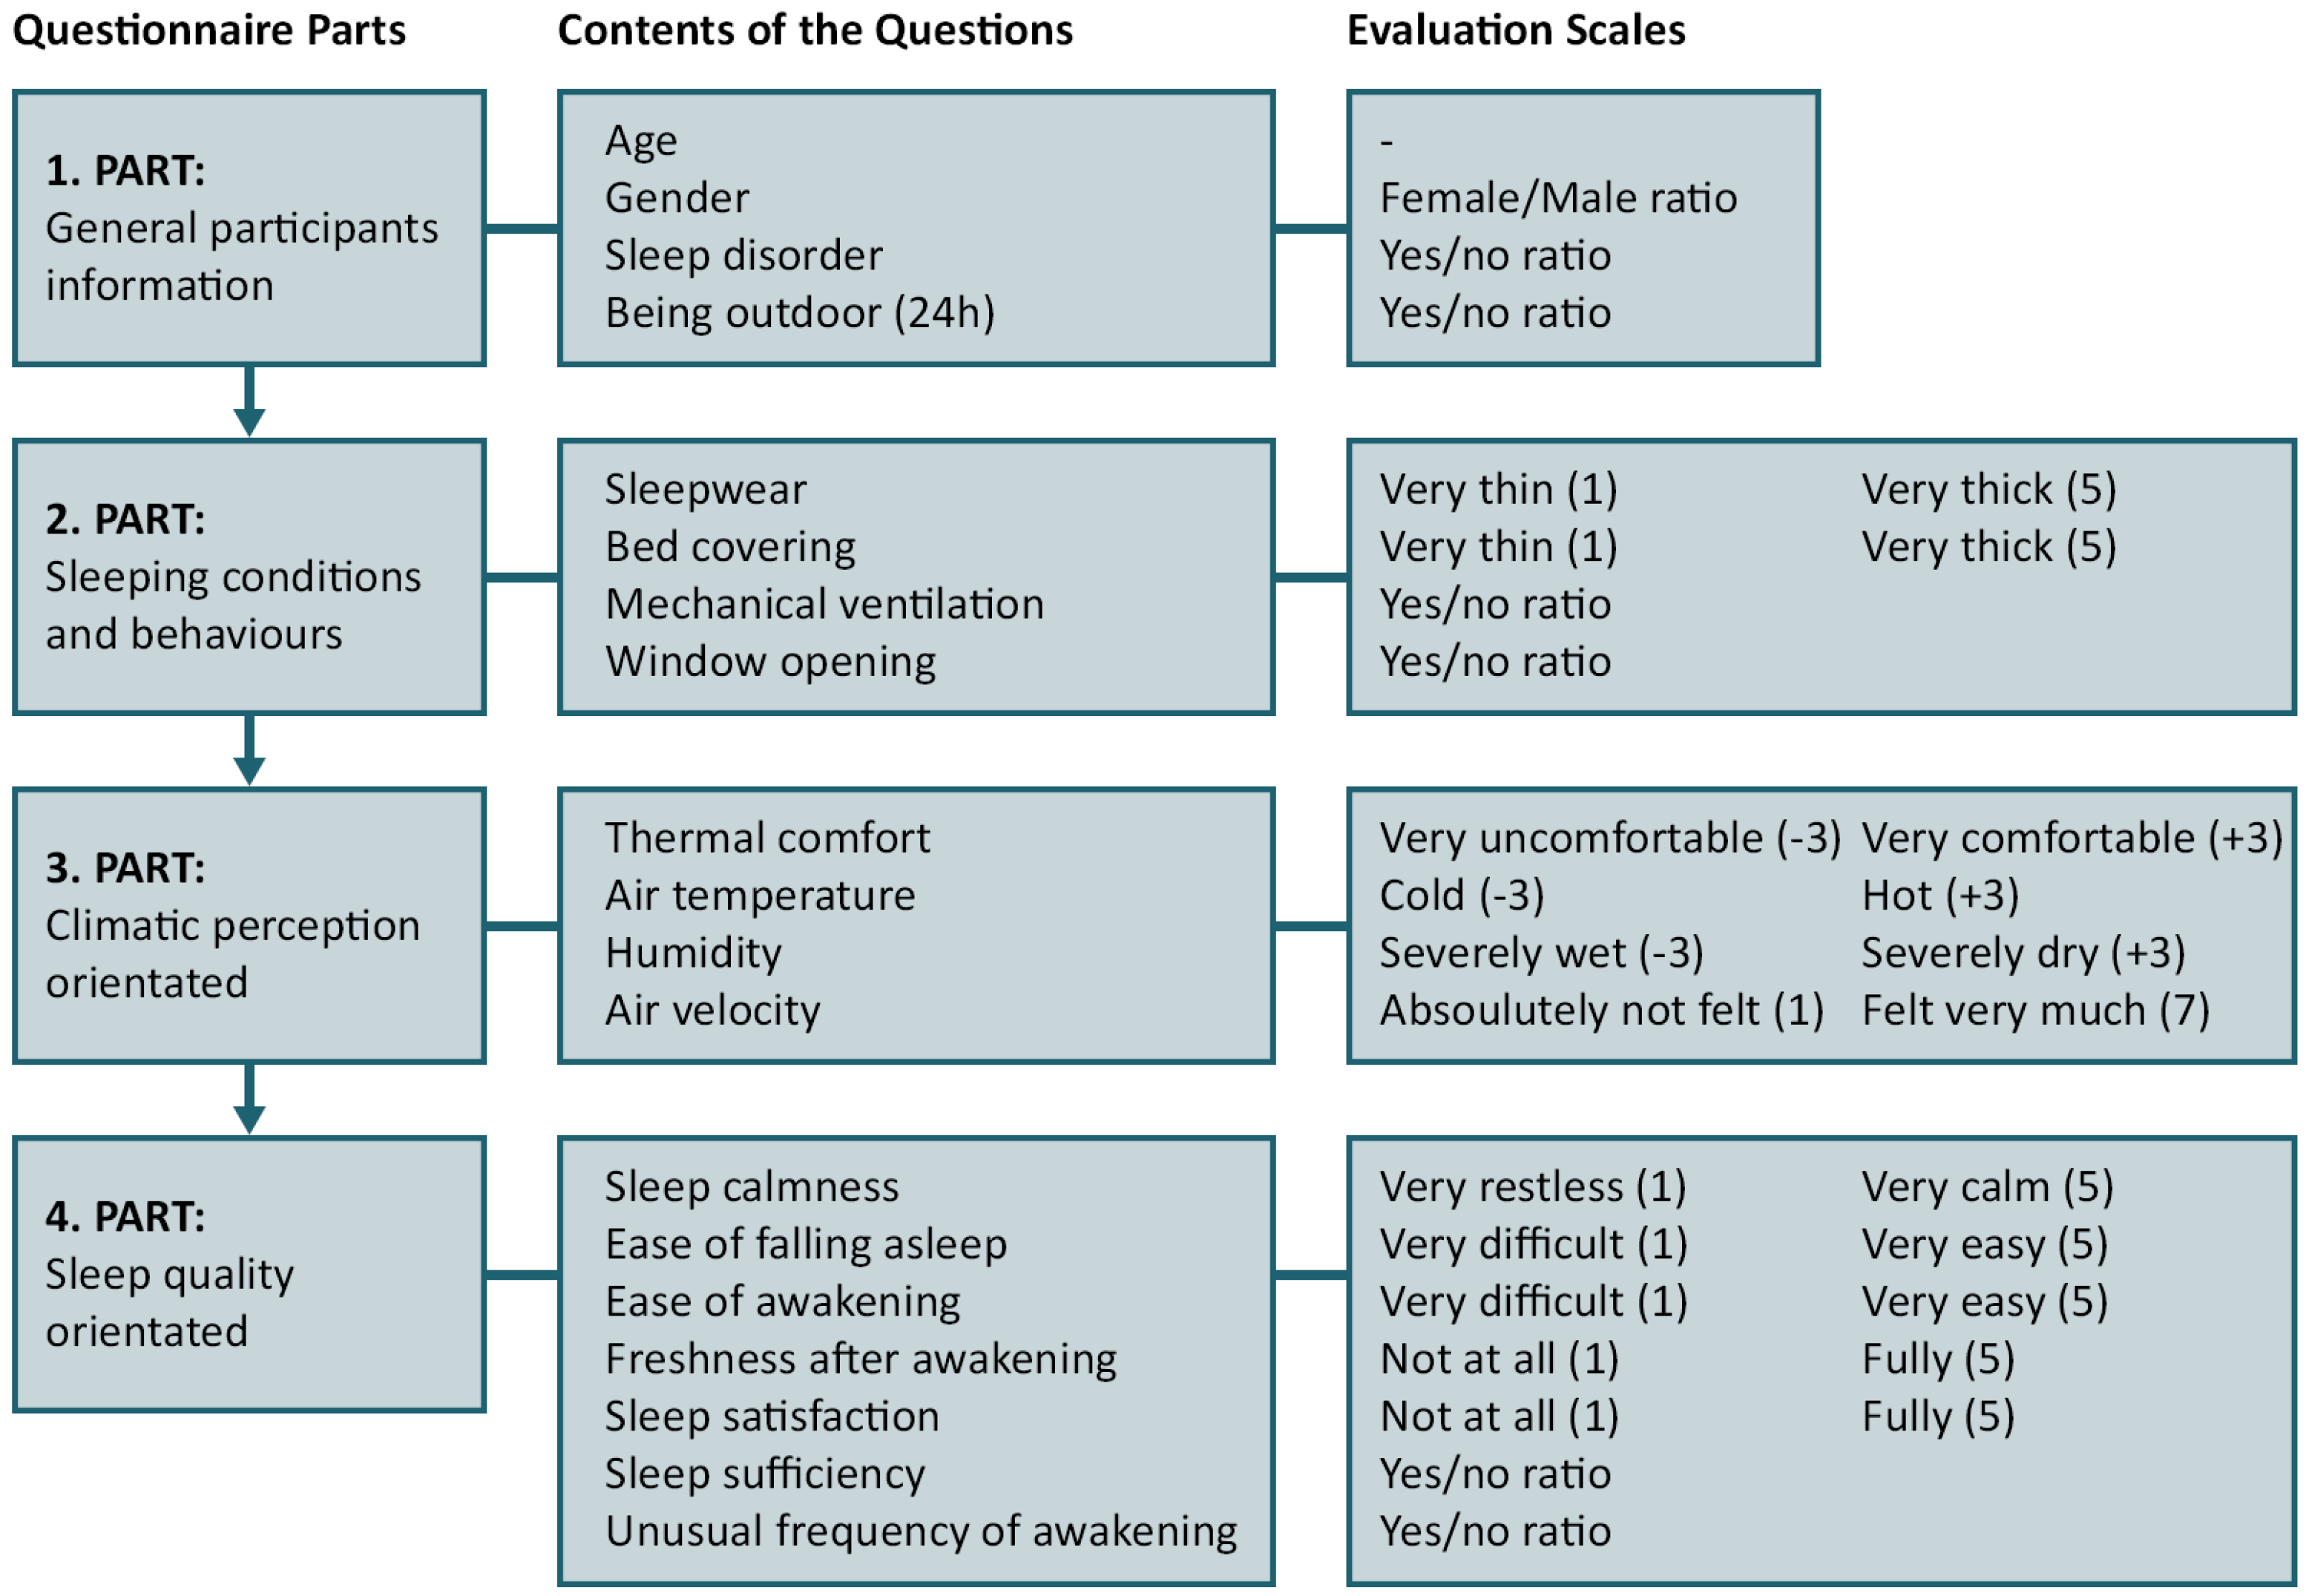
2.2.3. Psychological Approach
2.3. Data Processing
3. Results
3.1. Identification of Local Heat Thresholds
3.2. Evaluation of Meteorological Factors Affecting Physiological Thermal Comfort
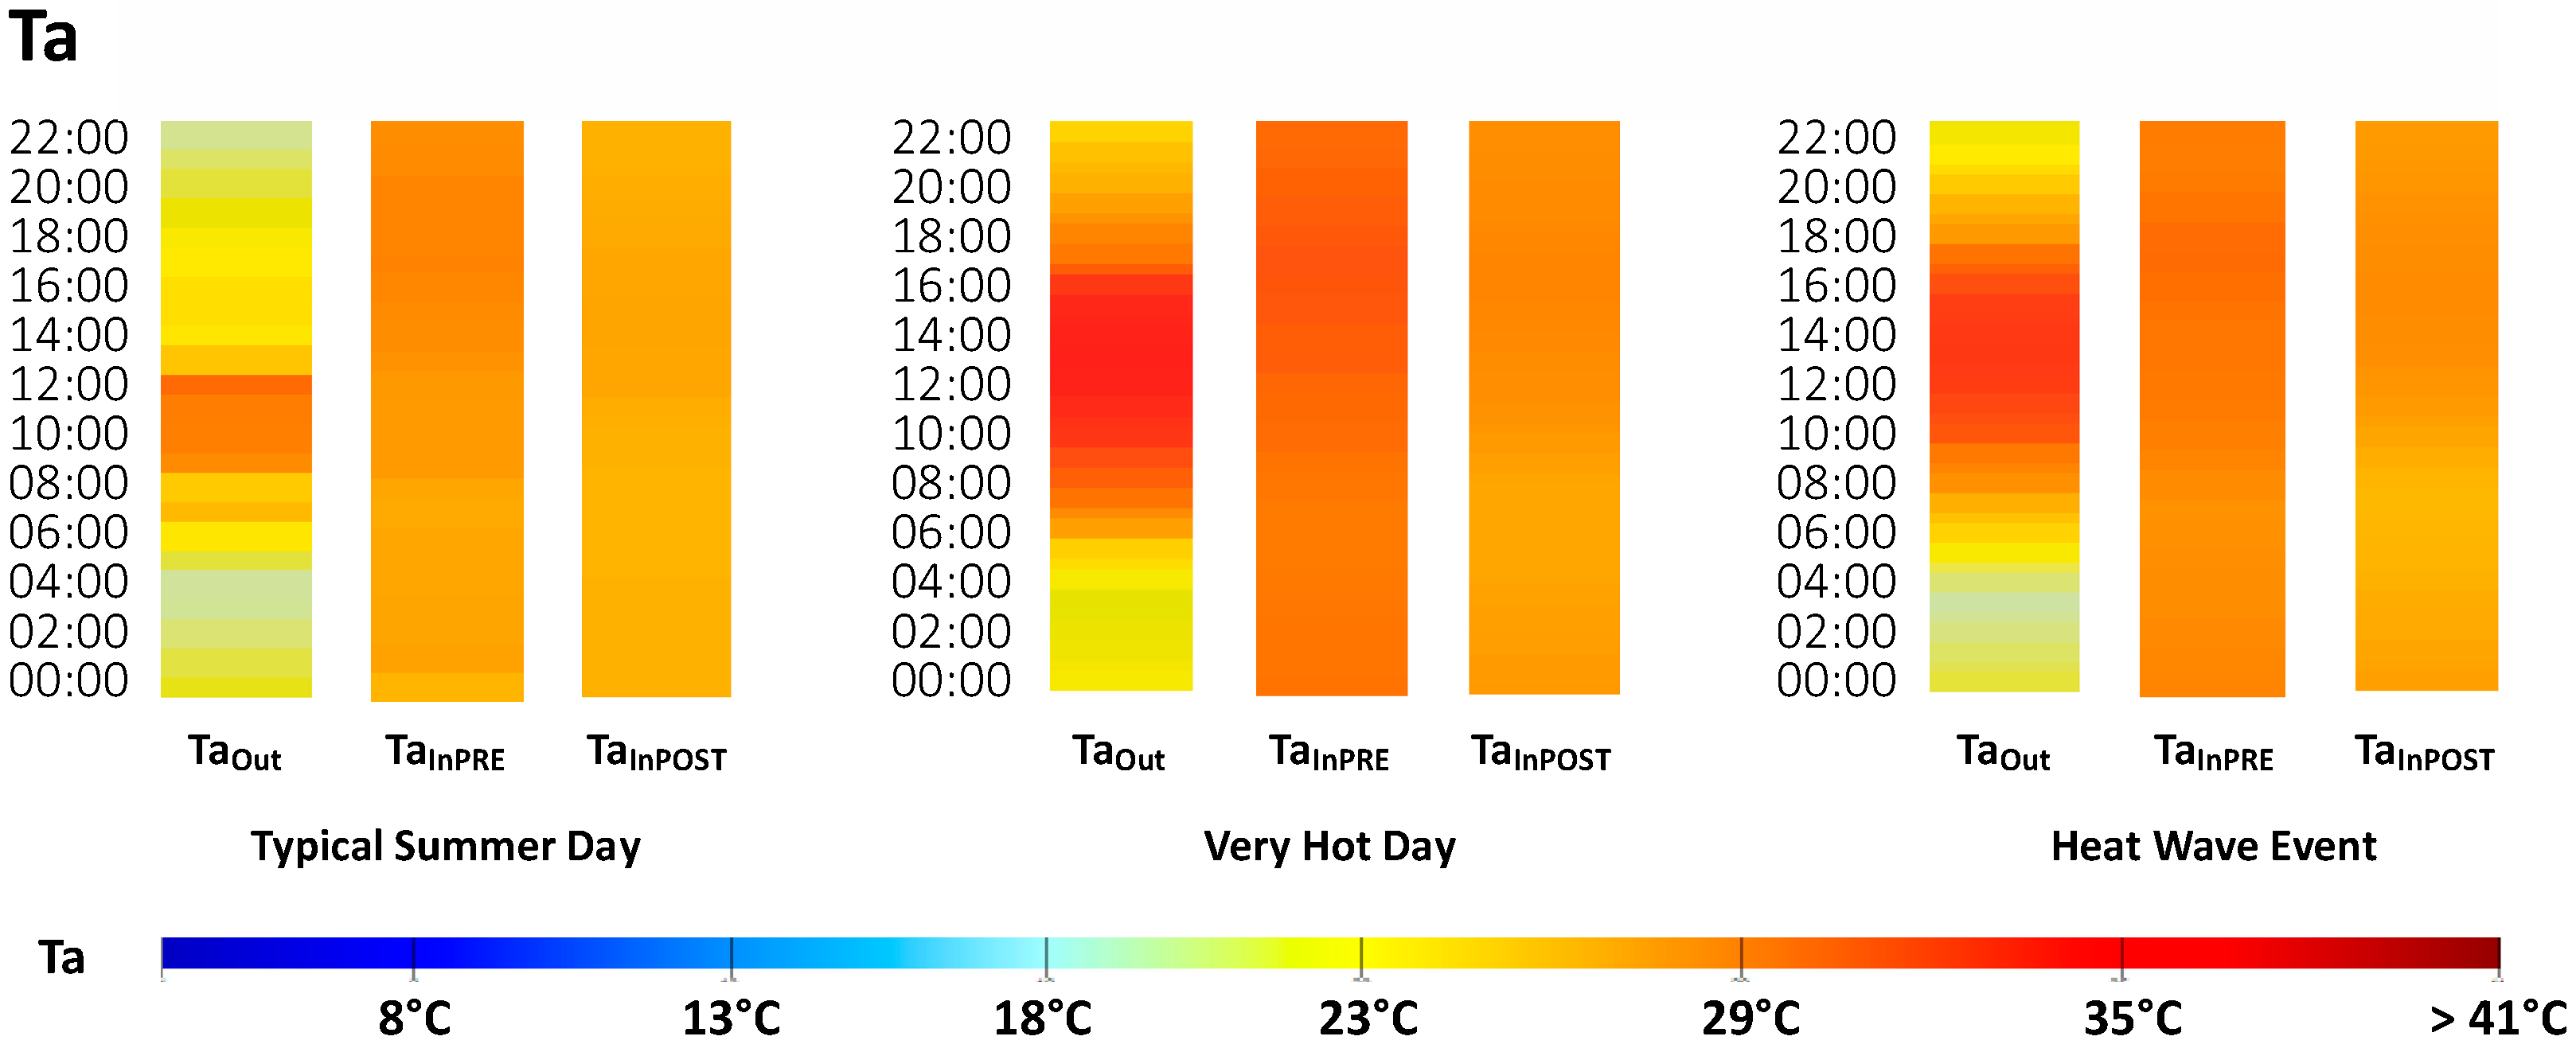
3.2.1. Air Temperature
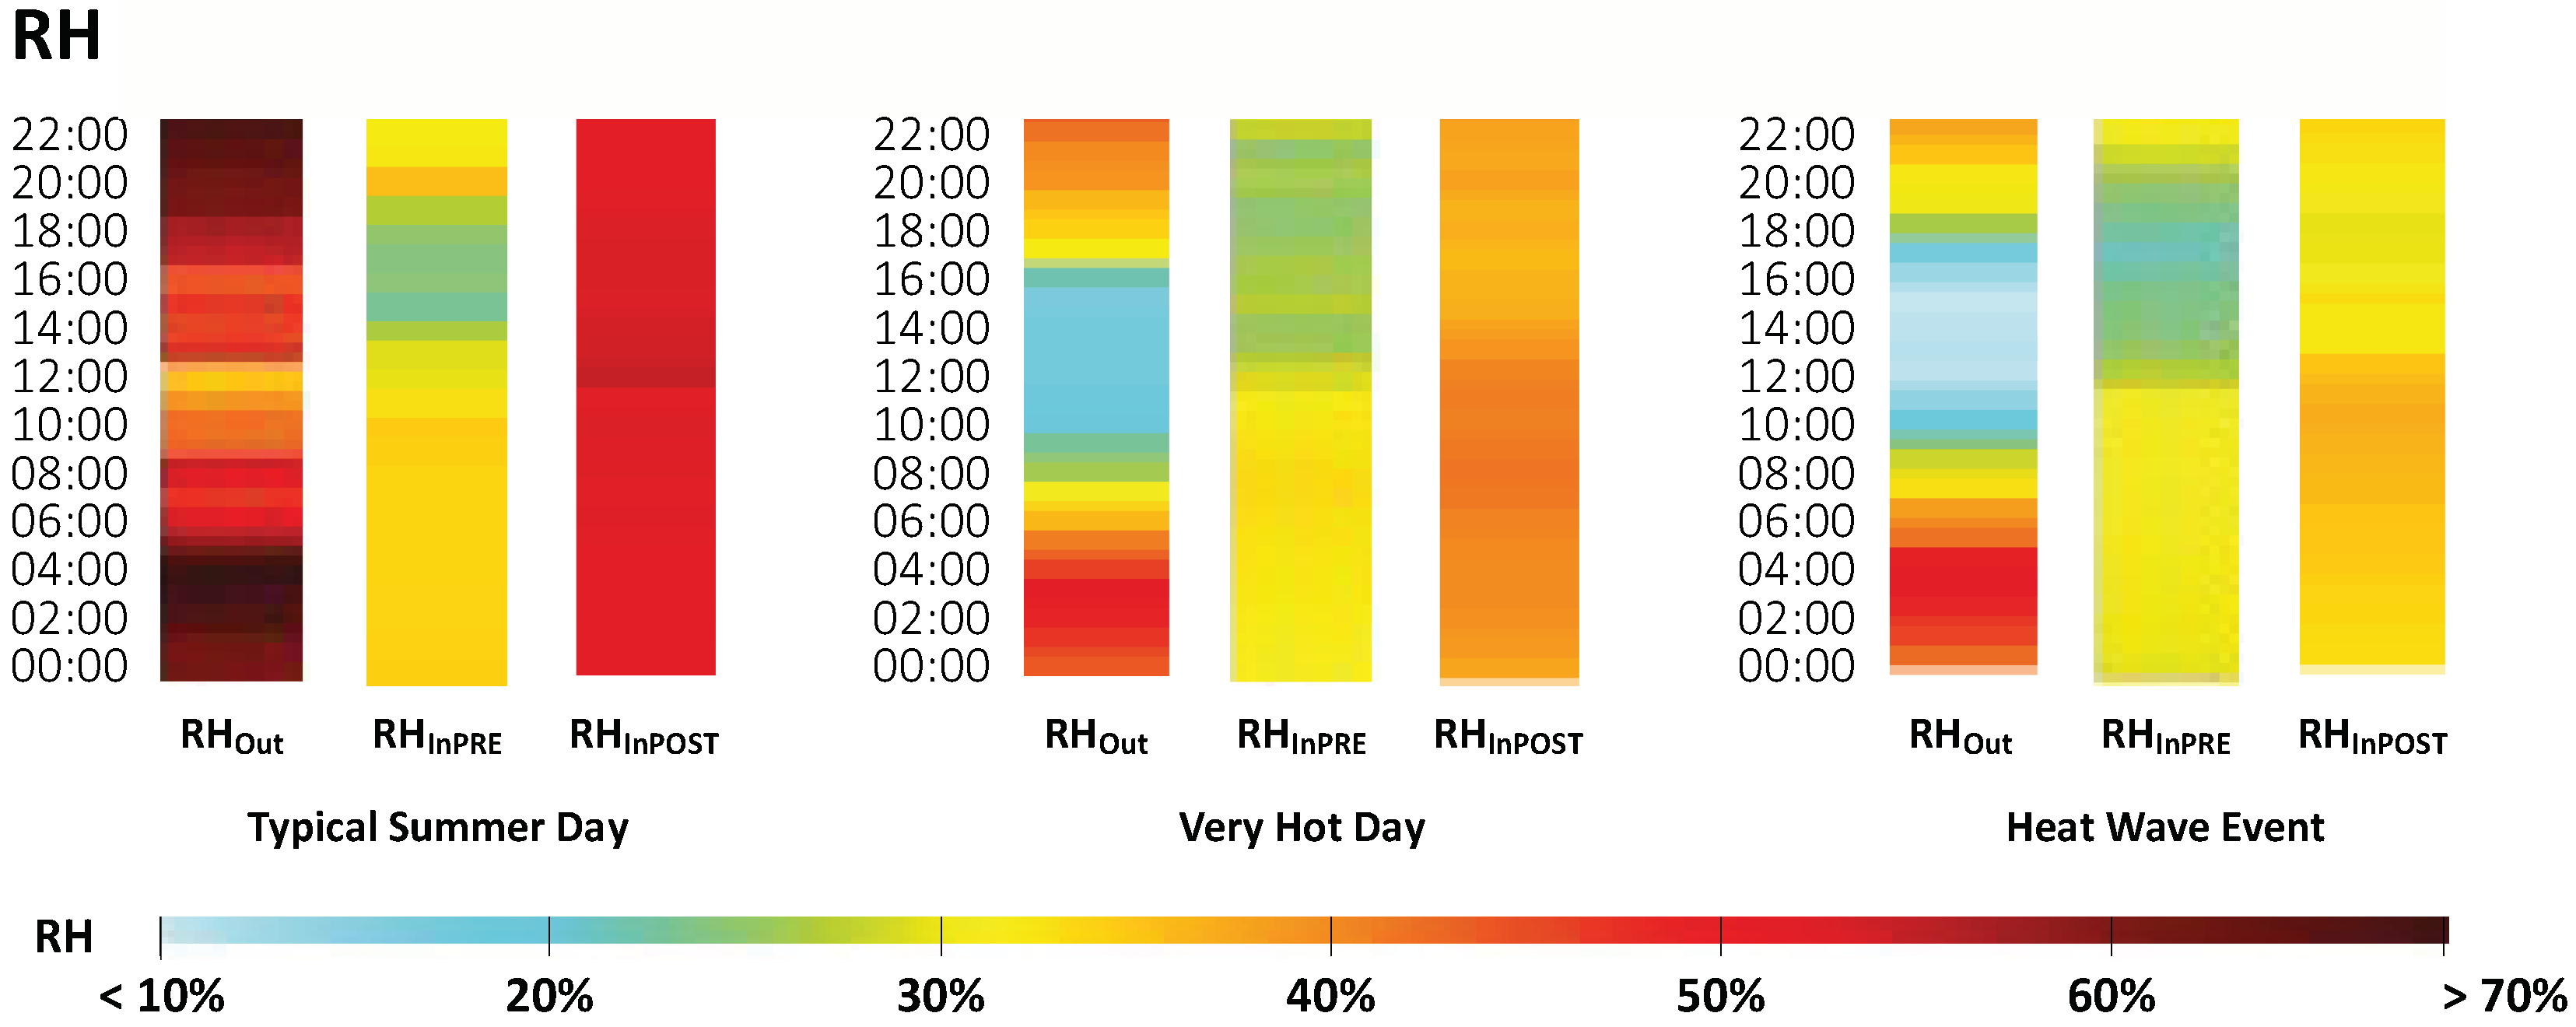
3.2.2. Relative Humidity
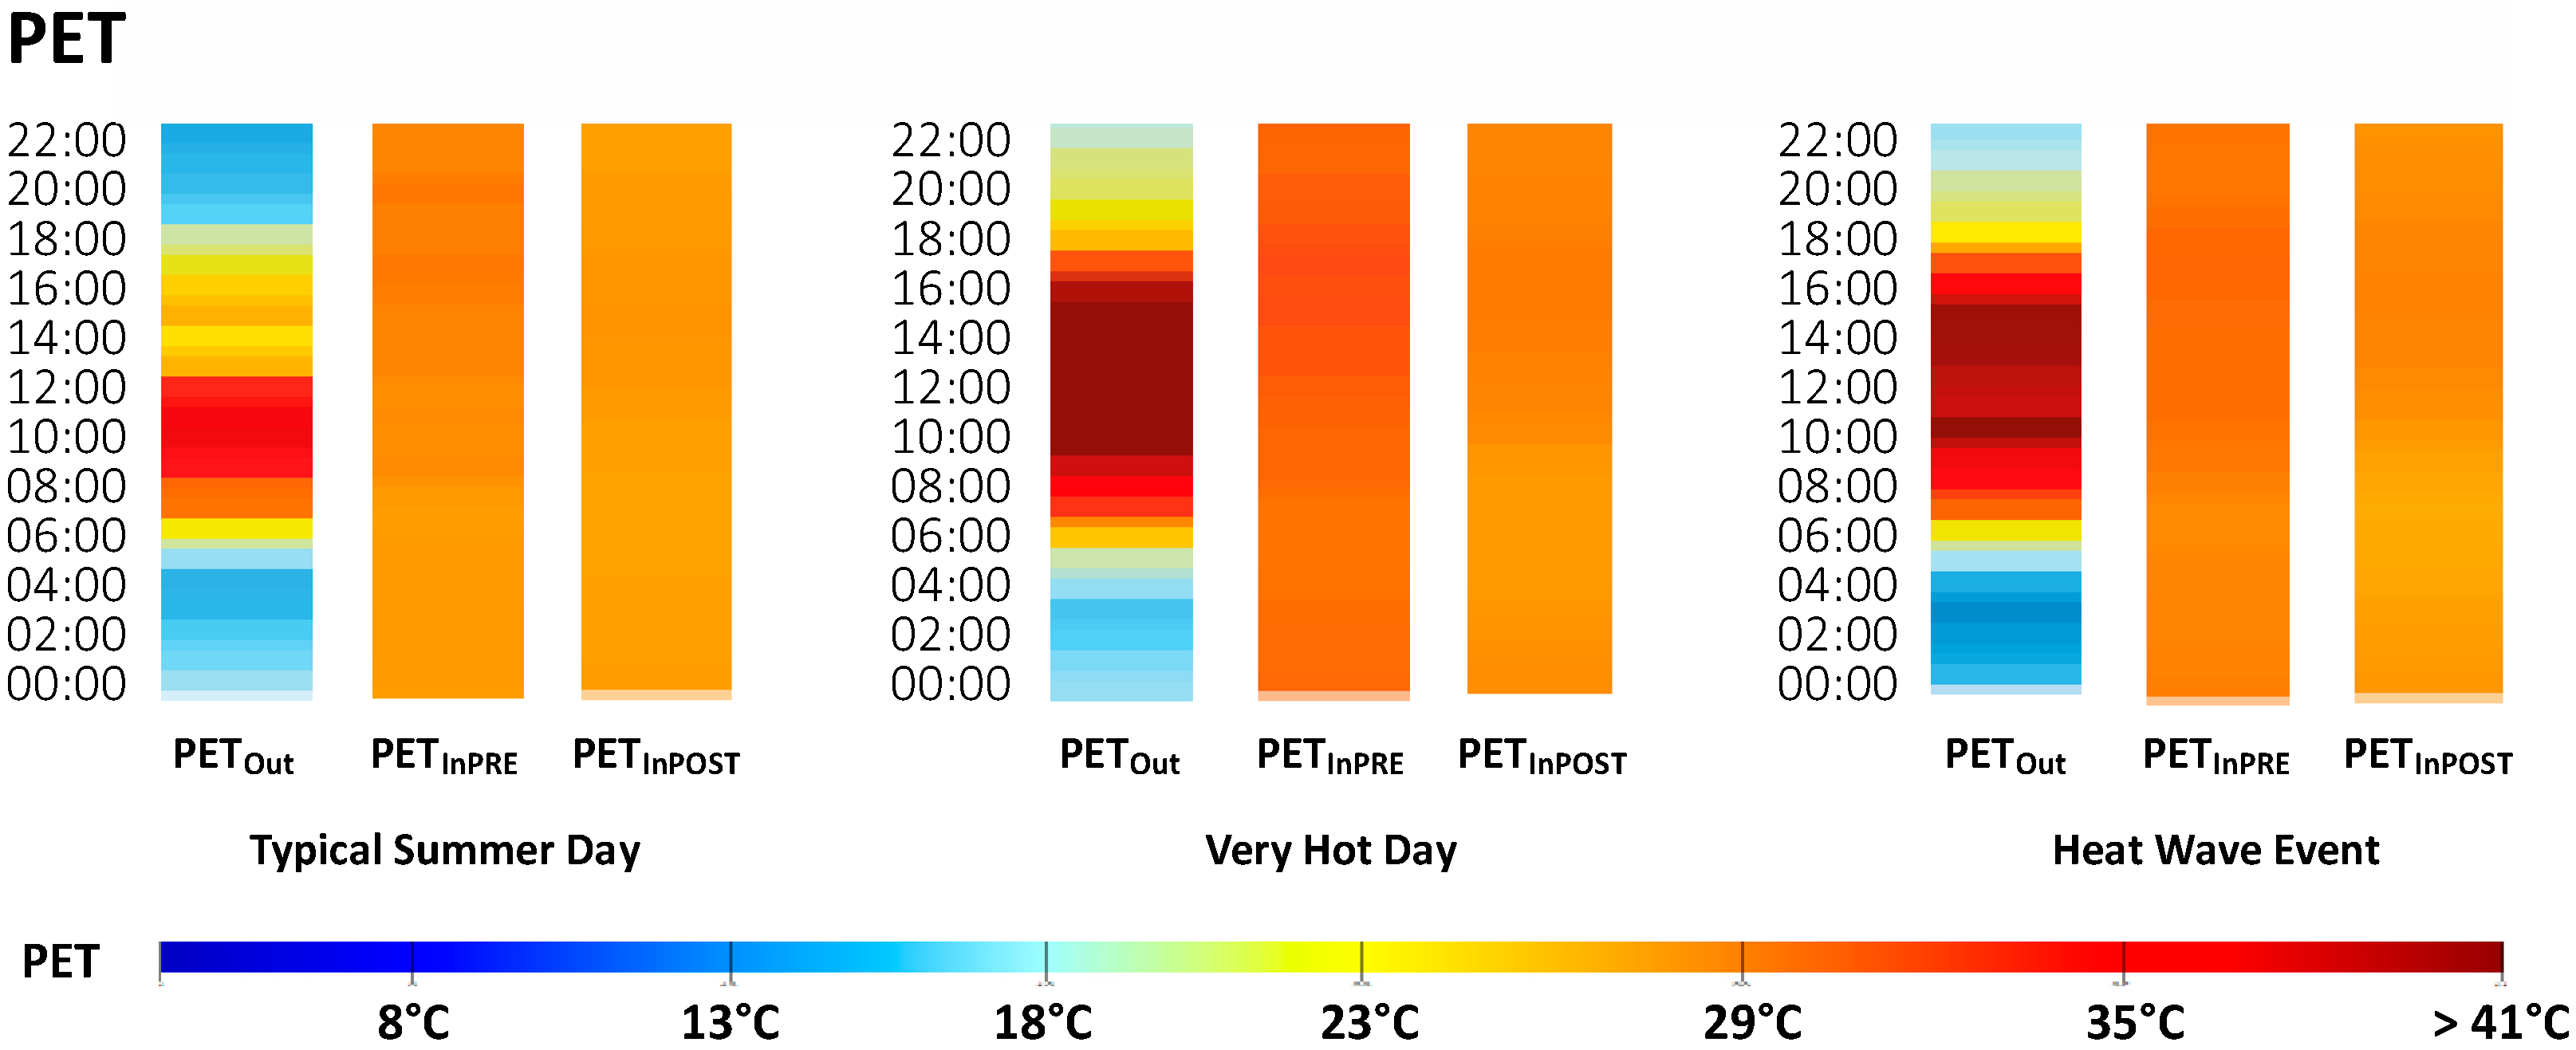
3.2.3. Thermal Index Outputs
3.3. Psychological Evaluations
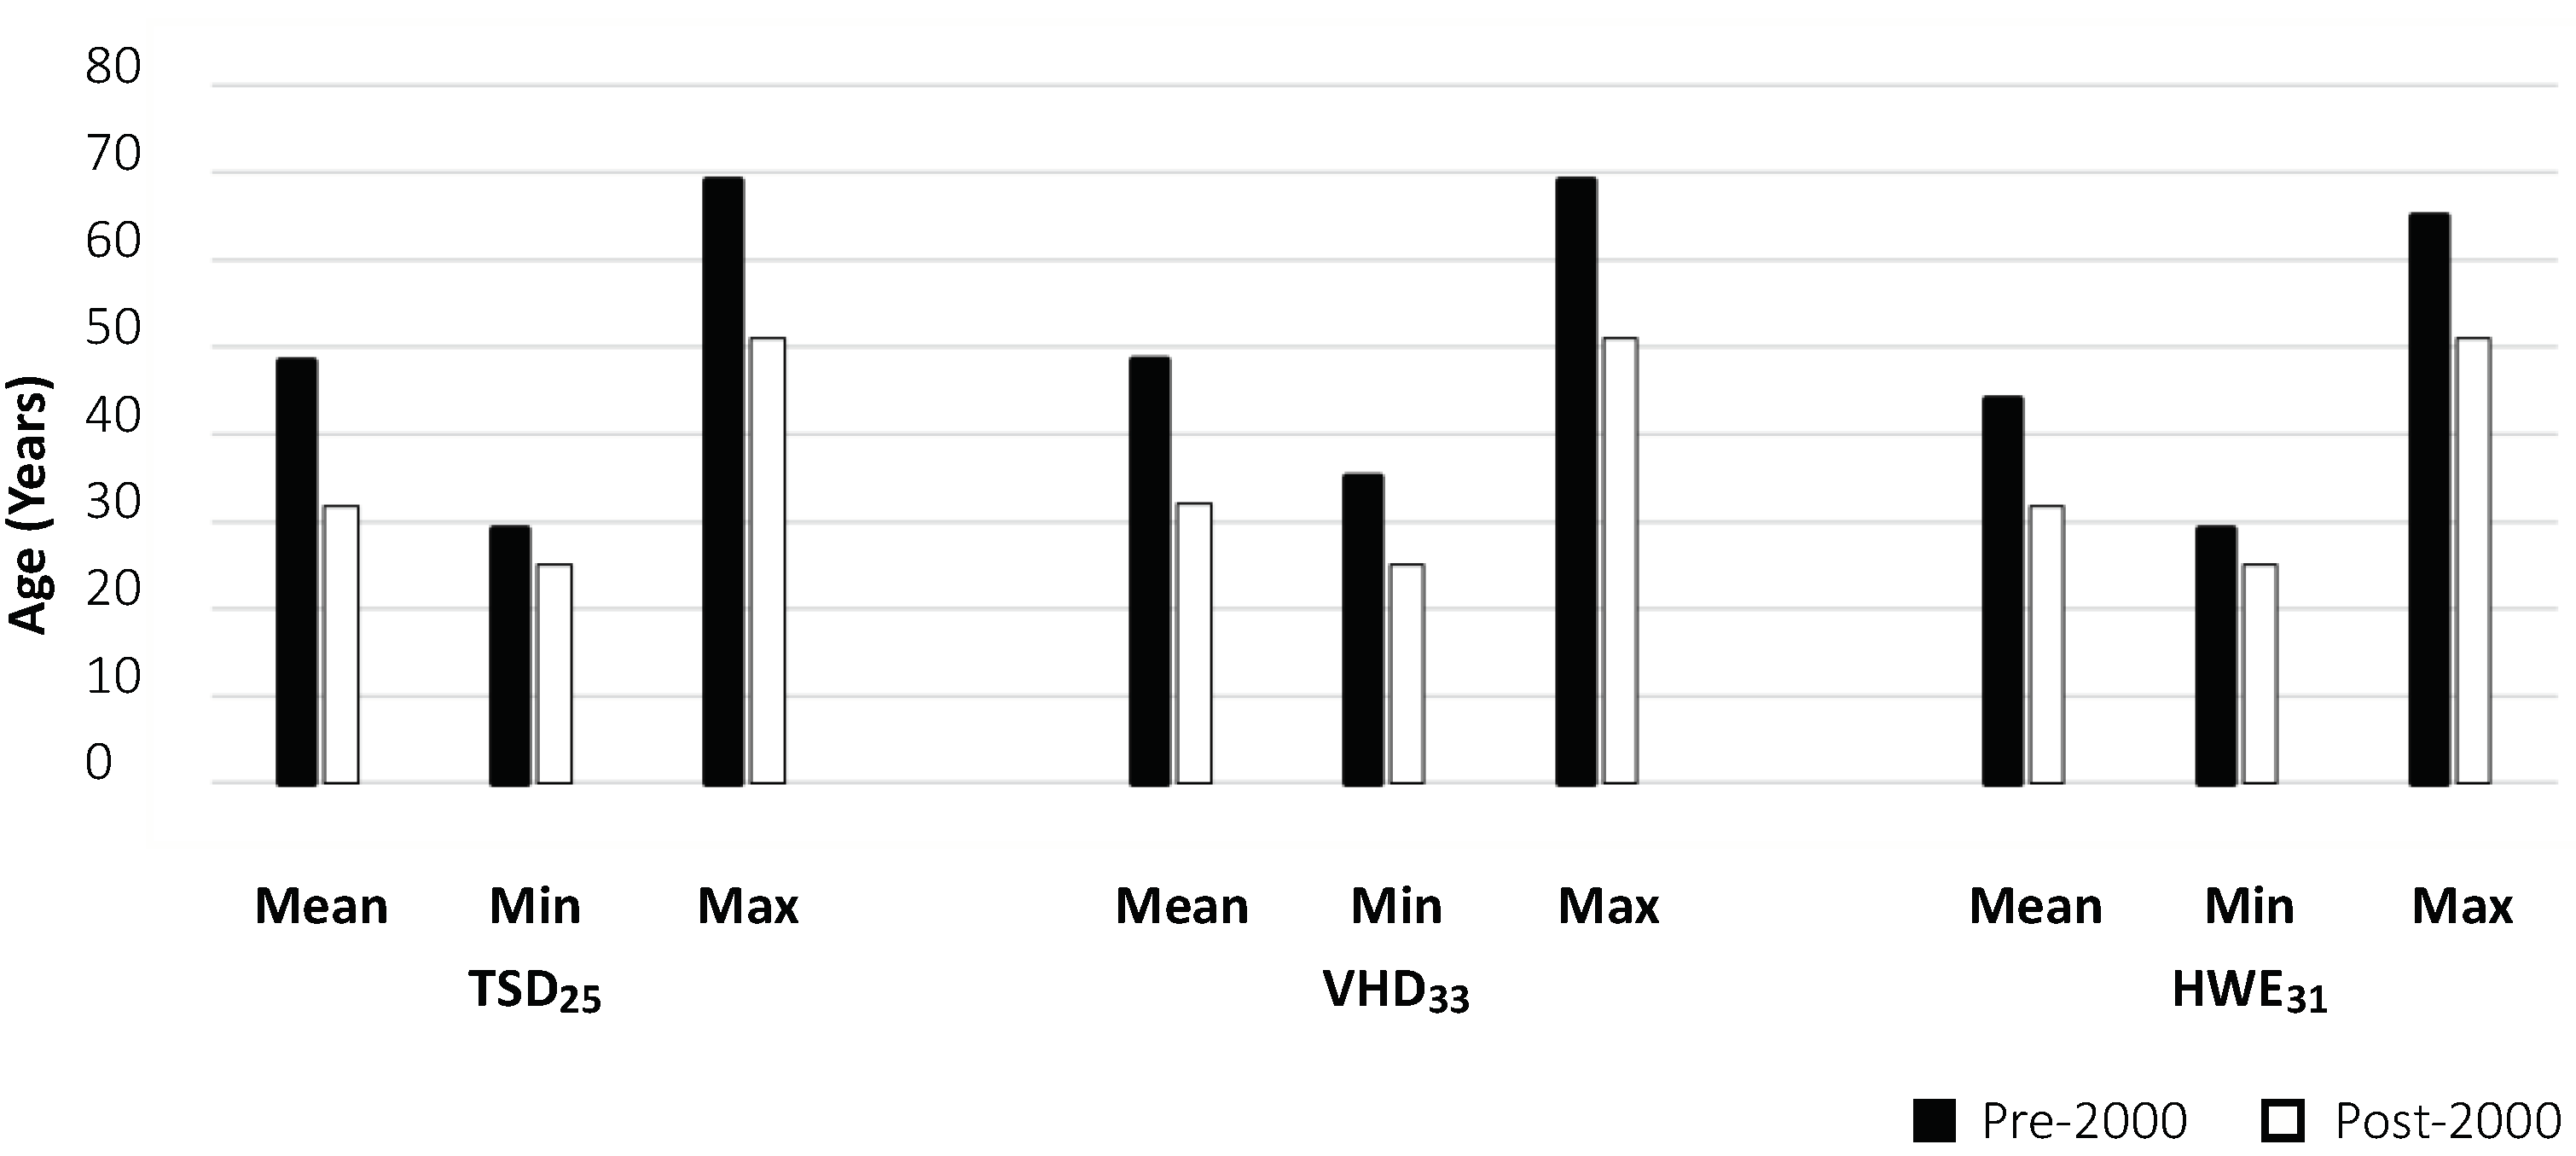
3.3.1. Individual Conditions
3.3.2. Psychological Evaluation of Thermal Conditions
3.3.3. Evaluation of Sleep Quality
4. Discussion
4.1. Relationship between Physiological and Psychological Thermal Comfort
4.2. Relationship between Pre-Sleep Thermal Comfort and Sleep Quality
4.3. Influence of Mechanical Ventilation on Thermal Comfort and Sleep Quality Evaluations
4.4. Management of Existing and Impending Heat Stress Events in Ankara to Address Human Sleep Quality in an Urban Context
4.5. Limitations and Future Studies
5. Concluding Remarks
Supplementary Materials
Author Contributions
Funding
Institutional Review Board Statement
Informed Consent Statement
Data Availability Statement
Conflicts of Interest
Abbreviations
| AMS | Ankara Meteorological Station |
| ASV | Air Velocity Sensation Vote |
| CCDI | Climate Change Detection Indices |
| CTIS | Climate-Tourism/Transfer-Information-Scheme |
| EBM | Energy Balance Model |
| HSV | Humidity Sensation Vote |
| HWE31 | Heat Wave Event |
| KG | Köppen–Geiger |
| KHS | Kestrel Heat Stress |
| MEMI | Munich Energy-Balance Model for Individuals |
| MRT | Mean Radiant Temperature (°C) |
| MRTIn | Indoor Mean Radiant Temperature (°C) |
| MRT20 | Tropical Nights |
| Oct | Octas |
| PET | Physiologically Equivalent Temperature (°C) |
| PETIn | Indoor Physiologically Equivalent Temperature (°C) |
| PETInPRE | Indoor Physiologically Equivalent Temperature in Pre-2000 Buildings (°C) |
| PETInPOST | Indoor Physiologically Equivalent Temperature in Post-2000 Buildings (°C) |
| PETOut | Outdoor Physiologically Equivalent Temperature (°C) |
| PS | Physiological Stress |
| REM | Rapid Eye Movement |
| RHIn | Indoor Relative Humidity (%) |
| RHInPRE | Indoor Relative Humidity in Pre-2000 Buildings (%) |
| RHInPOST | Indoor Relative Humidity in Post-2000 Buildings (%) |
| RHOut | Outdoor Relative Humidity (%) |
| SQV | Sleep Quality Vote/Ratio |
| TaIn | Indoor Air Temperature (°C) |
| TaInPRE | Indoor Air Temperature in Pre-2000 Buildings (°C) |
| TaInPOST | Indoor Air Temperature in Post-2000 Buildings (°C) |
| TaOut | Outdoor Air Temperature (°C) |
| Tcr | Core Body Temperature |
| TCV | Thermal Comfort Vote |
| TgIn | Indoor Globe Temperature (°C) |
| TSD25 | Typical Summer Day |
| Tsk | Skin Temperature |
| TSV | Thermal Sensation Vote |
| TÜBİTAK | Turkish National Scientific and Technological Research Council |
| VIn | Indoor Air Velocity (M/S) |
| VOut | Outdoor Wind Speed (M/S) |
| VHD33 | Very Hot Day |
References
- Cao, T.; Lian, Z.; Du, H.; Miyazaki, R.; Bao, J. Differences in Environmental Perception of Gender and Sleep Quality in Self-Regulating Sleep Thermal Environment. Indoor Built. Environ. 2021, 30, 1568–1579. [Google Scholar] [CrossRef]
- Dongmei, P.; Mingyin, C.; Shiming, D.; Minglu, Q. A Four-Node Thermoregulation Model for Predicting the Thermal Physiological Responses of a Sleeping Person. Build. Environ. 2012, 52, 88–97. [Google Scholar] [CrossRef]
- Krystal, A.D.; Edinger, J.D. Measuring Sleep Quality. Sleep Med. 2008, 9 (Suppl. S9), 10–17. [Google Scholar] [CrossRef] [PubMed]
- Buysse Charles F Reynolds Ill, D.J.; Monk, T.H.; Berman, S.R.; Kupfer, D.J. The Pittsburgh Sleep Quality Index: A New Instrument for Psychiatric Practice and Research. Psychiatry Res. 1988, 28, 193–195. [Google Scholar] [CrossRef] [PubMed]
- Zheng, G.; Li, K.; Wang, Y. The Effects of High-Temperature Weather on Human Sleep Quality and Appetite. Int. J. Environ. Res. Public Health 2019, 16, 270. [Google Scholar] [CrossRef]
- Zhang, N.; Cao, B.; Zhu, Y. Effects of Pre-Sleep Thermal Environment on Human Thermal State and Sleep Quality. Build. Environ. 2019, 148, 600–608. [Google Scholar] [CrossRef]
- Hill, T.D.; Burdette, A.M.; Hale, L. Neighborhood Disorder, Sleep Quality, and Psychological Distress: Testing a Model of Structural Amplification. Health Place 2009, 15, 1006–1013. [Google Scholar] [CrossRef]
- Kräuchi, K.; Cajochen, C.; Wirz-Justice, A. Circadian and Homeostatic Regulation of Core Body Temperature and Alertness in Humans: What Is the Role of Melatonin? Circadian Clocks Entrain. 1998, 7, 131–146. [Google Scholar]
- Raymann, R.J.E.M.; Dick, F.S.; van Someren, E.J.W. Cutaneous Warming Promotes Sleep Onset. Am. J. Physiol.-Regul. Integr. Comp. Physiol. 2005, 288, 1589–1597. [Google Scholar] [CrossRef]
- Okamoto-Mizuno, K.; Mizuno, K. Effects of Thermal Environment on Sleep and Circadian Rhythm. J. Physiol. Anthropol. 2012, 31, 14. [Google Scholar] [CrossRef]
- Murphy, P.J.; Campbell, S.S. Sleep Onset Nighttime Drop in Body Temperature: A Physiological Trigger for Sleep Onset? Sleep 1997, 20, 505–511. [Google Scholar] [CrossRef] [PubMed]
- Ko, Y.; Lee, J.Y. Effects of Feet Warming Using Bed Socks on Sleep Quality and Thermoregulatory Responses in a Cool Environment. J. Physiol. Anthr. 2018, 37, 13. [Google Scholar] [CrossRef] [PubMed]
- Kallawicha, K.; Boonvisut, S.; Chao, H.J.; Nitmetawong, T. Bedroom Environment and Sleep Quality of Apartment Building Residents in Urban Bangkok. Build. Environ. 2021, 188, 107474. [Google Scholar] [CrossRef]
- Lan, L.; Lian, Z. Ten Questions Concerning Thermal Environment and Sleep Quality. Build. Environ. 2016, 99, 252–259. [Google Scholar] [CrossRef]
- Haskell, E.H.; Palca, J.W.; Walker, J.M.; Berger, R.J.; Heller, H.C. The Effects of High and Low Ambient Temperatures on Human Sleep Stages. Electroencephalogr. Clin. Neurophysiol. 1981, 51, 494–501. [Google Scholar] [CrossRef] [PubMed]
- Sagot, J.C.; Amoros, C.; Candas, V.; Libert, J.P. Sweating Responses and Body Temperatures during Nocturnal Sleep in Humans. Am. J. Physiol.-Regul. Integr. Comp. Physiol. 1987, 252, 462–470. [Google Scholar] [CrossRef]
- Okamoto-Mizuno, K.; Mizuno, K.; Michie, S.; Maeda, A.; Iizuka, S. Effects of Humid Heat Exposure on Human Sleep Stages and Body Temperature. Sleep 1999, 22, 767–773. [Google Scholar] [CrossRef]
- Pan, L.; Lian, Z.; Lan, L. Investigation of Sleep Quality under Different Temperatures Based on Subjective and Physiological Measurements. HVAC R Res. 2012, 18, 1030–1043. [Google Scholar]
- Lan, L.; Pan, L.; Lian, Z.; Huang, H.; Lin, Y. Experimental Study on Thermal Comfort of Sleeping People at Different Air Temperatures. Build. Environ. 2014, 73, 24–31. [Google Scholar] [CrossRef]
- Staiger, H.; Laschewski, G.; Matzarakis, A. Selection of Appropriate Thermal Indices for Applications in Human Biometeorological Studies. Atmosphere 2019, 10, 18. [Google Scholar] [CrossRef]
- Nouri, A.S.; Afacan, Y.; Çalışkan, O.; Lin, T.-P.; Matzarakis, A.; Çalışkan, O.; Matzarakis, A.; De, A.M. Approaching Environmental Human Thermophysiological Thresholds for the Case of Ankara, Turkey. Theor. Appl. Climatol. 2021, 143, 533–555. [Google Scholar] [CrossRef] [PubMed]
- De Freitas, C.R.; Grigorieva, E.A. A Comprehensive Catalogue and Classification of Human Thermal Climate Indices. Int. J. Biometeorol. 2015, 59, 109–120. [Google Scholar] [CrossRef] [PubMed]
- Dongmei, P.; Zhongping, L.; Ning, M.; Mengjie, S. A Study on the Effects of Different Bedding Systems on Thermal Comfort—Quantifying the Sensitivity Coefficient Used for Calculating Predicted Mean Vote (PMV) in Sleeping Environments. Energy Procedia 2017, 142, 1939–1946. [Google Scholar] [CrossRef]
- Tsang, T.W.; Mui, K.W.; Wong, L.T. Investigation of Thermal Comfort in Sleeping Environment and Its Association with Sleep Quality. Build. Environ. 2021, 187, 107406. [Google Scholar] [CrossRef]
- Irshad, K.; Khan, A.I.; Algarni, S.; Habib, K.; Saha, B.B. Objective and Subjective Evaluation of a Sleeping Environment Test Chamber with a Thermoelectric Air Cooling System. Build. Environ. 2018, 141, 155–165. [Google Scholar] [CrossRef]
- Dewasmes, G.; Telliez, F.; Muzet, A.G. Effects of a Nocturnal Environment Perceived as Warm on Subsequent Daytime Sleep in Humans. Sleep 2000, 23, 409–413. [Google Scholar] [CrossRef]
- Cao, T.; Lian, Z.; Zhu, J.; Xu, X.; Du, H.; Zhao, Q. Parametric Study on the Sleep Thermal Environment. Build. Simul. 2022, 15, 885–898. [Google Scholar] [CrossRef]
- Nouri, A.S.; Costa, J.P.; Santamouris, M.; Matzarakis, A. Approaches to Outdoor Thermal Comfort Thresholds through Public Space Design: A Review. Atmosphere 2018, 9, 108. [Google Scholar] [CrossRef]
- Matzarakis, A.; Rutz, F.; Mayer, H. Modelling Radiation Fluxes in Simple and Complex Environments—Application of the RayMan Model. Int. J. Biometeorol. 2007, 51, 323–334. [Google Scholar] [CrossRef]
- Höppe, P. The Physiological Equivalent Temperature—A Universal Indexfor the Biometeorological Assessment of the Thermal Environment. Int. J. Biometeorol. 1999, 43, 71–75. [Google Scholar] [CrossRef]
- de Freitas, C.R.; Grigorieva, E.A. A Comparison and Appraisal of a Comprehensive Range of Human Thermal Climate Indices. Int. J. Biometeorol. 2017, 61, 487–512. [Google Scholar] [CrossRef] [PubMed]
- Charalampopoulos, I. A Comparative Sensitivity Analysis of Human Thermal Comfort Indices with Generalized Additive Models. Theor. Appl. Clim. 2019, 137, 1605–1622. [Google Scholar] [CrossRef]
- Mayer, H.; Höppe, P. Theoretical and Applied Climatoiogy Thermal Comfort of Man in Different Urban Environments. Theor. Appl. Clim. 1987, 38, 43–49. [Google Scholar] [CrossRef]
- Matzarakis, A.; Mayer, H. Heat Stress in Greece. Int. J. Biometeorol. 1997, 41, 34–39. [Google Scholar] [CrossRef]
- Samson, D.R.; Crittenden, A.N.; Mabulla, I.A.; Mabulla, A.Z.P. The Evolution of Human Sleep: Technological and Cultural Innovation Associated with Sleep-Wake Regulation among Hadza Hunter-Gatherers. J. Hum. Evol. 2017, 113, 91–102. [Google Scholar] [CrossRef]
- Nastos, P.T.; Matzarakis, A. Human-Biometeorological Effects on Sleep Disturbances in Athens, Greece: A Preliminary Evaluation. Indoor Built Environ. 2008, 17, 535–542. [Google Scholar] [CrossRef]
- Oke, T.R. The Urban Energy Balance. Prog. Phys. Geogr. 1988, 12, 471–508. [Google Scholar] [CrossRef]
- Kownacki, K.L.; Gao, C.; Kuklane, K.; Wierzbicka, A. Heat Stress in Indoor Environments of Scandinavian Urban Areas: A Literature Review. Int. J. Environ. Res. Public Health 2019, 16, 560. [Google Scholar] [CrossRef]
- Walikewitz, N.; Jänicke, B.; Langner, M.; Endlicher, W. Assessment of Indoor Heat Stress Variability in Summer and during Heat Warnings: A Case Study Using the UTCI in Berlin, Germany. Int. J. Biometeorol. 2018, 62, 29–42. [Google Scholar] [CrossRef]
- Akkose, G.; Meral Akgul, C.; Dino, I.G. Educational Building Retrofit under Climate Change and Urban Heat Island Effect. J. Build. Eng. 2021, 40, 102294. [Google Scholar] [CrossRef]
- Santamouris, M. Regulating the Damaged Thermostat of the Cities—Status, Impacts and Mitigation Challenges. Energy Build. 2015, 91, 43–56. [Google Scholar] [CrossRef]
- Zemtsov, S.; Shartova, N.; Varentsov, M.; Konstantinov, P.; Kidyaeva, V.; Shchur, A.; Timonin, S.; Grischchenko, M. Intraurban Social Risk and Mortality Patterns during Extreme Heat Events: A Case Study of Moscow, 2010–2017. Health Place 2020, 66, 102429. [Google Scholar] [CrossRef] [PubMed]
- Roaf, S.; Crichton, D.; Nicol, F. Adapting Buildings and Cities for Climate Change: A 21st Century Survival Guide; Routledge: London, UK, 2009; ISBN 9781856177207. [Google Scholar]
- Nouri, A.S.; Çalışkan, O.; Charalampopoulos, I.; Cheval, S.; Matzarakis, A. Defining Local Extreme Heat Thresholds and Indoor Cooling Degree Necessity for Vulnerable Residential Dwellings during the 2020 Summer in Ankara—Part I: Air Temperature. Sol. Energy 2021, 242, 435–453. [Google Scholar] [CrossRef]
- Esiyok, U. Energy Consumption and Thermal Performance of Typical Residential Buildings in Turkey. Ph.D. Thesis, University of Dortmund, Dortmund, Germany, 2006. [Google Scholar]
- Özkan, S. Capital City of Ankara’s Housing Problem in Urbanization. Educ. Soc. 21st Century 2018, 7, 383–424. [Google Scholar]
- Karaca, M.; Tayanç, M.; Toros, H. Effects of Urbanization on Climate of Istanbul and Ankara. Atmos. Environ. 1995, 29, 3411–3421. [Google Scholar] [CrossRef]
- Peel, M.C.; Finlayson, B.L.; Mcmahon, T.A. Updated World Map of the Köppen-Geiger Climate Classification. Hydrol. Earth Syst. Sci. 2007, 11, 1633–1644. [Google Scholar] [CrossRef]
- Akkor, G. 1st, 2nd, 3rd, 4th, 5th, Blocks North View; Bilkent University Directorate of Construction and Technical Works Faculty Housing: Ankara, Türkiye, 1985. [Google Scholar]
- Bütüner, H. System Detail; Bilkent University Directorate of Construction and Technical Works Faculty Housing: Ankara, Türkiye, 2021. [Google Scholar]
- Nouri, A.S.; Charalampopoulos, I.; Matzarakis, A. The Application of the Physiologically Equivalent Temperature to Determine Impacts of Locally Defined Extreme Heat Events within Vulnerable Dwellings during the 2020 Summer in Ankara. Sustain. Cities Soc. 2022, 81, 103833. [Google Scholar] [CrossRef]
- Rosenfelder, M.; Koppe, C.; Pfafferott, J.; Matzarakis, A. Effects of Ventilation Behaviour on Indoor Heat Load Based on Test Reference Years. Int. J. Biometeorol. 2016, 60, 277–287. [Google Scholar] [CrossRef]
- Basu, R.; Samet, J.M. Relation between Elevated Ambient Temperature and Mortality: A Review of the Epidemiologic Evidence. Epidemiol. Rev. 2002, 24, 190–202. [Google Scholar] [CrossRef]
- Gustin, M.; McLeod, R.S.; Lomas, K.J. Forecasting Indoor Temperatures during Heatwaves Using Time Series Models. Build. Environ. 2018, 143, 727–739. [Google Scholar] [CrossRef]
- White-Newsome, J.L.; Sánchez, B.N.; Jolliet, O.; Zhang, Z.; Parker, E.A.; Timothy Dvonch, J.; O’Neill, M.S. Climate Change and Health: Indoor Heat Exposure in Vulnerable Populations. Environ. Res 2012, 112, 20–27. [Google Scholar] [CrossRef] [PubMed]
- Yılmaz, E. Urban Heat Island in Ankara with Travers. Coğrafi Bilim. Derg. 2019, 17, 281–317. [Google Scholar] [CrossRef]
- Türkoğlu, N.; Çalışkan, O.; Çiçek, İ.; Yılmaz, E. The Analysis of Impact of Urbanization on the Bioclimatic Conditions in the Scale of Ankara. Uluslararası İnsan Bilim. Derg. 2012, 9, 932–955. [Google Scholar]
- Çiçek, I.; Doǧan, U. Detection of Urban Heat Island in Ankara, Turkey. Nuovo C. Della Soc. Ital. Fis. C 2006, 29, 399–409. [Google Scholar] [CrossRef]
- Çalışkan, O.; Türkoğlu, N. The Trends and Effects of Urbanization on Thermal Comfort Conditions in Ankara. Coğrafi Bilim. Derg. 2014, 12, 119–132. [Google Scholar] [CrossRef]
- Kuglitsch, F.G.; Toreti, A.; Xoplaki, E.; Della-Marta, P.M.; Zerefos, C.S.; Trke, M.; Luterbacher, J. Heat Wave Changes in the Eastern Mediterranean since 1960. Geophys. Res. Lett. 2010, 37. [Google Scholar] [CrossRef]
- Demirtaş, M. The High-Impact 2007 Hot Summer over Turkey: Atmospheric-Blocking and Heat-Wave Episodes. Meteorol. Appl. 2018, 25, 406–413. [Google Scholar] [CrossRef]
- Can, G.; Şahin, Ü.; Sayılı, U.; Dubé, M.; Kara, B.; Acar, H.C.; İnan, B.; Sayman, Ö.A.; Lebel, G.; Bustinza, R.; et al. Excess Mortality in Istanbul during Extreme Heat Waves between 2013 and 2017. Int. J. Environ. Res. Public Health 2019, 16, 4348. [Google Scholar] [CrossRef]
- Luber, G.; McGeehin, M. Climate Change and Extreme Heat Events. Am. J. Prev. Med. 2008, 35, 429–435. [Google Scholar] [CrossRef]
- Xu, X.; Lian, Z.; Shen, J.; Lan, L.; Sun, Y. Environmental Factors Affecting Sleep Quality in Summer: A Field Study in Shanghai, China. J. Therm. Biol. 2021, 99, 102977. [Google Scholar] [CrossRef]
- Yan, Y.; Lan, L.; Zhang, H.; Sun, Y.; Fan, X.; Wyon, D.P.; Wargocki, P. Association of Bedroom Environment with the Sleep Quality of Elderly Subjects in Summer: A Field Measurement in Shanghai, China. Build. Environ. 2022, 208, 108572. [Google Scholar] [CrossRef]
- Liu, W.T.; Wang, Y.H.; Chang, L.T.; Wu, C.D.; Wu, D.; Tsai, C.Y.; Lo, C.C.; Lo, K.; Chung, K.F.; Chang, T.Y.; et al. The Impacts of Ambient Relative Humidity and Temperature on Supine Position-Related Obstructive Sleep Apnea in Adults. Environ. Sci. Pollut. Res. 2022, 29, 50755–50764. [Google Scholar] [CrossRef] [PubMed]
- Okamoto-Mizuno, K.; Tsuzuki, K.; Mizuno, K.; Iwaki, T. Effects of Partial Humid Heat Exposure during Different Segments of Sleep on Human Sleep Stages and Body Temperature. Physiol. Behav. 2005, 83, 759–765. [Google Scholar] [CrossRef] [PubMed]
- Tsuzuki, K.; Mori, I.; Sakoi, T.; Kurokawa, Y. Effects of Seasonal Illumination and Thermal Environments on Sleep in Elderly Men. Build. Environ. 2015, 88, 82–88. [Google Scholar] [CrossRef]
- Ghani, S.; Mahgoub, A.O.; Bakochristou, F.; ElBialy, E.A. Assessment of Thermal Comfort Indices in an Open Air-Conditioned Stadium in Hot and Arid Environment. J. Build. Eng. 2021, 40, 102378. [Google Scholar] [CrossRef]
- Ouyang, W.; Liu, Z.; Lau, K.; Shi, Y.; Ng, E. Comparing Different Recalibrated Methods for Estimating Mean Radiant Temperature in Outdoor Environment. Build. Environ. 2022, 216, 109004. [Google Scholar] [CrossRef]
- Sulzer, M.; Christen, A.; Matzarakis, A. A Low-Cost Sensor Network for Real-Time Thermal Stress Monitoring and Communication in Occupational Contexts. Sensors 2022, 22, 1828. [Google Scholar] [CrossRef]
- Davtalab, J.; Deyhimi, S.P.; Dessi, V.; Hafezi, M.R.; Adib, M. The Impact of Green Space Structure on Physiological Equivalent Temperature Index in Open Space. Urban Clim. 2020, 31, 100574. [Google Scholar] [CrossRef]
- d’Ambrosio Alfano, F.R.; Dell’Isola, M.; Ficco, G.; Palella, B.I.; Riccio, G. Small Globes and Pocket Heat Stress Meters for WBGT and PHS Evaluations. A Critical Analysis under Controlled Conditions. Build. Environ. 2022, 226, 109781. [Google Scholar] [CrossRef]
- Oliveira, A.V.M.; Raimundo, A.M.; Gaspar, A.R.; Quintela, D.A. Globe Temperature and Its Measurement: Requirements and Limitations. Ann. Work. Expo. Health 2019, 63, 743–758. [Google Scholar] [CrossRef]
- Höppe, P. Heat Balance Modelling. Experientia 1993, 49, 741–746. [Google Scholar] [CrossRef]
- Höppe, P. The Energy Balance in Humans (Original Title—Die Energiebilanz Des Menschen) Munich; Universitat Munchen, Meteorologisches Institut: Munchen, Germany, 1984. [Google Scholar]
- Nouri, A.S.; Charalampopoulos, I.; Matzarakis, A. Beyond Singular Climatic Variables—Identifying the Dynamics of Wholesome Thermo-Physiological Factors for Existing/Future Human Thermal Comfort during Hot Dry Mediterranean Summers. Int. J. Environ. Res. Public Health 2018, 15, 2362. [Google Scholar] [CrossRef] [PubMed]
- Matzarakis, A. Applications of a Universal Thermal Index- Physiological Equivalent Temperature. Int. J. Biometeorol. 1999, 43, 76–84. [Google Scholar] [CrossRef] [PubMed]
- Nouri, A.S. A Bottom-up Perspective upon Climate Change—Approaches towards the Local Scale and Microclimatic Assessment; Taylor & Francis: Lisbon, Portugal, 2013; pp. 119–124. [Google Scholar]
- Matzarakis, A.; Rutz, F.; Mayer, H. Modelling Radiation Fluxes in Simple and Complex Environments: Basics of the RayMan Model. Int. J. Biometeorol. 2010, 54, 131–139. [Google Scholar] [CrossRef]
- Matzarakis, A.; Fröhlich, D. Influence of Urban Green on Human Thermal Bioclimate—Application of Thermal Indices and Micro-Scale Models. In Proceedings of the Influence of Urban Green on Human Thermal Bioclimate—Application of Thermal Indices and Micro-Scale Models, Bologna, Italy, 12–15 September 2017; pp. 1–10. [Google Scholar] [CrossRef]
- Budiawan, W.; Tsuzuki, K. Thermal Comfort and Sleep Quality of Indonesian Students Living in Japan during Summer and Winter. Buildings 2021, 11, 326. [Google Scholar] [CrossRef]
- Wang, Y.; Liu, Y.; Song, C.; Liu, J. Appropriate Indoor Operative Temperature and Bedding Micro Climate Temperature That Satisfies the Requirements of Sleep Thermal Comfort. Build. Environ. 2015, 92, 20–29. [Google Scholar] [CrossRef]
- Zhang, X.; Luo, G.; Xie, J.; Liu, J. Associations of Bedroom Air Temperature and CO2 Concentration with Subjective Perceptions and Sleep Quality during Transition Seasons. Indoor Air 2021, 31, 1004–1017. [Google Scholar] [CrossRef]
- Lai, D.; Lian, Z.; Liu, W.; Guo, C.; Liu, W.; Liu, K.; Chen, Q. A Comprehensive Review of Thermal Comfort Studies in Urban Open Spaces. Sci. Total Environ. 2020, 742, 140092. [Google Scholar] [CrossRef]
- Liu, Y.; Song, C.; Wang, Y.; Wang, D.; Liu, J. Experimental Study and Evaluation of the Thermal Environment for Sleeping. Build. Environ. 2014, 82, 546–555. [Google Scholar] [CrossRef]
- Zhang, H. Human Thermal Sensation and Comfort in Transient and Non-Uniform Thermal Environments; University of California: Berkeley, CA, USA, 2003. [Google Scholar]
- ANSI/ASHRAE Standard 55-2017; Thermal Environmental Conditions for Human Occupancy. American Society of Heating. Refrigeration and Airconditioning Engineers: Atlanta, GA, USA, 2017.
- Tsuzuki, K.; Okamoto-Mizuno, K.; Mizuno, K.; Iwaki, T. Effects of Airflow on Body Temperatures and Sleep Stages in a Warm Humid Climate. Int. J. Biometeorol. 2008, 52, 261–270. [Google Scholar] [CrossRef]
- Zhang, N.; Cao, B.; Zhu, Y. Indoor Environment and Sleep Quality: A Research Based on Online Survey and Field Study. Build. Environ. 2018, 137, 198–207. [Google Scholar] [CrossRef]
- Song, C.; Zhao, T.; Song, Z.; Liu, Y. Effects of Phased Sleeping Thermal Environment Regulation on Human Thermal Comfort and Sleep Quality. Build. Environ. 2020, 181, 107108. [Google Scholar] [CrossRef]
- Song, C.; Liu, Y.; Zhou, X.; Liu, J. Investigation of Human Thermal Comfort in Sleeping Environments Based on the Effects of Bed Climate. Procedia Eng. 2015, 121, 1126–1132. [Google Scholar] [CrossRef]
- Morito, N.; Tsuzuki, K.; Mori, I.; Nishimiya, H. Effects of Two Kinds of Air Conditioner Airflow on Human Sleep and Thermoregulation. Energy Build. 2017, 138, 490–498. [Google Scholar] [CrossRef]
- Zaki, S.A.; Rosli, M.F.; Rijal, H.B.; Sadzli, F.N.H.; Hagishima, A.; Yakub, F. Effectiveness of a Cool Bed Linen for Thermal Comfort and Sleep Quality in Air-Conditioned Bedroom under Hot-Humid Climate. Sustainability 2021, 13, 9099. [Google Scholar] [CrossRef]
- Zilli, I.; Ficca, G.; Salzarulo, P. Factors Involved in Sleep Satisfaction in the Elderly. Sleep Med. 2009, 10, 233–239. [Google Scholar] [CrossRef]
- Akerstedt, T.; Hume, K.; Minors, D.; Waterhouse, J. Good Sleep-Its Timing and Physiological Sleep Characteristics. J. Sleep Res. 1997, 6, 221–229. [Google Scholar] [CrossRef]
- Matzarakis, A. Transfer of Climate Data for Tourism Applications-The Climate-Tourism/Transfer-Information-Scheme. Sustain. Environ. Res. 2014, 24, 273–280. [Google Scholar]
- Lin, T.P.; Matzarakis, A. Tourism Climate and Thermal Comfort in Sun Moon Lake, Taiwan. Int. J. Biometeorol. 2008, 52, 281–290. [Google Scholar] [CrossRef]
- Zaninović, K.; Matzarakis, A. The Bioclimatological Leaflet as a Means Conveying Climatological Information to Tourists and the Tourism Industry. Int. J. Biometeorol. 2009, 53, 369–374. [Google Scholar] [CrossRef]
- Djamila, H.; Chu, C.-M.; Kumaresan, S. Effect of Humidity on Thermal Comfort in the Humid Tropics. J. Build. Constr. Plan. Res. 2014, 2, 109–117. [Google Scholar] [CrossRef]
- Harlan, S.L.; Brazel, A.J.; Prashad, L.; Stefanov, W.L.; Larsen, L. Neighborhood Microclimates and Vulnerability to Heat Stress. Soc. Sci. Med. 2006, 63, 2847–2863. [Google Scholar] [CrossRef] [PubMed]
- Shaviv, E.; Yezioro, A.; Capeluto, I.G. Thermal Mass and Night Ventilation as Passive Cooling Design Strategy. Renew. Energy 2001, 24, 445–452. [Google Scholar] [CrossRef]
- Piasecki, M.; Radziszewska-Zielina, E.; Czerski, P.; Fedorczak-Cisak, M.; Zielina, M.; Krzyściak, P.; Kwaśniewska-Sip, P.; Grześkowiak, W. Implementation of the Indoor Environmental Quality (Ieq) Model for the Assessment of a Retrofitted Historical Masonry Building. Energies 2020, 13, 6051. [Google Scholar] [CrossRef]
- Pal, R.K. Thermal Performance of an Insulated and Window Area Optimized House. J. Eng. Sci. Technol. 2018, 13, 1090–1110. [Google Scholar]
- Dikmen, N. Performance Analysis of the External Wall Thermal Insulation Systems Applied in Residences. J. Therm. Sci. Technol. 2011, 31, 67–76. [Google Scholar]
- Amirzadeh, A.; Strand, R.K.; Hammann, R.E.; Bhandari, M.S. Determination and Assessment of Optimum Internal Thermal Insulation for Masonry Walls in Historic Multifamily Buildings. J. Archit. Eng. 2018, 24, 4018016. [Google Scholar] [CrossRef]
- Hansen, T.K.; Bjarløv, S.P.; Peuhkuri, R.H.; Harrestrup, M. Long Term in Situ Measurements of Hygrothermal Conditions at Critical Points in Four Cases of Internally Insulated Historic Solid Masonry Walls. Energy Build. 2018, 172, 235–248. [Google Scholar] [CrossRef]
- Lotfabadi, P.; Hançer, P. A Comparative Study of Traditional and Contemporary Building Envelope Construction Techniques in Terms of Thermal Comfort and Energy Efficiency in Hot and Humid Climates. Sustainability 2019, 11, 3582. [Google Scholar] [CrossRef]
- Kaynakli, O. A Review of the Economical and Optimum Thermal Insulation Thickness for Building Applications. Renew. Sustain. Energy Rev. 2012, 16, 415–425. [Google Scholar] [CrossRef]
- Ealiwa, M.A.; Taki, A.H.; Howarth, A.T.; Seden, M.R. An Investigation into Thermal Comfort in the Summer Season of Ghadames, Libya. Build. Environ. 2001, 36, 231–237. [Google Scholar] [CrossRef]
- Schaudienst, F.; Vogdt, F.U. Fanger’s Model of Thermal Comfort: A Model Suitable Just for Men? Energy Procedia 2017, 132, 129–134. [Google Scholar] [CrossRef]
- Schellen, L.; van Marken Lichtenbelt, W.D.; Loomans, M.G.L.C.; Toftum, J.; de Wit, M.H. Differences between Young Adults and Elderly in Thermal Comfort, Productivity, and Thermal Physiology in Response to a Moderate Temperature Drift and a Steady-State Condition. Indoor Air 2010, 20, 273–283. [Google Scholar] [CrossRef] [PubMed]
- Bischof, W.; Lund Madsen, T.; Clausen, J.; Madsen, P.L.; Wildschiodtz, G. Sleep and the Temperature Field of the Bed. J. Therm. Biol. 1993, 5, 393–398. [Google Scholar] [CrossRef]
- Okamoto-Mizuno, K.; Tsuzuki, K. Effects of Season on Sleep and Skin Temperature in the Elderly. Int. J. Biometeorol. 2010, 54, 401–409. [Google Scholar] [CrossRef]
- Van Someren, E.J.W. Chapter 18: Mechanisms and Functions of Coupling between Sleep and Temperature Rhythms. Prog. Brain Res. 2006, 153, 309–324. [Google Scholar] [CrossRef]
- Nikolopoulou, M.; Steemers, K. Thermal Comfort and Psychological Adaptation as a Guide for Designing Urban Spaces. Energy Build 2003, 35, 95–101. [Google Scholar] [CrossRef]
- Ji, W.; Cao, B.; Geng, Y.; Zhu, Y.; Lin, B. A Study on the Influences of Immediate Thermal History on Current Thermal Sensation. Energy Build 2019, 198, 364–376. [Google Scholar] [CrossRef]
- Brager, G.S.; de Dear, R.J. Thermal Adaptation in the Built Environment: A Literature Review. Energy Build. 1998, 27, 83–96. [Google Scholar] [CrossRef]
- Vargas, G.A.; Stevenson, F. Thermal Memory and Transition in Lobby Spaces. Energy Procedia 2014, 62, 502–511. [Google Scholar] [CrossRef]
- Fadeyi, M.O. Initial Study on the Impact of Thermal History on Building Occupants’ Thermal Assessments in Actual Air-Conditioned Office Buildings. Build. Environ. 2014, 80, 36–47. [Google Scholar] [CrossRef]
- Kalmár, F. Investigation of Thermal Perceptions of Subjects with Diverse Thermal Histories in Warm Indoor Environment. Build. Environ. 2016, 107, 254–262. [Google Scholar] [CrossRef]
- Zhang, Y.; Chen, H.; Wang, J.; Meng, Q. Thermal Comfort of People in the Hot and Humid Area of China—Impacts of Season, Climate, and Thermal History. Indoor Air 2016, 26, 820–830. [Google Scholar] [CrossRef] [PubMed]
- Jowkar, M.; de Dear, R.; Brusey, J. Influence of Long-Term Thermal History on Thermal Comfort and Preference. Energy Build. 2020, 210, 109685. [Google Scholar] [CrossRef]
- Chun, C.; Kwok, A.; Mitamura, T.; Miwa, N.; Tamura, A. Thermal Diary: Connecting Temperature History to Indoor Comfort. Build. Environ. 2008, 43, 877–885. [Google Scholar] [CrossRef]
- Amin, R.; Teli, D.; James, P.; Bourikas, L. The Influence of a Student’s “home” Climate on Room Temperature and Indoor Environmental Controls Use in a Modern Halls of Residence. Energy Build. 2016, 119, 331–339. [Google Scholar] [CrossRef]
- Kubota, T.; Chyee, D.T.H.; Ahmad, S. The Effects of Night Ventilation Technique on Indoor Thermal Environment for Residential Buildings in Hot-Humid Climate of Malaysia. Energy Build. 2009, 41, 829–839. [Google Scholar] [CrossRef]
- Wallace, L.A.; Emmerich, S.J.; Howard-Reed, C. Continuous Measurements of Air Change Rates in an Occupied House for 1 Year: The Effect of Temperature, Wind, Fans, and Windows. J. Expo. Anal. Environ. Epidemiol. 2002, 12, 296–306. [Google Scholar] [CrossRef] [PubMed]
- Kong, D.; Liu, H.; Wu, Y.; Li, B.; Wei, S.; Yuan, M. Effects of Indoor Humidity on Building Occupants’ Thermal Comfort and Evidence in Terms of Climate Adaptation. Build. Environ. 2019, 155, 298–307. [Google Scholar] [CrossRef]
- Jing, S.; Li, B.; Tan, M.; Liu, H. Impact of Relative Humidity on Thermal Comfort in a Warm Environment. Indoor Built Environ. 2013, 22, 598–607. [Google Scholar] [CrossRef]
- Ozel, M. Thermal Performance and Optimum Insulation Thickness of Building Walls with Different Structure Materials. Proc. Appl. Therm. Eng. 2011, 31, 3854–3863. [Google Scholar] [CrossRef]
- Jelle, B.P. Traditional, State-of-the-Art and Future Thermal Building Insulation Materials and Solutions—Properties, Requirements and Possibilities. Energy Build. 2011, 43, 2549–2563. [Google Scholar] [CrossRef]
- Halawa, E.; Ghaffarianhoseini, A.; Ghaffarianhoseini, A.; Trombley, J.; Hassan, N.; Baig, M.; Yusoff, S.Y.; Azzam Ismail, M. A Review on Energy Conscious Designs of Building Façades in Hot and Humid Climates: Lessons for (and from) Kuala Lumpur and Darwin. Renew. Sustain. Energy Rev. 2018, 82, 2147–2161. [Google Scholar] [CrossRef]
- Matzarakis, A.; Amelung, B. Physiological Equivalent Temperature as Indicator for Impacts of Climate Change on Thermal Comfort of Humans. Adv. Glob. Chang. Res. 2008, 30, 161–172. [Google Scholar] [CrossRef]
- Lan, L.; Tsuzuki, K.; Liu, Y.F.; Lian, Z.W. Thermal Environment and Sleep Quality: A Review. Energy Build. 2017, 149, 101–113. [Google Scholar] [CrossRef]
- Buysse, D.J.; Reynolds Iii, C.F.; Monk, T.H.; Hoch, C.C.; Yeager, A.L.; Kupfer, D.J. Quantification of Subjective Sleep Quality in Healthy Elderly Men and Women Using the Pittsburgh Sleep Quality Index (PSQI). Sleep 1991, 14, 331–338. [Google Scholar] [CrossRef]
- Vitiello, M.V.; Larsen, L.H.; Moe, K.E. Age-Related Sleep Change: Gender and Estrogen Effects on the Subjective-Objective Sleep Quality Relationships of Healthy, Noncomplaining Older Men and Women. J. Psychosom. Res. 2004, 56, 503–510. [Google Scholar] [CrossRef]
- Muzet, A.; Libert, J.; Candas, V. Ambient Temperature and Human Sleep. Experienta 1984, 40, 425–429. [Google Scholar] [CrossRef]
- Troynikov, O.; Watson, C.G.; Nawaz, N. Sleep Environments and Sleep Physiology: A Review. J. Therm. Biol. 2018, 78, 192–203. [Google Scholar] [CrossRef]
- Fujii, H.; Fukuda, S.; Narumi, D.; Ihara, T.; Watanabe, Y. Fatigue and Sleep under Large Summer Temperature Differences. Environ. Res. 2015, 138, 17–21. [Google Scholar] [CrossRef]
- Sekhar, S.C.; Goh, S.E. Thermal Comfort and IAQ Characteristics of Naturally/Mechanically Ventilated and Air-Conditioned Bedrooms in a Hot and Humid Climate. Build. Environ. 2011, 46, 1905–1916. [Google Scholar] [CrossRef]
- Matzarakis, A.; Mayer, H. Atmospheric Conditions and Human Thermal Comfort in Urban Areas. In Proceedings of the 11th Seminar on Environmental Protection “Environment and Health, Thessaloniki, Greece, 20–23 November 2000; pp. 20–23. [Google Scholar]
- Nouri, A.S.; Matzarakis, A. The Maturing Interdisciplinary Relationship between Human Biometeorological Aspects and Local Adaptation Processes: An Encompassing Overview. Climate 2019, 7, 134. [Google Scholar] [CrossRef]
- Jendritzky, G.; de Dear, R.; Havenith, G. UTCI-Why Another Thermal Index? Int. J. Biometeorol. 2012, 56, 421–428. [Google Scholar] [CrossRef]
- Biardeau, L.T.; Davis, L.W.; Gertler, P.; Wolfram, C. Heat Exposure and Global Air Conditioning. Nat. Sustain. 2020, 3, 25–28. [Google Scholar] [CrossRef]
- Cheung, P.K.; Jim, C.Y. Impacts of Air Conditioning on Air Quality in Tiny Homes in Hong Kong. Sci. Total Environ. 2019, 684, 434–444. [Google Scholar] [CrossRef]
- Salamanca, F.; Georgescu, M.; Mahalov, A.; Moustaoui, M.; Wang, M. Anthropogenic Heating of the Urban Environment Due to Air Conditioning. J. Geophys. Res. 2014, 119, 5949–5965. [Google Scholar] [CrossRef]
- De Munck, C.; Pigeon, G.; Masson, V.; Meunier, F.; Bousquet, P.; Tréméac, B.; Merchat, M.; Poeuf, P.; Marchadier, C. How Much Can Air Conditioning Increase Air Temperatures for a City like Paris, France? Int. J. Climatol. 2013, 33, 210–227. [Google Scholar] [CrossRef]
- Farbotko, C.; Waitt, G. Residential Air-Conditioning and Climate Change: Voices of the Vulnerable. Health Promot. J. Aust. 2011, 22, 13–15. [Google Scholar] [CrossRef]
- Matzarakis, A.; Laschewski, G.; Muthers, S. The Heat Health Warning System in Germany—Application and Warnings for 2005 to 2019. Atmosphere 2020, 11, 170. [Google Scholar] [CrossRef]
- Kovats, R.S.; Hajat, S. Heat Stress and Public Health: A Critical Review. Annu. Rev. Public Health 2008, 29, 41–55. [Google Scholar] [CrossRef]
- Grandner, M.A.; Jackson, N.; Gerstner, J.R.; Knutson, K.L. Dietary Nutrients Associated with Short and Long Sleep Duration. Data from a Nationally Representative Sample. Appetite 2013, 64, 71–80. [Google Scholar] [CrossRef] [PubMed]
- Frank, S.; Gonzalez, K.; Lee-Ang, L.; Young, M.C.; Tamez, M.; Mattei, J. Diet and Sleep Physiology: Public Health and Clinical Implications. Front. Neurol. 2017, 8, 393. [Google Scholar] [CrossRef] [PubMed]
- Lam, C.K.C.; Gao, Y.; Yang, H.; Chen, T.; Zhang, Y.; Ou, C.; Hang, J. Interactive Effect between Long-Term and Short-Term Thermal History on Outdoor Thermal Comfort: Comparison between Guangzhou, Zhuhai and Melbourne. Sci. Total Environ. 2021, 760, 144141. [Google Scholar] [CrossRef] [PubMed]
- Erlat, E.; Türkeş, M. Observed Changes and Trends in Numbers of Summer and Tropical Days, and the 2010 Hot Summer in Turkey. Int. J. Climatol. 2013, 33, 1898–1908. [Google Scholar] [CrossRef]


| KG Class | Description of KG Class | Specific Environmental Thresholds | ||||
|---|---|---|---|---|---|---|
| General Classification Descriptors | Precipitation Descriptors | Temperature Descriptors | ||||
| General Description | Climate Specification | General Description | Climate Specification | |||
| ‘Dsb’ | Snow/cold climate and dry/warm summer | Thot ≤ 21 °C and Tcold ≤ 0 | Dry summer | Psdry < 40 and Psdry < Pwwet/3 | Warm summer | Thot ≤ 21 °C and Tmon10 ≥ 4 |
| ‘Dsa’ | Snow/cold climate and dry/hot summer | Thot ≤ 21 °C and Tcold ≤ 0 | Dry summer | Psdry < 40 and Psdry < Pwwet/3 | Hot summer | Thot ≥ 22 °C |
| ‘Csa’ | Warm temperate and dry/hot summer | Thot > 10 °C and Tcold< 18 | Dry summer | Psdry < 40 and Psdry < Pwwet/3 | Hot summer | Thot ≥ 22 °C |
| ‘BSk’ | Cold semi-arid climate | MAP < 10 × Pthreshold | Steppe | MAP ≥ 5 × Pthreshold | Cold | MAT <18 °C |
| Climatic Variable | Accuracy | Resolution | Specification Range |
|---|---|---|---|
| Air Temperature (TaIn) | 0.5 °C | 0.1 °C | −29.0 to 70.0 °C |
| Wind/Air Velocity (VIn) | > of 3% of reading | 0.1 m/s | 0.6 to 40.0 m/s |
| Relative Humidity (RHIn) | 2% | 0.1% | 10 to 90% (25 °C noncondensing) |
| Globe Temperature (TgIn) | 1.4 °C | 0.1 °C | −29.0 to 60.0 °C |
| PET | Thermal Perception | Physiological Stress |
|---|---|---|
| <4 °C | Very Cold | Extreme Cold Stress |
| Cold | Strong Cold Stress | |
| 8 °C | ||
| Cool | Moderate Cold Stress | |
| 13 °C | ||
| Slightly Cool | Slight Cold Stress | |
| 18 °C | ||
| Comfortable | No Thermal Stress | |
| 23 °C | ||
| Slightly Warm | Slight Heat Stress | |
| 29 °C | ||
| Warm | Moderate Heat Stress | |
| 35 °C | ||
| Hot | Strong Heat Stress | |
| >41 °C | ||
| Very Hot | Extreme Heat Stress |
| Ta (°C) (Average) | TaOut | TaInPRE | TaInPOST | ||||||||||
|---|---|---|---|---|---|---|---|---|---|---|---|---|---|
| Time Intervals | 18:00–20:00 | 21:00–23:00 | 00:00–02:00 | 03:00–05:00 | 18:00–20:00 | 21:00–23:00 | 00:00–02:00 | 03:00–05:00 | 18:00–20:00 | 21:00–23:00 | 00:00–02:00 | 03:00–05:00 | |
| TSD25 | Average | 22.3 | 20.0 | 17.7 | 20.0 | 28.7 | 28.3 | 29.6 | 29.7 | 26.9 | 26.6 | 26.7 | 26.7 |
| Max | 23.4 | 20.7 | 18.3 | 22.5 | 28.8 | 28.4 | 30.0 | 29.8 | 27.0 | 26.7 | 26.8 | 26.8 | |
| Min | 24.1 | 21.3 | 17.2 | 17.3 | 28.7 | 28.2 | 29.0 | 29.7 | 26.8 | 26.6 | 26.7 | 26.7 | |
| VHD33 | Average | 27.5 | 25.0 | 22.9 | 23.2 | 30.7 | 30.0 | 29.9 | 29.7 | 28.4 | 28.2 | 27.7 | 27.4 |
| Max | 28.7 | 25.9 | 23.6 | 23.2 | 30.9 | 30.1 | 30.0 | 29.8 | 28.5 | 28.3 | 27.9 | 27.5 | |
| Min | 26.7 | 24.1 | 22.4 | 21.9 | 30.5 | 30.0 | 29.8 | 29.7 | 28.3 | 28.1 | 27.6 | 27.2 | |
| HWE31 | Average | 26.5 | 22.9 | 20.3 | 20.3 | 29.5 | 29.1 | 28.9 | 28.7 | 28.0 | 27.6 | 27.2 | 26.8 |
| Max | 27.7 | 24.0 | 21.1 | 22.3 | 29.9 | 29.1 | 29.0 | 28.8 | 28.2 | 27.8 | 27.5 | 26.9 | |
| Min | 25.4 | 21.9 | 19.6 | 18.8 | 29.2 | 29.1 | 28.8 | 28.6 | 27.9 | 27.5 | 27.0 | 26.7 | |
| RH (%) (Average) | RHOut | RHInPRE | RHInPOST | ||||||||||
|---|---|---|---|---|---|---|---|---|---|---|---|---|---|
| Time Intervals | 18:00–20:00 | 21:00–23:00 | 00:00–02:00 | 03:00–05:00 | 18:00–20:00 | 21:00–23:00 | 00:00–02:00 | 03:00–05:00 | 18:00–20:00 | 21:00–23:00 | 00:00–02:00 | 03:00–05:00 | |
| TSD25 | Average | 60.0 | 67.0 | 75.0 | 63.0 | 29.1 | 31.9 | 29.2 | 30.0 | 52.2 | 51.8 | 54.9 | 55.5 |
| Max | 62.0 | 69.0 | 77.0 | 76.0 | 35.5 | 32.1 | 29.6 | 31.0 | 52.8 | 53.9 | 55.1 | 55.8 | |
| Min | 57.0 | 65.0 | 73.0 | 49.0 | 24.9 | 31.7 | 28.9 | 29.2 | 51.6 | 50.8 | 54.8 | 55.4 | |
| VHD33 | Average | 36.0 | 42.4 | 49.2 | 49.3 | 25.5 | 27.1 | 30.4 | 31.2 | 37.0 | 37.9 | 38.0 | 39.0 |
| Max | 39.0 | 45.0 | 50.0 | 51.0 | 27.0 | 28.8 | 30.8 | 31.5 | 38.0 | 38.5 | 38.3 | 38.9 | |
| Min | 34.0 | 40.0 | 48.0 | 48.0 | 24.8 | 24.8 | 29.8 | 31.0 | 36.3 | 37.3 | 37.6 | 38.5 | |
| HWE31 | Average | 29.5 | 37.9 | 45.3 | 47.0 | 23.9 | 30.4 | 31.6 | 31.2 | 30.8 | 33.5 | 34.8 | 35.3 |
| Max | 32.2 | 41.2 | 47.5 | 49.7 | 25.2 | 31.7 | 31.7 | 31.4 | 32.2 | 34.3 | 35.3 | 35.5 | |
| Min | 26.2 | 35.0 | 43.0 | 43.5 | 22.4 | 28.7 | 31.6 | 31.2 | 29.7 | 32.7 | 34.2 | 35.2 | |
| PET (°C) (Average) | PETOut | PETInPRE | PETInPOST | ||||||||||
|---|---|---|---|---|---|---|---|---|---|---|---|---|---|
| Time Intervals | 18:00–20:00 | 21:00–23:00 | 00:00–02:00 | 03:00–05:00 | 18:00–20:00 | 21:00–23:00 | 00:00–02:00 | 03:00–05:00 | 18:00–20:00 | 21:00–23:00 | 00:00–02:00 | 03:00–05:00 | |
| TSD25 | Average | 16.9 | 14.4 | 12.4 | 14.2 | 29.1 | 28.7 | 30.0 | 30.0 | 27.7 | 27.4 | 27.6 | 27.6 |
| Max | 19.6 | 15.0 | 12.7 | 16.7 | 29.4 | 28.8 | 30.3 | 30.1 | 27.8 | 27.5 | 27.6 | 27.7 | |
| Min | 15.2 | 13.8 | 12.0 | 11.5 | 29.0 | 28.6 | 29.5 | 30.0 | 27.6 | 27.4 | 27.6 | 27.6 | |
| VHD33 | Average | 22.9 | 19.0 | 17.3 | 18.4 | 30.9 | 30.3 | 30.2 | 30.0 | 28.9 | 28.7 | 28.3 | 27.9 |
| Max | 26.2 | 20.3 | 18.0 | 20.5 | 31.2 | 30.4 | 30.3 | 30.1 | 29.0 | 28.8 | 28.5 | 28.1 | |
| Min | 20.8 | 18.0 | 16.7 | 16.6 | 30.7 | 30.3 | 30.2 | 30.1 | 28.8 | 28.6 | 28.2 | 27.8 | |
| HWE31 | Average | 21.5 | 17.2 | 15.1 | 15.1 | 29.8 | 29.5 | 29.4 | 29.1 | 28.4 | 28.0 | 27.7 | 27.3 |
| Max | 24.1 | 18.1 | 15.9 | 16.7 | 30.2 | 29.6 | 29.5 | 29.2 | 28.6 | 28.2 | 27.9 | 27.4 | |
| Min | 19.7 | 16.4 | 14.4 | 13.6 | 29.5 | 29.5 | 29.3 | 29.0 | 28.3 | 27.9 | 27.5 | 27.1 | |
| TSD25 | VHD33 | HWE31 | ||||
|---|---|---|---|---|---|---|
| Pre-2000 | Post-2000 | Pre-2000 | Post-2000 | Pre-2000 | Post-2000 | |
| Mean Sleepwear Level | 2.71 | 2.05 | 2.27 | 2.13 | 1.88 | 1.88 |
| Mean Bed Covering Level | 3.24 | 2.58 | 2.53 | 2.25 | 2.40 | 2.06 |
| Window Opening Ratio (yes) | 29.4% | 47.4% | 53.3% | 75.0% | 56.3% | 75.0% |
| Mechanical Ventilation Ratio (yes) | 11.8% | 5.3% | 6.7% | 12.5% | 18.8% | 25.0% |
| TSD25 | VHD33 | HWE31 | ||||
|---|---|---|---|---|---|---|
| Pre-2000 | Post-2000 | Pre-2000 | Post-2000 | Pre-2000 | Post-2000 | |
| Mean TCV | 1.41 | 1.11 | 0.20 | 0.63 | −0.31 | −0.69 |
| Mean TSV | 0.18 | 0.16 | 0.40 | −0.12 | 1.06 | 1.56 |
| Mean HSV | 0.24 | 0.42 | 0.27 | 0.06 | −0.06 | 0.25 |
| Mean ASV | 3.00 | 3.16 | 3.07 | 3.69 | 2.50 | 3.19 |
| TSD25 | VHD33 | HWE31 | ||||
|---|---|---|---|---|---|---|
| Pre-2000 | Post-2000 | Pre-2000 | Post-2000 | Pre-2000 | Post-2000 | |
| Mean TCV | 1.47 | 1.17 | 0.29 | 0.86 | −0.15 | −0.33 |
| Mean TSV | 0.20 | 0.11 | 0.36 | −0.29 | 0.92 | 1.25 |
| Mean HSV | 0.27 | 0.44 | 0.21 | 0.07 | −0.08 | 0.42 |
| Mean ASV | 3.00 | 3.06 | 3.21 | 3.57 | 2.54 | 2.92 |
| Typical Summer Day | Very Hot Day | Heat Wave Event | ||||||
|---|---|---|---|---|---|---|---|---|
| Outdoor | Physiologically Equivalent Temperature | 14.4 °C | 19.0 °C | 17.2 °C | ||||
| Indoor—Uninsulated Residential Settings | Pre-sleep Physiological Evaluations | Physiologically Equivalent Temperature | 28.7 °C | 30.3 °C | 29.5 °C | |||
| Pre-sleep Psychological Evaluations | Users of mechanical Ventilation | Inclusive | Noninclusive | Inclusive | Noninclusive | Inclusive | Noninclusive | |
| Overall Thermal Comfort Sensation Vote | 1.41 | 1.47 | 0.20 | 0.29 | −0.31 | −0.15 | ||
| How was your sleep yesterday? | 3.76 | 3.67 | 3.60 | 3.57 | 3.69 | 3.85 | ||
| Influencing Factors | Average Age | 43.8 | 48.4 | 43.9 | ||||
| Mean Sleepwear Level | 2.71 | 2.27 | 1.88 | |||||
| Mean Bed Covering Level | 3.24 | 2.53 | 2.40 | |||||
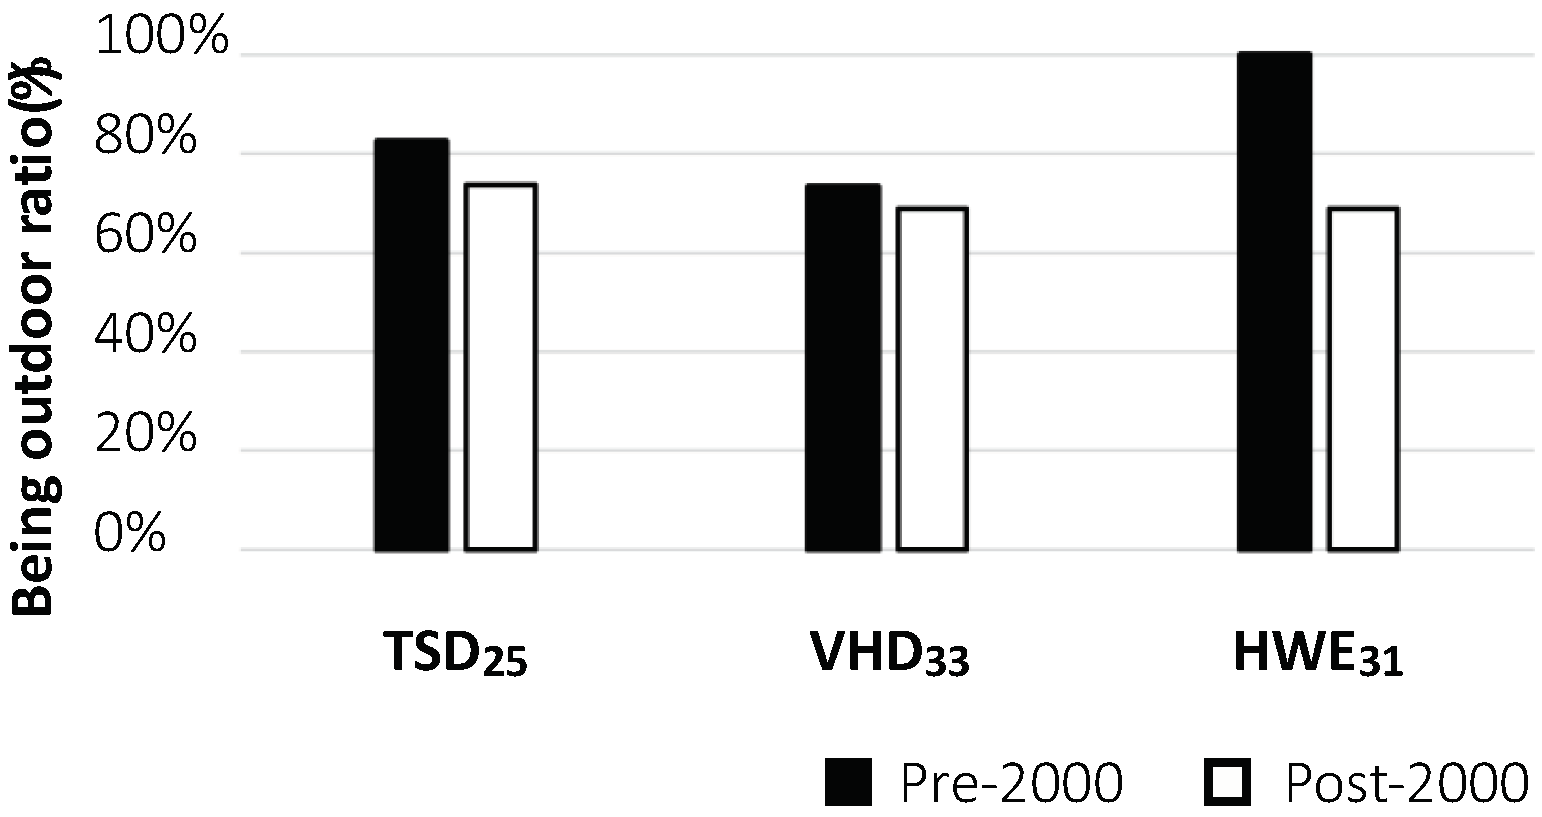
| Being Outdoor Ratio (24 h) | 82.4% | 73.3% | 100.0% | |||||
| Window Opening Ratio | 29.4% | 53.3% | 56.3% | |||||
| Indoor—Insulated Residential Settings | Pre-sleep Physiological Evaluations | Physiologically Equivalent Temperature | 27.4 °C | 28.7 °C | 28.0 °C | |||
| Pre-sleep Psychological Evaluations | Average Age | 31.8 | 32.0 | 31.8 | ||||
| Users of mechanical Ventilation | Inclusive | Noninclusive | Inclusive | Noninclusive | Inclusive | Noninclusive | ||
| Overall Thermal Comfort Sensation Vote | 1.11 | 1.17 | 0.63 | 0.86 | −0.69 | −0.33 | ||
| How was your sleep yesterday? | 3.68 | 3.67 | 3.63 | 3.79 | 3.00 | 3.00 | ||
| Influencing Factors | Average Age | 31.8 | 32.0 | 31.8 | ||||
| Mean Sleepwear Level | 2.05 | 2.13 | 1.88 | |||||
| Mean Bed Covering Level | 2.58 | 2.25 | 2.06 | |||||
| Being Outdoor Ratio (24 h) | 73.7% | 68.8% | 68.8% | |||||
| Window Opening Ratio | 47.4% | 75.0% | 75.0% | |||||
Disclaimer/Publisher’s Note: The statements, opinions and data contained in all publications are solely those of the individual author(s) and contributor(s) and not of MDPI and/or the editor(s). MDPI and/or the editor(s) disclaim responsibility for any injury to people or property resulting from any ideas, methods, instructions or products referred to in the content. |
© 2023 by the authors. Licensee MDPI, Basel, Switzerland. This article is an open access article distributed under the terms and conditions of the Creative Commons Attribution (CC BY) license (https://creativecommons.org/licenses/by/4.0/).
Share and Cite
Ahan, M.M.; Nouri, A.S.; Matzarakis, A. Investigating the Relationship of Outdoor Heat Stress upon Indoor Thermal Comfort and Qualitative Sleep Evaluation: The Case of Ankara. Atmosphere 2023, 14, 1407. https://doi.org/10.3390/atmos14091407
Ahan MM, Nouri AS, Matzarakis A. Investigating the Relationship of Outdoor Heat Stress upon Indoor Thermal Comfort and Qualitative Sleep Evaluation: The Case of Ankara. Atmosphere. 2023; 14(9):1407. https://doi.org/10.3390/atmos14091407
Chicago/Turabian StyleAhan, Merve Münevver, Andre Santos Nouri, and Andreas Matzarakis. 2023. "Investigating the Relationship of Outdoor Heat Stress upon Indoor Thermal Comfort and Qualitative Sleep Evaluation: The Case of Ankara" Atmosphere 14, no. 9: 1407. https://doi.org/10.3390/atmos14091407