


The Phenomenology of West African Coastal Rainfall Events Based on a New Rain Gauge Network over Abidjan (Côte d’Ivoire)
 , , ,
, , ,
Abstract
:1. Introduction
2. The Study Area, Data, and Methods
2.1. The Study Area
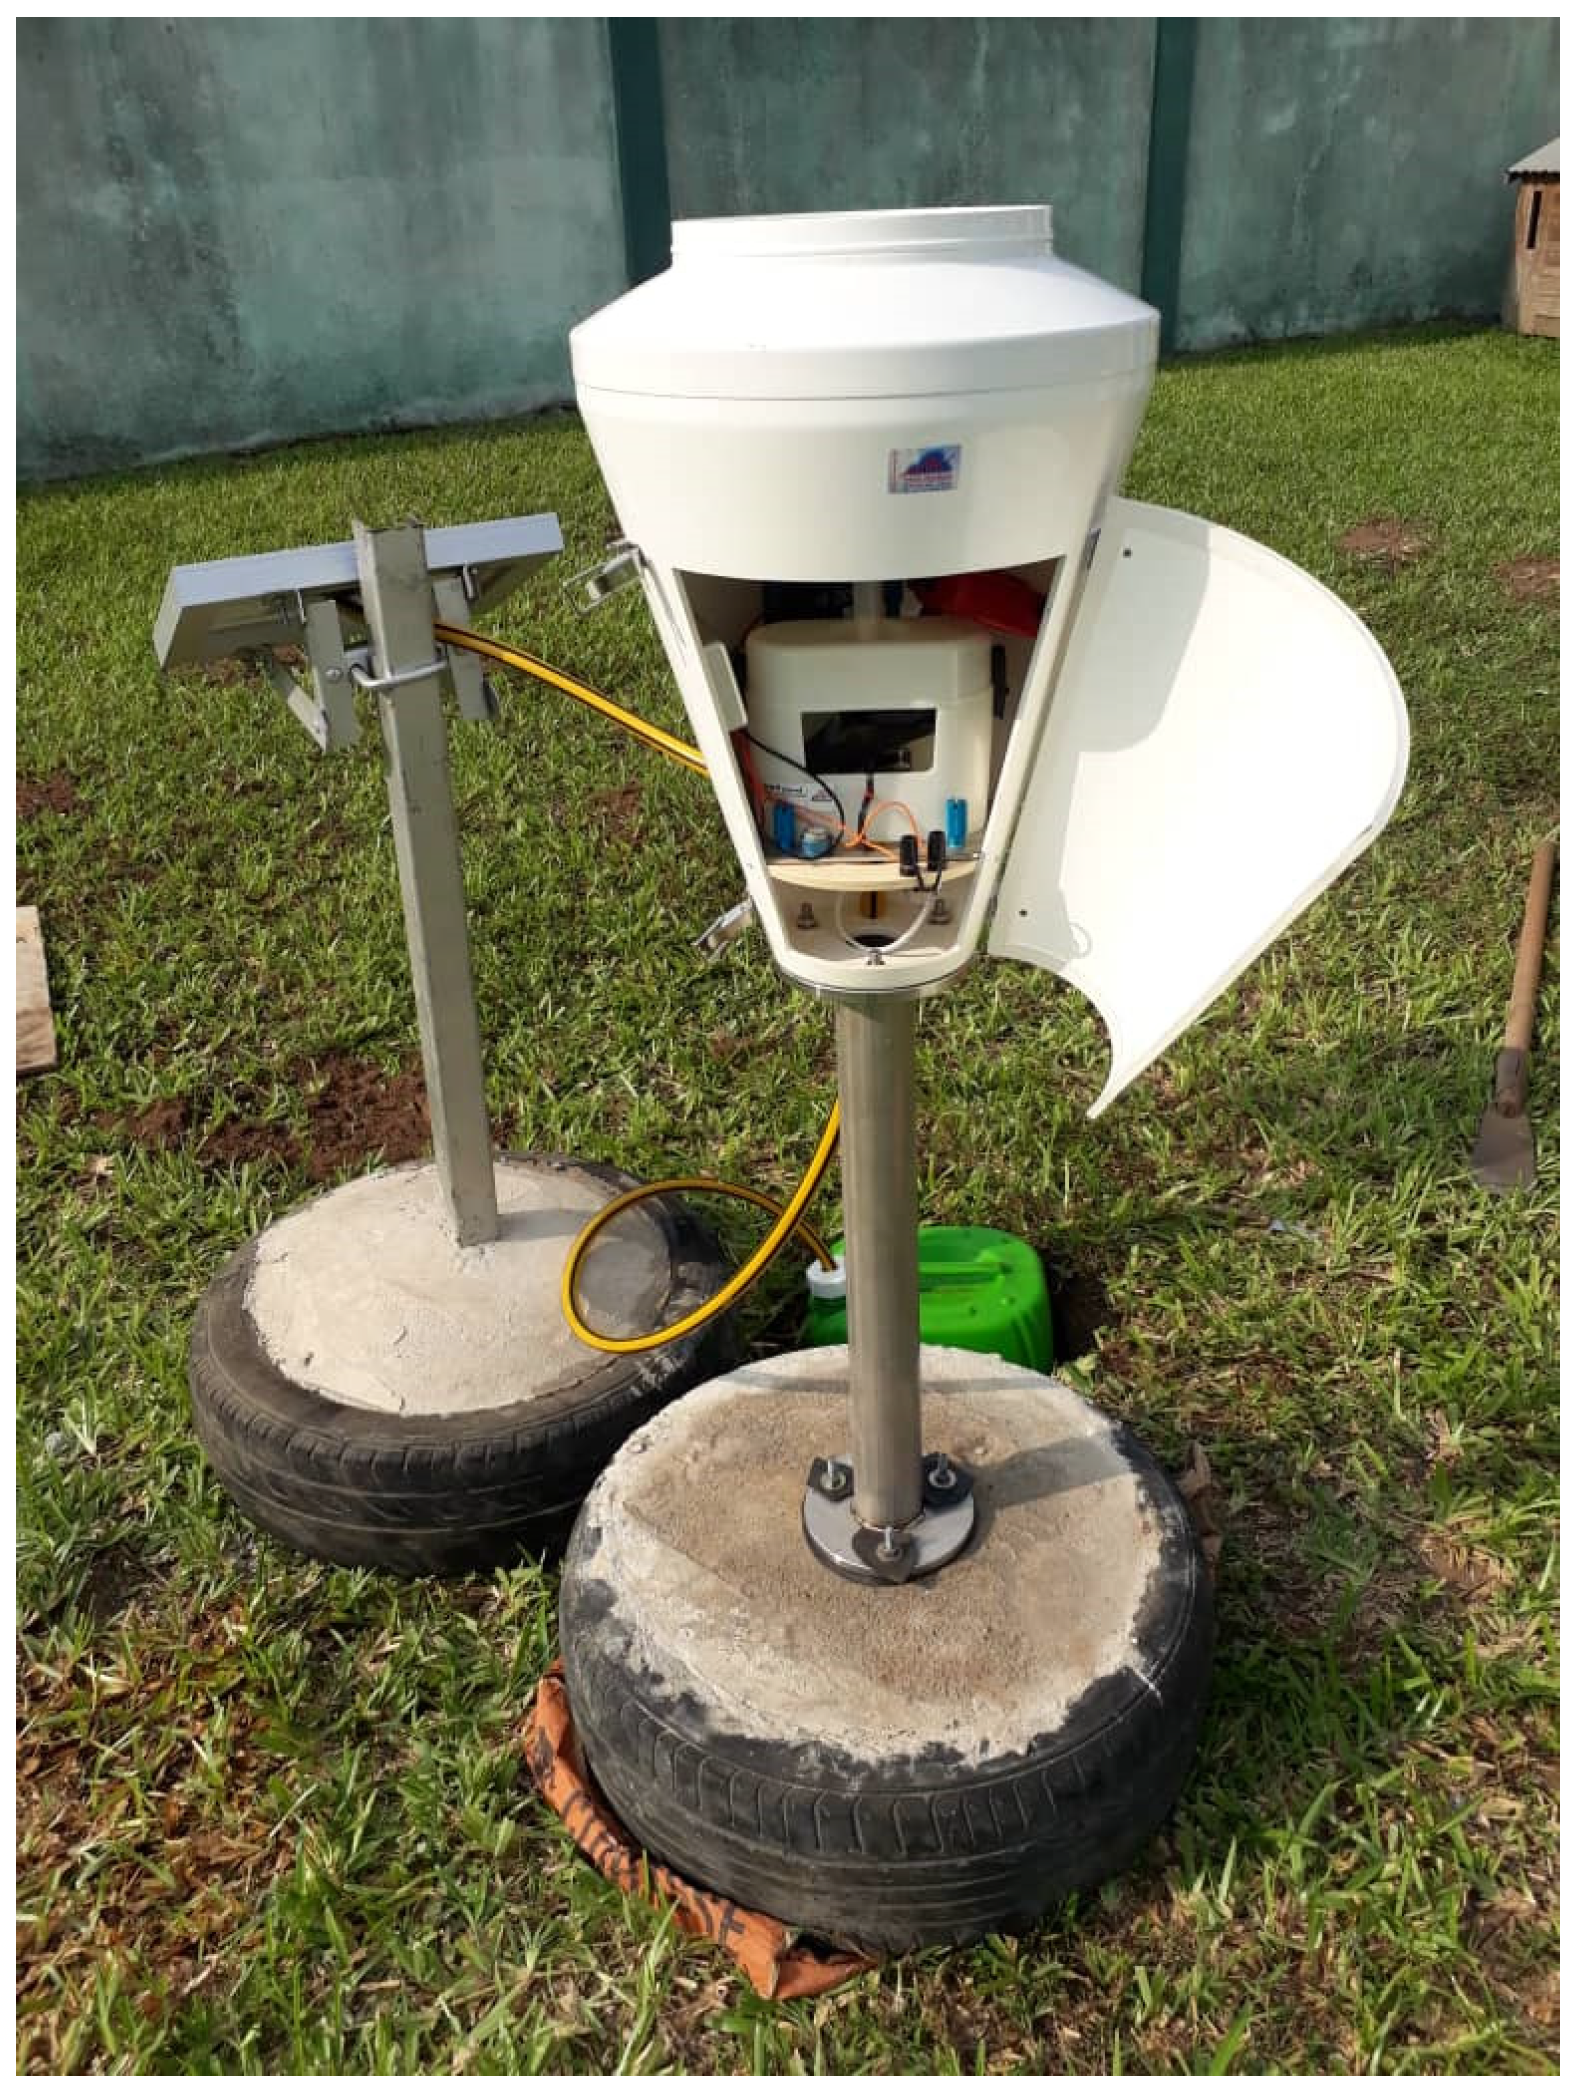
2.2. Data
2.3. Methods
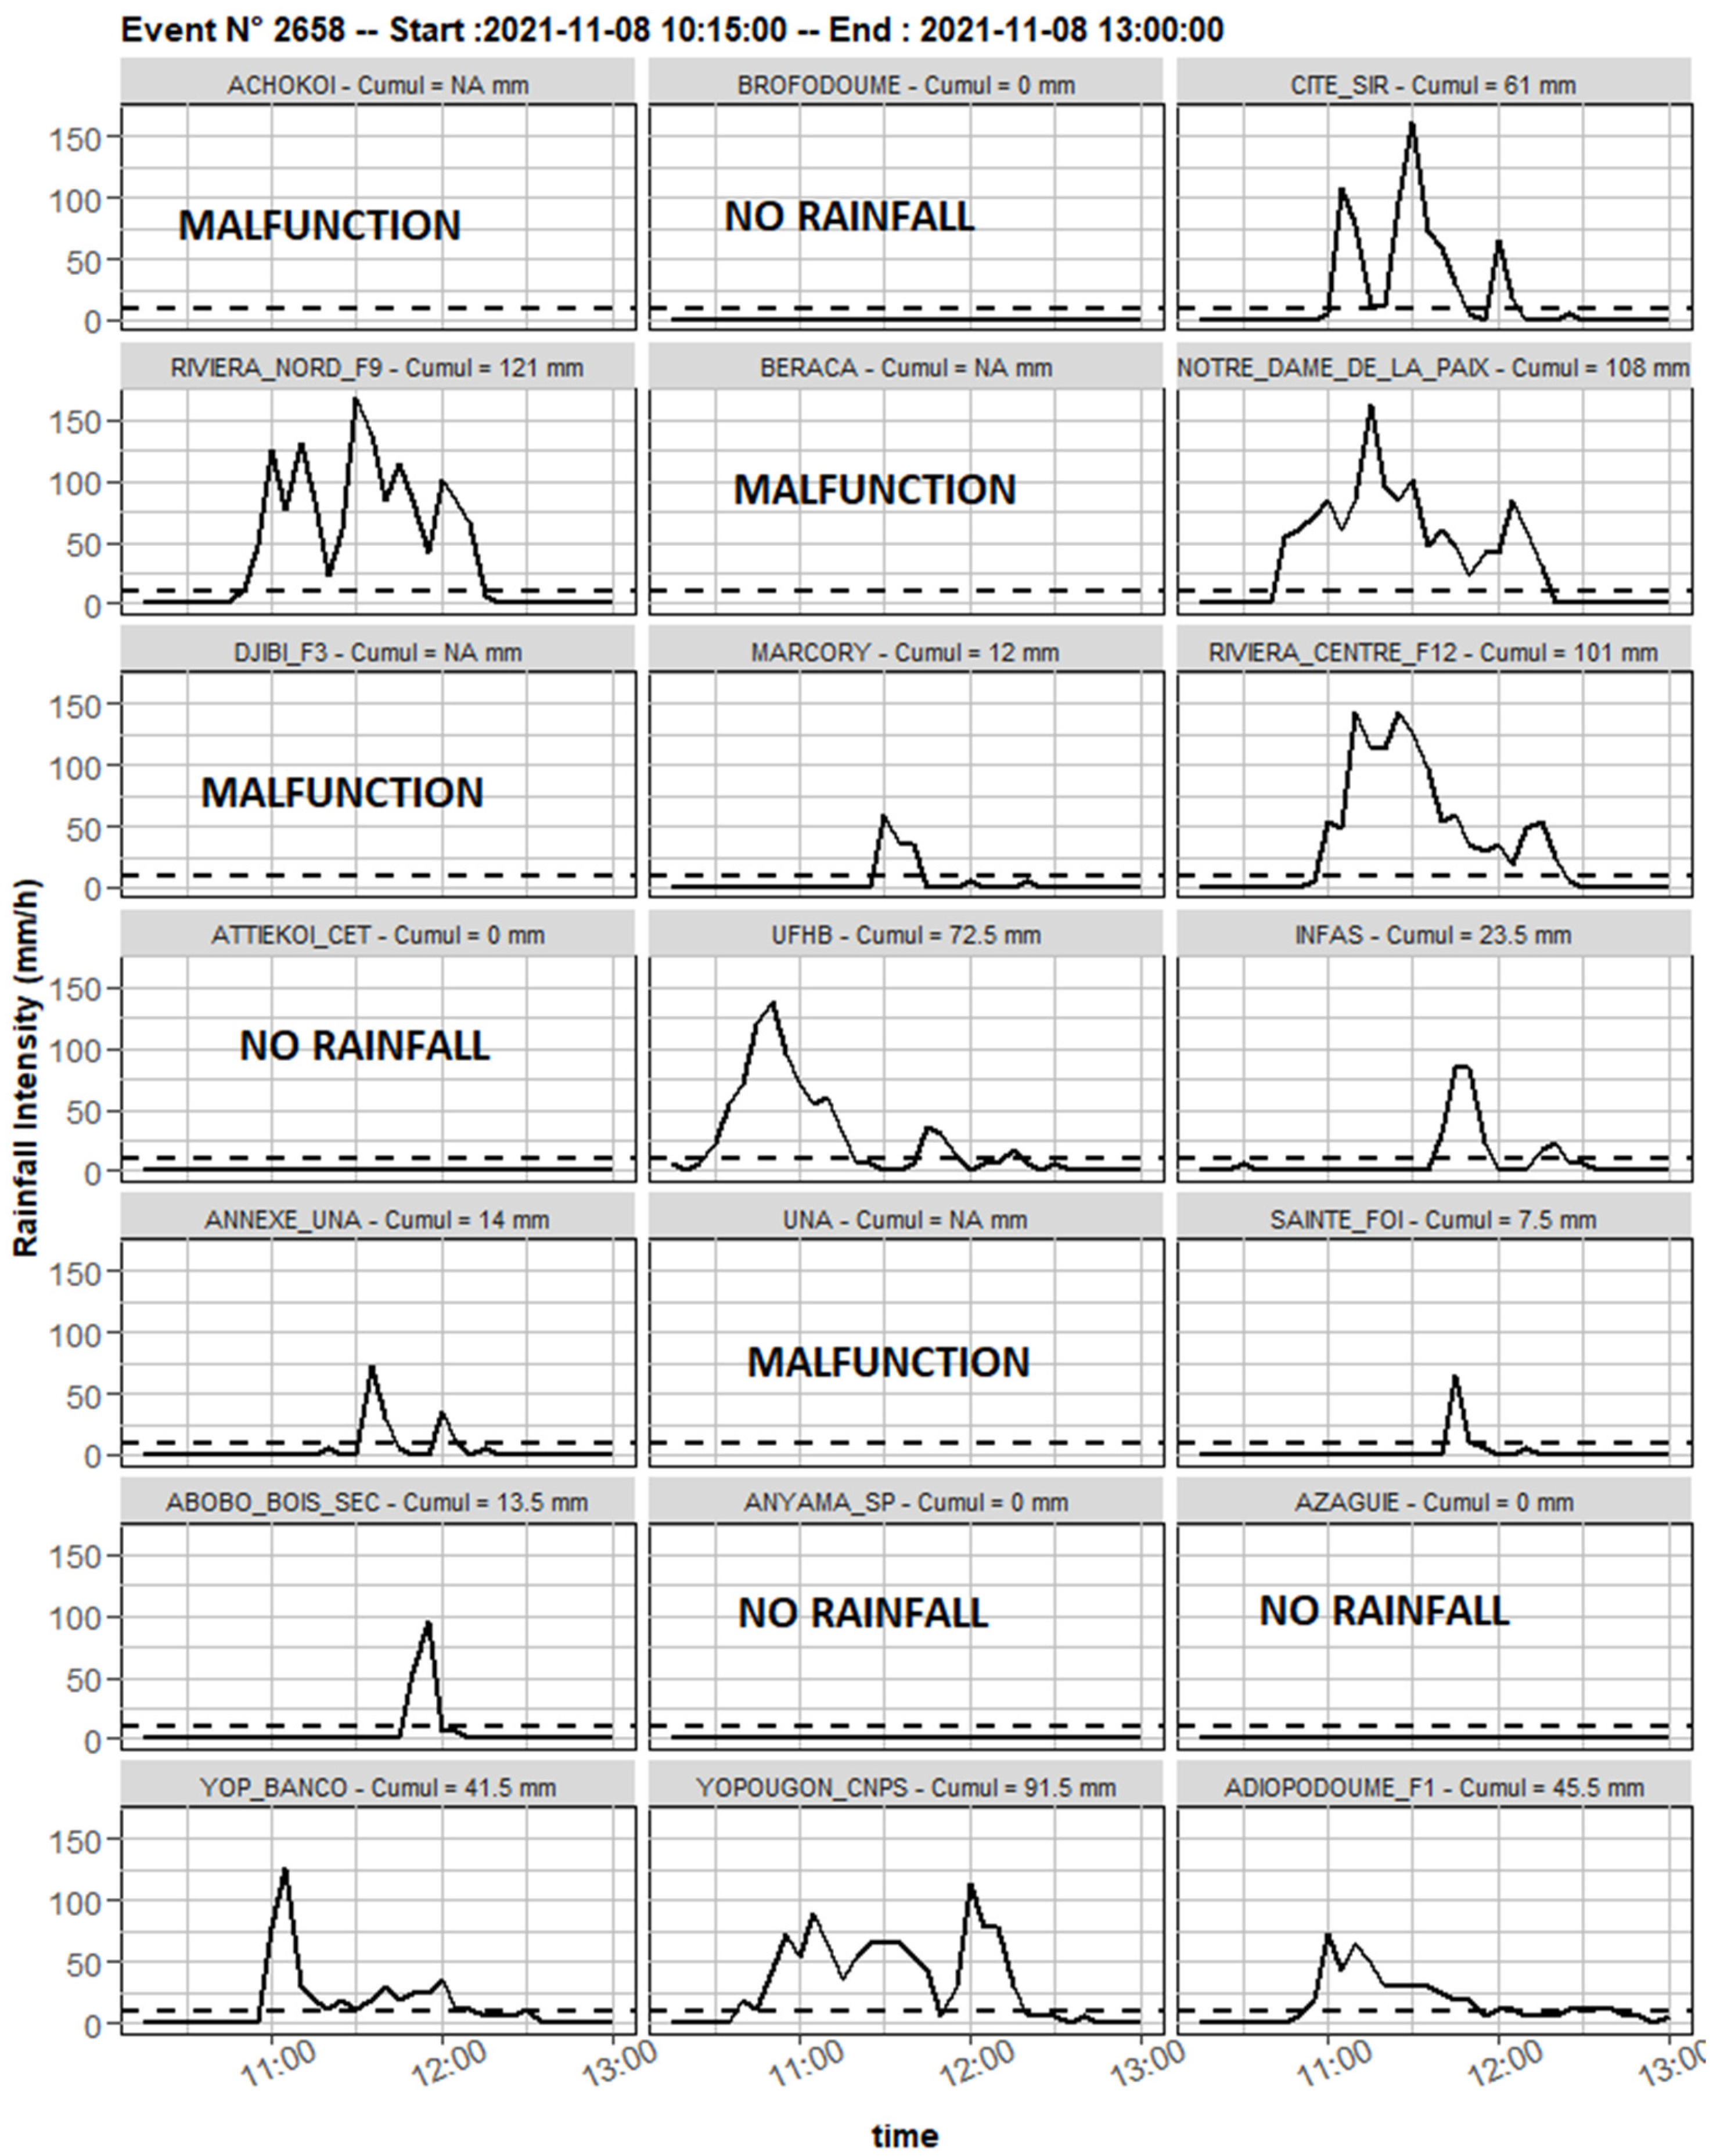
2.3.1. Rainfall Event Definition
2.3.2. Convective/Stratiform Separation
2.3.3. Convective Spells
2.3.4. Rainfall Event Parameters
- The date and time of the beginning of the rainfall event.
- The rainfall event duration.
- The period of the day in which the beginning and the end of the rainfall event are located on the study area: day (06 h–18 h), night (18 h–06 h), or day–night if overlapped.
- The maximum of the maximum intensities in 30 min observed at each of the rain gauges of the network (I30max).
- The event total rainfall amount at the rain gauge between the beginning and end of a rainfall event defined on the average hyetograph.
- The maximum intensity over a period of 30 min observed at the rain gauge (I30maxpi). This parameter is generally used in the evaluation of soil erosivity by rain [41,42,43]. We considered it rather than maximum rain intensity as a good approximation for the violence of thunderstorms. It can also be used to explain peak flows in the small urban catchments of Abidjan, where the time of concentration is approximately 30 min.
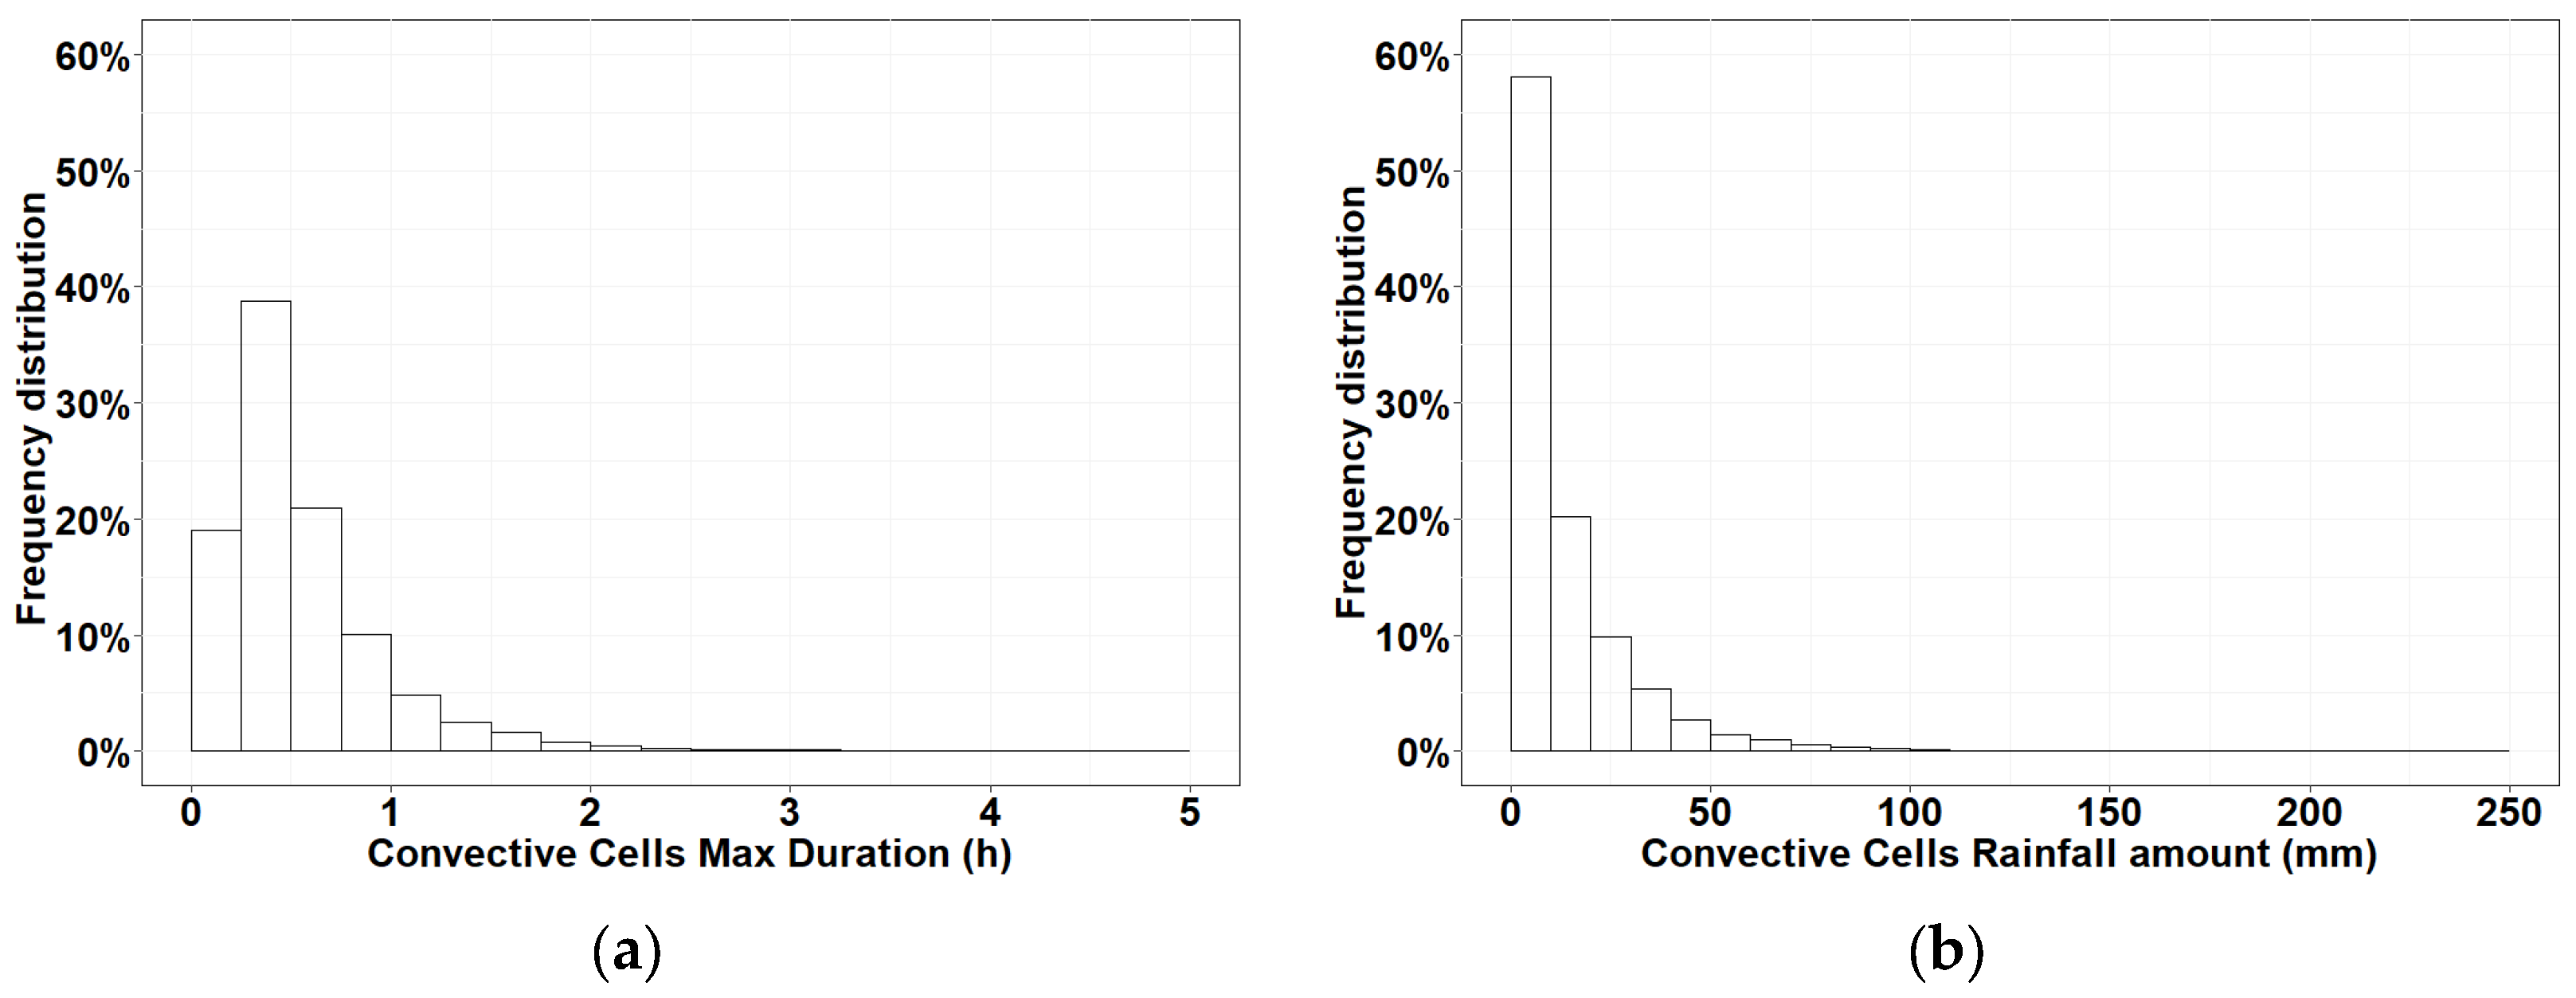
- The duration of the longest convective episode identified with a longer lifetime. This value was determined for each rainfall event and each rain gauge.
- The rainfall amount corresponding to the convective episode identified as having the longest duration.
2.3.5. Other Analyzed Parameters
- Definition of Consecutive Rainy-Day Events (CRDEs):
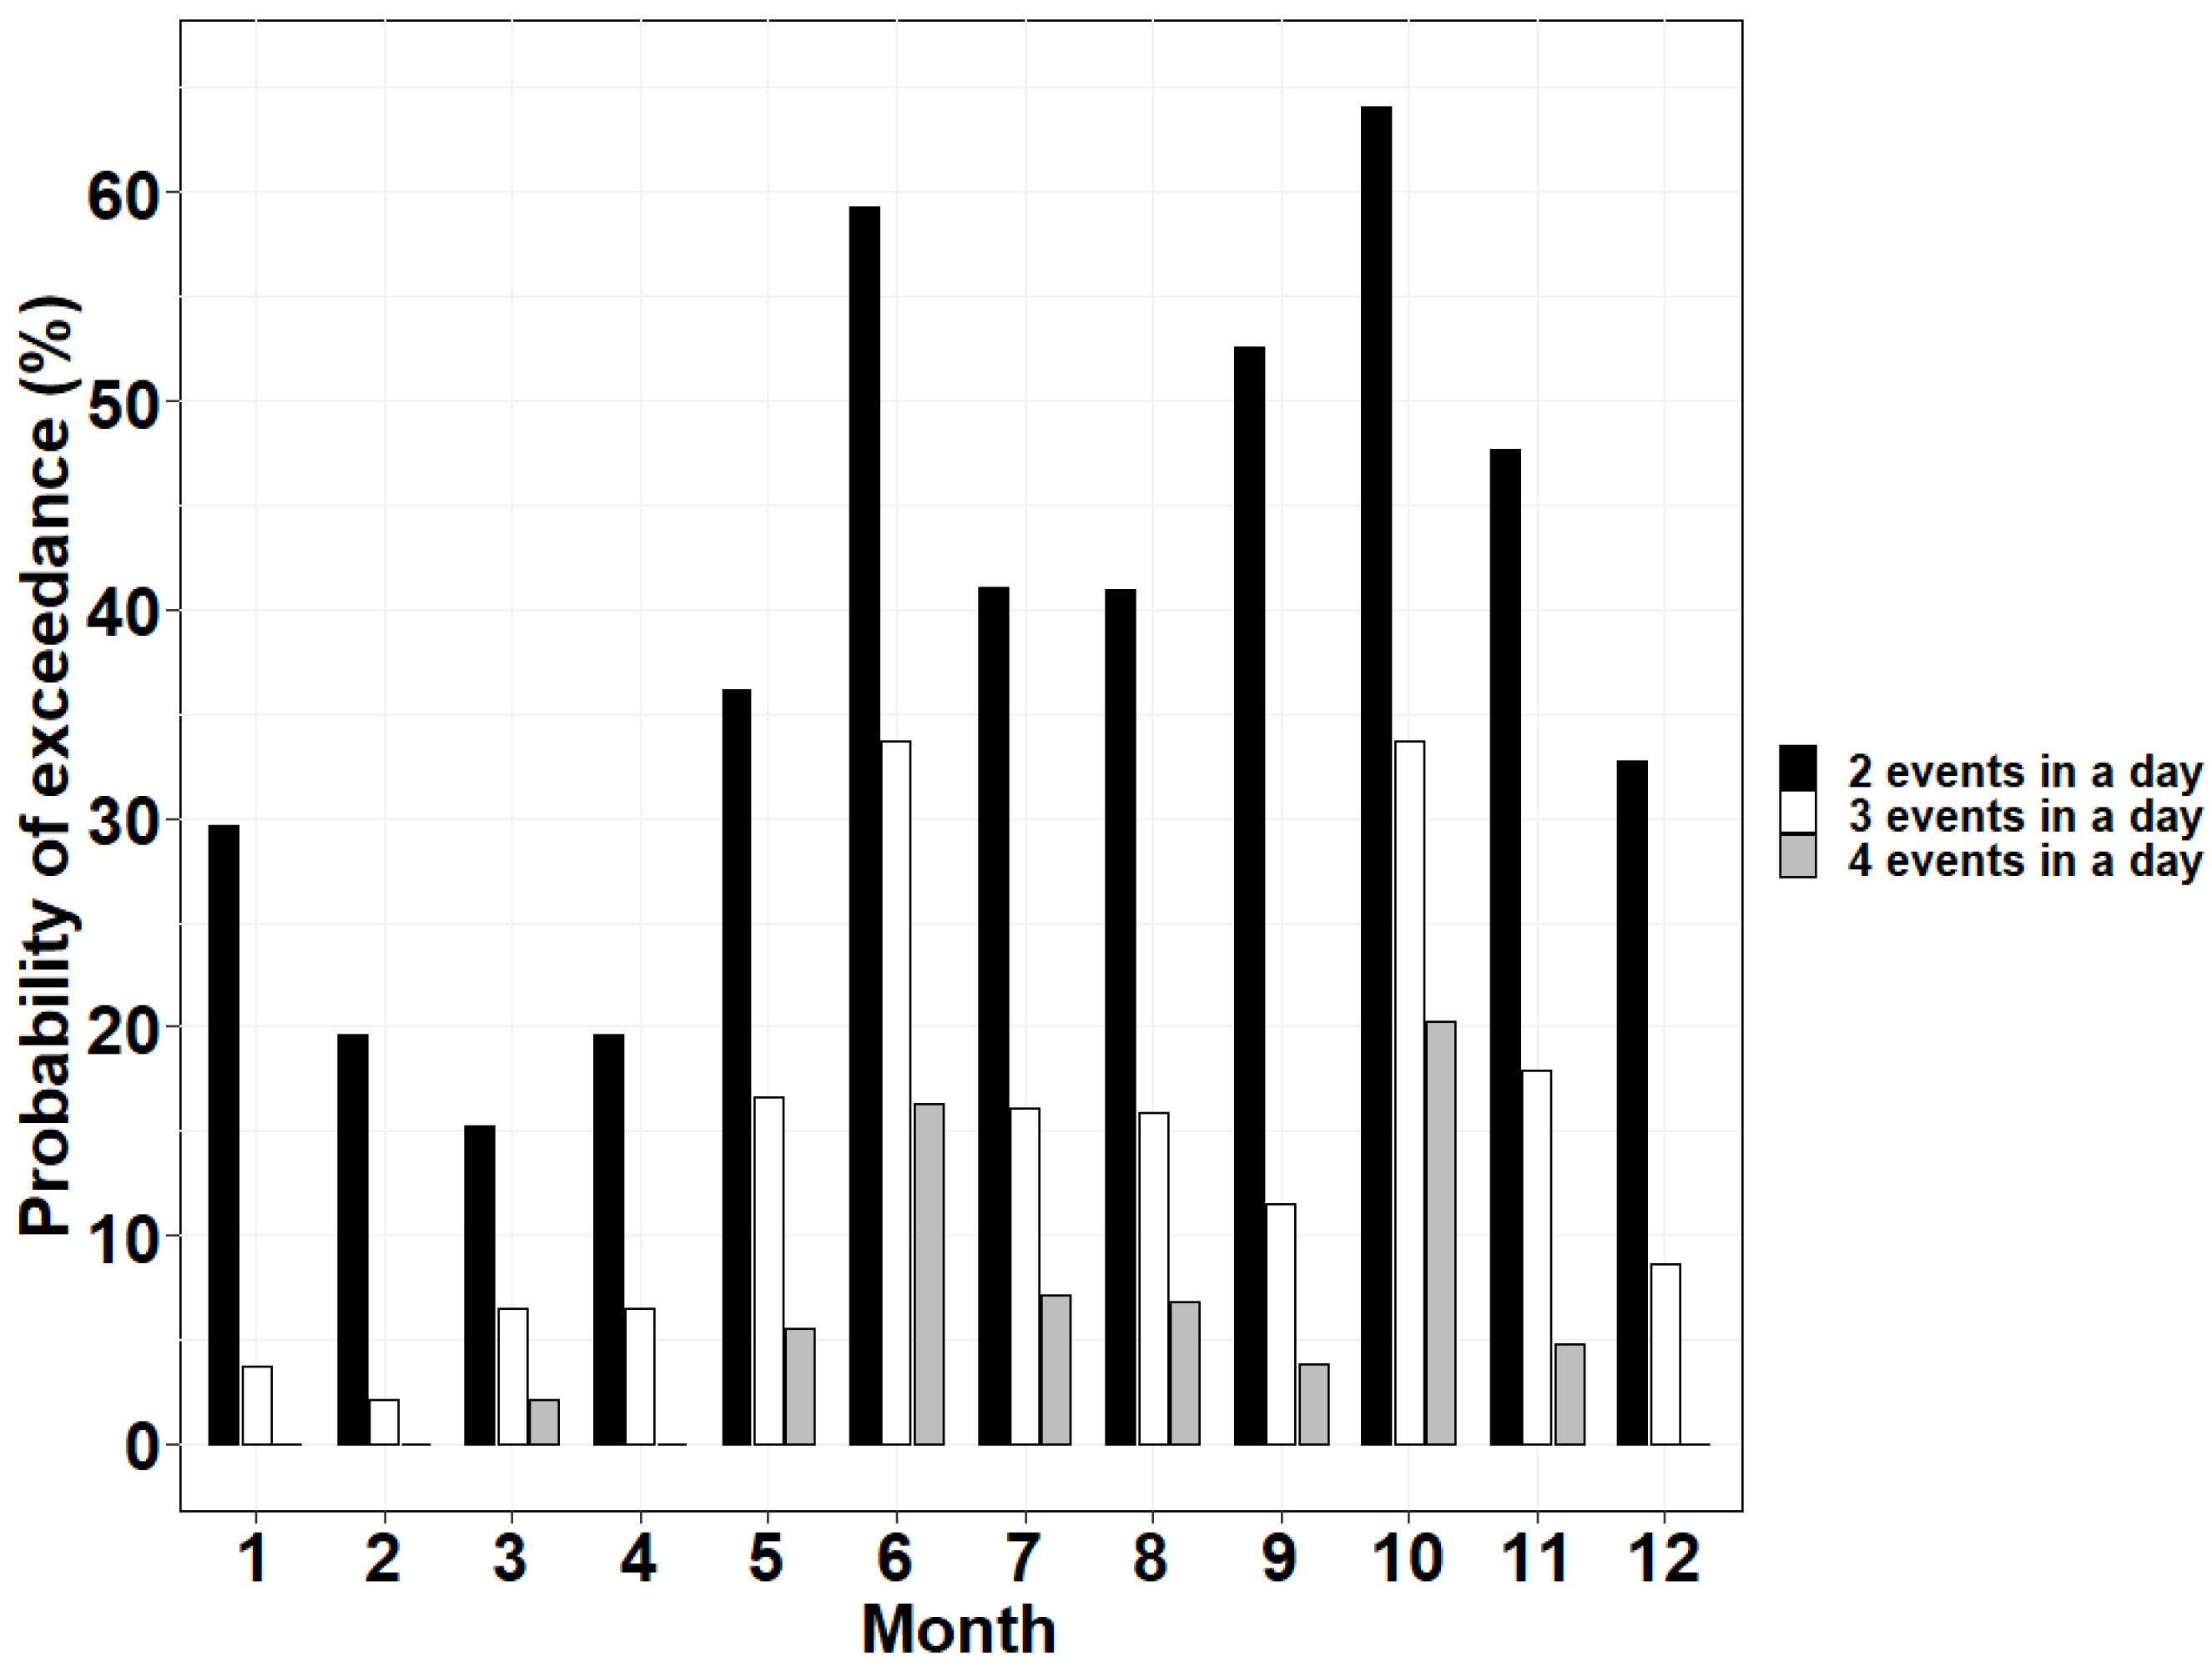
- The probability of exceeding x rainfall events per day.
3. Results
3.1. Rainfall Events Identification
3.2. Rainfall Event Duration
3.3. The Rainfall Amount Per Event
3.4. The Convective/Stratiform Nature of Rainfall Events
3.5. Analysis of Convective Spells at the Rain Gauge Scale
3.6. The Most Intense Rainfall Intensity: I30max
3.7. The Diurnal Cycle
- Rainfall event starting time
- Position of the rainy period during the day
3.8. Rainfall Event Occurrence
3.9. Consecutive Rainy-Day Events (CRDEs)
4. Discussion
5. Conclusions
Author Contributions
Funding
Institutional Review Board Statement
Informed Consent Statement
Data Availability Statement
Acknowledgments
Conflicts of Interest
References
- Boberg, J. Freshwater Availability. In Liquid Assets; How Demographic Changes and Water Management Policies Affect Freshwater Resources; RAND Corporation: Santa Monica, CA, USA, 2005; pp. 15–28. ISBN 978-0-8330-3296-6. [Google Scholar]
- Sy, A.; Duroure, C.; Baray, J.-L.; Gour, Y.; Van Baelen, J.; Diop, B. Space-Time Variability of the Rainfall over Sahel: Observation of a Latitudinal Sharp Transition of the Statistical Properties. Atmosphere 2018, 9, 482. [Google Scholar] [CrossRef]
- Tarhule, A. Damaging Rainfall and Flooding: The Other Sahel Hazards. Clim. Change 2005, 72, 355–377. [Google Scholar] [CrossRef]
- Nouaceur, Z. La reprise des pluies et la recrudescence des inondations en Afrique de l’Ouest sahélienne. Physio-Géo. Géographie Phys. Environ. 2020, 15, 89–109. [Google Scholar] [CrossRef]
- Mathon, V.; Laurent, H.; Lebel, T. Mesoscale Convective System Rainfall in the Sahel. J. Appl. Meteorol. 2002, 41, 1081–1092. [Google Scholar] [CrossRef]
- Mathon, V. Etude Climatologique des Systemes Convectifs de Meso-Echelle en Afriqije de L’ouest, Mathon, Vincent. Ph.D. Thesis, Université Paris 7—Denis Didédrot, Paris, France, 2001. [Google Scholar]
- OCHA Côte d’Ivoire. Zones à risques d’inondations et de choléra. Portail sur la résilience aux inondations. 2014. Available online: https://resilience-inondations.net/ressources/item/cote-divoire-zones-a-risques-dinondations-et-de-cholera/ (accessed on 30 June 2022).
- Traoré, H.K. Appréhender L’urbanisation en Milieu Tropical Humide: Le cas du Grand Abidjan. Le 4 Pages du LOTERR n°10, Décembre 2021. 2021. Available online: https://hal.univ-lorraine.fr/hal-03472004 (accessed on 15 February 2023).
- Kangah, A.; Della, A.A. Détermination des zones à risque d’inondation à partir du modèle numérique de terrain (MNT) et du système d’information géographique (SIG): Cas du bassin-versant de Bonoumin-Palmeraie (commune de Cocody, Côte d’ivoire). Geo-Eco-Trop 2015, 39, 297–308. [Google Scholar]
- Peters, O.; Christensen, K. Rain Viewed as Relaxational Events. J. Hydrol. 2006, 328, 46–55. [Google Scholar] [CrossRef]
- Wang, W.; Yin, S.; Xie, Y.; Nearing, M.A.; Wang, W.; Yin, S.; Xie, Y.; Nearing, M.A. Minimum Inter-Event Times for Rainfall in the Eastern Monsoon Region of China. Trans. ASABE 2019, 62, 9–18. [Google Scholar] [CrossRef]
- Yen, B.C.; Chow, V.T. Local Design Storm: Volume 2. Methodology and Analysis, FHWA-RD-82-064; United States. Federal Highway Administration. Offices of Research and Development: Washington, DC, USA, 1983. Available online: https://rosap.ntl.bts.gov/view/dot/41863 (accessed on 20 December 2021).
- Svoboda, V.; Hanel, M.; Máca, P.; Kyselý, J. Characteristics of Rainfall Events in Regional Climate Model Simulations for the Czech Republic. Hydrol. Earth Syst. Sci. 2017, 21, 963–980. [Google Scholar] [CrossRef]
- Dunkerley, D. Identifying Individual Rain Events from Pluviograph Records: A Review with Analysis of Data from an Australian Dryland Site. Hydrol. Process. 2008, 22, 5024–5036. [Google Scholar] [CrossRef]
- Wang, F. Temporal Pattern Analysis of Local Rainstorm Events in China During the Flood Season Based on Time Series Clustering. Water 2020, 12, 725. [Google Scholar] [CrossRef]
- Sottile, G.; Francipane, A.; Adelfio, G.; Noto, L.V. A PCA-Based Clustering Algorithm for the Identification of Stratiform and Convective Precipitation at the Event Scale: An Application to the Sub-Hourly Precipitation of Sicily, Italy. Stoch. Environ. Res. Risk Assess. 2021, 36, 2303–2317. [Google Scholar] [CrossRef]
- Terranova, O.G.; Gariano, S.L. Rainstorms Able to Induce Flash Floods in a Mediterranean-Climate Region (Calabria, Southern Italy). Nat. Hazards Earth Syst. Sci. 2014, 14, 2423–2434. [Google Scholar] [CrossRef]
- Joo, J.; Lee, J.; Kim, J.H.; Jun, H.; Jo, D. Inter-Event Time Definition Setting Procedure for Urban Drainage Systems. Water 2014, 6, 45–58. [Google Scholar] [CrossRef]
- Nojumuddin, N.S.; Yusof, F.; Yusop, Z. Determination of Minimum Inter-Event Time for Storm Characterisation in Johor, Malaysia. J. Flood Risk Manag. 2018, 11, S687–S699. [Google Scholar] [CrossRef]
- Ignaccolo, M.; De Michele, C. A Point Based Eulerian Definition of Rain Event Based on Statistical Properties of Inter Drop Time Intervals: An Application to Chilbolton Data. Adv. Water Resour. 2010, 33, 933–941. [Google Scholar] [CrossRef]
- Barbosa, L.R.; de Oliveira Galvão, C.; de Araújo, J.C. Sub-Hourly Rainfall Patterns by Hyetograph Type under Distinct Climate Conditions in Northeast of Brazil: A Comparative Inference of Their Key Properties. Rbrh 2018, 23, 14. [Google Scholar] [CrossRef]
- Larsen, M.L.; Teves, J.B. Identifying Individual Rain Events with a Dense Disdrometer Network. Adv. Meteorol. 2015, 2015, 1–12. [Google Scholar] [CrossRef]
- Dunkerley, D. How Is the Intensity of Rainfall Events Best Characterised? A Brief Critical Review and Proposed New Rainfall Intensity Index for Application in the Study of Landsurface Processes. Water 2020, 12, 929. [Google Scholar] [CrossRef]
- Löwe, R.; Madsen, H.; McSharry, P. Objective Classification of Rainfall in Northern Europe for Online Operation of Urban Water Systems Based on Clustering Techniques. Water 2016, 8, 87. [Google Scholar] [CrossRef]
- He, S.; Wang, J.; Liu, S. Rainfall Event–Duration Thresholds for Landslide Occurrences in China. Water 2020, 12, 494. [Google Scholar] [CrossRef]
- Sodexam Saison des Pluies 2020: LES Precisions du Directeur de la Meteorologie Nationale—2020. Available online: http://www.sodexam.com/?page_id=4089 (accessed on 20 May 2022).
- Zahiri, E.; Séguis, L.; Kacou, M.; Kamagaté, B.; Dao, A.; Perrin, J.-L.; Koffi, S.E.; Guilliod, M. 5 minutes rainfall in Abidjan district (Côte d’Ivoire) (2015-). Datasuds 2022, 5. [Google Scholar] [CrossRef]
- Ochou, A.D.; Kouadio, K.; Marchant, J.; Yapo, C.; Sauvageot, H.; Achy, S.A. Etude des précipitations par satellite en Côte d’Ivoire. Veill. Clim. Satellitaire 1991, 38, 57–62. [Google Scholar]
- Kouamé, B. Forme des Averses Variabilite Spatiale et Temporelle au Nord Ouest de la Cote O-Ivoire; Université des Sciences et Techniques du Languedoc: Languedoc-Roussillon, France, 1987; p. 141. [Google Scholar]
- D’Amato, N.; Lebel, T. On the Characteristics of the Rainfall Events in the Sahel with a View to the Analysis of Climatic Variability. Int. J. Climatol. 1998, 18, 955–974. [Google Scholar] [CrossRef]
- Duque, L.F. IETD: Inter-Event Time Definition. R Package Version 1.0.0. 2020. Available online: https://CRAN.R-project.org/package=IETD (accessed on 21 February 2021).
- R Core Team. R: A Language and Environment for Statistical Computing; R Foundation for Statistical Computing: Vienna, Austria, 2019. [Google Scholar]
- Testud, J.; Oury, S.; Black, R.A.; Amayenc, P.; Dou, X. The Concept of “Normalized” Distribution to Describe Raindrop Spectra: A Tool for Cloud Physics and Cloud Remote Sensing. J. Appl. Meteorol. Climatol. 2001, 40, 1118–1140. [Google Scholar] [CrossRef]
- Moumouni, S.; Gosset, M.; Houngninou, E. Main Features of Rain Drop Size Distributions Observed in Benin, West Africa, with Optical Disdrometers. Geophys. Res. Lett. 2008, 35, L23807. [Google Scholar] [CrossRef]
- Zeng, Y.; Yang, L.; Zhang, Z.; Tong, Z.; Li, J.; Liu, F.; Zhang, J.; Jiang, Y. Characteristics of Clouds and Raindrop Size Distribution in Xinjiang, Using Cloud Radar Datasets and a Disdrometer. Atmosphere 2020, 11, 1382. [Google Scholar] [CrossRef]
- Wu, Z.; Zhang, Y.; Zhang, L.; Zheng, H.; Huang, X. A Comparison of Convective and Stratiform Precipitation Microphysics of the Record-Breaking Typhoon In-Fa (2021). Remote Sens. 2022, 14, 344. [Google Scholar] [CrossRef]
- Doswell III, C.A.; Brooks, H.E.; Maddox, R.A. Flash Flood Forecasting: An Ingredients-Based Methodology. Weather Forecast. 1996, 11, 560–581. [Google Scholar] [CrossRef]
- Morin, E.; Yakir, H. Hydrological Impact and Potential Flooding of Convective Rain Cells in a Semi-Arid Environment. Hydrol. Sci. J. 2014, 59, 1353–1362. [Google Scholar] [CrossRef]
- Peleg, N.; Morin, E. Convective Rain Cells: Radar-Derived Spatiotemporal Characteristics and Synoptic Patterns over the Eastern Mediterranean. J. Geophys. Res. Atmos. 2012, 117, D15116. [Google Scholar] [CrossRef]
- Belachsen, I.; Marra, F.; Peleg, N.; Morin, E. Convective Rainfall in a Dry Climate: Relations with Synoptic Systems and Flash-Flood Generation in the Dead Sea Region. Hydrol. Earth Syst. Sci. 2017, 21, 5165–5180. [Google Scholar] [CrossRef]
- de Lima, C.A.; de Palácio, H.A.Q.; de Andrade, H.A.Q.; dosSantos, J.C.N.; Brasil, P.P. Characteristics of Rainfall and Erosion under Natural Conditions of Land Use in Semiarid Regions. Rev. Bras. Eng. Agríc. Ambient. 2013, 17, 1222–1229. [Google Scholar] [CrossRef]
- Lee, J.; Lee, S.; Hong, J.; Lee, D.; Bae, J.H.; Yang, J.E.; Kim, J.; Lim, K.J. Evaluation of Rainfall Erosivity Factor Estimation Using Machine and Deep Learning Models. Water 2021, 13, 382. [Google Scholar] [CrossRef]
- Wu, L.; Liu, X.; Ma, X. Spatiotemporal Distribution of Rainfall Erosivity in the Yanhe River Watershed of Hilly and Gully Region, Chinese Loess Plateau. Environ. Earth Sci. 2016, 75, 315. [Google Scholar] [CrossRef]
- Zheng, Y.; Li, S.; Ullah, K. Increased Occurrence and Intensity of Consecutive Rainfall Events in the China’s Three Gorges Reservoir Area Under Global Warming. Earth Space Sci. 2020, 7, e2020EA001188. [Google Scholar] [CrossRef]
- Wu, S.-J.; Tung, Y.-K.; Yang, J.-C. Incorporating Daily Rainfall to Derive At-Site Hourly Depth-Duration-Frequency Relationships. J. Hydrol. Eng. 2009, 14, 992–1001. [Google Scholar] [CrossRef]
- Zahiri, E.-P.; Bamba, I.; Famien, A.M.; Koffi, A.K.; Ochou, A.D. Mesoscale Extreme Rainfall Events in West Africa: The Cases of Niamey (Niger) and the Upper Ouémé Valley (Benin). Weather Clim. Extrem. 2016, 13, 15–34. [Google Scholar] [CrossRef]
- Dunkerley, D. Intra-Event Intermittency of Rainfall: An Analysis of the Metrics of Rain and No-Rain Periods. Hydrol. Process. 2015, 29, 3294–3305. [Google Scholar] [CrossRef]
- Dunkerley, D.L. Rainfall Intensity Bursts and the Erosion of Soils: An Analysis Highlighting the Need for High Temporal Resolution Rainfall Data for Research under Current and Future Climates. Earth Surf. Dyn. 2019, 7, 345–360. [Google Scholar] [CrossRef]
- Sighomnou, D.; Desbordes, M. Recherche d’un modèle de pluie de projet adapté aux précipitations de la zone tropicale africaine: Cas d’Adiopodoumé-Abidjan (Côte d’Ivoire). Hydrol. Cont. 1988, 3, 131–139. [Google Scholar]
- Yao, F.Z.; Reynard, E.; Ouattara, I.; N’go, Y.A.; Fallot, J.-M.; Savané, I. A New Statistical Approach to Assess Climate Variability in the White Bandama Watershed, Northern Côte d’Ivoire. ACS 2018, 8, 410–430. [Google Scholar] [CrossRef]
- Yao, K.C.J.; Kacou, M.; Koffi, E.S.; Dao, A.; Dutremble, C.; Guilliod, M.; Kamagaté, B.; Neppel, L.; Paturel, J.-E.; Perrin, J.-L.; et al. Rainfall Risk over the City of Abidjan (Ivory Coast): First Contribution to the Joint Analysis of Daily Rainfall from a Historical Record and a Recent Network of Rain Gauges. In Proceedings of the IAHS-AISH Scientific Assembly, Montpellier, France, 29 May–3 June 2022. [Google Scholar]
- Balme-Debionne, M. Analyse Du Régime Pluviométrique Sahélien Dans Une Perspective Hydrologique et Agronomique: Étude de l’impact de Sa Variabilité Sur La Culture Du Mil. Ph.D. Thesis, Grenoble INPG, Grenoble, France, 2004. [Google Scholar]
- Lawin, A. Analyse Climatologique et Statistique Du Régime Pluviométrique de La Haute Vallée de l’Oueme à Partir Des Données Pluviographiques Amma-Catch Benin. Ph.D. Thesis, Grenoble INPG, Grenoble, France, 2007. [Google Scholar]
- Amouin, J.; Kouadio, K.Y.; Kacou, M.; Djakouré, S.; Ta, S. Diagnosis of the Causes of the Rain Flooding in June in the West Africa Coastal Area. Atmos. Clim. Sci. 2020, 11, 11–31. [Google Scholar] [CrossRef]
- Houze, R.A., Jr. Convective and Stratiform Precipitation in the Tropics. In Tropical Rainfall Measurements; Theon, J.S., Fugono, N., Eds.; Deepak Pub.: Hampton, VA, USA, 1988; pp. 27–35. [Google Scholar]
- Evaristo, R.; Scialom, G.; Viltard, N.; Lemaître, Y. Polarimetric Signatures and Hydrometeor Classification of West African Squall Lines. Q. J. R. Meteorol. Soc. 2010, 136, 272–288. [Google Scholar] [CrossRef]
- Depraetere, C.; Gosset, M.; Ploix, S.; Laurent, H. The Organization and Kinematics of Tropical Rainfall Systems Ground Tracked at Mesoscale with Gages: First Results from the Campaigns 1999–2006 on the Upper Ouémé Valley (Benin). J. Hydrol. 2009, 375, 143–160. [Google Scholar] [CrossRef]
- Maranan, M. Rainfall Types over Southern West Africa: Diagnosis, Synoptic Environments and Representation in Satellite Retrievals. Available online: https://publikationen.bibliothek.kit.edu/1000099241 (accessed on 10 September 2020).
- Maranan, M.; Fink, A.H.; Knippertz, P. Rainfall Types over Southern West Africa: Objective Identification, Climatology and Synoptic Environment. Q. J. R. Meteorol. Soc. 2018, 144, 1628–1648. [Google Scholar] [CrossRef]
- Camberlin, P.; Kpanou, M.; Roucou, P. Classification of Intense Rainfall Days in Southern West Africa and Associated Atmospheric Circulation. Atmosphere 2020, 11, 188. [Google Scholar] [CrossRef]
- Nel, W.; Hauptfleisch, A.; Sumner, P.D.; Boojhawon, R.; Rughooputh, S.D.D.V.; Dhurmea, K.R. Intra-Event Characteristics of Extreme Erosive Rainfall on Mauritius. Phys. Geogr. 2016, 37, 264–275. [Google Scholar] [CrossRef]
- Gaye, A.; Viltard, A.; de Félice, P. Squall Lines and Rainfall over Western Africa during Summer 1986 and 87. Meteorol. Atmos. Phys. 2005, 90, 215–224. [Google Scholar] [CrossRef]
- Sangiorgio, M.; Barindelli, S. Spatio-Temporal Analysis of Intense Convective Storms Tracks in a Densely Urbanized Italian Basin. IJGI 2020, 9, 183. [Google Scholar] [CrossRef]
- Janiga, M.A.; Thorncroft, C.D. Convection over Tropical Africa and the East Atlantic during the West African Monsoon: Regional and Diurnal Variability. J. Clim. 2014, 27, 4159–4188. [Google Scholar] [CrossRef]
- Zhang, G.; Cook, K.H.; Vizy, E.K. The Diurnal Cycle of Warm Season Rainfall over West Africa. Part I: Observational Analysis. J. Clim. 2016, 29, 8423–8437. [Google Scholar] [CrossRef]
- Lafore, J.-P.; Flamant, C.; Giraud, V.; Guichard, F.; Knippertz, P.; Mahfouf, J.-F.; Mascart, P.; Williams, E.R. Introduction to the AMMA Special Issue on ‘Advances in Understanding Atmospheric Processes over West Africa through the AMMA Field Campaign. Q. J. R. Meteorol. Soc. 2010, 136, 2–7. [Google Scholar] [CrossRef]
- Thorncroft, C.D.; Nguyen, H.; Zhang, C.; Peyrillé, P. Annual Cycle of the West African Monsoon: Regional Circulations and Associated Water Vapour Transport. Q. J. R. Meteorol. Soc. 2011, 137, 129–147. [Google Scholar] [CrossRef]
- Raj, J.; Bangalath, H.K.; Stenchikov, G. West African Monsoon: Current State and Future Projections in a High-Resolution AGCM. Clim. Dyn. 2019, 52, 6441–6461. [Google Scholar] [CrossRef]


| Number | Name | Longitude (°W) | Latitude (°N) | Year of Installation |
|---|---|---|---|---|
| 1 | Azaguié | 4°3′36.792″ | 5°38′ 27.492″ | 2015 |
| 2 | Brofodoumé | 3°55′44.904″ | 5° 31′12.612″ | 2015 |
| 3 | Achokoi | 3°50′12.624″ | 5°22′35.508″ | 2015 |
| 4 | Attiekoi CET | 3°58′47.604″ | 5°29′28.392″ | 2015 |
| 5 | Anyama | 4°3′31.608″ | 5°29′43.584″ | 2015 |
| 6 | Ste Foi | 4°1′23.628″ | 5°26′40.956″ | 2015 |
| 7 | UNA | 4°1′9.732″ | 5°23′33.216″ | 2018 |
| 8 | UFHB | 3°59′24.324″ | 5°20′47.004″ | 2018 |
| 9 | Riviera Nord F9 | 3°56′28.932″ | 5°22′57.36″ | 2019 |
| 10 | Riviera centre F12 | 3°58′34.608″ | 5°23′6.936″ | 2019 |
| 11 | Djibi F3 | 3°57′46.224″ | 5°24′36.036″ | 2019 |
| 12 | Adiopodoumé | 4°7′52.068″ | 5°20′10.176″ | 2019 |
| 13 | INFAS | 4°0′15.48″ | 5°17′21.912″ | 2019 |
| 14 | Yopougon Usine | 4°3′53.316″ | 5°21′37.332″ | 2019 |
| 15 | Marcory | 3°58′17.004″ | 5°17′51.9″ | 2019 |
| 16 | Yopougon CNPS | 4°3′59.688″ | 5°19′44.04″ | 2019 |
| 17 | UNA CFC | 4°0′48.636″ | 5°25′38.676″ | 2019 |
| 18 | Notre Dame | 3°57′22.14″ | 5°22′39.684″ | 2019 |
| 19 | Beraca | 3°57′12.996″ | 5°23′26.232″ | 2019 |
| 20 | Abobo Bois sec | 4°2′34.008″ | 5°27′9.468″ | 2020 |
| 21 | Cité Sir | 3°56′0.564″ | 5°23′24.936″ | 2020 |
| Year | Network Rainfall Events | Mean Rainfall from Identified Events (mm) | Annual Rainfall from Average Hyetograph (mm) |
|---|---|---|---|
| 2018 | 232 | 1810 | 1944 |
| 2019 | 363 | 1705 | 1786 |
| 2020 | 293 | 1884 | 1943 |
| 2021 | 352 | 1674 | 1726 |
| Total | 1240 | ||
| Interannual average | 310 | 1768 | 1850 |
| Year | Convective Events | Stratiform Events | Mixed Events (Convective and Stratiform) |
|---|---|---|---|
| 2018 | 0 | 47 (20.3%) | 185 (79.7%) |
| 2019 | 0 | 51 (14.0%) | 312 (86.0%) |
| 2020 | 0 | 24 (08.2%) | 269 (91.8%) |
| 2021 | 0 | 30 (08.5%) | 322 (91.5%) |
| Total | 0 (0%) | 152 (12.3%) | 1088 (87.7%) |
| Moment of Day | Nature of Event | Percentage (Number of Event) | Total |
|---|---|---|---|
| Day | Mixed (Convective and Stratiform) | 50.1% (621) | 56.2% (697) |
| Stratiform | 06.1% (76) | ||
| Night | Mixed (Convective and Stratiform) | 23.6% (293) | 28.6% (355) |
| Stratiform | 05.0% (62) | ||
| Day–Night | Mixed (Convective and Stratiform) | 14.0% (174) | 15.2% (188) |
| Stratiform | 01.1% (14) | ||
| Total | Mixed (Convective and Stratiform) | 87.7% (1088) | 100% (1240) |
| Stratiform | 12.3% (152) |
| Number of Events Per Day | 1 | 2 | 3 | 4 | 5 | 6 | 7 |
|---|---|---|---|---|---|---|---|
| Occurrence (percentage) | 424 (57.9%) | 184 (25.1%) | 73 (10.0%) | 33 (4.5%) | 12 (1.6%) | 5 (0.7%) | 1 (0.1%) |
Disclaimer/Publisher’s Note: The statements, opinions and data contained in all publications are solely those of the individual author(s) and contributor(s) and not of MDPI and/or the editor(s). MDPI and/or the editor(s) disclaim responsibility for any injury to people or property resulting from any ideas, methods, instructions or products referred to in the content. |
© 2023 by the authors. Licensee MDPI, Basel, Switzerland. This article is an open access article distributed under the terms and conditions of the Creative Commons Attribution (CC BY) license (https://creativecommons.org/licenses/by/4.0/).
Share and Cite
Kacou, M.; Zahiri, E.-P.; Yao, K.C.; Séguis, L.; Dutremble, C.; Koffi, E.S.; Perrin, J.-L.; Dao, A.; Kodji, A.A.F.; Konan, K.F.; et al. The Phenomenology of West African Coastal Rainfall Events Based on a New Rain Gauge Network over Abidjan (Côte d’Ivoire). Atmosphere 2023, 14, 1322. https://doi.org/10.3390/atmos14091322
Kacou M, Zahiri E-P, Yao KC, Séguis L, Dutremble C, Koffi ES, Perrin J-L, Dao A, Kodji AAF, Konan KF, et al. The Phenomenology of West African Coastal Rainfall Events Based on a New Rain Gauge Network over Abidjan (Côte d’Ivoire). Atmosphere. 2023; 14(9):1322. https://doi.org/10.3390/atmos14091322
Chicago/Turabian StyleKacou, Modeste, Eric-Pascal Zahiri, Kouakou Christian Yao, Luc Séguis, Clément Dutremble, Ehouman Serge Koffi, Jean-Louis Perrin, Amidou Dao, Angah Armel Fourier Kodji, Kouamé Fréjus Konan, and et al. 2023. "The Phenomenology of West African Coastal Rainfall Events Based on a New Rain Gauge Network over Abidjan (Côte d’Ivoire)" Atmosphere 14, no. 9: 1322. https://doi.org/10.3390/atmos14091322