Article

The Effects of Planetary Boundary Layer Features on Air Pollution Based on ERA5 Data in East China

1
Hefei Meteorological Bureau, Hefei 230041, China
2
Anhui Climate Center, Hefei 230031, China
3
State Key Laboratory of Numerical Modeling for Atmosphere Sciences and Geophysical Fluid Dynamics (LASG), Institute of Atmospheric Physics, Chinese Academy of Sciences, Beijing 100029, China
*
Author to whom correspondence should be addressed.
Atmosphere 2023, 14(8), 1273; https://doi.org/10.3390/atmos14081273
Submission received: 10 July 2023 / Revised: 4 August 2023 / Accepted: 9 August 2023 / Published: 11 August 2023
(This article belongs to the Special Issue Multi-source Meteorological Data Fusion and Assimilation Methods)

Abstract

:
The planetary boundary layer (PBL) structure and its evolution can significantly affect air pollution. Here, the PBL’s characteristics and their association with air pollution were analyzed in Hefei, east China, using ERA5 reanalysis data, weather observations and air pollutant measurements from 2016 to 2021. In the near-surface level, air pollution was directly influenced by ground meteorological conditions, and high PM2.5 was normally related to weak wind speed, northwest wind anomalies, low temperature and high relative humidity. Moreover, in the trajectory analysis, air masses from the north and the northwest with short length played an important role in the high PM2.5 with pollutant transport within the PBL. Furthermore, high PM2.5 showed a tight dependence on PBL stratification. There was high temperature and relative humidity and low wind speed and PBL height within all PBL altitudes in the polluted condition. Notably, vertical wind shear (VWS) and temperature gradient tended to be much weaker below 900 hPa, which created a deeply stable stratification that acted as a cap to upward-moving air. Such a PBL structure facilitated more stable stratification and enhanced the generation of air pollution. Finally, the stable stratification in the PBL was related to the special synoptic configuration for the high PM2.5 conditions, which included the block situation at the high level, the southerly wind anomalies at the middle level and the wild range of the uniform pressure field at the near-ground level. Therefore, air pollutant concentrations were regulated by ground factors, PBL structure and the synoptic situation. Our results provide a precise understanding of the role of PBL features in air pollution, which contributes to improving the assimilation method of the atmospheric chemistry model in east China.

1. Introduction

Air pollution events occur frequently in China, with a significant increase in industrial emissions and vehicle exhaust since 2000, causing severe ecology and health problems [1,2]. People are becoming more aware of the dangers of air pollution, and the government has made significant attempts to improve air quality [3,4]. The most pressing task is to find out why air pollution forms by examining emission sources and meteorological conditions, which can provide helpful control ideas for local governments [5,6].
In recent years, the main primary pollutant in China is particulate matter (PM), which comes from fossil-fuel combustion, car exhaust and gas–particle conversion [7,8]. Furthermore, meteorological conditions impact air quality through a complicated set of processes and effects, such as regional transport, local accumulation and moist or dry removal processes [9,10]. Normally, pollutant emissions are basically constant in the short term, so weather factors play a leading role in air quality deterioration [11,12,13].
Air pollutants are affected by local ground conditions, PBL vertical structure and the large-scale synoptic situation in terms of meteorological role [14,15,16]. Recent research indicates that among ground meteorological factors, wind speed and precipitation both have an obvious role in PM2.5 concentration [17]. The scavenging effect of precipitation on aerosol is primarily demonstrated by moist deposition and wet removal [18]. Like cloud condensation nuclei, aerosol particulates can be washed out by raindrops [19,20]. High wind speed tends to create strong turbulence, which results in better dispersion conditions for contaminants, and lower wind speeds promote PM2.5 accumulation with weak horizontal diffusion ability [21,22]. Because of the migration of air contaminants, wind direction has a significant impact on air pollutants [23,24]. With regard to the large-scale synoptic situation, it interacts with regional PM2.5 at larger spatial scales and thus can affect the long temporal change in PM2.5 [25,26]. Synoptic circulation offers a large-scale backdrop of local weather conditions, which impacts the characteristics of the ground meteorological variables and PBL structure related to PM2.5, including rainfall, wind factors, relative humidity, cloud parameters, radiation balance and temperature [27,28,29,30,31]. Most previous studies mainly focused on the favorable synoptic circulation of heavy air pollution in the United States [32,33] and China [34,35].
PBL, as a link between the ground conditions and synoptic situation, modifies PM2.5 concentration fluctuation through thermal and dynamic roles, such as inversion layer and vertical wind shear (VWS). The PBL’s thermos-dynamic stratification affects the vertical exchange of air pollutants. During the convective PBL, air contaminants tend to mix evenly by way of convective turbulence in the vertical direction [36,37]. As the dynamic structure of the PBL, low-level jets (LLJs) have an effect on air pollution with strong VWS within the PBL in various areas around the globe. For instance, using measurements of wind profiler radars in north China, Zhang et al. [38] revealed that VWS can modulate PM concentration. Klein et al. [39] proved the role of LLJs in altering urban air-pollutant concentrations using a numerical model in the United States. Temperature stratification, as an important thermal factor of the PBL, can suppress the vertical diffusion of air pollutants with a deep thermal inversion layer and low PBL height [24]. For instance, using a balloon sounding system in north and central China, Sun et al. [40] and Li et al. [36] found that less unstable structures in the PBL favored the heavy pollution with a slight vertical PM2.5.
East China experiences severe air pollution, especially in winter. Therefore, it is essential to clarify the influence of the PBL on air pollution. So far, the effect mechanism of the PBL on PM2.5 is unclear due to a lack of vertical observation of the PBL. Now, the latest ERA5 dataset has high-resolution vertical information, and it provides a possibility for PBL research in these areas [41,42]. Thus, in this paper, the effects of the PBL on PM2.5 based on ERA5 data in east China are presented. Section 2 introduces the study area, observational data and research methods. Section 3 analyzes the PBL features and their effects on the different levels of air pollution. Section 4 provides a brief summary.

2. Materials and Methods
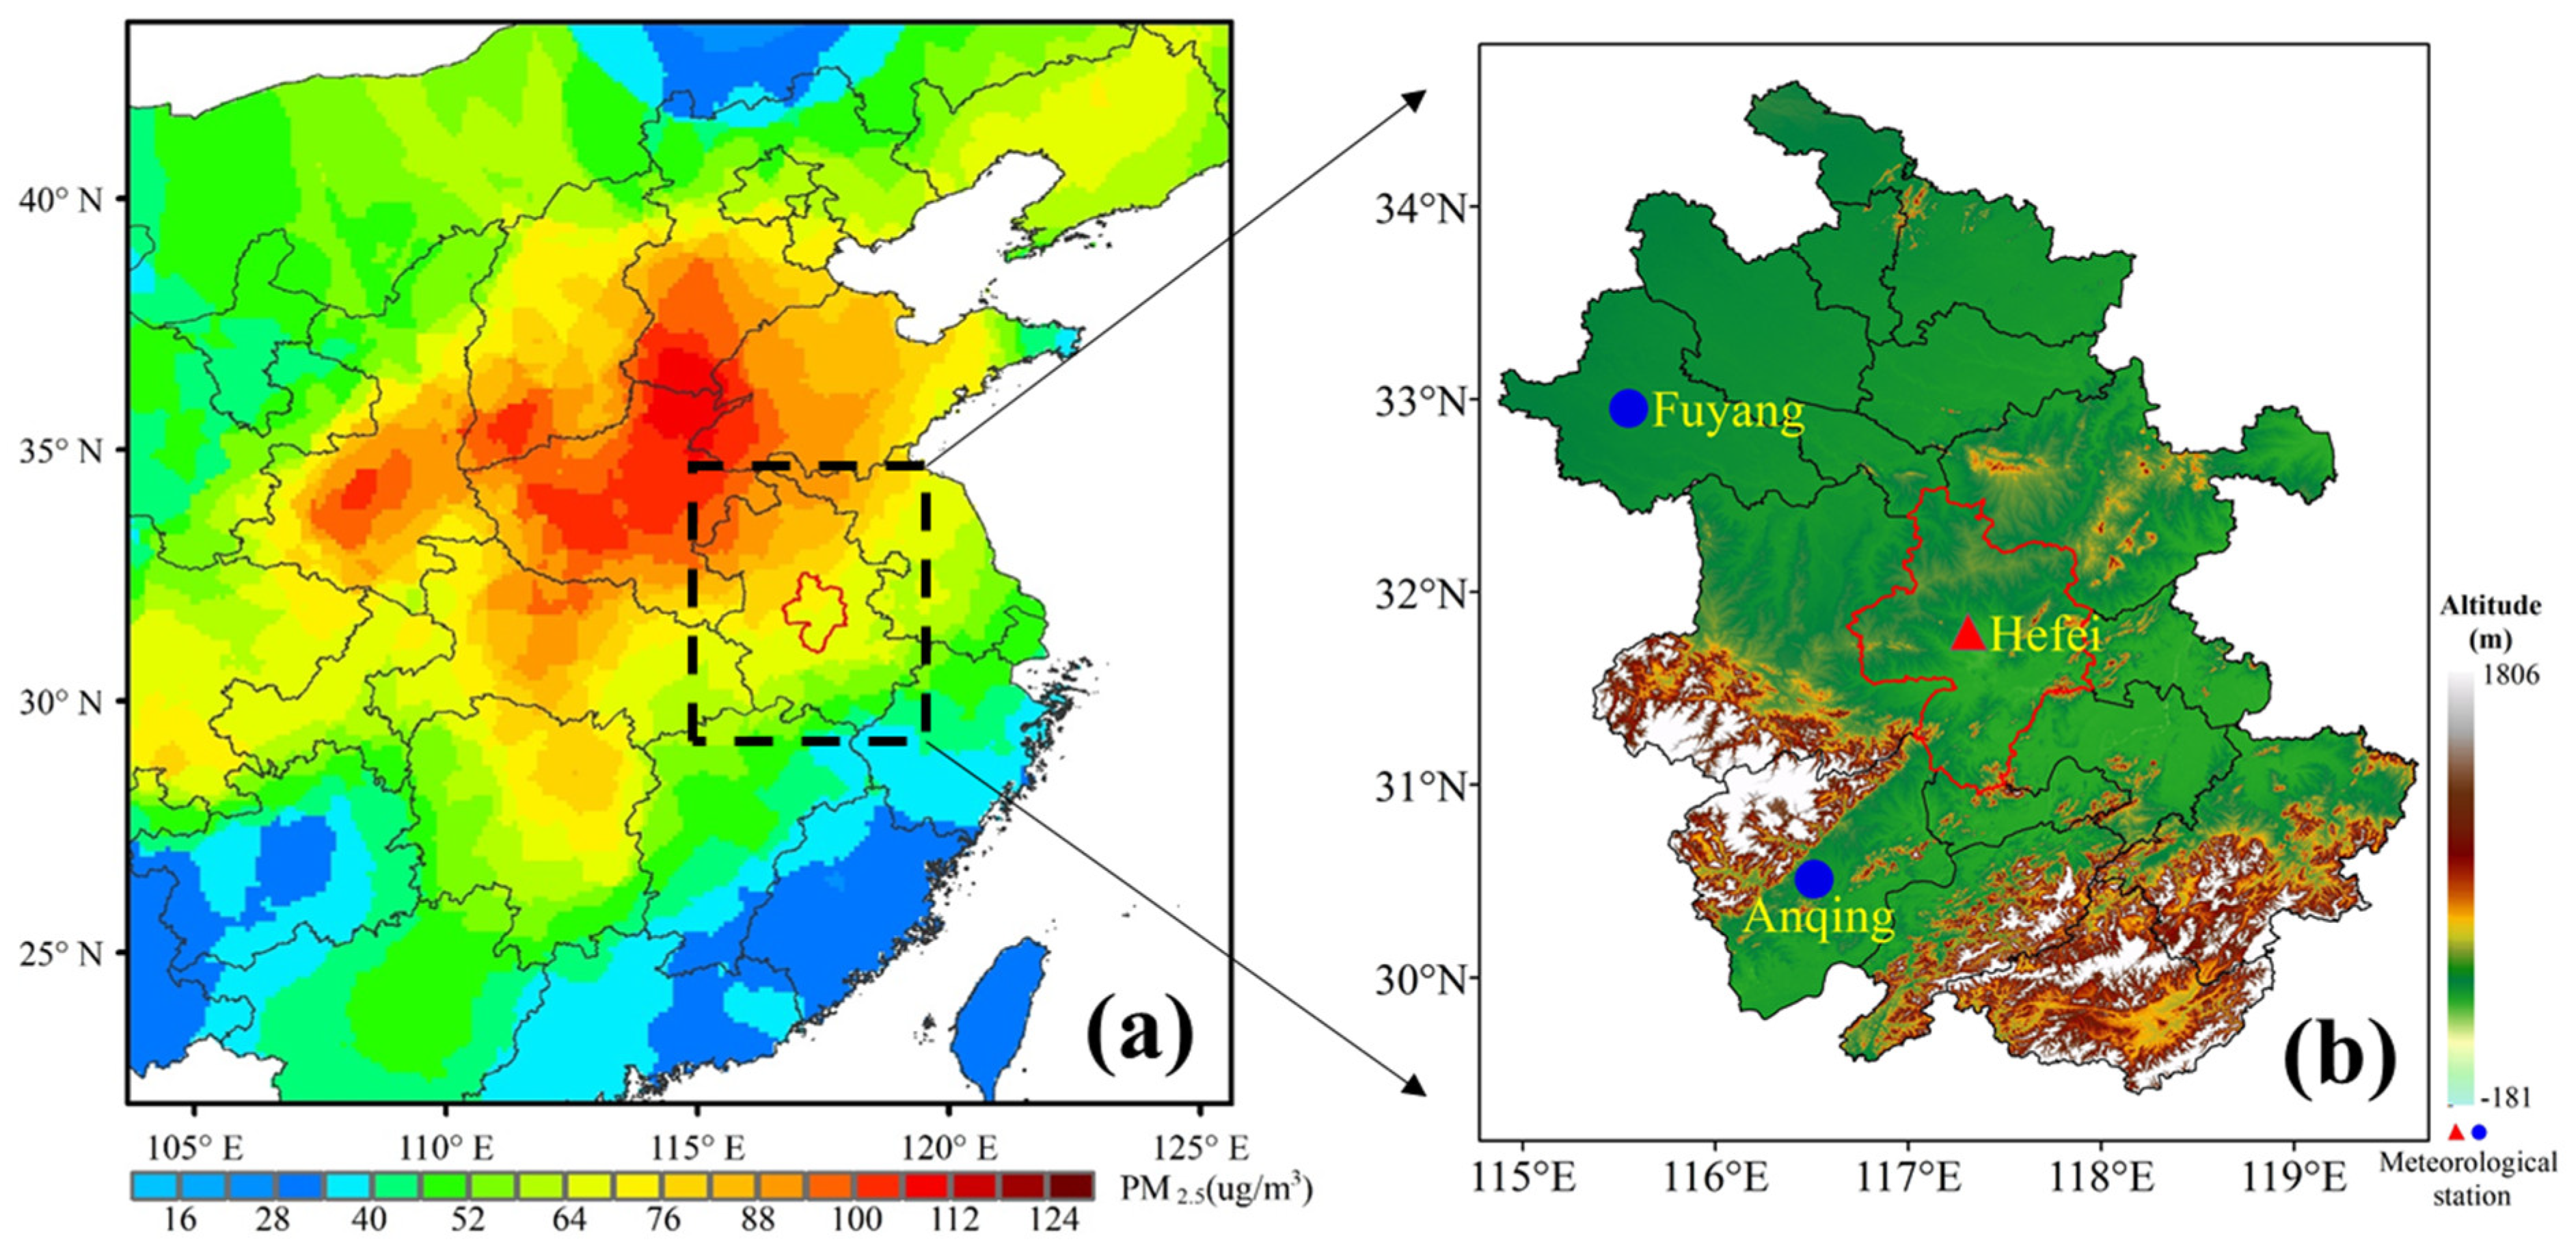
2.1. Study Area

Hefei, located in east China, is a new large city with a population of 10 million and an area of 11 thousand square kilometers. This area, as shown in Figure 1a, lies in a climate transition zone with frequent heavy rainfall events. Meanwhile, it is located on the pollutant transport belt between the Jing-Jin-Ji and Yangtze River Delta areas, where air pollution often occurs in winter [43]. Air pollution in Hefei has a complex formation cause including local emissions and regional transmission [44,45,46]. Because Hefei is bordered by the Dabie Mountains to the west, the Huang Mountains to the south and plains areas to the north and east (Figure 1b), air pollutants from the north cannot export southward and accumulate around Hefei [24].

2.2. ERA5 Reanalysis Data

ERA5 is the most recent ECMWF reanalysis dataset [47]. With a 0.25° horizontal grid, ERA5 can provide hourly horizontal wind, air temperature and humidity data, and it has 37 pressure levels below 1 hPa [48]. Because of its great geographical and temporal resolution, ERA5 has been frequently employed in studies on air pollution [49], clouds [50] and heavy rainfall [51]. In this study, ERA5 was used from 2016 to 2021, and the high spatiotemporal resolutions of the ERA5 dataset can meet the criteria of vertical structure analysis [52,53,54]. The applicability of the ERA5 data at the research region is compared with that of radiosondes in Supplementary Figure S1.

2.3. Air Pollutant Data

This study uses hourly concentrations of major pollutants measured on the ground in Hefei, including particulate matter (PM2.5), nitrogen dioxide (NO2), sulfur dioxide (SO2), carbon monoxide (CO) and ozone (O3), which were downloaded from the official website of the Ministry of Ecology and Environment of China. As shown in Figure 2, PM2.5 concentration has significant seasonal variation characteristics, and only the PM2.5 concentration in winter was discussed in this work, as winter had the maximum PM2.5 concentration. Meanwhile, hourly PM2.5 in precipitation periods was excluded. The hourly PM2.5 was separated into three equal groups on the basis of the lower, middle and upper terciles of normalized PM2.5. The lower and upper groupings correspond to the clean and contaminated degrees, respectively [40]. Then, clean and polluted conditions were compared to discuss the difference in vertical structure.

2.4. Backward Trajectory and Cluster Analysis

The HYSPLIT model, commonly known as the backward trajectory [55], is a useful tool for analyzing air-mass pathways. HYSPLIT can obtain backward and forward trajectories at a fixed location for varying heights and times [56]. The input data of the HYSPLIT model comprise the Global Data Assimilation System (GDAS) dataset of the NCEP. In addition, cluster analysis (CA) was applied with statistical methods to group similar trajectories [57,58], and distinct clusters of back trajectories belong to different synoptic circulation systems [59].

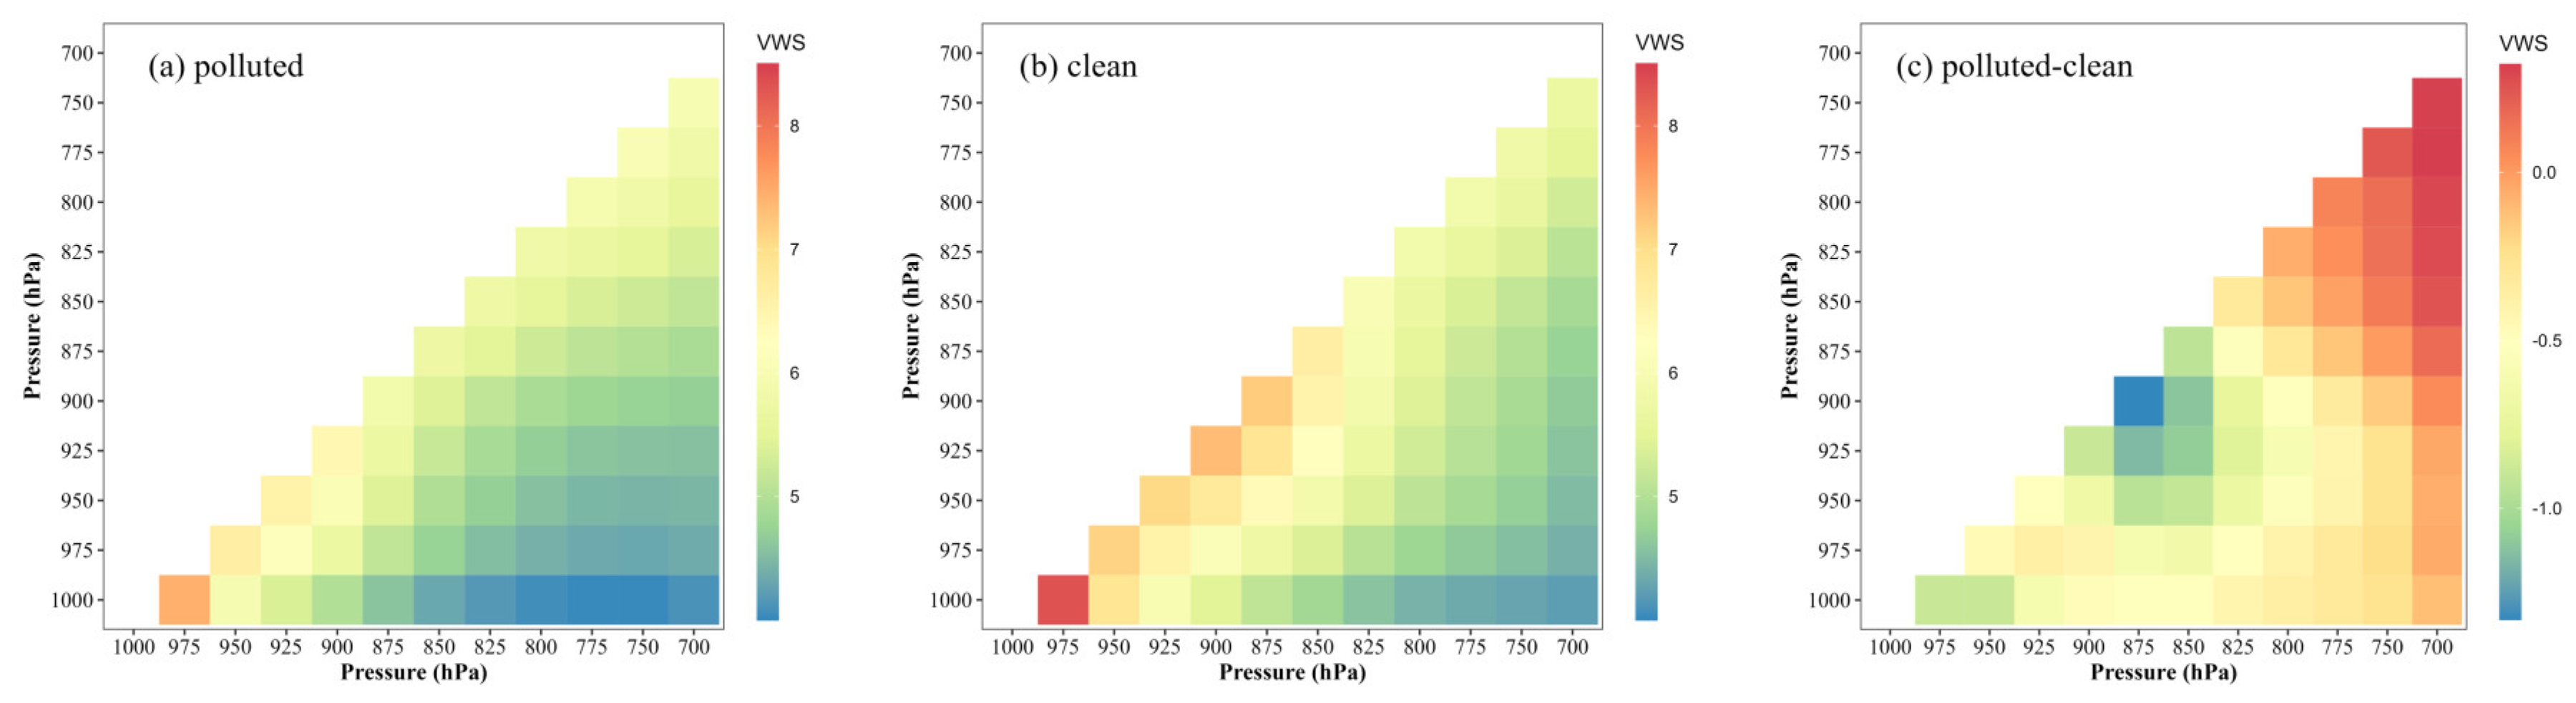
2.5. Calculation of Vertical Wind Shear and Temperature Gradient

To analyze the effect of meteorological vertical structure on air pollution in Hefei, VWS and gradient of temperature must be computed in the beginning. Therefore, VWS is calculated as follows [60]:
V W S = ( u t u l ) 2 + ( v t   v l ) 2 ( z t z l ) × 1000
where VWS is the vertical wind shear between the top and low levels in units of m/(s·km). u t ( u l ) and v t ( v l ) respectively indicate the zonal and meridional wind at the height of top level ( z t ) and low level ( z l ).
To discuss thermal role, the gradient of temperature was computed between two vertical levels using Equation (2):
G d = f t f l z t z l × 100
where Gd is the gradient of temperature in units of °C/100 m. f t and f l respectively represent the temperatures at the height of top level ( z t ) and low level ( z l ).

3. Results and Discussion

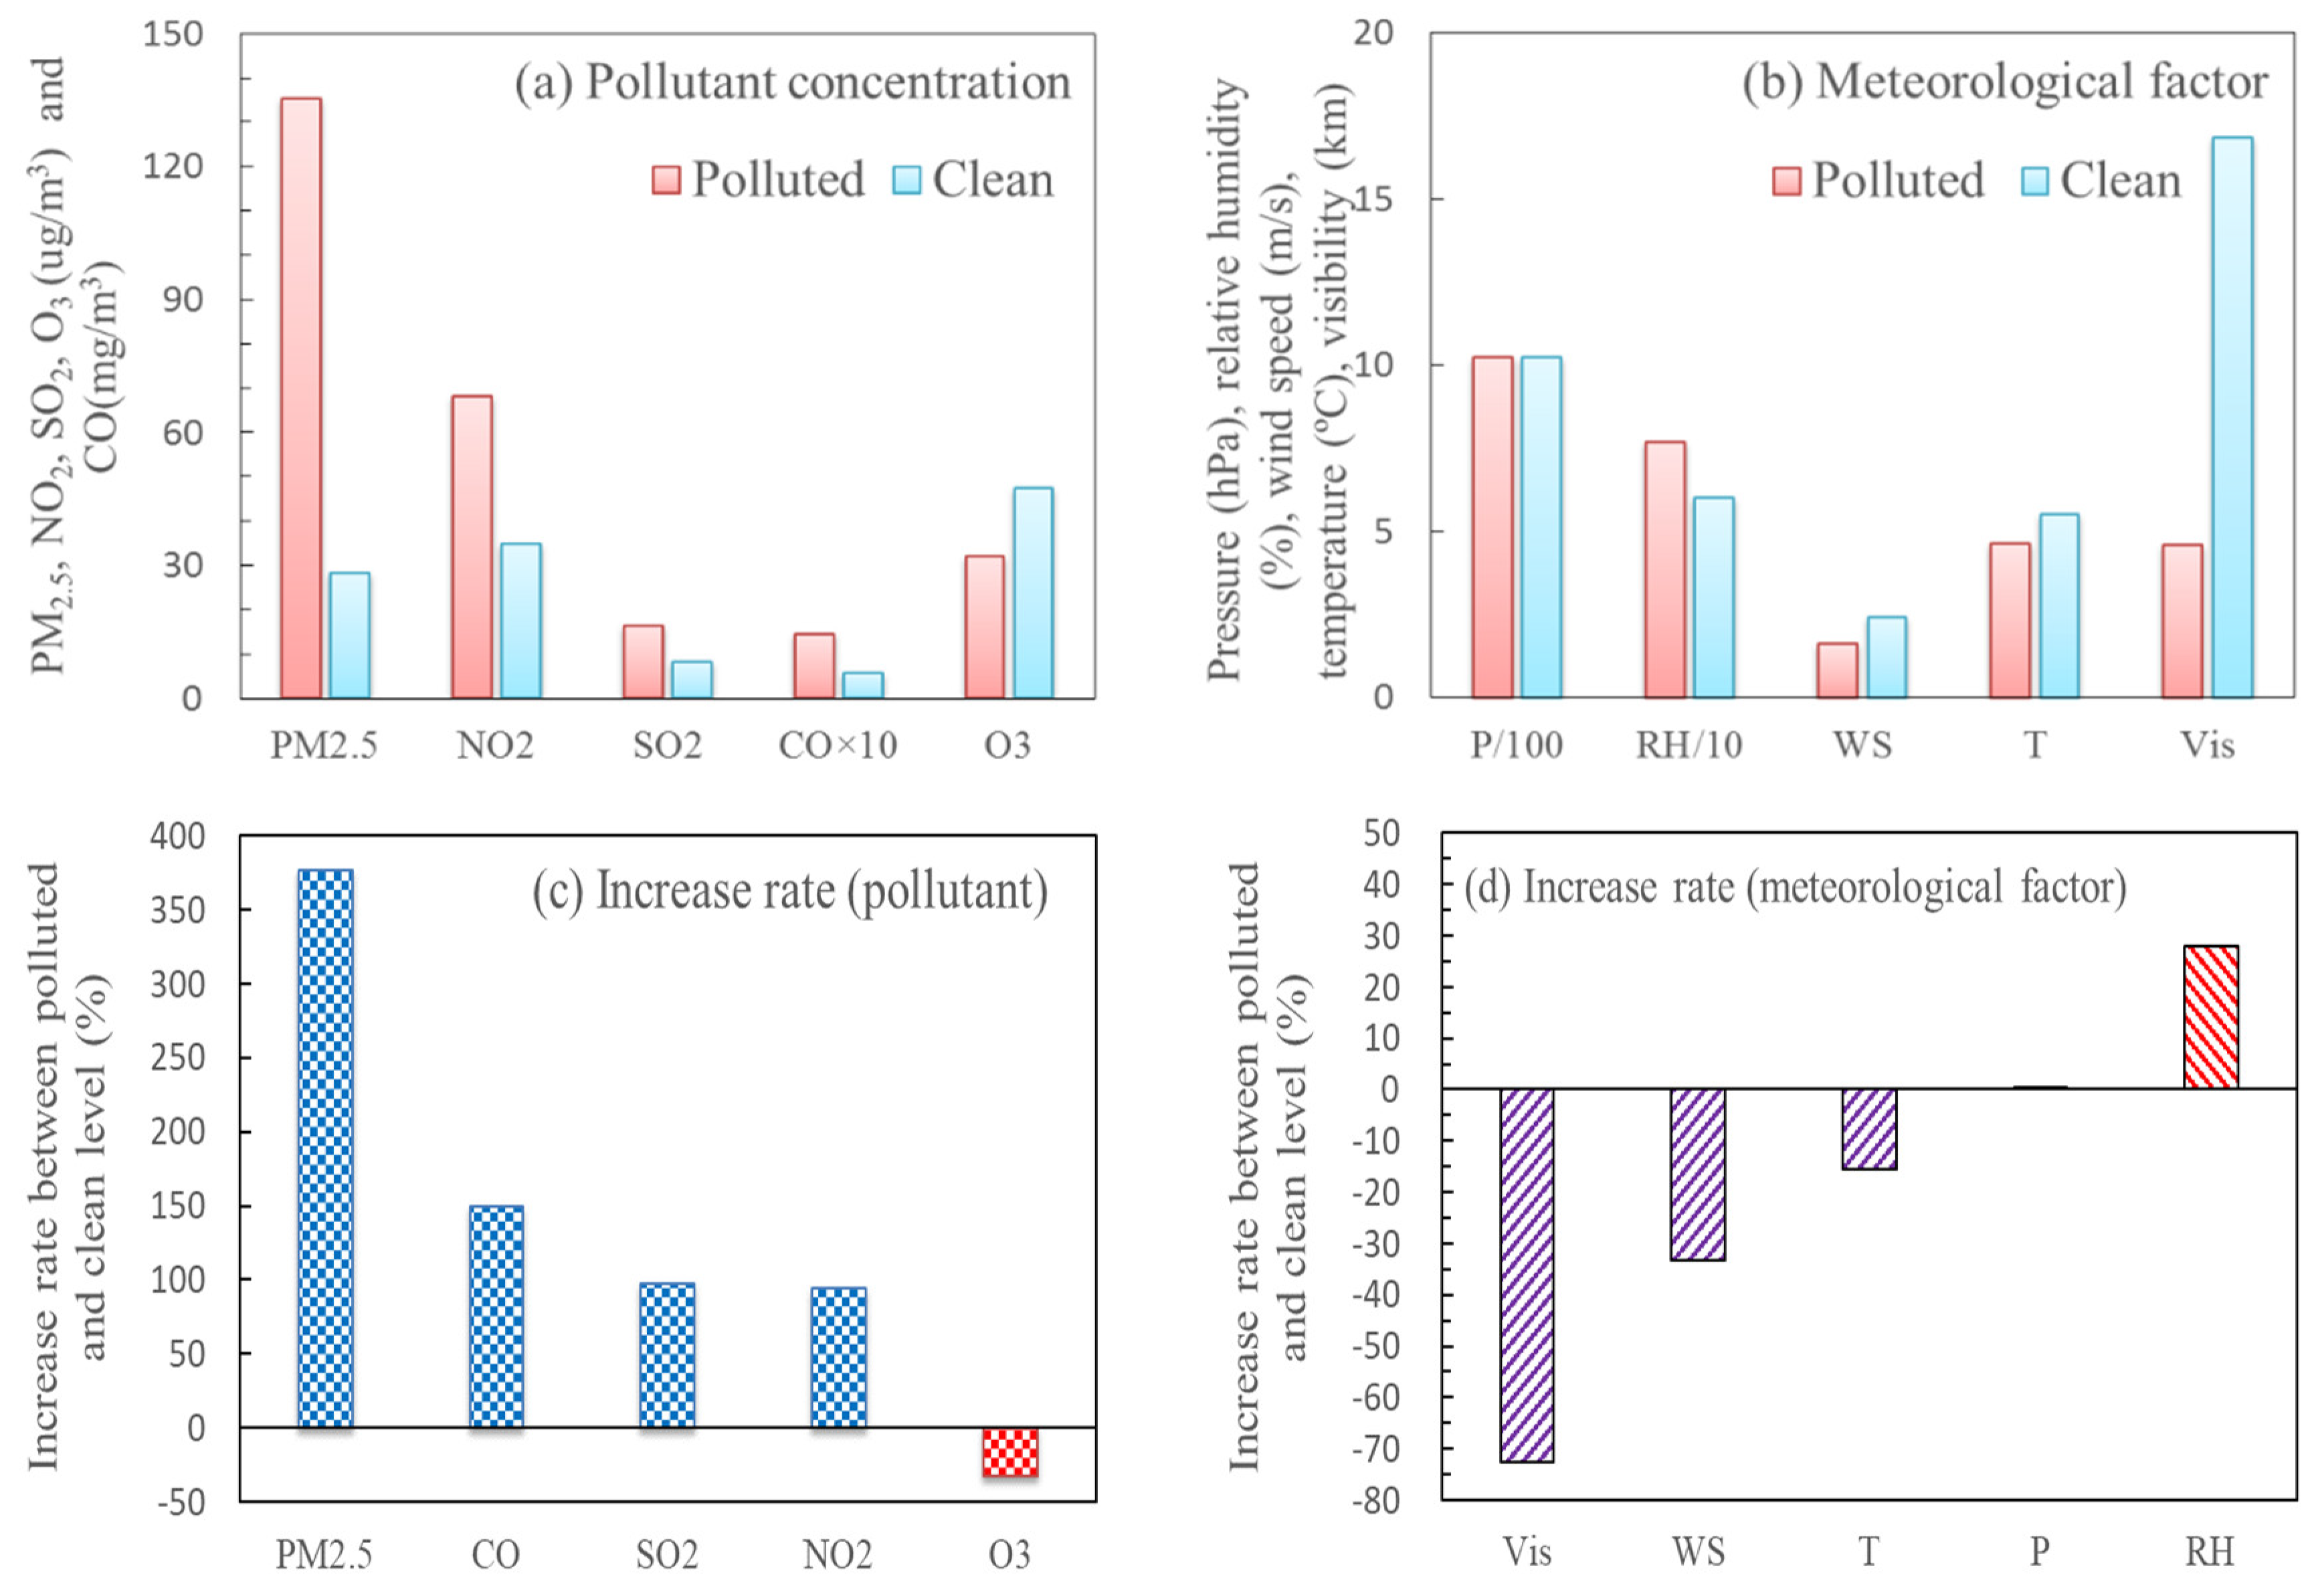
3.1. Impact of Surface Meteorological Factors

In this section, the near-surface weather conditions and pollutant concentrations underlying the polluted and clean conditions (defined in Section 2.3) are discussed. Figure 3 shows air pollutants, meteorological factors and their increase rates (Equation (3)) between the polluted and clean conditions during the winters of 2016–2021 in Hefei. It can be seen that all surface pollutants and weather factors experienced notable differences between the polluted and clean conditions. Equation (3) is as follows:
I R = C p C l C l × 100
where IR is the increase rate in units of %. C p and C l respectively represent the values of air pollutants or weather factors in the polluted and clean conditions.
Pollution emission directly leads to heavy pollution. Except for ozone, most particulate matter and gaseous pollutants rose considerably in the polluted condition (Figure 3a). The PM2.5 concentrations were 135.2 and 28.4 ug/m3 in the polluted and clean conditions, respectively, with increase rates of 380% (Figure 3c). Furthermore, the increase rates of gaseous pollutants were, successively, 150% (CO), 97% (SO2) and 95% (NO2), and the gas–particle conversion can enhance air pollution formation [61].
Meteorological factors, as an external cause, can influence the buildup of heavy air pollution [31]. As a good indicator of pollutant dispersion, the wind speed sharply decreased from 2.4 to 1.6 m/s during the two conditions with increase rates of −33% (Figure 3b,d). In the Yangtze River Basin, the equilibrium wind speed is roughly 2.1 m/s [62]; therefore, low wind speed is conducive to the accumulation of local pollutants, but high wind speed can clear pollutants. Relative humidity, as an essential driver of hygroscopic growth [63], increased from 60% (clean) to 77% (polluted) with increase rates of 28%. High humidity promotes the hygroscopic growth of particulate matter, which raises aerosol mass concentrations and increases the extinction coefficient. As a result of this increasing extinction, visibility reduced sharply from 16.8 km (clean) to 4.6 km (polluted), and its increase rates nearly reached −73%. Furthermore, compared to the clean condition, sea-level pressure increased slightly and temperature decreased by 16% in the polluted condition, which might have been caused by the frequent cold-air events with pollution transmission from the upstream region.
Wind direction is a useful index for judging the effect of pollution transport [24]. Figure 4 shows that the ground wind rose during the winters of 2016–2021 at Hefei station. The prevailing northerly wind dominated in winter. The most noticeable difference between the polluted and clean conditions was an increase in calm wind from 2.1% (clean) to 5.8% (polluted) (Figure 4a,b). Then, the 3.7% increment in calm wind led to more local accumulation of air pollutants (Figure 4c). Moreover, the frequency of the northwesterly (NW) and north-northwesterly (NNW) wind increased by a total of 3%, while the northeasterly wind (NE, NNE) and southwesterly wind (S, SW, WSW, W) all decreased noticeably. Considering the PM2.5 distribution around Hefei (Figure 1), the northwest upstream of Hefei was the most polluted area, and the increasing northwest wind can bring more air pollutants from the upstream region, which further increased the outbreaks of heavy air-pollution events.
As a result of the foregoing analysis, we found that the air pollution in Hefei was directly impacted by near-surface circumstances, including air pollutants and meteorological variables, in the horizontal direction. Furthermore, air pollutants can be transmitted vertically upwards; therefore, the meteorological vertical structure should be examined [40].

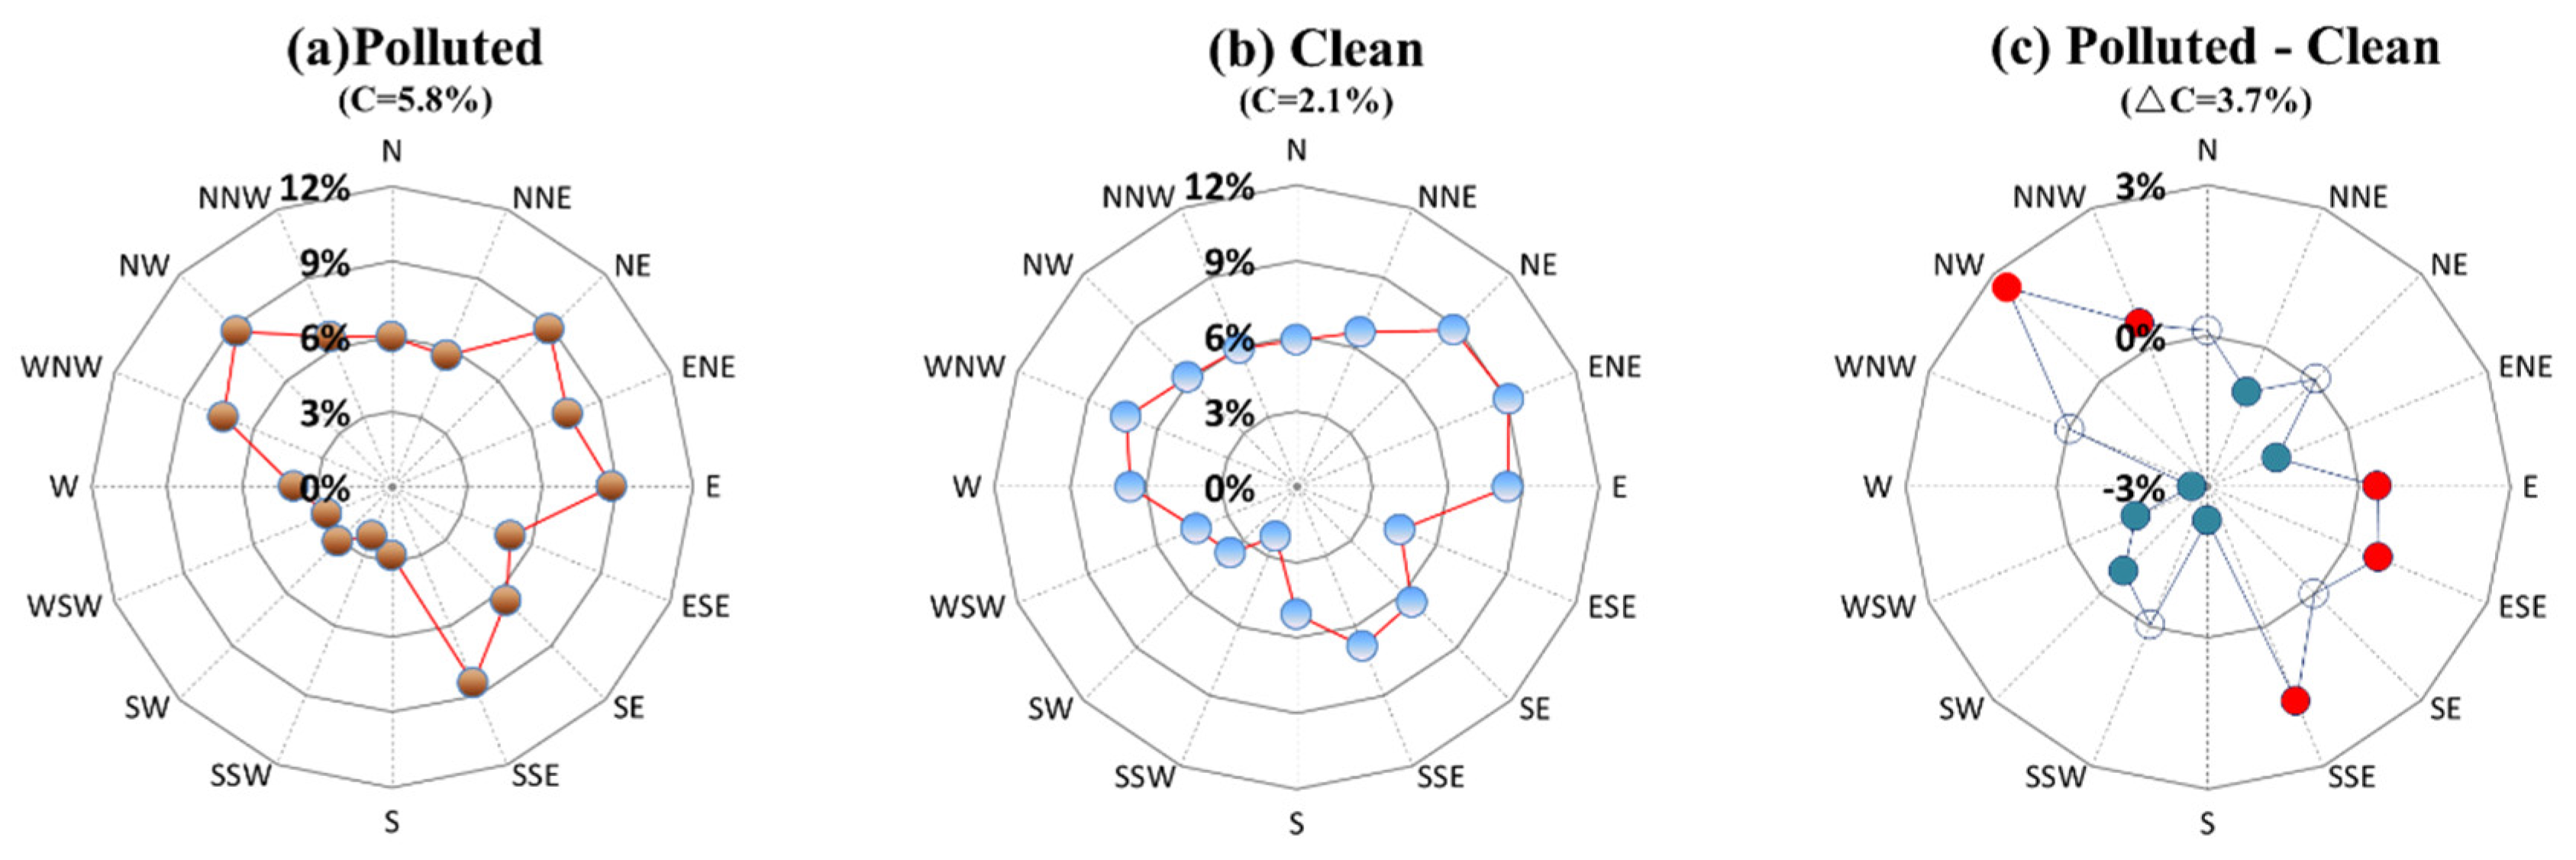
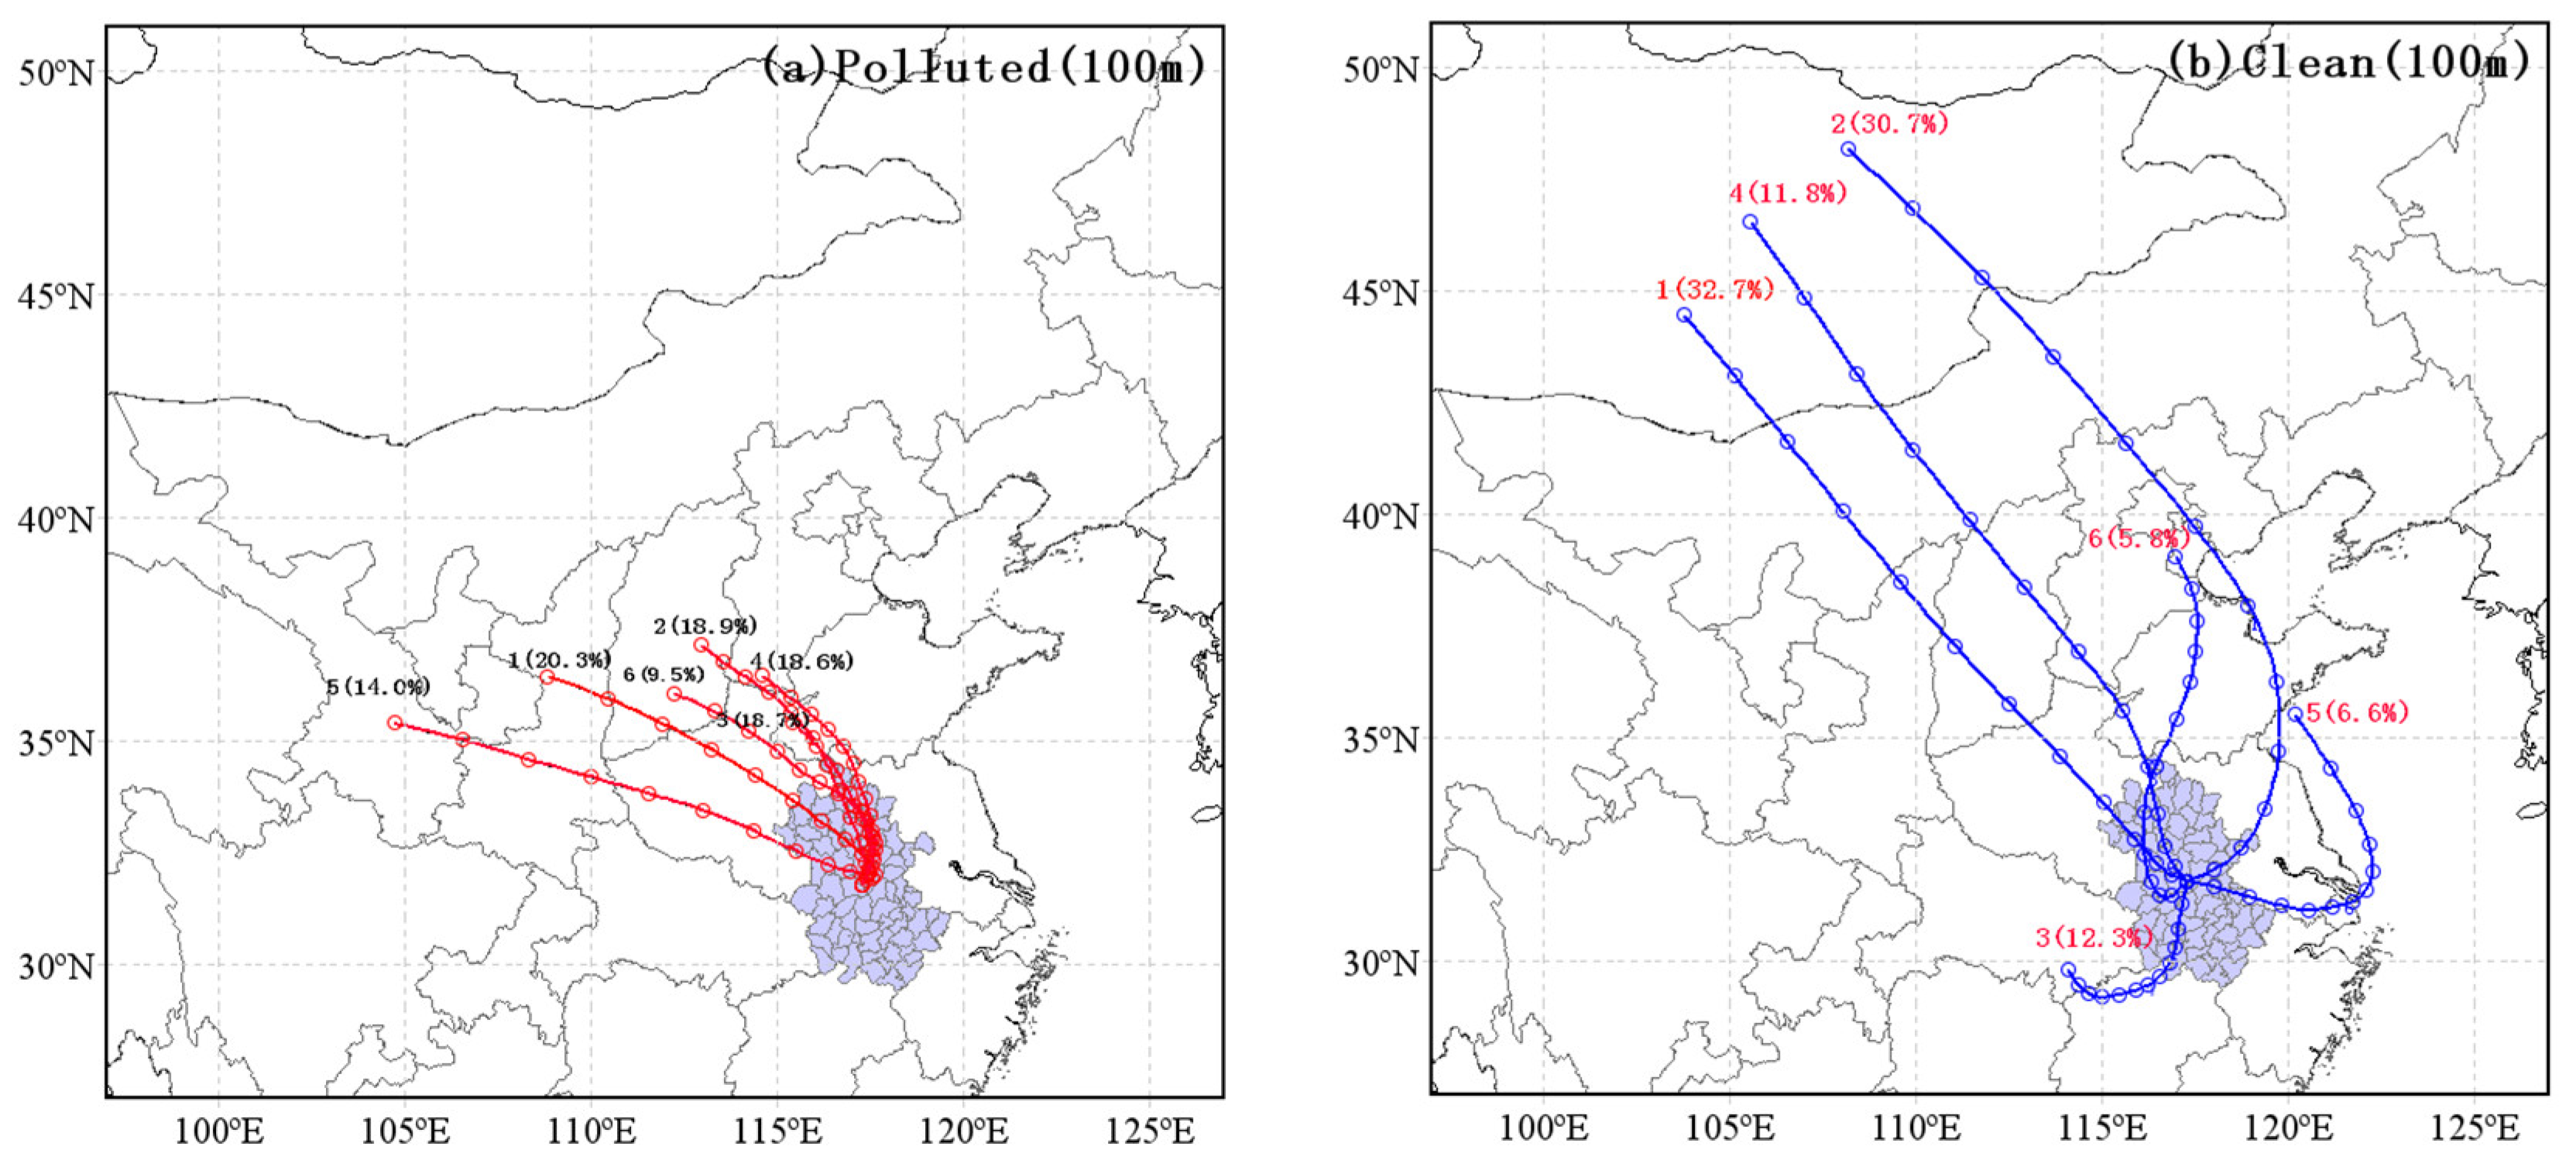
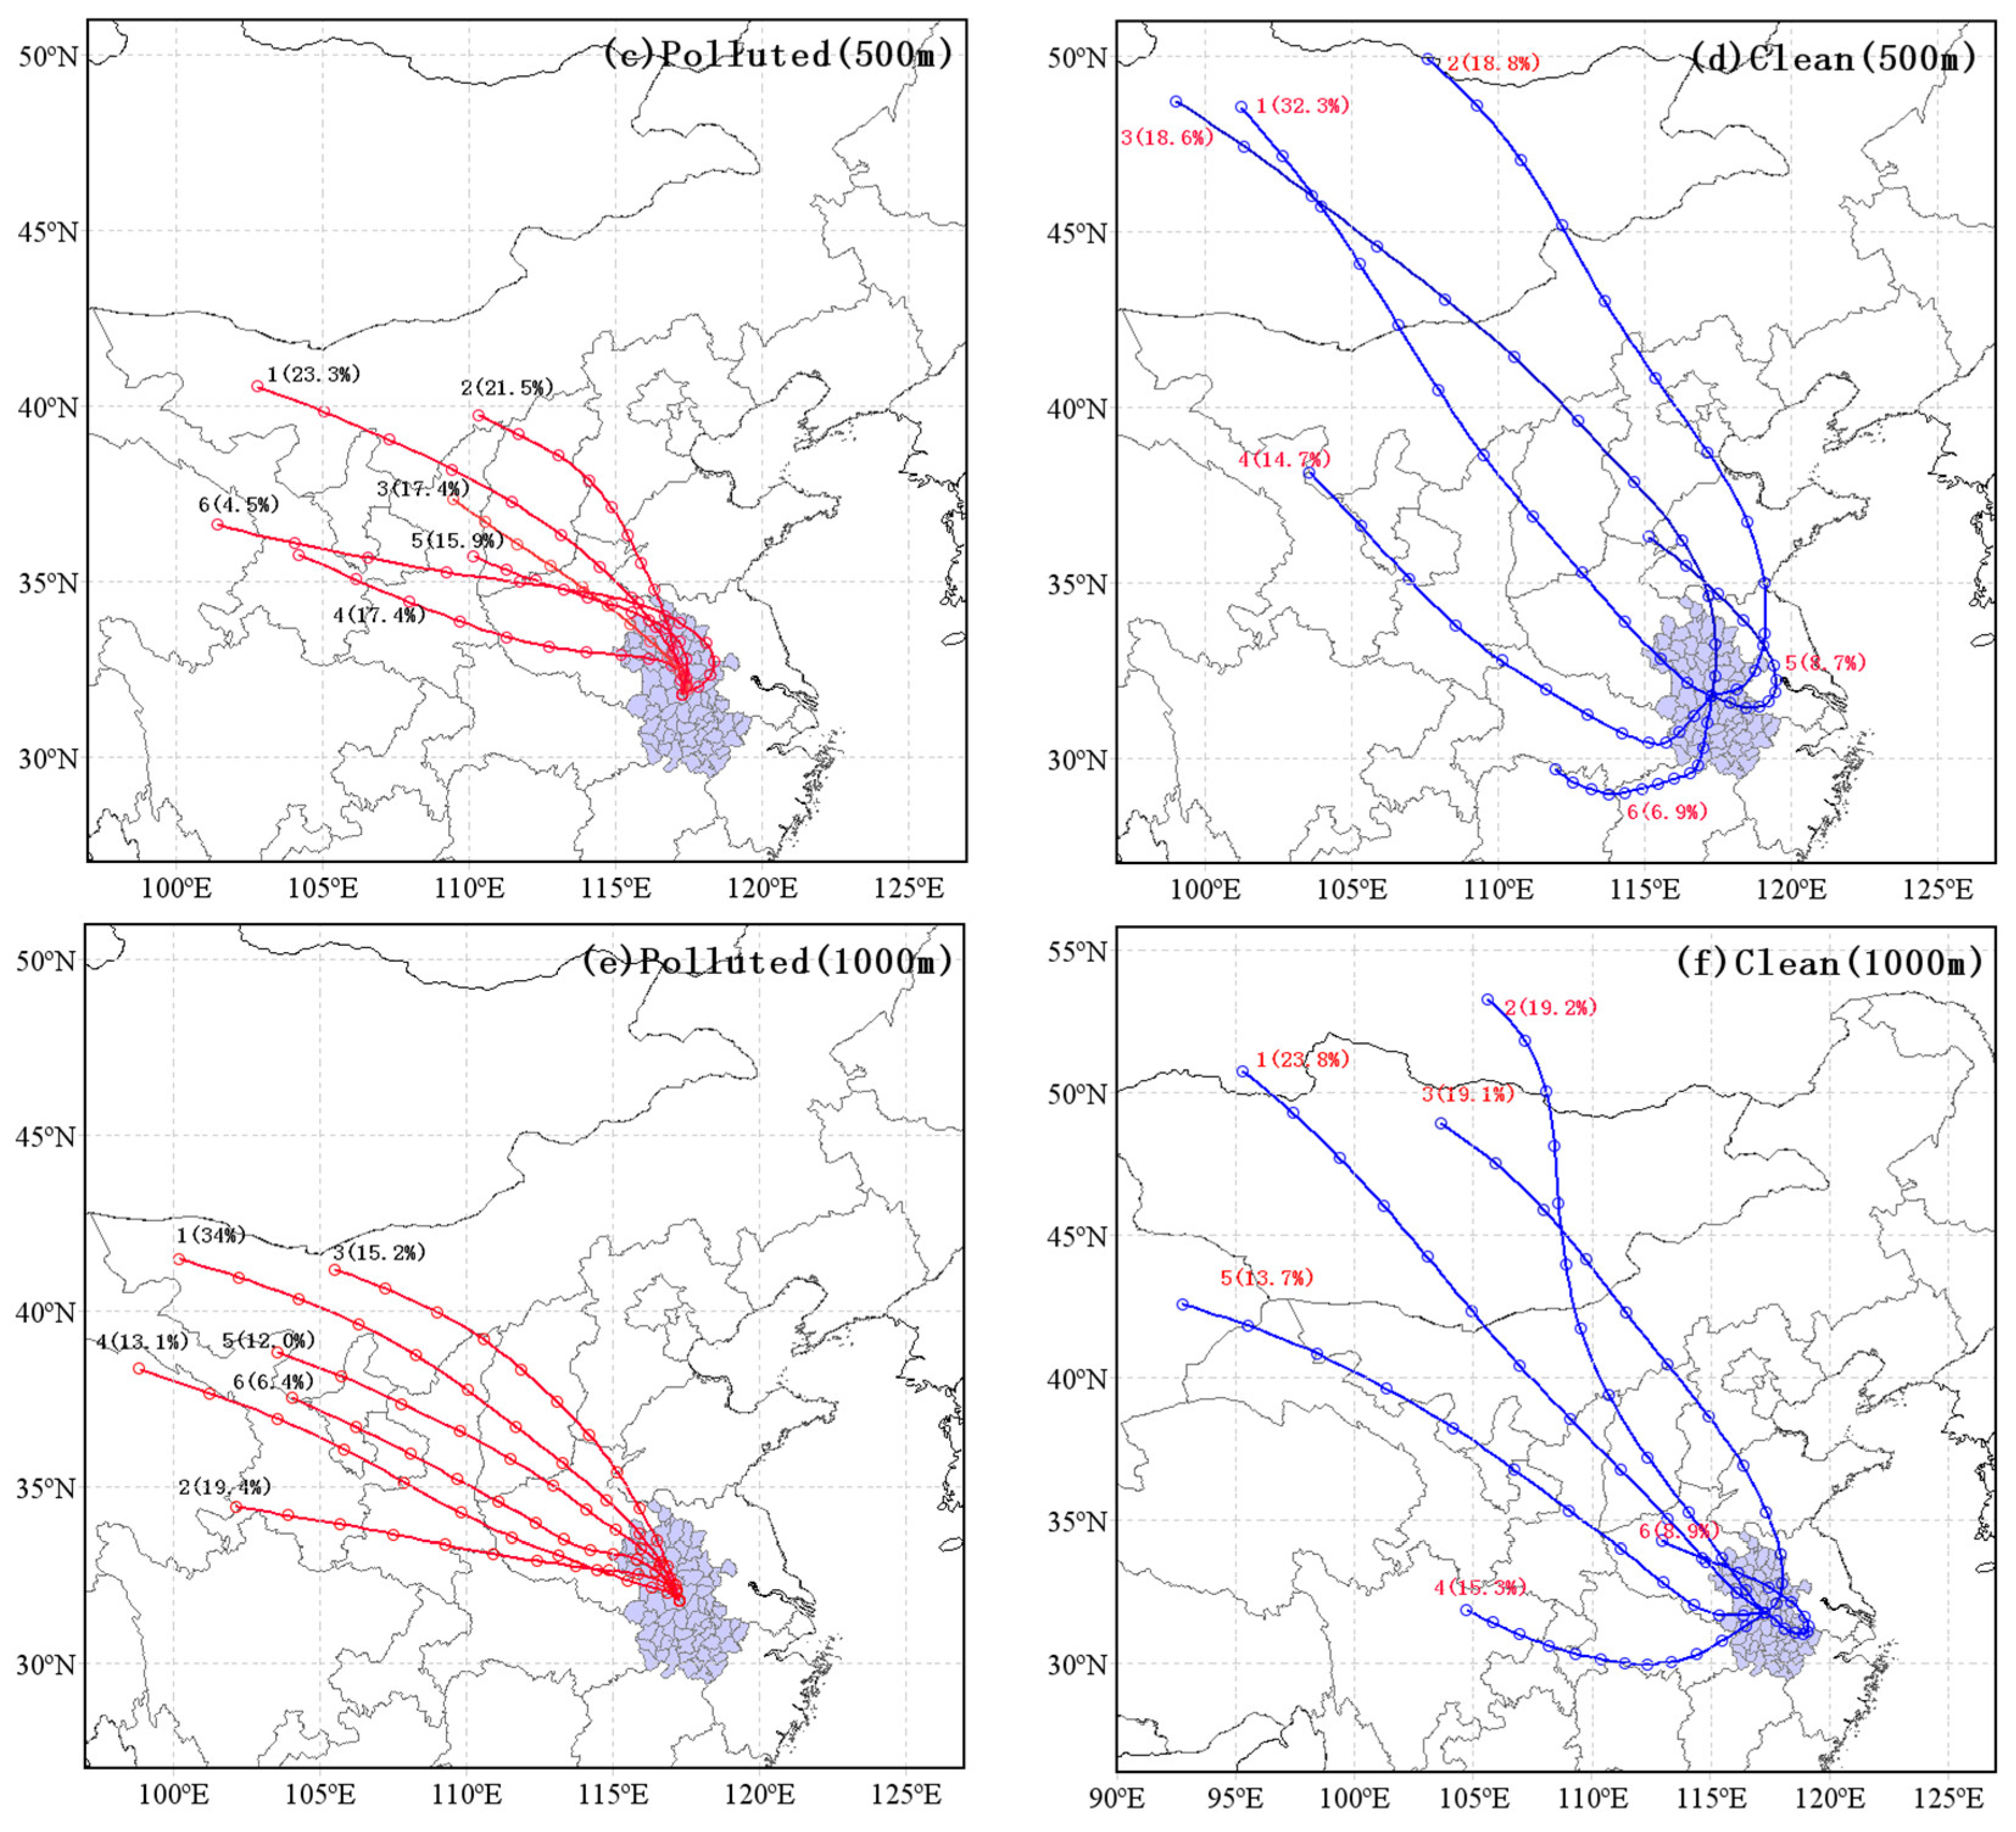
3.2. Back Trajectory Analysis

To further an understanding of air mass transport to PM2.5 pollution at various height levels, 72 h backward trajectories were estimated at altitudes of 100, 500 and 1000 m, and then all trajectories were categorized using cluster analysis in Hefei (Figure 5) [24,40]. As seen in Figure 5, six clusters were separately allocated to the polluted and clean conditions under the PBL in Hefei. The majority of the clusters came from the northerly sector in both the clean and polluted conditions under the PBL, which is in good agreement with the ground wind in Figure 4. Thus, pollutant transmission from the northern areas, such as Henan, Shandong and Hebei (Figure 1a), proved to have a significant role in the air pollution of Hefei at various PBL elevations [64].
Comparing the calculated air-mass transport pathways in the PBL, we found two main differences in the trajectory groups between the polluted and clean conditions as shown in Figure 5. Firstly, there was a significant difference in trajectory direction. All the air masses were from the northerly or northwesterly sectors, and particularly those from the northwest exceeded 90% of the total trajectories at 100, 500 and 1000 m, which was in good agreement with the upstream pollution area during the polluted condition. However, in the clean condition, the air mass from the south at 100, 500 and 1000 m accounted for 18.9%, 30.3% and 25.2% of the total trajectories, respectively, contributing to the clean air from the southern region. Secondly, trajectory length also had an obvious difference. In the clean condition, all the categories of air masses came from the north or northwest areas with short length, passing over northern or northwestern China with low speed, which was conducive to regional transmission and local accumulation. In contrast, if the air masses moved longer distances with high speed in the clean condition, turbulence would have diluted the pollutants in the air masses [65]. Overall, throughout the whole PBL height, the air masses from the north or the northwest with short length played an important role in the heavy air pollution in Hefei.

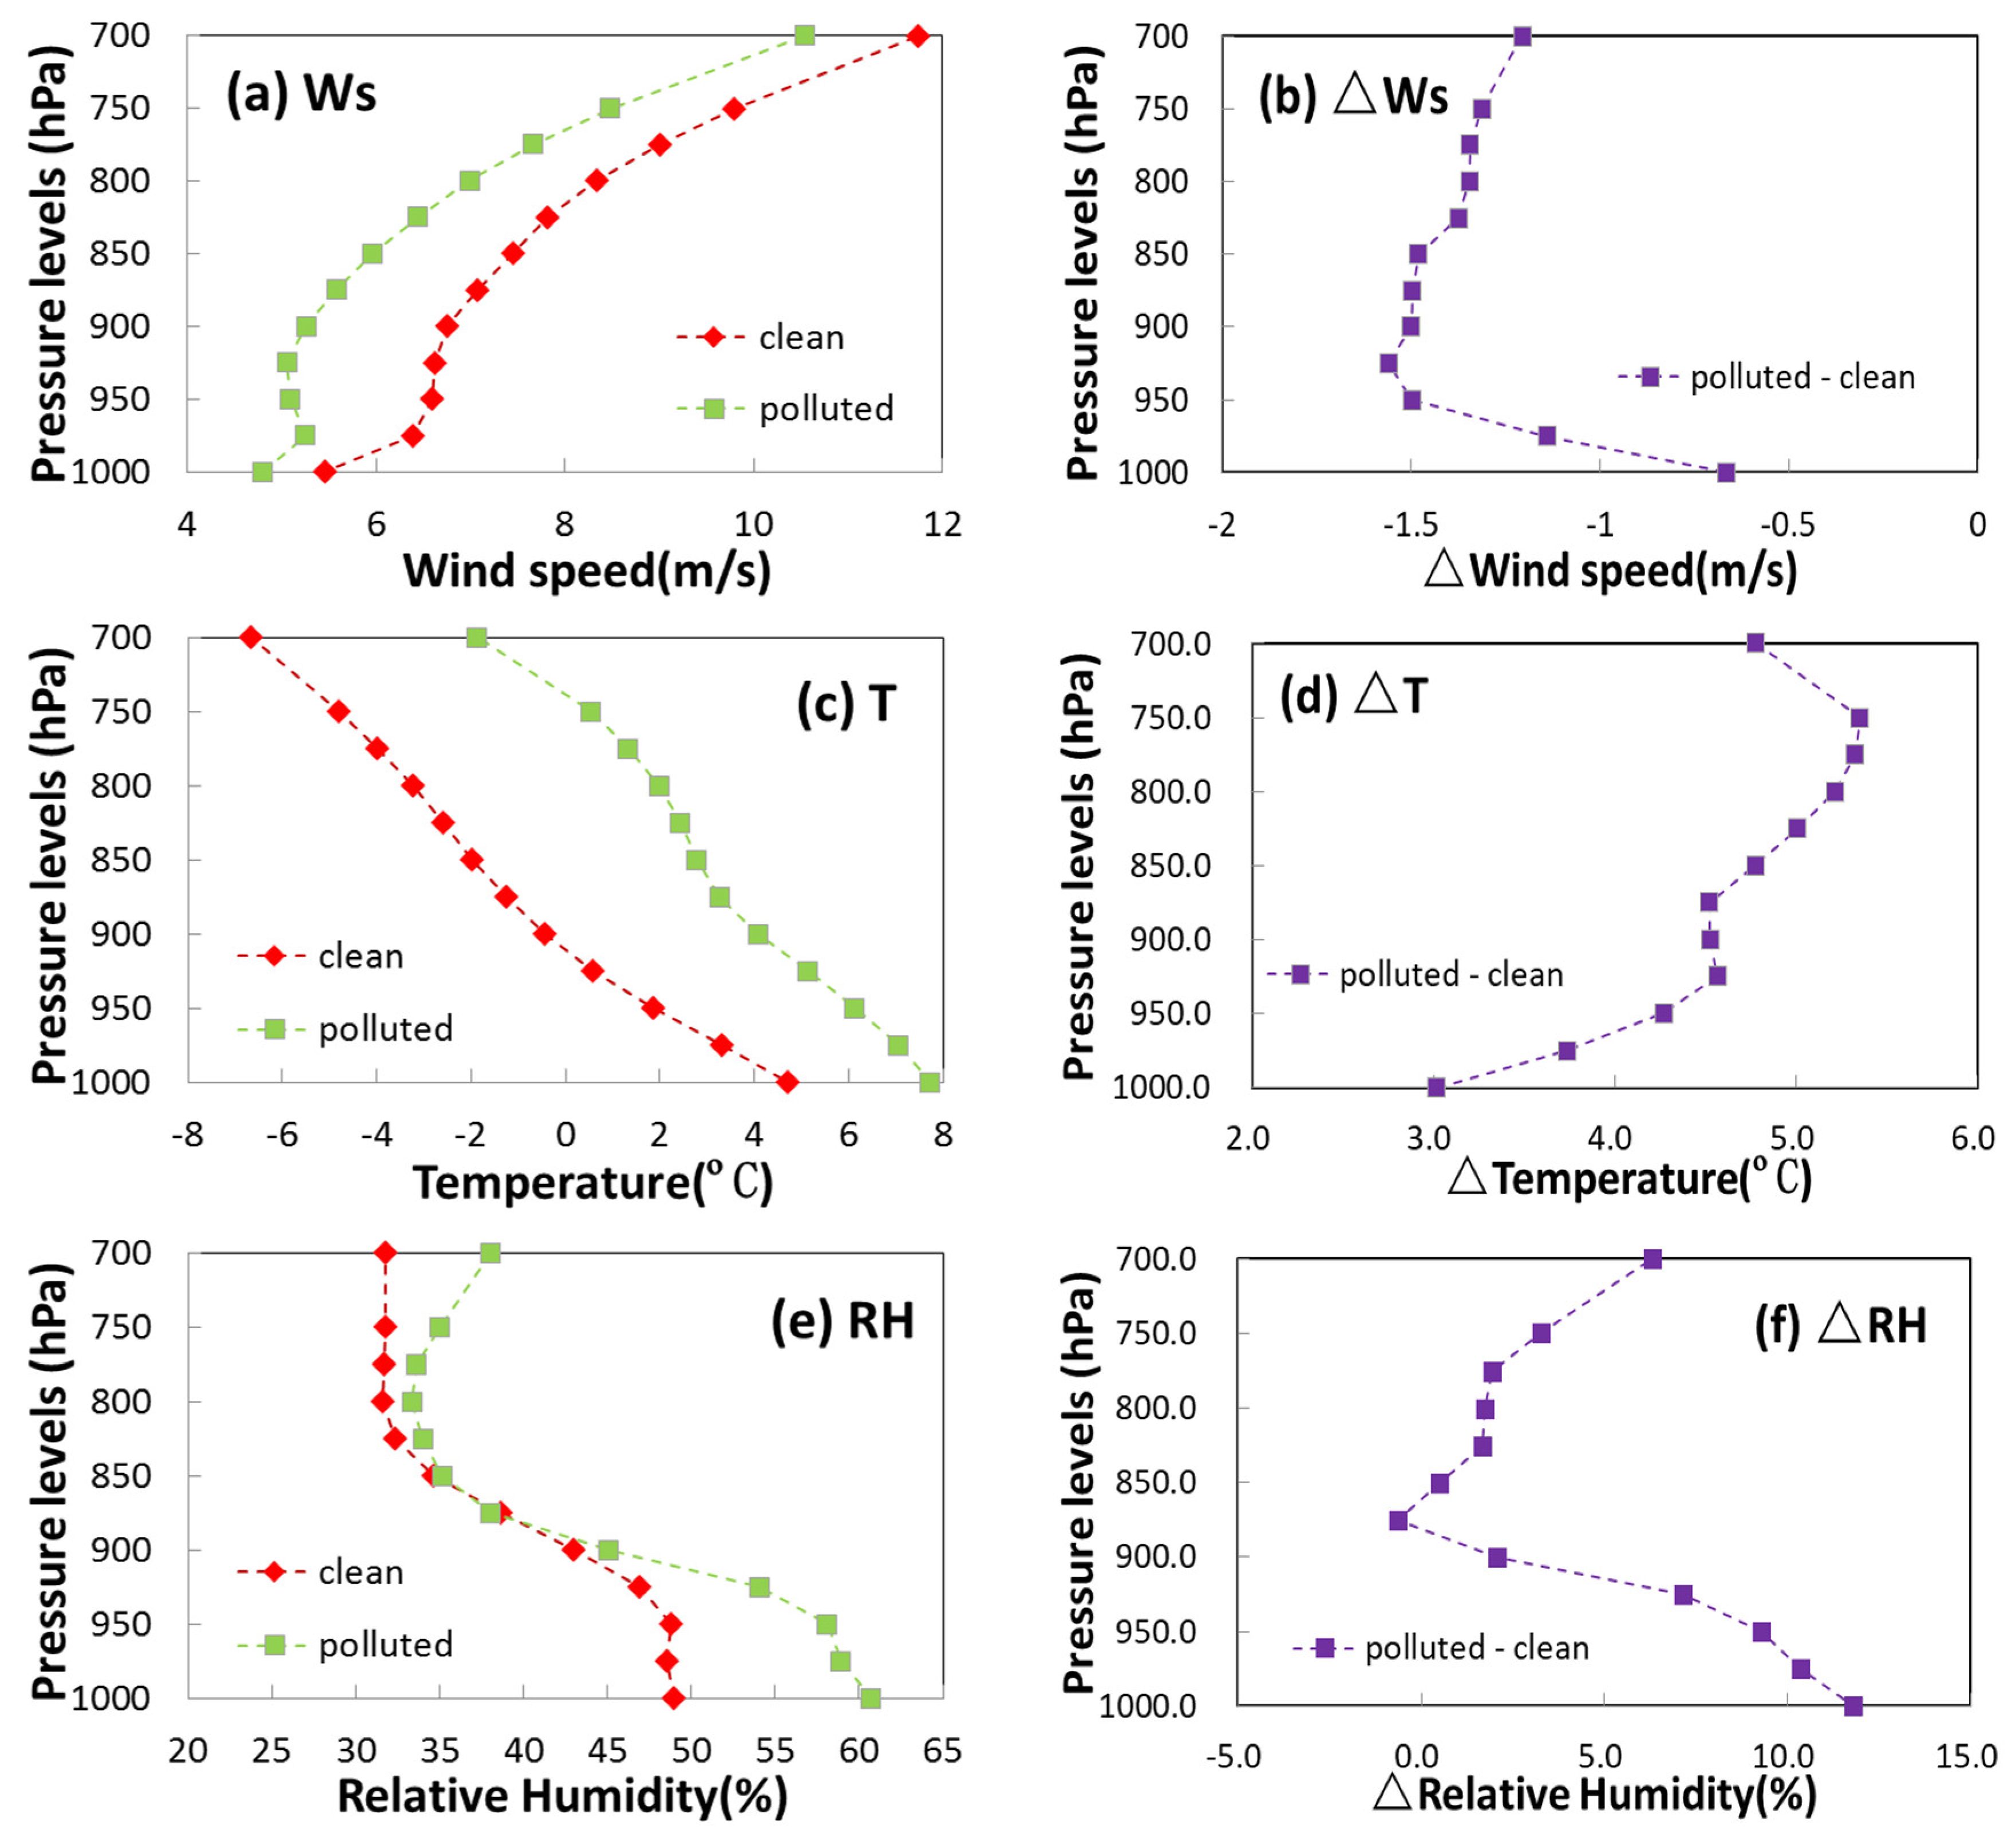
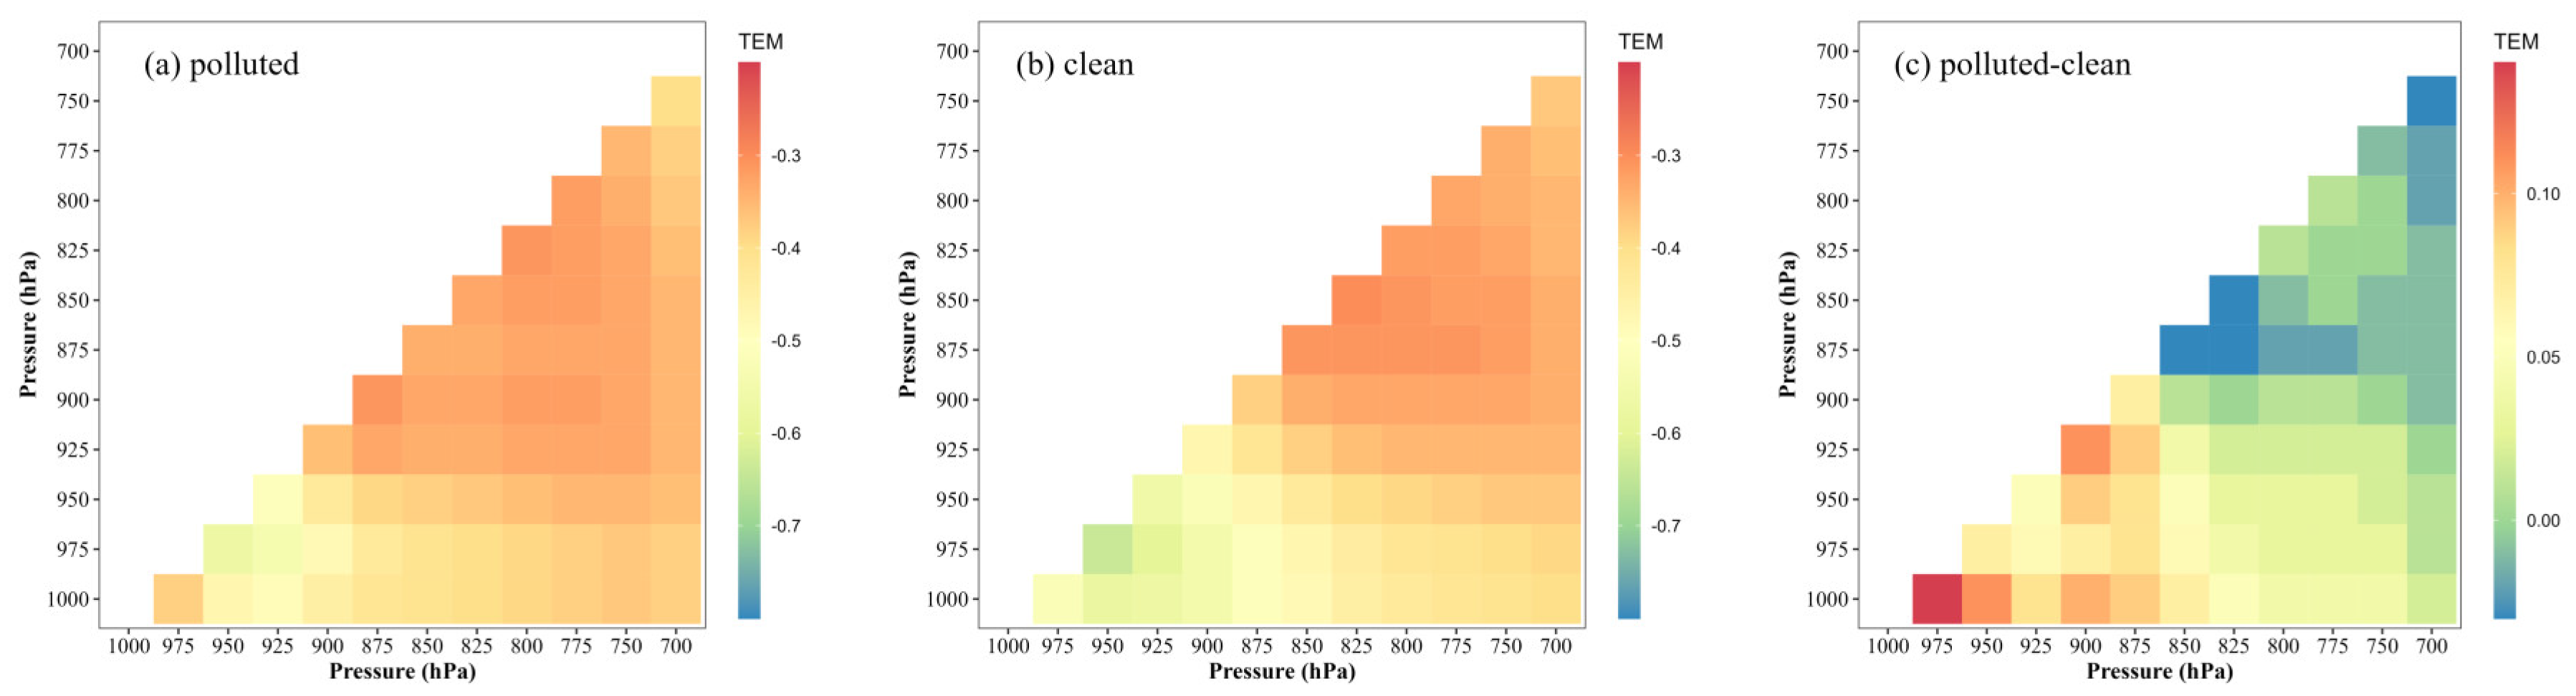
3.3. PBL Vertical Structure

The planetary boundary layer structure is a key factor in the formation and maintenance of air pollution. By way of atmospheric dynamic and thermal roles, the upward movement of air masses is affected in the vertical direction of the PBL, and different types of atmospheric stratification are formed [38]. In order to reveal the PBL structure characteristic of air pollution, the mean profile of wind speed, air temperature and RH were compared and analyzed for the polluted and clean conditions (Figure 6). Within the PBL, wind speed was the lowest at 1000 hPa and rose considerably with altitude; moreover, it peaked at 700 hPa with a value larger than 10 m/s (Figure 6a). Furthermore, temperature and RH were the greatest near the bottom and declined significantly with height (Figure 6c,e). The above three vertical profiles in the PBL have the same structure in other areas in China [42,66]. There were more differences between the polluted and clean conditions in the PBL. It should be noted that the wind speed in the polluted condition was much less than it was in the clean condition at all heights (Figure 6a), and the biggest difference occurred at 925 hPa with a value of −1.6 m/s (Figure 6b), implying that poor diffusion ability causes more contaminant accumulation. In particular, the decline rate of the wind speed below 900 hPa was much lower in the polluted condition than in the clean condition, and the wind speeds were all around 5 m/s with no apparent deviation in the vertical direction for the polluted condition in the near-surface layer (1000–900 hPa). These dynamic differences indicate that the low gradient of wind speed resulted in weak vertical wind shear and that the PBL in Hefei was more stable to restrain pollutant upload in the polluted condition.
In Figure 6c, it can be seen that the air temperature was much higher in the polluted condition than in the clean condition at all pressure levels, and these disparities can approach 3–6 °C in the PBL (Figure 6d), indicating that air pollution is associated with a comparatively warm layer under a high-pressure system in Hefei. In addition, the lapse rate in the polluted condition was lower than that in the clean condition, and the declining trend in temperature was relatively slow. Considering the increment at different altitudes as shown in Figure 6d, we found that the air temperature increased by 4.5–5.4 °C at the upper level from 925 hPa to 700 hPa but only by 3.0 °C at the surface level. The 2.4 °C difference of the increment between 1000 hPa and 925 hPa created a relative inversion layer. Such a thermal structure contributed to more stable stratification and hindered PBL growth.
When compared to wind and temperature, the change in RH expressed a clear distinction. The greatest difference in RH was observed at lower PBL ranging from 1000 to 925 hPa between the polluted and clean conditions as shown in Figure 6e. At the lower PBL, the RH was much higher in the polluted condition than in the clean condition, with an increment greater than 7.1% and a maximum value of 11.8% at 1000 hPa as shown in Figure 6f. In contrast, the RH of the two conditions was very close above 900 hPa. This RH tendency was associated with the more stable PBL due to atmospheric dynamic and thermal roles, which limited water vapor exchange over the upper PBL and favored water vapor buildup below the lower PBL, resulting in greater RH inside the lower PBL during the polluted condition. In the lower PBL, the high RH encouraged the secondary production of PM2.5.
To further assess the impact of the PBL on air pollution, the vertical wind shear and temperature gradient in Hefei were calculated from 1000 to 700 hPa as shown in Figure 7 and Figure 8, respectively. The main diagonal (from top right to bottom left) shows the local VWS and temperature gradient at each pressure level, while the color shading represents the amplitude of the VWS or temperature gradient in at least two successive vertical levels. The X and Y axes represent the top and bottom heights of the VWS or gradient bulk, respectively. Normally, the VWS value is substantially lower in polluted conditions than in clean conditions, and such low VWS values can restrict mechanical turbulence, lowering vertical mixing and establishing stable structures for air pollution generation. As shown in Figure 7, the mean local VWS was 5.9 (6) ms−1km−1 and 6.5 (7.4) ms−1km−1 for the polluted (clean) conditions at the upper PBL (875–700 hPa) and lower PBL (1000–900 hPa), respectively. It is noted that the VWS difference between the polluted and clean conditions at the lower PBL was greater than that at the upper PBL. This finding implies that the vertical mixing exchanges at the lower PBL directly affect pollutant accumulation at the ground. Once stable stratification is formed within a height of 0–1 km, air quality deteriorates at the ground in Hefei. Furthermore, the mean local temperature gradient was −0.34 (−0.42) °C·100 m−1 and −0.32 (−0.52) °C 100 m−1 for the polluted (clean) conditions at the upper PBL (875–700 hPa) and lower PBL (1000–900 hPa), respectively, as shown in Figure 8. When the temperature gradient reached the lower PBL, the difference between the polluted and clean conditions was larger than that at the upper PBL. The difference tendency for temperature gradient was consistent with that of the VWS in the PBL vertical direction. Thus, the difference in temperature between the ground and 900 hPa became weaker in the polluted condition, and the stratification of the PBL became more stable. Overall, through the joint action of thermal and dynamic factors, a relatively stable level was established in the lower PBL with weaker vertical mixing and a strong relative inversion layer, which restricts pollutant uploading and promotes pollution deterioration at the ground.

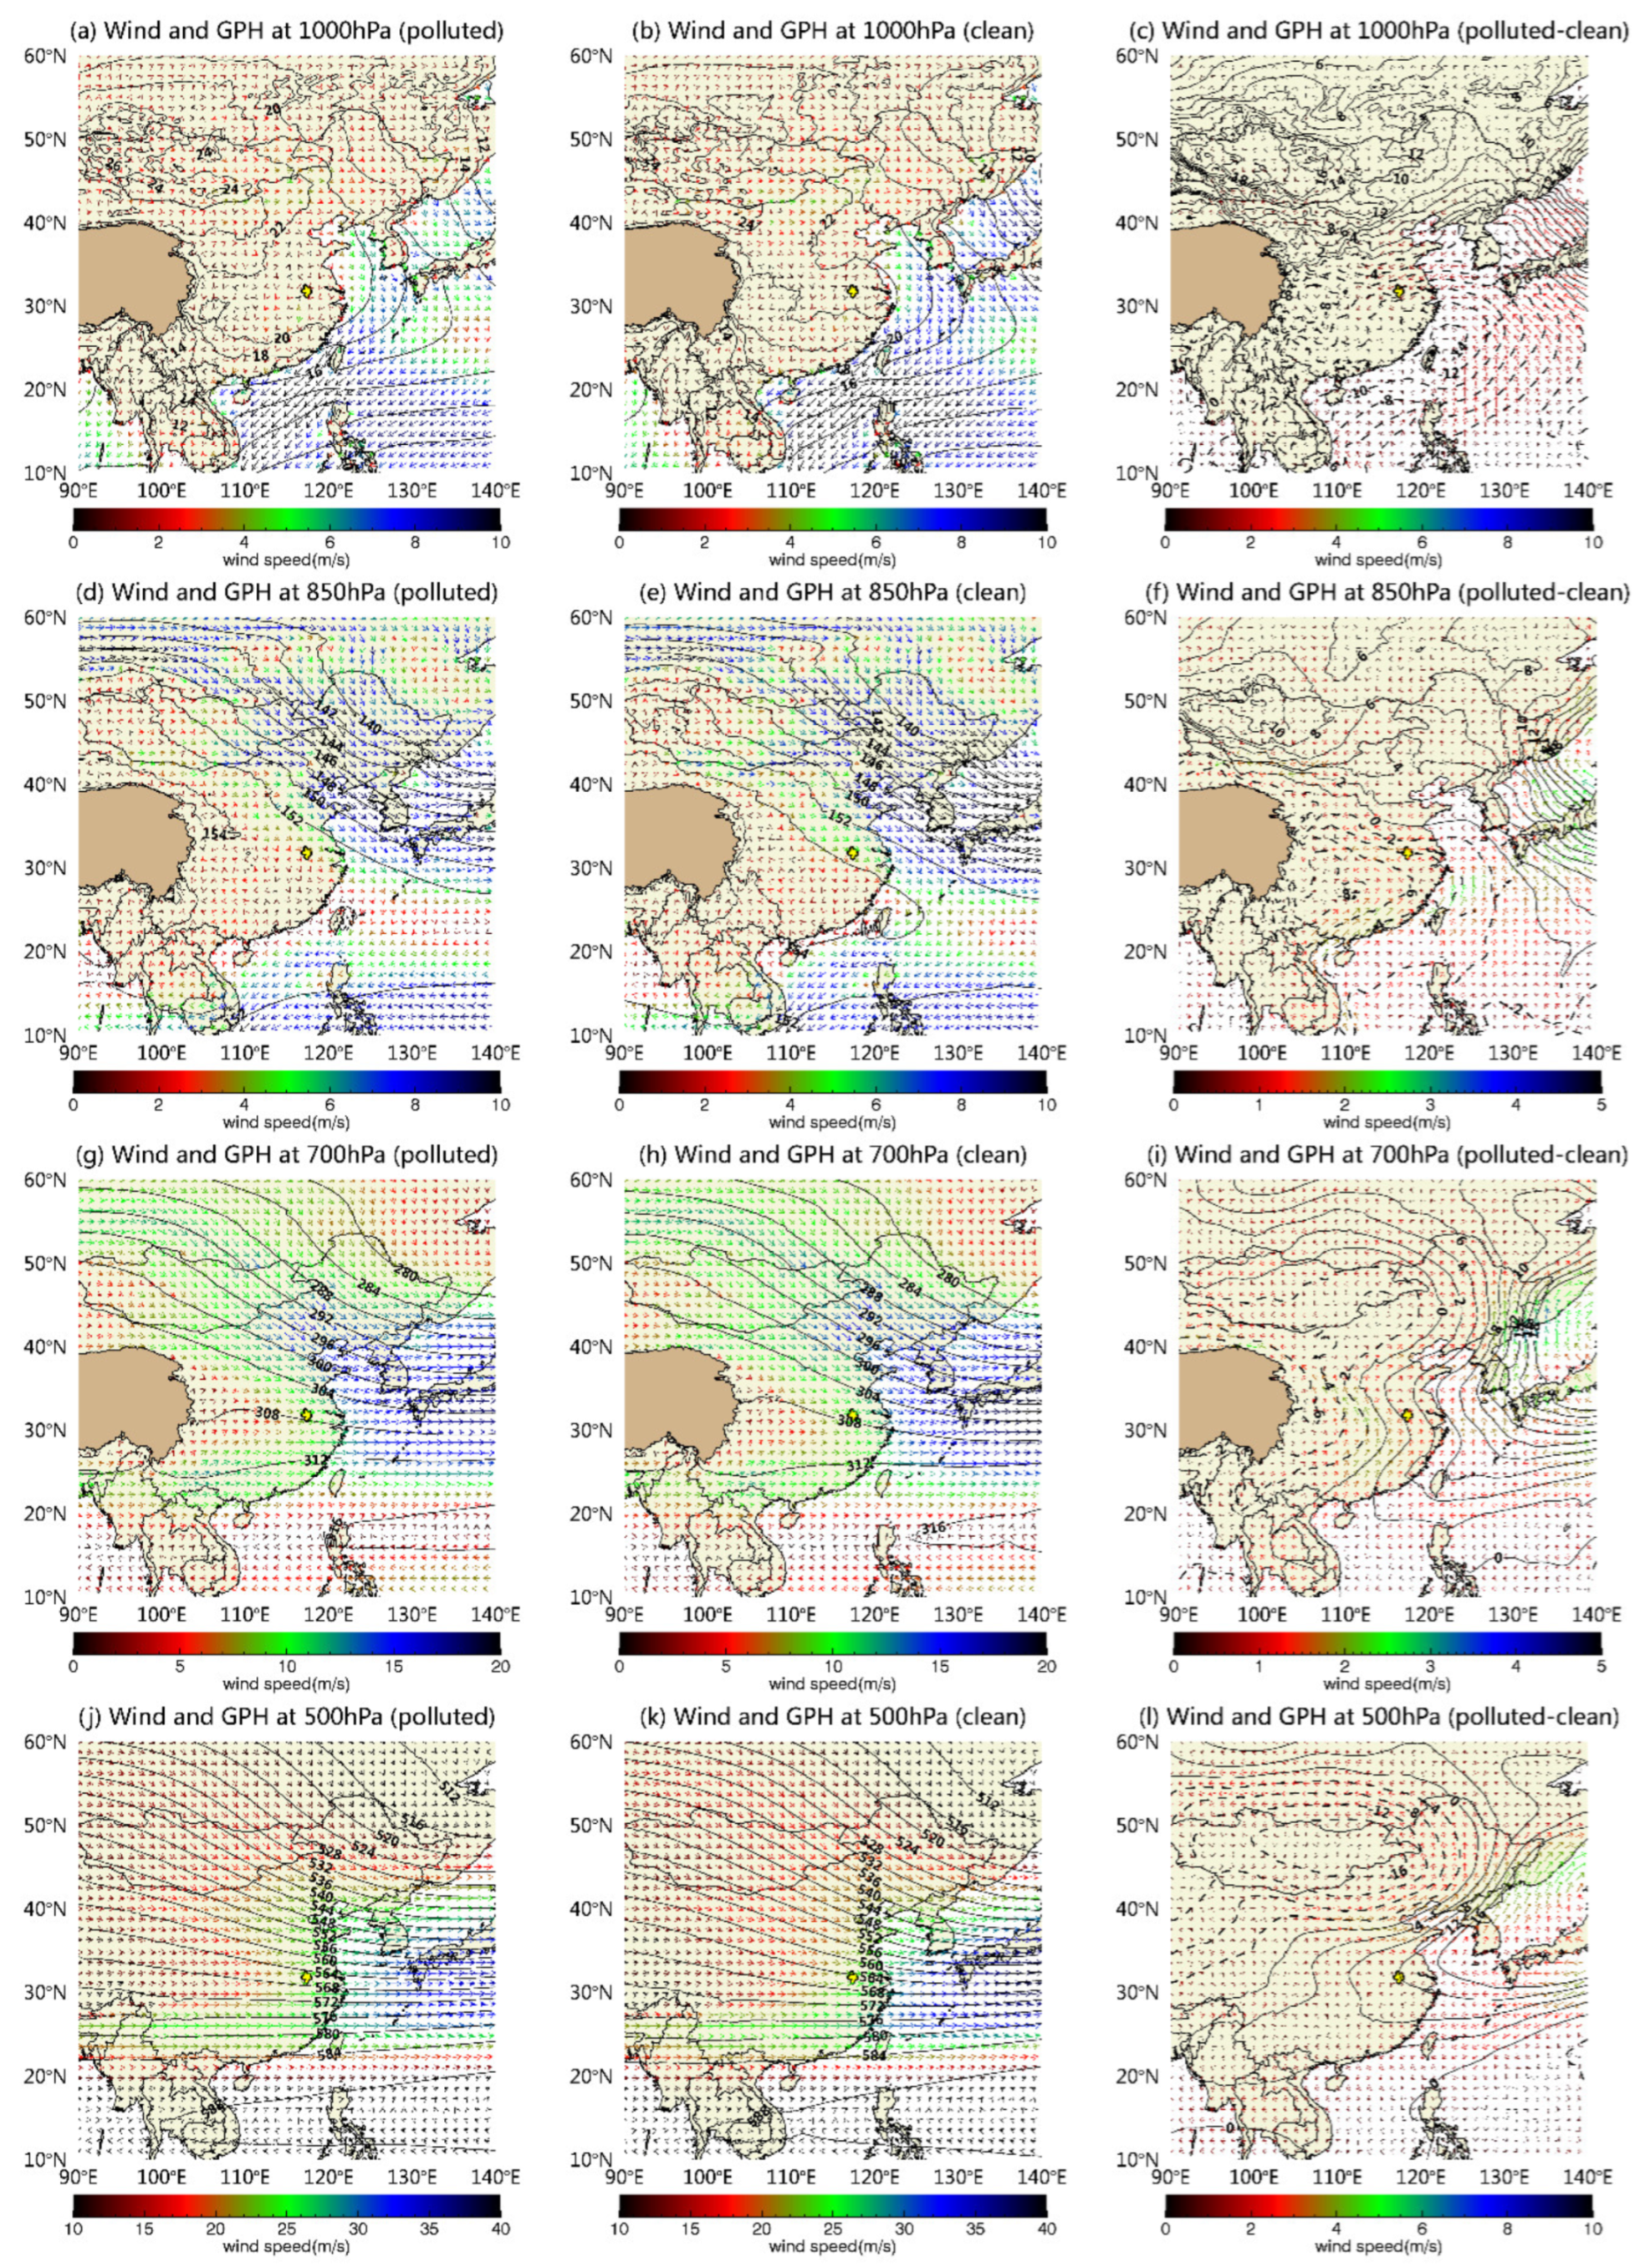
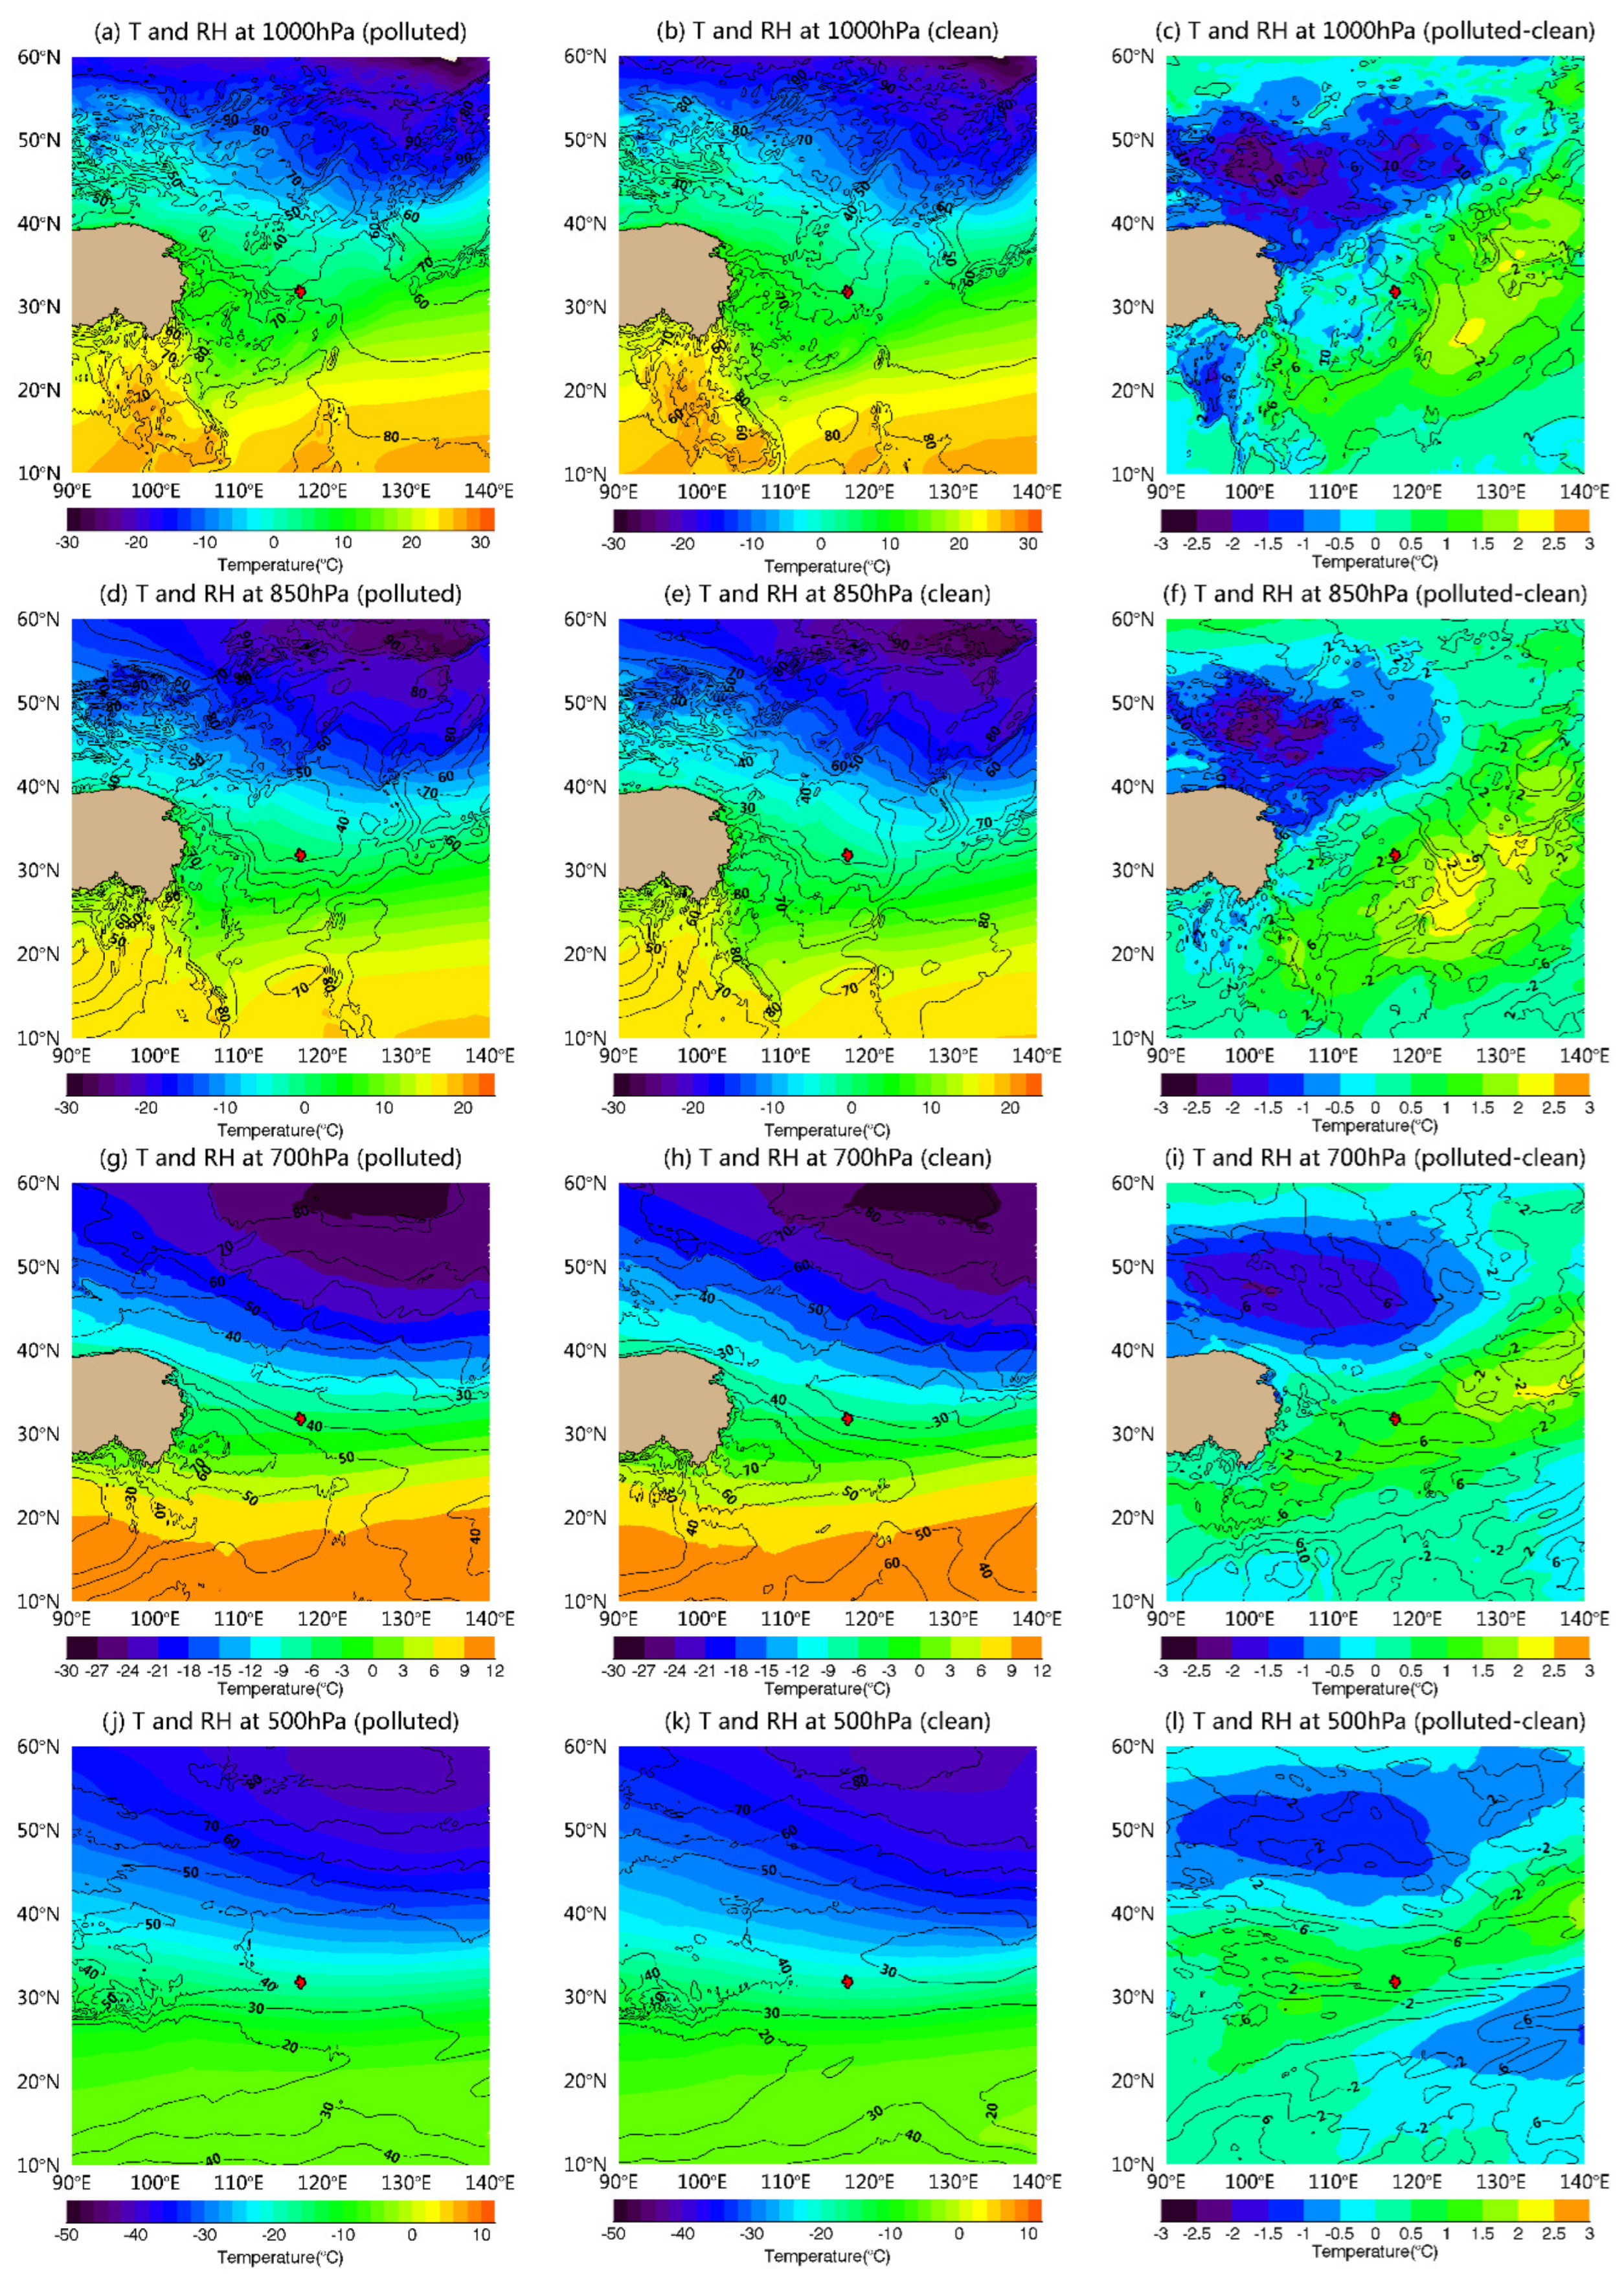
3.4. Synoptic System Analysis

The synoptic circulations were compared between the clean and polluted conditions to explain the cause of formation of the vertical structure as shown in Figure 9 and Figure 10. At 500 hPa (Figure 9j–l), there was an obvious block situation with a positive anomaly of geopotential height to the south of 40° N and a negative anomaly to the north of 40° N. Such abnormal southwesterly wind suggests that the East Asian trough weakened, which suppresses cold air from north China to Anhui province. Meanwhile, at the high level (700–500 hPa) (Figure 9g–i), a high-pressure anomaly over Hefei existed, indicating that a descending motion with the stable stratification restrained the pollutant upload. The adiabatic warming of the subsiding air resulted in a subsidence inversion, which acts as a lid on rising air (Figure 10a–f). Furthermore, at the middle level (850–700 hPa) (Figure 9d–i), the Hefei region was controlled by southerly wind anomalies, which brought more warm and moist air from the China Sea to Hefei. It can be seen in Figure 10d–i that there was an abnormally high air temperature and RH over Hefei, resulting in the reverse of temperature and humidity in the vertical direction (Figure 6). Such a PBL structure generated a relative inversion layer and increased atmospheric stability. In the near-ground level (1000 hPa) (Figure 9a–c), the high-pressure center weakened and the range of the uniform pressure field expanded in the polluted condition, which contributed to the generation of persistent stagnant weather during the pollution episode. These features of synoptic patterns in different levels were similar to those found in east China [11,43].

4. Conclusions

Using ERA5 reanalysis data and ground measurements during the winters of 2016–2021, the PBL vertical structure was analyzed to reveal the impact of meteorological stratification on air pollution in Hefei. The main results of this study can be summarized as follows:
Firstly, air pollutants all rose significantly with increase rates of 380% (PM2.5), 150% (CO), 97% (SO2) and 95% (NO2) in the polluted condition, and the gas–particle conversion enhanced air pollution formation. Meanwhile, near-surface weather conditions influenced air pollutant concentration by way of diffusion and removal roles. The northwest wind anomalies dominated with weak wind speed, low temperature and high RH, which caused frequent weak cold-air events with pollution transmission and local accumulation, thereby leading to local air pollution.
Furthermore, a favorable boundary layer structure played an important role in the air pollution in Hefei. Compared with the clean condition, there was less wind speed and higher temperature and humidity at all PBL altitudes in the polluted condition. More importantly, we found that the turning height of the dynamic and thermal conditions in the PBL was 900 hPa for the clean and polluted conditions. VWS and temperature gradient tended to be much weaker below 900 hPa, which created a subsidence inversion that acted as a cap to upward-moving air. Such a thermal and dynamic structure facilitated more stable stratification and enhanced the generation of air pollution. The special PBL structure in high PM2.5 conditions was related to the background of an atmospheric circulation anomaly. An obvious block situation weakened the East Asian trough and suppressed strong cold air at high levels. The southerly wind anomalies brought more warm and wet air from the China Sea to Hefei at the middle levels. The wild range of the uniform pressure field favored pollutant accumulation at the near-ground level.
By comparing the PBL factors between polluted and clean conditions, we found that the pollutant concentrations were regulated by the ground elements, PBL structure and synoptic situation. Next, it is more important to assimilate the PBL’s features into the atmospheric chemistry model and then improve air quality forecasting.

Supplementary Materials

The following supporting information can be downloaded at: https://www.mdpi.com/article/10.3390/atmos14081273/s1, Figure S1. Scatterplots of u component (a,b), v component (c,d), temperature (e,f) and relative humidity (g,h) between radiosonde data and ERA5 data from 2018 to 2021 in Fuyang (left) and Anqing (right).

Author Contributions

X.D. wrote the main manuscript text. D.H. designed the research structure. R.D. conducted data quality control. X.J. analyzed the ERA5 data. J.C. prepared Figure 1, Figure 2, Figure 3, Figure 4, Figure 5, Figure 6, Figure 7, Figure 8, Figure 9 and Figure 10. Z.Z. and L.Z. reviewed and edited the manuscript. J.Z. analyzed the air pollutants. All authors have read and agreed to the published version of the manuscript.

Funding

This work was supported by the Joint Fund of Anhui Natural Science Foundation [2208085UQ03], Decision-making Meteorological Services Special Project of China Meteorological Administration [JCZX2023031], the National Natural Science Foundation of China [41875181], the Anhui research project in the Public Interest [1604f0804003] and the Special innovation and development project of Anhui Meteorological Bureau [CXB202202; CXM202205].

Institutional Review Board Statement

Not applicable.

Informed Consent Statement

Not applicable.

Data Availability Statement

The ERA5 can be downloaded from the ECMWF data server center. The PM2.5 data can be acquired from the Ministry of Ecology and Environment of the People’s Republic of China. The balloon radiosondes data and ground meteorological data can be accessed from Anhui Meteorological Information Center, China.

Conflicts of Interest

The authors declare no conflict of interest.

References

  1. Chen, R.; Peng, R.D.; Meng, X.; Zhou, Z.; Chen, B.; Kan, H. Seasonal variation in the acute effect of particulate air pollution on mortality in the China Air Pollution and Health Effects Study (CAPES). Sci. Total. Environ. 2013, 451, 259–265. [Google Scholar] [CrossRef] [Green Version]
  2. Guo, J.; Xu, H.; Liu, L.; Chen, D.; Peng, Y.; Yim, S.; Yang, Y.; Li, J.; Zhao, C.; Zhai, P. The trend reversal of dust aerosol over East Asia and the North Pacific Ocean attributed to large-scale meteorology, deposition and soil moisture. J. Geophys. Res. Atmos. 2019, 124, 10450–10466. [Google Scholar]
  3. Xu, M.; Qin, Z. How does vehicle emission control policy affect air pollution emissions? Evidence from Hainan Province, China. Sci. Total. Environ. 2022, 866, 161244. [Google Scholar] [CrossRef]
  4. Cheng, Y.; Du, K.; Yao, X. Stringent environmental regulation and inconsistent green innovation behavior: Evidence from air pollution prevention and control action plan in China. Energ. Econ. 2023, 120, 106571. [Google Scholar]
  5. Wang, M.Y.; Cao, C.X.; Li, G.S.; Singh, R.P. Analysis of a severe prolonged regional haze episode in the Yangtze River Delta, China. Atmos. Environ. 2015, 102, 112–121. [Google Scholar] [CrossRef]
  6. Liu, T.; Gong, S.; He, J.; Yu, M.; Wang, Q.; Li, H.; Liu, W.; Zhang, J.; Li, L.; Wang, X.; et al. Attributions of meteorological and emission factors to the 2015 winter severe haze pollution episodes in China’s Jing-Jin-Ji area. Atmos. Chem. Phys. 2017, 17, 2971–2980. [Google Scholar] [CrossRef] [Green Version]
  7. Zhao, X.; Zhao, P.; Xu, J.; Meng, W.; Pu, W.; Dong, F.; He, D.; Shi, Q. Analysis of a winter regional haze event and its formation mechanism in the North China Plain. Atmos. Chem. Phys. 2013, 13, 5685–5696. [Google Scholar] [CrossRef] [Green Version]
  8. Liu, W.D.; Jiang, Y.H.; Li, J.; Wang, Z.X.; Wang, Q. Characteristics of aerosol distribution and transmission of a heavy air pollution process in Beijing area. Clim. Environ. Res. 2010, 15, 152–160. [Google Scholar]
  9. Ziomas, I.C.; Melas, D.; Zerefos, C.S.; Bais, A.F.; Paliatsos, A.G. Forecasting peak pollutant levels from meteorological variables. Atmos. Environ. 1995, 29, 3703–3718. [Google Scholar] [CrossRef]
  10. Li, J.; Wang, Z.; Huang, H.; Hu, M.; Meng, F.; Sun, Y. Assessing the effects of trans-boundary aerosol transport between various city clusters on regional haze episodes in spring over East China. Tellus B 2013, 65, 20052. [Google Scholar] [CrossRef] [Green Version]
  11. Xu, J.M.; Yan, F.X.; Xie, Y.; Wang, F.Y.; Wu, J.; Fu, Q. Impact of meteorological conditions on a nine-day particulate matter pollution event observed in December 2013, Shanghai, China. Particuology 2015, 20, 69–79. [Google Scholar]
  12. Griffith, S.M.; Huang, W.; Lin, C.; Chen, Y.; Chang, K.; Lin, T.; Wang, S. Long-range air pollution transport in East Asia during the first week of the COVID-19 lockdown in China. Sci. Total. Environ. 2020, 741, 140214. [Google Scholar] [CrossRef]
  13. Chen, F.L.; Zhang, X.; Chen, Z.F. Air pollution and mental health: Evidence from China Health and Nutrition Survey. J. Asian Econ. 2023, 86, 101611. [Google Scholar] [CrossRef]
  14. Nguyen, M.; Park, G.; Lee, B. Correlation analysis of size-resolved airborne particulate matter with classified meteorological conditions. Meteorol. Atmos. Phys. 2017, 129, 35–46. [Google Scholar] [CrossRef]
  15. Li, L.; Qian, J.; Ou, C.Q.; Zhou, Y.X.; Guo, C.; Guo, Y. Spatial and temporal analysis of Air Pollution Index and its timescale-dependent relationship with meteorological factors in Guangzhou, China, 2001–2011. Environ. Pollut. 2014, 190, 75–81. [Google Scholar] [CrossRef] [PubMed]
  16. Guo, J.; Zhang, J.; Yang, K.; Liao, H.; Zhang, S.; Huang, K.; Lv, Y.; Shao, J.; Yu, T.; Tong, B.; et al. Investigation of near-global daytime boundary layer height using high-resolution radiosondes: First results and comparison with ERA-5, MERRA-2, JRA-55, and NCEP-2 reanalyses. Atmos. Chem. Phys. 2021, 21, 17079–17097. [Google Scholar] [CrossRef]
  17. Westervelt, D.M.; Horowitz, L.W.; Naik, V.; Tai, A.; Fiore, A.M.; Mauzerall, D. Quantifying PM2.5-meteorology sensitivities in a global climate model. Atmos. Environ. 2016, 142, 43–56. [Google Scholar] [CrossRef]
  18. Wang, X.; Zhang, L.; Moran, M.D. Uncertainty assessment of current size-resolved parameterizations for below-cloud particle scavenging by rain. Atmos. Chem. Phys. 2010, 10, 5685–5705. [Google Scholar]
  19. Mircea, M.; Stefan, S.; Fuzzi, S. Precipitation scavenging coefficient: Influence of measured aerosol and raindrop size distributions. Atmos. Environ. 2000, 34, 5169–5174. [Google Scholar]
  20. Fu, H.; Zhang, Y.; Liao, C.; Mao, L.; Wang, Z.; Hong, N. Investigating PM2.5 responses to other air pollutants and meteorological factors across multiple temporal scales. Sci. Rep. 2020, 10, 15639. [Google Scholar]
  21. Singh, B.P.; Singh, D.; Kumar, K.; Jain, V.K. Study of seasonal variation of PM2.5 concentration associated with meteorological parameters at residential sites in Delhi, India. J. Atmos. Chem. 2021, 78, 161–176. [Google Scholar] [CrossRef]
  22. Zhang, B.; Jiao, L.; Xu, G.; Zhao, S.; Tang, X.; Zhou, Y.; Gong, C. Influences of wind and precipitation on different-sized particulate matter concentrations (PM2.5, PM10, PM2.5–10). Meteorol. Atmos. Phys. 2018, 130, 383–392. [Google Scholar] [CrossRef]
  23. Zhou, W.; Tie, X.; Zhou, G.; Liang, P. Possible effects of climate change of wind on aerosol variation during winter in Shanghai, China. Particuology 2015, 20, 80–88. [Google Scholar] [CrossRef]
  24. Deng, X.; Shi, C.; Wu, B.; Chen, Z.; He, D.; Zhang, H. Analysis of aerosol characteristics and their relationships with meteorological parameters over Anhui province in China. Atmos. Res. 2012, 109–110, 52–63. [Google Scholar] [CrossRef]
  25. Zhang, J.P.; Zhu, T.; Zhang, Q.H.; Li, C.C.; Shu, H.L.; Ying, Y.; Dai, Z.P.; Wang, X.; Liu, X.Y.; Liang, A.M.; et al. The impact of circulation patterns on regional transport pathways and air quality over Beijing and its surroundings. Atmos. Chem. Phys. 2012, 12, 5031–5053. [Google Scholar] [CrossRef] [Green Version]
  26. Ye, X.; Song, Y.; Cai, X.; Zhang, H.S. Study on the synoptic flow patterns and boundary layer process of the severe haze events over the North China Plain in January 2013. Atmos. Environ. 2016, 124, 129–145. [Google Scholar] [CrossRef]
  27. Tao, M.; Chen, L.; Xiong, X.; Zhang, M.; Ma, P.; Tao, J.; Wang, Z. Formation process of the widespread extreme haze pollution over northern China in January 2013: Implications for regional air quality and climate. Atmos. Environ. 2014, 98, 417–425. [Google Scholar]
  28. Wei, P.; Cheng, S.; Li, J.; Su, F. Impact of boundary-layer anticyclonic weather system on regional air quality. Atmos. Environ. 2011, 45, 2453–2463. [Google Scholar] [CrossRef]
  29. Guo, J.; Li, Y.; Cohen, J.; Li, J.; Chen, D.; Xu, H.; Liu, L.; Yin, J.; Hu, K.; Zhai, P. Shift in the temporal trend of boundary layer height trend in China using long-term (1979–2016) radiosonde data. Geophys. Res. Lett. 2019, 46, 6080–6089. [Google Scholar] [CrossRef] [Green Version]
  30. Wang, Y.; Jia, B.; Wang, S.C.; Estes, M.; Shen, L.; Xie, Y. Influence of the Bermuda High on interannual variability of summertime ozone in the Houston-Galveston-Brazoria region. Atmos. Chem. Phys. 2016, 16, 15265–15276. [Google Scholar] [CrossRef] [Green Version]
  31. Zhang, R.; Qiang, L.; Zhang, R. Meteorological conditions for the persistent severe fog and haze event over eastern china in January 2013. Sci. China. Earth. Sci. 2014, 57, 26–35. [Google Scholar]
  32. Liu, Y.; Wang, B.; Zhu, Q.; Luo, R.; Wu, C.; Jia, R. Dominant synoptic patterns and their relationships with PM2.5 pollution in winter over the Beijing-Tianjin-Hebei and Yangtze River Delta regions in China. J. Meteorol. Res. 2019, 33, 765–776. [Google Scholar] [CrossRef]
  33. Barnes, E.A.; Fiore, A.M. Surface ozone variability and the jet position: Implications for projecting future air quality. Geophys. Res. Lett. 2013, 40, 2839–2844. [Google Scholar] [CrossRef] [Green Version]
  34. Ning, G.; Yim, S.; Wang, S.; Duan, S.; NIe, C.; Yang, X.; Wang, J.; Shang, K. Synergistic effects of synoptic weather patterns and topography on air quality: A case of the Sichuan Basin of China. Clim. Dynam. 2019, 53, 6729–6744. [Google Scholar]
  35. Xu, W.Y.; Zhao, C.S.; Ran, L.; Deng, Z.Z.; Liu, P.F.; Ma, N.; Lin, W.L.; Xu, X.B.; Yan, P.; He, X.; et al. Characteristics of pollutants and their correlation to meteorological conditions at a suburban site in the North China Plain. Atmos. Chem. Phys. 2011, 11, 4353–4369. [Google Scholar] [CrossRef] [Green Version]
  36. Li, X.; Hu, X.; Ma, Y.; Wang, Y. Impact of planetary boundary layer structure on the formation and evolution of air-pollution episodes in Shenyang, Northeast China. Atmos. Environ. 2019, 214, 116850. [Google Scholar] [CrossRef]
  37. Hu, X.M.; Klein, P.M.; Xue, M.; Lundquist, J.K.; Zhang, F.; Qi, Y. Impact of low-level jets on the nocturnal urban heat island intensity in Oklahoma City. J. Appl. Meteorol. Clim. 2013, 52, 1779–1802. [Google Scholar] [CrossRef] [Green Version]
  38. Zhang, Y.; Guo, J.; Yang, Y.; Wang, Y.; Yim, S. Vertical Wind Shear Modulates Particulate Matter Pollutions: A Perspective from Radar Wind Profiler Observations in Beijing, China. Remote Sens. 2020, 12, 546. [Google Scholar]
  39. Klein, P.M.; Hu, X.M.; Xue, M. Impacts of mixing processes in nocturnal atmospheric boundary layer on urban ozone concentrations. Bound-Lay. Meteorol. 2014, 150, 7–30. [Google Scholar] [CrossRef]
  40. Sun, X.; Zhao, T.; Tang, G.; Bai, Y.; Kong, S.; Zhou, Y.; Hu, J.; Tan, C.; Shu, Z.; Xu, J.; et al. Vertical changes of PM2.5 driven by meteorology in the atmospheric boundary layer during a heavy air pollution event in central China. Sci. Total. Environ. 2023, 858, 159830. [Google Scholar] [CrossRef]
  41. Kovadlo, P.G.; Lukin, V.P.; Shikhovtsev, A.Y. Development of the model of turbulent atmosphere at the large solar vacuum telescope site as applied to image adaptation. Atmos. Ocean. Opt. 2019, 32, 202–206. [Google Scholar] [CrossRef]
  42. Shikhovtsev, A.Y.; Kovadlo, P.G.; Kiselev, A.V. Astroclimatic statistics at the sayan solar observatory. Solnechno-Zemn. Fiz. 2020, 6, 126–133. [Google Scholar] [CrossRef]
  43. Deng, X.; Cao, W.; Huo, Y.; Yang, G.; Yu, C.; He, D.; Deng, W.; Fu, W.; Ding, H.; Zhai, J. Meteorological conditions during a severe, prolonged regional heavy air pollution episode in eastern China from December 2016 to January 2017. Theor. Appl. Climatol. 2019, 135, 1105–1122. [Google Scholar] [CrossRef]
  44. Sulaymon, I.; Zhang, Y.; Hopke, P.; Hu, J.; Rupakheti, D.; Xie, X.; Yang, Z.; Ajibade, F.; Hua, J.; She, Y. Influence of transboundary air pollution and meteorology on air quality in three major cities of Anhui Province, China. J. Clean. Prod. 2021, 329, 129641. [Google Scholar] [CrossRef]
  45. Wei, W.; Wang, T.; Shi, C.; Zhang, H. Analysis of weather conditions for fog in Hefei. J. Meteorol. Res. 2012, 32, 437–442. [Google Scholar]
  46. Wang, S.; Liu, G.; Yi, J.; Huang, X.; Zhang, H.; Hong, X. The characteristics of particulate matter during an air pollution process revealed by joint observation of multiple equipments. Atmos. Pollut. Res. 2022, 13, 101487. [Google Scholar] [CrossRef]
  47. Hersbach, H.; Bell, B.; Berrisford, P.; Hirahara, S.; Horányi, A.; Muñoz, S.; Nicolas, J.; Peubey, C.; Radu, R.; Schepers, D.; et al. The ERA5 global reanalysis. Q. J. Roy. Meteo. Soc. 2020, 146, 1999–2049. [Google Scholar] [CrossRef]
  48. Hoffmann, L.; Günther, G.; Li, D.; Stein, O.; Wu, X.; Griessbach, S.; Heng, Y.; Konopka, P.; Müller, R.; Vogel, B.; et al. From ERA-Interim to ERA5: The considerable impact of ECMWF’s next-generation reanalysis on Lagrangian transport simulations. Atmos. Chem. Phys. 2019, 19, 3097–3124. [Google Scholar] [CrossRef] [Green Version]
  49. Wang, Z.; Chen, P.; Wang, R.; An, Z.; Qiu, L. Estimation of PM2.5 concentrations with high spatiotemporal resolution in Beijing using the ERA5 dataset and machine learning models. Adv. Space. Res. 2022, 71, 3150–3165. [Google Scholar] [CrossRef]
  50. Dommo, A.; Vondou, D.; Philippon, N.; Aloysius, N. The ERA5′s diurnal cycle of low-level clouds over Western Central Africa during June–September: Dynamic and thermodynamic processes. Atmos. Res. 2022, 280, 106426. [Google Scholar]
  51. Ganjir, G.; Pattnaik, S.; Trivedi, D. Characteristics of dynamical and thermo-dynamical variables during heavy rainfall events over the Indian region. Dynam. Atmos. Oceans. 2022, 99, 101315. [Google Scholar] [CrossRef]
  52. Miao, Y.; Liu, S.; Guo, J.; Huang, S.; Yan, Y.; Lou, M. Unraveling the relationships between boundary layer height and PM2.5 pollution in China based on four-year radiosonde measurements. Environ. Pollut. 2018, 243, 1186–1195. [Google Scholar] [CrossRef]
  53. Lv, Y.; Guo, J.; Li, J.; Cao, L.; Chen, T.; Wang, D.; Chen, D.; Han, Y.; Xiaoran, G.; Xu, H.; et al. Spatiotemporal characteristics of atmospheric turbulence over China estimated using operational high-resolution soundings. Environ. Res. Lett. 2021, 16, 054050. [Google Scholar] [CrossRef]
  54. Deng, X.; He, D.; Zhang, G.; Zhu, S.; Dai, R.; Jin, X.; Fu, W.; Shen, W.; Chen, J.; Fan, Y.; et al. Comparison of horizontal wind observed by wind profiler radars with ERA5 reanalysis data in Anhui, China. Theor. Appl. Climatol. 2022, 150, 1745–1760. [Google Scholar] [CrossRef]
  55. Draxler, R.; Rolph, G. Hybrid Single-Particle Lagrangian Integrated Trajectory (HYSPLIT) Model Access via the NOAA Website; NOAA Air Resources Laboratory: Silver Spring, MD, USA, 2003. Available online: http://www.arl.noaa.gov/ready/hysplit4.html (accessed on 13 September 2003).
  56. Lee, H.; Park, S.; Kim, K.; Kim, Y. Source identification of PM2.5 particles measured in Gwangju, Korea. Atmos. Res. 2008, 88, 199–211. [Google Scholar] [CrossRef]
  57. Lee, J.; Han, J.; Whang, K. Trajectory Clustering: A Partition-and-Group Framework. In Proceedings of the ACM SIGMOD International Conference on Management of Data (SIGMOD), Beijing, China, 7 June 2007; pp. 593–604. [Google Scholar]
  58. Dorling, S.; Davies, T.; Pierce, C. Cluster analysis: A technique for estimating the synoptic meteorological controls on air and precipitation chemistry-Method and applications. Atmos. Environ. 1992, 26, 2575–2581. [Google Scholar] [CrossRef]
  59. Dorling, S.; Davies, T. Extending cluster analysis-synoptic meteorology links to characterise chemical climates at six northwest European monitoring stations. Atmos. Environ. 1995, 29, 145–167. [Google Scholar] [CrossRef]
  60. Sharma, N.; Varma, A.; Liu, G. Percentage occurrence of global tilted deep convective clouds under strong vertical wind shear. Adv. Space. Res. 2022, 69, 2433–2442. [Google Scholar] [CrossRef]
  61. Kobara, H.; Takeuchi, K.; Ibusuki, T. Effect of relative humidity on aerosol generation through experiments at low concentrations of gaseous nitric acid and ammonia. Aerosol. Air. Qua. Res. 2007, 7, 193–204. [Google Scholar] [CrossRef] [Green Version]
  62. Mao, Z.; Xu, J.; Yang, D.; Li, P.; Cai, Z.; Gao, J.; Xu, H.; Ji, Y.; Deng, X. Analysis of characteristics and meteorological causes of PM2.5-O3 compound pollution in Shanghai. Environ. Res. 2019, 39, 2730–2738. [Google Scholar]
  63. Wang, Z.; Chen, L.; Tao, J. An empirical method of RH correction for satellite estimation of ground-level PM concentrations. Atmos. Environ. 2014, 95, 71–81. [Google Scholar] [CrossRef]
  64. Shan, W.; Yin, Y.; Lu, H.; Liang, S. A meteorological analysis of ozone episodes using HYSPLIT model and surface data. Atmos. Res. 2009, 93, 767–776. [Google Scholar] [CrossRef]
  65. Hu, Y.; Wang, S. Formation mechanism of a severe air pollution event: A case study in the Sichuan Basin, Southwest China. Atmos. Environ. 2021, 246, 118135. [Google Scholar] [CrossRef]
  66. Yan, Y.; Cai, X.; Huang, Q.; Qi, P.; Song, Y.; Zhang, H.; Zeng, L. Long-term planetary boundary layer features and associated PM2.5 pollution anomalies in Beijing during the past 40 years. Theor. Appl. Climatol. 2023, 151, 1787–1804. [Google Scholar] [CrossRef]
Figure 1. The spatial distribution of (a) averaged PM2.5 concentration during winter from 2019 to 2021 and (b) monitoring station in Hefei overlaid with topography (color shading). The location of Hefei station is indicated by the red triangle, and the two sounding sites are indicated by the blue dots.
Atmosphere 14 01273 g001
Figure 2. Monthly variation in PM2.5 concentration (unit: ug/m3) during 2016–2021 at Hefei station.
Atmosphere 14 01273 g002
Figure 3. Near-surface pollutant concentration (a), meteorological factors (b) and their increase rates (c,d) in polluted and clean conditions during the winters of 2016–2021 in Hefei.
Atmosphere 14 01273 g003
Figure 4. Near-surface wind rose during the winters of 2016–2021 for (a) polluted condition, (b) clean condition and (c) difference between the above two conditions in Hefei. ‘C’ is calm wind.
Atmosphere 14 01273 g004
Figure 5. Mean HYSPLIT 72 h backward trajectories of 100 m (a,b), 500 m (c,d) and 1000 m (e,f) altitudes using cluster analysis of polluted (a,c,e) and clean (b,d,f) conditions during 2016–2021 in Hefei.
Atmosphere 14 01273 g005aAtmosphere 14 01273 g005b
Figure 6. Vertical distributions of wind speed (a,b), temperature (c,d) and RH (e,f) for ‘polluted’, ‘clean’ (left) and their difference (right).
Atmosphere 14 01273 g006
Figure 7. Vertical wind shear (VWS) of each height level in Hefei for (a) polluted condition, (b) clean condition and (c) their difference during 2016–2021. The X and Y represent the top and bottom height of the VWS bulk, respectively (unit: ms−1km−1).
Atmosphere 14 01273 g007
Figure 8. Temperature gradient of each height level in Hefei for (a) polluted condition, (b) clean condition and (c) their difference during 2016–2021. The X and Y represent the top and bottom height of the temperature gradient bulk, respectively (unit: °C·100 m−1).
Atmosphere 14 01273 g008
Figure 9. Spatial distribution of the geopotential height (black contours) superimposed by wind (color arrows, vector) at 1000 hPa (ac), 850 hPa (df), 700 hPa (gi) and 500 hPa (jl) pressure levels under polluted (left column) and clean (middle column) conditions and the difference between them (right column) during 2016–2021. The areas highlighted with yellow lines represent the region of interest (Hefei).
Atmosphere 14 01273 g009
Figure 10. Spatial distribution of the RH (black contour) superimposed by temperature (shaded) at 1000 hPa (ac), 850 hPa (df), 700 hPa (gi) and 500 hPa (jl) pressure levels under polluted (left column) and clean (middle column) conditions and the difference between them (right column) during 2016–2021. The areas highlighted with red lines represent the region of interest (Hefei).
Atmosphere 14 01273 g010
Disclaimer/Publisher’s Note: The statements, opinions and data contained in all publications are solely those of the individual author(s) and contributor(s) and not of MDPI and/or the editor(s). MDPI and/or the editor(s) disclaim responsibility for any injury to people or property resulting from any ideas, methods, instructions or products referred to in the content.

