Article

The Heritage Climate Index (HERCI): Development, Assessment and Application for Tourism Purposes in Geoheritage and Cultural Heritage Sites

1
Faculty of Geography, University of Belgrade, Studentski Trg 3/3, 11000 Belgrade, Serbia
2
Department of Geography, Tourism and Hotel Management, Faculty of Sciences, University of Novi Sad, Trg Dositeja Obradovića 3, 21000 Novi Sad, Serbia
3
Faculty of Sciences and Mathematics, University of Priština in Kosovska Mitrovica, Lole Ribara 29, 38220 Kosovska Mitrovica, Serbia
*
Author to whom correspondence should be addressed.
Atmosphere 2023, 14(8), 1265; https://doi.org/10.3390/atmos14081265
Submission received: 2 July 2023 / Revised: 5 August 2023 / Accepted: 8 August 2023 / Published: 9 August 2023

Abstract

:
The development of climate indices and their application can influence the preferences of tourists and the time frame for visiting the locality. This study develops a new Heritage Climate Index (HERCI) that finds its application in assessing climate comfort for visiting geoheritage and cultural heritage objects. The study analyzed the geoheritage site in Western Serbia (Stopića Cave) and the cultural heritage site in Eastern Serbia (Golubac Fortress). The index was developed to represent climatic comfort on a monthly basis and consisted of five climatic elements. The values of the HERCI index were obtained based on the multi-criteria decision-making model—the Best–Worst method (BWM). The results were classified into five classes, depending on the degree of conformity. After a comparative analysis of the index results for four localities and their attendance for the period 2012–2021 and 2019–2022, it was determined that there is a very high level of correlation (>0.9). This is the first study to use the BWM to develop and analyze a climate index. From the aspect of tourism policy, this study significantly contributes to tourism organizations and tourists in better understanding climate comfort and making decisions about the organization’s time frame and realization of the travel.

1. Introduction

Tourism is a significant factor of economic income for many tourist-oriented countries [1,2]. Some authors define tourism as one of the world’s largest industries [3]. To adequately implement tourism in a certain area, it is necessary to analyze the environmental parameters that play an important role in its development [4,5]. Parameters include both assessment of natural factors (climate, geology, topography, biodiversity) and analysis of anthropogenic factors (land use, landscape change) [6,7]. Territories characterized by specific landforms, optimal climate comfort, low degree of terrain inclination and great biological diversity with minimal anthropogenic influence will represent an ideal geoheritage for visiting tourists. In the case of cultural heritage sites, it is necessary to maintain the building in an adequate condition without putting pressure on the environment. Climatic elements represent an essential natural factor and directly influence destination choice, season length and quality [8,9]. For this reason, it is necessary to evaluate the tourist climate in order to make adequate decisions, investments, planning, etc. [10].
During the 20th and 21st centuries, dozens of thermal and climate indices were developed with different numbers of parameters used [11,12]. Climate comfort is defined as the degree of satisfaction with climatic conditions in the environment where people participate in tourism activities [13]. In some literature dealing with urban areas, one can find the concept of outdoor thermal comfort (OTC), which is different from climatic comfort, since the analysis includes subjective factors (behavioral and psychological) in addition to objective parameters (climatic conditions) [14]. The best known and most widely used index for assessing the tourist thermal environment—the Tourism Climate Index (TCI)—was developed by Mieczkowski [15]. Seven climate variables are used to calculate the TCI. However, the TCI is based solely on expert opinion and does not consider human thermophysiology [3]. For this reason, several methods have been developed to calculate thermal comfort based on human biometeorology, such as the Universal Thermal Climate Index (UTCI) [16,17]. The UTCI is considered one of the most comprehensive bioclimatic indices because it is very sensitive to changes in ambient conditions and better reflects the temporal variability of thermal conditions than many other indices.
Depending on the regional climate differences, the geographical location of the place, the natural conditions and the type of tourist activities, the following have been developed: Beach Climate Index (BCI) [18] and second generation climate index for tourism (CIT) [19], the Holiday Climate Index [20], the Tourism Climate Comfort Index (TCCI) [21], the Camping Climate Index (CCI) [22,23], the Outdoor Tourism Climate Index (OTCI) [24] and the Coastal Tourism Climate Index (CTCI) [10]. Morgan [18] studied the optimal climatic conditions for beach use in Wales, Turkey and Malta. Based on the BCI, the results indicated an optimal climate comfort that enables the recreation of tourists from Northern Europe to Mediterranean beaches outside the peak tourist season. De Freitas et al. [19] integrate thermal, aesthetic and physical aspects of time for the development of CIT. The rating of satisfaction with the climate is expressed in values from one (unacceptable) to seven (optimal). Anđelković et al. [21] propose a new mathematical approach to climate parameters to develop the TCCI. A link was established on a sample of 26 meteorological stations across Serbia between the index value and statistical data on the number of tourists. Ma et al. [22] perform a comparative analysis of daily meteorological data for 29 campsites with daily data on camp occupancy. By applying the CCI, a correlation between the two analyzed parameters was identified. Yu et al. [25] conducted a comparative analysis of TCI and HCI for beach areas in the Asia–Pacific tourism region. The results show that TCI values do not follow the trend of tourist visits, while HCI values have a much higher score during the summer months. Valizadeh and Khoorani [24] examine the impact of climate change on outdoor tourist movement in Hormozgan Province, Iran. Using the OTCI, they conclude that February, March and December are optimal for outdoor tourist activities. Gao et al. [10] include five variables for developing CTCI in Chinese coastal cities. The results showed that the CTCI had been applied and verified in the case of nine Chinese coastal cities compared to the HCI.
There are few studies on climate comfort for localities in Serbia. City, spa and mountain tourism can be identified as Serbia’s most popular tourism sectors. Pecelj et al. [26] investigate the differences in bioclimatic conditions during the summer months between the city of Belgrade and the Zlatibor Mountain using human heat load (HL) and UTCI. Basarin et al. [27] report the bioclimatic conditions of the Zlatibor Mountain using the physiologically equivalent temperature (PET) and UTCI over 10-day periods. Błażejczyk et al. [28] evaluate thermal conditions of nine mountains in Central and Eastern Europe, using UTCI. Malinović-Milićević et al. [2] evaluate thermal comfort and its changes for the purpose of skiing on Kopaonik Mountain. Tourist activity in Serbia is increasing year by year. Excluding years 2020 and 2021 due to the COVID-19 virus pandemic and restrictive measures, the number of tourists increased by 83% in the ten-year period of 2009–2019. In 2009, there were slightly more than two million tourists, while in 2019, the number of tourists reached 3.7 million. During the same period, the number of foreign tourists increased by 186%, from 646,000 foreign tourists in 2009 to 1.84 million in 2019 [29]. After removing all restrictive measures, a full recovery of the tourism sector in Serbia and an increase in the number of tourists compared to the previous three years is expected in 2023.
One of the goals of the study is to apply the new climate index to protected areas, especially geoheritage and cultural heritage sites. According to the data of the Institute for Nature Protection of Serbia, the inventory of geoheritage objects includes about 1150 geological, geomorphological, speleological, hydrological, pedological and archaeological phenomena and objects [30]. So far, more than 80 objects have been protected. The goal is to protect all geoheritage objects in the future. As for cultural heritage, 2624 immovable cultural assets are registered in the central register of the Republic Institute for the Protection of Cultural Monuments [31].
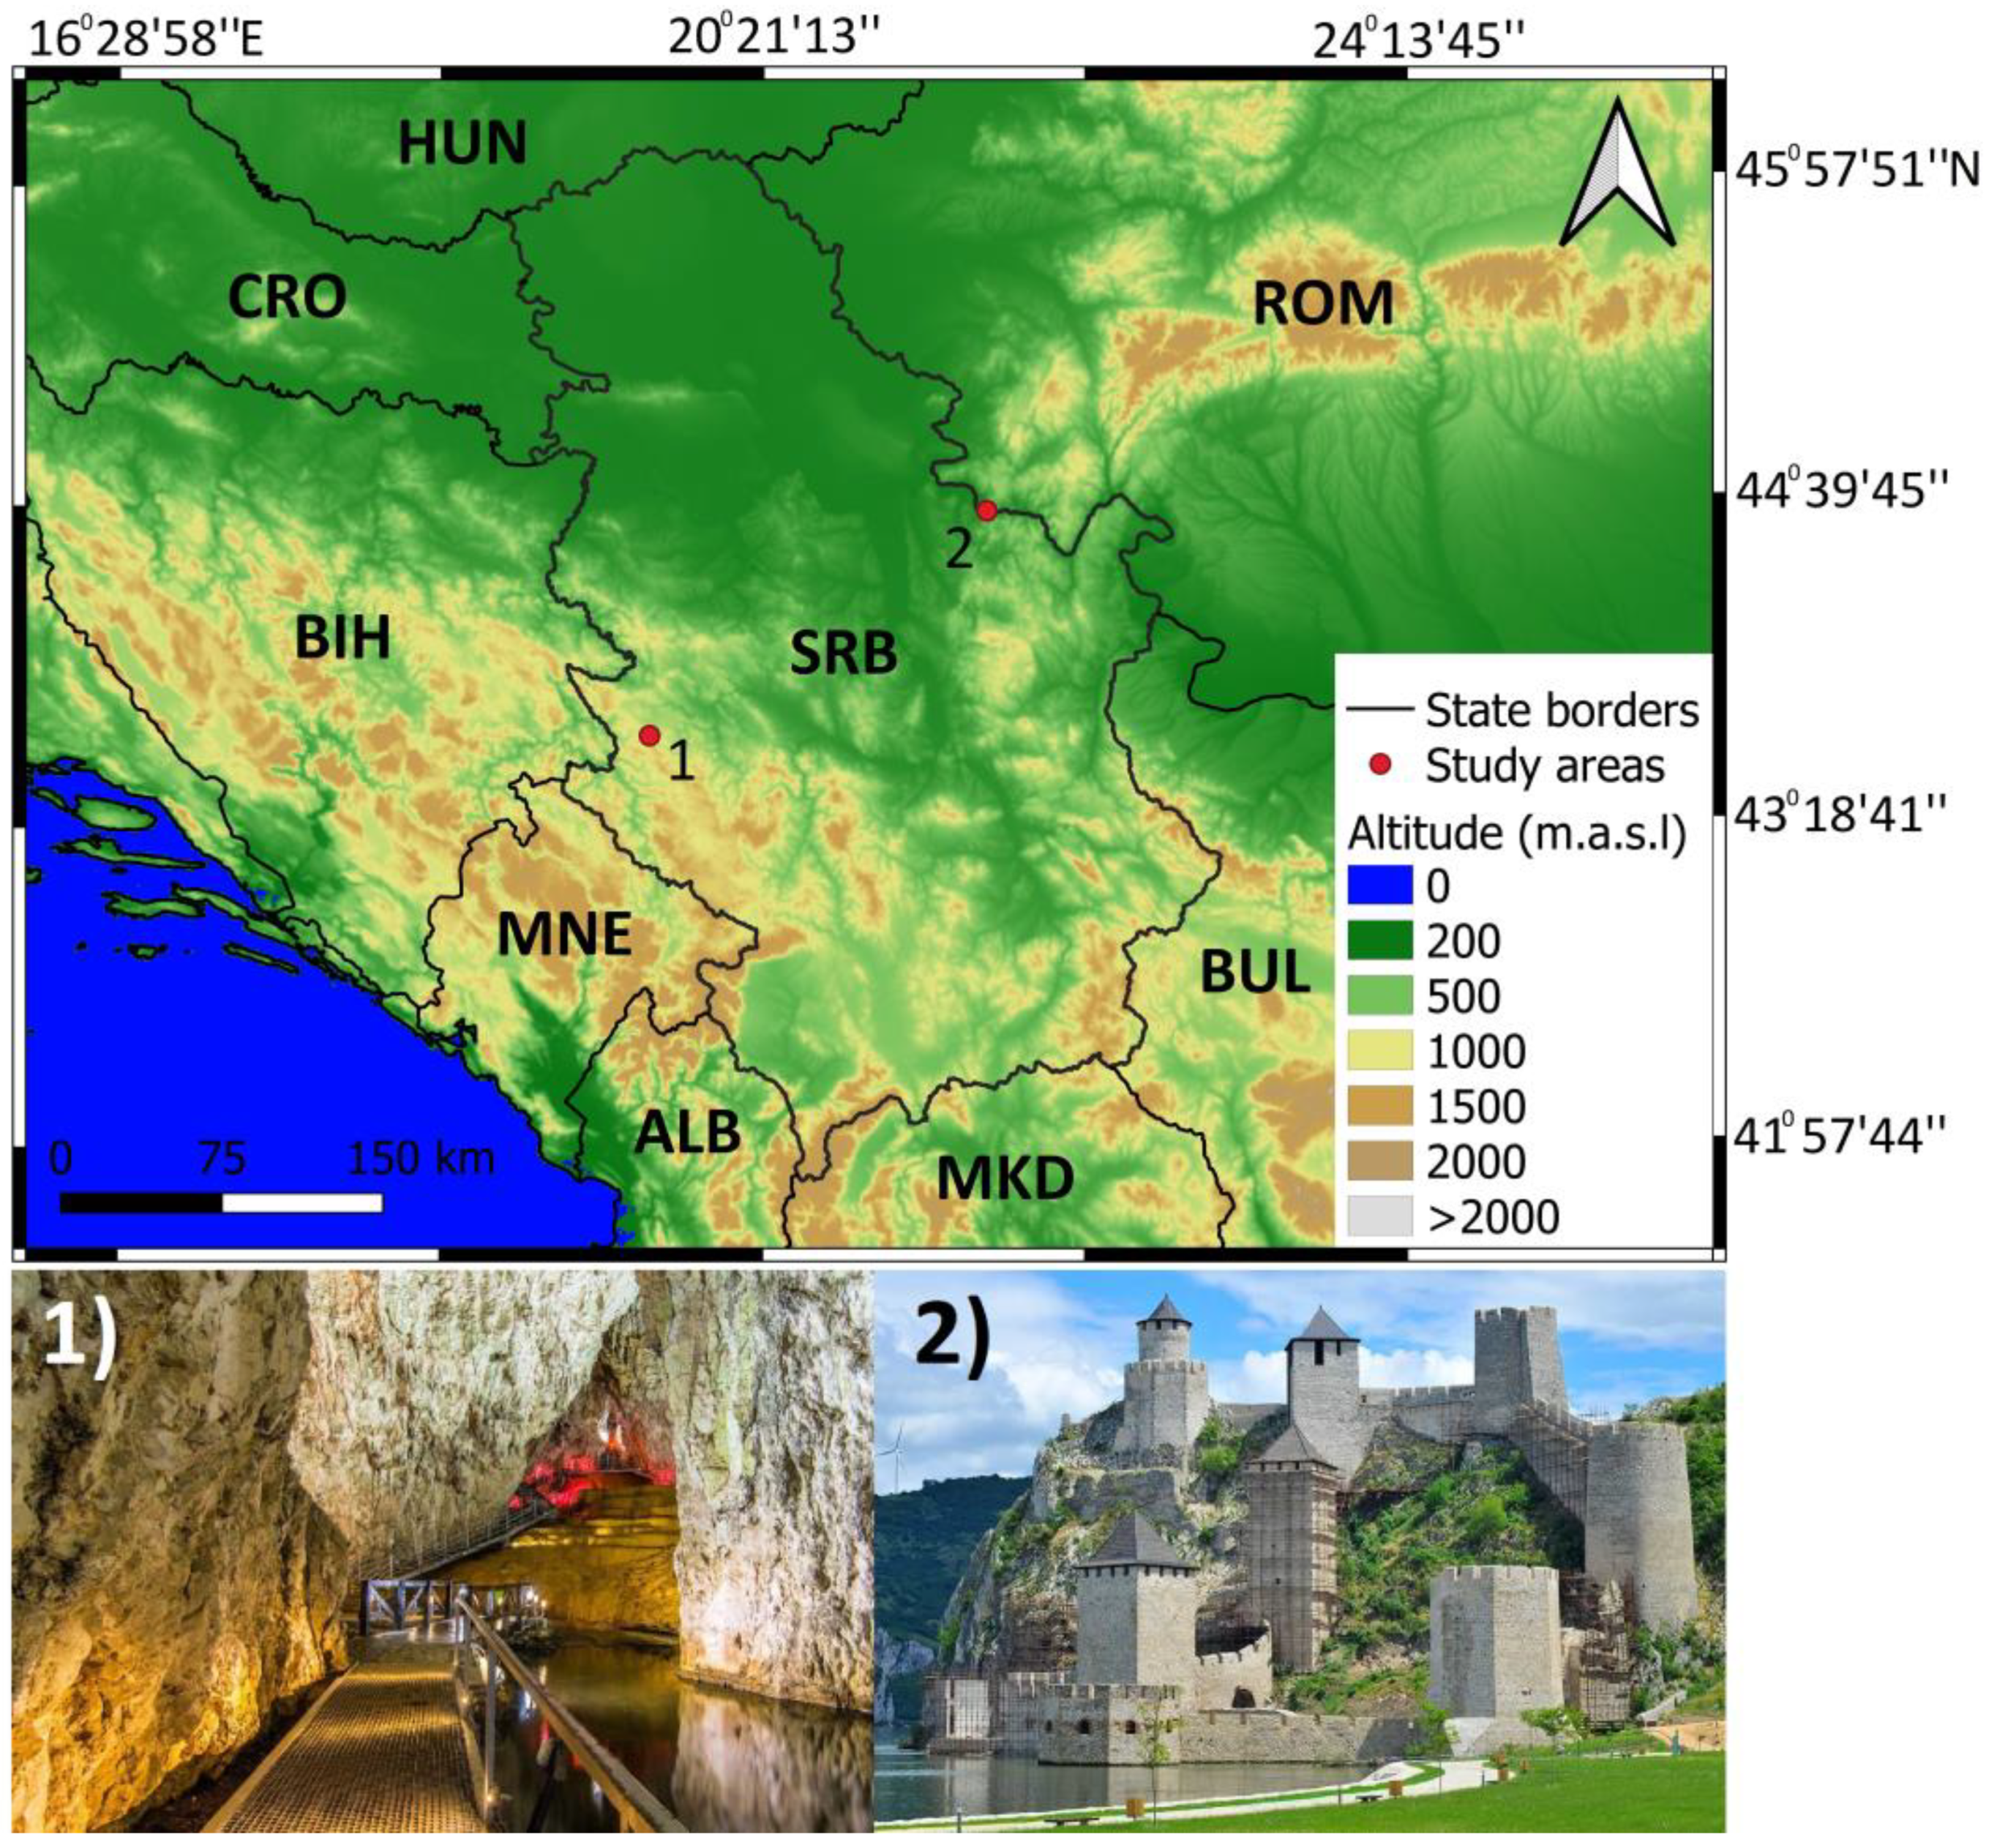
Tourist activities in the vicinity of the Stopića Cave, located on Zlatibor, have the classic characteristics of mountain tourism. This type of tourism not only offers different forms of geoheritage but also has the advantage of attracting different visitors throughout the year through a range of activities (mountaineering, cycling, climbing, skiing, snowboarding, sledding) [32,33]. On the other hand, visiting Golubac Fortress can be classified as cultural tourism. Cultural tourism is characterized by weak seasonality, so many authors believed that the development of cultural tourism resources could avoid strong seasonality [34,35,36].
From the aspect of tourism, climatology, natural hazards and environmental protection, the application and analysis of a large number of parameters often assigned a different weighting coefficient to evaluate the criteria, i.e., a hierarchy of priorities was carried out [37,38]. This type of procedure—multi-criteria analysis—considers various quantitative and qualitative criteria that need to be determined in order to find the best solution. In such situations, decision making is based on proper structuring and explicitly evaluating all criteria using appropriate models and software packages [39,40]. For the purpose of the study, the Best–Worst method (BWM) was used as one of the latest and most reliable multi-criteria decision-making models [41]. In analyzing the five climatic elements, a priority hierarchy was created so that each criterion received its weight. The BWM served as the mathematical basis for developing a new index, the Heritage Climate Index (HERCI), which basically uses readily available climate parameters. HERCI determines optimal climate comfort on a monthly basis using mean monthly air temperature, mean monthly total precipitation, mean monthly cloudiness, monthly insolation and mean monthly relative humidity. The index can be used in areas with moderate climate characteristics.
The aim of this study is to analyze the external climate comfort conditions of protected areas and to develop a new climate index based on five climate parameters and a multi-criteria analysis. In addition, as it involves the evaluation of climate variables for natural and cultural heritages, the study contributes to a better understanding of regional climate differences and the potential of ecotourism and cultural tourism.

2. Materials and Methods

2.1. Study Area

Stopića Cave is located in the western part of Serbia, in the northeastern part of the Zlatibor Mountain (Figure 1). The first speleological explorations of the cave were carried out by the most famous Serbian geographer Jovan Cvijić. Due to its specific natural characteristics and preserved geomorphological and hydrological features, the Stopića Cave was declared a protected area in the form of a natural monument in 2005. Tourist visits to the cave has been arranged since 2009 and is known mainly for its accumulative forms—Tufa tubs (rimstone dams). Stopića Cave consists of five morphological units: Light Hall, Dark Hall, Hall with Tubs, Channel with Tubs and River Channel [42]. Excluding its youngest system, Stopića Cave is 1692 m long. The cave entrance is 711 m above sea level, and the Trnava stream flows through the cave. According to the Zlatibor Tourist Organization, the number of visitors in 2012 was 25,817, while in 2021, the number of visitors was 100,252 visitors, which makes this site one of the most visited geoheritage objects in Serbia [43].
From the climatological point of view, the area around the cave is located at the interface between temperate continental climate and mountain climate [44,45]. The data used for the analysis of climatic elements were obtained from the meteorological station of Zlatibor [46]. The station altitude is 1029 m, and the climate elements were analyzed for the period 1990–2021. According to the results, the average annual air temperature is 8.3 °C, and the average annual precipitation is 1017.4 mm. The average annual number of sunshine hours is 2052, the average annual relative humidity is 75.1%, and the average annual cloudiness is 57%.
Golubac Fortress is a medieval fortress in the northeastern part of Serbia, on the right bank of the Danube. It is located 75 m above sea level, at the entrance of the Djerdap Gorge and the Djerdap National Park. The fortress’s construction date is unknown, although it was first mentioned in written sources in 1335 [47]. During its long history, the fortress was ruled by many people (Hungarians, Serbs, Ottoman Turks) and suffered great damage during wars. Detailed reconstruction of the fortress was completed in 2019 when it was opened for tourist visits. Today, the Golubac Fortress is under state protection as a cultural monument of exceptional importance. In 2019, it was visited by 112,248 tourists, and in 2022, by 171,608 tourists [47].
For the analysis of climatic elements, the data (1990–2021) from the meteorological station Veliko Gradište [43] was used, located at an altitude of 80 m above sea level and 17 km from Golubac. Golubac and its surroundings are characterized by a moderate-continental climate with significant regional climate differences compared to Zlatibor [48]. The average annual air temperature is 11.8 ° C, while the average annual precipitation is 668.4 mm. The average annual cloudiness is 54%, and the average number of sunshine hours is 2139. The average annual relative humidity is 73.6% [46].
Stopića Cave and Golubac Fortress are objects of geoheritage and cultural heritage. These two protected heritage sites with large altitude differences and different climate conditions were used in this study to demonstrate the wide application of the HERCI index in areas with different climate characteristics.

2.2. Selection of Criteria by Importance

Air temperature—is the degree of hotness or coldness of a site. The air temperature is measured two meters above the ground, where the thermometer is protected from direct sunlight and exposed to free airflow. The dry bulb thermometer is placed in a meteorological shelter two meters above the topographic surface. It is marked as the most important criterion because human body does not have any selective sensors for the perception of individual climatic parameters, but can only register (by thermoreceptors) and generate a thermoregulatory response to temperature [49]. The human body is able to adapt to different temperature conditions, but during tourist stays, most people avoid outdoor activities in very high or very low temperatures. The human body is subject to the laws of thermodynamic, and in order to maintain an internal temperature of around 37 °C, environmental conditions determine whether there is too much/too little heat, or it is just right. Air temperature, radiant temperature, humidity and air movement are four basic environmental variables that affect human response to thermal environment. Extremely high or extremely low air temperatures can cause various human diseases [50,51].
Insolation—the duration of sunlight, measured in hours. Sunlight duration has great influence on outdoor activities, primarily because of day length. Also, it impacts the attractiveness of sites [52]. Although some rooms in the fortresses and the interior of the caves are independent of insolation, the surroundings of the fortress (viewpoints, entrance) and caves are an indispensable part of tourist activities for which sunlight is of great importance. Insolation is important for people’s physical and mental health. Unlike other essential vitamins, which must be obtained from food, vitamin D can be synthesized in the skin caused by exposure to radiation [53]. Lack of indirect sunlight is a major predictor of anxiety, and natural light has a positive impact on mental health. Insolation significantly affects the mood of people who mark “nice weather” as “sunny weather” [54,55].
Cloudiness—the level of the sky covered with clouds. It is expressed in tens or percent. Cloud cover is inversely proportional to insolation and has the opposite effect. Therefore, it affects the appearance of the landscape and its aesthetic qualities [56,57].
Precipitation—means an amount above or equal to 0.1 mm of rainfall. Along with temperature, precipitation is the most important climate element for different climate research [58]. In this case, precipitation is fourth as a criterion because, apart from showers and extreme precipitation, it has no limiting effect on people’s activities and/or health or tourist movements.
Relative air humidity—is defined as the ratio of the vapor pressure of air to its saturation vapor pressure [50,59]. It is expressed in percentages. Increased humidity causes a feeling of fatigue [60]. With low temperatures, it reduces visibility and causes fog. In winter months, it reduces the negative effects of relatively low temperatures. The optimal humidity is 50–75% [58,61].
Other factors which are not used in this research also play a role in climate comfort: wind speed and frequency, monthly amplitude of air temperature and number of rainy days in a given month [21].

2.3. Methodology

2.3.1. Multi-Criteria Decision Making (MCDM)

Based on five climate criteria, assessing climate comfort can be considered a multi-criteria decision making (MCDM) problem. In MCDM problems, decisions are based on evaluating different, mostly contradictory criteria. In other words, MCDM methods provide a situation to consider various criteria with different weights. The outcome of this assessment helps to identify the optimal alternative from multiple alternatives as selected by a decision-maker [62].
Different MCDM methods have been used in the literature in various fields [63]. However, potential inconsistency is one of the primary deficiencies in some popular MCDM methods [41] and cannot be easily rectified [64]. Moreover, other MCDM methods, such as Analytical Hierarchy Process (AHP), need to collect extensive data, making managing data difficult [60].
In this study, we aim to use Best–Worst Method (BWM). BWM, developed by Rezaei [41], among other MCDM methods, has superior features that make it very popular among researchers. Rezaei [61] elaborates on three core benefits of BWM: (1) BWM allows more reliable and consistent pairwise comparisons as an expert has a clear understanding of the range of evaluation from the outset by selecting the best and the worst criteria, (2) BWM decreases possible anchoring bias by using two pairwise comparisons based on the best and the worst criteria, and (3) BWM uses data and time-efficient pairwise comparisons with a possibility of checking the consistency of pairwise comparisons.
In the literature, Best–Worst Method has been used in several studies with different objectives: business model and sustainability, technology selection, social sustainability in the supply chain and R&D performance [65,66,67,68,69]. However, using BWM for finding the values of the HERCI index is new.
BWM can provide multiple optimal solutions if a non-linear minmax model is used to determine the criteria weights. When a linear BWM model is used, the pairwise comparison gives one unique outcome [62].

2.3.2. Best–Worst Method (BWM)

This study uses a linear BWM model to determine the weights of five climatic elements. See Rezaei [62] for a more thorough explanation and justification of the design of the linear BWM. The steps of BWM are as follows:
Step 1: Identify a set of decision criteria for a decision-making problem { c 1 , c 2 , c 3 , , c n } .
Step 2: Identify the best criterion (or most important, most preferred criterion) and the worst criterion (or least important, least desired criterion) among the decision criteria.
Step 3: Compare the best criterion to all the other criteria using a 9-point scale (number 1 represents equal importance, whereas number 9 means that the best criterion is rated ‘extremely more important’ than other criteria). The result is a best-to-others (BO) vector that is as follows:
A B = ( a B 1 , a B 2 , , a B n )
aBj stands for to what extent the best criterion B is more preferred to criterion j. Therefore, it is evident that aBB = 1.
Step 4: Compare all other criteria to the worst criterion (W) using a 9-point scale (numbers between 1 and 9; 1: j is equally important to W; 9: j is extremely more important than W). In this case, the vector OW is as follows:
A W = ( a 1 W , a 2 W , , a n W )
Here, the preference of criterion j over the worst criterion is expressed as ajW, while aWW = 1.
Step 5: Calculate the optimal weights of the different criteria. By minimizing the maximum value of the set of w B a B j w j , w j a j W w W for all j, the problem can be translated into the following [62]:
min w max j w B a B j w j , w j a j W w W
subject   to   j = 1 n w j = 1 , w j 0 ,   for   all   j
This problem (4) can be written as a linear programming model, as it is showed below:
min   ξ
such that
w B a B j w j ξ ,   for   all   j
w j a j W w W ξ ,   for   all   j
j = 1 n w j = 1
w j 0 ,   for   all   j
In the literature, the best–worst method has been used in several studies with different objectives: Business model and sustainability, technology selection, supply chain social sustainability, and R&D performance [65,66,67,68,69].
The input-based consistency ratios and associated thresholds provided in Liang et al. [70] are used to check the acceptability of the pairwise comparisons’ consistency. All the comparisons were consistent.
Based on previous research and experts’ opinions in climatology, tourism, geography and the environment, a hierarchy of criteria was created according to priority. In all multi-criteria analyses, the opinion of many experts is important to reduce subjectivity in the creation of the matrix and the final calculation. Researchers and professors with 5–25 years of experience participated in determining the priorities, and the greatest importance was assigned to the average monthly air temperature (Tavg). In contrast, the least importance was given to relative air humidity (RHavg). In addition to the mentioned criteria, the following criteria were also used in the calculation: monthly insolation (Imon), average monthly cloud cover (CCavg) and monthly total precipitation (Psum) (Table 1).
The level of consistency of pairwise comparisons is acceptable and amounts to 0.2. The associated threshold value is 0.23. By assigning numerical values in the matrix and applying the BWM method, the weighting coefficients for each criterion were obtained (Table 2).
In this case, the greatest importance is attached to the best marked criterion, i.e., Tavg (0.416), while the criterion evaluated as the worst is RHavg and has a weight value of 0.072.

2.3.3. Heritage Climate Index (HERCI)

The HERCI index was developed to evaluate climatic comfort for ecotourism and cultural tourism needs. It is based on the application of five readily available climate parameters: average monthly air temperature (Tavg), monthly insolation (Imon), average monthly cloud cover (CCavg), monthly total precipitation (Psum) and average monthly relative air humidity (RHavg). Weighting coefficients (WC) were determined using the BWM method. The assignment of grades and the classification of results in the application of multi-criteria analysis varies; in general, the final results are divided into four or five classes [71,72,73].
Within each climate parameter, intervals (INT) were separated and grades (G) were assigned from one to five. Intervals with a grade of one were defined as extremely unfavorable, and values with grade of five were defined as very favorable for climate comfort assessment. Grade Coefficient (GC) is obtained by multiplying WC and G.
Once GC is assigned to all five parameters, the following formula is obtained:
HERCI = G C ,
where HERCI—Heritage Climate Index; GC—Grade Coefficient. The maximum value that a locality can receive using the HERCI index is five, and the minimum value is one. On this basis, the index value was divided into five classes (Table 3). The validity of the HERCI index is achieved by applying five easily accessible climate parameters, without the possibility of adding new parameters or changing existing ones. The method does not include air velocity due to significant microclimate differences in the study areas. It is a parameter where the frequency and speed can vary significantly at the local level. Certain geoheritage and cultural heritage objects are located on the windward side, some on the leeward side. At the same time, official data is collected only for the location of the meteorological station.
Depending on the final sum, the climate index of the place on a monthly basis may be as follows: extremely unfavorable, unfavorable, acceptable, favorable, and very favorable (Table 4).
Depending on the final sum, the climate index of the locality on a monthly basis can be as follows: extremely unfavorable, unfavorable, acceptable, favorable and very favorable (Table 4).
In order for HERCI to be relevant for areas with different climatic conditions, the Stopića Cave, whose surroundings have a mountain climate, and Golubac Fortress, which is characterized by a temperate–continental climate, were examined in the study. For both locations, a very high correlation was obtained between the index values and monthly tourist visits.

3. Results and Discussion

By processing climatological data for the period 1991–2021, average values of climatic elements for the areas around Stopića Cave and Golubac Fortress were obtained. From the climatic conditions, January, February and December are the least suitable for visiting the Stopića Cave, when the average temperatures are below 0 °C. Insolation during January and December is very low, which implies that the cloudiness in this period is the highest in the whole year (>64%). Relative humidity is above 83%, while monthly precipitation is 63.9–83.4 mm (Table 5).
The synergy of the processed climate elements results in January and December being extremely unfavorable for tourist visits to the protected areas on Zlatibor. July and August, on the other hand, can be considered very favorable. Temperature conditions above 18 °C, a significant amount of sunshine (>270 h), the least cloudiness (<46%) and optimal humidity (<70%) resulted in ideal climate comfort for tourist activities within geoheritage and cultural heritage sites.
The analysis of tourist visits to Stopića Cave by month in 2012–2021 confirms that the largest number of tourists was recorded in July and August (>9000). The highest recorded climate comfort (4.7) in August corresponds to the highest number of tourists in the same month (15,142). A very low number of tourists was recorded during the winter months when the climate comfort was classified as extremely unfavorable or unfavorable. December, which is marked as the most unfavorable (1.4), is characterized by a very low number of tourist visits (1343) (Table 6).
When examining the correlation analysis between HERCI index scores and average visits on a monthly level, a very high Pearson’s correlation level of 0.94 was found. The relationship between the two variables is shown in Figure 2.
Weather conditions at the Golubac Fortress differ significantly from those in Zlatibor. When examining the meteorological data of the Veliko Gradište station for the period 1990–2021, it was found that the monthly average temperatures in January, February and December are less than 3 °C. In January and December, insolation was very low (<70 h), while cloud cover was >70%. In contrast to Zlatibor, the Veliko Gradište area is characterized by relatively uniform monthly precipitation. Unfavorable relative humidity (>82%) was recorded during January and December. The lowest HERCI value was for January, i.e., 1.55, which means that the climate comfort in this month is extremely unfavorable. Very favorable climatic comfort was recorded for June (4.43), July (4.77) and August (4.89). Ideal climatic conditions were recorded in August, having air temperature around 22 °C and extremely sunny weather with more than 290 h of sunshine.
Also, the lowest cloudiness of the year (34%), a small amount of precipitation (51.2 mm) and ideal humidity (67.5%) resulted in August being the month with the highest climate comfort (Table 7).
Comparative analysis of index results regarding monthly visits revealed a very high Pearson’s correlation (0.91). August is the month with the highest number of tourists (30,021) and the highest degree of climate comfort (4.89). On the other hand, January has the lowest HERCI value (1.55) and the lowest number of visitors in the year (1667) (Table 8).
The graph of linear regression diagram shows an obvious relationship between the number of tourists and the obtained values of climatic comfort (Figure 3).
The coefficient of determination for the geoheritage object, Stopića Pećina, is 0.88, while the value for the Golubac fortress is 0.83. The results clearly show that the development of the HERCI index is justified and that the climate comfort values are closely related to the monthly number of tourists.
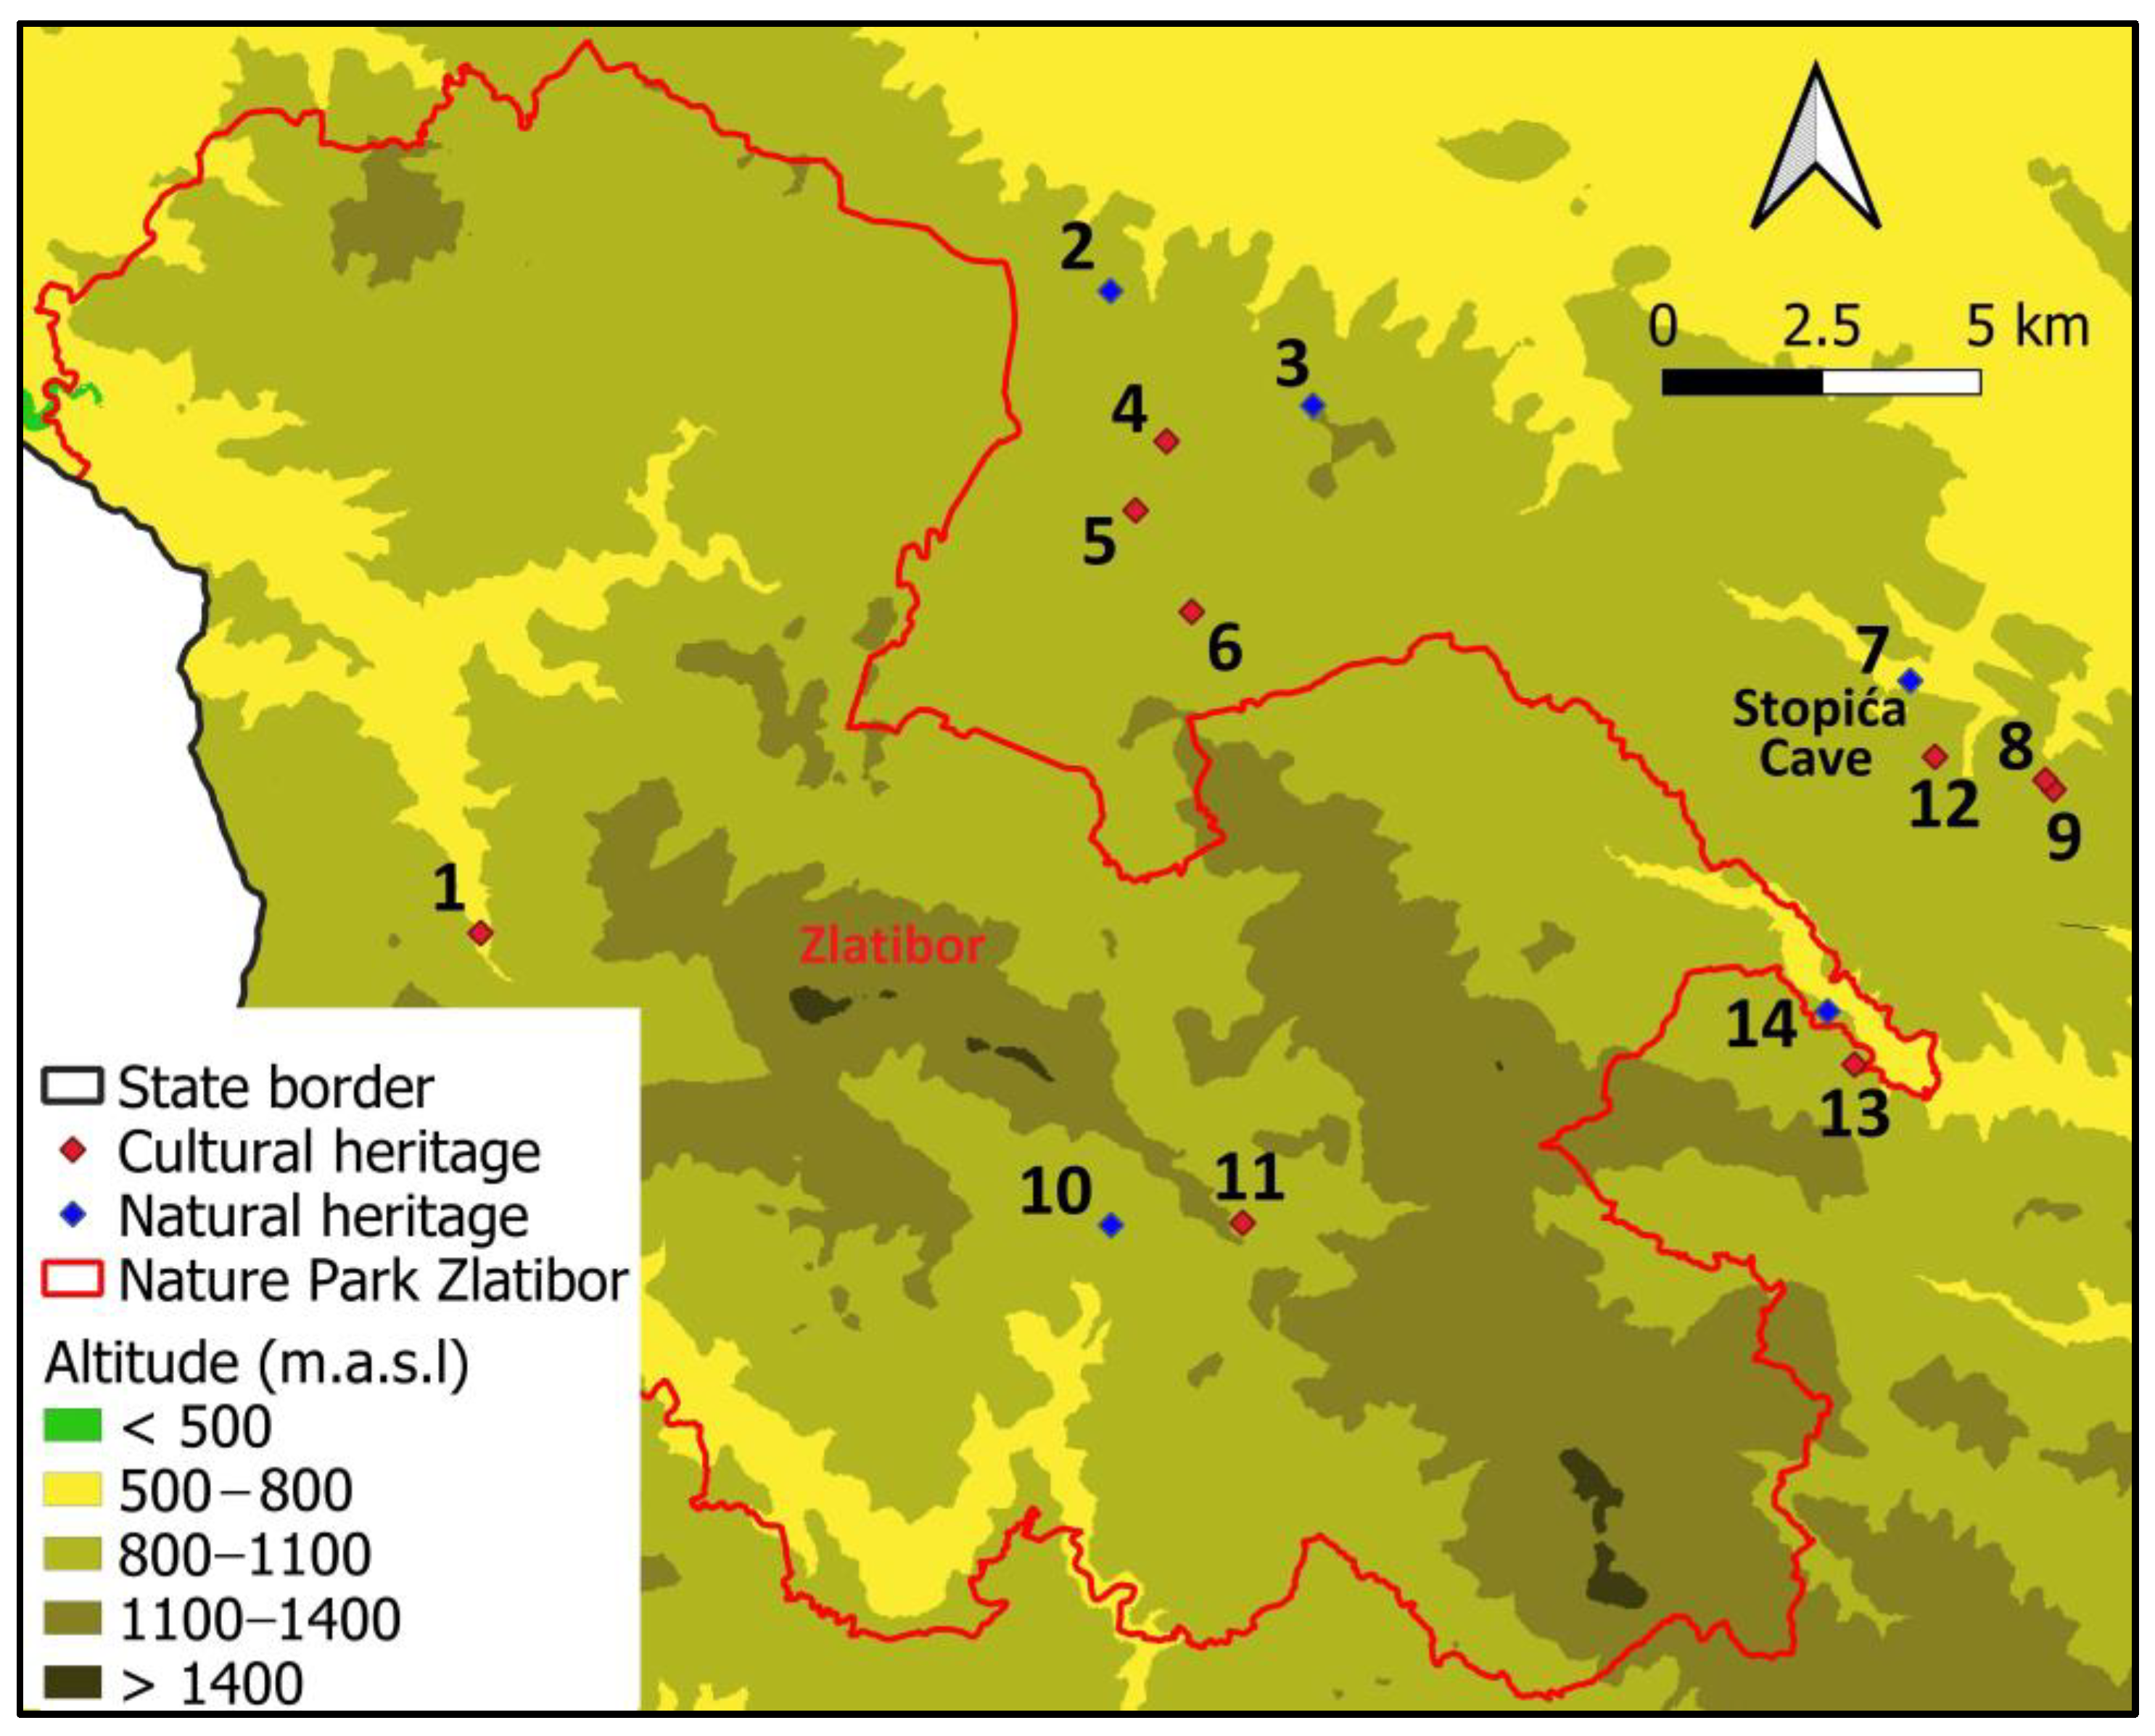
In addition to the Stopića cave, there are 13 other objects of natural and cultural heritage in Zlatibor and the immediate surroundings, within which the results of the HERCI index are applicable. Sites were mapped using geographic information systems (GIS) and inventory analysis of natural and cultural objects (Figure 4).
In the Zlatibor region there are five representative natural forms of geological heritage: the Obadovo brdo viewpoint, the Gradina viewpoint, the Stopića cave, the natural stone bridge in Dobroselica and the Gostilje waterfall (Table 9). All the mentioned locations are tourism spots. A large part of the mountain massif is protected as the Zlatibor Nature Park with an area of about 419 km2.
A large number of different types of cultural buildings (churches, villas, fountains, monuments and houses) are represented in Zlatibor. This combination of specific landforms with cultural heritage offers tourists a wide choice when visiting heritage sites (Figure 5).
In the northeastern part of Serbia, around Golubac and Veliko Gradište, a total of 18 natural and cultural objects were analyzed and mapped (Figure 6).
As in Zlatibor, the cultural heritage around Golubac is very heterogeneous and includes archaeological sites, a power plant, a water mill, churches, houses, buildings and a fortress (Table 10).
The tufa accumulation near the Tumane Monastery stands out among the objects of geological heritage (Figure 7). It is important to emphasize that Golubac Fortress is located on the territory of a protected area—Djerdap National Park—which is also protected at the international level within the worldwide network of geoparks of UNESCO.
Although the HERCI index was tested for two locations, the obtained results of climatic comfort are applicable to 32 natural and cultural monuments (14 in the Zatibor region and 18 in the Golubac region).
According to the register created by De Freitas and Grigorieva [11], today there are more than 165 variations of climate indices. A person’s thermal comfort can be assessed by analyzing six variables, which are divided into two groups: indoor environment (air temperature, surface temperature, air velocity, humidity) and personal information (clothing level, activity level) [74,75].
Still, when it comes to those that deal with the relationship between climate and geoheritage, there is a gap in the literature. Several studies [76,77] have found statistical differences based on socio-demographic factors and tourists’ place of origin across the tourism sector. However, not all tourists are equally sensitive to the same weather conditions. Tourist climate indices differ mainly in terms of the used variables, their number and categorization.
They have in common the evaluation of the thermal component: maximum and average temperature (TCI and OTCI) [15,24], average temperature (TCCI) [21], minimum and maximum temperature (CCI) [22], maximum temperature (HCI) [20] and temperature sensation (BCI) [18]. TCI and TCCI are excluded as generally applicable indices, and the selection and evaluation of the remaining variables will depend on the type of destination to which the index is applied. There is a need for indices that are adapted to tourism sectors [78]. It is not enough to assume that the desired climate resources are the same for all tourism activities. For example, [79] note that different nature-based tourism activities (e.g., camping vs. skiing) require different climatic conditions [22].
HERCI has a concrete application in the sector of ecotourism and cultural tourism, that is why the average air temperature was chosen as a thermal component. The Golubacka fortress is an open type, and the air temperature of Stopića Cave depends on the outdoor temperature. According to the obtained results, HERCI at both sites has the lowest values in the months with the lowest air temperatures (Table 5 and Table 7).
Like Mietzkowski [15], HERCI considers insolation (including cloudiness) as an aesthetic rather than a thermal index component. Although insolation does not directly affect Stopića Cave, it does affect its surroundings and Zlatibor as a whole, especially for visitors whose motive is not ski tourism. In the BCI, insolation has both aesthetic and thermal value. Together with the air temperature, the proportion of time the sun shines during the day creates a thermal sensation [18]. OTCI, on the other hand, excludes insolation as a parameter due to spatial and temporal variability [24]. For this reason, HERCI is most optimal to use for research in moderate climate areas.
Among the aforementioned indices, only the TCCI, in the assessment of the Republic of Serbia, does not use wind as a variable. According to the authors, the average monthly wind speed in the studied area does not significantly affect the comfort of tourists [21]. Also, this study did not use wind speed as a physical component. The reason is that wind speed data is difficult to find. Therefore, HERCI was developed with the idea of using widely available data.
By applying the TCCI to 26 meteorological stations [21], it results state that the most favorable months for tourist activities in Serbia are May, June and September with the calculated TCCI index of 24–28, except for Kopaonik and Zlatibor, where August is more favorable with a TCCI index of 30. The gradation applied by Anđelković ranges from 0 to 40, and the most favorable months are those with a value between 20 and 30. Using the HERCI coefficient, we found that August in the Stopića Cave stands out as the month with the highest climate comfort and calculated index of 4.7, while at the Golubac Fortress, June is the most favorable, which also agrees with Anđelković’s results.
This manuscript investigates the relationship between the number of visitors per month and the climate comfort of tourists in geoheritage and cultural heritage sites. In tourism, the number of visits does not depend exclusively on climate conditions, but the results show a high degree of correlation between HERCI and visits to both localities (Figure 3 and Figure 4). Anđelković et al. examined the correlation between the number of tourists and TCCI in three locations in Serbia and obtained lower coefficients of determination (Belgrade—0.73; Zlatibor—0.09; Vrnjacka Banja—0.69).
The HCI index applied by Hejazizadeh [20] uses a rating scale from 0 to 100, and for the threshold of favorability, it uses a score of 50; the higher the coefficient, the greater is the favorability. May stands out as the most favorable month with a score of 92; the other months are marked as very good to ideal months for tourism, among which October, September, April and January stand out with the worst score for tourists (56). In this study, the HCI index was applied to the area of different climatic conditions. Still, it is one of those that can also serve for a better understanding and valorization of ecotourism. In the future, a comparative analysis of the HCI and HERCI indices can be performed, which would demonstrate its precision and applicability.

4. Conclusions

Human health, well-being and optimal comfort are a result of the complex influence of natural and anthropogenic factors, of which climate is one of the most important. This study evaluated climatic conditions in the western and northeastern parts of Serbia using meteorological data from 1990–2021. By applying five criteria and their hierarchy by priority, the HERCI index was developed. Wind speed is not included in the HERCI method due to the absence of precise data. The limitation is due to significant microclimatic and geomorphological differences between the studied areas and an insufficient number of meteorological measurements. Climate parameters are determined by intervals and grades from one to five, where grade five indicates very favorable climatic comfort. The results showed that climate comfort conditions obtained by the HERCI index correlate very highly with monthly visits to Stopića Cave and Golubac Fortress. In addition to the two sites studied, the HERCI index is applicable to another 30 natural and cultural objects in Zlatibor and the surroundings of Golubac.
Although the two protected areas differ significantly in elevation and climate conditions, the HERCI index mitigates regional climatic differences. Under conditions of a temperate continental climate and readily available data, the HERCI index represents an improvement that will be useful for predicting future interactions of ecotourism and cultural tourism with climate change [80,81,82]. Information on climate comfort on a monthly basis before travel can increase the number of tourists and help them better prepare for their vacations. In addition to climate comfort studies, future researchers should aim to study the interaction between natural and socioeconomic factors, i.e., the inclusion of market-based factors. The methodology used and the results obtained will be a starting point for studying climate comfort in other protected areas worldwide where similar climatic conditions prevail.

Author Contributions

Conceptualization, U.D.; methodology, U.D.; software, A.V.; validation, T.L., N.Č. and M.D.; formal analysis, S.V. and U.D.; investigation, D.R.; resources, V.S.; data curation, A.V.; writing—original draft preparation, U.D.; writing—review and editing, T.L.; visualization, U.D., M.D., N.Č. and S.V. All authors have read and agreed to the published version of the manuscript.

Funding

This research was funded by the Ministry of Education, Science and Technological Development of the Republic of Serbia (Contract number 451–03-68/2022–14/200091).

Institutional Review Board Statement

Not applicable.

Informed Consent Statement

Not applicable.

Data Availability Statement

To obtain the data for this study, please contact the authors via email.

Acknowledgments

We are grateful to colleagues and co-authors Aleksandar Valjarević and Tin Lukić for the invitation to participate in the Special Issue “Cloudiness, Weather Modification and their Effects on Populations, Environment and Land”. We would like to thank the Tourist Organization “Zlatibor” and Tourist Organization “Golubac” for providing data for research purposes.

Conflicts of Interest

The authors declare no conflict of interest.

References

  1. Jover, J.; Diaz-Parra, I. Gentrification, transnational gentrification and touristification in Seville (Spain). Urban Stud. 2019, 57, 3044–3059. [Google Scholar] [CrossRef]
  2. Malinović-Milićević, S.; Petrović, M.D.; Radovanović, M.M. Evaluation of outdoor thermal comfort conditions: Evidence from the Serbian major ski resort over the last 30 years. Int. J. Biometeorol. 2023, 67, 807–819. [Google Scholar] [CrossRef]
  3. Zeng, D.; Wu, J.; Mu, Y.; Li, H.; Deng, M.; Wei, Y.; Sun, W. An Assessment of Tourism Climate Comfort in the China–Pakistan Economic Corridor. Sustainability 2020, 12, 6981. [Google Scholar] [CrossRef]
  4. Pénzes, E. Applicability of tourism impact assessment method. J. Landsc. Ecol. 2009, 7, 363–373. [Google Scholar]
  5. Masoudi, M. Estimation of the spatial climate comfort distribution using tourism climate index (TCI) and inverse distance weighting (IDW) (case study: Fars Province, Iran). Arab. J. Geosci. 2021, 14, 363. [Google Scholar] [CrossRef]
  6. Renes, H. The interconnection of mountain and lowland landscapes in a historical perspective. J. Landsc. Ecol. 2018, 16, 1–10. [Google Scholar] [CrossRef]
  7. Kruse, A.; Paulowitz, B. UNESCO world heritage as an opportunity for mountain landscapes. A trigger for development not only in the Alps. J. Landsc. Ecol. 2018, 16, 41–57. [Google Scholar] [CrossRef]
  8. Valizadeh, M.; Khoorani, A. The impact of climate change on the outdoor tourism with a focus on the outdoor tourism climate index (OTCI) in Hormozgan province, Iran. Theor. Appl. Climatol. 2022, 150, 1605–1612. [Google Scholar] [CrossRef] [PubMed]
  9. Karimi, A.; Mohammad, P. Effect of outdoor thermal comfort condition on visit of tourists in historical urban plazas of Sevilla and Madrid. Environ. Sci. Pollut. Res. 2022, 29, 60641–60661. [Google Scholar] [CrossRef]
  10. Gao, C.; Liu, J.; Zhang, S.; Zhu, H.; Zhang, X. The Coastal Tourism Climate Index (CTCI): Development, Validation, and Application for Chinese Coastal Cities. Sustainability 2022, 14, 1425. [Google Scholar] [CrossRef]
  11. De Freitas, C.R.; Grigorieva, E.A. A comparison and appraisal of a comprehensive range of human thermal climate indices. Int. J. Biometeorol. 2017, 61, 487–512. [Google Scholar] [CrossRef] [PubMed]
  12. Potchter, O.; Cohen, P.; Lin, T.-P.; Andreas, M. Outdoor human thermal perception in various climates: A comprehensive review of approaches, methods and quantification. Sci. Total. Environ. 2018, 631–632, 390–406. [Google Scholar] [CrossRef] [PubMed]
  13. Hasanah, I.A.N.; Maryetnowati, D.; Edelweis, N.F.; Indriyani, F.; Nugrahayu, Q. The climate comfort assessment for tourism purposes in Borobudur Temple Indonesia. Heliyon 2020, 6, e05828. [Google Scholar] [CrossRef]
  14. Aghamolaei, R.; Azizi, M.M.; Aminzadeh, B.; O’Donnell, J. A comprehensive review of outdoor thermal comfort in urban areas: Effective parameters and approaches. Energy Environ. 2022, 1–24. [Google Scholar] [CrossRef]
  15. Mieczkowski, Z. The tourism climatic index: A method for evaluating world climates for tourism. Can. Geogr. 1985, 29, 220–233. [Google Scholar] [CrossRef]
  16. Błazejczyk, K.; Epstein, Y.; Jendritzky, G.; Staiger, H.; Tinz, B. Comparison of UTCI to selected thermal indices. Int. J. Biometeorol. 2012, 56, 515–535. [Google Scholar] [CrossRef] [PubMed]
  17. Zare, S.; Hasheminejad, N.; Shirvan, E.H.; Hemmatjo, R.; Sarebanzadeh, K.; Ahmadi, S. Comparing Universal Thermal Climate Index (UTCI) with selected thermal indices/environmental parameters during 12 months of the year. Weather. Clim. Extremes 2018, 19, 49–57. [Google Scholar] [CrossRef]
  18. Morgan, R.; Gatell, E.; Junyent, R.; Micallef, A.; Özhan, E.; Williams, A.T. An improved user-based beach climate index. J. Coast. Conserv. 2000, 6, 41–50. [Google Scholar] [CrossRef]
  19. De Freitas, C.R.; Scott, D.; McBoyle, G. A second generation climate index for tourism (CIT): Specification and verification. Int. J. Biometeorol. 2008, 52, 399–407. [Google Scholar] [CrossRef]
  20. Hejazizadeh, Z.; Karbalaee, A.; Hosseini, S.A.; Tabatabaei, S.A. Comparison of the holiday climate index (HCI) and the tourism climate index (TCI) in desert regions and Makran coasts of Iran. Arab. J. Geosci. 2019, 12, 803. [Google Scholar] [CrossRef]
  21. Anđelković, G.; Pavlović, S.; Đurđić, S.; Belij, M.; Stojković, S. Tourism climate comfort index (TCCI)—An attempt to evaluate the climate comfort for tourism purposes: The example of Serbia. Glob. Environ. Chang. 2016, 18, 482–493. [Google Scholar]
  22. Ma, S.; Craig, A.C.; Song Feng, S. The Camping Climate Index (CCI): The development, validation, and application of a camping-sector tourism climate index. Tour. Manag. 2020, 80, 104105. [Google Scholar] [CrossRef]
  23. Fitchett, M.J.; Meyer, A.C. The applicability and suitability of the Camping Climate Index for South Africa. J. Outdoor Recreat. Tour. 2023, 42, 100619. [Google Scholar] [CrossRef]
  24. Valizadeh, M.; Khoorani, A. Evaluation of climatic conditions pertaining to outdoor tourism in Bandar Abbas, Iran. Int. J. Biometeorol. 2020, 64, 29–37. [Google Scholar] [CrossRef]
  25. Yu, D.D.; Rutty, M.; Scott, D.; Li, S. A comparison of the holiday climate index: Beach and the tourism climate index across coastal destinations in China. Int. J. Biometeorol. 2021, 65, 741–748. [Google Scholar] [CrossRef]
  26. Pecelj, M.; Đorđević, Đ.; Pecelj, M.R.; Pecelj-Purković, J.; Filipović, D.; Šećerov, V. Biothermal conditions on Mt. Zlatibor based on thermophysiological indices. Arch. Biol. Sci. 2017, 69, 455–461. [Google Scholar] [CrossRef]
  27. Basarin, B.; Lukić, T.; Bjelajac, D.; Micić, T.; Stojićević, G.; Stamenković, I.; Đorđević, J.; Đorđević, T.; Matzarakis, A. Bioclimatic and climatic tourism conditions at Zlatibor Mountain (Western Serbia). Idojaras 2018, 122, 321–343. [Google Scholar] [CrossRef]
  28. Błażejczyk, K.; Pecelj, M.; Nejedlik, P.; Skrynyk, O.; Mikulova, K. Thermal stress in selected mountain system in Central and Eastern Europe—Initial research based on UTCI characteristics. Geogr. Pol. 2021, 94, 223–236. [Google Scholar] [CrossRef]
  29. Statistical Office of the Republic of Serbia. Statistical Yearbook 2010. 2020. Available online: https://www.stat.gov.rs/en-US/publikacije/?a=22&s=2202&d=2&r= (accessed on 3 May 2023).
  30. Institute for Nature Conservation of Serbia. Geodiversity. Available online: https://www.zzps.rs/wp/geodiverzitet/?script=lat (accessed on 5 May 2023).
  31. Republic Institute for the Protection of Cultural Monuments—Belgrade. Immovable Cultural Property. Available online: https://heritage.gov.rs/latinica/nepokretna_kulturna_dobra.php (accessed on 7 May 2023).
  32. Romeo, R.; Russo, L.; Parisi, F.; Notarianni, M.; Manuelli, S.; Carvao, S.; UNWTO. Mountain Tourism—Towards a More Sustainable Path; Food and Agriculture Organization of the United States: Rome, Italy, 2021. [Google Scholar]
  33. Steiger, R.; Knowles, N.; Pöll, K.; Rutty, M. Impacts of climate change on mountain tourism: A review. J. Sustain. Tour. 2022, 30, 1–34. [Google Scholar]
  34. Qiang, M. Does climate drive tourism seasonality in cultural destinations? A comparative study. Curr. Issues Tour. 2020, 23, 2756–2761. [Google Scholar] [CrossRef]
  35. Vatsa, P. Seasonality and cycles in tourism demand—Redux. Ann. Tour. Res. 2021, 90, 103–105. [Google Scholar] [CrossRef]
  36. Zhang, J.; Yu, Z.; Miao, C.; Li, Y.; Qiao, S. Cultural Tourism Weakens Seasonality: Empirical Analysis of Chinese Tourism Cities. Land 2022, 11, 308. [Google Scholar] [CrossRef]
  37. Durlević, U.; Valjarević, A.; Novković, I.; Ćurčić, N.B.; Smiljić, M.; Morar, C.; Stoica, A.; Barišić, D.; Lukić, T. GIS-Based Spatial Modeling of Snow Avalanches Using Analytic Hierarchy Process. A Case Study of the Šar Mountains, Serbia. Atmosphere 2022, 13, 1229. [Google Scholar] [CrossRef]
  38. Araya, J.D.; Hernando, A.; Tejera, R.; Velázquez, J. Sustainable Tourism around Ecosystem Services: Application to a Case in Costa Rica Using Multi-Criteria Methods. Land 2023, 12, 628. [Google Scholar] [CrossRef]
  39. Taherdoost, H.; Madanchian, M. Multi-Criteria Decision Making (MCDM) Methods and Concepts. Encyclopedia 2023, 3, 77–87. [Google Scholar] [CrossRef]
  40. Durlević, U.; Novković, I.; Carević, I.; Valjarević, D.; Marjanović, A.; Batoćanin, N.; Krstić, F.; Stojanović, L.; Valjarević, A. Sanitary landfill site selection using GIS-based on a fuzzy multi-criteria evaluation technique: A case study of the City of Kraljevo, Serbia. Environ. Sci. Pollut. Res. 2023, 30, 37961–37980. [Google Scholar] [CrossRef]
  41. Rezaei, J. Best-worst multi-criteria decision-making method. Omega 2015, 53, 49–57. [Google Scholar] [CrossRef]
  42. Stupar, M.; Savković, Ž.; Popović, S.; Subakov Simić, G.; Ljaljević Grbić, M. Speleomycology of Air in Stopića Cave (Serbia). Microb. Ecol. 2023. [Google Scholar] [CrossRef] [PubMed]
  43. Tourist Organization “Zlatibor”. Stopića Cave. Available online: https://www.zlatibor.org.rs/eng (accessed on 2 May 2023).
  44. Todorović, D.D.; Stojanović Krasić, M.; Jovanović, S.; Drljača, B.; Kevkić, T. A Statistical Analysis of Long-Term Grid-Connected PV System Operation in Niš (Serbia) under Temperate Continental Climatic Conditions. Appl. Sci. 2023, 13, 6229. [Google Scholar] [CrossRef]
  45. Barry, R.G. Recent advances in mountain climate research. Theor. Appl. Climatol. 2012, 110, 549–553. [Google Scholar] [CrossRef]
  46. Republic Hydrometeorogical Service of Serbia. Meteorological Annuals for 1990–2021. Available online: https://www.hidmet.gov.rs/index_eng.php (accessed on 3 May 2023).
  47. Tourist Organization “Golubac”. Golubac Fortress. Available online: https://tvrdjavagolubackigrad.rs/eng/fortress/ (accessed on 2 May 2023).
  48. Živanović, V.S.; Tošić, A.I. Influence of climatic conditions on fire risk in Djerdap National Park (Serbia): A case study of September 2011. Therm. Sci. 2020, 24, 2845–2855. [Google Scholar] [CrossRef]
  49. Höppe, P.R. The physiological equivalent temperature—A universal index for the biometeorological assessment of the thermal environment. Int. J. Biometeorol. 1999, 43, 71–75. [Google Scholar] [CrossRef] [PubMed]
  50. Parsons, K. Human Thermal Environments. The Effects of Hot, Moderate, and Cold Environments on Human Health, Comfort and Performance, 3rd ed.; CRC Press: New York, NY, USA, 2002. [Google Scholar]
  51. Çağlak, S.; Matzarakis, A. Evaluation of the relationship between thermal comfort conditions and respiratory diseases in Amasya City, Turkey. J. Public Health 2023. [Google Scholar] [CrossRef] [PubMed]
  52. Becken, S.; Hay, J. Tourism and Climate Change—Risks and Opportunities; Channel View Publications: Clevedon, UK, 2007; pp. 1–352. [Google Scholar]
  53. Mead, M.N. Benefits of Sunlight: A Bright Spot for Human Health. Environ. Health Perspect. 2008, 116, A160–A167. [Google Scholar] [CrossRef] [PubMed]
  54. An, M.; Colarelli, S.M.; O’Brien, K.; Boyajian, M.E. Why We Need More Nature at Work: Effects of Natural Elements and Sunlight on Employee Mental Health and Work Attitudes. PLoS ONE 2016, 11, e0155614. [Google Scholar] [CrossRef]
  55. Taniguchi, K.; Takano, M.; Tobari, Y.; Hayano, M.; Nakajima, S.; Mimura, M.; Tsubota, K.; Noda, Y. Influence of External Natural Environment Including Sunshine Exposure on Public Mental Health: A Systematic Review. Psychiatry Int. 2022, 3, 91–113. [Google Scholar] [CrossRef]
  56. Stanković, S. Tourist Geography of Serbia (In Serbian); Serbian Geographical Society: Belgrade, Serbia, 2013; pp. 1–238. [Google Scholar]
  57. Roshan, R.G.; Oji, R.; Fdez-Arróyabe, P. Future impact of cloudiness and wind changes on thermal comfort conditions in the city of Tabriz (Iran) in the frame of climate change. Sustain. Cities Soc. 2022, 77, 103575. [Google Scholar] [CrossRef]
  58. Huang, C.-H.; Tsai, H.-H.; Chen, H.-C. Influence of Weather Factors on Thermal Comfort in Subtropical Urban Environments. Sustainability 2020, 12, 2001. [Google Scholar] [CrossRef]
  59. Kong, F.; Singh, P.R. Chemical deterioration and physical instability of foods and beverages. In Food and Beverage Stability and Shelf Life; Kilcast, D., Subramaniam, P., Eds.; Woodhead Publishing: Cambridge, UK, 2011; pp. 29–62. [Google Scholar]
  60. Konefał, M.; Chmura, J.; Charmas, M.; Kotowska, J.; Błażejczyk, K.; Chmura, P. Lactate Threshold and Psychomotor Fatigue Threshold in Hot Conditions: Suggestions for Soccer Players Participating in the Qatar World Cup 2022. Int. J. Environ. Res. Public Health 2022, 19, 17028. [Google Scholar] [CrossRef]
  61. Jovičić, D. Tourist Geography of Serbia (In Serbian); Faculty of Geography: Belgrade, Serbia, 2009; pp. 1–301. [Google Scholar]
  62. Rezaei, J. Best-worst multi-criteria decision-making method: Some properties and a linear model. Omega 2016, 64, 126–130. [Google Scholar] [CrossRef]
  63. Triantaphyllou, E. Multi-Criteria Decision Making Methods: A Comparative Study; Springer: New York, NY, USA, 2000; pp. 1–290. [Google Scholar]
  64. Karapetrovic, S.; Rosenbloom, E.S. A quality control approach to consistency paradoxes in AHP. Eur. J. Oper. Res. 1999, 119, 704–718. [Google Scholar] [CrossRef]
  65. Salimi, N.; Rezaei, J. Evaluating firms’ R&D performance using best worst method. Eval. Program Plann. 2018, 66, 147–155. [Google Scholar] [PubMed]
  66. Rezaei, J. A Concentration Ratio for Nonlinear Best Worst Method. Int. J. Inf. Technol. Decis. Mak. 2020, 19, 891–907. [Google Scholar] [CrossRef]
  67. Salimi, N. Opportunity recognition for entrepreneurs based on a business model for sustainability: A systematic approach and its application in the Dutch dairy farming sector. IEEE Trans. Eng. Manag. 2021, 1–17. [Google Scholar] [CrossRef]
  68. Kheybari, S.; Rezaie, F.M.; Rezaei, J. Measuring the importance of decision-making criteria in biofuel production technology selection. IEEE Trans. Eng. Manag. 2019, 68, 483–497. [Google Scholar] [CrossRef]
  69. Ahmadi, H.B.; Kusi-Sarpong, S.; Rezaei, J. Assessing the social sustainability of supply chains using Best Worst Method. Resour. Conserv. Recycl. 2017, 126, 99–106. [Google Scholar] [CrossRef]
  70. Liang, F.; Brunelli, M.; Rezaei, J. Consistency issues in the best worst method: Measurements and thresholds. Omega 2020, 96, 102175. [Google Scholar] [CrossRef]
  71. Durlević, U.; Novković, I.; Lukić, T.; Valjarević, A.; Samardžić, I.; Krstić, F.; Batoćanin, N.; Mijatov, M.; Ćurić, V. Multihazard susceptibility assessment: A case study – Municipality of Štrpce (Southern Serbia). Open Geosci. 2021, 13, 1414–1431. [Google Scholar] [CrossRef]
  72. Cai, S.; Fan, J.; Yang, W. Flooding Risk Assessment and Analysis Based on GIS and the TFN-AHP Method: A Case Study of Chongqing, China. Atmosphere 2021, 12, 623. [Google Scholar] [CrossRef]
  73. Nikolić, G.; Vujović, F.; Golijanin, J.; Šiljeg, A.; Valjarević, A. Modelling of Wildfire Susceptibility in Different Climate Zones in Montenegro Using GIS-MCDA. Atmosphere 2023, 14, 929. [Google Scholar] [CrossRef]
  74. ANSI/ASHRAE Standard 55; Thermal Environmental Conditions for Human Occupancy. ASHRAE: Peachtree Corners, GA, USA, 2020.
  75. Gao, N.; Wei Shao, W.; Rahaman, S.M.; Zhai, J.; David, K.; Salim, D.F. Transfer learning for thermal comfort prediction in multiple cities. Build. Environ. 2021, 195, 107725. [Google Scholar] [CrossRef]
  76. Rutty, M.; Sccott, D. Differential climate preferences of international beach tourists. Clim. Res. 2013, 57, 259–269. [Google Scholar] [CrossRef]
  77. Rutty, M.; Sccott, D. Bioclimatic comfort and the thermal perceptions and preferences of beach tourists. Int. J. Biometeorol. 2015, 59, 37–45. [Google Scholar] [CrossRef] [PubMed]
  78. Matthews, L.; Scott, D.; Andrey, J. Development of a data-driven weather index for beach parks tourism. Int. J. Biometeorol. 2021, 65, 749–762. [Google Scholar] [CrossRef]
  79. Grillakis, M.; Koutroulis, A.; Seiradakis, K.; Tsanis, I. Implications of 2 °C global warming in European summer tourism. Clim. Serv. 2016, 1, 30–38. [Google Scholar] [CrossRef]
  80. Valjarević, A.; Morar, C.; Živković, J.; Niemets, L.; Kićović, D.; Golijanin, J.; Gocić, M.; Bursać, N.M.; Stričević, L.; Žiberna, I.; et al. Long Term Monitoring and Connection between Topography and Cloud Cover Distribution in Serbia. Atmosphere 2021, 12, 964. [Google Scholar] [CrossRef]
  81. Milentijević, N.; Valjarević, A.; Bačević, R.N.; Ristić, D.; Kalkan, K.; Cimbaljević, M.; Dragojlović, J.; Savić, S.; Pantelić, M. Assessment of observed and projected climate changes in Bačka (Serbia) using trend analysis and climate modeling. Idojaras 2022, 126, 47–68. [Google Scholar] [CrossRef]
  82. Valjarević, A.; Milanović, M.; Gultepe, I.; Filipović, D.; Lukić, T. Updated Trewartha climate classification with four climate change scenarios. Geogr. J. 2022, 188, 506–517. [Google Scholar] [CrossRef]
Figure 1. Geographical position of the Stopića Cave (1) and Golubac Fortress (2).
Atmosphere 14 01265 g001
Figure 2. Scatter diagram between tourist visits and the HERCI index.
Atmosphere 14 01265 g002
Figure 3. Linear regression between tourist visits and the HERCI index.
Atmosphere 14 01265 g003
Figure 4. Sites of natural and cultural heritage in the region of Zlatibor.
Atmosphere 14 01265 g004
Figure 5. Natural stonebridge in Dobroselica (a), Gostilje Waterfall (b), Stopića Cave (c), Museum (old village) Sirogojno (d) and church log cabin in Jablanica (e).
Atmosphere 14 01265 g005
Figure 6. Sites of natural and cultural heritage in the region of Golubac.
Atmosphere 14 01265 g006
Figure 7. Tufa accumulation near Tumane monastery (a), water mill of Vojislav Stefanović (b) and the building of the Veliko Gradište Municipal Assembly (c).
Atmosphere 14 01265 g007
Table 1. Matrix of values.
Best to othersTavgImonCCavgPsumRHavg
Tavg12345
Others to the worstTavgImonCCavgPsumRH avg
RHavg54321
Table 2. Weight coefficients of climatic elements.
CriteriaTavgImonCCavgPsumRHavg
Weights0.4160.2370.1580.1180.072
Table 3. Weighting coefficients and ratings of climatic elements.
ParameterWeight Coefficient (WC)Interval (INT)Grade (G)Grade Coefficient (GC)
Tavg (°C)0.41618–2352.08
15–18 and 23–2541.66
12–15 and 25–2731.25
5–12 and 27–2920.83
<5 and >2910.42
Imon (h)0.237>25051.18
190–25040.95
150–19030.71
80–15020.47
<8010.24
CCavg (%)0.158<4250.80
42–5240.60
52–6330.47
63–7020.32
>7010.16
Psum (mm)0.118<5050.59
50–7040.47
70–9030.35
90–11020.24
>11010.12
RHavg (%)0.07240–6850.36
30–40 and 68–7040.29
30–35 and 70–7530.22
25–30 and 75–8520.14
<25 and >8510.07
Table 4. Classification of HERCI index values.
HERCI Index ValuesDescriptionLabel
<1.86Extremely unfavorable
1.86–2.59Unfavorable
2.6–3.39Acceptable
3.4–4.35Favorable
>4.35Very favorable
Table 5. Average values of climate elements for the meteorological station Zlatibor in 1990–2021 [46].
ParameterJanFebMarAprMayJunJulAugSepOctNovDec
Tavg−1.7−0.42.97.612.416.218.218.313.49.04.4−0.9
GC0.420.420.420.831.251.662.082.081.250.830.420.42
Imon90.4107.7149.3167.2209.4242.1276.1270.1192.4160.3106.975.4
GC0.470.470.470.710.950.951.181.180.950.710.470.24
CCavg656361615952454152546266
GC0.320.470.470.470.470.470.60.80.60.470.470.32
Psum63.969.380.181.5101.5111.097.472.794.381.880.683.4
GC0.470.470.350.350.240.120.240.350.240.350.350.35
RHavg83.278.973.569.670.671.769.368.274.177.579.985.1
GC0.140.140.220.290.220.220.290.290.220.140.140.07
HERCI1.821.971.932.653.133.424.394.73.262.51.851.4
Table 6. Average monthly tourism visitations in 2012–2021 [43].
ParameterJanFebMarAprMayJunJulAugSepOctNovDec
Tourism visitations201324691250404671085687907515,1425898441023341343
Table 7. Average values of climate elements for the meteorological station Veliko Gradište in 1990–2021 [46].
ParameterJanFebMarAprMayJunJulAugSepOctNovDec
Tavg0.52.36.812.217.020.822.622.217.111.97.01.7
GC0.420.420.831.251.662.082.082.081.660.830.830.42
Imon68.999.4160.9196.5236.9268.5302.1291.9205.1157.193.458.3
GC0.240.470.710.950.951.181.181.180.950.710.470.24
CCavg716256555345383447516172
GC0.160.470.470.470.470.60.80.80.60.60.470.8
Psum46.642.241.456.571.574.177.251.256.654.145.152.0
GC0.590.590.590.470.350.350.350.470.470.470.590.47
RHavg83.077.768.967.669.970.767.867.571.675.379.284.1
GC0.140.140.290.360.290.220.360.360.220.140.140.14
HERCI1.552.092.893.53.724.434.774.893.92.752.52.07
Table 8. Average monthly tourism visitations in 2019–2022 [47].
ParameterJanFebMarAprMayJunJulAugSepOctNovDec
Tourism visitations166730623496930018,17017,13120,78530,02115,49513,58057681907
Table 9. List of heritage sites in the Zlatibor region.
NumberNameHeritage
1Church log cabin in JablanicaCultural
2Viewpoint Obadovo brdoNatural
3Viewpoint Gradina
4Villa of the presidency of the governmentCultural
5King’s drinking fountain
6The monument on the hill Šumatno
7Stopića CaveNatural
8Museum “Staro selo” (old village) SirogojnoCultural
9Church of Saints Peter and Paul
10Natural stonebridge in DobroselicaNatural
11Church log cabin in DobroselicaCultural
12The house of national hero Sava Jovanović
13Native house of Dimitrije Tucović
14Gostilje Waterfall Natural
Table 10. List of heritage sites in the Golubac region.
NumberNameHeritage
1Archaeological site OstrovoCultural
2Saint Nicholas Church
3The old house of Svetomir Miladinović
4Boris Kidrič Square
5Church of St. Archangel Gabriel
6The building of the Veliko Gradište Municipal Assembly
7Archaeological site Pinkum
8Old power plant
9Water mill of Vojislav Stefanović
10Church of the Holy Prophet Jeremiah
11Archaeological site Umka—Kuzmino brdo
12The house of Jelica Stričević
13Building in Golubac
14The building in Veljka Dugoševića Street
15Saint Nicholas Church
16Milan Gajić’s old house
17Golubac Fortress
18Tufa accumulation near Tumane monasteryNatural
Disclaimer/Publisher’s Note: The statements, opinions and data contained in all publications are solely those of the individual author(s) and contributor(s) and not of MDPI and/or the editor(s). MDPI and/or the editor(s) disclaim responsibility for any injury to people or property resulting from any ideas, methods, instructions or products referred to in the content.

