
Agricultural Water Deficit Trends in Yemen

Food and Agriculture Organization of the United Nations, Mohamed Thamer Building Faj Attan, Hadda, Sana’a P.O. Box 1867, Yemen
*
Author to whom correspondence should be addressed.
Atmosphere 2023, 14(8), 1263; https://doi.org/10.3390/atmos14081263
Submission received: 5 June 2023
/
Revised: 13 July 2023
/
Accepted: 20 July 2023
/
Published: 9 August 2023
(This article belongs to the Special Issue Agrometeorology, Agricultural Water Management and Impacts of Extreme Events)
Abstract
:Globally, climate change is triggering shifts in water availability, especially across arid and desert landscapes similar to that in Yemen, where precipitation patterns are increasingly erratic. Here, we use water budget calculations, drought metrics, and trend analyses to examine climatic water deficits, with the aim of unraveling irrigation demands and overall water stress across Yemen. The results indicate that 94% of the influx is lost back to the atmosphere via evapotranspiration, 6% is converted to runoff, and only a negligible amount, generally less than 1%, is retained as storage. The results also show an unrelenting, statistically significant water deficit increase of 0.17 mm yr−1 on the Sen’s slope, at the critical Z-value of 0.005 across the country, for the past 63 years. Our findings challenge the conventional understanding of water deficits across Yemen and suggest that the country’s water resources situation is direr than was earlier documented. Further results show that while the water shortage mosaic across the country experiences interannual variations, their occurrence is significantly intensifying. As such, an immediate and radical modernization of integrated water management systems, including concerted investments in irrigation and artificial recharge wells, especially across the Arabian Sea Coast, the Red Sea Coast, and the Highlands, is strongly recommended.
1. Introduction
Water security has been the subject of much systematic scrutiny because of the risk that climate change poses to freshwater resources. This subject matter has also taken center stage in policy dialogs, due to its close links with agriculture, food (in)security, and poverty reduction [1,2,3]. While water security is a broad term that includes both physical water scarcity and quality, the present study focuses on the physical aspects relating to the mismatch between freshwater availability and demand.
An estimated 4 billion people are currently subjected to severe water shortages across the world [4]. The Middle East and North Africa (MENA) region is especially impacted by critical shortages. With 82% of the globe’s most water-stressed countries in the MENA region, the area is currently the most water-stressed in the world; at the top of the table are Kuwait, the United Arab Emirates, Saudi Arabia, Libya, Qatar, Yemen, and Algeria [5]. Given MENA’s exposure to frequent drought and extreme heat [6], water-access disparities are growing rapidly in the region and small-scale farmers who rely on rainfed agriculture are among the most seriously affected. The situation is projected to worsen as the region develops into a global drought hotspot [7], thus pointing to the need for accurate and regular water accounting across the region.
Regular water accounting can aid in the decision-making related to irrigation, especially in MENA countries such as Yemen, which rely on rainfall for much of their agricultural activities, which include the production of cereals, cash crops, vegetables, and the rearing of livestock. However, given its widespread aridity [8], most rainfed agricultural activities in Yemen are concentrated in coastal areas and the Highlands, where the interlinkages between water availability and erratic rainfall negatively affect yield, thus necessitating frequent water budget monitoring.
Frequent terrestrial water budget monitoring can deepen the policymakers’ understanding of trends, fluctuations, and the drivers of water deficits, which can, in turn, support the devising of strategies to address hydrological imbalances in agricultural rainfed systems. This is especially critical considering the fact that with climate change, aridity is projected to more than double in the future across much of the landmass in MENA [9,10]. This aridification will be accompanied by more frequent droughts, intensified by higher-than-usual temperatures, especially in the Middle East [11]. With this background, studies focusing on water budget analysis for countries in the Middle East are crucial for informing governments, regional organizations, and international stakeholders, enabling them to collaborate and implement sustainable water management strategies that seek to alleviate water stress in the region. For example, the authors of [12] found a negative trend of 0.5 cm yr−1 in groundwater levels in the United Arab Emirates (UAE) and used these findings to propose interventions for the sustainable use of water resources in the UAE. In a similar study, the authors of [13] used a probabilistic framework for water budget estimation to show that accuracy of evapotranspiration estimations is more critical than other components for water budget analysis in the region.
Water budget analysis is even more critical in Yemen, where water scarcity is a driver of and contributor to conflicts. The overexploitation of groundwater is widespread, thus leading to declines in groundwater levels in all major agricultural areas [14]. Droughts are further compounding this situation; almost every year, this conflict-prone country reels under months of severe to extreme drought. Competition for water leads to localized conflict and sparks demonstrations that have the potential to grow into small riots [15]. Water-related conflicts are estimated to cause around 4000 deaths a year, in addition to leading to the destruction of water infrastructure, such as wells, pumps, etc. Water scarcity is, therefore, considered a human security challenge in Yemen [16]. Unless interventions are intensified in a conflict-sensitive manner that takes into account how the overexploitation and mismanagement of water resources drive conflict, Yemen’s massive population growth will contribute to aggravating water demand, potentially strain water supplies further, and lead to further conflict.
In the present study, we examine water deficits in Yemen (Figure 1). Yemen is ranked the sixth most critically affected country by water stress globally [5], and its high vulnerability to climate-change-driven extreme events renders the country one of the most food insecure in the MENA region and also globally. Despite humanitarian interventions, an estimated 17 million people in Yemen remain food insecure, with unprecedented undernutrition levels [17]. Many scientists and policymakers agree that the agricultural sector of Yemen remains fundamental to addressing the livelihood and food security challenges of the most vulnerable populations, especially considering that agriculture is practiced by 70% of the rural population, of which 85% are women [18,19]. However, agricultural production and yield variations are largely impeded by rudimentary agricultural practices, poor soils, and water deficits across the country’s varying agro-ecological zones (Figure 1). Despite these challenges, there is scant literature on the subject matter. A few studies that exist have also neglected to confirm their analyses of remote sensing datasets with fieldwork, thus leading to generalized results. The main goal of the present study is to unravel irrigation demands and overall water stress across Yemen. We begin by assessing water deficit trends at the country level before focusing on the three main agricultural areas of the country: the Arabian Sea Coast, the Red Sea Coast, and the Highlands. We then supplement data analyses with field visits, to provide a novel contribution to the literature on the current water stress situation across the country. We end the study by proposing strategic interventions that can be used to address the ongoing water challenges in Yemen. The findings from this study will be applicable to other Middle East countries by informing the selection of an optimal allocation of this limited resource, thereby optimizing agricultural productivity.
2. Data Sources and Methods
In the present study, we used TerraClimate, a high-resolution climatic water balance dataset that spans global terrestrial surfaces and covers the period from 1958 to the near-present (Table 1; [20]). With a 1/24th degree longitude x latitude spatial resolution (~4 km), TerraClimate is one of the largest climatic water balance datasets available and is widely used in hydroclimatic studies [21,22]. Apart from its high resolution and long temporal coverage, TerraClimate was used in the present study because Yemen is a highly data-scarce country; therefore, water budgeting studies are difficult and they remain an unresolved problem, with implications for surface water supplies, crop yields, and, by extension, food security. Furthermore, the dataset has been found to show reasonable consistency with the in situ datasets for Brazil [23], Columbia [24], and in the MENA region, where it was found to have a very small absolute error [7].
To quantify agricultural water deficits, we used climatic water deficit (CWD) as a surrogate. We defined CWD as the annual evaporative demand exceeding available water across the study area [25]. Therefore, we considered CWD as the difference between potential and actual evapotranspiration [26]. Given the processes that drive evapotranspiration, CWD, by its very nature, incorporates soil moisture fluctuations, hydraulics, climate variability, and solar radiation. CWD can, therefore, be thought of as a critical indicator of soil moisture levels, groundwater recharge, and the irrigation demand necessary to offset agricultural water deficits [27]; thus, the greater the CWD across the area of interest, the more severe the agricultural water deficit [28]. In addition to CWD, all three key hydrological fluxes, i.e., precipitation, evapotranspiration, and runoff, as simulated by a modification of the Thornthwaite–Mather climatic water-balance model [29], were analyzed in the current study (see Table 1). Given the statistical relationships between wind speed and actual evapotranspiration [30], we hypothesized that changes in wind speed would lead to near-equal changes in evapotranspiration and, thus, the water balance. Therefore, we also examined wind speed data across the study area. Finally, we substantiated our data collection with a site visit to one of the most water-stressed regions of the country.
We note that while CWD is an effective measure of agricultural water stress, it does not sufficiently represent the soil’s water-holding capacity. To ensure that our findings are robust, we adopted the water budget calculation and calculated water storage (ΔS) by subtracting the output flux (i.e., the combination of actual evapotranspiration and runoff) from the input flux, with the assumption of a steady state. Mathematically, this can be represented as given in Equation (1):
where ΔS is the change in water storage, P is the input flux, i.e., precipitation, Q is the runoff, and Ea is actual evapotranspiration.
ΔS = P − Q − Ea
We also assessed changes in the severity of agricultural water stress during drought years. To achieve this, we employed the standardized precipitation index (SPI) [31]. SPI is widely used and is convenient for categorizing droughts [32,33], especially in data-scarce regions such as Yemen, because it is based on precipitation data only. The index compares annual average precipitation before fitting it to a gamma distribution and then transforming it to a normal distribution, using an equal-probability transformation [34]. The average is then fitted to zero, with above-zero values indicating wetter or flood years, while below-zero values denote drought years. Mathematically, SPI can be expressed as shown in Equation (2):
where refers to the gamma function, and x is the amount of precipitation in mm, thus implying x > 0, a is the shape parameter, and is the scale parameter . Table 2 summarizes the classification of drought severity on an annual basis, as used in this study [31].
To quantify trends in the different fluxes, while at the same time ensuring that the effect of autocorrelation is accounted for, we used the modified Mann–Kendall trend test (m-MK) [35]. All calculations were performed using the ‘modifiedmk’ package in the R programming language [36]. The hypotheses we employed in this study were as follows:
H0 natural randomness;
H1 monotonic trend present.
Mathematically, the calculation of the m-MK test can be expressed using Equation (3):
where Ri refers to the rank of the detrended time series, n refers to the length of the time series, and is the inverse standard normal distribution function, with a mean of zero and a standard deviation of 1.
After assessing the trends in the different hydrological fluxes using the m-MK trend test, we employed the sequential Mann–Kendall (MK) test, as proposed in the work of [37] to detect abrupt changes in the fluxes. The sequential Mann–Kendall test considers the progressive row of Kendall’s normalized tau ( coefficient), which is also referred to as the forward statistic u(t), and the retrograde row of Kendall’s normalized tau, i.e., the backward statistic u’(t). The Boolean vector is then used to indicate at which indices of the original time series the progressive and retrograde cross, which is considered TRUE at the point of abrupt changes [38]. To compute the sequential Mann–Kendall test, we used the Pheno package [39] in the R programming language [36].
We also used correlation coefficients (R) to disentangle the linear relationship between several variables, including, but not limited to, water deficits and wind speed.
3. Results and Discussion
3.1. Country-Level Terrestrial Water Budget Variability
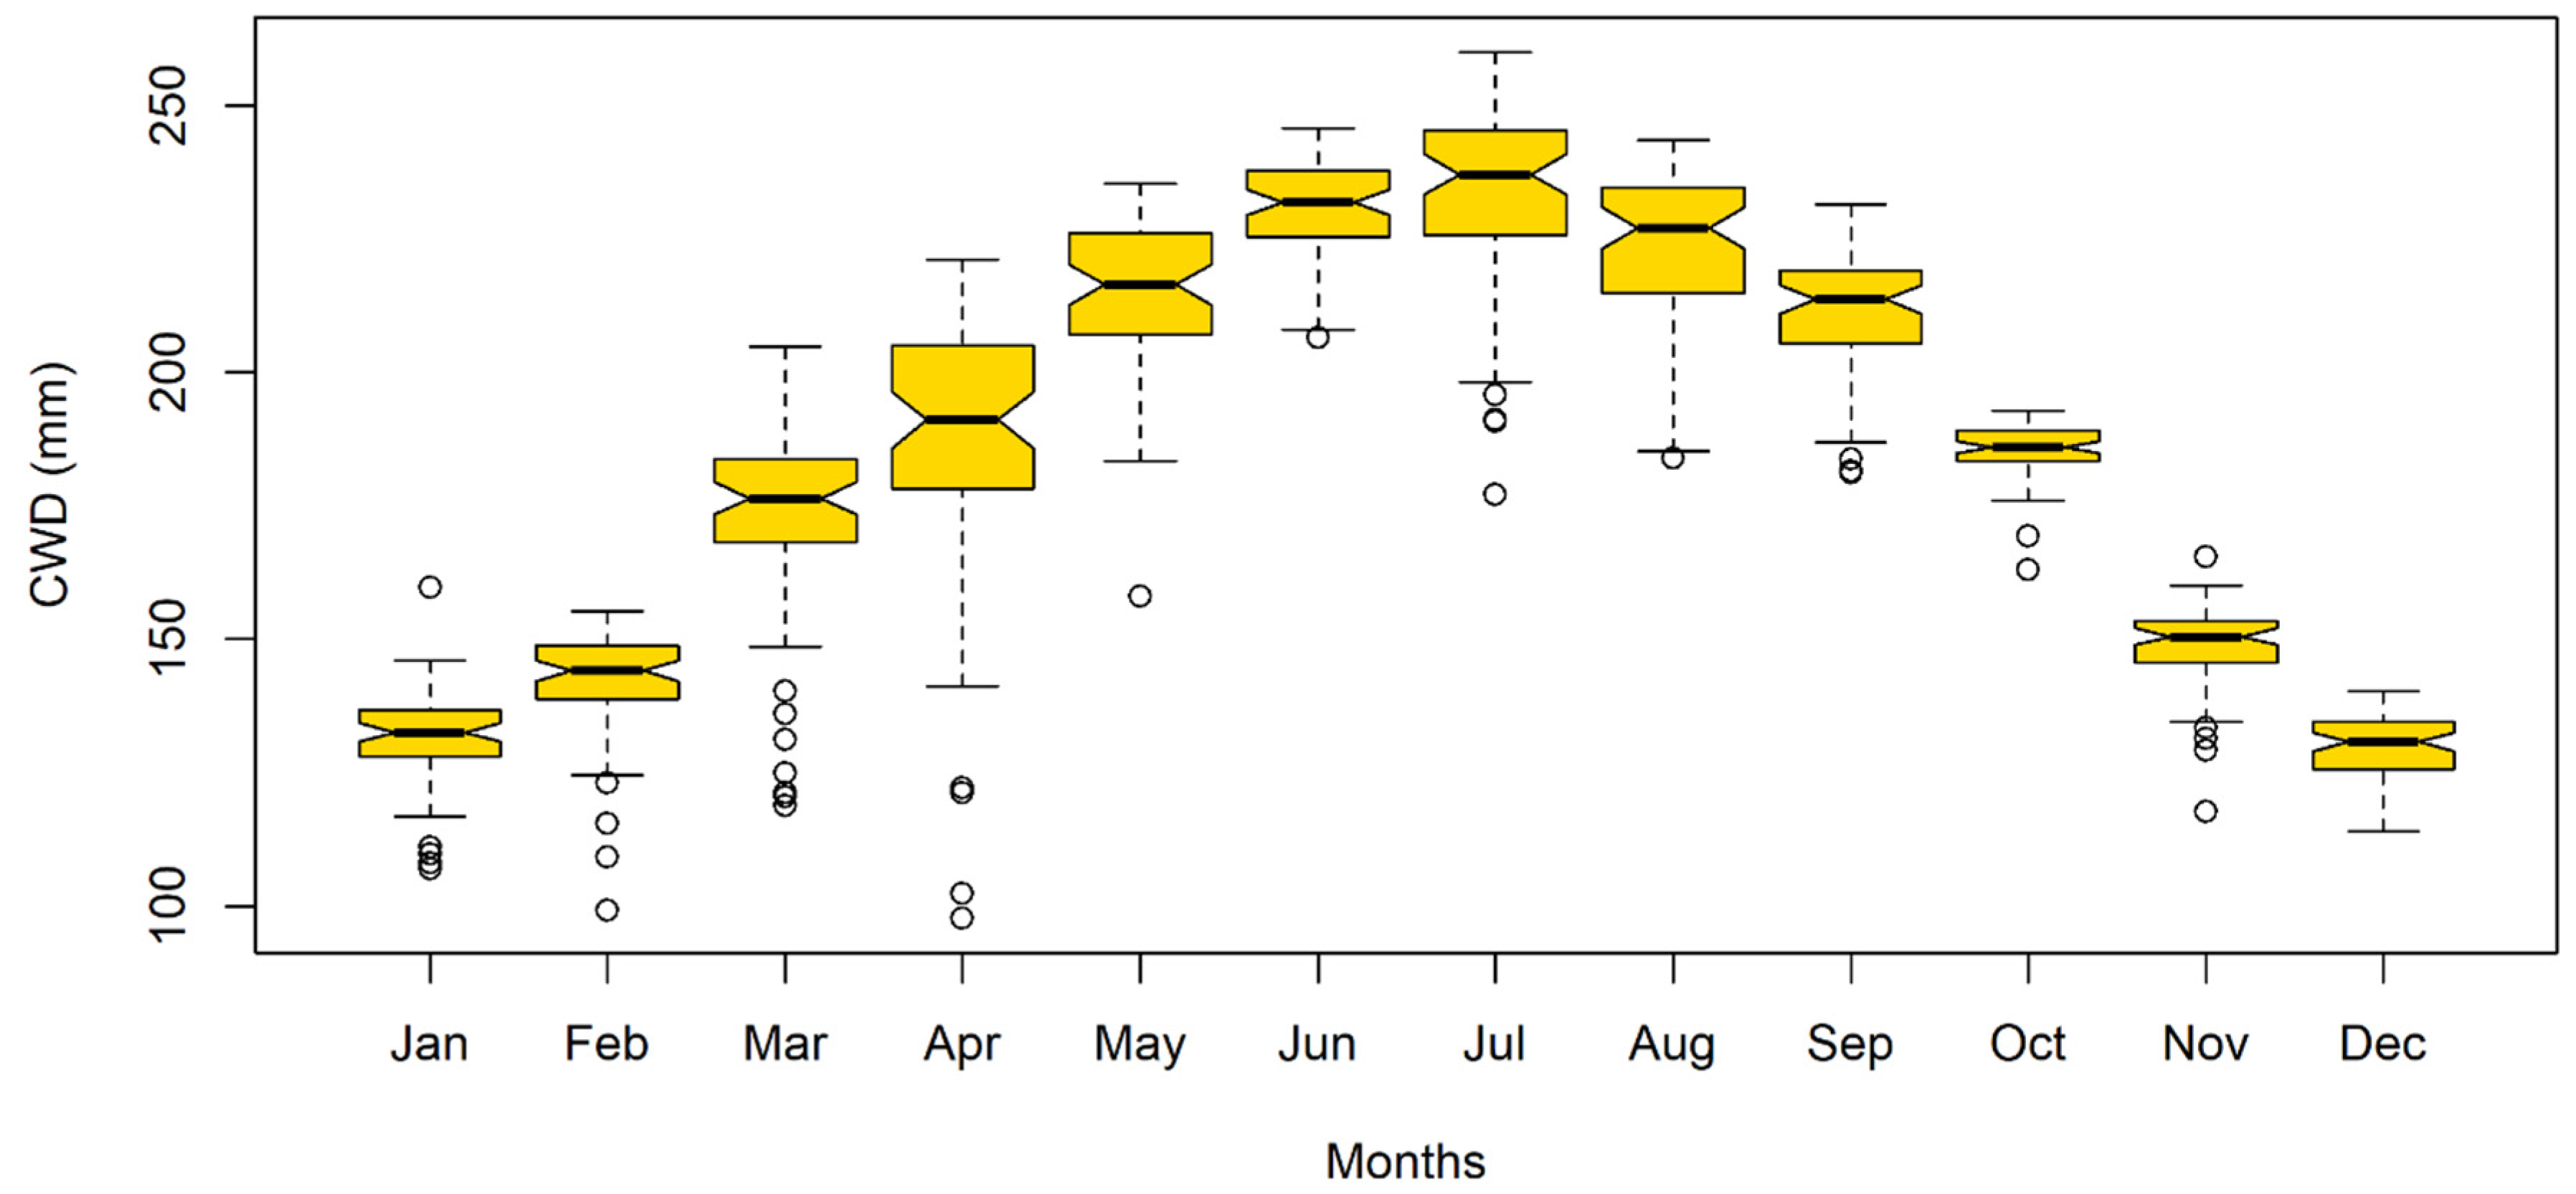
In the first set of analyses, we examined the long-term monthly cycle of water deficits across the country. We found mean monthly water deficits ranging between 97 and 260 mm (Figure 2). We further observed that while the country is characterized by water deficits that are generally over 100 mm throughout the year, intensification begins soon after the winter season, around March/April, suggesting that the warming up of temperatures triggers an intensification of water deficits. In a nutshell, while climate change impacts the global hydrological cycle in complex ways [40], evidence suggests that warmer temperatures are associated with higher evaporative rates, which lead to intensified water deficits, especially in arid environments [41,42]. With a statistically significant correlation coefficient of 0.8 at α = 0.005, further evidence shows that the intensification of water deficits is associated with a rise in wind speed across the country (Figure 3). This finding points to the effect of wind speed on evapotranspiration and, thus, CWD [31].
Our findings further show that the rise in water deficits continues and reaches its peak in July, when maximum deficits of up to 260 mm are experienced (Figure 3). From August, a gradual and steady improvement is noticeable, although the country remains generally water-stressed throughout the year. The observation that the strain on water resources begins as early as March of each year is counterintuitive since rains, especially across the Highlands, begin in March as the Red Sea Convergence Zone-triggered Saif rainy season is ushered in [43]. As such, the intensification of water deficits at the onset of the rainy season can be attributed to there being very little effective rainfall.
However, the intensification of water deficits during the rainy season presents an opportunity for a radical modernization of integrated water management systems in Yemen. For instance, during downpours, rainwater can be contained and stored for irrigation. In addition to rainwater harvesting, the traditional diversion of stormwater has been found useful in many arid regions [44]. However, it is notable that the identification of suitable sites for effective rainwater harvesting or the practice of spate irrigation may be a challenge, especially for small-scale farmers, as the use of geographical information systems and hydrological models may be necessary [45]. To bridge this gap, studies that focus on providing information regarding the spatial differences in rainfall regimes, slope, soil type, land use, land cover, and finally, distance to water bodies are indispensable [46]. Equally important is the provision of this information to small-scale farmers in a non-technical way.
The planting of native and drought-tolerant grasses, shrubs, and trees is another way of enhancing integrated water management, the protection of ecosystems, and combating drought because this measure increases localized rainfall activities [47].
Analyzing the interannual variability of water deficits, we found that even during wet years, the rainfall received across much of Yemen is insufficient to offset deficits (Figure 4). Notably, we found a correlation coefficient of −0.7 between SPI and CWD suggesting that although the direction of the linear relationship between the two variables is as expected, the strength is weak thus adding credence to the earlier observation that the rainfall received across Yemen does not sufficiently offset water deficits. Furthermore, from 1958 to the near present, there have only been two flood events that managed to bring water deficits down to less than 170 mm; these are the extreme wet years of 1963 and 1983 when mean average water deficits were 165 and 164 mm respectively. The highest mean annual deficit of ~194 mm was reported during the severely dry years of 2012, 2014, and 2015 (Figure 4).
Results of the SPI also show that although Yemen experiences more near-normal years, it is characterized by extreme precipitation events. Specifically, in the past 63 years, the country has experienced 8 years of severe drought (i.e., 2012, 2014, 1984, 1980, 2013, 2015, 2008, and 2003), 46 near normal years, 5 moderately wet years (i.e., 1961, 1989, 2020, 2016, and 1964), 3 severely wet years (1967, 1968, and 2018), and 2 extremely wet years (1983 and 1963). While the country experienced 10 years of above-normal rainfall, our findings demonstrate that much of the rainfall received is insufficient to offset deficits (Figure 4). The observed droughts and concomitant water shortages have dried up dams in critical agricultural hotspots such as the Abyan governorate along the Arabian Sea Coast (see Figure 1), thus forcing many farmers to give up their profession, and a 33% decline in cultivated land was recently observed across greater Sana’a due to constrained access to water [48].
With climate change, water deficits are projected to worsen in the future with dire implications for the water-food security nexus [49]. The current and projected water insecurities, therefore, bring into question Yemen’s capacity to safeguard sustained access to adequate quantities of agricultural water for sustaining livelihoods, socioeconomic development, and overall well-being. Foremost in addressing the current and projected water supply challenges in Yemen is a concerted investment in access to water and climate data, strategic information, and systematic tools that address trade-offs [4].
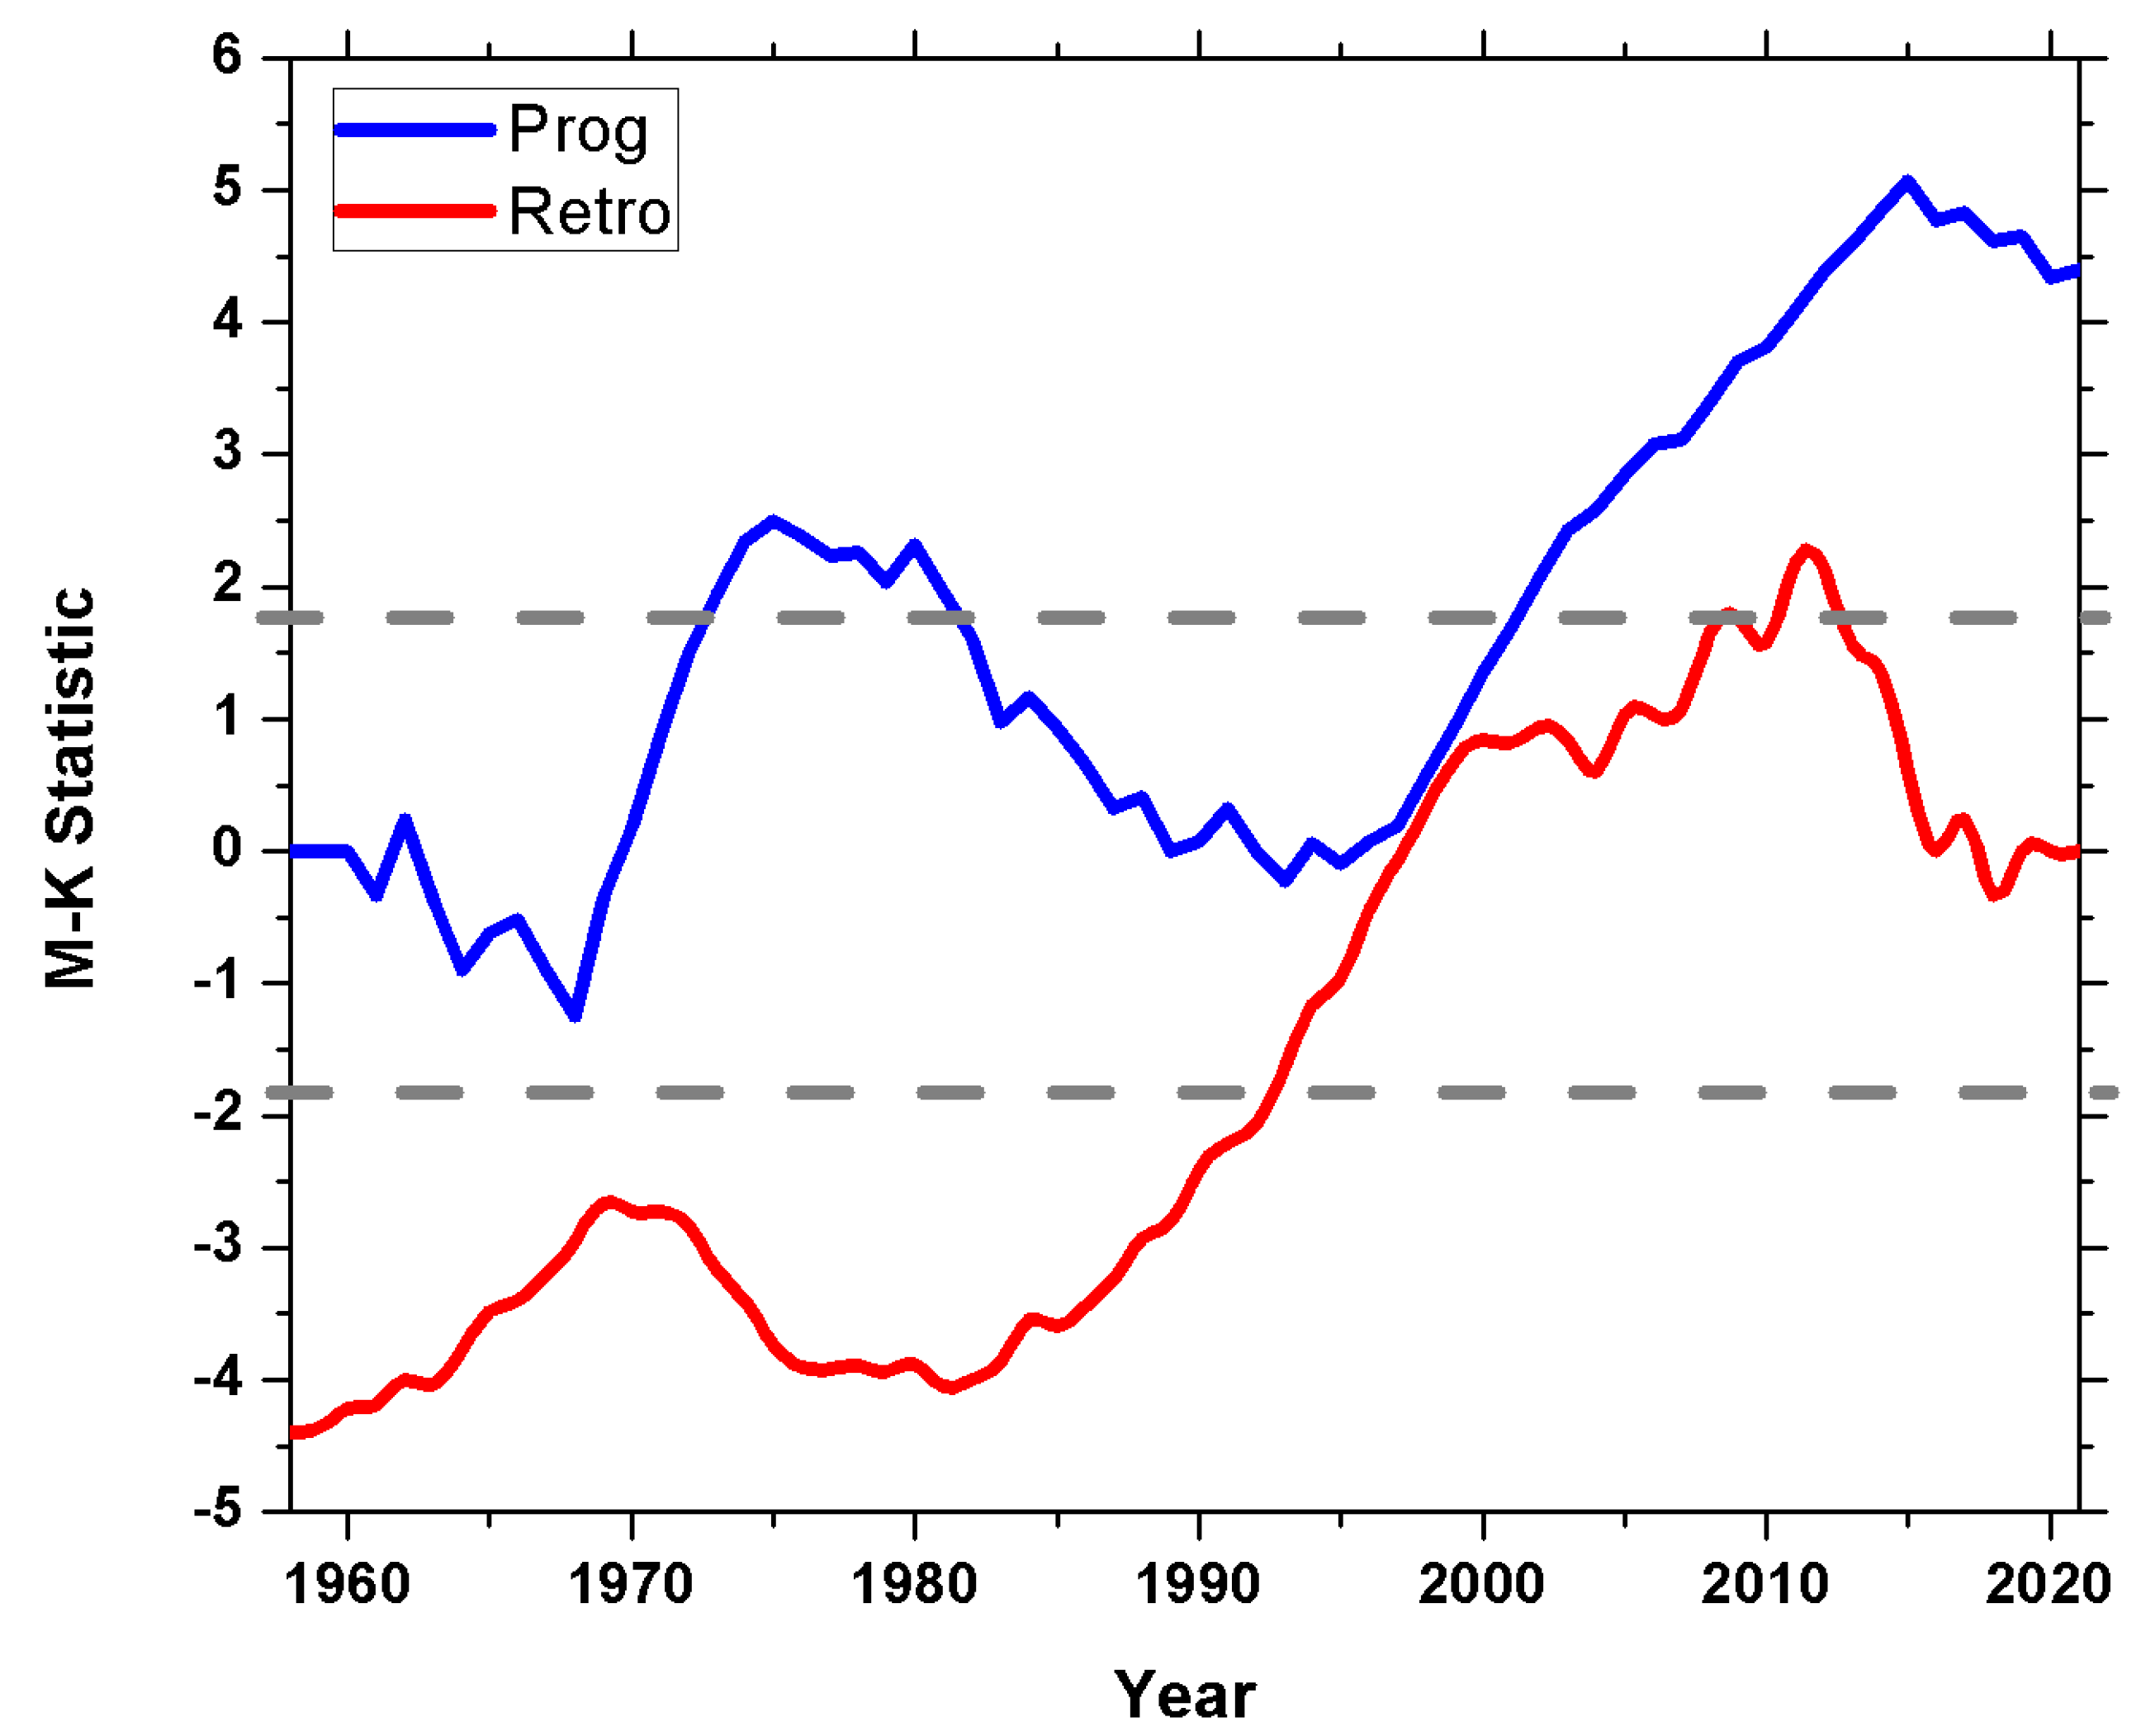
Notwithstanding the two major CWD drops during the extreme wet years of 1963 and 1983, the trends show a constant increase, with a Sen’s slope of 0.17 which is significant at the critical Z-value of 0.005 (Figure 5). These findings suggest that while the water shortage mosaic across the country experiences interannual variations, there is a significant intensification in their occurrence. Furthermore, results from the sequential Mann–Kendall test show that since 1958, there have been no sudden changes in the upward trend of water deficits (Figure 6). The absence of sudden changes indicates that the rise is persistent, and this is a good indicator of future water deficits across the country. Conclusively, these findings point to a drier Yemen in the future. Therefore, unless sustainable water management interventions are taken, especially in basins similar to Sana’a, where unsustainable water use is widespread, the government and local communities risk losing a substantial source of livelihood and revenue in the future.
Our findings regarding sustained water deficits amid increasingly severe droughts are consistent with those of the authors of [48], who employed remote sensing techniques to study water resources in the Sana’a region and found deficits of between 500 and 723 mm3 between 2007 and 2018. In a similar study, the authors of [50] attributed the continued rise in water scarcity across Yemen to uncontrolled agricultural practices and the demographic changes propelled by rapid population increases. Overall, increased water deficits, droughts, and temperature increments have been reported by several studies across the country [51,52,53].
Of the 114 mm of mean annual rainfall received across the country, 108 mm, representing 94% of the influx, is lost back to the atmosphere via evapotranspiration (Figure 7). Generally, 7 mm, representing 6% of the influx, is converted to runoff, and only a negligible amount of 0.02 mm, representing less than 1%, is retained as storage. Our findings are consistent with those reported in [54], where the authors observed that in arid environments, over 90% of the precipitation is lost via evapotranspiration. Similar findings were noted in the nearby United Arab Emirates, where a negative trend of 0.5 cm yr−1 in groundwater levels was found; this would translate into aquifers not being recharged rapidly enough to compensate for human withdrawals, compounded by extremely high evapotranspiration rates [12]. Furthermore, the findings in this study demonstrate that while evapotranspiration is one of the most important components of the water cycle, due to its close links to atmospheric and surface energy budgets [55], it is responsible for much of the water loss across Yemen and remains the major contributor to agricultural water deficits. Given the statistically significant interlinkage between temperature and evapotranspiration, the findings in this study suggest that the current global warming that is underway is enhancing evapotranspiration and, as a result, water deficits across the country. In a nutshell, as the temperature increases, evapotranspiration demand equally increases, due to the increase in the amount of energy present to convert water to water vapor [56,57].
Our observation that less than 1% of rainfall is retained as storage points to a general lack of groundwater recharge across much of Yemen. In many countries, recharge, i.e., the addition of rainwater to aquifers through the unsaturated zone, helps to counterbalance the depletion of groundwater and, thus, mitigates the adverse effects of climate change-induced water deficits [58,59]. However, in the case of Yemen, our results show that on average, very little to no recharge occurs across the country, thus necessitating the need for artificial groundwater recharge. Some of the most prominent practices for increasing the amount of water that enters aquifers include the strategic establishment of injection wells to the subsurface and the redirection of water through canals [60]. Since much of the water is lost through evapotranspiration, human-controlled recharge shows much promise as a water conservation technique since the water is stored immediately after it rains and before it evaporates. In fact, a recent study in the neighboring country of Saudi Arabia shows that the strategic drilling of wells for artificial recharge reduces evaporation loss by 86% and increases groundwater recharge by 44% [61].
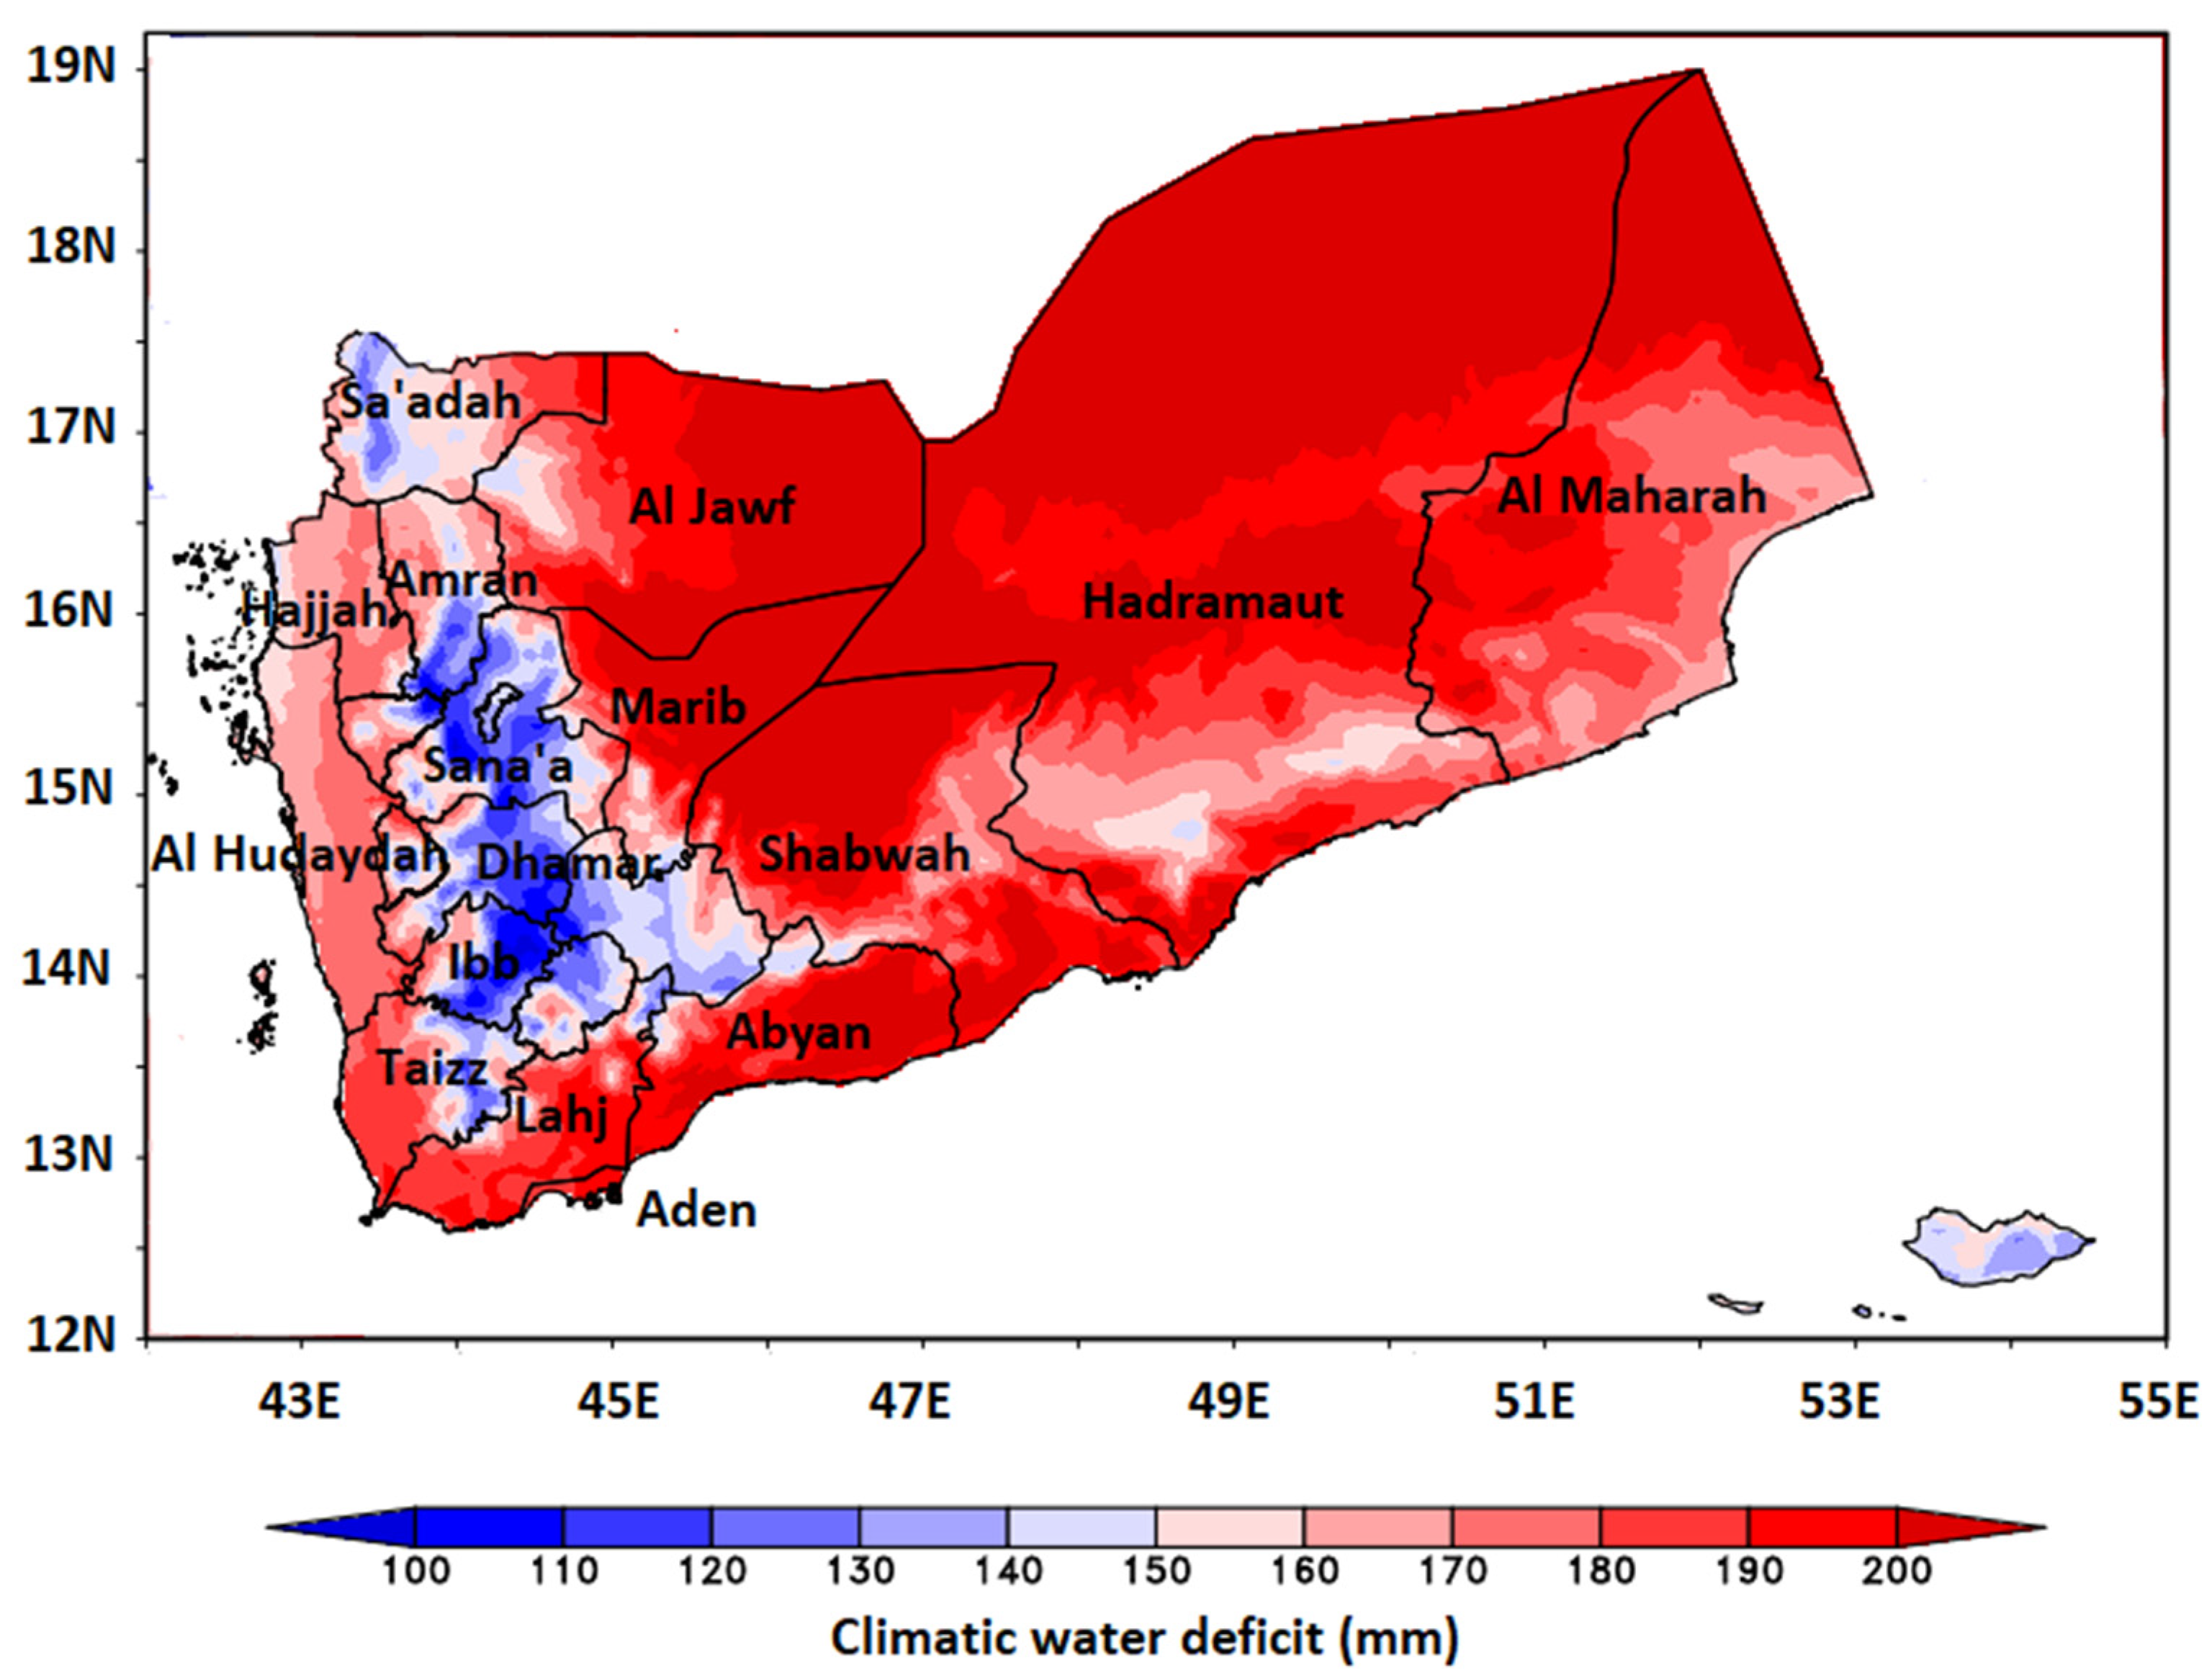
With mean annual water deficits ranging between 100 and 150 mm, results indicate that the Highlands are the least water-stressed region (Figure 8). However, considering that much of the agricultural activities occur across the western parts of the country, the Highlands are heavily abstracted, and the depletion rate of groundwater in this area is higher than across other parts of the country; sharp declines have especially been reported in Sa’dah, Taiz, and Amran [44]. The decline in groundwater is likely compounded by near-zero recharge rates as much of the water is lost via evapotranspiration processes (see Figure 7).
Other parts of the country that are severely stressed include the Eastern Dry Zone (see Figure 1), a desertic landscape where the mean annual water deficits are generally over 200 mm. Similarly, parts of the Arabian Sea coast, especially along the coastal areas of Abyan, Shabwah, and Hadramaut, are severely water-stressed (Figure 8). Since little to no agriculture is practiced across the Eastern Dry Zone, water conservation efforts should focus on the western parts of the Arabian Sea coast, the Red Sea coast, and the Highlands.
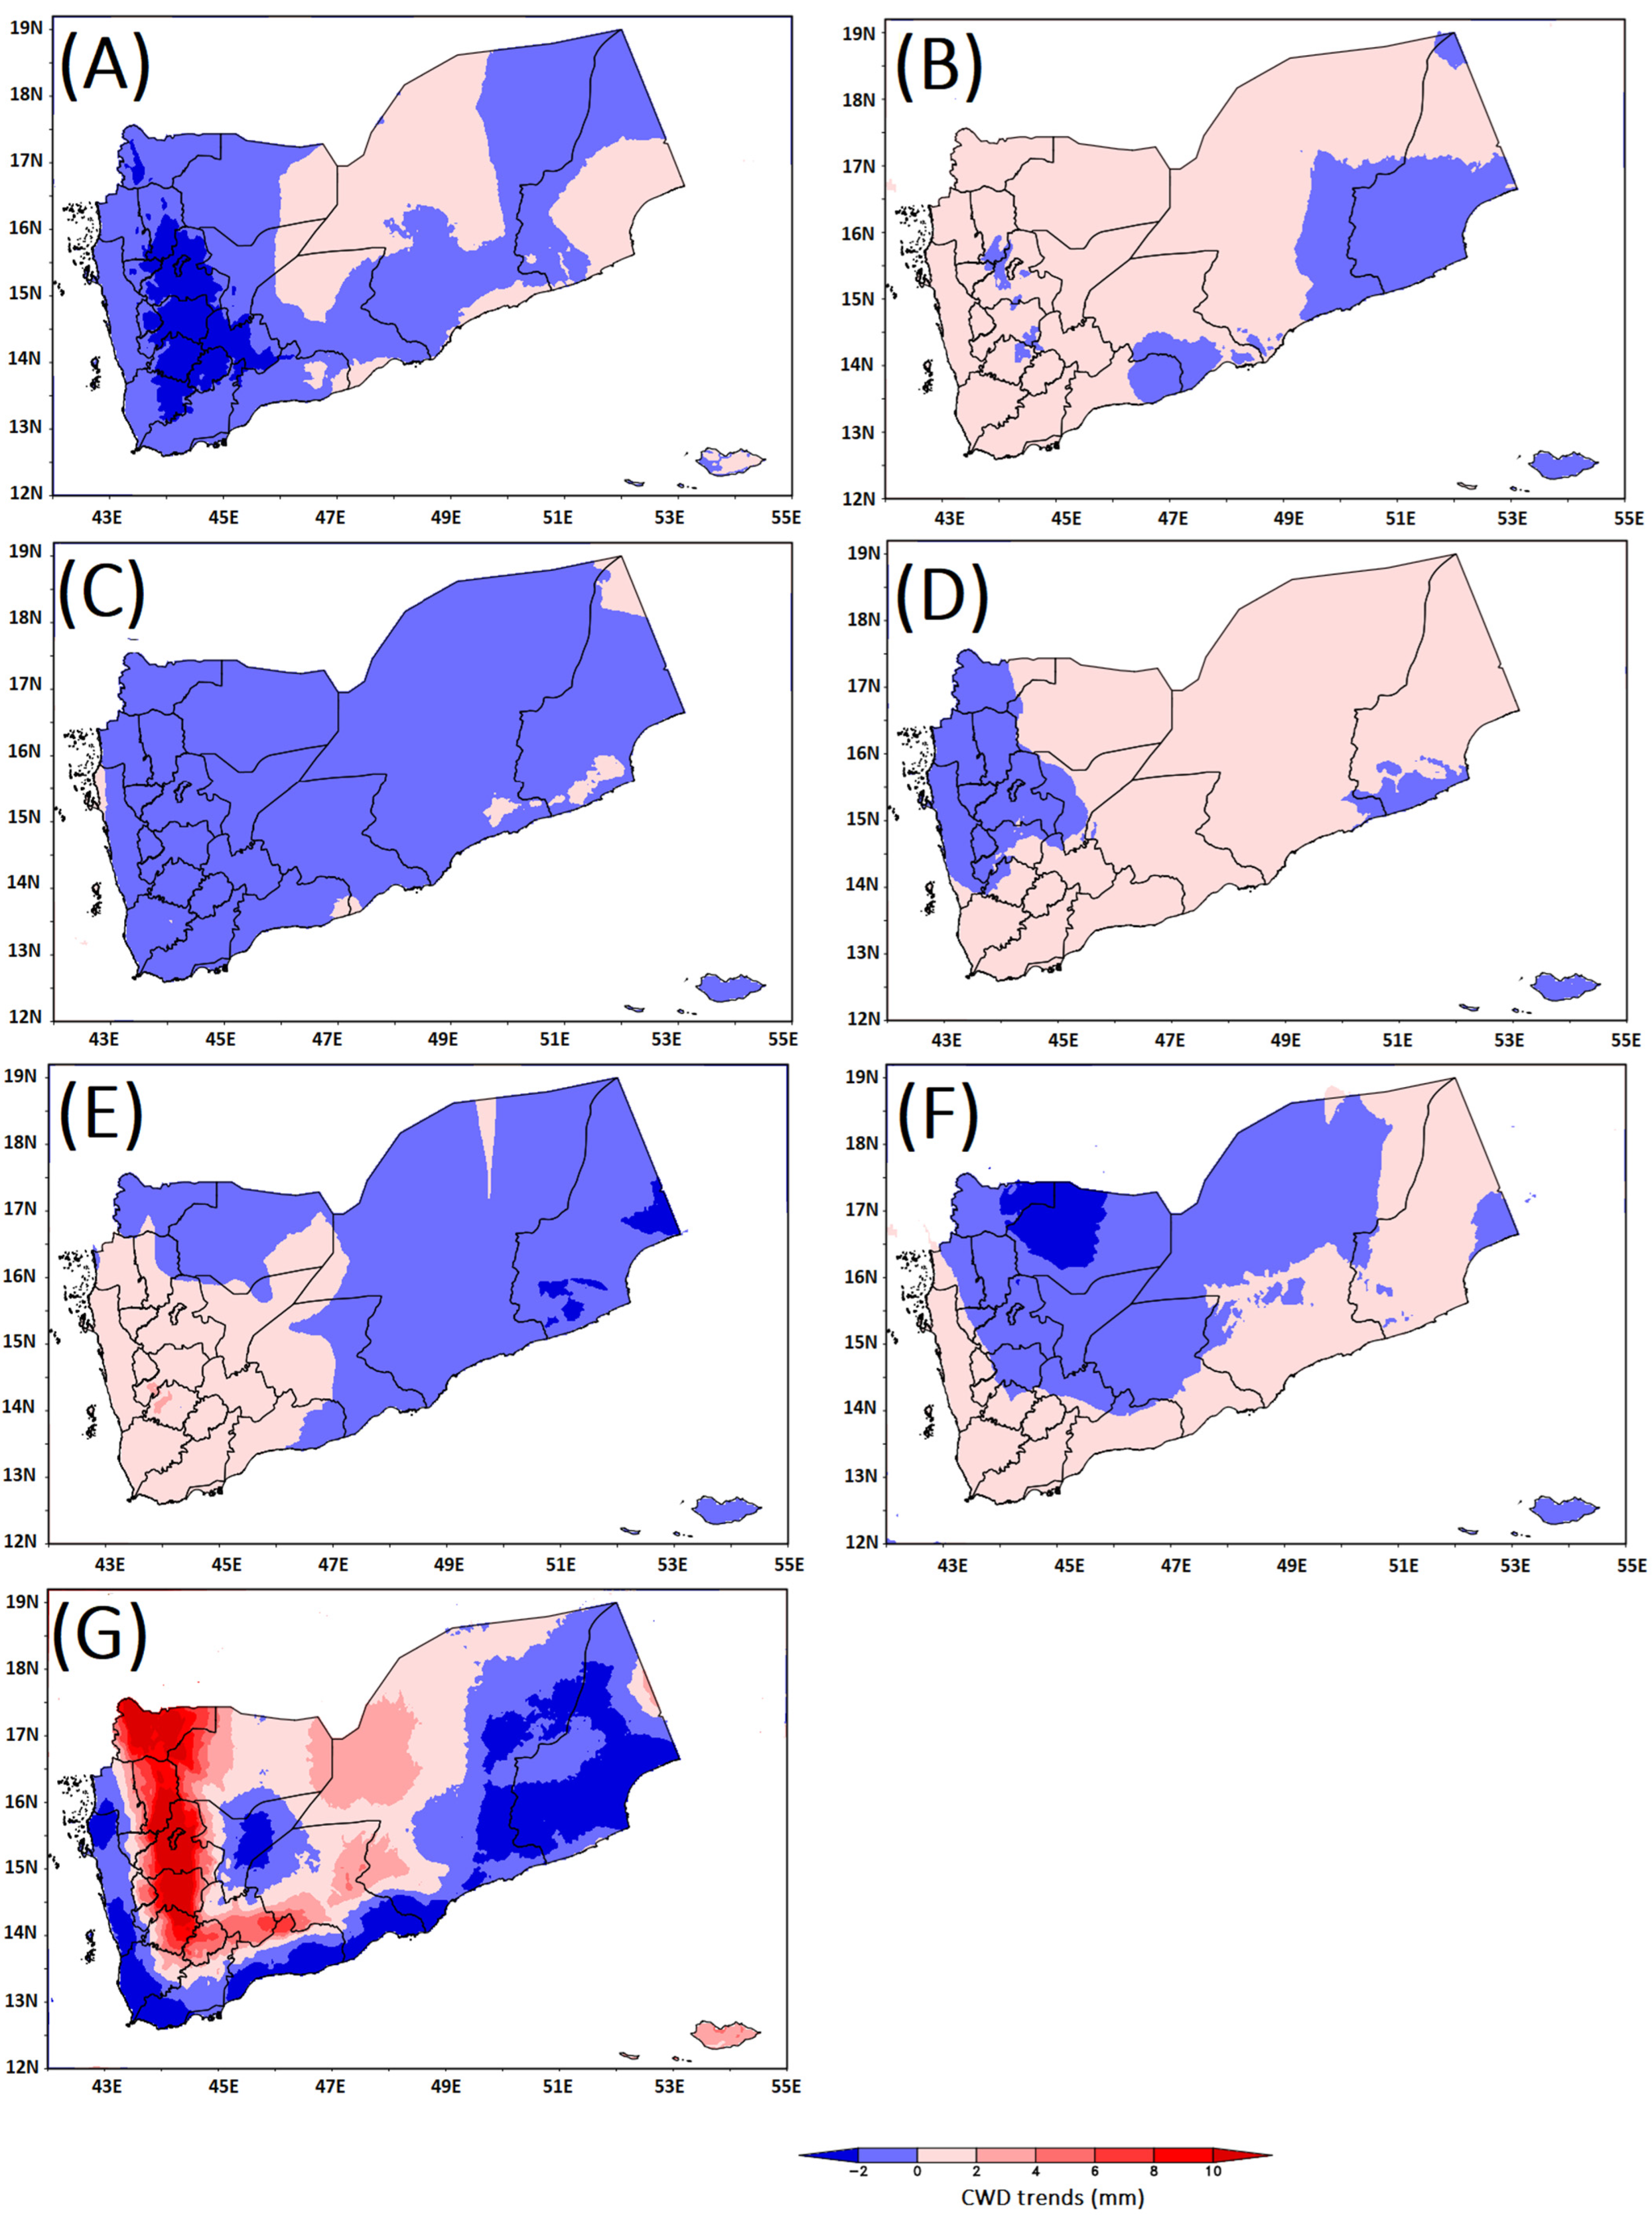
In terms of spatial trends, wide variabilities were found over the period from 1958 to 2021 (Figure 9). Specifically, in the first decade, much of the Eastern Dry Zone experienced an increasing trend of 2 mm yr−1, while the rest of the country experienced a decreasing trend of between 1 and 2 mm yr−1 (Figure 9A). During the 1968–1977 period, however, the whole country experienced an increasing trend, apart from the Al Maharah Governorate (Figure 9B). This observation was reversed during the 1978–1987 period (Figure 9C). What stands out from these results, therefore, is that while the Highlands experienced an increasing trend of up to 2 mm yr−1 in the early years, i.e., 1958–1967 (Figure 9A), a sharp increasing trend of as high as 10 mm yr−1 is evident in recent years (Figure 9G).
3.2. Regional-Level Terrestrial Water Budget Variability
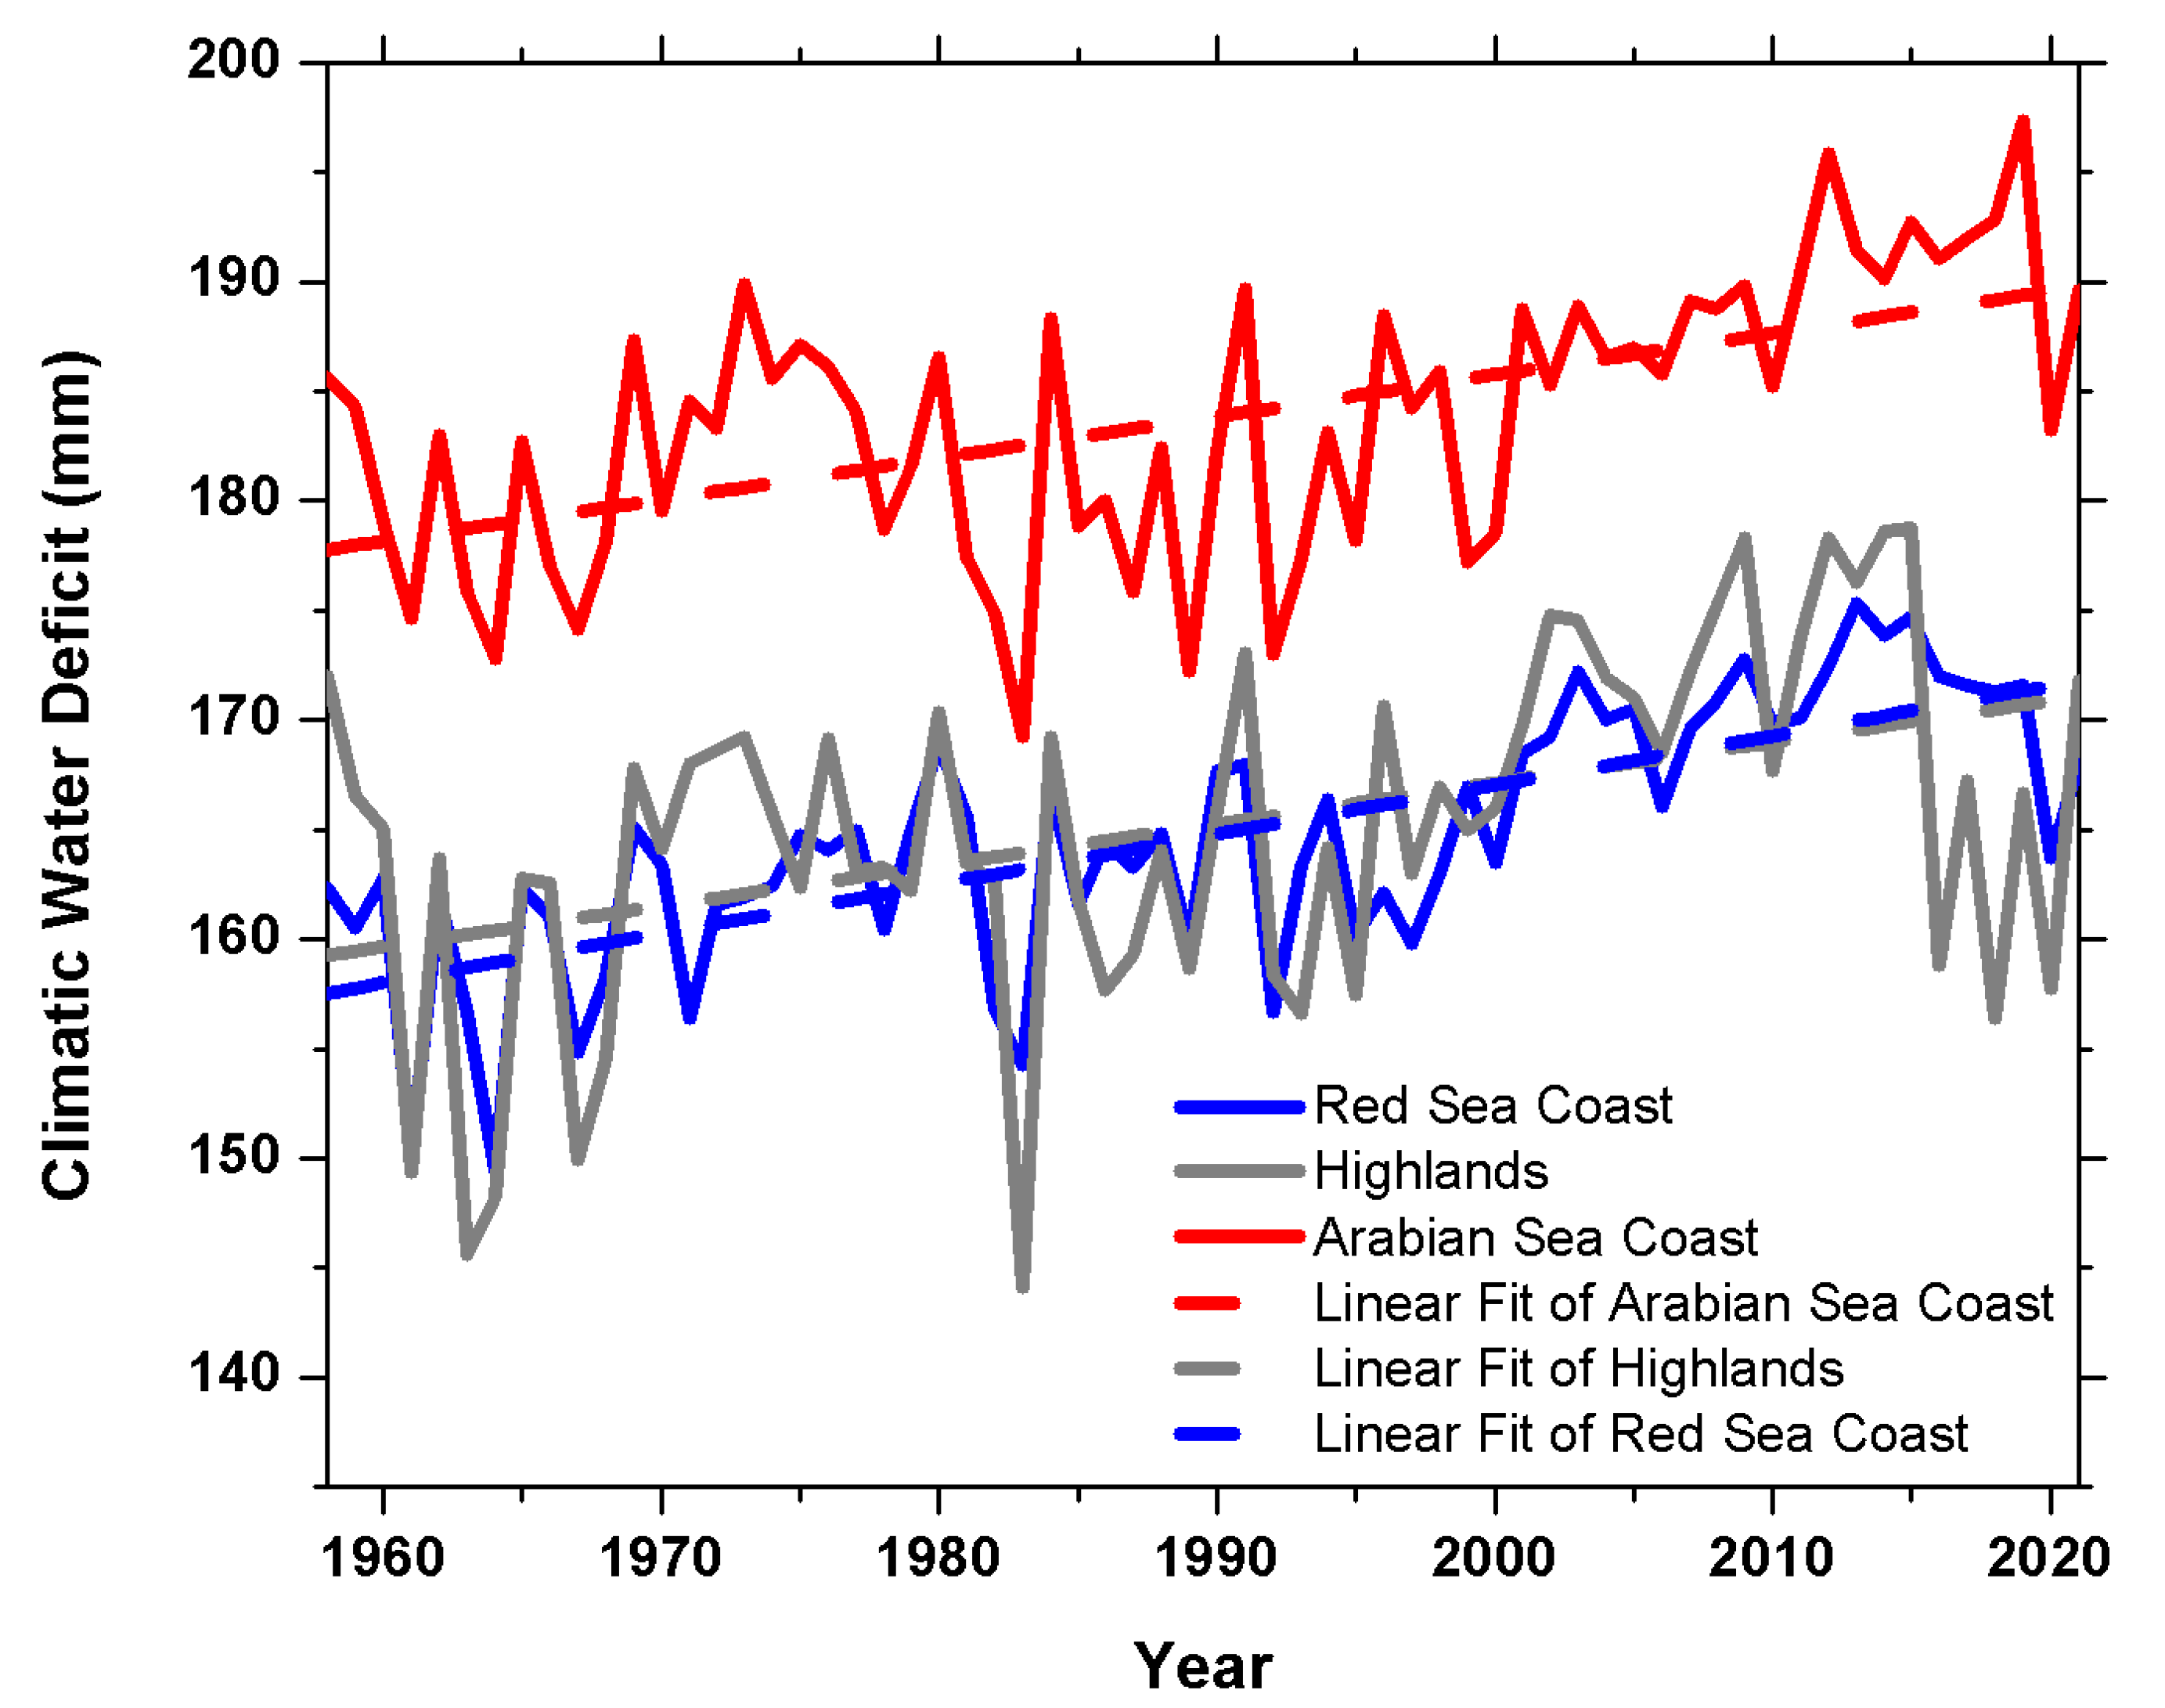
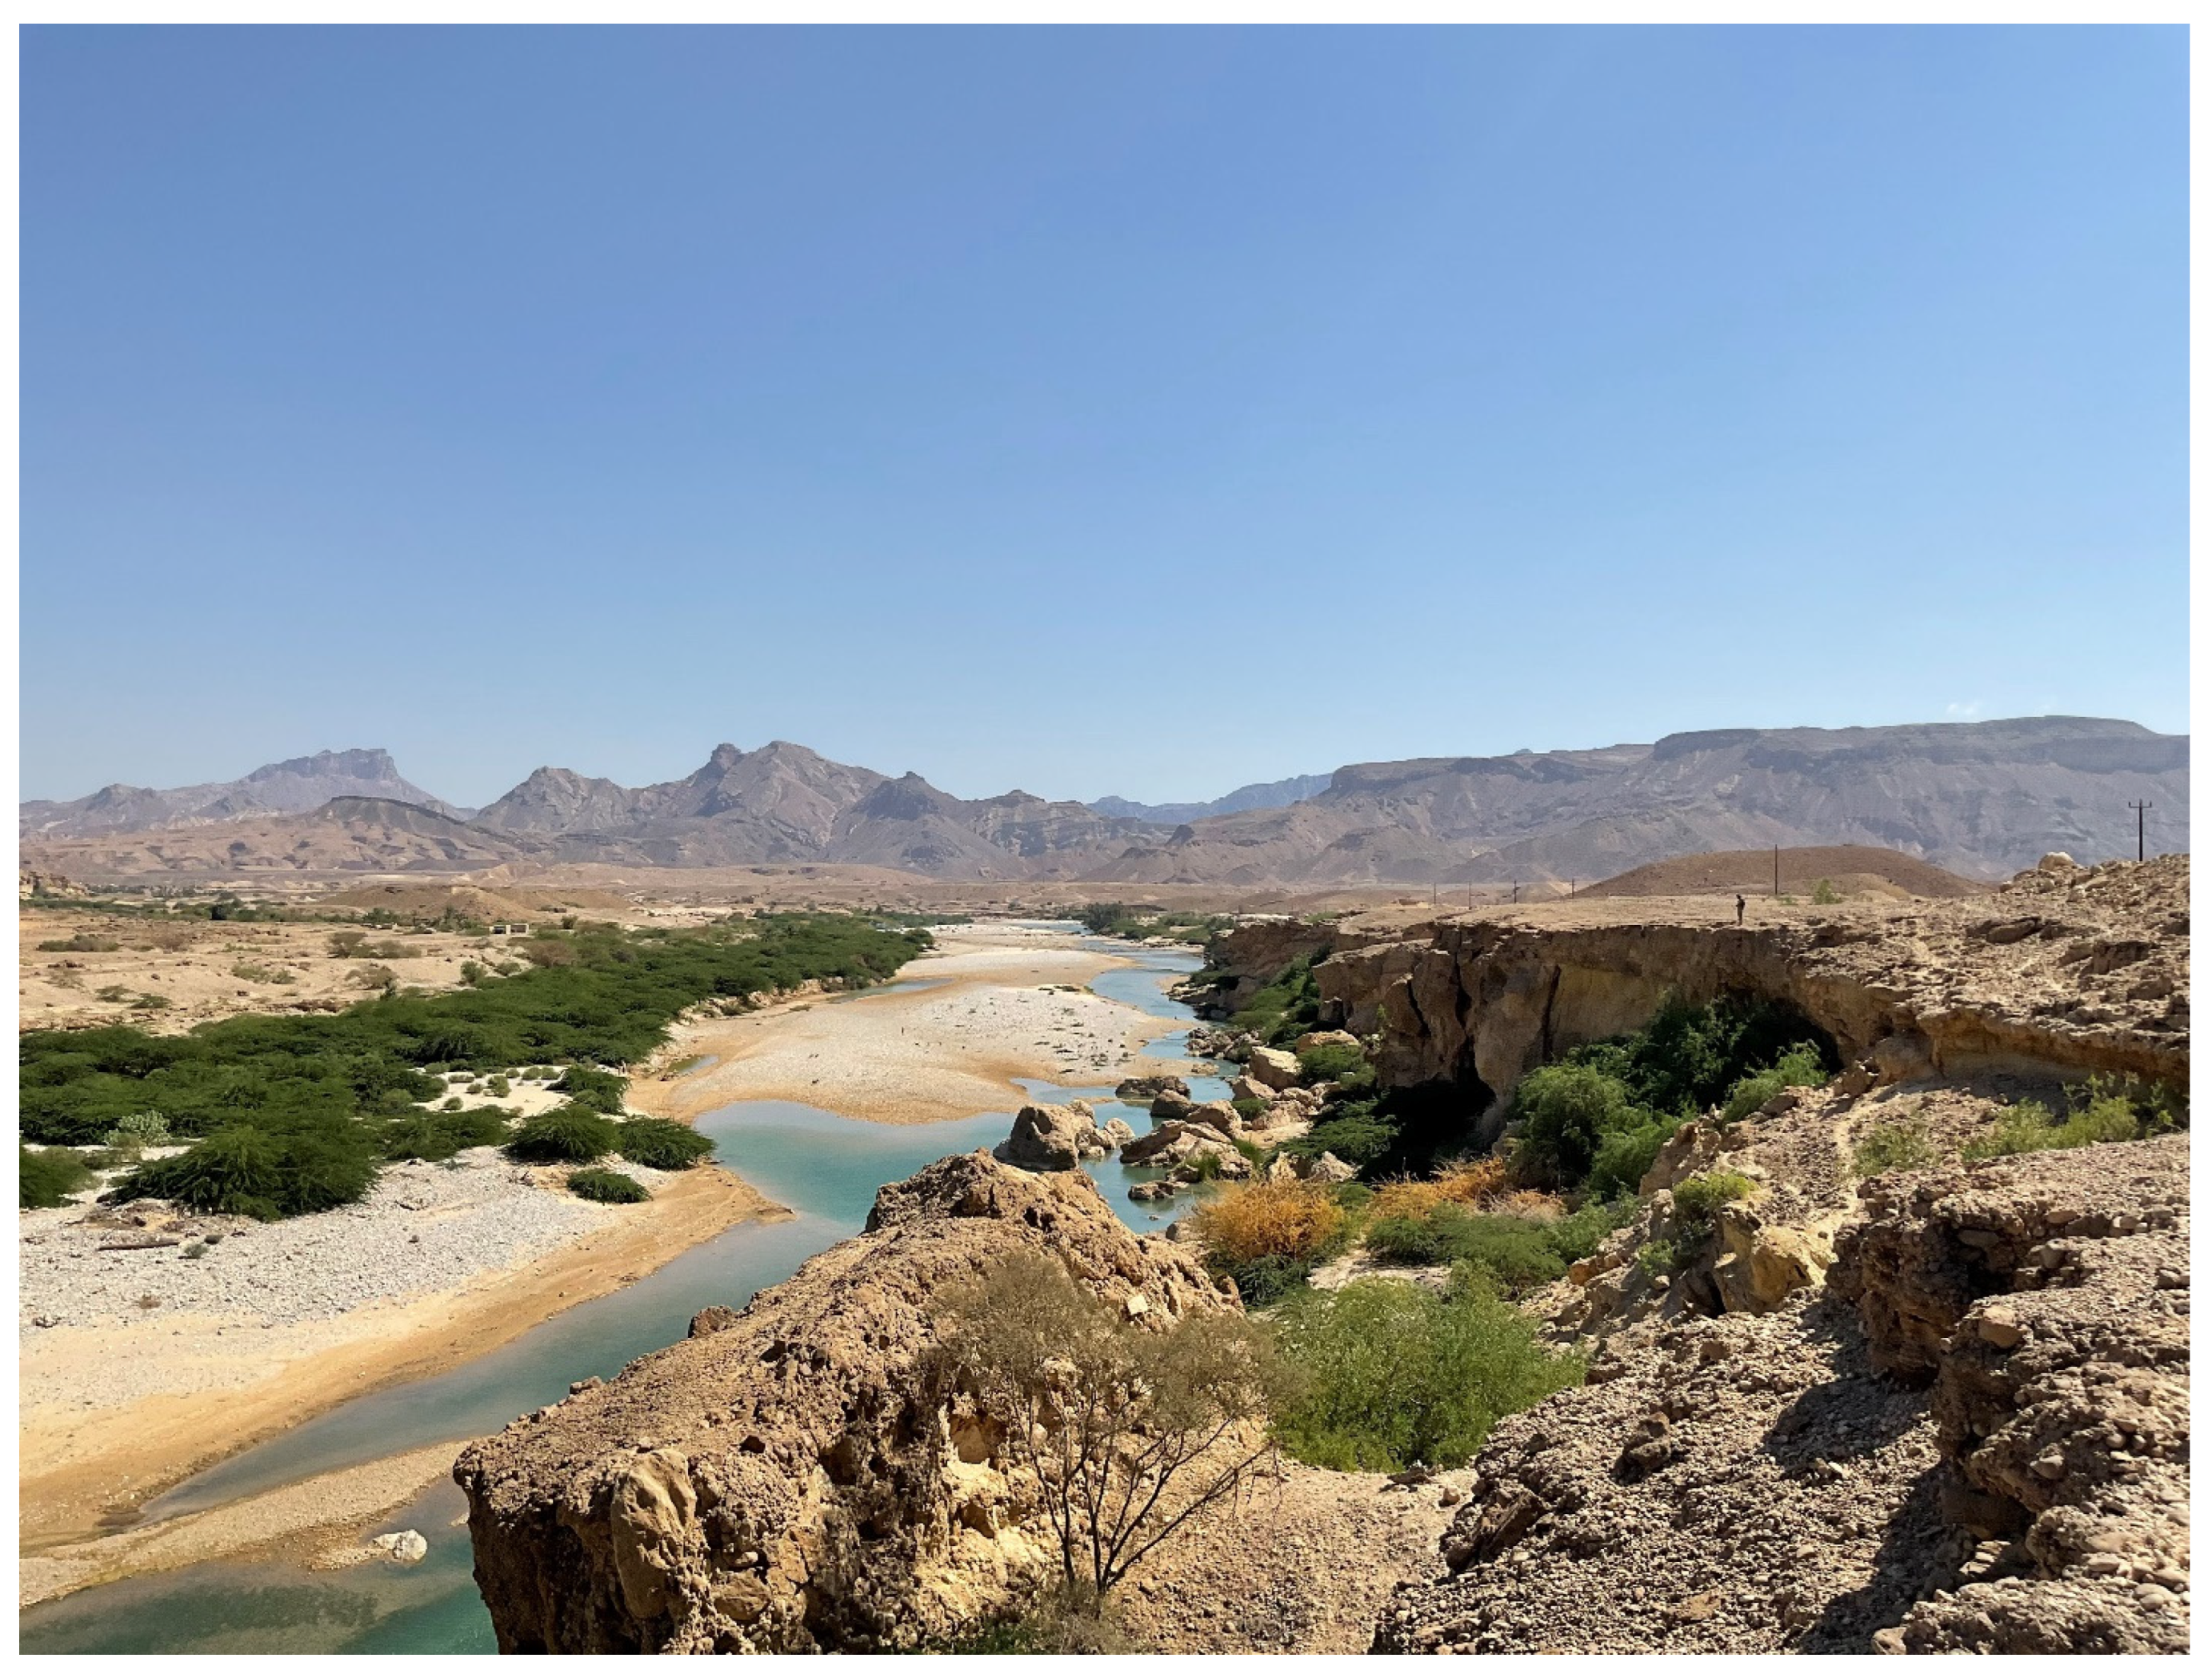
Having observed the marked spatial differences in water deficit (Figure 8), we analyzed their trends across three main agricultural zones, i.e., the Red Sea coast, the Highlands, and the Arabian Sea coast. The results indicate that with a mean annual deficit of 184 mm and a range of 78 to 272 mm, the Arabian Sea coast is the most water-stressed agricultural area (Figure 10). On the other hand, while there are interannual differences between the Red Sea coast and the Highlands, there is nearly no difference in the mean annual water deficit between the two regions. The observed upward trends without abrupt changes (see Figure 6) show that Yemen’s water resources situation is direr than was earlier documented. For instance, earlier studies recognized Wadi Hajr in Hadramaut Governorate as the only truly perennial flow in the country and that influx exceeded outflux across parts of the Wadi [62]. However, our findings challenge this conventional understanding and show that, as in other parts of the country, Wadi Hajr is severely water-stressed and is no longer perennial (Figure 10 and Figure 11). Both data analysis and site visits show that parts of the Wadi are seasonal. This finding has not been previously described.
Having observed that the Arabian Sea Coast is the most water-stressed agricultural area, we examined wind speed variations across the three regions. The results indicate that with a mean monthly mean of 4.1 m s−1, the Arabian Sea coast has the highest wind speeds, while the Red Sea coast and the Highlands are roughly similar at 3.7 and 3.3 m s−1, respectively (Figure 12). Higher CWDs across the Arabian Sea Coast can, therefore, be attributed to higher wind speeds compared to other regions. When wind speed increases, it blows away atmospheric water vapor, thereby triggering a decrease in relative humidity (RH), which ultimately increases the evaporative demand.
4. Conclusions
Yemen’s agricultural sector has a great deal of potential to become a major driving force for food security, poverty reduction, and socioeconomic development. Unfortunately, as in many MENA countries, the sector is severely affected by water availability concerns. We assessed the long-term agricultural water deficits using a high-resolution dataset and found countrywide water deficits, with mean monthly values ranging between 97 and 260 mm. We further found that even during wet years, the rainfall across much of Yemen is insufficient to offset these deficits. Water deficit trends show a constant increase across the whole country. These findings suggest that while the water shortage mosaic across Yemen experiences interannual variations, there is a significant intensification in their occurrence. Furthermore, the results of the sequential Mann–Kendall test show that since 1958, there have been no sudden changes in the upward trend of water deficits. The absence of sudden changes indicates that the rise is persistent and represents a good indicator of future water deficits across the country. Conclusively, these findings point to a drier Yemen in the future. Therefore, unless sustainable water management interventions are taken, the government and local communities risk losing a substantial source of livelihood and revenue in the future. Investments in water conservation techniques can mitigate these challenges by recharging aquifers and ensuring water availability across the agricultural areas of Yemen. While the trend analyses performed in this study are a good indicator of future water stress across Yemen, these results will be improved by future studies that can use models to project future water stress.
Author Contributions
Conceptualization, H.G and B.L.; Methodology, B.L.; Software, B.L.; Validation, H.G. and B.L.; Formal analysis, B.L.; Investigation, B.L; Resources, H.G.; Data curation, B.L.; Writing—original draft, B.L.; Writing—review & editing, H.G.; Supervision, H.G.; Project administration, H.G. All authors have read and agreed to the published version of the manuscript.
Funding
This research and the APC were funded through the EU-supported Food Security, Nutrition, and Information Systems Project implemented by the Food and Agriculture Organization office in Yemen.
Institutional Review Board Statement
Not applicable.
Informed Consent Statement
Not Applicable.
Data Availability Statement
All datasets used in this study are freely available online as described under Section 2: Data Sources and Methods.
Acknowledgments
This work was done under the EU-funded Food Security, Nutrition, and Information Systems Project implemented by the Food and Agriculture Organization office in Yemen; the EU is hereby acknowledged. It should be noted, however, that the EU was not involved in the conception, analytical design, data analyses, interpretation of the data, manuscript writing, or the decision to submit this work for publication. We also acknowledge the Climatology Lab for the TerraClimate datasets used in this study. The Editor and reviewers are also appreciated for their comments that further helped to improve this work.
Conflicts of Interest
The authors declare no conflict of interest.
References
- Jiang, Y. China’s water scarcity. J. Environ. Manag. 2009, 90, 3185–3196. [Google Scholar] [CrossRef]
- Albrecht, T.R.; Gerlak, A.K. Beyond the basin: Water security in transboundary environments. Water Secur. 2022, 17, 100124. [Google Scholar] [CrossRef]
- Anik, A.H.; Sultan, M.B.; Alam, M.; Parvin, F.; Ali, M.M.; Tareq, S.M. The impact of climate change on water resources and associated health risks in Bangladesh: A review. Water Secur. 2023, 18, 100133. [Google Scholar] [CrossRef]
- IPCC. Climate Change: Impacts, Adaptation and Vulnerability. Contribution of Working Group II to the Sixth Assessment Report of the Intergovernmental Panel on Climate Change; Pörtner, H.-O., Roberts, D.C., Tignor, M., Poloczanska, E.S., Mintenbeck, K., Alegría, A., Craig, M., Langsdorf, S., Löschke, S., Möller, V., et al., Eds.; Cambridge University Press: Cambridge, UK; New York, NY, USA, 2022; pp. 1457–1579. [Google Scholar] [CrossRef]
- FAO. AQUASTAT Core Database. Food and Agriculture Organization of the United Nations. 2022. Available online: http://www.fao.org/aquastat/en/ (accessed on 1 March 2023).
- Ide, T.; Lopez, M.R.; Fröhlich, C.; Scheffran, J. Pathways to water conflict during drought in the MENA region. J. Peace Res. 2021, 58, 568–582. [Google Scholar] [CrossRef]
- Nisa, Z.; Govind, A. Long-Term Terrestrial Water Budget Estimates over the Middle East North Africa Region. CGIAR Initiative on Climate Resilience. 2022. Available online: https://cgspace.cgiar.org/handle/10568/127844 (accessed on 20 March 2023).
- El Kenawy, A.; McCabe, M.; Vicente-Serrano, S.; Robaa, S.; Lopez-Moreno, J. Recent changes in continentality and aridity conditions over the Middle East and North Africa region, and their association with circulation patterns. Clim. Res. 2016, 69, 25–43. [Google Scholar] [CrossRef] [Green Version]
- Göll, E. Future Challenges of Climate Change in the MENA Region. Future Notes No. 7. 2017. Available online: https://research.fit.edu/media/site-specific/researchfitedu/coast-climate-adaptation-library/africa/regional---africa/G%C3%83ll.--2017.--Future-Challenges-of-CC-in-the-Mena-Region.pdf (accessed on 25 February 2023).
- Barredo, J.I.; Mauri, A.; Caudullo, G.; Dosio, A. Assessing shifts of Mediterranean and arid climates under RCP4. 5 and RCP8. 5 climate projections in Europe. In Meteorology and Climatology of the Mediterranean and Black Seas; Birkhäuser: Cham, Switherland, 2019; pp. 235–251. [Google Scholar]
- Tramblay, Y.; Llasat, M.C.; Randin, C.; Coppola, E. Climate change impacts on water resources in the Mediterranean. Reg. Environ. Chang. 2020, 20, 83. [Google Scholar] [CrossRef]
- Gonzalez, R.; Ouarda, T.B.M.J.; Marpu, P.R.; Allam, M.M.; Eltahir, E.A.B.; Pearson, S. Water Budget Analysis in Arid Regions, Application to the United Arab Emirates. Water 2016, 8, 415. [Google Scholar] [CrossRef] [Green Version]
- Soltani, S.S.; Ataie-Ashtiani, B.; Danesh-Yazdi, M.; Simmons, C.T. A probabilistic framework for water budget estimation in low runoff regions: A case study of the central Basin of Iran. J. Hydrol. 2020, 586, 124898. [Google Scholar] [CrossRef]
- Guppy, L.; Alnabhani, S. Water-related Conflict Assessment Report Resilience; Programme in the Irrigation and Agricultural Sector. 2022. Available online: https://rb.gy/zgrq2 (accessed on 2 July 2023).
- Glass, N. The Water Crisis in Yemen: Causes, Consequences and Solutions. Glob. Major. E-J. 2010, 1, 17–30. Available online: https://www.american.edu/cas/economics/ejournal/upload/glass_accessible.pdf (accessed on 1 July 2023).
- UPI. Yemen’s Water Crisis a Mideast Warning. 2009. Available online: https://bit.ly/3PNULlv (accessed on 2 July 2023).
- FAO. Yemen Emergency. 2022. Available online: https://bit.ly/40GpmG8 (accessed on 30 March 2023).
- Almas, A.A.M.; Scholz, M. Agriculture and Water Resources Crisis in Yemen: Need for Sustainable Agriculture. J. Sustain. Agric. 2006, 28, 55–75. [Google Scholar] [CrossRef]
- Varisco, D. Pumping Yemen Dry: A History of Yemen’s Water Crisis. Hum. Ecol. 2019, 47, 317–329. [Google Scholar] [CrossRef]
- Abatzoglou, J.T.; Dobrowski, S.; Parks, S.A.; Hegewisch, K.C. TerraClimate, a high-resolution global dataset of monthly climate and climatic water balance from 1958–2015. Sci. Data 2018, 5, 170191. [Google Scholar] [CrossRef] [PubMed] [Green Version]
- Lemenkova, P. Console-Based Mapping of Mongolia Using GMT Cartographic Scripting Toolset for Processing TerraClimate Data. Geosciences 2022, 12, 140. [Google Scholar] [CrossRef]
- Wiwoho, B.S.; Astuti, I.S. Runoff observation in a tropical Brantas watershed as observed from long-term globally available TerraClimate data 2001–2020. Geoenviron. Disasters 2022, 9, 12. [Google Scholar] [CrossRef]
- Filgueiras, R.; Venancio, L.P.; Aleman, C.C.; da Cunha, F.F. Comparison and calibration of terraclimate climatological variables over the Brazilian territory. J. S. Am. Earth Sci. 2022, 117, 103882. [Google Scholar] [CrossRef]
- Cepeda Arias, E.; Cañon Barriga, J. Performance of high-resolution precipitation datasets CHIRPS and TerraClimate in a Colombian high Andean Basin. Geocarto Int. 2022, 37, 17382–17402. [Google Scholar] [CrossRef]
- Zhang, X.; Cai, X. Climate change impacts on global agricultural water deficit. Geophys. Res. Lett. 2013, 40, 1111–1117. [Google Scholar] [CrossRef]
- Stephenson, N. Actual evapotranspiration and deficit: Biologically meaningful correlates of vegetation distribution across spatial scales. J. Biogeogr. 1998, 25, 855–870. [Google Scholar] [CrossRef]
- Flint, L.E.; Flint, A.L.; Thorne, J.H. Climate change: Evaluating your local and regional water resources. US Geol. Surv. (USGS) Fact Sheet 2015, 3098, 1–6. [Google Scholar] [CrossRef] [Green Version]
- Yin, D.; Li, Q.; Li, X.; Zhu, R. Annual water deficit in response to climate variabilities across the globe. Environ. Res. Lett. 2022, 17, 054021. [Google Scholar] [CrossRef]
- Wang-Erlandsson, L.; Bastiaanssen, W.G.M.; Gao, H.; Jägermeyr, J.; Senay, G.B.; van Dijk, A.I.J.M.; Guerschman, J.P.; Keys, P.W.; Gordon, L.J.; Savenije, H.H.G. Global root zone storage capacity from satellite-based evaporation. Hydrol. Earth Syst. Sci. 2016, 20, 1459–1481. [Google Scholar] [CrossRef]
- Tabari, H.; Talaee, P.H. Sensitivity of evapotranspiration to climatic change in different climates. Glob. Planet. Chang. 2014, 115, 16–23. [Google Scholar] [CrossRef]
- McKee, T.B.; Doesken, N.J.; Kleist, J. The Relationship of Drought Frequency and Duration to Time Scales. Available online: https://www.droughtmanagement.info/literature/AMS_Relationship_Drought_Frequency_Duration_Time_Scales_1993.pdf (accessed on 1 July 2023).
- Liu, C.; Yang, C.; Yang, Q.; Wang, J. Spatiotemporal drought analysis by the standardized precipitation index (SPI) and standardized precipitation evapotranspiration index (SPEI) in Sichuan Province, China. Sci. Rep. 2021, 11, 1280. [Google Scholar] [CrossRef]
- Kamruzzaman, M.; Almazroui, M.; Salam, M.A.; Mondol, A.H.; Rahman, M.; Deb, L.; Kundu, P.K.; Zaman, A.U.; Islam, A.R.M.T. Spatiotemporal drought analysis in Bangladesh using the standardized precipitation index (SPI) and standardized precipitation evapotranspiration index (SPEI). Sci. Rep. 2022, 12, 20694. [Google Scholar] [CrossRef]
- Zargar, A.; Sadiq, R.; Naser, B.; Khan, F.I. A review of drought indices. Environ. Rev. 2011, 19, 333–349. [Google Scholar] [CrossRef] [Green Version]
- Hamed, K.H.; Rao, A.R. A modified Mann-Kendall trend test for autocorrelated data. J. Hydrol. 1998, 204, 182–196. [Google Scholar] [CrossRef]
- R Core Team. R: A Language and Environment for Statistical Computing; R Foundation for Statistical Computing: Vienna, Austria, 2020; Available online: http://www.r-project.org (accessed on 2 February 2023).
- Sneyers, R. On Statistical Analysis of Series of Observations; Technical Note No 143; World Meteorological Society: Geneva, Switzerland, 1990; Available online: https://www.scirp.org/(S(czeh2tfqw2orz553k1w0r45))/reference/referencespapers.aspx?referenceid=1292315 (accessed on 28 March 2023).
- Kendall, M.; Gibbons, J.D. ‘Rank Correlation Methods’. Arnold. Sneyers R. In On Statistical Analysis of Series of Observations; Technical Note No 143.; World Meteorological Society: Geneva, Switzerland, 1990; Available online: https://library.wmo.int/index.php?lvl=notice_display&id=7427#.ZCKIh3ZByZ4 (accessed on 28 March 2023).
- Schaber, J. _Pheno: Auxiliary Functions for Phenological Data Analysis_. R Package Version 1.7-0. 2022. Available online: https://CRAN.R-project.org/package=pheno (accessed on 31 March 2023).
- Satoh, Y.; Yoshimura, K.; Pokhrel, Y.; Kim, H.; Shiogama, H.; Yokohata, T.; Hanasaki, N.; Wada, Y.; Burek, P.; Byers, E.; et al. The timing of unprecedented hydrological drought under climate change. Nat. Commun. 2022, 13, 3287. [Google Scholar] [CrossRef] [PubMed]
- Jumrani, K.; Bhatia, V.S. Impact of combined stress of high temperature and water deficit on growth and seed yield of soybean. Physiol. Mol. Biol. Plants 2018, 24, 37–50. [Google Scholar] [CrossRef] [PubMed]
- Fecht, S. How Climate Change Impacts Our Water. 2019. Available online: https://news.climate.columbia.edu/2019/09/23/climate-change-impacts-water/ (accessed on 15 March 2023).
- Cauderay, E.; Wain, J.; Alsobari, A. Detailed Shelter Response Profile for Yemen: Local Building Cultures for Sustainable and Resilient Habitats. CRAterre; Global Shelter Cluster, 69p., hal-03772939v2. 2022. Available online: https://hal.science/hal-03772939v2 (accessed on 19 March 2023).
- Gadain, H. Being the Change in Yemen: Improving Integrated Water Resources Management for Food Security. 2023. Available online: https://reliefweb.int/report/yemen/being-change-yemen-improving-integrated-water-resources-management-food-security (accessed on 29 March 2023).
- Abd-El-Kader, M.M.; El-Feky, A.M.; Saber, M.; AlHarbi, M.M.; Alataway, A.; Alfaisal, F.M. Designating Appropriate Areas for Flood Mitigation and Rainwater Harvesting in Arid Region Using a GIS-based Multi-criteria Decision Analysis. Water Resour. Manag. 2023, 37, 1083–1108. [Google Scholar] [CrossRef]
- Ammar, A.; Riksen, M.; Ouessar, M.; Ritsema, C. Identification of suitable sites for rainwater harvesting structures in arid and semi-arid regions: A review. Int. Soil Water Conserv. Res. 2016, 4, 108–120. [Google Scholar] [CrossRef] [Green Version]
- Baker, J.C.A. Planting trees to combat drought. Nat. Geosci. 2021, 14, 458–459. [Google Scholar] [CrossRef]
- Aljawzi, A.A.; Fang, H.; Abbas, A.A.; Khailah, E.Y. Assessment of Water Resources in Sana’a Region, Yemen Republic (Case Study). Water 2022, 14, 1039. [Google Scholar] [CrossRef]
- Hoekstra, A.Y.; Mekonnen, M.M. The water footprint of humanity. Proc. Natl. Acad. Sci. USA 2012, 109, 3232–3237. [Google Scholar] [CrossRef] [PubMed]
- Al-Saidi, M. Contribution of Water Scarcity and Sustainability Failures to Disintegration and Conflict in the Arab Region—The Case of Syria and Yemen. In The Regional Order in the Gulf Region and the Middle East; Amour, P., Ed.; Palgrave Macmillan: Cham, Switzerland; Springer EBooks: London, UK, 2020; pp. 375–405. [Google Scholar] [CrossRef]
- Al-Mahfadi, A.; Dakki, M. Vulnerability of Al-hodidah wetlands in Yemen: Main socio-economic causes. Mater. Today: Proc. 2019, 13, 515–524. [Google Scholar] [CrossRef]
- Al-Mashreki, M.H. Characterization of Soil and Water Resources in Yemen; Springer EBooks: Berlin/Heidelberg, Germany, 2022; pp. 151–172. [Google Scholar] [CrossRef]
- Price, R. Climate Change Risks and Opportunities in Yemen; K4D Helpdesk Report 1168; Institute of Development Studies: Falmer, UK, 2022. [Google Scholar] [CrossRef]
- Oweis, T.Y.; Prinz, D.; Hachum, A.Y. Rainwater Harvesting for Agriculture in the Dry Areas; CRC Press: Boca Raton, FL, USA, 2012. [Google Scholar]
- Allan, R.P.; Barlow, M.; Byrne, M.P.; Cherchi, A.; Douville, H.; Fowler, H.J.; Gan, T.Y.; Pendergrass, A.G.; Rosenfeld, D.; Swann, A.L.S.; et al. Advances in understanding large-scale responses of the water cycle to climate change. Ann. N. Y. Acad. Sci. 2020, 1472, 49–75. [Google Scholar] [CrossRef] [Green Version]
- Xiang, K.; Li, Y.; Horton, R.; Feng, H. Similarity and difference of potential evapotranspiration and reference crop evapotranspiration—A review. Agric. Water Manag. 2020, 232, 106043. [Google Scholar] [CrossRef]
- Ferreira, L.B.; Da Cunha, F.F. New approach to estimate daily reference evapotranspiration based on hourly temperature and relative humidity using machine learning and deep learning. Agric. Water Manag. 2020, 234, 106113. [Google Scholar] [CrossRef]
- Crosbie, R.S.; Doble, R.C.; Turnadge, C.; Taylor, A.R. Constraining the Magnitude and Uncertainty of Specific Yield for Use in the Water Table Fluctuation Method of Estimating Recharge. Water Resour. Res. 2019, 55, 7343–7361. [Google Scholar] [CrossRef]
- Xiang, W.; Evaristo, J.; Li, Z. Recharge mechanisms of deep soil water revealed by water isotopes in deep loess deposits. Geoderma 2020, 369, 114321. [Google Scholar] [CrossRef]
- USGS. Artificial Groundwater Recharge. 2019. Available online: https://www.usgs.gov/mission-areas/water-resources/science/artificial-groundwater-recharge (accessed on 30 March 2023).
- Alataway, A.; El Alfy, M. Rainwater Harvesting and Artificial Groundwater Recharge in Arid Areas: Case Study in Wadi Al-Alb, Saudi Arabia. J. Water Resour. Plan. Manag. 2019, 145, 05018017. [Google Scholar] [CrossRef]
- Girgirah, A.A.; Maktari, M.S.; Sattar, H.A.; Mohammed, M.F.; Abbas, H.H.; Shoubihi, H.M. Wadi Development for Agriculture in PDR Yemen. 2021. Available online: https://floodbased.org/wp-content/uploads/2021/05/Wadi-development-for-agriculture-in-PDR-Yemen.pdf (accessed on 29 March 2023).
Figure 1.
Agroecological zones of the study area, Yemen. The insert shows the location of Yemen on the global map, as depicted by the red shading.
Figure 1.
Agroecological zones of the study area, Yemen. The insert shows the location of Yemen on the global map, as depicted by the red shading.

Figure 2.
Monthly cycle of climatic water deficit (CWD; mm) across Yemen, averaged over longitude 42.6° to longitude 53.2° and latitudes 12.7° to 17.6°, for the period 1958–2021. This box and whisker plot shows the five-number summary of CWD across Yemen. The bottom-most horizontal line of each plot is the minimum, followed by the first quartile, then the vertical line that goes through the box is the median, followed by the third quartile, and the maximum.

Figure 3.
Relationship between climatic water deficit (CWD; mm) and wind speed (WS) in m s−1 across Yemen (R = 0.8), averaged over longitude 42.6° to longitude 53.2° and latitudes 12.7° to 17.6° for the period 1958–2021.
Figure 3.
Relationship between climatic water deficit (CWD; mm) and wind speed (WS) in m s−1 across Yemen (R = 0.8), averaged over longitude 42.6° to longitude 53.2° and latitudes 12.7° to 17.6° for the period 1958–2021.

Figure 4.
Interannual variations of the standardized precipitation index (SPI) and climatic water deficit (CWD) across Yemen (R = −0.7), averaged over longitude 42.6° to longitude 53.2° and latitudes 12.7° to 17.6° for the period 1958–2021. The red dotted line denotes the separation between the wet and dry years on the SPI scale.

Figure 5.
The trend of climatic water deficit (CWD) across Yemen (Sen’s slope 0.17; p-value = 0.006; α = 0.005), averaged over longitude 42.6° to longitude 53.2° and latitudes 12.7° to 17.6° for the period 1958–2021.
Figure 5.
The trend of climatic water deficit (CWD) across Yemen (Sen’s slope 0.17; p-value = 0.006; α = 0.005), averaged over longitude 42.6° to longitude 53.2° and latitudes 12.7° to 17.6° for the period 1958–2021.

Figure 6.
Abrupt changes in climatic water deficit (CWD) across Yemen, averaged over longitude 42.6° to longitude 53.2° and latitudes 12.7° to 17.6° for the period 1958 - 2021. Results are based on the sequential Mann–Kendall test statistic. Prog (i.e., the progressive row of Kendall’s normalized tau) is the forward sequential statistic while Retro (i.e., the retrograde row of Kendall’s normalized tau) is the backward sequential statistic. The grey dashed lines represent the confidence limits at α = 5%.

Figure 7.
Interannual water balance fluctuations (mm/yr) across Yemen, averaged over longitude 42.6° to longitude 53.2° and latitudes 12.7° to 17.6°, for the period 1958–2021. S is the change in water storage, Q is runoff, Ea is evapotranspiration, and P is precipitation.
Figure 7.
Interannual water balance fluctuations (mm/yr) across Yemen, averaged over longitude 42.6° to longitude 53.2° and latitudes 12.7° to 17.6°, for the period 1958–2021. S is the change in water storage, Q is runoff, Ea is evapotranspiration, and P is precipitation.

Figure 8.
Spatial patterns of climatic water deficit (CWD) across Yemen for the period 1958–2021.

Figure 9.
Spatial trends of climatic water deficit (CWD; mm) across Yemen: (A) 1958–1967; (B) 1968–1977; (C) 1978–1987; (D) 1988–1997; (E) 1998–2007; (F) 2008–2017; (G) 2018–2021.
Figure 9.
Spatial trends of climatic water deficit (CWD; mm) across Yemen: (A) 1958–1967; (B) 1968–1977; (C) 1978–1987; (D) 1988–1997; (E) 1998–2007; (F) 2008–2017; (G) 2018–2021.

Figure 10.
The trend of climatic water deficit (CWD) across the Red Sea coast (blue curve), the Arabian Sea coast (red curve), and the Highlands (grey curve) for the period 1958–2021. All trends are significant at α = 0.005.
Figure 10.
The trend of climatic water deficit (CWD) across the Red Sea coast (blue curve), the Arabian Sea coast (red curve), and the Highlands (grey curve) for the period 1958–2021. All trends are significant at α = 0.005.

Figure 11.
Fieldwork findings show that the once truly perennial flow, Wadi Hajr Delta in Hadramaut governorate, is no longer perennial due to continued water stress. Source: FAO, 4 December 2022.
Figure 11.
Fieldwork findings show that the once truly perennial flow, Wadi Hajr Delta in Hadramaut governorate, is no longer perennial due to continued water stress. Source: FAO, 4 December 2022.

Figure 12.
Mean monthly cycle of wind speed (m s−1) across the Arabian Sea coast (red curve), Red Sea coast (blue curve), and Highlands (gray curve), averaged over longitude 42.6° to longitude 53.2° and latitudes 12.7° to 17.6°, for the period 1958–2021.
Figure 12.
Mean monthly cycle of wind speed (m s−1) across the Arabian Sea coast (red curve), Red Sea coast (blue curve), and Highlands (gray curve), averaged over longitude 42.6° to longitude 53.2° and latitudes 12.7° to 17.6°, for the period 1958–2021.


Table 1.
Data sources used in this study.
| Variable | Representation | Units | Source |
|---|---|---|---|
| Precipitation | P | mm | [20] |
| Actual Evapotranspiration | Ea | mm | [20] |
| Runoff | Q | mm | [20] |
| Climatic Water Deficit | CWD | mm | [20] |
| Water Storage | ΔS | mm | Equation (1) |
| Wind Speed | WS | m s−1 | [20] |
Table 2.
Drought classification on the SPI scale [31].
Table 2.
Drought classification on the SPI scale [31].
| Description | SPI Values |
|---|---|
| Extreme drought | ≤−2 |
| Severe drought | −1.9 to −1.5 |
| Moderate drought | −1.4 to −1.0 |
| Near Normal | −0.9 to 0.9 |
| Moderately wet | 1 to 1.5 |
| Severely wet | 1.6 to 2 |
| Extremely wet | ≥2 |
Disclaimer/Publisher’s Note: The statements, opinions and data contained in all publications are solely those of the individual author(s) and contributor(s) and not of MDPI and/or the editor(s). MDPI and/or the editor(s) disclaim responsibility for any injury to people or property resulting from any ideas, methods, instructions or products referred to in the content. |
© 2023 by the authors. Licensee MDPI, Basel, Switzerland. This article is an open access article distributed under the terms and conditions of the Creative Commons Attribution (CC BY) license (https://creativecommons.org/licenses/by/4.0/).
Share and Cite
MDPI and ACS Style
Gadain, H.; Libanda, B. Agricultural Water Deficit Trends in Yemen. Atmosphere 2023, 14, 1263. https://doi.org/10.3390/atmos14081263
AMA Style
Gadain H, Libanda B. Agricultural Water Deficit Trends in Yemen. Atmosphere. 2023; 14(8):1263. https://doi.org/10.3390/atmos14081263
Chicago/Turabian StyleGadain, Hussein, and Brigadier Libanda. 2023. "Agricultural Water Deficit Trends in Yemen" Atmosphere 14, no. 8: 1263. https://doi.org/10.3390/atmos14081263
Note that from the first issue of 2016, this journal uses article numbers instead of page numbers. See further details here.