Article

Three-Dimensional Visualization of Long-Range Atmospheric Transport of Crop Pathogens and Insect Pests

1
Visual Data Analysis Group, Regional Computing Centre, Universität Hamburg, 20146 Hamburg, Germany
2
Center for International Peace Operations (ZIF), 10719 Berlin, Germany
3
Atmospheric Dispersion and Air Quality Group, UK Met Office, Exeter EX1 3PB, UK
4
Epidemiology and Modelling Group, Department of Plant Sciences, University of Cambridge, Cambridge CB2 3EA, UK
5
International Maize and Wheat Improvement Center (CIMMYT), Texcoco 56237, Mexico
6
Food and Agriculture Organization of the United Nations, Viale delle Terme di Caracalla, 00153 Rome, Italy
*
Authors to whom correspondence should be addressed.
Atmosphere 2023, 14(6), 910; https://doi.org/10.3390/atmos14060910
Submission received: 25 March 2023 / Revised: 3 May 2023 / Accepted: 15 May 2023 / Published: 23 May 2023

Abstract

:
Some of the most devastating crop diseases and insect pests can be transmitted by wind over extremely long distances. These low-probability but high-impact events can have severe consequences for crop production and food security by causing epidemic outbreaks or devastating insect infestations in previously uninfected geographic areas. Two prominent examples that have recently caused substantial damage to agricultural production are novel strains of wheat rusts and desert locust swarm infestations. Whilst quantitative estimates of long-range atmospheric transport events can be obtained using meteorological transport simulations, the exact characteristics of three-dimensional spatiotemporal dynamics of crop pathogen transport and insect flight on extremely large spatial scales, over entire regions and continents, remain largely unknown. Here, we investigate the feasibility and usefulness of new advanced geospatial data visualization methods for studying extremely long-distance airborne transmission of crop pathogens and insect pests. We combine field surveillance data and a Lagrangian Particle Dispersion Model with novel techniques from computer graphics to obtain, for the first time, detailed three-dimensional visual insights into airborne crop pathogen and insect pest transport on regional and continental scales. Visual insights into long-distance dispersal of pests and pathogens are presented as a series of short 3D movies. We use interactive three-dimensional visual data analysis for explorative examination of long-range atmospheric transport events from a selection of outbreak and infestation sites in East Africa and South East Asia. The practical usefulness of advanced 3D visualization methods for improving risk estimates and early warning is discussed in the context of two operational crop disease and insect pest management systems (for wheat rusts and desert locusts). The tools and methods introduced here can be applied to other pathogens, pests, and geographical areas and can improve understanding of risks posed to agricultural production by crop disease and insect pest transmission caused by meteorological extreme events.

1. Introduction

Some of the most devastating crop diseases and migratory insect pests can be transported by winds over extremely long distances; they cross landscapes, multiple countries, and even entire continents [1,2,3]. Examples include wheat rust, soybean rust, fall armyworm, and, the most feared of all migratory pests, the desert locust [4,5,6,7]. Amongst the first reported empirical measurements that showed the long-range transport of biological matter in the atmosphere are those of Peturson in 1930, who measured the equivalent of around 16,000 fungal spores per square meter at 4.5 km altitude using a spore trap attached to an airplane [8]. Today, a range of experimental techniques is in use, including unmanned aerial vehicles, remote sensing techniques, microfluidic chips, micro-Raman spectroscopy, vertically looking insect radars, and various types of spore traps [9,10,11,12,13]. These are complemented by complex meteorological models to simulate the atmospheric transport of crop pathogens and insect pests [1,2,14,15,16,17,18,19,20,21]. Whilst these advances in experimental and computational methods have improved our knowledge, the long-range transport of crop pathogens and insect pests is still a poorly understood phenomenon.
Understanding long-distance airborne dispersal (LDD) has been acknowledged as one of the key challenges in crop epidemiology [22]. The airborne transport of crop pathogens and insect flight along winds over long distances can have severe consequences for crop production and food security by causing epidemic outbreaks and devastating insect infestations in previously uninfected geographical areas. On regional and continental scales, mechanistic meteorological simulation models and geospatial data visualization are key methods for estimating transport quantities and for communicating risks. Simulation models and visualization tools are core components in some of the most advanced operational crop disease and insect pest early warning systems [23,24,25,26,27]. For example, both a new wheat rust early warning system [23] and the desert locust early warning system maintained by the UN Food and Agricultural Organization (FAO) [27] include components for estimating and visualizing long-range atmospheric transport. Whilst these early warning systems have proven to be of great use, various challenges remain. These include challenges regarding the understanding of the phenomenon itself—e.g., the influence of meteorological factors on survival of crop pathogens and on insect flight behavior—as well as challenges on how to translate model outputs to actionable insights and how to communicate these insights effectively to practitioners and decision-makers outside of the academic modelling community for improving surveillance, early warning, and control.
Geospatial data visualization is central not only for meteorological modelling applications in crop epidemiology but for investigating a range of other atmospheric transport phenomena that pose hazards to humans (e.g., pollen and other biological allergens, volcanic ash, or radioactive substances) and for studying meteorological extreme events. In the case of crop pathogens and insect pests, geospatial data visualization is key for communicating risks to stakeholders, agricultural decision-makers, and also for the research process itself, for understanding, development, testing, and interpretation of atmospheric transport models.
In the case of wheat rust outbreaks, trillions of pathogenic fungal spores are released into the air above infected fields, and some of these are blown away by winds over extremely long distances (Figure 1a). In the case of desert locust infestations, huge swarms with up to hundreds of millions of insects form and engage in collective swarm flight along dominant wind streams for crossing regions and continents (Figure 1b). For both cases, Earth System Data and Lagrangian Particle Dispersion Models (LPDMs) can be used to simulate the processes involved in atmospheric transmission (release, turbulent transport, survival during transport, deposition/landing; Figure 2a,b). In essence, LPDMs process three-dimensional meteorological data from numerical weather prediction models to construct a computational data atmosphere, in which the release, transport, and deposition of millions of stochastic simulation particles are simulated to estimate probabilities for long-range atmospheric transport.
Geospatial data visualization is a key step in model calibration and interpretation of model results, by allowing for the summary and interpretation of extremely large amounts of data involved in simulation assessments. In addition to the meteorological input data (e.g., three-dimensional time-dependent wind vector data), the transport simulation models provide various types of geospatial data that summarize different aspects of atmospheric transport (Figure 2c). Most notably, the simulation data consist of time-dependent three-dimensional (3D) trajectories of millions of simulation particles, time-dependent 3D particle density fields (i.e., 3D raster data), and time-dependent two-dimensional (2D) raster data with particle deposition rates. Whilst a plethora of 2D and 3D geospatial visualization tools and software libraries exist, most of these are not capable of processing in reasonable time the extremely large amounts of data that are involved in regional and continental scale transport simulations. Up to now, the interpretation and visualization of atmospheric dispersion simulation data mostly relied on 2D geographical maps and time-series data of air-concentration and deposition rates at individual locations in space. The quantification and visualization of 3D spatiotemporal dynamics of atmospheric transport of crop pathogens and insect pests on regional and continental scales remain a challenge.
Recent advances in computational graphics hardware and computer graphics software have enabled the development of a few specialized advanced 3D visualization tools that are capable of detailed visualization of high-resolution meteorological data and interactive 3D visual data analysis on regional and continental scales [29,30,31,32]. The leading tools for 3D visualization in Earth System Science include ParaView, Vapour, MeteoExplorer, and Met.3D [33,34,35,36,37]. These allow for using various advanced visualization methods—e.g., interactive sliding of cross-sections through 3D data volumes, indirect volume rendering via 3D isosurfaces and advanced flow visualization techniques—to interrogate time-dependent meteorological data (Figure 2d). The detailed 3D examination of meteorological data provides a method for studying the processes and mechanisms involved in meteorological extreme events.
In this study, we link an atmospheric transport model for crop pathogens and insect pests with novel visualization tools to obtain 3D visual representations of crop pathogen and insect pest transport on regional and continental scales. We discuss the usefulness of these 3D visualizations for assessing and communicating risks to agricultural production caused by extremely long-distance atmospheric transport events. In summary, the aims of the study are twofold: (i) obtain 3D insights into atmospheric transport of crop pathogens and insect pests on regional and continental scales; (ii) discuss the usefulness of 3D visual data analyses in the practical context of operational disease and pest management systems.

2. Materials and Methods

In a multi-institutional collaboration, we tested the feasibility and usefulness of novel methods from computer graphics for improving two operational crop disease and pest management systems—the wheat rust early warning system [23] and the FAO desert locust early warning system [27,38]. Our interdisciplinary approach involved the following workflow: (i) selection of a set of recent outbreak and infestation sites as trial sites based on ongoing operational field surveillance campaigns; (ii) use of data about outbreak/infestation intensity at trial sites to calibrate a LPDM for simulating long-range atmospheric transport of crop pathogens and insect pests from outbreak/infestations sites; (iii) development of an interface for passing the output from atmospheric transport simulations as input into novel computer graphics tools for 3D visualization; and (iv) integration of the resulting 3D visualizations as complementary data into decision-making processes and project meetings as part of operational crop disease and pest management systems. Figure 2 summarizes the conceptual framework for conducting 3D visual data analyses of long-range atmospheric transmission of crop pathogens and insect pests on regional and continental scales.

2.1. Study Region

We examined the three-dimensional atmospheric transport of crop pathogens and insect pests from a set of crop disease outbreak and insect infestation sites in East Africa, South West Asia and South East Asia. For desert locusts, a set of trial sites were selected during the last desert locust upsurge based on the latest detection sites reported from field monitor teams in Kenya, Ethiopia, Sudan, Somalia, Yemen, and Saudi Arabia.
For wheat rusts, two recent infection sites in Pakistan and India were used as trial sites, and one recent epidemic outbreak area in Ethiopia was selected. In the current paper, we provide a summary of results from a selected subset of study locations (Figure 3). The study locations are situated in a diverse set of landscapes with different climatic conditions, ranging from mountainous areas in the East African Rift Valley to the northern plains of India.

2.2. Crop Disease and Insect Pest Surveillance Data

Surveillance data for wheat stem rust caused by Puccinia graminis f. sp. tritici (Pgt) and wheat stripe rust caused by Puccinia striiformis f.sp. tritici (Pst) were obtained from the International Maize and Wheat Improvement Centre’s (CIMMYT) RustTracker system [39], and Desert Locust ground surveillance data were obtained from FAOs desert locust management system [40].

2.3. Meteorological Data

We used high-resolution global meteorological data from the UK Met Office’s (UKMO) Unified Model [41]. The gridded meteorological data cover the globe with a horizontal resolution of approximately 10 km at 70 vertical levels.

2.4. Atmospheric Transport Simulations

Long-distance spore dispersal of pathogens causing wheat rusts and flight of desert locusts were simulated using the Numerical Atmospheric-Dispersion Modelling Environment (NAME)—the UKMO’s LPDM [42]. In summary, NAME is a stochastic simulation model that uses meteorological data to simulate atmospheric transport processes, including release/take-off, survival during atmospheric transport, and deposition/landing. For simulating atmospheric transport of the pathogenic fungal spores that transmit wheat rusts, we used a previously tested model configuration that is also used as part of a semi-operational wheat rust early warning system [2,17,18,20,23], which we adapted to the outbreak location and intensity at the set of trial sites in East Africa and South Asia for the purpose of this study. Desert locust swarm flights were simulated using a newly developed adaptation of NAME (Thurston et al., in prep.). Preliminary tests were also conducted using another atmospheric transport model, the Hybrid Single-Particle Lagrangian Integrated Trajectory Model (HYSPLIT) [15,43], with desert locust test data obtained from M. Cohen (pers. comm.).

2.5. Three-Dimensional Visual Data Analysis

Two different types of visual data analysis were used: interactive and non-interactive three-dimensional data visualization. Our focus was on exploratory interactive visual data analyses using the open-source meteorological visualization tool Met.3D [36,37]. For non-interactive 3D data visualization, we used both Met.3D and the open-source general-purpose visualization framework ParaView [33]. To allow for visually analyzing the output of atmospheric transport simulations along with the UKMO’s meteorological data using the visualization tools Met.3D and ParaView, we developed a set of data conversion scripts. These converted the UKMO’s meteorological data and the NAME transport simulation data to a generic Network Common Data Form (NetCDF) file format that could be processed by the visualization tools Met.3D and ParaView. A set of visualization methods was then tested for exploratory interactive data visualization. These included sliding horizontal and vertical cross-sections through three-dimensional data volumes; different terrain visualization techniques; various flow visualization techniques (single trajectories, trajectory-ensembles, particle-ensembles); and direct and indirect volume rendering techniques (e.g., 3D isosurfaces). To address questions around the influence of meteorological factors on survival during atmospheric transport, we included a new feature into the source code of Met.3D that allowed for interactive 3D sampling and visualization of meteorological data along particle trajectories (see Movie S1) [44].

2.6. Computing Hardware

The meteorological transport simulations and the computations for interactive 3D visualization of high-resolution data on large spatial scales described here required high-performance computing resources. The NAME transport simulations were conducted on the UKMO’s supercomputer. Results were transferred to servers at the University of Cambridge and the University of Hamburg for further modelling and 3D visualization. The visualization methods in Met.3D were based on dedicated implementations for Graphical Processing Units (GPUs), as these allowed for achieving the necessary computational speed for interactive 3D visual data analyses.

2.7. Prototype for Automated 3D Visualization of Short-Term Forecasts of Desert Locust Swarm Flight

We developed and tested a prototype for automated 3D visualization of short-term NAME forecasts that estimated the risk for desert locust swarm flight for up to 5 days into the future. For this, the simulation data from routine NAME forecasts conducted at the UKMO were transferred to a dedicated graphics server at the University of Hamburg. Data processing and visualization was automated to routinely produce 3D movies as a complement to 2D risk maps, illustrating NAME output from the UKMO. The 3D movies were shared with practitioners in the FAOs operational desert locust early warning system for helping to inform decisions about surveillance and control operations.

2.8. Evaluation in Context of Operational Crop Disease and Pest Management Systems

The development and evaluation of 3D data visualizations were embedded into the operational context of two advanced crop disease and pest management systems: the wheat rust early warning system [23] and the desert locust early warning system [27]. Initially designed for wheat stem rust in Ethiopia, the wheat rust early warning system provided daily predictions of spore dispersal, risks of infection for stripe and leaf, as well as stem rust during the wheat growing seasons in Ethiopia, Kenya, Bangladesh, and Nepal. The FAO desert locust management system combined a set of surveillance and early warning tools, including a data collection app, a data management system, a tailored Geographical Information System (GIS), and support structures for national desert locust units. It was deployed across all countries exposed to infestation by desert locusts. As part of this study, a set of 3D visualizations were shared with practitioners during regular stakeholder meetings (including bi-weekly meetings over the course of 6 months during the recent DL upsurge) for discussion and evaluation of feasibility and usefulness for both research questions and practical decision-making.

3. Results

Results from the application of novel visualization techniques at a set of trial sites across East Africa and South East Asia are summarized, first for long-distance spore dispersal of wheat stem rust (Section 3.1) and second for desert locust swarm flight (Section 3.2).

3.1. Case 1: Wheat Rusts

3.1.1. Time-Lapse of Three-Dimensional Dynamics of Extremely Long-Distance Atmospheric Transport Events

In our first numerical experiment, we simulated 10 days of Pgt spore release from a detection site in southern Pakistan in March 2018 and visualized the resulting atmospheric transport pattern in 3D (Movie S2; Figure 4a–c). The release time was chosen such that it coincided with meteorological conditions suitable for extremely long-distance transport. The Pgt spore cloud exhibited complex spatiotemporal dynamics, such as a nuanced increase in vertical transport during daytime. The visualization provided insights into the representation of diurnal changes in the intensity of vertical mixing in NAME simulations (due to variations in both turbulence and deep convection intensity). It was apparent from the 3D visualization that the Himalayas served as a transport barrier for the outer parts of the spore cloud. When the spore cloud hit the Himalayas, an upwards motion of spores from the lower plains along the mountain range towards higher altitudes was observed in the model outputs (Movie S2, seconds 7–12).
In our second simulation experiment, we simulated 10 days of transmission and deposition of Pst spore release in March 2018 from a detection site in northern India—one of the most important wheat production zones worldwide. We chose the release time such that it coincided with the time of particularly strong winds in the northern plains. The approximate order of magnitude of viable spores in different parts of the spore cloud was visualized by colouring simulation particles according to viable spore density (Movie S3, Figure 4d–f). The majority of spores were transported along the mountain range. The NAME model was used to simulate wet and dry deposition as well as the sedimentation of spores, with wet deposition accounting for most of the spore transport from the atmosphere to the surface (Figure 4d–f). The simulated spore concentration at higher altitudes was extremely low (approximately 8–10 orders of magnitude lower than at the release location; see colouring of particles reaching higher altitudes in Figure 4d–f). Whilst the effect of altitude on spore viability was indirectly accounted for in our simulation (via an increased UV radiation dose at these altitudes), the effect of temperature as an important secondary environmental factor relative to UV radiation was not yet explicitly accounted for in the NAME model. The newly introduced additional features in Met.3D (Section 2.4) that allowed for the visualization of air temperature and other meteorological variables along the atmospheric pathway of simulated spores in 3D provided a method for detailed case-analyses as part of future improvements to the viability component in the spore transport model. For this case, preliminary analyses of air temperatures and spore survival at these altitudes indicated that spores would not remain viable once they reached very high altitudes necessary to cross the mountains, even if this low probability event of long-range transport over the entire northern plains of India occurred.

3.1.2. Interactive 3D Visual Analysis of Extremely Long-Range Atmospheric Pathogen Transport

We tested the application of interactive 3D visualization as a method for exploratory visual analyses of long-range rust spore transport patterns at two trial sites. For the case study at trial site one, we extended the analyses of simulation data from a previous study [2] of spore release from an outbreak site in one of the main wheat production zones in Ethiopia. Movie S4 demonstrates a range of interactive visualization methods that include the interactive sliding of horizontal and vertical cross sections through 3D meteorological data (e.g., to track horizontal and vertical wind fields). These were combined with the visualization of the simulated spore-ensemble to illustrate the dynamic effects of meteorological variables on simulated transport pathways (Movie S4, Figure 5a). For the second case study at trial site two, we simulated spore release from an outbreak site in northern India. By visualizing the time evolution of the position of each simulation particle in 3D in combination with the temporal dynamics of 3D iso-surfaces of the particle concentration field, we can visually examine details of spatiotemporal plume dynamics (Movie S5, Figure 5b). Interactive slicing of particle data and iso-surfaces reveals the inner structure of the spore cloud over the Himalayas. The exploratory examples shown here demonstrate how interactive 3D visualization provides a flexible technique for explorative visual analysis for case studies of spore dispersal.

3.2. Case 2: Desert Locusts

3.2.1. Three-Dimensional Visualization of Long-Range Desert Locust Swarm Flight

We tested different methods for simulating and visualizing desert locust swarm flight: (i) a single HYSPLIT trajectory visualized as a 3D tube (Movie S6, Figure 6a); (ii) a NAME trajectory ensemble visualized as a 3D tube along the mean trajectory surrounded by a set of transparently shaded single trajectories that indicated uncertainty around the mean transport trajectory (Movie S7, Figure 6b); (iii) a NAME particle ensemble visualized as a discrete particle cloud in spherical coordinates (Movie S8, Figure 6c). In areas with complex terrain (e.g., the Rift Valley in Movie S7), the 3D perspectives provided useful additional insights. For example, they showed that an initial model version overestimated the desert locust flight altitude substantially (comparison with typical flight altitudes and other modelling approaches, see [15,25,26]), a shortcoming that was, subsequently, fixed as part of model improvements. In other cases (e.g., single trajectory over flat terrain), no additional value was apparent, and spatial perception in complex 3D views was a challenge.

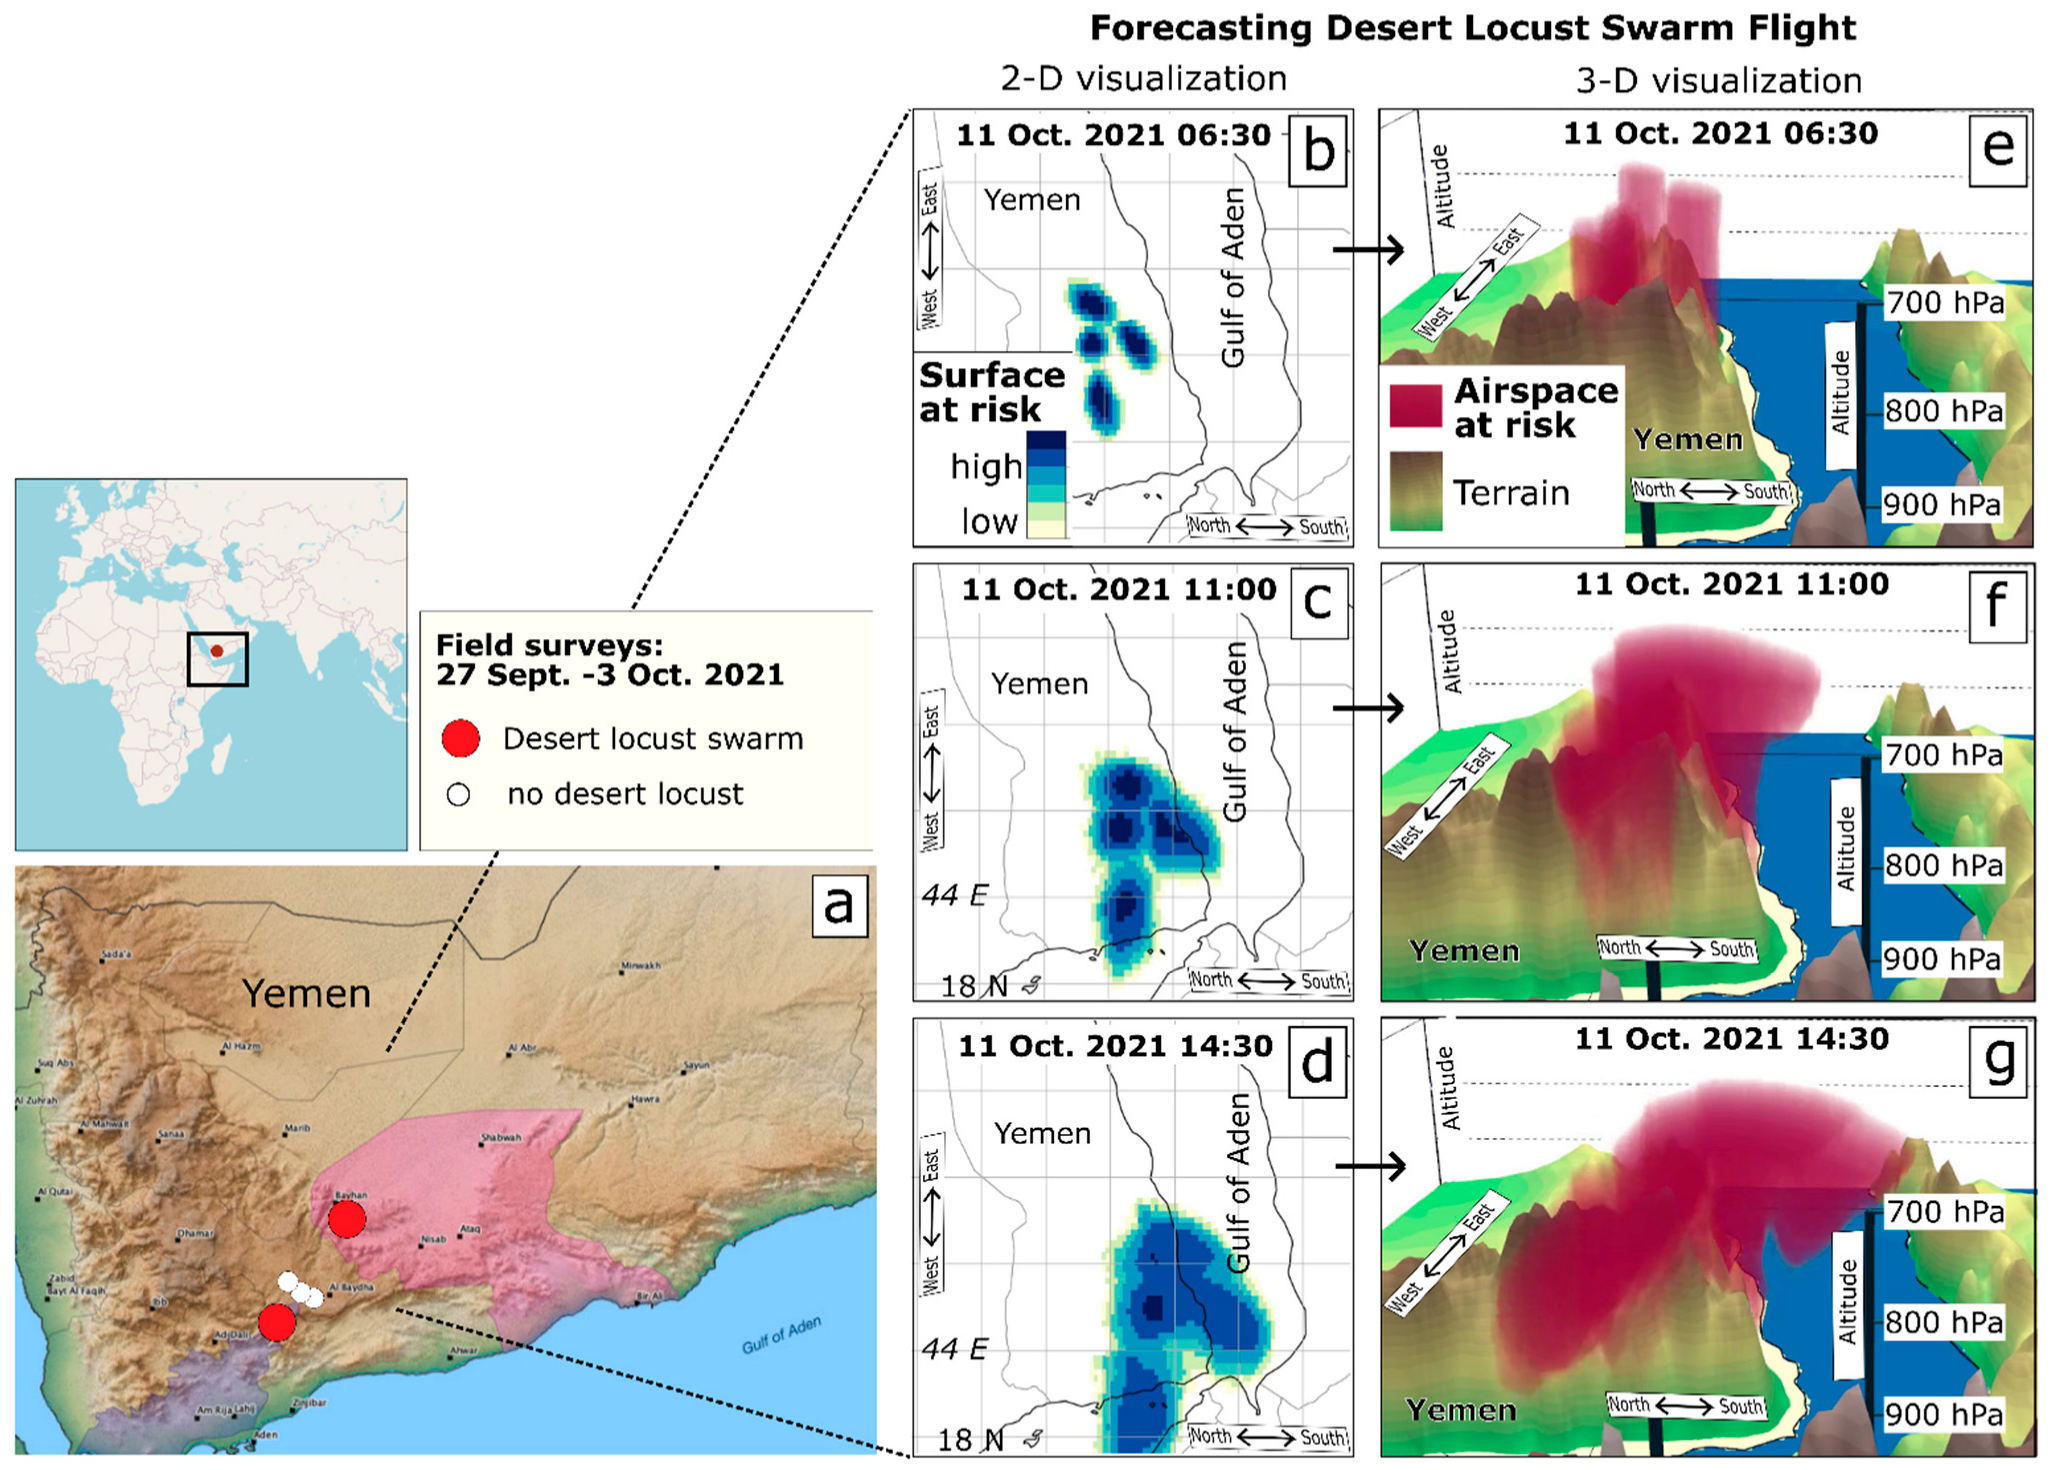
3.2.2. Automated Three-Dimensional Visualization of Short-Term Desert Locust Swarm Flight Forecasts

We developed a prototype for the automated production of time-lapse movies for 3D visualization of short-term desert locust swarm flight forecasts (Movies S9–S11, Figure 7). During the recent desert locust upsurge in East Africa, locust detection sites observed as part of operational field surveillance campaigns were used as source locations for atmospheric transport forecast simulations (Figure 7a). Forecast simulation results were visualized as 2D risk maps (Figure 7b–d) complemented by a set of 3D time-lapse movies (e.g., Movies S9–S11, Figure 7e–g). The standard procedure we used for obtaining a risk forecast score to quantify the risk of a locust swarm reaching a location x is based on vertically integrating the simulated locust density in forecast simulations above location x during a certain time interval (each pixel/location in the risk maps in Figure 7b–d is coloured according to the vertical integral of simulated locust density). Whilst this procedure provided an aggregated 2D risk map, it did not account for flight altitudes and vertical dynamics. This led to forecast interpretation errors, especially in areas with complex terrain and complex flight patterns, for example, the overestimation of risk if locust swarms in simulations were transported at unrealistically high altitudes.
To improve model interpretation, we complemented the 2D risk map with 3D visualizations. The 3D movies proved to be a useful complement for 2D risk maps for aiding model interpretation and risk assessments by the FAO Desert Locust management system team in areas with complex terrain or complex transport patterns. By automatically producing 3D Movies of locust flight simulations twice a week over a test-period of three months, we were able to examine and discuss flight simulations on a regular basis with the FAO team. This enabled, for example, the identification of an unusual transport event over the Gulf of Aden, which was not visible in 2D risk maps. On the 11th of October 2021, simulated locust swarms descended into a low air pressure region after crossing the mountains in southern Yemen and before reaching the coast of East Africa. The descending motion over the Gulf of Aden was not apparent in the 2D maps (compare Figure 7b–d with Figure 7e–g and Movies S9–S11). The same flight simulation was visualized using different camera orientations to illustrate the simulated 3D plume structure from different perspectives, increasing the level of detail and enhancing spatial perception. The 3D visuals of desert locust swarm flight forecasts were included as additional support for early warning and early response analyses by the FAOs operational desert locust management system during the 2021 upsurge in East Africa.

4. Discussion

Our discussion of the usefulness of novel advanced 3D geospatial visualization methods for improving agrometeorological risk assessments and crop disease management systems is summarized in Table 1.
For the interactive visualization of large datasets, Met.3D is recommended because the GPU implementation of core visualization methods provides the necessary computational speed. For producing non-interactive, high-quality visualizations and time-lapse movies, or for interactive visual analysis of smaller datasets, ParaView is likely the better choice, as it is far more flexible, stable, and rich in features. In the Supplementary Material, we provide a step-by-step guide for producing a simple 3D visualization of NAME simulation results with both Met.3D and ParaView (Supplementary Material). Whilst interactive 3D visual data analysis provides a powerful tool, it is restricted to exploratory case analyses by means of manual interaction between a user and the data via the graphical user interface of the visualization tool. The combination of explorative interactive visual data analyses of individual cases with systematic statistical analyses of a set of cases has proven to be a useful workflow for advancing understanding of weather extremes [45].
The level of detail in the three-dimensional dispersion simulation model output and visualizations thereof greatly exceed the level of detail that is usually available from observational data. Thus far, observational data about atmospheric transport of crop pathogens and pests is usually available only at a set of point locations on the surface or, in exceptional cases, from airborne sampling via drones or planes. This implies that it is currently not feasible to rigorously validate the 3D dynamics visualized here by means of comparison with empirically observed transport patterns. Newly emerging technologies, such as, e.g., sensors tagged to locusts (D. Hughes, pers. comm.), promise the availability of detailed 3D empirical data.

5. Conclusions

Advanced 3D geospatial data visualization is increasingly used in meteorological research but has not yet been tested to examine long-distance atmospheric dispersion of economically important agricultural pests and pathogens. By integrating novel approaches from computer graphics with atmospheric transport simulations, adapted to recent wheat rust outbreak sites and desert locust swarm infestation sites, we were able to obtain detailed 3D visualizations of the simulated long-range atmospheric transport of crop pathogens and insect pests on regional and continental scales (Movies S2–S11). The practical usefulness of the advanced 3D visualization methods for improving risk estimates and early warning was evaluated and discussed in the context of two operational crop disease and insect pest management systems.
Our exploratory study shows that novel interactive and non-interactive 3D visualization methods can be a useful complement to standard 2D visualization methods for investigating atmospheric transport events and for improving crop management systems. We also highlight several challenges associated with advanced 3D visualization techniques (Table 1). The tools and methods introduced here can be applied to other pathogens, pests, and geographical areas and can improve understanding of risks posed to agricultural production by crop disease and insect pest transmission caused by meteorological extreme events.
The tools used here for epidemiological risk assessments can also be applied to a range of other atmospheric dispersion problems such as, e.g., the atmospheric transport of hazardous material after nuclear, chemical, or biological accidents. For future work, we see significant potential in the following lines of research: (i) progress from the exploratory analyses described here to the semi-operational integration of 3D visualizations into crop disease and pest early warning systems; (ii) identify systematically for which cases the 3D visuals provide added value compared with standard 2D visualizations; (iii) conduct detailed case studies of selected long-range dispersion events (e.g., atmospheric transport of a particular pathogen during a particular storm event) and, more broadly, detailed case studies of meteorological extreme events; (iv) carry out exploratory analyses of complex meteorological processes and mechanisms that drive long-range crop pathogen and insect pest transport; (v) apply the visualization methods introduced here on smaller landscape scales, for which observational data from UAVs become available [10] for comparison with 3D visualizations; (vi) use newly available sensor data on DL flight tracks (D. Hughes, pers. comm.) to validate 3D visualizations; (vii) combine novel approaches from remote sensing to monitor the spread of diseases and pests [46,47] with advanced atmospheric transport simulations and novel methods for 3D visualization introduced here; (viii) use 3D visuals for communication of modelling results and for raising awareness for risks to agricultural production in discussions with practitioners and decision-makers outside the academic community.

Supplementary Materials

The following supporting information can be downloaded at: https://www.mdpi.com/article/10.3390/atmos14060910/s1, Movie S1: Method for interactive 3D visual sampling of meteorological data along Lagrangian particle trajectories in Met.3D; Movie S2: Simulated 3D dynamics of atmospheric Pgt spore transport from a detection site in Pakistan; Movie S3: Simulated 3D dynamics of atmospheric Pst spore transport and deposition from a detection site in India; Movie S4: Interactive 3D visual analysis of pathogen dispersal simulations and meteorological data; Movie S5: Interactive 3D visual analysis of a simulated pathogenic spore cloud over complex terrain (Himalaya); Movie S6: Interactive 3D visual analysis of a single HYSPLIT trajectory for indicating likely paths of Desert Locust swarm flight; Movie S7: Interactive 3D visual analysis of NAME desert locust swarm flight simulations in an area with complex terrain; Movie S8: 3D visualization of simulated desert locust swarm flight in spherical coordinates using ParaView; Movie S9: Automated 3D visualization of short-term forecasts of desert locust swarm flight risks from a detection site in Yemen (camera pointing towards the east); Movie S10: Automated 3D visualization of short-term forecasts of desert locust swarm flight risks from a detection site in Yemen (camera pointing towards the north); Movie S11: Automated 3D visualization of short-term forecasts of desert locust swarm flight risks from a detection site in Yemen (camera pointing towards the south-west). Example code and tutorial for producing a simple 3D visualization: Minimal examples, code snippets for data conversions, step-by-step guide, and links for producing a simple 3D visualization of NAME simulation data using Met.3D or ParaView.

Author Contributions

Conceptualization, M.M., K.C. and C.A.G.; Data curation, M.M., W.T., D.P.H. and K.C.; Formal analysis, M.M.; Funding acquisition, M.M., S.C.M., D.P.H. and C.A.G.; Investigation, M.M., W.T., A.S., J.W.S., D.P.H., K.C. and C.A.G.; Methodology, M.M. and W.T.; Project administration, M.M., S.C.M. and C.A.G.; Resources, M.M., J.W.S., S.C.M., D.P.H., K.C. and C.A.G.; Software, M.M.; Supervision, M.M., S.C.M., K.C. and C.A.G.; Validation, M.M. and W.T.; Visualization, M.M. and A.S.; Writing—original draft, M.M.; Writing—review and editing, M.M., W.T., J.W.S., D.P.H., K.C. and C.A.G. All authors have read and agreed to the published version of the manuscript.

Funding

MM acknowledges funding from the Deutsche Forschungsgemeinschaft (DFG, German Research Foundation) under Germany’s Excellence Strategy—EXC 2037 “CLICCS—Climate, Climatic Change, and Society”—project 40 number 390683824, the contribution to the Center for Earth System Research and Sustainability (CEN) of Universität Hamburg. CAG and JWS gratefully acknowledge support to the University of Cambridge from the Bill and Melinda Gates Foundation (BMGF) and the UK Foreign, Commonwealth and Development Office (FCDO) for wheat rust modelling (INV-010472) and a subgrant for desert locust modelling from the UK Foreign, Commonwealth and Development Office (FCDO) as a supplement to a joint BMGF/FCDO initiative in African Crop Epidemiology Systems (INV-003892).

Institutional Review Board Statement

Not applicable.

Informed Consent Statement

Not applicable.

Data Availability Statement

Crop disease and pest data are available publicly (CIMMYT—Rusttracker, 2019; FAO Desert Locust Data, 2022). Meteorological data from the UK Met Office are available upon request and subject to license agreements. The atmospheric dispersal model NAME is available upon request and subject to license agreements. The atmospheric trajectory model HYSPLIT is publicly available (https://www.ready.noaa.gov/HYSPLIT.php, accessed on 24 March 2023). Both the visualization tool Met.3D (https://met3d.readthedocs.io/en/latest/, accessed on 24 March 2023) and the visualization framework ParaView (https://www.paraview.org/, accessed on 24 March 2023) are available publicly. Code for data conversions, step-by-step guides, and links to documentation for producing a simple 3D visualization of NAME simulation data for both Met.3D and ParaView are provided in the Supplementary Materials.

Acknowledgments

We greatly acknowledge the feedback and discussions during regular stakeholder meetings as part of the desert locust and the wheat rust early warning systems. We would also like to express gratitude to NOAA for providing test data and technical expertise around HYSPLIT desert locust simulations. M.M. thankfully acknowledges the helpful technical discussions regarding Met.3D coding and automation with members of the Visual Data Analysis Group at the Regional Computing Centre, Universität Hamburg, and he would like to express great appreciation for the opportunity to conduct this research, aside from other duties as part of the CLICCS project.

Conflicts of Interest

The authors declare no conflict of interest. The funders had no role in the design of the study; in the collection, analyses, or interpretation of data; in the writing of the manuscript, or in the decision to publish the results.

References

  1. Aylor, D.E. Aerial Dispersal of Pollen and Spores; American Phytopathological Society: St. Paul, MN, USA, 2017. [Google Scholar]
  2. Meyer, M.; Cox, J.A.; Hitchings, M.D.T.; Burgin, L.; Hort, M.C.; Hodson, D.P.; Gilligan, C.A. Quantifying airborne dispersal routes of pathogens over continents to safeguard global wheat supply. Nat. Plants 2017, 3, 780–786. [Google Scholar] [CrossRef] [PubMed]
  3. Brown, J.K.M.; Hovmøller, M.S. Aerial dispersal of pathogens on the global and continental scales and its impact on plant disease. Science 2002, 297, 537–541. [Google Scholar] [CrossRef] [PubMed]
  4. Chapman, J.W.; Reynolds, D.R.; Wilson, K. Long-range seasonal migration in insects: Mechanisms, evolutionary drivers and ecological consequences. Ecol. Lett. 2015, 18, 287–302. [Google Scholar] [CrossRef] [PubMed]
  5. Isard, S.A.; Russo, J.M.; Ariatti, A. The integrated aerobiology modeling system applied to the spread of soybean rust into the Ohio River valley during September 2006. Aerobiologia 2007, 23, 271–282. [Google Scholar] [CrossRef]
  6. Roelfs, A.P.; Singh, R.P.; Saari, E.E. Rust Diseases of Wheat: Concepts and Methods of Disease Management; CIMMYT International Maize and Wheat Improvement Center: Texcoco, Mexico, 1992. [Google Scholar]
  7. Symmons, P.M.; Cressman, K. Desert Locust Guidelines Biology and Behavior; Food and Agriculture Organization of the United Nations: Rome, Italy, 2001. [Google Scholar]
  8. Gregory, P.H. The dispersion of air-borne spores. Trans. Br. Mycol. Soc. 1945, 28, 26–72. [Google Scholar] [CrossRef]
  9. Chapman, J.W.; Nesbit, R.L.; Burgin, L.E.; Reynolds, D.R.; Smith, A.D.; Middleton, D.R.; Hill, J.K. Flight orientation behaviors promote optimal migration trajectories in high-flying insects. Science 2010, 327, 682–685. [Google Scholar] [CrossRef]
  10. Schmale, D.G.; Ross, S.D.; Fetters, T.L.; Tallapragada, P.; Wood-Jones, A.K.; Dingus, B. Isolates of Fusarium graminearum collected 40–320 meters above ground level cause fusarium head blight in wheat and produce trichothecene mycotoxins. Aerobiologia 2012, 28, 1–11. [Google Scholar] [CrossRef]
  11. Viljanen-Rollinson, S.L.H.; Parr, E.L.; Marroni, M.V. Monitoring long distance spore dispersal by wind—A review. N. Z. Plant Prot. 2007, 60, 291296. [Google Scholar] [CrossRef]
  12. Ahmadi, P.; Mansor, S.; Farjad, B.; Ghaderpour, E. Unmanned Aerial Vehicle (UAV)-Based Remote Sensing for Early-Stage Detection of Ganoderma. Remote Sens. 2022, 14, 1239. [Google Scholar] [CrossRef]
  13. Zhang, X.; Bian, F.; Wang, Y.; Hu, L.; Yang, N.; Mao, H. A Method for Capture and Detection of Crop Airborne Disease Spores Based on Microfluidic Chips and Micro Raman Spectroscopy. Foods 2022, 11, 3462. [Google Scholar] [CrossRef]
  14. Aylor, D.E. The role of intermittent wind in the dispersal of fungal pathogens. Annu. Rev. Phytopathol. 1990, 28, 73–92. [Google Scholar] [CrossRef]
  15. Cohen, M.; Zinn, S.; Cressman, K.; Newcomb, L.; Matlock, G.; Stein, A. Locust Forecasting with the NOAA Hysplit model. In Proceedings of the American Meteorological Society, 101st Annual Meeting, Virtual, 10–15 January 2020. [Google Scholar]
  16. Isard, S.A.; Gage, S.H.; Comtois, P.l.; Russo, J.M. Principles of the atmospheric pathway for invasive species applied to soybean rust. BioScience 2005, 55, 851–861. [Google Scholar] [CrossRef]
  17. Olivera-Firpo, P.D.; Newcomb, M.; Szabo, L.J.; Rouse, M.N.; Johnson, J.L.; Gale, S.W.; Luster, D.; Hodson, D.P.; Cox, J.A.; Burgin, L.E.; et al. Phenotypic and genotypic characterization of race TKTTF of Puccinia graminis f. sp. tritici that caused a wheat stem rust epidemic in southern Ethiopia in 2013/14. Phytopathology 2015, 105, 917–928. [Google Scholar] [CrossRef]
  18. Meyer, M.; Burgin, L.; Hort, M.C.; Hodson, D.P.; Gilligan, C.A. Large scale atmospheric dispersal simulations identify likely airborne incursion routes of wheat stem rust into Ethiopia. Phytopathology 2017, 107, 1175–1186. [Google Scholar] [CrossRef]
  19. Prank, M.; Kenaley, S.C.; Bergstrom, G.C.; Acevedo, M.; Mahowald, N.M. Climate change impacts the spread potential of wheat stem rust, a significant crop disease. Environ. Res. Lett. 2019, 14, 124053. [Google Scholar] [CrossRef]
  20. Visser, B.; Meyer, M.; Park, R.F.; Gilligan, C.A.; Burgin, L.E.; Hort, M.C.; Hodson, D.P.; Pretorius, Z.A. Microsatellite analysis and urediniospore dispersal simulations support the movement of Puccinia graminis f. sp. tritici from southern Africa to Australia. Phytopathology 2019, 109, 133–144. [Google Scholar] [CrossRef]
  21. Wang, Y.P.; Wu, M.F.; Lin, P.J.; Wang, Y.; Chen, A.D.; Jiang, Y.Y.; Zhai, B.P.; Chapman, J.W.; Hu, G. Plagues of Desert Locusts: Very Low Invasion Risk to China. Insects 2020, 11, 628. [Google Scholar] [CrossRef]
  22. Cunniffe, N.J.; Koskella, B.E.; Metcalf, C.J.; Parnell, S.; Gottwald, T.R.; Gilligan, C.A. Thirteen challenges in modelling plant diseases. Epidemics 2015, 10, 6–10. [Google Scholar] [CrossRef]
  23. Allen-Sader, C.; Thurston, W.; Meyer, M.; Nure, E.; Bacha, N.; Alemayehu, Y.; Stutt, R.O.J.H.; Safka, D.; Craig, A.P.; Derso, E.; et al. An early warning system to predict and mitigate wheat rust diseases in Ethiopia. Environ. Res. Lett. 2019, 14, 115004. [Google Scholar] [CrossRef]
  24. Isard, S.A.; Russo, J.M.; Magarey, R.D.; Golod, J.; VanKirk, J.R. Integrated pest information platform for extension and education (iPiPE): Progress through sharing. J. Integr. Pest Manag. 2015, 6, 15. [Google Scholar] [CrossRef]
  25. Cressman, K. Current methods of desert locust forecasting at FAO. EPPO Bull. 1996, 26, 577–585. [Google Scholar] [CrossRef]
  26. Cressman, K. Desert Locust Guidelines Information and Forecasting; Food and Agriculture Organization of the United Nations: Rome, Italy, 2001. [Google Scholar]
  27. Cressman, K. The use of new technologies in desert locust early warning. Outlooks Pest Manag. 2008, 19, 55–59. [Google Scholar] [CrossRef]
  28. McIntosh, R.A.; Wellings, C.R.; Park, R.F. Wheat Rusts: An Atlas of Resistance Genes; CSIRO Publications: Melbourne, Australia, 1995. [Google Scholar]
  29. Orf, L.; Wilhelmson, R.; Lee, B.; Finley, C.; Houston, A. Evolution of a Long-Track Violent Tornado within a Simulated Supercell. Bull. Am. Meteorol. Soc. 2017, 98, 45–68. [Google Scholar] [CrossRef]
  30. Rautenhaus, M.; Böttinger, M.; Siemen, S.; Hoffman, R.; Kirby, R.M.; Mirzargar, M.; Röber, N.; Westermann, R. Visualization in Meteorology—A Survey of Techniques and Tools for Data Analysis Tasks. IEEE Trans. Vis. Comput. Graph. 2018, 24, 3268–3296. [Google Scholar] [CrossRef]
  31. Roeber, N.; Boettinger, M. Visualization of Climate Science Simulation Data. IEEE Comput. Graph. Appl. 2021, 41, 42–48. [Google Scholar] [CrossRef]
  32. Wright, H. Introduction to Scientific Visualization; Springer: London, UK, 2007. [Google Scholar]
  33. Ayachit, U. The ParaView Guide: A Parallel Visualization Application; Kitware: New York, NY, USA, 2015. [Google Scholar]
  34. Li, S.; Jaroszynski, S.; Pearse, S.; Orf, L.; Clyne, J. VAPOR: A Visualization Package Tailored to Analyze Simulation Data in Earth System Science. Atmosphere 2019, 10, 488. [Google Scholar] [CrossRef]
  35. Yu, L. MeteoExplorer: Visual data analysis software for atmospheric and geoscientists. Meteorol. Appl. 2020, 27, e1916. [Google Scholar] [CrossRef]
  36. Rautenhaus, M.; Kern, M.; Schäfler, A.; Westermann, R. Three-dimensional visualization of ensemble weather forecasts—Part 1: The visualization tool Met.3D (version 1.0). Geosci. Model Dev. 2015, 8, 2329–2353. [Google Scholar] [CrossRef]
  37. Rautenhaus, M.; Grams, C.M.; Schäfler, A.; Westermann, R. Three-dimensional visualization of ensemble weather forecasts—Part 2: Forecasting warm conveyor belt situations for aircraft-based field campaigns. Geosci. Model Dev. 2015, 8, 2355–2377. [Google Scholar] [CrossRef]
  38. Cressman, K. Desert Locust, Biological and Environmental Hazards, Risks, and Disasters; Shroder, J.F., Sivanpillai, R., Eds.; Elsevier: Amsterdam, The Netherlands, 2016; pp. 87–105. [Google Scholar]
  39. CIMMYT—RustTracker. A Global Wheat Rust Monitoring System. 2019. Available online: http://rusttracker.cimmyt.org/ (accessed on 20 May 2023).
  40. FAO Desert Locust Data. Available online: https://www.fao.org/locusts/en/ (accessed on 20 May 2023).
  41. Walters, D.; Baran, A.J.; Boutle, I.; Brooks, M.; Earnshaw, P.; Edwards, J.; Furtado, K.; Hill, P.; Lock, A.; Manners, J.; et al. The Met office unified model global atmosphere 7.0/7.1 and JULES global land 7.0 configurations. Geosci. Model Dev. 2019, 12, 1909–1963. [Google Scholar] [CrossRef]
  42. Jones, A.; Thomson, D.; Hort, M.; Devenish, B. The UK Met office’s next generation atmospheric dispersion model NAMEIII. In Air Pollution Modelling and Its Application; Borrego, C., Norman, L.A., Eds.; Springer: Berlin/Heidelberg, Germany, 2007; pp. 580–589. [Google Scholar] [CrossRef]
  43. Stein, A.F.; Draxler, R.R.; Rolph, G.D.; Stunder, B.J.B.; Cohen, M.D.; Ngan, F. NOAA’s HYSPLIT atmospheric transport and dispersion modeling system. Bull. Am. Meteorol. Soc. 2015, 96, 2059–2077. [Google Scholar] [CrossRef]
  44. Met.3D—Code Repository. Available online: https://gitlab.com/wxmetvis/met.3d (accessed on 20 May 2023).
  45. Meyer, M.; Polkova, I.; Modali, K.R.; Schaffer, L.; Baehr, J.; Olbrich, S.; Rautenhaus, M. Interactive 3-D visual analysis of ERA5 data: Improving diagnostic indices for marine cold air outbreaks and polar lows. Weather Clim. Dyn. 2021, 2, 867–891. [Google Scholar] [CrossRef]
  46. Youssefi, F.; Zoej, M.J.V.; Hanafi-Bojd, A.A.; Dariane, A.B.; Khaki, M.; Safdarinezhad, A.; Ghaderpour, E. Temporal Monitoring and Predicting of the Abundance of Malaria Vectors Using Time Series Analysis of Remote Sensing Data through Google Earth Engine. Sensors 2022, 22, 1942. [Google Scholar] [CrossRef]
  47. Zhao, H.; Yang, C.; Guo, W.; Zhang, L.; Zhang, D. Automatic Estimation of Crop Disease Severity Levels Based on Vegetation Index Normalization. Remote Sens. 2020, 12, 1930. [Google Scholar] [CrossRef]
Figure 1. Pictures of the crop diseases and pests considered here as case study examples for testing three-dimensional geospatial data visualization methods on regional and continental scales. (a) Case study 1: wheat rusts. Pictures from left to right: stem rust infected plant tissue, stripe rust infected vs. non-infected wheat field, and pathogenic spore cloud released from an infected wheat field; (b) Case study 2: desert locusts. Pictures from left to right: individual insects consuming plant tissue, flying insects, desert locust swarm over the city of Addis Ababa, Ethiopia. Picture credits to CIMMYT, FAO, GRRC, D. Hodson, K. Cressman, and [28].
Atmosphere 14 00910 g001
Figure 2. Conceptual framework for three-dimensional visual analyses of atmospheric transport of crop pathogens and insect pests on regional and continental scales. (a) Extremely large earth system data are processed using high-performance computing resources and fed into (b) mechanistic atmospheric transport simulations. Results from transport simulations and earth system data processing are stored in a variety of (c) data grids and types. (d) The data are visualized in 3D using a range of advanced geospatial data visualization techniques.
Atmosphere 14 00910 g002
Figure 3. Case study locations for examining three-dimensional atmospheric transport of crop pathogens and insect pests on regional and continental scales.
Atmosphere 14 00910 g003
Figure 4. Three-dimensional dynamics of long-range atmospheric transport of fungal pathogens transmitting wheat rusts. (ac) Snapshots from Movie S2, visualizing atmospheric dispersal in simulation of Pgt spore release from a detection site in southern Pakistan; (df) Snapshots from Movie S3, visualizing atmospheric dispersal, spore deposition, and cloud water in simulation of Pst spore release from a detection site in northern India. Movies S2 and S3 show the full 10-day time-lapse of simulated 3D spore transport dynamics.
Atmosphere 14 00910 g004
Figure 5. Interactive three-dimensional visual analyses of simulated long-range atmospheric pathogen transport. (a) Snapshot from Movie S4, illustrating the use of interactive visualization methods to examine the wind data field that drives pathogen transport in simulations (source in the Bale-zone, Ethiopia). See Movie S4 for an illustration of various key techniques for exploratory interactive visual data analysis; (b) Snapshot from Movie S5, illustrating the slicing of a simulated pathogen spore cloud for visually examining its 3D structure. The red arrows indicate interactive movement of visualization elements. See Movie S5 for details.
Atmosphere 14 00910 g005
Figure 6. Testing model configurations for three-dimensional simulation and visualization of desert locust swarm flight. (a) Single trajectory visualized as a 3D tube; (b) trajectory ensemble visualized as a tube along the mean trajectory surrounded by a transparent set of single trajectories to indicate uncertainties; (c) discrete particle cloud. See Movies S6–S8 for time-lapse animations of (ac).
Atmosphere 14 00910 g006
Figure 7. Automated short-term forecasts of desert locust swarm flight risk. (a) Desert locust detection sites in Yemen; (bd) Two-dimensional risk maps showing the surface areas at risk for desert locust invasion. The risk score is based on vertically integrating simulated desert locust density in the air column above each pixel on the map. (eg) Three-dimensional risk maps that indicate the air-space at risk for desert locust swarm flight. Please see Movies S9–S11 for details. The air-space at risk is based on the density of simulated desert locusts per 3D model grid-cell.
Atmosphere 14 00910 g007
Table 1. Advantages and disadvantages of 3D visual analyses of atmospheric dispersion simulations of long-range transport of crop pathogens and insect pests.
Advantages Disadvantages
Three-dimensional visualization enhanced our understanding and assessment of risk in areas with complex terrain. For example, it provided useful novel insights into complex transport patterns in the East African Rift Valley (Section 3.2.1; Movie S7) and around the Himalayas (Section 3.1; Movies S2–S3).Producing 3D visualizations is resource demanding (high computational costs; time-consuming manual configuration of 3D scene).
Three-dimensional visualization enhanced our understanding and assessment of risk in cases with complex anisotropic wind flow patterns. For example, it helped to identify an unusual atmospheric flow regime that increased the risk for desert locust flight from Yemen over the Gulf of Aden into the East African continent.
(Section 3.2.2).
Whilst it became evident that 3D visualization has the potential to provide added value and novel insights, in many cases, it did not add substantive value to standard 2D maps.
Interactive 3D visualization enables detailed exploratory analyses of specific cases of extremely long-distance transport events by providing insights into 3D structure and dynamics of simulation particle clouds and simulation particle density fields (Movies S4 and S5). It can help to improve understanding of atmospheric transport model behavior and model calibration. For example, it has motivated the development of a new temperature-dependent flight altitude scheme to improve forecasting of DL swarm movements (Section 3.2.1).Spatial perception is a key challenge in complex 3D scenes and often a sequence of 2D maps (e.g., along different altitudes) provides a clearer visualization that is easier to interpret and relate to observational data. Spatial perception is especially challenging when visualizing 3D spatiotemporal dynamics of scalar particle density fields (e.g., Movies S9–S11).
Combined interactive visualization of transport simulation data and meteorological data in one 3D scene helps analyze complex interactions between meteorology and pathogen/pest transport quantities and as such is useful for studying mechanisms driving long-distance atmospheric transport events (e.g., Movies S2–S5).The 3D visualizations are only as good as the 3D simulation data, which induces a notable uncertainty due to limitations in availability of high-quality multi-dimensional empirical data for calibration and validation of simulations.
Three-dimensional visualizations provide valuable material for communication, outreach, and raising awareness of risks to agricultural production. For example, 3D visuals can illustrate the various complex model components involved in atmospheric transport simulations and facilitate cross-disciplinary dialogue between modellers and practitioners advising on disease risk and control.The level of detail in 3D visualizations (e.g., 3D spatiotemporal dynamics of simulated DL swarm flight) goes far beyond the level of detail that is currently available in most observational data. This makes rigorous quantitative validation of representativeness of 3D visuals extremely difficult.
Three-dimensional visualizations provide new perspectives compared with standard 2D maps, which may facilitate the formulation of new hypotheses.The level of detail in 3D visualizations in some cases goes beyond the level of detail required for making informed decisions about the scale of surveillance and control. As such, 3D visualization is not relevant for practical decisions about surveillance and control measures in some cases.
Key novel aspects of the results presented here include: (i) we provide the most detailed 3D representation of long-range atmospheric transport of crop pathogens and insect pests on regional continental scales available in the literature, including the combined visualization of dynamic gridded meteorological data and atmospheric transport simulation data; (ii) we provide the first application of novel advanced computer graphics methods for interactive 3D data visualization in the field of agrometeorology; (iii) we integrate, for the first time, novel methods for 3D visualization into two operational crop disease and pest early warning systems and provide an exploratory study of feasibility and usefulness.
Disclaimer/Publisher’s Note: The statements, opinions and data contained in all publications are solely those of the individual author(s) and contributor(s) and not of MDPI and/or the editor(s). MDPI and/or the editor(s) disclaim responsibility for any injury to people or property resulting from any ideas, methods, instructions or products referred to in the content.

