
Stable Isotopes Unravel the Sources and Transport of PM2.5 in the Yangtze River Delta, China
 , and
, and 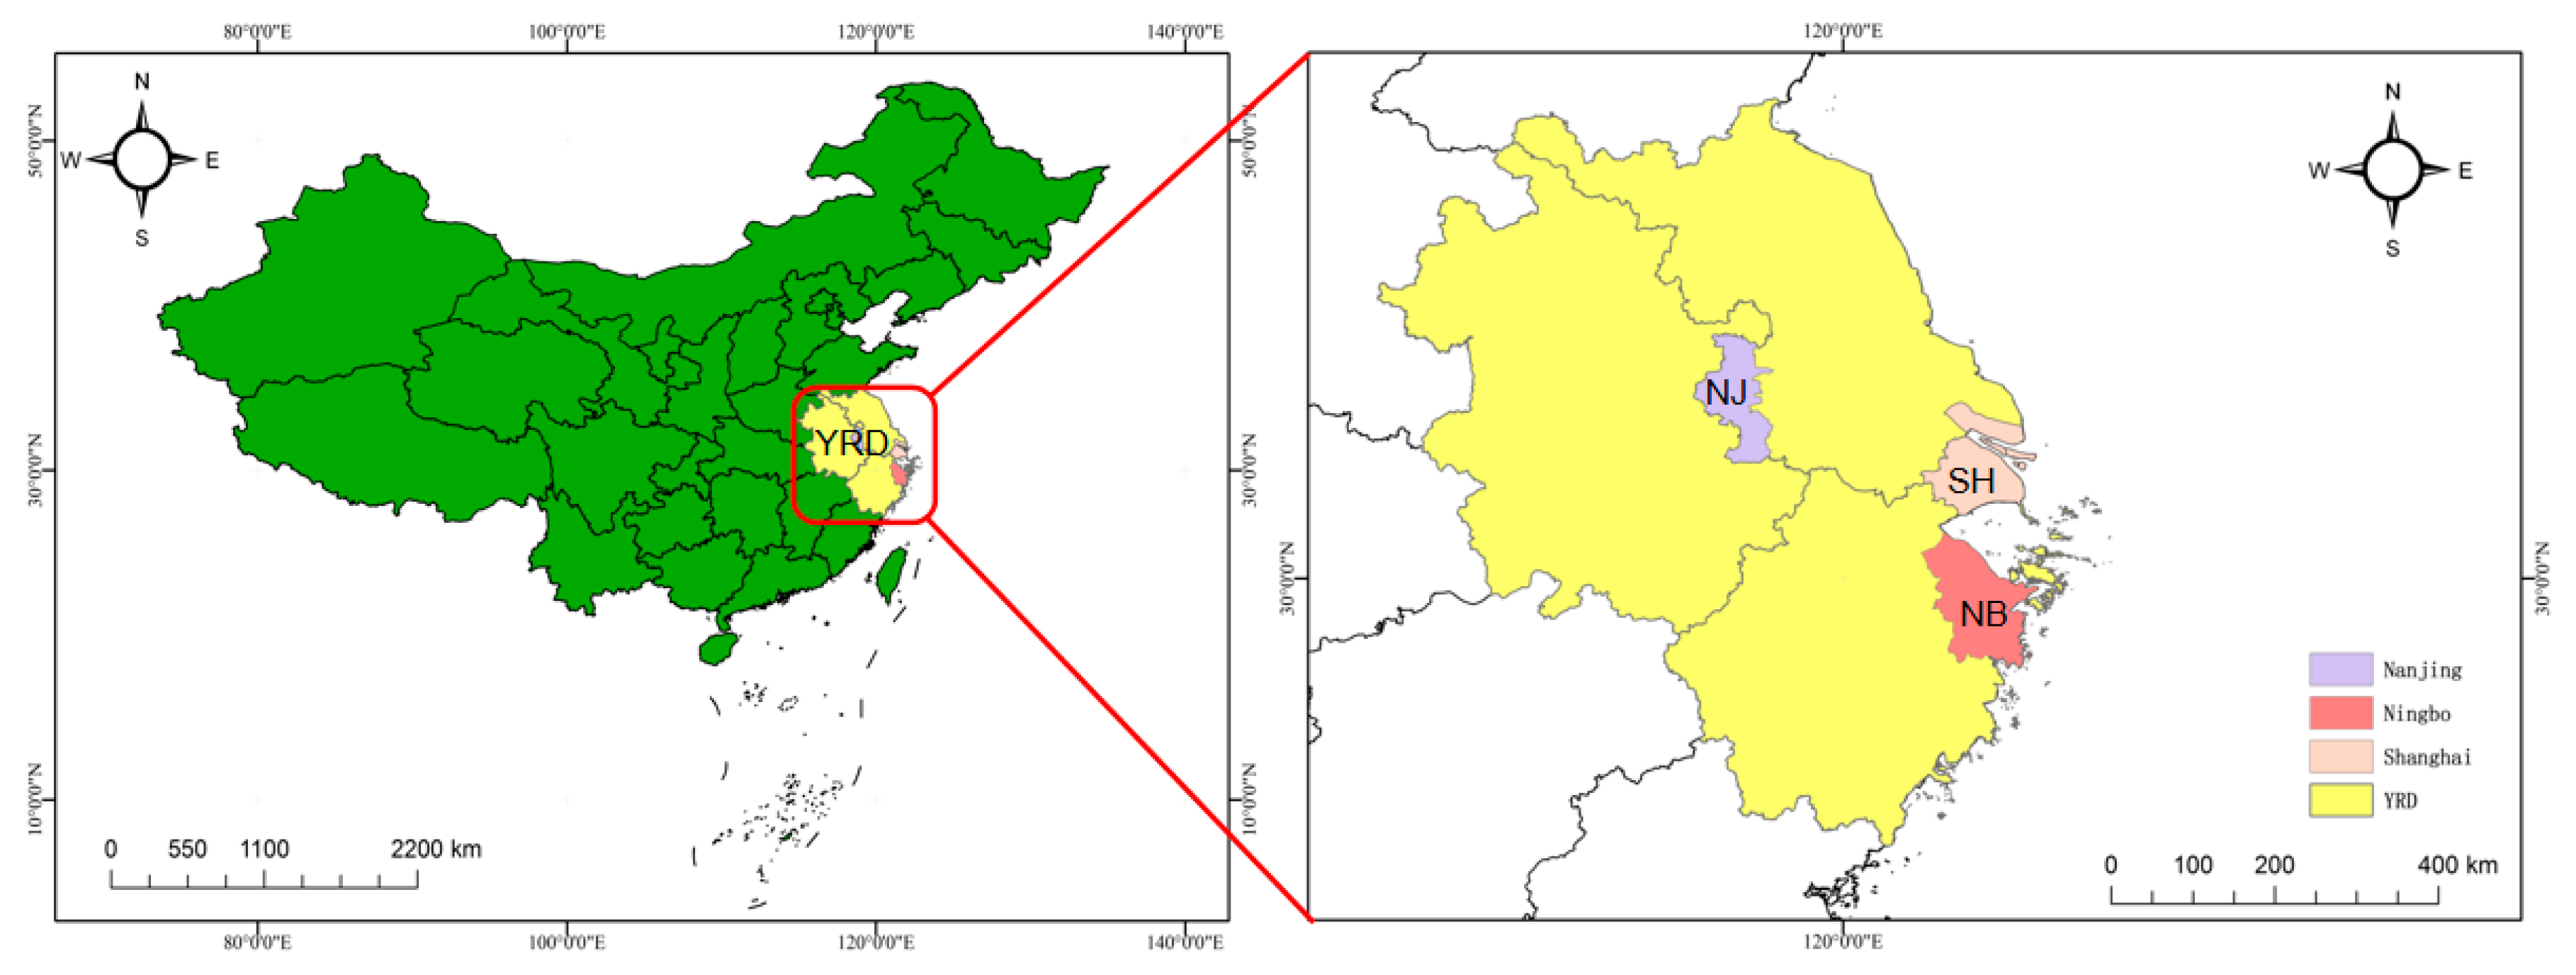
Abstract
:1. Introduction
2. Methods
2.1. Sampling Sites
2.2. Sample Collection
2.3. Sample Analysis
2.4. Quality Control and Quality Assurance
3. Results and Discussion
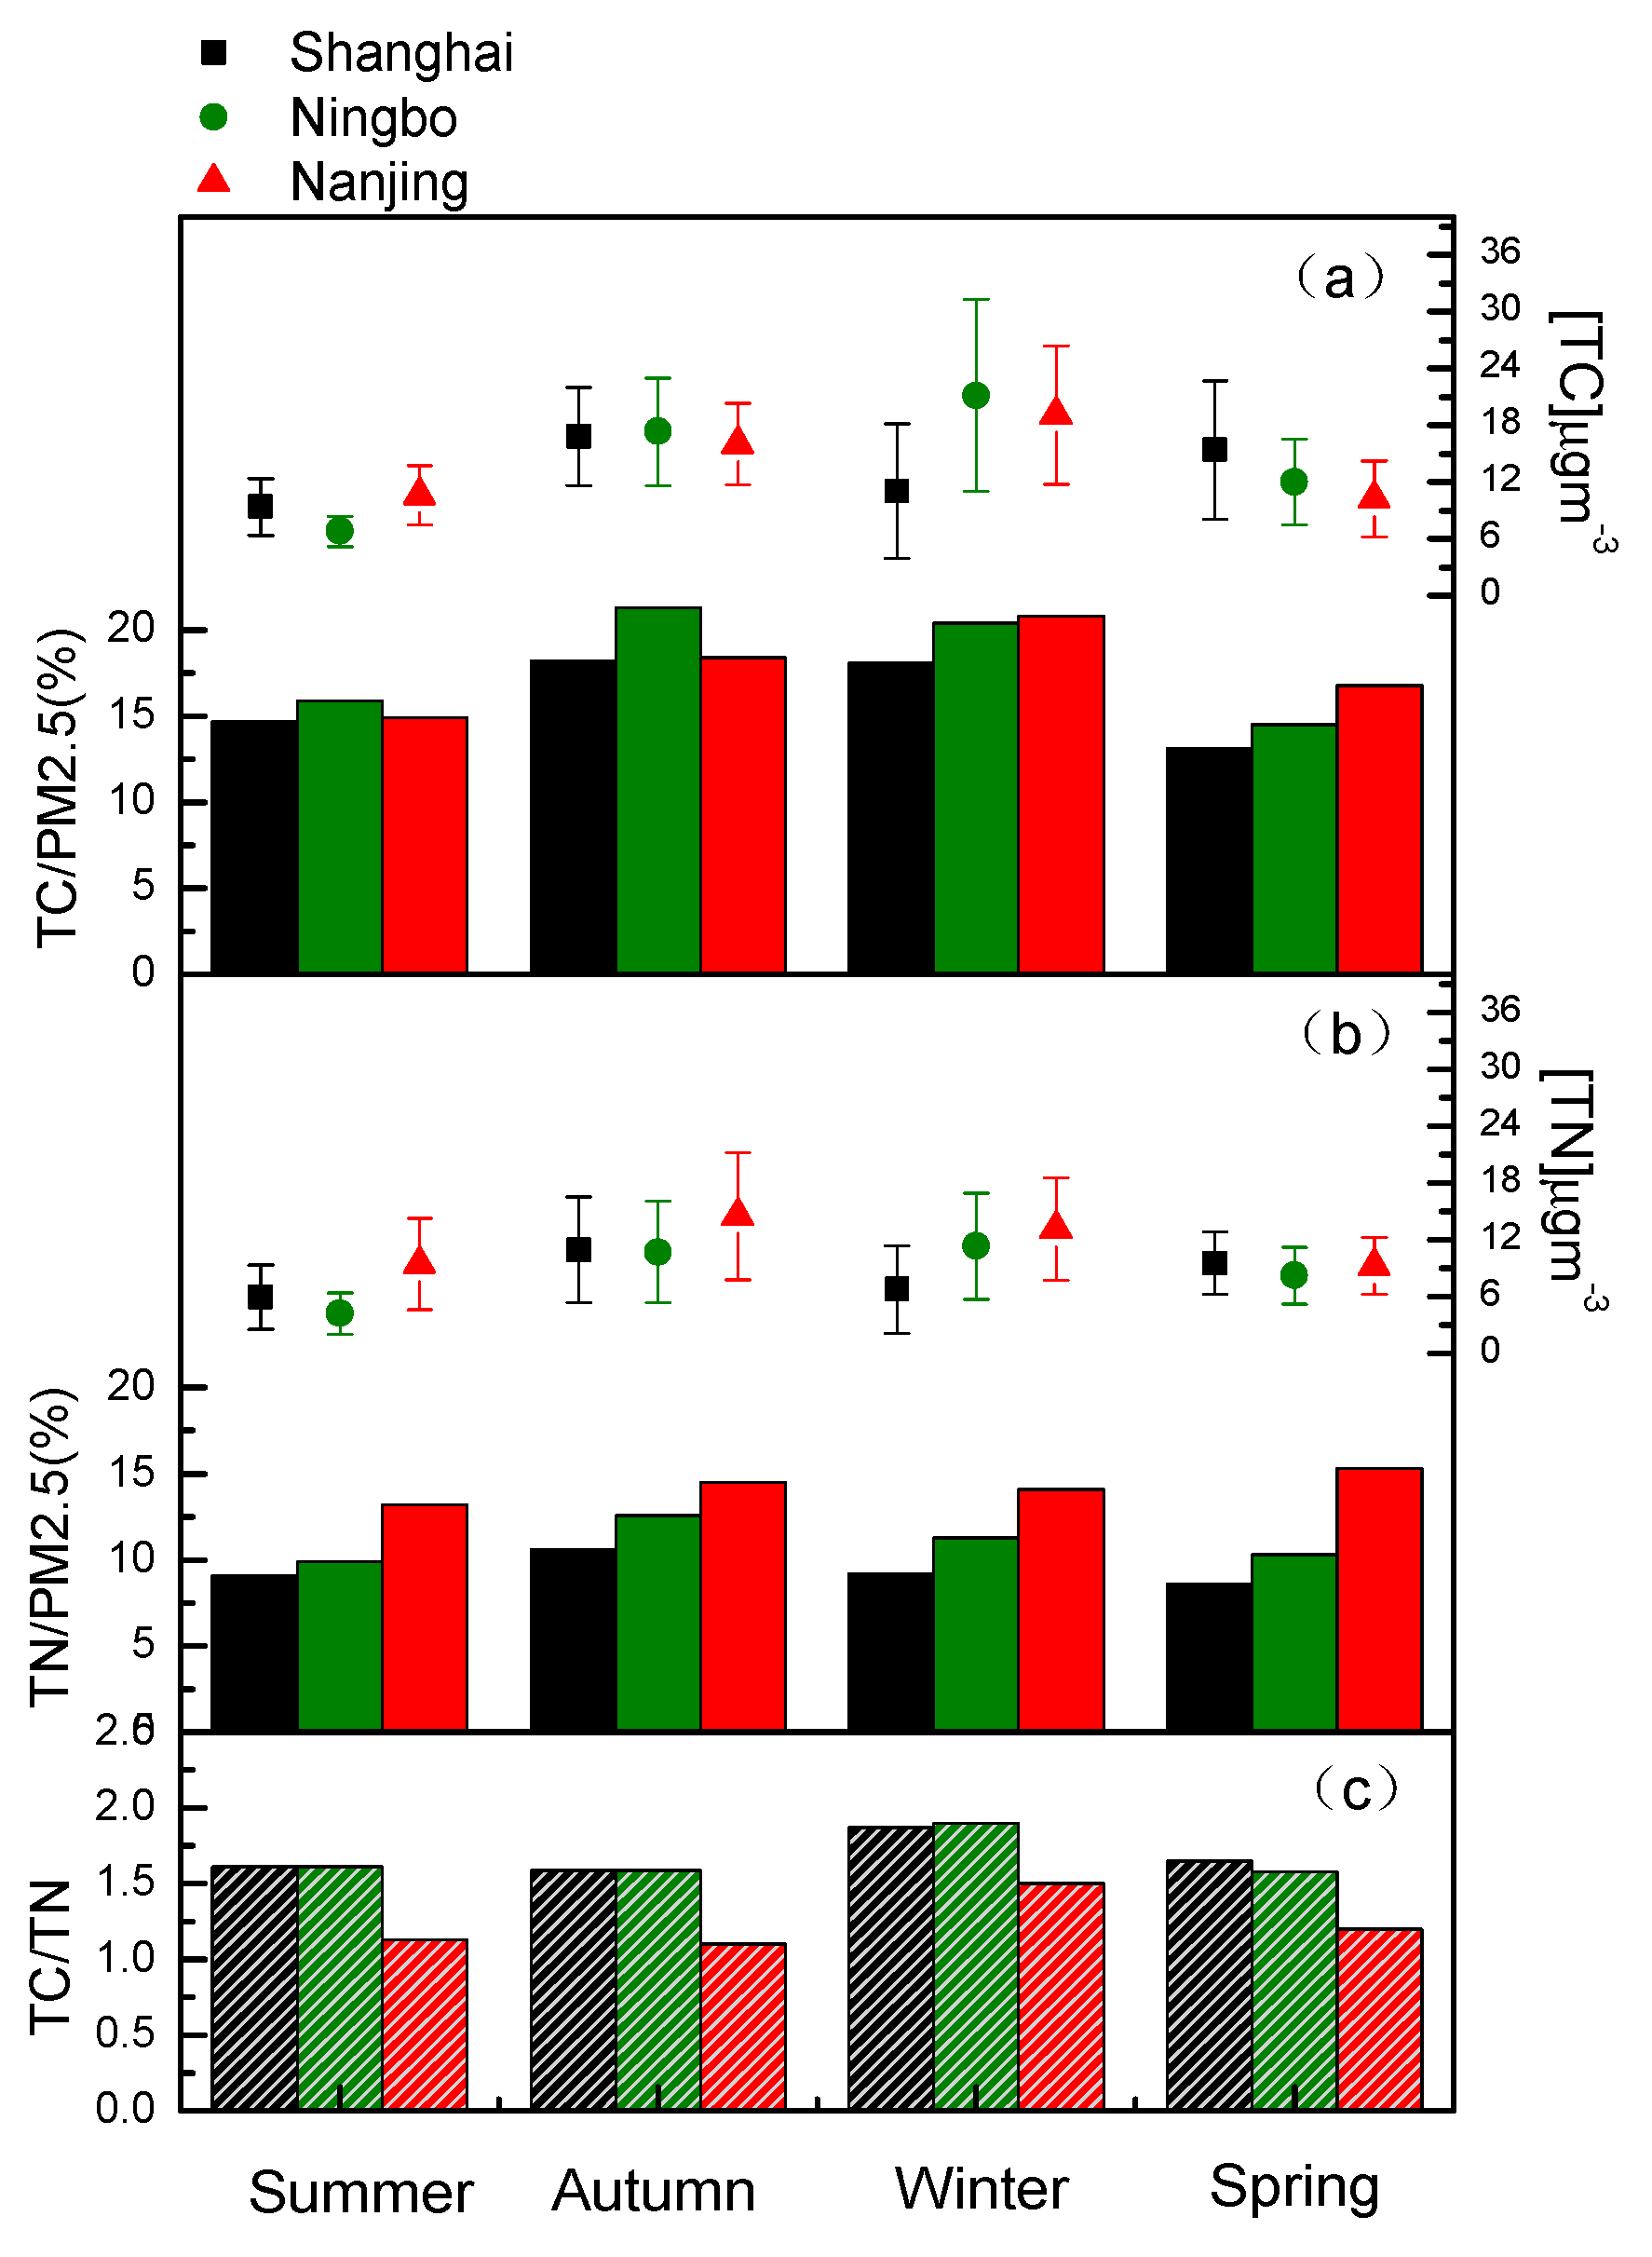
3.1. Levels of PM2.5, TC, TN and TC/TN Ratio of PM2.5 in the YRD
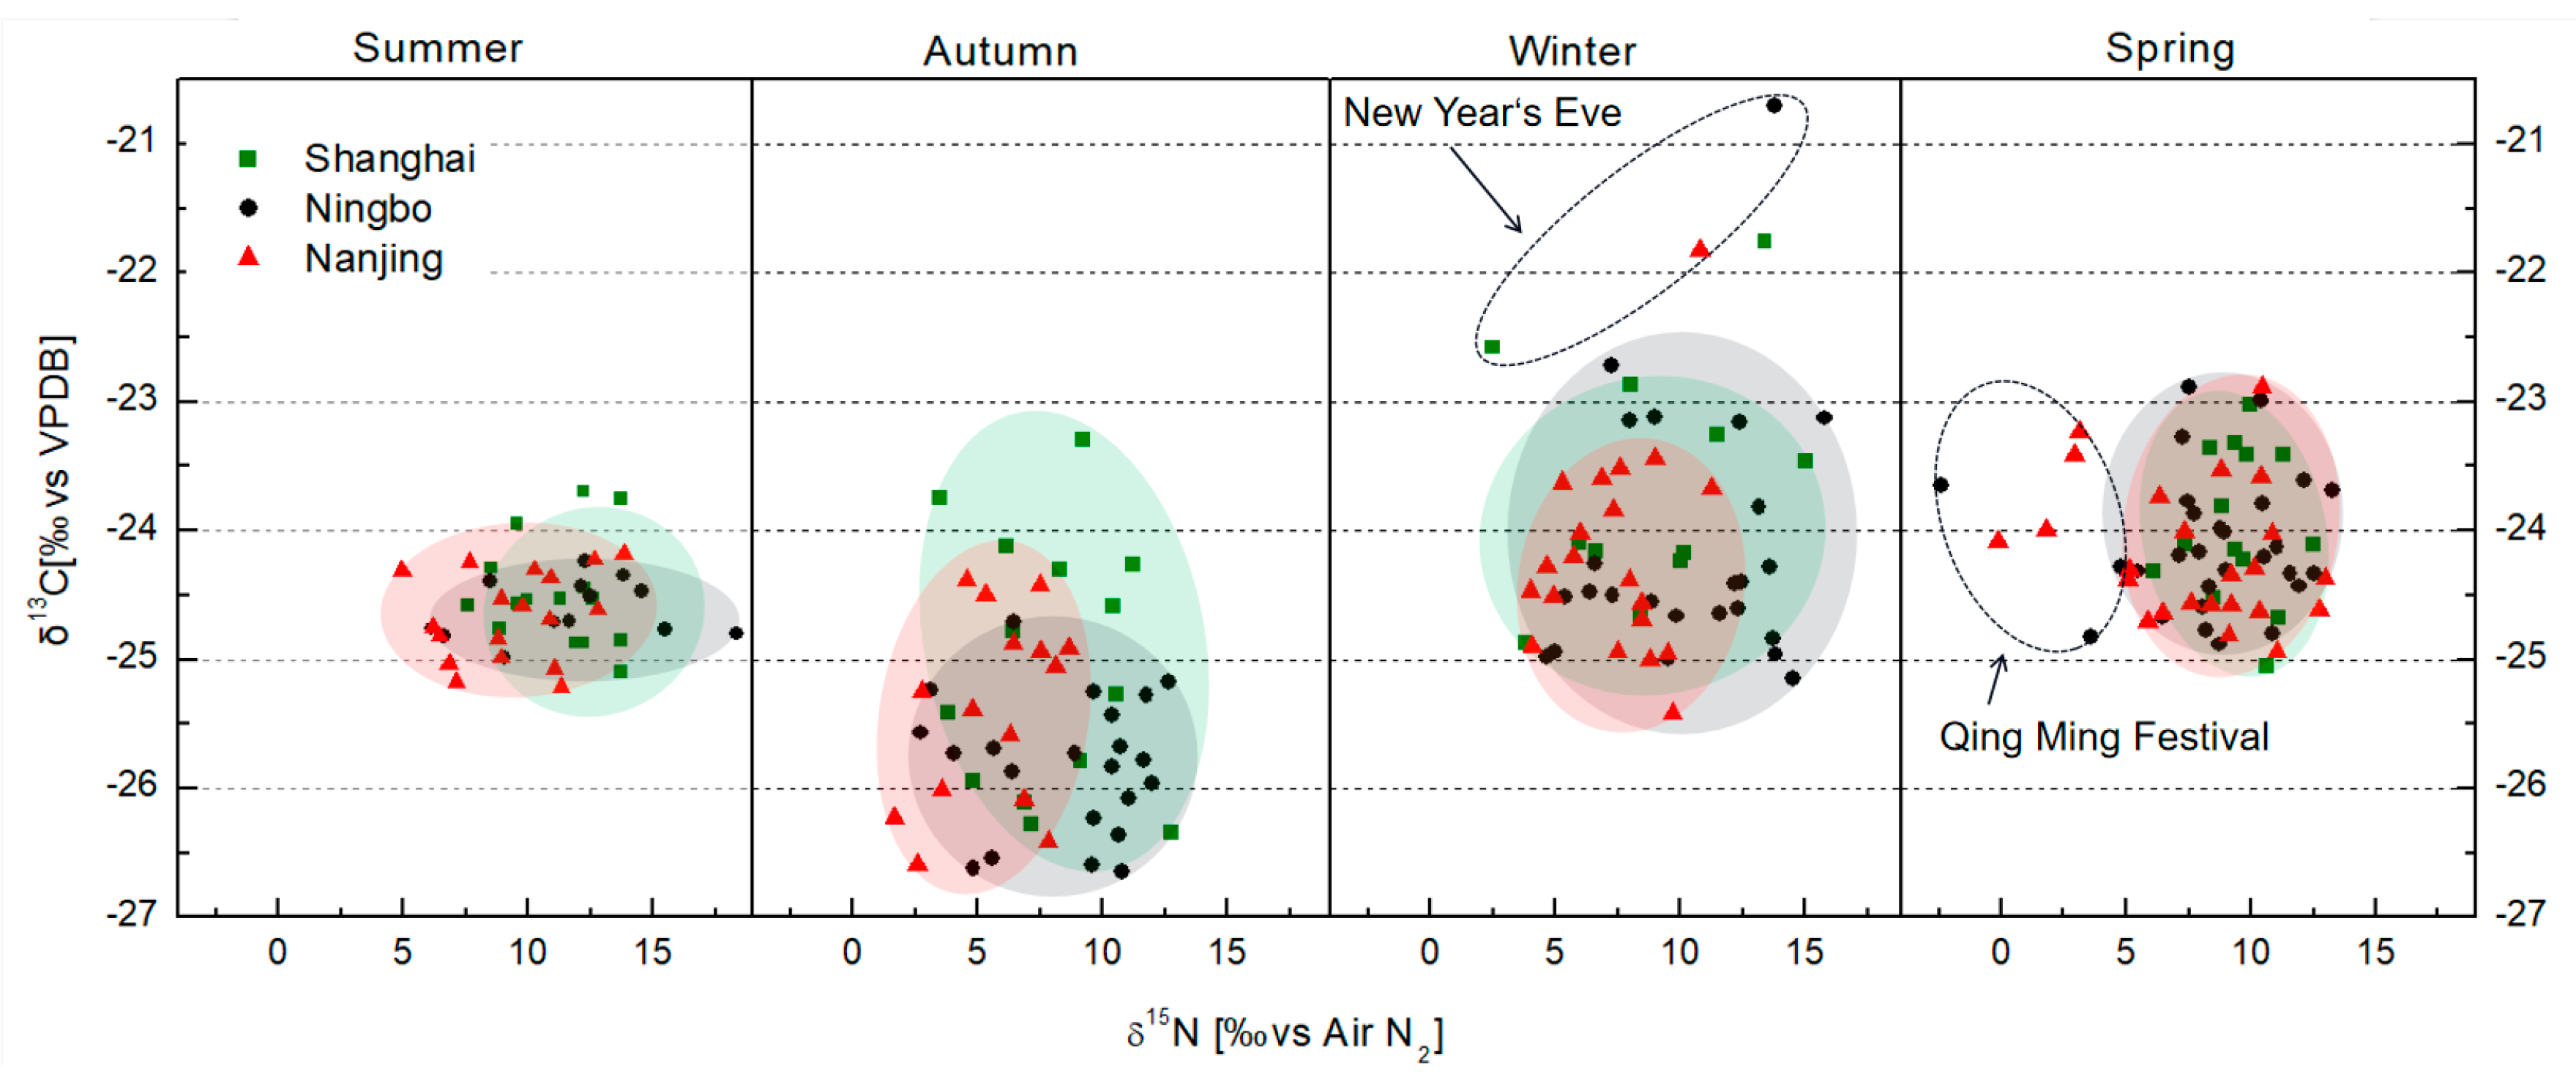
3.2. The Characteristics of δ13CTC and δ15NTN of PM2.5
3.3. Relationships between TC, TN, PM2.5, δ13C, and δ15N
3.4. Stable Isotopes Reflect the Impact of Unusual Events on PM2.5
3.5. Stable Isotopes Can Trace Air Mass Transport
4. Conclusions
Supplementary Materials
Author Contributions
Funding
Institutional Review Board Statement
Informed Consent Statement
Data Availability Statement
Acknowledgments
Conflicts of Interest
References
- Bi, X.; Dai, Q.; Wu, J.; Zhang, Q.; Zhang, W.; Luo, R.; Cheng, Y.; Zhang, J.; Wang, L.; Yu, Z.; et al. Characteristics of the main primary source profiles of particulate matter across China: From 1987 to 2017. Atmos. Chem. Phys. 2019, 19, 3223–3243. [Google Scholar] [CrossRef] [Green Version]
- Karagulian, F.; Belis, C.A.; Dora, C.F.C.; Prüss-Ustün, A.M.; Bonjour, S.; Adair-Rohani, H.; Amann, M. Contributions to cities’ ambient particulate matter (PM): A systematic review of local source contributions at global level. Atmos. Environ. 2015, 120, 475–483. [Google Scholar] [CrossRef]
- Qi, Z.; Zhang, Y.; Chen, Z.-F.; Yang, C.; Song, Y.; Liao, X.; Li, W.; Tsang, S.Y.; Liu, G.; Cai, Z. Chemical identity and cardiovascular toxicity of hydrophobic organic components in PM2.5. Ecotoxicol. Environ. Saf. 2020, 201, 110827. [Google Scholar] [CrossRef]
- Hopke, P.K.; Dai, Q.; Li, L.; Feng, Y. Global review of recent source apportionments for airborne particulate matter. Sci. Total Environ. 2020, 740, 140091. [Google Scholar] [CrossRef] [PubMed]
- Wu, H.; Tian, L.; Chen, B.; Jin, B.; Tian, B.; Xie, L.; Rogers, K.M.; Lin, G. Verification of imported red wine origin into China using multi isotope and elemental analyses. Food Chem. 2019, 301, 125137. [Google Scholar] [CrossRef] [PubMed]
- Zhao, S.; Zhao, Y.; Rogers, K.M.; Chen, G.; Chen, A.; Yang, S. Application of multi-element (C, N, H, O) stable isotope ratio analysis for the traceability of milk samples from China. Food Chem. 2020, 310, 125826. [Google Scholar] [CrossRef] [PubMed]
- Xu, S.; Kang, P.; Sun, Y.A. A stable isotope approach and its application for identifying nitrate source and transformation process in water. Environ. Sci. Pollut. Res. 2016, 23, 1133–1148. [Google Scholar] [CrossRef]
- Nikolenko, O.; Jurado, A.; Borges, A.V.; Knöller, K.; Brouyère, S. Isotopic composition of nitrogen species in groundwater under agricultural areas: A review. Sci. Total Environ. 2018, 621, 1415–1432. [Google Scholar] [CrossRef]
- Aguilera, J.; Whigham, L.D. Using the 13C/12C carbon isotope ratio to characterise the emission sources of airborne particulate matter: A review of literature. Isot. Environ. Health Stud. 2018, 54, 573–587. [Google Scholar] [CrossRef]
- Kawashima, H.; Haneishi, Y. Effects of combustion emissions from the Eurasian continent in winter on seasonal δ13C of elemental carbon in aerosols in Japan. Atmos. Environ. 2012, 46, 568–579. [Google Scholar] [CrossRef]
- Lim, S.; Lee, M.; Czimczik, C.I.; Joo, T.; Holden, S.; Mouteva, G.; Santos, G.M.; Xu, X.; Walker, J.; Kim, S.; et al. Source signatures from combined isotopic analyses of PM2.5 carbonaceous and nitrogen aerosols at the peri-urban Taehwa Research Forest, South Korea in summer and fall. Sci. Total Environ. 2019, 655, 1505–1514. [Google Scholar] [CrossRef]
- Boreddy, S.K.; Parvin, F.; Kawamura, K.; Zhu, C.; Lee, C.T. Stable carbon and nitrogen isotopic compositions of fine aerosols (PM2.5) during an intensive biomass burning over Southeast Asia: Influence of SOA and aging. Atmos. Environ. 2018, 191, 478–489. [Google Scholar] [CrossRef]
- Zhang, Y.; Benedict, K.B.; Tang, A.; Sun, Y.; Fang, Y.; Liu, X. Persistent Nonagricultural and Periodic Agricultural Emissions Dominate Sources of Ammonia in Urban Beijing: Evidence from 15N Stable Isotope in Vertical Profiles. Environ. Sci. Technol. 2019, 54, 102–109. [Google Scholar] [CrossRef] [PubMed]
- Wang, H.; An, J.; Shen, L.; Zhu, B.; Pan, C.; Liu, Z.; Liu, X.; Duan, Q.; Liu, X.; Wang, Y. Mechanism for the formation and microphysical characteristics of submicron aerosol during heavy haze pollution episode in the Yangtze River Delta, China. Sci. Total Environ. 2014, 490, 501–508. [Google Scholar] [CrossRef]
- Dong, X.; Li, J.; Fu, J.S.; Gao, Y.; Huang, K.; Zhuang, G. Inorganic aerosols responses to emission changes in Yangtze River Delta, China. Sci. Total Environ. 2014, 481, 522–532. [Google Scholar] [CrossRef] [PubMed]
- Huang, Q.; Wang, T.; Chen, P.; Huang, X.; Zhu, J.; Zhuang, B. Impacts of emission reduction and meteorological conditions on air quality improvement during the 2014 Youth Olympic Games in Nanjing, China. Atmos. Chem. Phys. 2017, 17, 13457–13471. [Google Scholar] [CrossRef] [Green Version]
- Aggarwal, S.G.; Kawamura, K.; Umarji, G.S.; Tachibana, E.; Patil, R.S.; Gupta, P.K. Organic and inorganic markers and stable C-, N-isotopic compositions of tropical coastal aerosols from megacity Mumbai: Sources of organic aerosols and atmospheric processing. Atmos. Chem. Phys. 2013, 13, 4667–4680. [Google Scholar] [CrossRef] [Green Version]
- Pavuluri, C.M.; Kawamura, K.; Swaminathan, T. Time-resolved distributions of bulk parameters, diacids, ketoacids and α-dicarbonyls and stable carbon and nitrogen isotope ratios of TC and TN in tropical Indian aerosols: Influence of land/sea breeze and secondary processes. Atmos. Res. 2015, 153, 188–199. [Google Scholar] [CrossRef]
- Mkoma, S.L.; Kawamura, K.; Tachibana, E.; Fu, P. Stable carbon and nitrogen isotopic compositions of tropical atmospheric aerosols: Sources and contribution from burning of C3 and C4 plants to organic aerosols. Tellus B 2014, 66, 20176. [Google Scholar] [CrossRef]
- Xing, J.; Song, J.; Yuan, H.; Wang, Q.; Li, X.; Li, N.; Duan, L.; Qu, B. Water-soluble nitrogen and phosphorus in aerosols and dry deposition in Jiaozhou Bay, North China: Deposition velocities, origins and biogeochemical implications. Atmos. Res. 2018, 207, 90–99. [Google Scholar] [CrossRef]
- Huang, R.J.; Zhang, Y.; Bozzetti, C.; Ho, K.F.; Cao, J.J.; Han, Y.; Daellenbach, K.R.; Slowik, J.G.; Platt, S.M.; Canonaco, F.; et al. High secondary aerosol contribution to particulate pollution during haze events in China. Nature 2015, 514, 218–222. [Google Scholar] [CrossRef] [PubMed] [Green Version]
- Geng, G.; Zhang, Q.; Tong, D.; Li, M.; Zheng, Y.; Wang, S.; He, K. Chemical composition of ambient PM2.5 over China and relationship to precursor emissions during 2005–2012. Atmos. Chem. Phys. 2017, 17, 9187–9203. [Google Scholar] [CrossRef] [Green Version]
- Pan, Y.; Tian, S.; Liu, D.; Fang, Y.; Zhu, X.; Zhang, Q.; Zheng, B.; Michalski, G.; Wang, Y. Fossil Fuel Combustion-Related Emissions Dominate Atmospheric Ammonia Sources during Severe Haze Episodes: Evidence from15N-Stable Isotope in Size-Resolved Aerosol Ammonium. Environ. Sci. Technol. 2016, 50, 8049–8056. [Google Scholar] [CrossRef] [Green Version]
- Wu, Y.; Gu, B.; Erisman, J.W.; Reis, S.; Fang, Y.; Lu, X.; Zhang, X. PM2.5 pollution is substantially affected by ammonia emissions in China. Environ. Pollut. 2016, 218, 86–94. [Google Scholar] [CrossRef] [PubMed] [Green Version]
- Cao, F.; Zhang, S.C.; Kawamura, K.; Zhang, Y.L. Inorganic markers, carbonaceous components and stable carbon isotope from biomass burning aerosols in Northeast China. Sci. Total Environ. 2016, 572, 1244–1251. [Google Scholar] [CrossRef] [PubMed]
- Tie, X.; Huang, R.J.; Dai, W.; Cao, J.; Long, X.; Su, X.; Zhao, S.; Wang, Q.; Li, G. Effect of heavy haze and aerosol pollution on rice and wheat productions in China. Sci. Rep. 2016, 6, 5–10. [Google Scholar] [CrossRef] [Green Version]
- Zhang, X.; Lu, Y.; Wang, Q.G.; Qian, X. A high-resolution inventory of air pollutant emissions from crop residue burning in China. Atmos. Environ. 2019, 213, 207–214. [Google Scholar] [CrossRef]
- Kirillova, E.N.; Andersson, A.; Sheesley, R.J.; Kruså, M.; Praveen, P.S.; Budhavant, K.; Safai, P.D.; Rao, P.S.P.; Gustafsson, Ö. 13C- And 14C-based study of sources and atmospheric processing of water-soluble organic carbon (WSOC) in South Asian aerosols. J. Geophys. Res. Atmos. 2013, 118, 614–626. [Google Scholar] [CrossRef]
- Felix, J.D.; Elliott, E.M.; Gish, T.J.; McConnell, L.L.; Shaw, S.L. Characterizing the isotopic composition of atmospheric ammonia emission sources using passive samplers and a combined oxidation-bacterial denitrifier approach. Rapid Commun. Mass Spectrom. 2013, 27, 2239–2246. [Google Scholar] [CrossRef]
- Xiao, H.; Huang, Z.; Zhang, J.; Zhang, H.; Chen, J.; Zhang, H.; Tong, L. Identifying the impacts of climate on the regional transport of haze pollution and inter-cities correspondence within the Yangtze River Delta. Environ. Pollut. 2017, 228, 26–34. [Google Scholar] [CrossRef]
- Kundu, S.; Kawamura, K.; Andreae, T.W.; Hoffer, A.; Andreae, M.O. Diurnal variation in the water-soluble inorganic ions, organic carbon and isotopic compositions of total carbon and nitrogen in biomass burning aerosols from the LBA-SMOCC campaign in Rondônia, Brazil. J. Aerosol Sci. 2010, 41, 118–133. [Google Scholar] [CrossRef] [Green Version]
- Baranyai, E.; Simon, E.; Braun, M.; Tóthmérész, B.; Posta, J.; Fábián, I. The effect of a fireworks event on the amount and elemental concentration of deposited dust collected in the city of Debrecen, Hungary. Air Qual. Atmos. Health 2015, 8, 359–365. [Google Scholar] [CrossRef] [PubMed] [Green Version]
- Walters, W.W.; Goodwin, S.R.; Michalski, G. Nitrogen stable isotope composition (δ15N) of vehicle-emitted NOx. Environ. Sci. Technol. 2015, 49, 2278–2285. [Google Scholar] [CrossRef] [PubMed]
- Park, Y.M.; Park, K.S.; Kim, H.; Yu, S.M.; Noh, S.; Kim, M.S.; Kim, J.Y.; Ahn, J.Y.; Seok, K.S.; Kim, Y.H. Characterizing isotopic compositions of TC-C, NO3−-N, and NH4+-N in PM2.5 in South Korea: Impact of China’s winter heating. Environ. Pollut. 2018, 233, 735–744. [Google Scholar] [CrossRef] [PubMed]


Disclaimer/Publisher’s Note: The statements, opinions and data contained in all publications are solely those of the individual author(s) and contributor(s) and not of MDPI and/or the editor(s). MDPI and/or the editor(s) disclaim responsibility for any injury to people or property resulting from any ideas, methods, instructions or products referred to in the content. |
© 2023 by the authors. Licensee MDPI, Basel, Switzerland. This article is an open access article distributed under the terms and conditions of the Creative Commons Attribution (CC BY) license (https://creativecommons.org/licenses/by/4.0/).
Share and Cite
Zhang, H.; Hong, Z.; Wei, L.; Thornton, B.; Hong, Y.; Chen, J.; Zhang, X. Stable Isotopes Unravel the Sources and Transport of PM2.5 in the Yangtze River Delta, China. Atmosphere 2023, 14, 1120. https://doi.org/10.3390/atmos14071120
Zhang H, Hong Z, Wei L, Thornton B, Hong Y, Chen J, Zhang X. Stable Isotopes Unravel the Sources and Transport of PM2.5 in the Yangtze River Delta, China. Atmosphere. 2023; 14(7):1120. https://doi.org/10.3390/atmos14071120
Chicago/Turabian StyleZhang, Han, Zhenyu Hong, Lai Wei, Barry Thornton, Youwei Hong, Jinsheng Chen, and Xian Zhang. 2023. "Stable Isotopes Unravel the Sources and Transport of PM2.5 in the Yangtze River Delta, China" Atmosphere 14, no. 7: 1120. https://doi.org/10.3390/atmos14071120